Article

Milk Lactose and Inflammatory Marker Changes: Early Indicators of Metabolic and Inflammatory Stress in Early Lactation Dairy Cattle

by
Karina Džermeikaitė
1,*,
Justina Krištolaitytė
1,
Lina Anskienė
2,
Akvilė Girdauskaitė
1,
Samanta Arlauskaitė
1,
Greta Šertvytytė
1,
Gabija Lembovičiūtė
1,
Walter Baumgartner
3 and
Ramūnas Antanaitis
1
1
Animal Clinic, Veterinary Academy, Lithuania University of Health Sciences, Tilžės Str. 18, LT-47181 Kaunas, Lithuania
2
Department of Animal Breeding, Veterinary Academy, Lithuanian University of Health Sciences, Tilžės Str. 18, LT-47181 Kaunas, Lithuania
3
Clinical Centre for Ruminant and Camelid Medicine, University of Veterinary Medicine, Veterinaerplatz 1, A-1210 Vienna, Austria
*
Author to whom correspondence should be addressed.
Agriculture 2025, 15(11), 1205; https://doi.org/10.3390/agriculture15111205
Submission received: 5 May 2025 / Revised: 28 May 2025 / Accepted: 30 May 2025 / Published: 31 May 2025
(This article belongs to the Special Issue Innovations in Dairy Cows' Stress, Health, and Nutrition)

Abstract

Metabolic and inflammatory stress during early lactation poses significant risks to dairy cow health and productivity. This study aimed to assess the physiological, metabolic, and inflammatory differences between dairy cows producing low (LL; <4.5%) and high (HL; ≥4.5%) milk lactose, focusing on C-reactive protein (CRP), liver function markers, iron metabolism, and reticulorumen health. A total of 71 clinically healthy lactating multiparous cows (20–30 days postpartum) were monitored using real-time physiological sensors, milk composition analysis, blood biomarkers and continuous reticulorumen pH measurement (every 10 min). Cows in the LL group showed significantly higher aspartate transaminase (AST) activity (p = 0.042), lower serum iron (Fe) concentration (p = 0.013), and reduced reticulorumen pH (p = 0.03). Although CRP concentrations did not differ significantly between groups, correlation analysis revealed positive associations with non-esterified fatty acids (NEFA) (r = 0.335, p = 0.043), reticulorumen pH (r = 0.498, p = 0.002), and body temperature (r = 0.372, p = 0.023). Receiver operating characteristic (ROC) analysis identified gamma-glutamyl transferase (GGT) (AUC = 0.66), AST (AUC = 0.63), and NEFA (AUC = 0.58) as moderate predictors of low milk lactose levels. Conversely, Fe (AUC = 0.66) and reticulorumen pH (AUC = 0.64) showed moderate ability to predict higher lactose content. These results support the integration of milk lactose, liver enzymes, and inflammatory biomarkers into precision health monitoring protocols. The combined use of CRP and milk lactose as complementary biomarkers may enhance the early identification of metabolic stress and support more targeted dairy herd health management.

1. Introduction

Lactose is the main carbohydrate found exclusively in mammalian milk, where it plays a key role in regulation milk volume, maintaining osmotic balance, and supplying energy to neonatal calves [1,2]. It is considered one of the most stable milk components and is increasingly recognized as a valuable indicator of both mammary gland function and systemic metabolic status in dairy cows [3]. Fluctuations in milk lactose levels have been associated with physiological stress, inflammation, and disruptions in energy metabolism [4]. Due to its non-invasive and frequent measurability—particularly through automated milking systems—milk lactose is gaining prominence as a practical biomarker for real-time monitoring of dairy cow health and productivity [5]. Studies have shown that cows with higher milk lactose concentrations (≥4.70%) tend to produce more milk, though often with lower milk protein content, compared to cows with lower lactose levels [6]. Conversely, low milk lactose concentrations have been linked to conditions such as mastitis, negative energy balance, and liver dysfunction [7]. Unlike milk fat or protein, lactose is less affected by short-term nutritional or environmental fluctuations, making it a robust and sensitive indicator of subclinical metabolic disturbances [2,8]. Its synthesis depends directly on glucose availability and the integrity of mammary epithelial cells, further supporting its utility in metabolic health monitoring [9].
Metabolic changes during the transition period, early lactation, and reproductive stages are critical to dairy cow health and productivity [10,11]. In the final weeks of gestation, cows must support rapid foetal development and initiate lactation, which includes glandular tissue repair and colostrum production. Dry matter intake (DMI) typically declines three weeks before calving in dairy cows, and endocrine changes around parturition can lead to physiological stress, appetite loss, and reduced feed intake. Negative energy balance (NEB) begins a few days before calving and may persist for 2–3 weeks due to the sharp increase in energy demand associated with lactation [12]. These changes are reflected in biomarkers present in blood and milk, such as non-esterified fatty acids (NEFAs), liver enzymes, and acute-phase proteins (APPs) [12,13]. In addition to their role in inflammatory conditions, APPs have proven useful in assessing non-inflammatory conditions, such as metabolic diseases, pregnancy, parturition, and stress. They often outperform traditional haematological markers, such as leukocyte count, neutrophil percentage, or immature neutrophil percentage, in distinguishing between acute and chronic conditions in cattle [14]. Among these, C-reactive protein (CRP) is a major APP synthesized by the liver in response to inflammation, infection, or metabolic stress [15,16]. Human and animal mononuclear series cells, including monocytes and macrophages, secrete cytokines, including interleukin-1 (IL-1), interleukin-6 (IL-6), tumour necrosis factor α (TNFα), and interferon, during infections and under stressful conditions [17]. CRP levels increase rapidly in the early stages of infection or stress [18] and have been proposed as a marker of systemic inflammation in both human and veterinary medicine [15,16,19,20]. Previous research suggests that elevated CRP levels may occur in high-producing cows or in cases of mastitis and systemic inflammation [15,21]. For instance, research by Lee et al. [18] and Murakami et al. [22] reported a threefold increase in CRP concentrations in cows with mastitis compared to healthy lactating cows [17,21]. However, limited research has examined the relationship between CRP and organ-specific functions, such as liver metabolism or ruminal health. Furthermore, integrating CRP with milk-based indicators, such as lactose, may offer a practical and cost-effective approach to on-farm health monitoring [18]. Unlike transient cytokines, CRP offers a more stable reflection of systemic inflammation, making it potentially more suitable for routine monitoring [23,24,25]. Although CRP is less widely studied than haptoglobin or Serum amyloid A (SAA), it may provide complementary diagnostic value due to its sensitivity to inflammatory stimuli and liver dysfunction. Unlike previous studies that primarily evaluated CRP as a general inflammatory marker, the present study explores its association with liver function, iron metabolism, and ruminal health, offering deeper insights into organ-specific inflammatory responses [17,24,25,26,27].
Despite growing interest in milk lactose and CRP as individual biomarkers, few studies have investigated their combined diagnostic potential, particularly in relation to liver function, iron (Fe) metabolism, and ruminal health. To our knowledge, this is the first study to apply receiver operating characteristic (ROC) curve analysis to assess the diagnostic performance of routine liver and energy metabolism biomarkers in predicting milk lactose concentration in dairy cows. While individual associations between biomarkers and milk lactose have been reported, integrating them into a diagnostic framework represents a novel approach that supports early detection of subclinical health issues using milk lactose as a sentinel trait. By combining CRP and milk lactose, this study offers a dual-biomarker strategy for assessing both inflammatory and metabolic stress in early lactation. This integrated approach is intended to enhance health monitoring, support precision livestock management, and contribute to the development of cost-effective, on-farm decision-support tools.
This study hypothesizes that milk lactose concentration and CRP levels are associated with specific metabolic and physiological indicators in early lactation dairy cows, and that their combined use may improve the early identification of subclinical inflammatory and metabolic disturbances. Specifically, we aim to investigate whether milk lactose concentration is associated with metabolic parameters, such as liver enzyme activity, Fe status, reticulorumen pH, and rumination time, while CRP reflects systemic inflammation and physiological stress responses. By evaluating these biomarkers individually and in combination, this research supports a more precise and integrated approach to health assessment in modern dairy herd management.

2. Materials and Methods

2.1. Study Design and Animal Selection

The Lithuanian Law on Animal Welfare and Protection was adhered to in this study, and authorisation was obtained with the approval number G2-227.
The study was conducted from 1 June to 1 August 2024, on a Lithuanian dairy farm that accommodates 1500 lactating cows in free-stall barns. The farm is situated at a latitude of 54.9738° and a longitude of 23.7695°. A DeLaval milking system (DeLaval Inc., Tumba, Sweden) was used to milk 1000 cows twice daily in a parlour system at 5:00 a.m. and 5:00 p.m. The barns were equipped with ventilation systems (DeLaval Inc., Tumba, Sweden) to ensure optimal housing conditions. During the study period, the average ambient temperature was 23 °C, based on farm records and regional meteorological estimates. No clinical signs of heat stress were observed in any enrolled cows.
From a total herd of approximately 1000 lactating cows, 71 clinically healthy cows were selected based on strict inclusion and exclusion criteria designed to minimize physiological variability and enhance data consistency. All assessments and selection procedures were conducted exclusively by a licensed, board-certified veterinarian from the Large Animal Clinic of the Lithuanian University of Health Sciences, ensuring adherence to ethical standards.
The inclusion criteria specified multiparous cows in their second or higher lactations (aged between 3 and 6 years), with an average parity of 2.8 ± 0.7 (range: 2–5 lactations). This ensured physiological maturity and reduced the confounding effects of first-lactation variability. All cows were between 20 to 30 days postpartum, corresponding to the early lactation period, a stage characterized by heightened metabolic demand and susceptibility to physiological imbalances. Only purebred Holstein Friesian dairy cows were included to ensure genetic and production trait uniformity. The mean weight of selected cows was 550 kg ± 45 kg. Key information, including breed, lactation number, last calving date, and milk yield, was obtained from the farm’s digital management system (Delpro, DeLaval Inc., Tumba, Sweden). Days in milk were calculated based on the interval from calving to data collection.
Eligible cows were required to be in good general health with no clinical signs of systemic illness, inflammation, or metabolic dysfunction. Health assessments for conditions such as retained placenta, mastitis, ketosis, metritis, and other periparturient disorders were conducted by a licensed veterinarian through clinical examination and farm health records. Cows were also required to have no history of disease or veterinary treatment during the current or previous lactation. Although subclinical inflammation or metabolic dysfunction was not systematically confirmed through laboratory diagnostics before inclusion, cows with abnormal behaviour, physiological parameters, or production records were excluded to minimize the risk of underlying undetected conditions. Each animal underwent a thorough health evaluation, including general physical examination, rumen motility assessment, rectal temperature measurement, udder palpation, body condition scoring (BCS), and observation of feeding behaviour and appetite. Milk yield was confirmed to be normal for each cow’s parity and lactation stage. Mastitis was excluded using clinical udder evaluation, individual milk somatic cell counts, and the California Mastitis Test (CMT), performed according to the protocol by Ali et al. [28]. Lameness was assessed using a standardized locomotion scoring system (scale 1 to 5) as defined by Thomsen et al. [29] and Sprecher et al. [30], with only cows scoring ≤ 2/5 considered eligible. Any cows displaying clinical abnormalities, deviations from physiological norms, or signs of reduced rumination or feed intake were excluded. This stringent selection process ensured that only physiologically stable, high-health-status animals were enrolled in the study to minimize confounding factors in biomarker evaluation.

2.2. Experimental Group Classification

This investigation was designed as a cross-sectional observational study, focusing on a single time-point assessment of physiological, metabolic, and inflammatory parameters in early lactation dairy cows. This approach enabled the evaluation of associations between milk lactose concentration and various health indicators without longitudinal follow-up. All cows (n = 71) were categorized into two experimental groups based on milk lactose concentration: low lactose (LL) group: <4.5% and high lactose (HL) group: ≥4.5%, as determined by the scientific research conducted by Gantener et al. [31] and the methodology employed in their research [31]. The LL group consisted of 30 cows, while the HL group consisted of 41 cows.

2.3. Housing and Feeding Management

Cows were managed under standardized conditions, receiving the same total mixed ration (TMR) and housed in a controlled environment with uniform feeding, milking, and ventilation systems. Feeding was scheduled at 6:00 a.m. and 6:00 p.m., with fresh water provided ad libitum. Any leftover feed was removed daily at 5:00 a.m. and 5:00 p.m. The TMR was formulated by a professional nutritionist to meet the specific nutritional and physiological needs of Holstein cows weighing between 550 and 650 kg. The average energy-corrected milk production was 12,500 kg per lactation, with an average milk composition of 4.2% fat and 3.6% protein. Table 1 presents the ingredient proportions and corresponding chemical composition of the TMR provided to all study cows during the experimental period. The diet was prepared in accordance with the nutritional recommendations for dairy cattle (NRCs) [32]. The grass silage used in the TMR was primarily composed of a mixture dominated by perennial ryegrass (Lolium perenne), which is commonly cultivated on the farm to ensure high-quality forage for lactating cows.

2.4. Data Acquisition and Monitoring Systems

The BROLIS HerdLine in-line milk analyser (Brolis Sensor Technology, Vilnius, Lithuania) was employed in this study to assess milk composition. Additionally, cow behavioural parameters—including rumination time (minutes/day), body temperature (°C), reticulorumen pH, water intake (L/day), and activity levels (seconds/hour)—were monitored using SmaXtec boluses (SmaXtec Animal Care GmbH, Graz, Austria).
Furthermore, serum biomarkers, such as NEFA, CRP, aspartate transaminase (AST), creatinine (CREA), Fe, gamma-glutamyl transferase (GGT), and SAA, were analysed to evaluate metabolic and inflammatory status. By integrating advanced sensor technologies with blood parameter assessments, a comprehensive dataset was obtained, enabling a multidimensional evaluation of dairy cow health and performance.
The real-time data collected from Brolis Sensor Technology and SmaXtec boluses facilitated continuous health monitoring, providing valuable insights into the cows’ physiological state. The combination of behavioural metrics, physiological indicators, and biochemical markers allowed for a holistic assessment of overall well-being, supporting a more precise and informed approach to dairy herd management.

2.5. Blood Sampling and Biochemical Analysis

A single blood sample was collected from each cow within 20 to 30 days postpartum, corresponding to the early lactation period. The mean sampling day was 25.1 ± 3.2 days postpartum. This window was selected because it represents a critical phase of metabolic adaptation, during which cows are at elevated risk of negative energy balance, hepatic lipidosis, and subclinical inflammation [33,34]. Sampling during this timeframe allows for effective identification of early physiological stress before the onset of clinical symptoms, thereby aligning with the study’s aim to investigate early metabolic and inflammatory indicators. Blood samples were obtained from each cow four hours after morning milking and feeding, with all collections conducted during routine clinical examinations. To facilitate sampling, cows were restrained in a resting stall or headlock, ensuring minimal stress and safe handling. A small blood sample was drawn from the coccygeal vein using a needle syringe.
For biochemical analysis, blood was collected into evacuated tubes without anticoagulant (BD Vacutainer®, Eysin, Switzerland). Samples were kept upright and allowed to clot at room temperature (~22 °C) for approximately 30 min. To maintain sample integrity, all specimens were transported at +4 °C within one hour to the Laboratory of Clinical Tests at the Large Animal Clinic, Veterinary Academy, Lithuanian University of Health Sciences. Upon arrival, the samples underwent centrifugation at 1500× g for 15 min to separate serum, which was immediately used for biochemical profiling on the same day.
The levels of CRP, GGT, AST, CREA and Fe in the blood serum were measured using a Hitachi 705 analyser (Hitachi, Tokyo, Japan) and DiaSys reagents (Diagnostic Systems GmbH, Berlin, Germany).
The NEFA samples were assessed using an automated wet chemistry analyser (Rx Daytona, Randox Laboratories Ltd., London, UK) and Rx Daytona reagents (Randox Laboratories Ltd., London, UK).
SAA concentration was tested by Selectra Junior (Vital Scientific, Dieren, The Netherlands) using ELISA kits (MyBioSource, San Diego, CA, USA) for blood tests.

2.6. Milk Composition

Milk composition was continuously monitored throughout the experiment using the BROLIS HerdLine in-line milk analyser. This advanced device was employed to measure key milk parameters, including lactose, temperature, fat, protein, and the fat-to-protein ratio, in real time for each milk sample.
The analyser is equipped with a GaSb broadly tuneable external cavity laser-based spectrometer, operating within the 2100–2400 nm spectral range. By utilizing transmission mode, the device continuously tracks milk flow during the milking process, allowing for individual sample measurements. Through molecular absorption spectrum analysis, it functions as a compact, on-farm laboratory, precisely quantifying the primary milk components. Conveniently positioned within the milking parlour, the mini spectroscope is integrated along the milk line, ensuring seamless data collection.
To ensure accuracy and reliability, each BROLIS HerdLine in-line milk analyser was assessed and calibrated at the Eurofins laboratory. The calibration process verified the precision of the device, with root mean square error of prediction (RMSEP) values recorded at 0.21% for fat, 0.19% for protein, and 0.19% for lactose.

2.7. Cow Behavioural Monitoring and Activity Tracking

At the start of the study, each of the 71 cows was equipped with an orally administered SmaXtec Classic Bolus (Model: SCB-G5, SmaXtec Animal Care GmbH, Graz, Austria) within the first 5 days post-calving. The boluses were inserted into the reticulorumen using a specialized applicator device, following the manufacturer’s guidelines. Prior to insertion, each bolus was activated, matched to the corresponding ear tag ID, and wirelessly paired with the farm’s SmaXtec Base Station for real-time data acquisition.
The boluses were programmed to collect physiological and behavioural data every 10 min, including reticulorumen pH, internal body temperature, activity levels (seconds/hour), and rumination time (minutes/day). Additionally, the system estimated water intake (litters/day) through detection of temperature changes following drinking events, using proprietary algorithms.
Calibration of pH sensors was performed prior to data collection using certified buffer solutions (pH 4.0 and pH 7.0) supplied by Reagecon (Shannon, Ireland). Calibration was repeated according to the manufacturer’s recommended schedule and checked regularly throughout the study to ensure data accuracy. The data were transmitted wirelessly to the farm server and analysed using SmaXtec Messenger® Software (Version 4.0).
Beyond its role in ruminal health monitoring, SmaXtec technology also facilitated the assessment of drinking behaviour by directly tracking activity within the reticulum. The system measured internal body temperature fluctuations to estimate water intake, employing AI-driven algorithms to analyse temperature changes following each drinking event. This method allowed for the continuous monitoring of individual water consumption, ensuring that each cow met appropriate hydration thresholds without requiring additional manual observation. Collected data were wirelessly transmitted to a central system, enabling farmers and veterinarians to conduct detailed analyses.
An implanted wireless device was used to track reticulorumen temperature, pH levels, total reticulated rumination, and physical activity. The data acquisition process was supported by SmaXtec Animal Care Technology® antennas, while a microprocessor-controlled system digitized pH and TRR measurements through an Analog-to-Digital (A/D) converter and stored them on an external memory chip for further analysis. All collected data were systematically compiled using SmaXtec Messenger® software (Version 4). This innovative technology provided continuous, non-invasive health monitoring, allowing for early detection of potential health issues and contributing to the improved welfare and productivity of the herd.

2.8. Data Processing and Statistical Evaluation

All statistical analyses were conducted using IBM SPSS Statistics for Windows, Version 29.0 (IBM Corp., Armonk, NY, USA). The Shapiro–Wilk test was applied to assess the normality of continuous variables [35]. Descriptive statistics, including means, standard deviations, and 95% confidence intervals, were calculated to summarize the data. Differences between groups categorized by milk lactose content (<4.5% vs. ≥4.5%) were evaluated using independent t-tests. The group sizes were unequal (n = 30 vs. n = 41), which may have contributed to higher variability in the standard deviations and standard errors for the smaller group. However, all statistical analyses were performed using methods appropriate for unequal sample sizes, including independent t-tests with equal variance assumptions tested, and results were interpreted accordingly.
Pearson’s correlation analysis was performed to assess associations between CRP levels and other physiological indicators, with significance set at p < 0.05. No correction for multiple comparisons was applied, as the analysis was exploratory and aimed to identify potential associations for further investigation. Pearson correlation analysis interprets coefficients as follows: values from 0.1 to 0.3 signify a low correlation, 0.3 to 0.5 denote a moderate correlation, and values over 0.5 represent a high correlation [36].
To evaluate the discriminatory ability of physiological and biochemical parameters in predicting milk lactose concentration groupings, Receiver Operating Characteristic (ROC) curve analysis was performed. This method enables the assessment of the diagnostic performance of individual variables by calculating the Area Under the Curve (AUC). An AUC of 0.5 indicated no discrimination, 0.6–0.7 was considered moderate, and values > 0.7 were considered acceptable [37]. ROC analysis offers a novel perspective by identifying which biomarkers may serve as early indicators of subclinical metabolic imbalance and complements traditional group comparisons.

3. Results

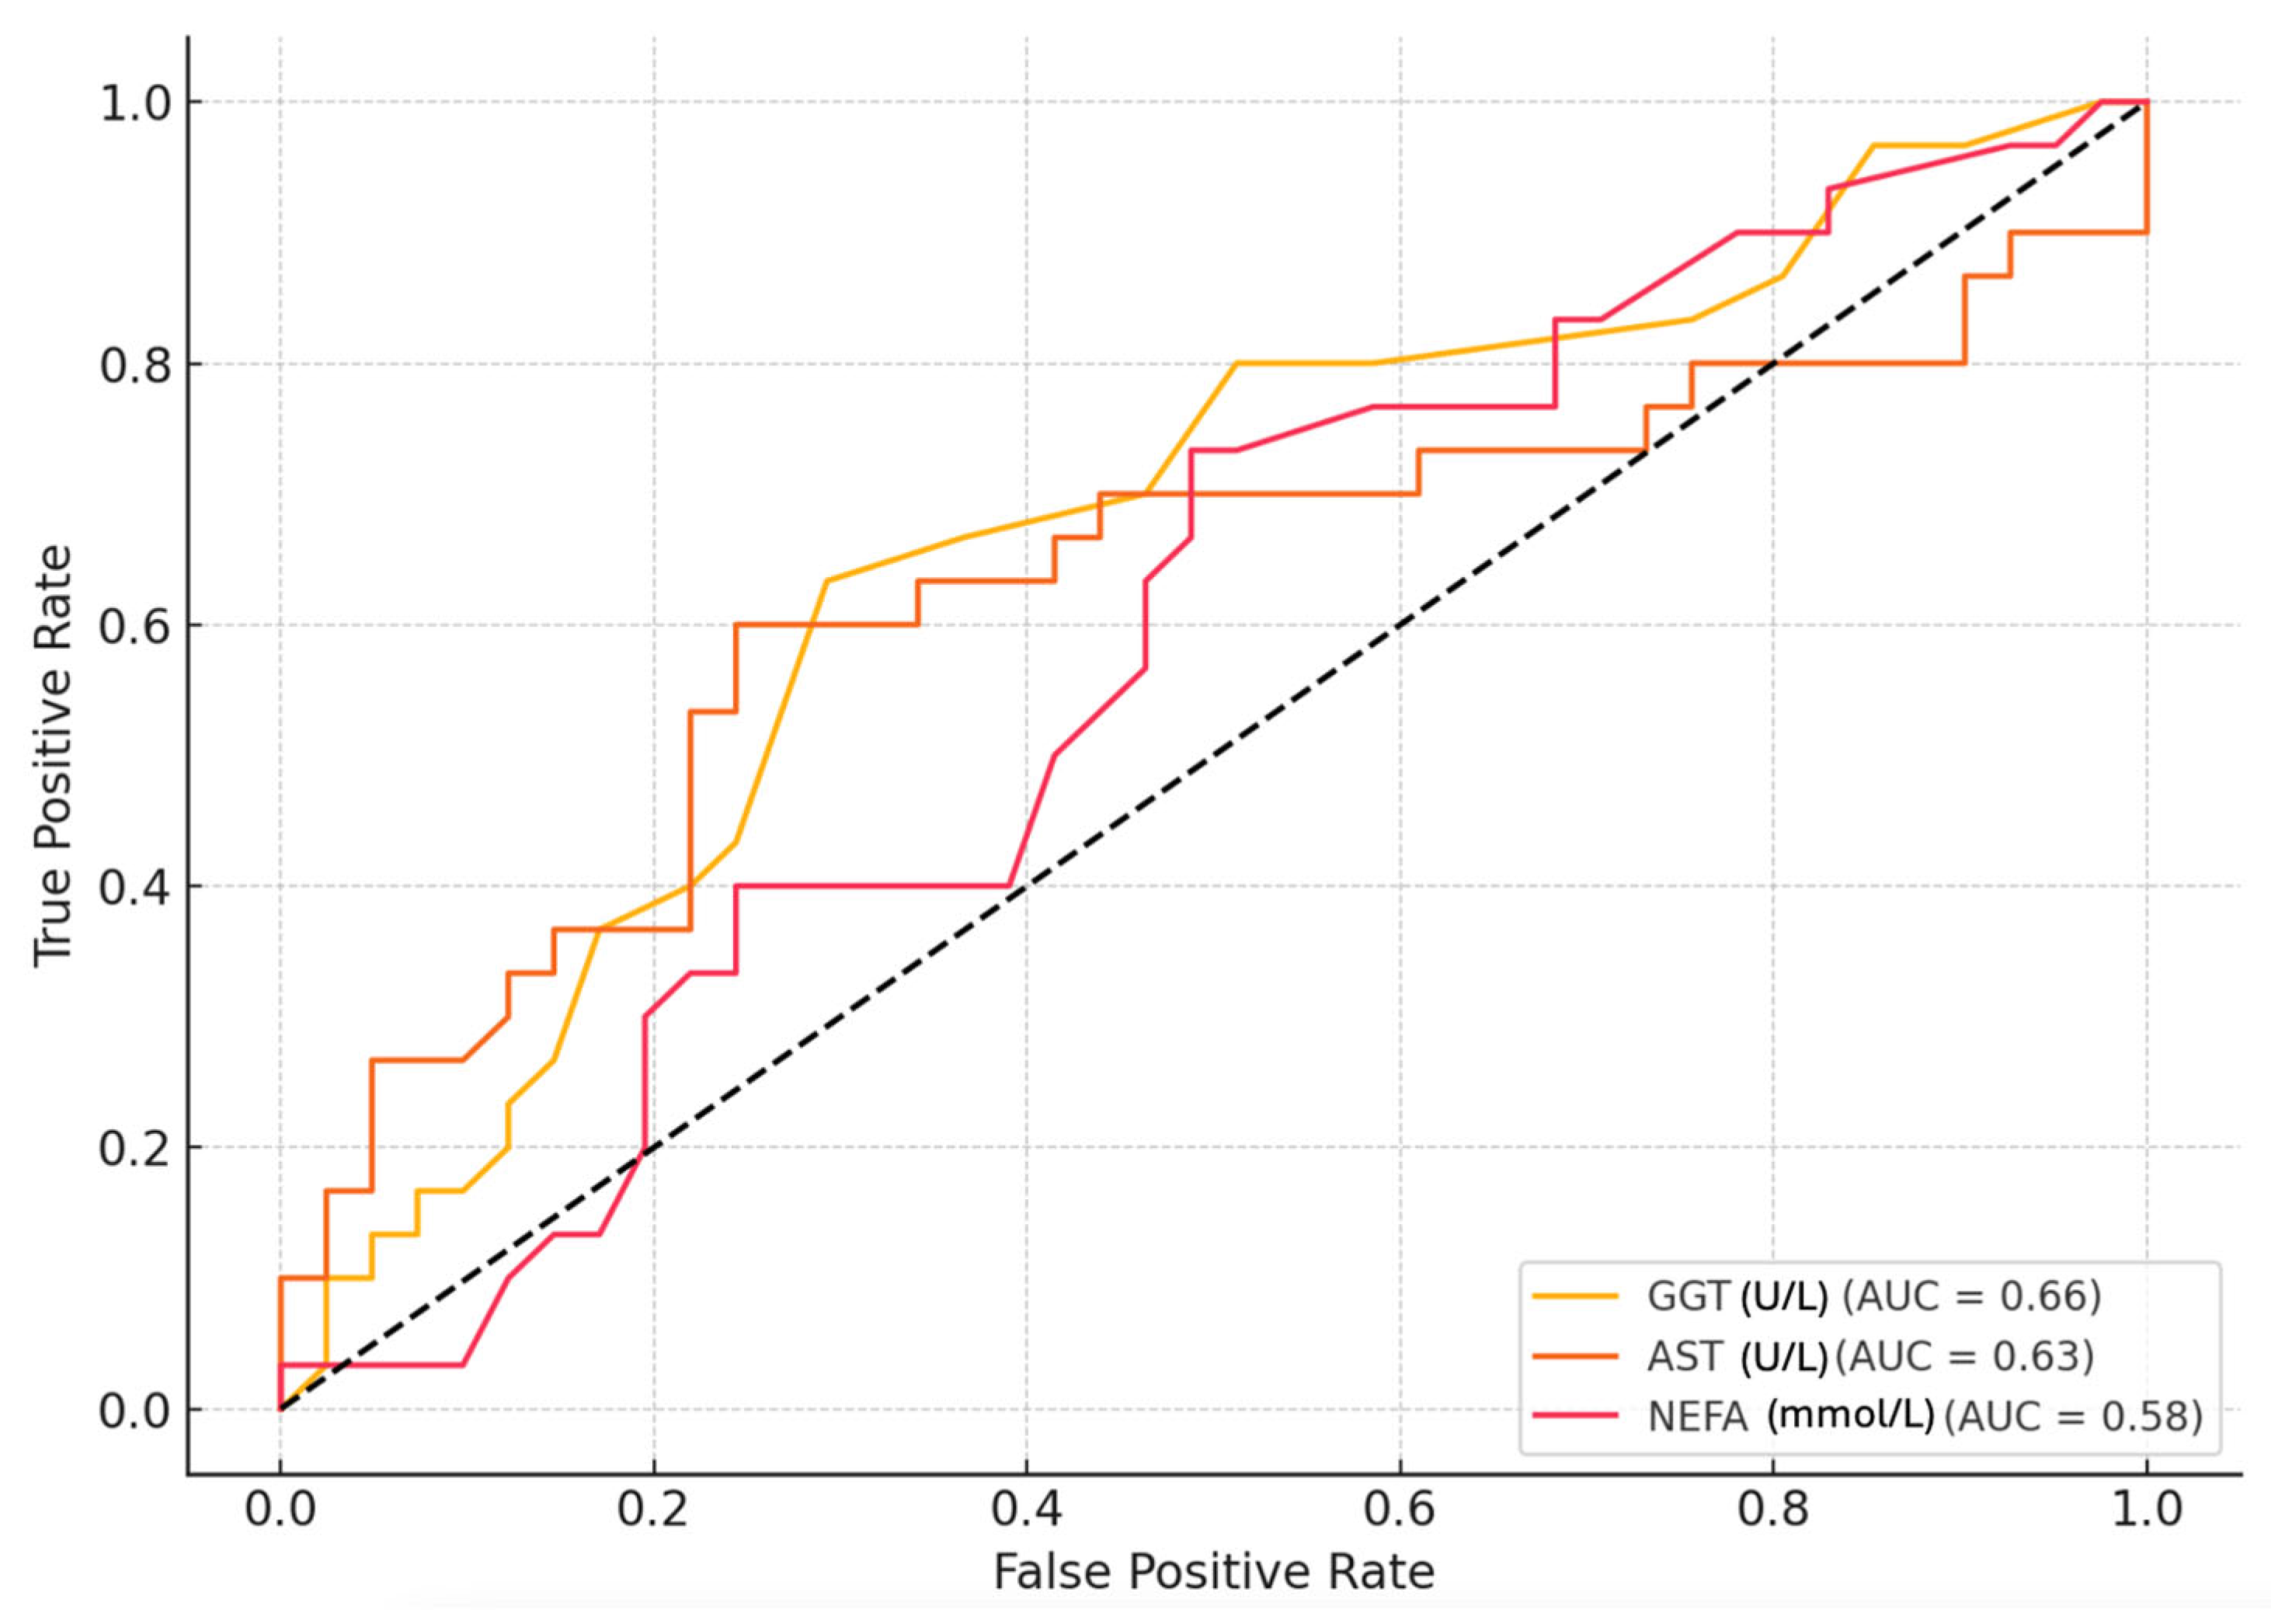
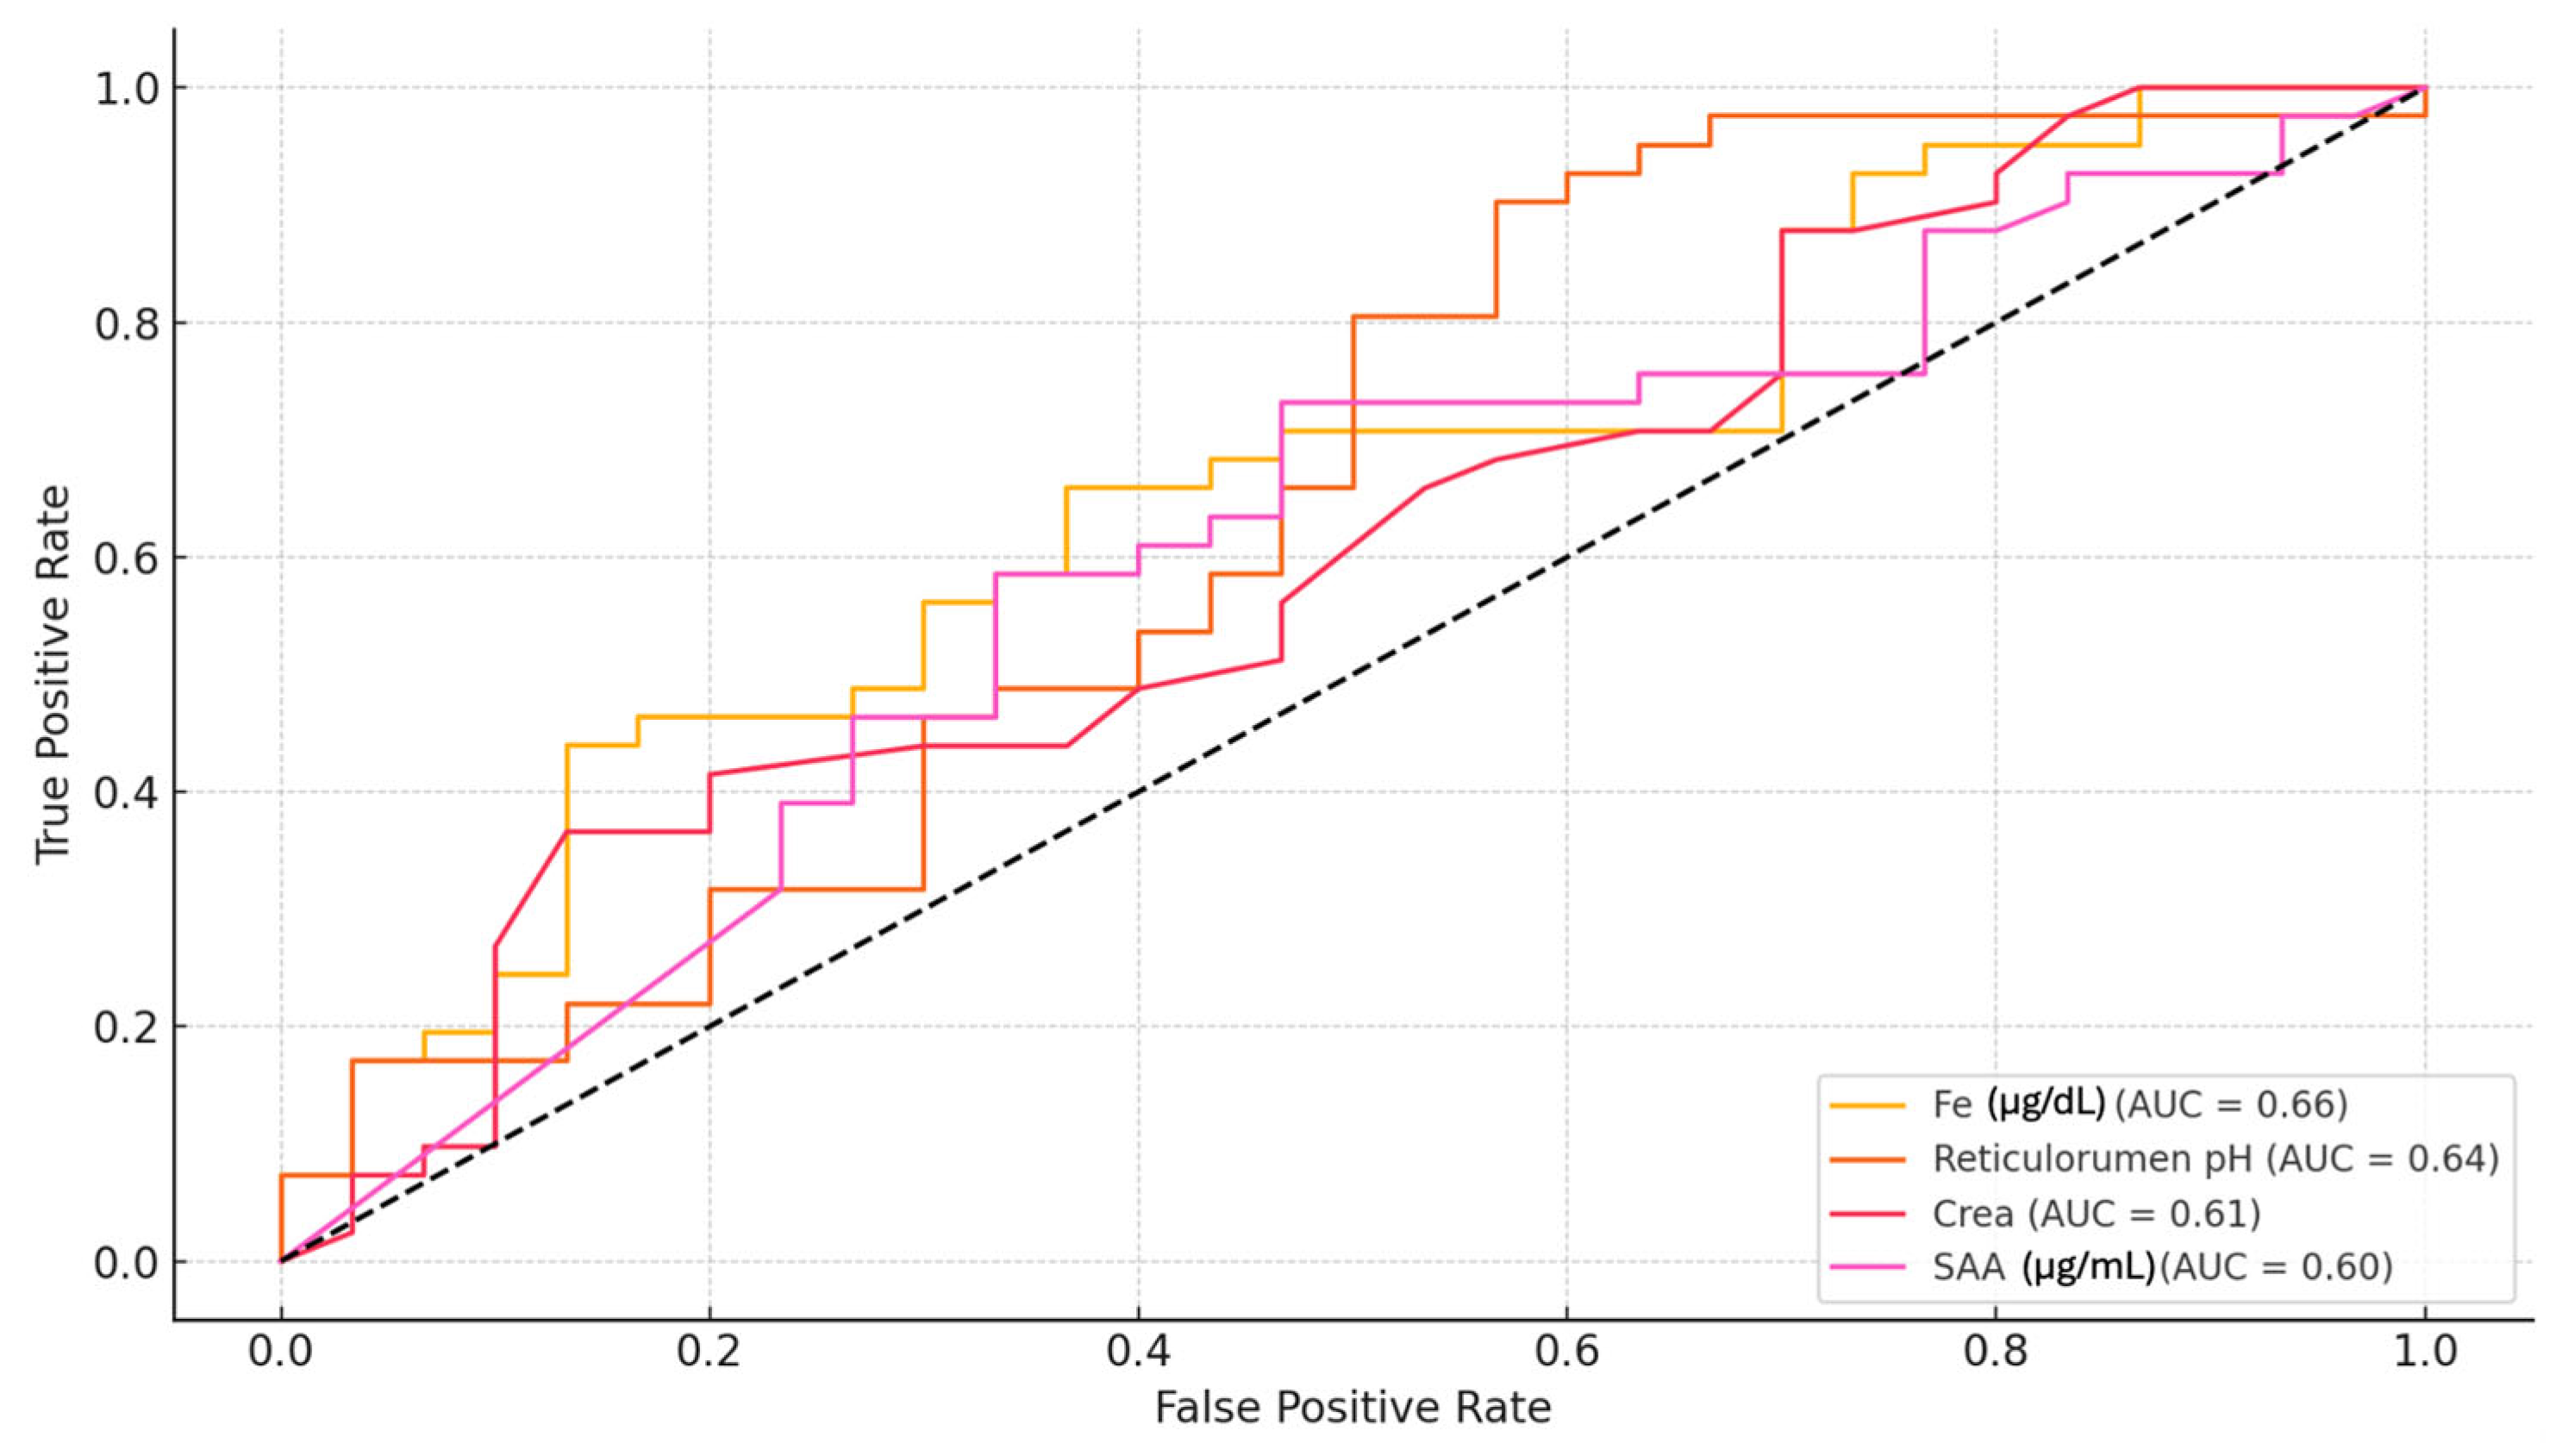
3.1. Biomarker Description of ROC Analysis Results for Milk Lactose

The results analysis below presents ROC curves for the top predictors, illustrating their diagnostic performance. The Area Under each Curve quantifies how well the parameter discriminates between low and high lactose milk, with curves further from the diagonal (reference line) indicating stronger discriminatory ability.
To identify potential biomarkers associated with reduced milk lactose concentration (<4.5%), we performed an ROC curve analysis using a wide panel of physiological, biochemical, and production-related parameters. Here, we focused on those variables that showed moderate to strong discriminatory ability with an AUC > 0.60. Conversely, the best predictors of low milk lactose levels (<4.5%) were markers related to liver function and energy balance, as presented in Figure 1. GGT (U/L) − AUC = 0.66; gamma-glutamyl transferase, a liver enzyme, demonstrated the highest predictive ability for low milk lactose; AST (U/L) − AUC = 0.63. Aspartate aminotransferase, another liver-associated enzyme, was also significantly associated with low lactose levels and NEFA (mmol/L) − AUC = 0.58.
Several parameters exhibited moderate to strong ability to predict whether a cow had a milk lactose level of 4.5% or higher. The top-performing indicators, as shown in Figure 2, were statistically and biologically meaningful parameters (AUC > 0.60).
The following variables showed promising discriminatory power: Fe (µg/dL) − AUC = 0.66: iron concentration in blood demonstrated the highest predictive accuracy among tested traits. Reticulorumen pH − AUC = 0.64: indicates that cows with higher rumen pH were more likely to have milk lactose concentrations ≥ 4.5%. Creatinine (Crea) − AUC = 0.61: as a marker of renal function and muscle metabolism. SAA − AUC = 0.60: as an acute phase protein, SAA’s moderate predictive power suggests a possible relationship between systemic inflammation and milk composition changes. These variables demonstrated better-than-chance discriminatory power (AUC > 0.60).

3.2. Behaviour and Blood Parameters Differences in Dairy Cows with Low and High Milk Lactose Levels

The results of this study reveal significant behaviour, metabolic, and inflammatory differences between dairy cows with low lactose (<4.5%) and high lactose (≥4.5%) milk content. One of the most notable findings is the difference in liver function markers, with cows in the LL group exhibiting significantly higher AST activity levels (94.95 U/L vs. 83.35 U/L, p = 0.042, +12.22%). Additionally, Fe concentration was significantly lower (−12.40%) in cows with lactose < 4.5% (97.88 µg/dL vs. 110.02 µg/dL, p = 0.013) (Table 2).
Inflammatory markers also showed notable trends, with CRP levels 5.58% higher in the HL group (14.94 mg/L vs. 14.15 mg/L), although this difference was not statistically significant. Similarly, SAA, another inflammatory marker, was 13.65% higher in the HL group (74.18 μg/mL vs. 65.27 μg/mL). In terms of energy metabolism, NEFA levels were 10.53% lower in the HL group (0.34 mmol/L vs. 0.38 mmol/L), indicating potential differences in lipid mobilization and energy utilization, though not statistically significant.
Other behaviour parameters, such as rumination time (+2.39%), cow activity (+5.74%), and water intake (+1.61%), exhibited small variations between groups but were not statistically significant (Table 3). Furthermore, reticulorumen pH was significantly lower in the LL group (5.99 vs. 6.1, p = 0.03, −1.83%), suggesting altered ruminal fermentation that may affect digestive efficiency or be influenced by dietary factors.
The mean daily milk yield in the LL group (<4.5%) was 39.82 ± 6.1 kg/day. In the HL group (≥4.5%), it was 40.82 ± 5.4 kg/day. No statistically significant difference in milk yield was observed between groups (p > 0.05). Milk composition parameters, including milk fat (−1.50%) and protein (−1.53%), showed minor reductions in the HL group, while the milk fat-to-protein ratio remained stable (−0.81%). Milk temperature (−0.34%) was slightly lower in the HL group, but this change also was not significant.

3.3. Correlation Analysis with CRP

In addition to group differences, correlation analyses revealed significant relationships between CRP and various blood, behaviour and milk parameters in dairy cows (n = 71), with several noteworthy associations (Table 4). While some correlations were weak and statistically insignificant, a few notable trends emerged. NEFA (r = 0.335, p = 0.043) exhibited a moderate positive correlation with CRP, suggesting that increased inflammation is linked to heightened lipid mobilization and metabolic stress. Similarly, reticulorumen pH (r = 0.498, p = 0.002) showed a strong positive correlation. Normal temperature (r = 0.372, p = 0.023) also demonstrated a moderate positive correlation with CRP. Furthermore, rumination time (r = 0.429, p = 0.008) displayed a moderate correlation. Other physiological variables, including milk composition, activities of liver enzymes (AST, GGT), Fe concentration, and milk temperature, showed weaker correlations with CRP, with p-values exceeding 0.05, indicating no statistically significant relationship.

4. Discussion

4.1. Interpretation of Biomarker Associations and Physiological Implications

This study investigated the potential of milk lactose and CRP as non-invasive biomarkers for evaluating the metabolic and inflammatory status of early lactation of dairy cows. Milk lactose was chosen due to its strong dependence on systemic glucose availability and its role as an indirect indicator of energy balance, mammary function, and metabolic health. CRP was selected as a representative acute-phase inflammatory protein, reflecting systemic inflammatory states that may not yet be clinically apparent. The combination of these two markers provides a novel integrative approach to monitoring dairy cow health at a critical production stage.
Nóbrega and Langoni [38] highlighted the importance of milk lactose content as a key indicator of mammary gland health. Similarly, Costa et al. [1] identified a correlation between lactose levels and overall animal health, reporting that cows with milk lactose ≤ 4.553% experienced greater health impairments compared to those with lactose levels ≥ 5.045%. Our results align with and extend these findings by demonstrating significant physiological, metabolic, and inflammatory differences between dairy cows producing LL (<4.5%) and high lactose (≥4.5%) milk. GGT (AUC = 0.66) and AST (AUC = 0.63) were the strongest predictors of low milk lactose (<4.5%), linking liver function impairment to decreased lactose synthesis. A key distinction lies in liver function markers, where cows in the LL group exhibited notably higher AST activities (94.95 U/L vs. 83.35 U/L, p = 0.042, +12.22%), indicating greater hepatic stress or metabolic strain. AST is a well-recognized biomarker of liver function, and increased activity indicates potential liver cell damage, metabolic overload, or heightened oxidative stress [7,36]. AST is an acute-phase enzyme located in the mitochondria and, to a lesser degree, in the cytoplasm of hepatocytes [39]. AST is released into the bloodstream as a result of hepatic injury, lipid build-up in the liver, inflammation, or muscle damage [40]. This finding is consistent with prior research, where elevated AST activities were associated with metabolic disorders, including ketosis and hepatic lipidosis, in high-yielding dairy cows [7]. It is noteworthy that Pandey et al. observed that injury to the secretory epithelium of the udder was indicated by the increase in AST levels [41]. In the study by Cui et al. [42], elevated levels of hepatic markers were reported post-parturition. Comparable findings have been documented in cows afflicted with endometritis [43] and mastitis [44], indicating that inflammation enhances cell membrane permeability, resulting in the efflux of enzymes into the bloodstream [42]. Moreover, the relationship between milk lactose concentration and metabolic health is further supported by studies indicating that lower lactose levels are associated with increased metabolic stress markers. For instance, research has shown that cows with lower milk lactose concentrations during early lactation exhibit higher levels of NEFA and β-hydroxybutyrate (BHB), both indicative of negative energy balance and lipid mobilization. These findings suggest that reduced milk lactose content may reflect underlying metabolic challenges, including impaired liver function and energy metabolism [45]. The observed elevation in AST activities among cows producing low lactose milk underscores the potential hepatic implications and metabolic stress associated with reduced lactose concentrations. These insights highlight the importance of monitoring milk lactose levels as part of a comprehensive approach to dairy cow health management, facilitating early detection of metabolic disorders and informing targeted interventions to enhance animal welfare and productivity.
In our study, we observed a significant reduction in serum Fe concentration (−12.40%) in cows with milk lactose levels below 4.5% (97.88 µg/dL vs. 110.02 µg/dL, p = 0.013). Fe (AUC = 0.66) was the best predictors of higher milk lactose (≥4.5%), implying that iron metabolism is crucial for maintaining milk quality. This finding suggests potential metabolic alterations or anaemia-like conditions in these cows. The observed decrease in serum Fe concentration in cows with milk lactose levels below 4.5% may indicate underlying inflammatory processes. During inflammation, cytokines such as IL-6 stimulate the liver to produce hepcidin, a key regulator of iron homeostasis. Hepcidin inhibits ferroportin, the iron exporter on cell membranes, leading to reduced iron absorption from the intestine and sequestration of iron within macrophages [22]. This mechanism results in reduced serum iron levels, a response observed in various inflammatory conditions in cattle. For instance, studies have demonstrated that serum iron concentration decreases rapidly during inflammation, serving as a potential biomarker for such conditions [21,43]. Therefore, the reduced Fe concentration in cows with lower milk lactose levels may reflect an inflammatory state, potentially linked to metabolic stress or subclinical infections [46]. Previous research has shown that serum Fe concentrations decrease in endotoxemia [47,48] and acute coliform mastitis [44,45], as well as following minor surgery involving inflammation, like dehorning [49]. By highlighting this relationship, our study emphasizes the potential of serum iron, along with milk lactose, as accessible and informative biomarkers of inflammation and metabolic imbalance in dairy cows.
Beyond liver function and iron metabolism, ruminal health also showed significant associations with milk lactose concentration. Reticulorumen pH was significantly lower in the LL group (5.99 vs. 6.10, p = 0.03, −1.83%), indicating changes in ruminal fermentation that may impact digestive efficiency or be influenced by dietary factors. Reticulorumen pH (AUC = 0.64) was a predictor of higher milk lactose (≥4.5%), implying that ruminal health is crucial for maintaining milk quality. The lower reticulorumen pH in cows with lower lactose milk may indicate a predisposition to sub-acute ruminal acidosis (SARA), which could contribute to increased metabolic stress. These cows may require dietary adjustments to optimize fermentation efficiency. This suggests a greater predisposition to SARA or altered fermentation processes. A lower ruminal pH can indicate increased production of volatile fatty acids (VFA) and reduced buffering capacity, which can compromise digestive efficiency and nutrient absorption. These findings align with previous studies that associate low ruminal pH with metabolic stress, altered feed efficiency, and increased systemic inflammation in dairy cows. Given that low lactose content in milk has been linked to metabolic disruptions, it is plausible that these cows may have higher energy demands, altered fermentation efficiency, or diet-induced acidosis contributing to this variation [50]. For instance, Televičius et al. [50] observed that cows with higher reticuloruminal pH had increased milk lactose concentrations, suggesting that monitoring reticuloruminal pH could serve as an indicator of milk quality, particularly lactose content [50]. However, other studies have found only weak or inconsistent correlations between reticuloruminal pH and milk composition parameters, including lactose. Šematoviča et al. [51] reported a weak, statistically significant correlation between reticuloruminal pH and milk protein levels, but no significant relationship with milk lactose concentration [51]. In another study, Antanaitis et al. [6] examined the association between milk lactose concentration and cow behaviour. They observed that cows with milk lactose levels of ≥4.70% produced significantly more milk and had increased rumination activity. These cows also showed a decrease in milk protein concentration and physical activity levels. The findings suggest that higher milk lactose levels reflect enhanced rumination and feeding behaviours, thereby reflecting better overall health and well-being [6]. Furthermore, research by Antanaitis et al. [52] indicated that cows with higher reticuloruminal pH and milk lactose levels had improved reproductive success. The study highlighted that monitoring reticuloruminal pH could be a valuable tool in assessing cow health and fertility [52]. Collectively, these studies underscore the intricate relationship between ruminal pH, milk lactose concentration, and overall cow health. Our findings contribute to this body of knowledge by demonstrating that cows producing low-lactose milk are more susceptible to ruminal pH imbalances, which may necessitate dietary adjustments to optimize fermentation efficiency and mitigate metabolic stress. Implementing strategies to monitor and manage ruminal pH could enhance digestive health, improve milk quality, and promote the well-being of dairy cows.
In the present study, a strong positive correlation between reticulorumen pH and CRP levels (r = 0.498, p = 0.002) has been observed, suggesting that higher ruminal pH may be associated with increased systemic inflammation, potentially through systemic metabolic shifts affecting acid-base homeostasis. However, other studies have reported different associations. For instance, Antanaitis et al. [50] investigated the relationship between reticulorumen pH and various health indicators, including milk somatic cell count (SCC), an indirect marker of inflammation [50]. They found that cows with lower reticulorumen pH had higher SCC, indicating a potential link between decreased ruminal pH and increased inflammatory responses [52]. Additionally, research by Antanaitis et al. [53] demonstrated that cows with clinical mastitis exhibited lower reticulorumen pH compared to healthy cows, further supporting the association between reduced ruminal pH and heightened inflammatory states [53]. This suggests that inflammatory processes may influence ruminal fermentation dynamics, potentially through systemic metabolic shifts affecting acid-base homeostasis. These varying findings highlight the complex interplay between ruminal pH and systemic inflammation in dairy cows. Factors such as diet, health status, and individual cow variability may influence this relationship. Further research is needed to elucidate the mechanisms underlying these associations and to determine the potential of reticulorumen pH as a biomarker for inflammatory conditions in dairy cattle.
Our study identified a moderate positive correlation between CRP and NEFA (r = 0.335, p = 0.043), suggesting that increased inflammation is linked to heightened lipid mobilization and metabolic stress in dairy cows. The concentration of serum CRP in cattle undergoes minimal fluctuations during inflammatory conditions [19]. This is expected, as elevated NEFA concentrations indicate NEB and increased fat mobilization, which are frequently observed in cows under metabolic stress. The high NEFA levels are associated with a higher incidence of periparturient metabolic diseases, as they reflect the mobilisation of lipid reserves to compensate for the discrepancy between the nutrients consumed by the cow and the nutrients secreted in milk [54]. Several studies have investigated the relationship between NEFA and CRP in dairy cows [55]. While direct studies linking NEFA and CRP are limited, research has demonstrated significant associations between NEFA and other acute-phase proteins, such as haptoglobin (Hp) and SAA, which serve as proxies for systemic inflammation [56,57,58]. Research investigating the relationship between NEFA concentrations and APP such as Hp and SAA in postpartum dairy cows revealed significant positive correlations between NEFA and both Hp and SAA. These findings indicate that higher NEFA levels are associated with elevated APP, reflecting an inflammatory response linked to lipid mobilization [56]. However, our recent study produced contrasting findings, revealing a significant negative correlation between NEFA and SAA levels (r = −0.441, p < 0.001). This suggests that elevated fat mobilization may dampen the inflammatory response, potentially increasing the risk of metabolic and infectious diseases [57]. However, more research is needed to fully understand the implications of these results. Further investigation into the relationship between NEFA levels and inflammatory markers like SAA is warranted to clarify the underlying mechanisms at play. These conflicting results highlight the complexity of the interplay between lipid metabolism and inflammation in disease development. Given the limited direct studies on NEFA and CRP correlations, further research is warranted to elucidate this specific relationship. Understanding the direct association between NEFA and CRP could provide deeper insights into the inflammatory processes linked to metabolic stress in dairy cows, potentially leading to improved monitoring and management strategies during critical periods like early lactation.
Normal temperature (r = 0.372, p = 0.023) demonstrated a moderate positive correlation with CRP, reinforcing the association between inflammatory responses and thermoregulation in dairy cows. This association indicates that systemic inflammation may lead to subtle thermoregulatory adaptations, potentially due to metabolic adjustments or immune activation. While fever is a classical sign of infection, low-grade increases in body temperature may also reflect subclinical inflammation, particularly in high-producing dairy cows during early lactation. In a study involving sows, similar findings were found, showing that higher blood CRP was linked to higher sow body temperature [59]. Schmitt et al. [60] found that only Hp exhibited a significant positive correlation with body temperature. No correlation was identified between CRP and body temperature [60]. This discrepancy may be attributed to differences in study design, animal health status, or the specific inflammatory challenges encountered. Supporting this, Lee et al. [18] observed that CRP levels in dairy cattle increased with milk production, peaking during high lactation periods, and decreased when lactation ceased. They also noted that CRP levels were highest during naturally occurring infections, such as mastitis and other tissue inflammations, highlighting its role as a marker for systemic inflammation [18]. These results suggest that the relationship between inflammatory markers and body temperature may vary among different species and physiological conditions [61]. The positive correlation between Hp and body temperature in dairy cows could be indicative of the acute phase response to infection. Further research is needed to understand the mechanisms underlying these relationships and their implications for animal health and welfare. The findings from these studies highlight the complex interplay between inflammation, thermoregulation, and overall physiological function in livestock.
In addition to systemic inflammatory markers, behavioural parameters, such as rumination time, further reflected the cows’ physiological status. Furthermore, rumination time (r = 0.429, p = 0.008) displayed a moderate correlation with CRP, suggesting that cows experiencing inflammatory stress might alter their feeding and chewing behaviour, potentially as a compensatory mechanism for maintaining digestive efficiency. Research indicates that there can be a compensatory relationship between eating and ruminating time. For instance, cows that spend less time eating due to illness or feed restrictions may increase their rumination time to maintain proper digestion. This inverse relationship suggests that increased rumination can serve as a compensatory mechanism in response to reduced feed intake or other stressors [62]. Recognizing this pattern is vital for comprehensive health monitoring and timely intervention, ultimately contributing to improved animal welfare and dairy production efficiency. Research assessing inflammatory status and metabolic changes at dry-off in high-yielding dairy cows found that, after dry-off, DMI was reduced, and rumination time increased in all animals. High milk-yielding cows had greater DMI and rumination time than low milk-yielding cows. This indicates a potential link between rumination behaviour and inflammatory status during the dry-off period [63]. Future studies should also consider additional factors that may influence lactose concentration, such as diet, genetic variation, and overall cow health. Exploring these variables could provide a more comprehensive understanding of the interactions between metabolic health, inflammation, and milk composition.
Future research should explore potential nutritional and management interventions to mitigate these effects, particularly in cows at risk of low lactose production, metabolic disorders, and ruminal acidosis. Investigating the role of dietary buffering agents, precision feeding strategies, and early biomarker detection could provide valuable insights into improving dairy cow resilience and productivity. Additionally, longitudinal studies examining how changes in lactose levels correspond to metabolic and inflammatory fluctuations over time would help refine precision livestock farming approaches and enhance dairy herd management.

4.2. Limitations

While this study provides valuable insights into the association between milk lactose concentration, CRP, and metabolic health in early lactation dairy cows, several limitations must be acknowledged. First, the study employed a cross-sectional design with a single time-point blood sampling, which limits the ability to assess dynamic changes in biomarker levels over time. As a result, causal inferences cannot be made, and transient fluctuations in physiological or inflammatory markers may have been missed.
Second, although a total of 71 cows were included, which provided sufficient power to detect statistically significant differences in key variables, a larger and more diverse population across multiple farms would enhance the generalizability of the findings.
Although our study focused on NEFA as a primary biomarker of lipid mobilization, other indicators, such as β-hydroxybutyrate (BHBA), malondialdehyde (MDA), and total antioxidant status (TAS), also play important roles in evaluating metabolic and oxidative stress in dairy cows [64]. BHBA is a key ketone body that reflects hepatic ketogenesis and could provide additional insight into energy metabolism, particularly in cows at risk of subclinical ketosis [65]. Similarly, MDA is a widely used marker of lipid peroxidation, and TAS reflects overall antioxidant capacity—both of which are closely linked to oxidative stress status in high-yielding dairy cows [66]. While these markers were not included in the present study due to logistical constraints, their integration in future research could further elucidate the complex interactions between energy balance, inflammation, oxidative stress, and milk composition. Including BHBA may enhance the interpretation of metabolic profiles and offer complementary value alongside NEFA and CRP.
Future studies should consider longitudinal sampling to track biomarker trends throughout lactation and include a broader sampling base to validate these findings across varying management systems, breeds, and environmental conditions. Future studies could benefit from incorporating detailed environmental monitoring to evaluate interactions between heat stress and metabolic responses.

5. Conclusions

This study demonstrated that milk lactose concentration, when assessed in conjunction with key blood biomarkers, such as CRP, GGT, AST, NEFA, and serum Fe, provides valuable insights into the metabolic and inflammatory status of early lactation dairy cows. Cows producing low lactose milk (<4.5%) exhibited higher AST activity, lower Fe concentrations, and reduced reticulorumen pH, suggesting increased hepatic stress, systemic inflammation, and altered ruminal fermentation dynamics. ROC analysis confirmed the moderate predictive ability of liver function enzymes and metabolic parameters for identifying cows at risk of subclinical metabolic disturbances. The integration of milk lactose monitoring with CRP and other physiological markers offers a cost-effective, non-invasive approach to early health assessment in dairy herds. These findings support the use of milk lactose as a sentinel indicator of metabolic stability, while CRP and related biomarkers enhance the early detection of inflammatory stress. Implementing precision monitoring systems based on these biomarkers could improve dairy cow welfare, optimize production efficiency, and enable more targeted herd management strategies. Further longitudinal studies are warranted to validate these associations across different production systems and to explore the potential of incorporating these biomarkers into automated health-monitoring technologies for precision dairy farming. Additional research is advised to confirm these biomarkers in field circumstances and other production systems.

Author Contributions

Conceptualization, K.D., J.K. and R.A.; methodology, K.D. and R.A.; software, K.D. and L.A.; formal analysis, K.D.; investigation, K.D., J.K., A.G., S.A., G.Š. and G.L.; data curation, K.D. and R.A.; writing—original draft preparation, K.D.; writing—review and editing, R.A. and W.B.; visualization, K.D.; project administration, R.A. All authors have read and agreed to the published version of the manuscript.

Funding

This project has received financial support from the Research Council of Lithuania (LMTLT) and the Ministry of Education, Science and Sport of the Republic of Lithuania, agreement No: S-A-UEI-23-7.

Institutional Review Board Statement

The study was conducted in accordance with the Declaration of Helsinki and approved by the Ethics Committee (approval number G2-227, dated 7 March 2025).

Data Availability Statement

The original contributions of this study are presented within the journal, and any further inquiries can be directed to the corresponding author.

Acknowledgments

The authors have reviewed and edited the output and take full responsibility for the content of this publication.

Conflicts of Interest

The authors declare no conflicts of interest.

Abbreviations

The following abbreviations are used in this manuscript:
MDPIMultidisciplinary Digital Publishing Institute
CRPC-reactive protein
ASTAspartate transaminase
FeIron
NEFANon-esterified fatty acid
APPAcute phase protein
IL-1Interleukin-1
IL-6Interleukin-6
TNFαTumour necrosis factor α
GGTGamma-glutamyl transferase
SAASerum amyloid A
BSCBody condition score
CMTCalifornia mastitis test
TMRTotal mixed ration
CREACreatinine
A/DAnalog-to-digital
AUCArea Under the Curve
ROCReceiver operating characteristic
RMSEPRoot mean square error of prediction
SARASub-acute ruminal acidosis
BHBβ-hydroxybutyrate
VFAVolatile fatty acid
SCCSomatic cell count
NEBNegative energy balance
HpHaptoglobin
DMIDry matter intake
BHBAβ-hydroxybutyrate
MDAMalondialdehyde
TASTotal antioxidant status

References

  1. Costa, A.; Lopez-Villalobos, N.; Sneddon, N.W.; Shalloo, L.; Franzoi, M.; De Marchi, M.; Penasa, M. Invited Review: Milk Lactose-Current Status and Future Challenges in Dairy Cattle. J. Dairy Sci. 2019, 102, 5883–5898. [Google Scholar] [CrossRef] [PubMed]
  2. Lactose and Its Relationship with Other Milk Constituents, Somatic Cell Count, and Total Bacterial Count. Livest. Sci. 2021, 252, 104678. [CrossRef]
  3. Gross, J.J.; Bruckmaier, R.M. Review: Metabolic challenges in lactating dairy cows and their assessment via established and novel indicators in milk. Animal 2019, 13, s75–s81. [Google Scholar] [CrossRef]
  4. Liu, Z.; Jiang, A.; Lv, X.; Zhou, C.; Tan, Z. Metabolic Changes in Serum and Milk of Holstein Cows in Their First to Fourth Parity Revealed by Biochemical Analysis and Untargeted Metabolomics. Animals 2024, 14, 407. [Google Scholar] [CrossRef]
  5. Tian, H.; Zheng, N.; Wang, W.; Cheng, J.; Li, S.; Zhang, Y.; Wang, J. Integrated Metabolomics Study of the Milk of Heat-Stressed Lactating Dairy Cows. Sci. Rep. 2016, 6, 24208. [Google Scholar] [CrossRef]
  6. Antanaitis, R.; Džermeikaitė, K.; Krištolaitytė, J.; Girdauskaitė, A.; Arlauskaitė, S.; Tolkačiovaitė, K.; Baumgartner, W. The Relation between Milk Lactose Concentration and the Rumination, Feeding, and Locomotion Behavior of Early-Lactation Dairy Cows. Animals 2024, 14, 836. [Google Scholar] [CrossRef]
  7. Kovacikova, E.; Kovacik, A.; Harangozo, L.; Tokarova, K.; Knazicka, Z.; Tvrda, E.; Jambor, T.; Tomka, M.; Massanyi, P.; Lukac, N. Canonical Correlation of Milk Composition Parameters and Blood Biomarkers in High-Producing Dairy Cows During Different Lactation Stages. Animals 2024, 14, 3294. [Google Scholar] [CrossRef]
  8. Portnoy, M.; Barbano, D.M. Lactose: Use, Measurement, and Expression of Results. J. Dairy Sci. 2021, 104, 8314–8325. [Google Scholar] [CrossRef]
  9. Horst, E.A.; Kvidera, S.K.; Baumgard, L.H. Invited Review: The Influence of Immune Activation on Transition Cow Health and Performance—A Critical Evaluation of Traditional Dogmas. J. Dairy Sci. 2021, 104, 8380–8410. [Google Scholar] [CrossRef]
  10. Shahbazkia, H.R.; Aminlari, M.; Tavasoli, A.; Mohamadnia, A.R.; Cravador, A. Associations among Milk Production Traits and Glycosylated Haemoglobin in Dairy Cattle; Importance of Lactose Synthesis Potential. Vet. Res. Commun. 2010, 34, 1–9. [Google Scholar] [CrossRef]
  11. Costa, A.; Bovenhuis, H.; Egger-Danner, C.; Fuerst-Waltl, B.; Boutinaud, M.; Guinard-Flament, J.; Obritzhauser, W.; Visentin, G.; Penasa, M. Mastitis Has a Cumulative and Lasting Effect on Milk Yield and Lactose Content in Dairy Cows. J. Dairy Sci. 2025, 108, 635–650. [Google Scholar] [CrossRef] [PubMed]
  12. Liu, N.; Qi, J.; An, X.; Wang, Y.; Wang, B.; Li, X.; Zhang, Z.; Huo, X. Changes in Feeding Behavior, Milk Yield, Serum Indexes, and Metabolites of Dairy Cows in Three Weeks Postpartum. Sci. Rep. 2025, 15, 7925. [Google Scholar] [CrossRef] [PubMed]
  13. Haile-Mariam, M.; Pryce, J.E. Genetic Parameters for Lactose and Its Correlation with Other Milk Production Traits and Fitness Traits in Pasture-Based Production Systems. J. Dairy Sci. 2017, 100, 3754–3766. [Google Scholar] [CrossRef] [PubMed]
  14. Pires, J.A.A.; Larsen, T.; Leroux, C. Milk Metabolites and Fatty Acids as Noninvasive Biomarkers of Metabolic Status and Energy Balance in Early-Lactation Cows. J. Dairy Sci. 2022, 105, 201–220. [Google Scholar] [CrossRef]
  15. Bagga, A.; Randhawa, S.S.; Sharma, S.; Bansal, B.K. Acute Phase Response in Lame Crossbred Dairy Cattle. Vet. World 2016, 9, 1204–1208. [Google Scholar] [CrossRef]
  16. Prediction of metabolic status of dairy cows in early lactation with on-farm cow data and machine learning algorithms. J. Dairy Sci. 2019, 102, 10186–10201. [CrossRef]
  17. Kuczyńska, B.; Puppel, K.; Gołębiewski, M.; Wiśniewski, K.; Przysucha, T. Metabolic Profile According to the Parity and Stage of Lactation of High-Performance Holstein-Friesian Cows. Anim. Biosci. 2021, 34, 575–583. [Google Scholar] [CrossRef]
  18. Lee, W.-C.; Hsiao, H.-C.; Wu, Y.-L.; Lin, J.-H.; Lee, Y.-P.; Fung, H.-P.; Chen, H.-H.; Chen, Y.-H.; Chu, R.-M. Serum C-Reactive Protein in Dairy Herds. Can. J. Vet. Res. 2003, 67, 102–107. [Google Scholar]
  19. Ali, A.; Rehman, M.U.; Mushtaq, S.; Ahmad, S.B.; Khan, A.; Karan, A.; Bashir Wani, A.; Ganie, S.A.; Mir, M.U.R. Biochemical and Computational Assessment of Acute Phase Proteins in Dairy Cows Affected with Subclinical Mastitis. Curr. Issues Mol. Biol. 2023, 45, 5317–5346. [Google Scholar] [CrossRef]
  20. Toscano, A.; Giannuzzi, D.; Pegolo, S.; Vanzin, A.; Bisutti, V.; Gallo, L.; Trevisi, E.; Cecchinato, A.; Schiavon, S. Associations between the Detailed Milk Mineral Profile, Milk Composition, and Metabolic Status in Holstein Cows. J. Dairy Sci. 2023, 106, 6577–6591. [Google Scholar] [CrossRef]
  21. Gross, J.; van Dorland, H.A.; Bruckmaier, R.M.; Schwarz, F.J. Performance and Metabolic Profile of Dairy Cows during a Lactational and Deliberately Induced Negative Energy Balance with Subsequent Realimentation. J. Dairy Sci. 2011, 94, 1820–1830. [Google Scholar] [CrossRef] [PubMed]
  22. Murakami, Y.; Tsukano, K.; Hirata, H.; Suzuki, K. Evaluation of Blood Serum Iron Concentration as an Alternative Biomarker for Inflammation in Dairy Cows. Biol. Trace Elem. Res. 2023, 201, 4710–4717. [Google Scholar] [CrossRef] [PubMed]
  23. Eckersall, P.D.; Bell, R. Acute Phase Proteins: Biomarkers of Infection and Inflammation in Veterinary Medicine. Vet. J. Lond. Engl. 1997 2010, 185, 23–27. [Google Scholar] [CrossRef]
  24. Murata, H.; Shimada, N.; Yoshioka, M. Current Research on Acute Phase Proteins in Veterinary Diagnosis: An Overview. Vet. J. 2004, 168, 28–40. [Google Scholar] [CrossRef]
  25. Tanai, S.; Endo, N.; Tanaka, T. Quantifying the C-Reactive Protein Concentrations of Uterine Lavage Samples in Postpartum Dairy Cows. Anim. Reprod. Sci. 2020, 217, 106455. [Google Scholar] [CrossRef]
  26. Trevisi, E.; Jahan, N.; Bertoni, G.; Ferrari, A.; Minuti, A. Pro-Inflammatory Cytokine Profile in Dairy Cows: Consequences for New Lactation. Ital. J. Anim. Sci. 2015, 14, 3862. [Google Scholar] [CrossRef]
  27. Ceciliani, F.; Lecchi, C.; Urh, C.; Sauerwein, H. Proteomics and Metabolomics Characterizing the Pathophysiology of Adaptive Reactions to the Metabolic Challenges during the Transition from Late Pregnancy to Early Lactation in Dairy Cows. J. Proteom. 2018, 178, 92–106. [Google Scholar] [CrossRef]
  28. Ability of Diagnostic Tests to Predict Subclinical Mastitis and Intramammary Infections in Quarters from Lactating Dairy Cows. Available online: https://www.researchgate.net/publication/359257331_Ability_of_Diagnostic_Tests_to_Predict_Subclinical_Mastitis_and_Intramammary_Infections_in_Quarters_from_Lactating_Dairy_Cows (accessed on 15 April 2025).
  29. Thomsen, P.T.; Munksgaard, L.; Tøgersen, F.A. Evaluation of a Lameness Scoring System for Dairy Cows. J. Dairy Sci. 2008, 91, 119–126. [Google Scholar] [CrossRef]
  30. Sprecher, D.J.; Hostetler, D.E.; Kaneene, J.B. A Lameness Scoring System That Uses Posture and Gait to Predict Dairy Cattle Reproductive Performance. Theriogenology 1997, 47, 1179–1187. [Google Scholar] [CrossRef]
  31. Gantner, V.; Jožef, I.; Popović, V.; Solić, D.; Popović, J.; Potočnik, K. The Effect of Age of Cows on Variability in Mastitis Prevalence Risk and Its Concomitant Impacts on the Successive Daily Milk Yield. Contemp. Agric. 2023, 72, 170–174. [Google Scholar] [CrossRef]
  32. Nutrient Requirements of Dairy Cattle: Eighth Revised Edition; National Academies Press: Washington, DC, USA, 2021; ISBN 978-0-309-67777-6.
  33. Mekuriaw, Y. Negative Energy Balance and Its Implication on Productive and Reproductive Performance of Early Lactating Dairy Cows: Review Paper. J. Appl. Anim. Res. 2023, 51, 220–228. [Google Scholar] [CrossRef]
  34. Caixeta, L.S.; Ospina, P.A.; Capel, M.B.; Nydam, D.V. The Association of Subclinical Hypocalcemia, Negative Energy Balance and Disease with Bodyweight Change during the First 30 Days Post-Partum in Dairy Cows Milked with Automatic Milking Systems. Vet. J. 2015, 204, 150–156. [Google Scholar] [CrossRef] [PubMed]
  35. Prion, S.; Haerling, K.A. Making Sense of Methods and Measurement: Pearson Product-Moment Correlation Coefficient. Clin. Simul. Nurs. 2014, 10, 587–588. [Google Scholar] [CrossRef]
  36. Puth, M.-T.; Neuhäuser, M.; Ruxton, G.D. Effective Use of Pearson’s Product–Moment Correlation Coefficient. Anim. Behav. 2014, 93, 183–189. [Google Scholar] [CrossRef]
  37. Zhang, M.; Guo, M.; Wang, Z.; Liu, H.; Bai, X.; Cui, S.; Guo, X.; Gao, L.; Gao, L.; Liao, A.; et al. Predictive Model for Early Functional Outcomes Following Acute Care after Traumatic Brain Injuries: A Machine Learning-Based Development and Validation Study. Injury 2023, 54, 896–903. [Google Scholar] [CrossRef]
  38. SciELO Brazil—Breed and Season Influence on Milk Quality Parameters and in Mastitis Occurrence Breed and Season Influence on Milk Quality Parameters and in Mastitis Occurrence. Available online: https://www.scielo.br/j/pvb/a/F3yVJs5mxmJZGdynmQBb6tk/?lang=en (accessed on 24 February 2025).
  39. Comparison of Hepatic Adaptation in Extreme Metabolic Phenotypes Observed in Early Lactation Dairy Cows on-farm-Dorland-2014-Journal of Animal Physiology and Animal Nutrition-Wiley Online Library. Available online: https://onlinelibrary.wiley.com/doi/full/10.1111/jpn.12125 (accessed on 3 March 2025).
  40. Batista, C.P.; Gonçalves, R.S.; Contreras, L.V.; de Faria Valle, S.; González, F. Correlation between Liver Lipidosis, Body Condition Score Variation, and Hepatic Analytes in Dairy Cows. Braz. J. Vet. Med. 2022, 44, e005121. [Google Scholar] [CrossRef]
  41. Pandey, V.; Aditi, A.; Pratiksha, P.; Gupta, S.K.; Sharma, N.; Sharma, D. Impact of Subclinical Mastitis on Blood Biochemistry of Dairy Cows. Indian J. Anim. Sci. 2012, 82, 477. [Google Scholar]
  42. Cui, L.; Wang, H.; Ding, Y.; Li, J.; Li, J. Changes in the Blood Routine, Biochemical Indexes and the pro-Inflammatory Cytokine Expressions of Peripheral Leukocytes in Postpartum Dairy Cows with Metritis. BMC Vet. Res. 2019, 15, 1–10. [Google Scholar] [CrossRef]
  43. Sattler, T.; Fürll, M. Creatine Kinase and Aspartate Aminotransferase in Cows as Indicators for Endometritis. J. Vet. Med. Ser. A 2004, 51, 132–137. [Google Scholar] [CrossRef]
  44. El-Shafey, Y. Effect of Some Strains of Mycoplasma on Serum and Milk Biochemistry of Dairy Cows. Egypt J. Comp. Pathol. Clin. Pathol. 2008, 21, 230–249. [Google Scholar]
  45. Andjelić, B.; Djoković, R.; Cincović, M.; Bogosavljević-Bošković, S.; Petrović, M.; Mladenović, J.; Čukić, A. Relationships between Milk and Blood Biochemical Parameters and Metabolic Status in Dairy Cows during Lactation. Metabolites 2022, 12, 733. [Google Scholar] [CrossRef] [PubMed]
  46. Tsukano, K.; Suzuki, K. Serum Iron Concentration Is a Useful Biomarker for Assessing the Level of Inflammation That Causes Systemic Symptoms in Bovine Acute Mastitis Similar to Plasma Haptoglobin. J. Vet. Med. Sci. 2020, 82, 1440–1444. [Google Scholar] [CrossRef] [PubMed]
  47. Tsukano, K.; Shimamori, T.; Suzuki, K. Serum Iron Concentration in Cattle with Endotoxaemia. Acta Vet. Hung. 2020, 68, 53–58. [Google Scholar] [CrossRef]
  48. Shimamori, T.; Noda, J.; Tsukano, K.; Sera, K.; Yokota, H.; Koiwa, M.; Suzuki, T.; Suzuki, K. Particle-Induced X-Ray Emission Analysis of Zierum Trace and Major Elements in Cattle with Acute Coliform Mastitis. Jpn. J. Vet. Res. 2017, 65, 29–37. [Google Scholar]
  49. Tsukano, K.; Shimamori, T.; Fukuda, T.; Nishi, Y.; Otsuka, M.; Kitade, Y.; Suzuki, K. Serum Iron Concentration as a Marker of Inflammation in Young Cows That Underwent Dehorning Operation. J. Vet. Med. Sci. 2019, 81, 626–628. [Google Scholar] [CrossRef]
  50. Televičius, M.; Juozaitiene, V.; Malašauskienė, D.; Antanaitis, R.; Rutkauskas, A.; Urbutis, M.; Baumgartner, W. Inline Milk Lactose Concentration as Biomarker of the Health Status and Reproductive Success in Dairy Cows. Agriculture 2021, 11, 38. [Google Scholar] [CrossRef]
  51. Šematoviča, I.; Eihvalde, I.; Kairiša, D. Reticulo-Ruminal pH and Temperature Relationship between Dairy Cow Productivity and Milk Composition. Agron. Res. 2017, 15, 576–584. [Google Scholar]
  52. Antanaitis, R.; Juozaitienė, V.; Malašauskienė, D.; Televičius, M. Inline Reticulorumen pH as an Indicator of Cows Reproduction and Health Status. Sensors 2020, 20, 1022. [Google Scholar] [CrossRef]
  53. Antanaitis, R.; Juozaitienė, V.; Rutkauskas, A.; Televičius, M.; Stasiulevičiūtė, I. Reticulorumen Temperature and pH as Indicators of the Likelihood of Reproductive Success. J. Dairy Res. 2018, 85, 23–26. [Google Scholar] [CrossRef]
  54. Puppel, K.; Kuczyńska, B. Metabolic Profiles of Cow’s Blood; a Review. J. Sci. Food Agric. 2016, 96, 4321–4328. [Google Scholar] [CrossRef]
  55. Li, L.; Bai, S.; Zhao, H.; Tan, J.; Wang, Y.; Zhang, A.; Jiang, L.; Zhao, Y. Dietary Supplementation with Naringin Improves Systemic Metabolic Status and Alleviates Oxidative Stress in Transition Cows via Modulating Adipose Tissue Function: A Lipid Perspective. Antioxidants 2024, 13, 638. [Google Scholar] [CrossRef] [PubMed]
  56. Tóthová, C.; Nagy, O.; Kovác, G. Changes in the Concentrations of Selected Acute Phase Proteins and Variables of Energetic Profile in Dairy Cows after Parturition. J. Appl. Anim. Res. 2014, 42, 278–283. [Google Scholar] [CrossRef]
  57. Džermeikaitė, K.; Krištolaitytė, J.; Sutkevičienė, N.; Vilkonienė, T.; Vaičiulienė, G.; Rekešiūtė, A.; Girdauskaitė, A.; Arlauskaitė, S.; Bajcsy, Á.C.; Antanaitis, R. Relationships Among In-Line Milk Fat-to-Protein Ratio, Metabolic Profile, and Inflammatory Biomarkers During Early Stage of Lactation in Dairy Cows. Vet. Sci. 2025, 12, 187. [Google Scholar] [CrossRef]
  58. Luo, Z.; Yong, K.; Du, Z.; Huang, Y.; Zhou, T.; Ma, L.; Yao, X.; Shen, L.; Yu, S.; Yan, Z.; et al. Association between Tryptophan Metabolism and Inflammatory Biomarkers in Dairy Cows with Ketosis. Metabolites 2023, 13, 333. [Google Scholar] [CrossRef]
  59. Stiehler, T.; Heuwieser, W.; Pfützner, A.; Burfeind, O. Serum Haptoglobin and C-Reactive Protein Concentration in Relation to Rectal and Vaginal Temperature of Early Postpartum Sows. Theriogenology 2016, 86, 862–867. [Google Scholar] [CrossRef]
  60. Schmitt, R.; Pieper, L.; Gonzalez-Grajales, L.A.; Swinkels, J.; Gelfert, C.-C.; Staufenbiel, R. Evaluation of Different Acute-Phase Proteins for Herd Health Diagnostics in Early Postpartum Holstein Friesian Dairy Cows. J. Dairy Res. 2021, 88, 33–37. [Google Scholar] [CrossRef]
  61. Yogeshpriya, S.; Selvaraj, P. C-Reactive Protein in Veterinary Practice. J. Dairy Vet. Sci. 2019, 13, 1–3. [Google Scholar]
  62. Beauchemin, K.A. Invited Review: Current Perspectives on Eating and Rumination Activity in Dairy Cows. J. Dairy Sci. 2018, 101, 4762–4784. [Google Scholar] [CrossRef]
  63. Mezzetti, M.; Minuti, A.; Piccioli-Cappelli, F.; Trevisi, E. Inflammatory Status and Metabolic Changes at Dry-off in High-Yield Dairy Cows. Ital. J. Anim. Sci. 2020, 19, 51–65. [Google Scholar] [CrossRef]
  64. Tufarelli, V.; Colonna, M.A.; Losacco, C.; Puvača, N. Biological Health Markers Associated with Oxidative Stress in Dairy Cows during Lactation Period. Metabolites 2023, 13, 405. [Google Scholar] [CrossRef]
  65. Mohsin, M.A.; Zhou, X.; Huiru, Y.; Shen, W.; He, B.; Sobiech, P.; Pierzchała, M.; Ogłuszka, M.; Starzyński, R.; Kalra, G.; et al. Effect of β-Hydroxybutyrate Acid on Gene Expression Levels of Antioxidant Biomarkers and Growth Hormone–Related Genes in Liver Cell Culture. J. Vet. Res. 2024, 68, 313–324. [Google Scholar] [CrossRef] [PubMed]
  66. Yehia, S.G.; Ramadan, E.S.; Megahed, E.A.; Salem, N.Y. Effect of Parity on Metabolic and Oxidative Stress Profiles in Holstein Dairy Cows. Vet. World 2020, 13, 2780–2786. [Google Scholar] [CrossRef]
Figure 1. Receiver Operating Characteristic (ROC) curves for GGT, AST and NEFA predicting milk lactose concentration below 4.5% in dairy cows. The AUC values indicate the diagnostic performance of each biomarker. The black dashed line represents the line of no discrimination (AUC = 0.5), which indicates the performance of a random classifier. AUC—Area Under the Curve; GGT—gamma-glutamyl transferase activity; AST—aspartate transaminase activity; NEFA—non-esterified fatty acid.
Agriculture 15 01205 g001
Figure 2. ROC curves for Fe, Reticulorumen pH, Crea, and SAA in predicting milk lactose concentration ≥ 4.5% in dairy cows. The AUC values indicate the discriminatory ability of each biomarker. The black dashed line represents the line of no discrimination (AUC = 0.5), which indicates the performance of a random classifier. RAUC—Area Under the Curve; Fe—iron; Crea—creatinine; SAA–serum amyloid A.
Agriculture 15 01205 g002
Table 1. TMR composition and nutritional content for lactating dairy cows.
TMR ComponentValue (%)
Corn silage25%
Alfalfa grass hay5%
Grass silage20%
Sugar beet pulp silage15%
Grain concentrates mash30%
Mineral mix5%
Dry matter (DM)48.8%
Neutral detergent fibre28.2% of DM
Net energy lactation1.6 Mcal/kg
Crude protein15.8% of DM
Non-fibre carbohydrates38.7% of DM
Acid detergent fibre19.8% of DM
Calcium0.80%
Phosphorus0.45%
Ether extract3.50%
Table 2. Descriptive statistics of blood parameters in dairy cows based on milk lactose content.
TraitsLactose (%)NMeanStd. DeviationStd. Error95% Confidence Interval for MeanMinimumMaximumSignificance
Lower BoundUpper Bound
CRP (mg/L)<4.53014.153.940.7212.6815.624.4122.300.399
≥4.54114.943.830.6013.7316.155.1322.73
AST (U/L)<4.53094.9531.535.7683.17106.7248.10196.000.042
≥4.54183.3514.682.2978.7287.9858.60124.40
Fe (µg/dL)<4.53097.8821.173.8789.97105.7851.00135.400.013
≥4.541110.0218.92.95104.06115.9966.30141.00
GGT (U/L)<4.53032.0316.563.0225.8538.2218.0088.000.085
≥4.54126.2711.241.7622.7229.8217.0088.00
NEFA (mmol/L)<4.5300.380.170.030.320.450.130.910.359
≥4.5410.340.190.030.280.400.100.84
SAA (μg/mL)<4.53065.2723.834.3556.3774.1723.81100.000.125
≥4.54174.1823.993.7566.6181.7623.81100.00
CREA (g/L)<4.53174.1010.481.9170.1978.0156.0098.000.161
≥4.54177.519.691.5174.4580.5761.0098.00
CRP—C-reactive protein; AST—aspartate transaminase activity; Fe–iron; GGT–gamma-glutamyl transferase activity; NEFA–non-esterified fatty acids; SAA—serum amyloid A; CREA—creatinine.
Table 3. Descriptive statistics of behaviour and milk parameters in dairy cows based on milk lactose content.
TraitsLactose (%)NMeanStd. DeviationStd. Error95% Confidence Interval for MeanMinimumMaximumSignificance
Lower BoundUpper Bound
Milk yield (kg)<4.53040.828.021.4637.8243.8223.3256.850.588
>4.54139.827.391.1537.4942.1514.3154.53
Milk fat<4.5304.000.760.143.724.282.645.520.705
≥4.5413.940.580.093.764.122.985.32
Milk protein<4.5303.270.310.063.153.382.643.950.472
≥4.5413.220.230.043.153.292.663.82
Milk fat-to-protein ratio<4.5301.240.270.051.141.340.791.860.882
≥4.5411.230.200.031.171.290.881.95
Reticulorumen pH<4.5305.990.220.045.916.075.516.360.03
≥4.5416.100.180.036.046.155.506.49
Reticulorumen temperature (°C)<4.53038.940.150.0338.8839.0038.6939.200.579
≥4.54138.970.180.0338.9139.0238.5939.60
Temperature without drink cycles (°C)<4.53039.630.170.0339.5739.7039.3739.990.456
≥4.54139.660.140.0239.6239.7039.4440.14
Normal temperature (°C)<4.53039.790.150.0339.7339.8539.540.000.963
≥4.54139.790.120.0239.7539.8339.5940.00
Rumination time (min./day)<4.530436.8976.1713.91408.45465.34253.2549.390.541
≥4.541447.3666.7710.43426.28468.43224.55567.10
Cow activity (sec/h)<4.5301295.90429.4478.401135.541456.25555.912445.830.497
≥4.5411370.30470.3373.451221.891518.8323.162418.33
Water intake (L/day)<4.530130.0118.113.31123.24136.7795.59168.940.618
≥4.541132.1117.032.66126.74137.4995.00166.93
Table 4. Correlation between C-reactive protein and other investigated traits.
TraitsPearson CorrelationSignificanceN
Milk temperature (°C)−0.0580.73371
Lactose (%)0.0430.80271
AST (U/L)0.1890.26271
Fe (µg/dL)−0.1770.29471
GGT (U/L)−0.0870.60871
NEFA (mmol/L)0.3350.04371
SAA (μg/mL)−0.320.05371
CREA (g/L)0.0590.62471
Milk yield (kg/day)0.1470.38671
Milk fat0.1610.34371
Milk protein−0.2640.11571
Milk fat-to-protein ratio0.2440.14571
Reticulorumen pH0.4980.00271
Reticulorumen temperature (°C)0.1400.40871
Temperature without drink cycles (°C)0.2750.10071
Normal temperature (°C)0.3720.02371
Rumination time (min/day)0.4290.00871
Cow activity (seconds/hour)−0.0990.55871
Water intake (L/day)−0.0070.96971
AST—aspartate transferase; Fe—iron; GGT—gamma-glutamyl transferase; NEFA—non-esterified fatty acids; SAA—serum amyloid A; CREA—creatinine.
Disclaimer/Publisher’s Note: The statements, opinions and data contained in all publications are solely those of the individual author(s) and contributor(s) and not of MDPI and/or the editor(s). MDPI and/or the editor(s) disclaim responsibility for any injury to people or property resulting from any ideas, methods, instructions or products referred to in the content.

