Abstract
Soil health has become increasingly important in recent years. The Hokkaido government initiated its original administrative strategy referred to as “Clean Agriculture” in 1991, before the concept of soil health and soil quality evolved in the 1990s. Also, Clean Agriculture has been integrated with remote sensing techniques for spatial application in arable fields. In this review paper, we summarized the scientific progress in Clean Agriculture and the management of soil health using remote sensing. One of the main pillars of Clean Agriculture is the minimal usage of chemical fertilizers and agrochemicals to increase soil fertility through the proper application of organic matter. The other two pillars are the sustainment and enhancement of the natural recycling function in agriculture and the enhancement of a stable production safe and high-quality agricultural products taking into account environmental harmony. These agronomic practices can increase soil fertility, maintain water quality, mitigate climate change, and maintain human health, and are similar to those in North America and the EU. Moreover, soil nitrogen fertility evaluated by autoclaved nitrogen (AC-N) can be estimated in large-scale fields and areas via remote sensing, which can facilitate variable nitrogen fertilization using variable-rate planters or broadcasters. Furthermore, systems comprising the growth sensor and variable-rate broadcaster can determine the additional nitrogen fertilization rates for winter wheat on the fields, which enhances soil health over relatively large areas. Further research is needed to expand the spatial utility of various Clean Agriculture techniques using multiperiod satellite images.
1. Introduction
Soil health is an important concept associated with soil conservation, soil function, environmental protection, sustainable agriculture, and human health [1]. The concept of soil health evolved as an offshoot of soil quality in the 1990s [2,3]. Recently, the concept of soil quality has been extended to crop productivity and fertility [4,5,6,7], water quality [8,9,10], climate change and carbon sequestration [11,12,13], soil biodiversity [14,15,16], and human health [8,17,18,19]. Because the functional knowledge and the effective assessment of soil biodiversity are still limited, Lehmann et al. summarized soil health from four viewpoints: sustainable crop production, water quality, climate change, and human health, and they discussed that soil biodiversity is related to all the viewpoints [1]. Nowadays, soil health is a comprehensive concept of ecosystem services related to soils [1,20,21,22].
Similar to other regions worldwide, there has been considerable research on soil health in Hokkaido, Japan, in terms of sustainable crop production [23] as well as soil and water pollution [24]. Prior to these studies, the Hokkaido government developed “Clean Agriculture” as its original administrative strategy in 1991 [25,26].
Clean Agriculture is defined as “An agriculture that sustains and enhances not only the natural recycling function in agriculture but also a stable production of the feel-relieved safety and high-quality agricultural products taking into account environmental harmony. In this concept, efforts are made to apply soil amendments for example organic application, and minimizes the usage of chemical fertilizers and agrochemicals” [25].
In the 1990s, given the vigorous international agricultural competitions such as the GATT-Uruguay rounds, Clean Agriculture was launched to fortify the international competitiveness and sustainability of Hokkaido agriculture. Its main aims are as follows: (1) the conservation of the clean environment that Hokkaido takes pride in, (2) the promotion of the appeal of Hokkaido agriculture, and (3) the reinforcement of the competitiveness of Hokkaido agriculture [27]. As of 2024, more than 300 relevant techniques have been developed [28], and Clean Agriculture is currently the basis for the agricultural practices relied on to enhance soil health in Hokkaido [26].
In practice, the application of Clean Agriculture techniques depends on spatial variations in the field. Recently, remote sensing [e.g., satellites or unmanned aerial vehicles (UAVs)] has increasingly been used to evaluate spatial variations in soil properties and crop growth. Therefore, the coordinated application of both remote sensing and Clean Agriculture techniques has been adopted, especially for the cultivation of arable crops in Hokkaido. Several studies also pointed out the importance of remote sensing for the assessment of soil health [1,29]. However, studies to manage soil health with remote sensing are still limited.
Recently, many reviews of soil health have been published worldwide [30,31,32]. Nevertheless, the relationship between Clean Agriculture and soil health, and the practice of soil health using remote sensing have not been summarized yet. The objectives of this paper are (1) to review the scientific progress of Clean Agriculture in Hokkaido from the viewpoints that Lehmann et al. summarized [1] in comparison with other regions, (2) to review the co-application of remote sensing techniques in arable fields in Hokkaido, and (3) to suggest future research directions needed to further enhance soil health mainly for arable fields.
2. Clean Agriculture and Hokkaido Fertilizer Recommendations
2.1. History of Clean Agriculture
In 1991, before Doran and Parkin [3] and Doran et al. [2] propounded the concept of soil health, Clean Agriculture was originally advocated by the now deceased Dr. Satoru Souma [27,33]. He established Clean Agriculture mainly on the basis of the concept of “Low Input Sustainable Agriculture” in the United States of America (USA), and emphasized the need for minimizing the usage of chemical fertilizers and agrochemicals by improving soil fertility through the proper application of organic matter. In Clean Agriculture, fertilized soil applied with an adequate amount of organic matter may decrease the need for chemical fertilizers and agrochemicals. In the 1990s, Dr. Souma, the former director of Hokkaido Prefectural Agricultural Experiment Stations, strongly encouraged the scientists he supervised to perform experiments and studies to diagnose soil physicochemical properties, control soil fertility through soil amendments, and minimize the usage of chemical fertilizers and agrochemicals [27,33]. This scientific strategy continues to be applied as of 2025. The research outcomes have been uploaded and updated on the Hokkaido Research Organization website [28], and summarized in Hokkaido Fertilizer Recommendations [34], which has been continuously revised almost every five years. These documents have been utilized by farmers, advisors, and professionals in other stakeholders. The Hokkaido government has also promoted Clean Agriculture among farmers and consumers using a cartoon character (Figure 1).

Figure 1.
Cartoon character of Dr. Hatakeda (arable field in Japanese) and “clean-dane” (clean seeds in Japanese), which has been used to promote Hokkaido’s Clean Agriculture.
Clean Agriculture is “NOT” organic agriculture which excludes any usage of chemical fertilizer and agrochemicals. Clean Agriculture allows their minimal usage [33], aiming for a 30% reduction of chemical fertilizers and agrochemicals used. The political direction of Clean Agriculture resembles the current EU agricultural policy (Farm to Fork Strategy) whose goals are a “20% reduction of chemical fertilizers and 50% reduction of agrochemicals by 2030” [35], which align with the Japanese government’s policies of a “30% reduction of chemical fertilizers and 50% reduction of agrochemicals by 2030” [35].
Clean Agriculture is supposed to be a realistic choice when thinking about the failing example of Sri Lanka. The Sri Lankan government imposed organic farming in 2019, with the complete prohibition of the usage of chemical fertilizers and agrochemicals nationwide. However, the policy caused a 30% reduction in crop yield and a serious shortage of food supply [36].
2.2. Hokkaido Fertilizer Recommendations: Practice of Clean Agriculture Based on Soil Diagnosis
Hokkaido Fertilizer Recommendations is a guidebook for applying fertilizers on the basis of soil diagnosis results [34]. The first edition was published in 2002, and it has since been revised three times (2010, 2015, and 2020). Before 2002, the guidelines (“Soil Diagnosis-Based Application of Fertilizers in Hokkaido”) and the criteria (“Soil and Plant Nutrition”) were published separately, but they were combined into one guidebook in 2002.
In Hokkaido Fertilizer Recommendations, the criteria for evaluating the soil in arable fields were established (Table 1), such as topsoil thickness, effective soil depth, saturated hydraulic conductivity, bulk density, available moisture, pH, available P2O5, and exchangeable K2O. Similarly, Doran et al. [2] reported the utility of the following soil physical, chemical, and biological factors for assessing soil health: texture, soil depth, infiltration, bulk density, water retention, total organic carbon (C) and nitrogen (N), pH, electrical conductivity (EC), extractable N, phosphorus (P), potassium (K), microbial biomass C and N, potential mineralizable N (anaerobic incubation), and soil respiration. These criteria seem to be the basis for the recent assessment of soil quality and soil health in North America [37] and the EU [38]. Because Hokkaido Fertilizer Recommendations referred to the guidelines in the USA, they share similar assessments to those in North America. However, there are some differences. For example, many soil physical properties are assessed in Hokkaido compared with North America and the EU, although these are listed in other soil health assessment guidelines such as USDA-NRCS in the USA [39] and AHDB-BBRO in the UK [40]. In contrast, there are no indices for soil texture, soil organic matter, and cation exchange capacity (CEC) in Hokkaido Fertilizer Recommendations because it is difficult for farmers to improve them immediately. Moreover, exchangeable Na2O is not listed in the Hokkaido Fertilizer Recommendations because the annual precipitation is much higher than evapotranspiration in Hokkaido so that the risk of salinity is much less than in North America and the EU. Furthermore, soil biological properties are listed in North America and the EU but are limited in Hokkaido. Instead, autoclaved N (AC-N) content can alternatively be utilized in Hokkaido.

Table 1.
Healthy soil criteria for arable fields in Hokkaido [34], North America [37], and the EU [38].
AC-N content is a widely used index for available N, with standard values that vary depending on the crop, region, and soil type (as described later). According to the Hokkaido Fertilizer Recommendations, the potential mineralizable N (anaerobic incubation) is also applicable for testing the available N in rice paddies. Specifically, a mixture comprising soil–water (10 g:20 mL) is sealed in a container and incubated at 40 °C for 7 days before determining the NH4-N content. Different diagnosis values for anaerobically incubated N have been set for each region and soil type. It has been reported that AC-N is significantly correlated with microbial biomass C, glucosidase activity, and soil respiration [41,42]. Therefore, AC-N can be utilized as an index of the biological aspect of soil health conditions.
Although there are some differences between Hokkaido Fertilizer Recommendations and the soil health assessment in other countries, the former contains relevant information affecting soil health, including soil micronutrients (e.g., Mn, B, Zn, Cu, and Ni), soil nutrient balance indices (Ca/Mg ratio, Mg/K ratio, base saturation, and Ca saturation), and crop nutrition diagnosis values. Thus, the Hokkaido Fertilizer Recommendations are a practical guide for maintaining healthy agricultural soil.
2.3. Wide Dissemination of AC-N as the Index for Available N
Clean Agriculture practices necessitate the accurate evaluation of soil N fertility. For arable crops (e.g., wheat, sugar beet, and potato) and horticultural crops, Hokkaido Fertilizer Recommendations use AC-N as the index for available N [34]. This index is easily determined by autoclaving a mixture consisting of 8 g of soil and 80 mL of water in a flask at 105 °C for 60 min and then digesting 20 mL of the filtrate according to the Kjeldahl method [43]. Earlier research indicated that AC-N can be easily and rapidly estimated by measuring the absorbance of the filtrate at 280 nm [44] and performing a near-infrared spectroscopic examination [45].
Although AC-N is more likely to overestimate soil N fertility than aerobically incubated N [46], in most cases, the adaptability of AC-N for the N uptake and N fertilization of individual crops was carefully examined before a soil diagnosis technique was disseminated (as described later). Therefore, AC-N is a widely applicable index for analyzing agricultural soil.
3. Sustainable Crop Production
3.1. Sugar Beet
According to Hokkaido Fertilizer Recommendations, soil fertility must be enhanced through the proper application of organic matter [34]. This guidebook provides details regarding how to decrease N fertilization rates when organic matter is applied. In particular, the effects of accumulating N due to the consecutive application of manure are thoroughly explained on the basis of long-term experiments for thirty years [47,48,49]. Moreover, Fueki et al. [50] observed that the amount of N derived from the applied organic matter determined according to Hokkaido Fertilizer Recommendations (Table 2) was closely associated with the residual amount of soil mineral N at a soil depth of 0–100 cm. Therefore, Fueki et al. [50] scored the amount of organic matter and field practice in regard to N, called the “N-score”. The sum of N-scores showed the highest correlation with the soil mineral N stocks ranging from 44 to 750 kg ha−1 in commercial fields (r = 0.839, p < 0.01) compared with the total soil nitrogen content (r = 0.388, p < 0.05) or AC-N (r = 0.397, p < 0.01) [50]. These results suggest that N-score could be representative of soil mineral N stocks in the depth of 0–100 cm (Figure 2). These results correspond to those in the other regions. In the USA, the sugar beet yield was maximized when the amount of N supplied (fertilizer N + spring soil mineral N) was 150–200 kg ha−1 [51]. Therefore, Fueki et al. [23] demonstrated that the N-score (+fertilizer N amount) can be used to predict the N uptake by sugar beet (Figure 3). On the other hand, excess organic matter application did not increase N uptake further as shown by × symbols (Figure 3), suggesting that excess organic matter application did not contribute to the further increase in yields and promoted N loss [52]. Thus, the N fertilization technique for sugar beet production was developed and disseminated. Nowadays, farmers can decide N fertilization rates using the following equation:
N fertilization rates (kg N ha−1) = 210 − ∑ N-score
Table 2.
Examples of N-scores for the application of organic matter in fields [34].
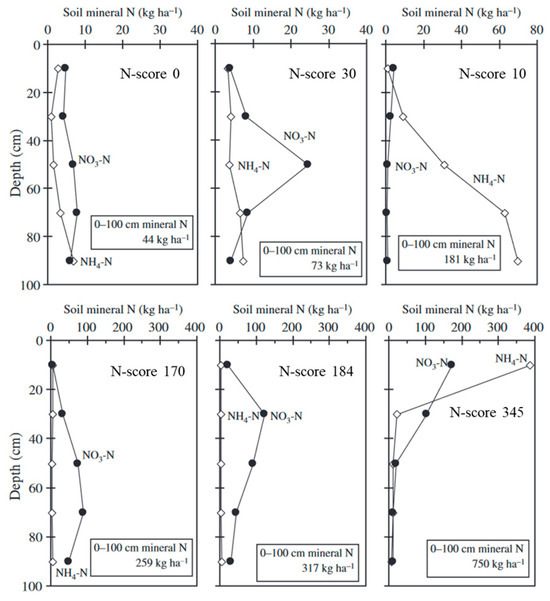
Figure 2.
Vertical distribution of soil mineral nitrogen in six typical representative fields modified after [50].
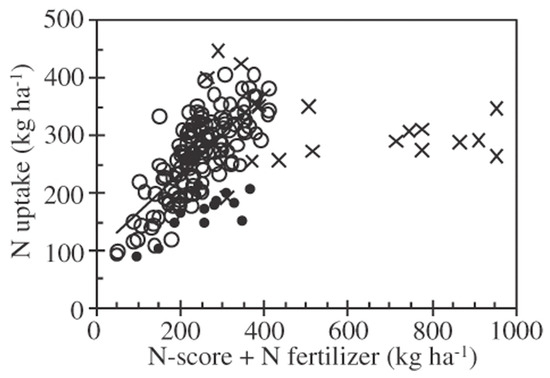
Figure 3.
Relationship between N uptake by sugar beet and N-score + N fertilization rate [18]. ×, excess organic matter (N-score exceeds 220 Mg ha−1 or consecutive applications more than 30 Mg ha−1 yr−1), n = 18; ●, confounding problems (diseased sugar beet or the topsoil is too hard), n = 13; ○, the others, n = 140, y = 0.68x + 100, r = 0.75, p < 0.001 [23].
3.2. Potato
In Hokkaido, different potato varieties that are suitable for the production of (1) fresh market potatoes, (2) potatoes that are subsequently processed (e.g., the production of chips, fries, croquettes, and salads), and (3) potatoes as starch resources have been developed. Potatoes that are processed after harvest must have a high starch content, low reducing sugar content, and high dry matter percentage to increase the processing efficiency and production quality at processing plants. Generally, increasing the N uptake by potatoes leads to an increase in tuber yield, but a decrease in starch content [53,54]. Additionally, excessive N uptake adversely affects photosynthetic efficiency and also leads to lodging as well as possibly increased susceptibility to diseases (e.g., late blight and soft rot) [55]. Therefore, optimal N fertilization management practices are needed to improve soil health and increase the starch content.
First, potato plants were cultivated without applying N fertilizers, and soil diagnosis-based techniques were used to measure N uptake. The results indicated that AC-N showed a higher correlation with N uptake (r = 0.54, p < 0.05) than with the soil mineral N (r = 0.26) or incubated mineral N content (r = 0.47, p < 0.05) [53], reflecting the applicability of AC-N for setting N fertilization rates for potato plants. However, the previous crops in crop rotations are typically sugar beet and pulses, with more N derived from sugar beet residues than from pulses. Accordingly, the previous crops as well as AC-N must be considered when setting N fertilization rates. Another study, which involved fertilizer treatments of potatoes used for processing and various previous crops, revealed that the marketable tuber yields plateaued when the N uptake was 100–110 kg N ha−1 regardless of the variety, soil type, AC-N, N fertilization rate, and fertilization method [56]. In addition, the N uptake without N fertilization plateaued when the AC-N was 100 mg kg−1 when the previous crops were pulses and green manure. However, the N uptake without N fertilization was much higher when the previous crop was sugar beet rather than pulses or green manure. Accordingly, N fertilization rates for the production of potatoes that will be processed can be determined on the basis of AC-N and previous crops (Table 3) [56].
Table 3.
N fertilization rates for potatoes that are processed to produce chips, fries, croquettes, and salads [34].
3.3. Winter Wheat
In Hokkaido, winter wheat is mainly cultivated for the production of medium flour (for Japanese “udon” noodles) and hard flour (for bread). Notably, wheat varieties cultivated as a source of medium flour are grown in more than 80% of the total winter wheat cropping area in Hokkaido [57]. Medium flour contains less protein than hard flour. Moreover, the N fertilization rate should be lower for the cultivation of wheat used to produce medium flour. Additionally, excessive N fertilization leads to lodging, which results in a decrease in the harvest efficiency of combine harvesters. Furthermore, because Hokkaido receives snow in winter, soil mineral N is easily lost via infiltration and surface runoff due to snowmelt in spring [24]. Therefore, the split application of N is required for sustainable wheat production while maintaining soil health.
To determine the rates of additional N fertilization between the regrowth stage (after snowmelt) and the panicle formation stage, appropriate soil diagnosis and target depth analyses were conducted. These analyses revealed that N uptake at harvest was related to the abundance of soil nitrate at a depth of 0–60 cm in the regrowth stage [58]. Hence, N fertilization rates can be calculated on the basis of the target yield and the abundance of soil nitrate at a depth of 0–60 cm (Table 4). Similar results were reported in other countries. For example, the optimal N rate was in the range of 71–170 kg N ha−1 in the North China Plain [59]. In Denmark, spring N application up to 150 kg N ha−1 did not increase the remaining nitrate in the soil at harvest, but N application of more than 150 kg N ha−1 retained soil nitrate at harvest [60].
Table 4.
Additional N fertilization rates (kg N ha−1) determined according to the target yield of winter wheat and the soil nitrate abundance in a depth of 0–60 cm in the regrowth stage [34].
A new high-yielding variety (“Kitahonami”) that was subsequently developed responded differently to fertilization compared with previous varieties [61]. More specifically, the additional N fertilization in the regrowth stage increased the yield, but it also resulted in the excessive production of spikes, potentially leading to lodging, especially when the tiller number in the regrowth stage was high. In contrast, the additional N fertilization at the panicle-formation stage resulted in a moderate increase in spike number. Currently, it is recommended that the additional N fertilization rate should be determined according to the tiller number in the regrowth stage (Table 5).
Table 5.
Determination of the additional N fertilization rate for winter wheat [34].
Additional N fertilization when the flag leaf appears increases the thousand grain weight [61]. Therefore, a method for setting the additional N fertilization rate in this stage is necessary. Fueki et al. demonstrated a close relationship between N uptake in the flag leaf stage and N uptake at harvest [62]. They also developed a method for estimating the N uptake in the flag leaf stage. Their findings suggested that the additional N fertilization rates at this stage can be calculated using the following equations [34]:
N uptake in the flag leaf stage (B, kg N ha−1) = 0.004 × superior stem number (stem m−2) × leaf color value of the second leaf − 12
Predicted N uptake at harvest without additional N fertilization during the flag leaf stage (C, kg N ha−1) = 0.58 × B + 66
Target N uptake at harvest (D, kg N ha−1) = 0.017 × target yield (kg ha−1) + 51
N fertilization rates for the flag leaf stage (kg N ha−1) = (D − C)/0.7
If farmers did not follow the additional N fertilization rates at the flag leaf stage described above, the N uptake at the mature stage was higher than that when following the recommended fertilization practices, leading to excess protein contents based on Japanese criteria for the medium flour [62]. These wheat grains lead to mineral N remaining in the soil at harvest as well as economic loss to farmers because the grain price decreases.
4. Water Quality
Excess N application results in a high abundance of mineral N remaining in the soil, which lowers crop quality as described in the previous section. Also, the high abundance of mineral N results in N leaching, leading to eutrophication in groundwater, rivers, and oceans [24,63,64,65,66,67,68]. In Japan, the national upper limit of nitrate concentration in groundwater is 10 mg N L−1. Therefore, it was necessary not to exceed the upper limit of nitrate concentration in agricultural fields.
To maintain water quality, various studies [24,63,64,65,66,67,68] on the nitrate concentration of leached water in arable fields were conducted. Suzuki and Shiga [24] revealed that the nitrate concentration of leached water did not exceed the upper limit for the N fertilization rates recommended by Clean Agriculture without manure application (Table 6). Also, manure application at 20 Mg ha−1 and the reduction of chemical N fertilizer by 20 kg ha−1 did not exceed the upper limit on average. However, manure application at 20 Mg ha−1 without the reduction of chemical N fertilizer exceeded the upper limit in all years. These results suggest that the nitrate concentration did not exceed the upper limit under the practice of Clean Agriculture. However, the excess N input could exceed the upper limit of nitrate concentration.
Table 6.
Nitrate leaching and concentration from arable fields [34], modified to English.
To expand the previous studies, environmental N capacity and excess N input are defined by the following equations [69]:
where the nitrate capacity for groundwater is defined by the Japanese upper limit of nitrate concentration in groundwater (10 mg N L−1) × percolation rate.
Previous studies revealed that the excess N input was significantly correlated with the nitrate concentration in groundwater on the municipal [69] and field [66] scales. Also, these studies suggested that the N leaching was increased when the excess N input exceeded 0 kg N ha−1 [66,69], and N fertilization rates equal to the environmental N capacity did not increase the N leaching. Therefore, Clean Agriculture sets the N fertilization rates without surplus N at harvest. A similar concept has been adopted in Poland [70] and the USA [71].
5. Climate Change
Agricultural soils are one of the important sources of greenhouse gas emissions [72]. On the other hand, soils also have the potential to mitigate climate change through appropriate agricultural practices [73,74]. It is expected that the increase in global soil organic matter stocks by 4 per mille can compensate for the global anthropogenic emissions of greenhouse gases [74]. In Hokkaido, the practice of Clean Agriculture did not change soil organic carbon (C) stocks and contents for about 10 years at a depth of 0–0.15 m [75]. This finding suggests that Clean Agriculture can maintain the soil organic C stocks and contents.
Nitrous oxide (N2O) is another important greenhouse gas, and fertilized soils are an important source of N2O [72]. Mostly, the N2O emission is higher with higher surplus N in soils [76,77,78]. Therefore, it is expected that the same strategy to reduce N leaching can be taken to mitigate climate change.
In arable fields, the annual N2O emissions of conventional fertilization were 1.85 kg N ha−1 yr−1 and 1.02 kg N ha−1 yr−1 for the fields of winter wheat and sugar beet for a three-year average, respectively [52] (Table 7). On the other hand, the annual N2O emissions of Clean Agriculture by a manure application of 30 Mg ha−1 and reduced chemical fertilization of 30 kg N ha−1 were significantly decreased [52] (Table 7). In contrast, the excess manure application of 90 Mg ha−1 increased N2O emissions (Table 7). Also, the yields of winter wheat and sugar beet did not change significantly [52].
Table 7.
Annual N2O emissions of conventional chemical fertilization without manure, with Clean Agriculture, and with excess manure application [34], modified to English.
In grassland, CO2, CH4, and N2O emissions from manure, slurry, and digestive fluid application and reduced chemical fertilizer based on Clean Agriculture were compared [79]. CO2 (heterotrophic respiration), CH4, and N2O emissions did not change among treatments. On the other hand, the net ecosystem C balance (NECB) was significantly lower for manure application (40.5 Mg CO2-eq ha−1 yr−1) than for chemical fertilizer only (64.1 Mg CO2-eq ha−1 yr−1). The greenhouse gas balance (CO2 equivalent NECB, CH4, and N2O) was mitigated 36.2%, 16.5%, and 27.0% for manure, slurry, and digestive fluid, respectively, compared with chemical fertilizer only [79]. Furthermore, grass yield did not change significantly [52,79]. Therefore, Clean Agriculture with manure application and reduced chemical fertilizer can be an important strategy to mitigate climate change without yield loss.
6. Human Health
There are various aspects of the effect of soil health on human health. Lehmann et al. summarized the micronutrients for malnutrition, soil pollutants, and soil host pathogens [1]. In Hokkaido, the main issue related to human health is soil pollutants, especially heavy metals. Although the contents of heavy metals are lower in the parent materials of Andosols than in the other soil groups [80], the control of toxic heavy metals in agricultural soils is important in Hokkaido.
In paddy fields, the cadmium (Cd) contents in rice can be significantly changed by the redox status. A pot experiment revealed that the Cd contents in rice grown (0.01 mg kg−1) with flooding throughout the growing period was significantly lower than that in rice grown (0.24 mg kg−1) without flooding [81]. Moreover, the flooding from transplanting to three weeks before heading can significantly decrease Cd contents in rice from 0.23 mg kg−1 to 0.04 mg kg−1 in rice grown with the flooding for two weeks after heading [81]. Although all of the results of Cd contents in rice were lower than the Japanese upper limit (0.4 mg kg−1), these results suggest that the Cd contents in rice can be lowered by water management in paddy fields.
Moreover, organic matter application can be a source of heavy metals. Lime-treated sewage sludge compost can be utilized for Clean Agriculture, but it contains zinc (Zn), copper (Cu), arsenic (As), and Cd [82]. Therefore, the application of the compost should be controlled. The application of the compost at 4 Mg ha−1 did not change Zn, Cu, and Cd contents in rice compared with the case without compost application for a single year in brown lowland soil and gley lowland soil (Table 8) [82]. Furthermore, the compost application at 2 Mg ha−1 for three consecutive years did not change the Zn, Cu, As, and Cd contents in rice compared with the case without compost application in brown lowland soil, gley lowland soil, and peat soil (Table 8). Also, compost application at 2 Mg ha−1 did not change acid-soluble Zn (4.9−7.4 mg kg−1), acid-soluble Cu (2.3−5.4 mg kg−1), acid-soluble As (2.0−5.4 mg kg−1), and total Cd (0.19−0.23 mg kg−1) contents in the soil compared with the case without compost application in these three soil types. According to these results, Clean Agriculture allows the application of lime-treated sewage sludge compost with farmers recording the application rates and the actual heavy metal contents.
Table 8.
Heavy metal contents in rice grains (mg kg−1) [82], modified to English.
7. Remote Sensing
As mentioned in Section 3, various Clean Agriculture techniques (e.g., N fertilizer management) have been developed in Hokkaido. However, many of these techniques were developed for a single point within the field. To effectively apply Clean Agriculture techniques in the arable fields of Hokkaido where each field exceeds several hectares, it is important to consider the spatial variations in crop growth and soil fertility in many fields. In this section, we introduce some studies that confirmed that remote sensing can facilitate the application of Clean Agriculture techniques in whole fields. Furthermore, we discuss future prospects for remote sensing technology as part of Clean Agriculture initiatives.
7.1. Variable Additional N Application System for Wheat Using Growth Sensors
As shown in Equations (1)–(4), the appropriate additional N application rates for “Kitahonami” wheat during the flag leaf stage can be estimated according to the N uptake at that stage [62]. To apply this method throughout the arable field, the spatial variations in N uptake within the field at a particular stage must be examined. Thus, a “variable additional N application system for wheat using growth sensors” was developed in Hokkaido (Figure 4) [83].
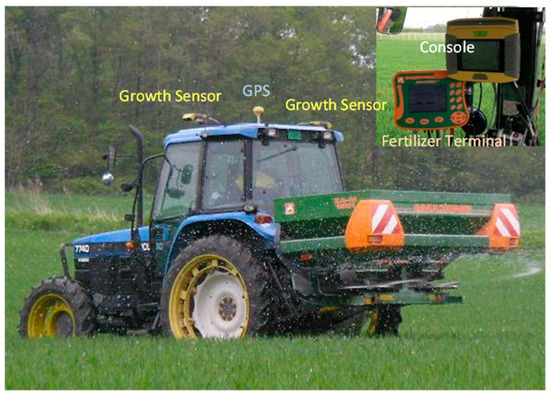
Figure 4.
Components of the variable additional N application system for wheat.
This system consists of growth sensors (CropSpec developed by TOPCON Corporation, Tokyo, Japan) mounted on a tractor, a GPS, and a guidance system console. The system is also characterized by sensing crop growth using active optical sensors. Generally, the reflection intensity of crop growth obtained from satellite images is affected by sunlight and aerosols. Therefore, to create an agricultural information map for N uptake using image data, the reflection intensity and the actual measured N uptake for each image must be calibrated. However, the active optical sensors that are used can obtain stable reflection intensities without depending on sunlight. Hence, the reflection intensity can easily be calibrated with the actual crop growth. In other words, once a calibration formula for the reflection intensity and N uptake is created, it can be used to estimate the wheat N uptake in other fields.
The console has a built-in input/output function for sensor values, a calibration formula for sensor values and N uptake, and a formula to convert the N uptake during the flag leaf stage into appropriate additional N application rates. The console performs the following operations in real time: (1) input the sensor values determined by the growth sensors, (2) convert the sensor values into the appropriate additional N application rates, and (3) transfer the N application rates to the console terminal.
Field studies comparing the variable fertilizer (VF) application treatments using this system and the conventional fertilizer (CF) application treatments (uniform fertilization) revealed that the spatial variability in the grain protein contents was lower for the VF treatments than for the CF treatments. Therefore, this system may be useful for restricting the decrease in the wheat quality rank. Furthermore, this system can also be used to calculate variable additional N application rates at the panicle-formation stage of wheat. Specifically, variable application rates are determined on the basis of the difference between the mean N uptake in the field and the N uptake at each location, with data obtained from growth sensors. As shown in Table 9, the studies conducted in six fields indicated that the yield was on average 5% higher for the VF treatments (5.73 t ha−1) than for the CF treatments (5.44 t ha−1). In addition, the coefficient of variance (CV) in the VF treatment was lower than that in the CF treatment for each experiment, suggesting that variable nitrogen application leveled out wheat growth within a field.
Table 9.
Wheat yields for the variable and conventional fertilizer application treatments at panicle formation stage [83], edited in English.
7.2. Variable Basal Nitrogen Application System Using AC-N Maps from Drone Images
As mentioned in Section 2.3, AC-N is used to evaluate soil N fertility in Hokkaido, and methods for estimating the appropriate N application rates according to AC-N have been established for various crops, including sugar beet and potato. In a previous study, AC-N was found to be highly positively correlated with the soil humus content in each field (Figure 5) [84]. In addition, the surface soil humus content in an arable field can be estimated using bare soil images obtained from optical sensors [85]. Thus, a private company in Hokkaido (Zukosha Co., Ltd., Obihiro, Japan) developed a system for determining the variable basal N application rate using the map of AC-N obtained from images captured by the optical camera of a UAV drone [26].
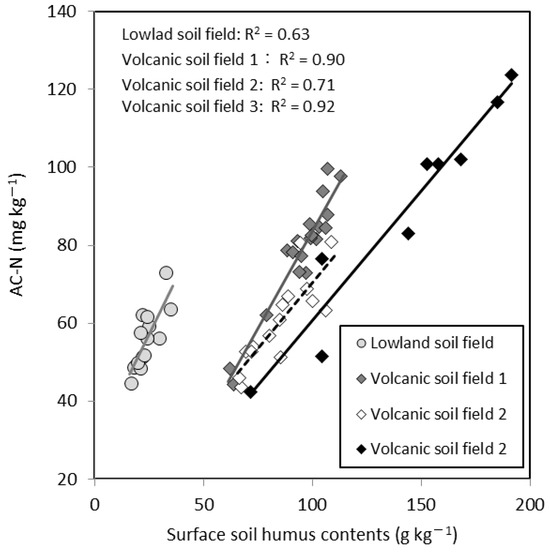
Figure 5.
Relationship between AC-N and surface soil humus content under different field conditions [84], edited in English.
As an example of an AC-N map, Niwa et al. [86] acquired bare soil images of two fields using a visible camera mounted on a UAV drone. These images were separated by color bands of red, green, and blue (RGB) using an image analysis software (PC-MAPPING Version 6.0, Mapcom Inc., Tokyo, Japan). The relationship between RGB and the measured AC-N (Table 10) was investigated with regression analysis for each color band. Then, the color band with the highest R2 was selected, and the AC-N map was generated by using the images of a single band. The selected color band was not always the same. As shown in Table 11, the blue (R2 = 0.47) and red (R2 = 0.79) bands were selected for fields A and B, respectively.
Table 10.
Actual measured contents of AC-N (mg kg−1) for each field surveyed [86], edited in English.
Table 11.
Results of simple regression analysis of drone-based bare soil image data (red, green, and blue) and AC-N [86], edited in English.
The procedure for using this system is used is summarized as follows (Figure 6):
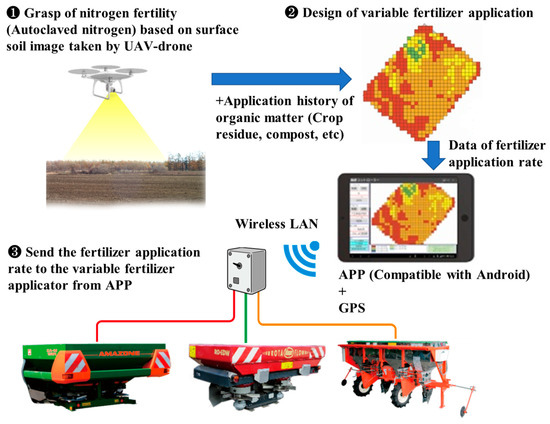
Figure 6.
Overview of the variable basal N application system [26].
- An AC-N map of the field is created using bare soil images taken by a UAV-drone and actual AC-N measurements at several points.
- The map of variable fertilizer application rates is designed on the basis of the AC-N map, the above-mentioned methods for estimating N fertilizer application rates, and the history of organic matter applications and field practices (Table 2). When blended fertilizers are used, variable fertilizer application rates may sometimes be determined after consulting with the user regarding the required phosphate and potassium application amounts.
- The variable fertilizer application rates are transferred to the application (app) compatible with the Android mobile operating system developed by Zukosha Co., Ltd. (Obihiro, Japan). This app can determine the current location using a GPS and transfer the fertilizer application rates at the current location to the fertilizer applicator terminal via a wireless LAN.
Recently, ISOBUS fertilizer applicators have been introduced. When using an ISOBUS fertilizer applicator, the app and wireless LAN (Figure 6) are no longer necessary, thereby simplifying the variable fertilizer application.
The utility of this system was investigated in three sugar beet fields comprising volcanic soils in the Tokachi region of Hokkaido in 2015. Briefly, CF and VF treatments were applied to experimental plots established in each field, after which the fertilizer application rates and sugar beet yields for the treatments were compared.
The experimental results for all fields showed that the N fertilizer application rate was on average 25% lower for the VF treatment than for the CF treatment. Moreover, in each field, the sugar beet yield was on average 9% higher for the VF treatment than for the CF treatment (Table 12). Furthermore, in 2017, a similar study was conducted for potatoes in field C using the AC-N field map for variable fertilization in 2015. Compared with the corresponding data for the CF treatment, the N application rate was 18% lower and the marketable potato yield was 15% higher for the VF treatment.
Table 12.
N application rates and sugar beet yields for the variable and conventional fertilizer application treatments [26].
This system has been adapted for various crops, with the AC-N field map applicable for other years. Notably, this system has been introduced in arable fields (more than 1000 ha) in Hokkaido. Furthermore, a local agricultural high school has incorporated this system into their classes.
As mentioned above, in Hokkaido, the technology of variable N application rates has been developed on the basis of crop growth and AC-N so that it is compatible with Clean Agriculture. Similar techniques have been developed on the basis of soil N status [87,88], crop growth detected by sensors [89,90], and their combinations [91,92]. For example, Zhou et al. [87] measured soil total N contents using an on-the-go sensor attached to a tractor. On the basis of the measurements, they generated a map of soil total N, and the N fertilization rates were changed on the basis of the map of soil total N content. The maize grain yield for VF (7275 kg ha−1) was higher than that for CF (6713 kg ha−1).
There is another approach to delineating the management zone by the apparent electrical conductivity (ECa) [93,94,95]. ECa is correlated with soil texture, soil moisture, and soil nutrient status. For example, Sanches et al. [95] measured ECa using an electromagnetic induction sensor pulled by a quadricycle. Then, an ECa map was generated by the ordinary kriging interpolation method. The area with higher ECa was attributed to higher base cation and humus contents compared with the area with lower ECa, suggesting that the area with higher ECa was more fertile. Sugarcane yield showed that the area of higher ECa was maximized with lower N fertilization rates compared with the area with lower ECa. Therefore, the potential for the usage of ECa is high for variable N applications.
In contrast, ECa has not been listed in most of the soil health indicators including Clean Agriculture (Table 1). Therefore, the compatibility of variable N application based on ECa would be weak in Hokkaido. For the spatial extension of soil health, it is important to determine N application rates using soil health indicators as well as N fertility. In this context, the variable N application rates based on AC-N are preferable for soil health because AC-N is correlated with soil microbial activity [41,42].
7.3. Determining Suitable Fields for Variable N Application
As shown in Figure 5, the surface humus content is highly correlated with AC-N for each field. In other words, the variability of N fertility within a field can be evaluated on the basis of the surface humus content. Focusing on this point, Niwa et al. [96] investigated the relationship between image data for each wavelength band (RGB and near-infrared) obtained from the satellite image (SPOT) of bare soil in April 2016 and the measured surface humus contents at 64 locations in Hokkaido’s arable land. As a result, the highest negative correlation (R2 = 0.71) was found between the red image data and the measured humus contents, and the surface humus content map (10 m mesh) was generated from the satellite image of the red band. In addition, the normalized difference vegetation index (NDVI) (10 m mesh) of potato and sugar beet was obtained from satellite images (SPOT) taken in early July 2016, which corresponds to the stage of complete foliage cover for sugar beet and the flowering stage for potato. Using the obtained maps, the relationship between the surface humus content and the NDVI was investigated in 123 fields. The year 2016 was characterized by heavy rainfall in June.
As shown in Figure 7, some fields showed a positive correlation, while others showed a negative correlation between surface humus content and NDVI. Approximately 40% of the fields showed positive correlations between these two factors, and variable N application is effective in these fields. However, approximately 20% of the fields showed negative correlations. The soil with high humus content in the study area results from poor drainage during heavy rainfall caused by the excessively high water-holding capacity. For this reason, the drainage in the area with the high surface humus contents should be improved in those fields with negative correlations. The application of a variable N fertilization rate becomes unstable depending on weather conditions.
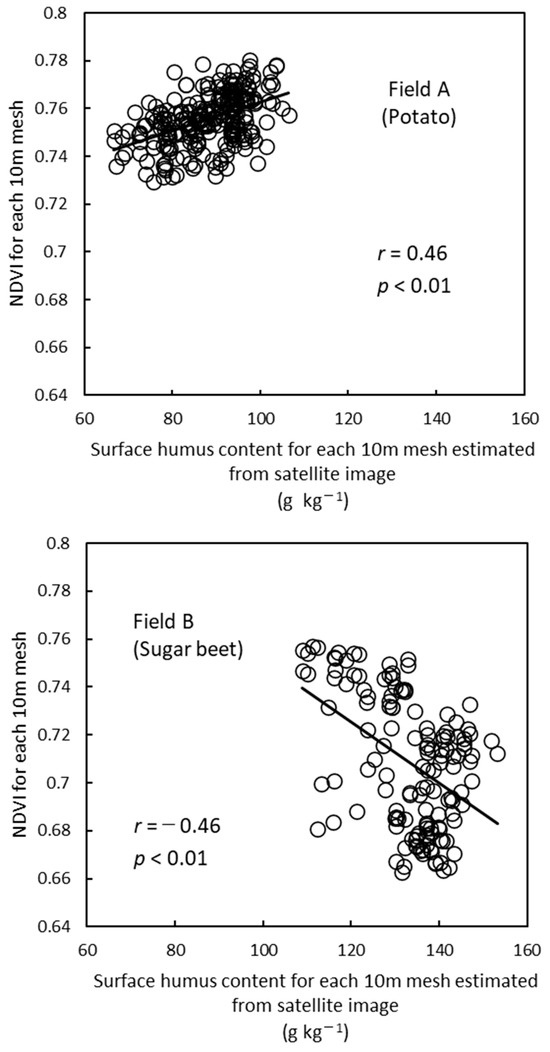
Figure 7.
Relationship between surface humus content and crop growth (NDVI) for 10 m mesh estimated from satellite images for each field [96], edited in English.
As described above, variations in crop growth within a field are affected by various factors. Therefore, to conduct variable N application effectively, it is important to understand in advance whether crop growth is affected by N fertility.
7.4. Current Limitations and Future Prospects for Remote Sensing Technology
We have described the technology of variable N application based on remote sensing. In the future, it will be important to estimate various edaphic factors from remote sensing information and to carry out cultivation management and soil improvement based on that information. However, it is difficult to determine various edaphic factors from regression analysis such as those shown in Table 11.
In recent years, more advanced methods such as machine learning have been integrated with remote sensing, and studies on determining various edaphic factors have been conducted [97,98,99,100]. For example, Morishita and Ishitsuka [99] took images of bare soils using a UAV drone and attempted to estimate various soil properties by random forest regression. As a result, they showed that particle size, pH (H2O), EC, and so forth, which were difficult to estimate using conventional regression methods, can be estimated using machine learning.
On the other hand, in recent years, satellite images, including those from Sentinel (European Space Agency) and Landsat (National Aeronautics and Space Administration), have been provided as open data. In terms of Sentinel-2, the 2A and 2B satellites equipped with optical sensors can acquire images with a resolution of 10 m every 5 days. The resolution of Sentinel-2 images is sufficient for revealing the variations in crop growth and soil fertility within arable fields in Hokkaido. In other words, in Hokkaido, agricultural information obtained from multiperiod satellite images can be distributed at a low cost.
Ishikura et al. [101,102] evaluated the variability of NDVI within a field in some wheat fields at the panicle-formation and maturity stages using satellite images. As a result, they showed that areas with relatively low NDVI in both stages showed poor water retention, but areas with low NDVI in the panicle-formation stage and high NDVI in the maturity stage showed poor drainage. Niwa et al. [103] evaluated sugar beet growth within a field in rainy and dry years using NDVI from satellite images. As a result, it was found that some areas of the surveyed fields had low NDVI only in rainy years. In those areas, it was confirmed that the growth of sugar beet was restricted because of waterlogging, which occurred only in a rainy year.
In this way, to understand various edaphic factors from remote sensing, it is important to utilize multiperiod images as well as introduce new analysis methods such as machine learning.
8. Conclusions
In Hokkaido, Clean Agriculture has been applied and refined since the 1990s on the basis of soil diagnosis, appropriate amendment of organic matter, and minimal usage of chemical fertilizers and agrochemicals. Clean Agriculture realizes sustainable crop production, an increase in water quality, the mitigation of climate change, and the maintenance of human health. Although each study has been conducted from the viewpoint of soil quality, implementing Clean Agriculture integrating all of these study outcomes will lead to enhanced soil health as well as soil health indicators in other countries. Moreover, Clean Agriculture has been recommended by the Hokkaido local government, agricultural experiment stations, agricultural extension centers, and other stakeholders. Thus, many farmers have practiced Clean Agriculture in their own arable fields, which contributes to the management of soil health in Hokkaido.
Most farmers request soil diagnosis at only one point in their field. However, soil properties spatially vary within arable fields in Hokkaido. Expanding the use of Clean Agriculture techniques to promote soil health over wide areas will require the incorporation of remote sensing technology into Clean Agriculture practices. Therefore, Clean Agriculture should also be improved to be easily compatible with remote sensing. In the case of N management for winter wheat, the N uptake at the flag leaf stage can be estimated using a handheld NDVI sensor [104], which suggests the possibility of N uptake estimation using satellite images. It is expected that farmers can decide on the N fertilization rate in each field from satellite images in the near future. Although the decision of N fertilization rates by soil diagnosis is accurate, some soil properties have low compatibility with remote sensing. Therefore, further research is required to address the estimation of various soil properties by remote sensing, leading to easy decision-making by farmers. It is expected that these future outcomes of remote sensing and machine learning technologies increasingly enable farmers and other stakeholders to maintain soil health.
Author Contributions
Conceptualization, N.F.; writing—original draft preparation, N.F., K.I. and K.N.; writing—review and editing, K.I.; visualization, K.I.; supervision, N.F. and K.N. All authors have read and agreed to the published version of the manuscript.
Funding
This research received no external funding.
Institutional Review Board Statement
Not applicable.
Data Availability Statement
Not applicable.
Acknowledgments
We appreciate the contributions of the farmers, agricultural extension centers, agricultural cooperatives, and other stakeholders involved in the studies on Clean Agriculture. We also appreciate all of the researchers who helped develop Clean Agriculture techniques.
Conflicts of Interest
Author Katsuhisa Niwa was employed by the company Zukosha Co., Ltd. The remaining authors declare that the research was conducted in the absence of any commercial or financial relationships that could be construed as a potential conflict of interest.
References
- Lehmann, J.; Bossio, D.A.; Kögel-Knabner, I.; Rillig, M.C. The Concept and Future Prospects of Soil Health. Nat. Rev. Earth Environ. 2020, 1, 544–553. [Google Scholar] [CrossRef] [PubMed]
- Doran, J.W.; Sarrantonio, M.; Liebig, M.A. Soil Health and Sustainability. Adv. Agron. 1996, 56, 2–55. [Google Scholar]
- Doran, J.W.; Parkin, T.B. Defining and Assessing Soil Quality. In Defining Soil Quality for a Sustainable Environment; Doran, J.W., Coleman, D.C., Bezdicek, B.F., Stewart, B.A., Eds.; Soil Science Society of America: Madison, WI, USA, 1994; Volume 35, pp. 1–21. [Google Scholar]
- Thapa, S.; Bhandari, A.; Ghimire, R.; Xue, Q.; Kidwaro, F.; Ghatrehsamani, S.; Maharjan, B.; Goodwin, M. Managing Micronutrients for Improving Soil Fertility, Health, and Soybean Yield. Sustainability 2021, 13, 11766. [Google Scholar] [CrossRef]
- Silveira, M.L.; Kohmann, M.M. Maintaining Soil Fertility and Health for Sustainable Pastures. In Management Strategies for Sustainable Cattle Production in Southern Pastures; Academic Press: New York, NY, USA, 2020; pp. 35–58. ISBN 9780128144749. [Google Scholar]
- Chaparro, J.M.; Sheflin, A.M.; Manter, D.K.; Vivanco, J.M. Manipulating the Soil Microbiome to Increase Soil Health and Plant Fertility. Biol. Fertil. Soils 2012, 48, 489–499. [Google Scholar] [CrossRef]
- Karlen, D.L.; Veum, K.S.; Sudduth, K.A.; Obrycki, J.F.; Nunes, M.R. Soil Health Assessment: Past Accomplishments, Current Activities, and Future Opportunities. Soil. Tillage Res. 2019, 195, 104365. [Google Scholar] [CrossRef]
- Lamichhane, S.; Bal Krishna, K.C.; Sarukkalige, R. Polycyclic Aromatic Hydrocarbons (PAHs) Removal by Sorption: A Review. Chemosphere 2016, 148, 336–353. [Google Scholar] [CrossRef]
- Carpenter, S.R.; Caraco, N.F.; Correll, D.L.; Howarth, R.W.; Sharpley, A.N.; Smith, V.H. Nonpoint Pollution of Surface Waters with Phosphorus and Nitrogen. Ecol. Appl. 1998, 8, 559–568. [Google Scholar] [CrossRef]
- Evans, A.E.; Mateo-Sagasta, J.; Qadir, M.; Boelee, E.; Ippolito, A. Agricultural Water Pollution: Key Knowledge Gaps and Research Needs. Curr. Opin. Environ. Sustain. 2019, 36, 20–27. [Google Scholar] [CrossRef]
- Battaglia, M.; Thomason, W.; Fike, J.H.; Evanylo, G.K.; von Cossel, M.; Babur, E.; Iqbal, Y.; Diatta, A.A. The Broad Impacts of Corn Stover and Wheat Straw Removal for Biofuel Production on Crop Productivity, Soil Health and Greenhouse Gas Emissions: A Review. GCB Bioenergy 2021, 13, 45–57. [Google Scholar] [CrossRef]
- Thangarajan, R.; Bolan, N.S.; Tian, G.; Naidu, R.; Kunhikrishnan, A. Role of Organic Amendment Application on Greenhouse Gas Emission from Soil. Sci. Tot. Environ. 2013, 465, 72–96. [Google Scholar] [CrossRef]
- Lal, R. Soil Health and Carbon Management. Food Energy Secur. 2016, 5, 212–222. [Google Scholar] [CrossRef]
- Wall, D.H.; Nielsen, U.N.; Six, J. Soil Biodiversity and Human Health. Nature 2015, 528, 69–76. [Google Scholar] [CrossRef]
- Frąc, M.; Hannula, S.E.; Bełka, M.; Jȩdryczka, M. Fungal Biodiversity and Their Role in Soil Health. Front. Microbiol. 2018, 9, 316246. [Google Scholar] [CrossRef]
- Wagg, C.; Bender, S.F.; Widmer, F.; Van Der Heijden, M.G.A. Soil Biodiversity and Soil Community Composition Determine Ecosystem Multifunctionality. Proc. Natl. Acad. Sci. USA 2014, 111, 5266–5270. [Google Scholar] [CrossRef] [PubMed]
- Perković, S.; Paul, C.; Vasić, F.; Helming, K. Human Health and Soil Health Risks from Heavy Metals, Micro(Nano)Plastics, and Antibiotic Resistant Bacteria in Agricultural Soils. Agronomy 2022, 12, 2945. [Google Scholar] [CrossRef]
- Morton, C.M.; Pullabhotla, H.; Bevis, L.; Lobell, D.B. Soil Micronutrients Linked to Human Health in India. Sci. Rep. 2023, 13, 13591. [Google Scholar] [CrossRef] [PubMed]
- Barrett, C.B.; Bevis, L.E.M. The Self-Reinforcing Feedback between Low Soil Fertility and Chronic Poverty. Nat. Geosci. 2015, 8, 907–912. [Google Scholar] [CrossRef]
- Kibblewhite, M.G.; Ritz, K.; Swift, M.J. Soil Health in Agricultural Systems. Philos. T Roy. Soc. B 2008, 363, 685–701. [Google Scholar] [CrossRef]
- Adhikari, K.; Hartemink, A.E. Linking Soils to Ecosystem Services—A Global Review. Geoderma 2016, 262, 101–111. [Google Scholar] [CrossRef]
- Bonfante, A.; Basile, A.; Bouma, J. Targeting the Soil Quality and Soil Health Concepts When Aiming for the United Nations Sustainable Development Goals and the EU Green Deal. Soil 2020, 6, 453–466. [Google Scholar] [CrossRef]
- Fueki, N.; Sato, K.; Takeuchi, H.; Sato, H.; Nakatsu, S.; Kato, J. Prediction of Nitrogen Uptake by Sugar Beet (Beta Vulgaris L.) by Scoring Organic Matter and Nitrogen Management (N-Score), in Hokkaido, Japan. Soil. Sci. Plant Nutr. 2011, 57, 411–420. [Google Scholar] [CrossRef]
- Suzuki, K.; Shiga, H. The Maximum Permissible Amount of Nitrogen Input into an Andisol Upland Field in Abashiri Area Assessed by Percolate Nitrate Concentrations. Jpn. J. Soil. Sci. Plant Nutr. 2004, 75, 45–52, (In Japanese with English abstract). [Google Scholar] [CrossRef]
- Department of Agriculture Hokkaido Local Government Clean Agriculture of Hokkaido. Available online: https://www.pref.hokkaido.lg.jp/ns/shs/clean/ (accessed on 30 December 2023).
- Nakatsuji, T.; Shiga, H.; Takeuchi, H.; Tsukamoto, Y.; Goto, E.; Watanabe, Y.; Sakurai, M.; Fueki, N.; Hikasa, Y.; Hayashi, T.; et al. Hokkaido Region. In The Soils of Japan; Hatano, R., Shinjo, H., Takata, Y., Eds.; Springer: Singapore, 2021; pp. 135–184. [Google Scholar]
- Souma, S. Direction and Technological Agenda of Environmentally Harmonized Agriculture (Clean Agriculture) Aimed in Hokkaido. J. Agr. Sci. 1992, 47, 193–198. (In Japanese) [Google Scholar]
- Department of Agricultural Research Hokkaido Research Organization List of Research Outcomes. Available online: https://www.hro.or.jp/agricultural/center/result/kenkyuseika.html (accessed on 24 December 2023).
- Tripathi, A.; Tiwari, R.K.; Tiwari, S.P. A Deep Learning Multi-Layer Perceptron and Remote Sensing Approach for Soil Health Based Crop Yield Estimation. Int. J. Appl. Earth Obs. Geoinf. 2022, 113, 102959. [Google Scholar] [CrossRef]
- Hussain, Z.; Deng, L.; Wang, X.; Cui, R.; Liu, G. A Review of Farmland Soil Health Assessment Methods: Current Status and a Novel Approach. Sustainability 2022, 14, 9300. [Google Scholar] [CrossRef]
- Guo, M. Soil Health Assessment and Management: Recent Development in Science and Practices. Soil. Syst. 2021, 5, 61. [Google Scholar] [CrossRef]
- Omer, E.; Szlatenyi, D.; Csenki, S.; Alrwashdeh, J.; Czako, I.; Láng, V. Farming Practice Variability and Its Implications for Soil Health in Agriculture: A Review. Agriculture 2024, 14, 2114. [Google Scholar] [CrossRef]
- Souma, S. Agenda and Perspective of Clean Agriculture. Hokuno 1995, 62, 314–317. (In Japanese) [Google Scholar]
- Department of Agriculture Hokkaido Prefectural Government. Hokkaido Fertilizer Recommendations 2020; Department of Agricultural Research Hokkaido Research Organization, Ed.; Department of Agriculture, Hokkaido Prefectural Government: Sapporo, Japan, 2020. (In Japanese) [Google Scholar]
- Ministry of Agriculture Forestry and Fisheries MIDORI Strategy for Sustainable Food Systems. Available online: https://www.maff.go.jp/j/kanbo/kankyo/seisaku/midori/ (accessed on 17 March 2025).
- Hatano, R. Development of International Collaboration and Our Challenges to Regional Issues in Soil Science and Plant Nutrition Research 2. Progress of Internationalization of Soil Science in Japan. Jpn. J. Soil. Sci. Plant Nutr. 2022, 93, 405–410. (In Japanese) [Google Scholar] [CrossRef]
- Norris, C.E.; Mac Bean, G.; Cappellazzi, S.B.; Cope, M.; Greub, K.L.H.; Liptzin, D.; Rieke, E.L.; Tracy, P.W.; Morgan, C.L.S.; Honeycutt, C.W. Introducing the North American Project to Evaluate Soil Health Measurements. Agron. J. 2020, 112, 3195–3215. [Google Scholar] [CrossRef]
- Panagos, P.; Broothaerts, N.; Ballabio, C.; Orgiazzi, A.; De Rosa, D.; Borrelli, P.; Liakos, L.; Vieira, D.; Van Eynde, E.; Arias Navarro, C.; et al. How the EU Soil Observatory Is Providing Solid Science for Healthy Soils. Eur. J. Soil. Sci. 2024, 75, e13507. [Google Scholar] [CrossRef]
- Friedman, D.; Hubbs, M.; Tugel, A.; Seybold, C.; Sucik, M. Guidelines for Soil Quality Assessment in Conservation Planning; Joubert, B., Ed.; United States Department of Agriculture, Natural Resources Conservation Service, Soil Quality Institute: Washington, DC, USA, 2001. [Google Scholar]
- Agriculture and Horticulture Development Board; British Beet Research Organization. Soil Health Scorecard Approach Sampling Protocol and Benchmarking Tables England and Wales Version 1.0; Agriculture and Horticulture Development Board: Coventry, UK, 2022. [Google Scholar]
- Okumura, M.; Mino, K.; Miki, N.; Suzuki, K.; Yamagami, M.; Kitagawa, I. Relationship between α-Glucosidase Activity, Microbial Biomass and Physical Properties in the Volcanic Ash Soils Distributed in the Central Part of Hokkaido. Jpn. J. Soil. Sci. Plant Nutr. 1998, 69, 340–347, (In Japanese with English abstract). [Google Scholar] [CrossRef]
- Higashida, S.; Tamura, H.; Yamagami, M. Microbial Activities in Upland Fields and Factors Relating Them. Bull. Hokkaido Pref. Agr. Exp. Stn. 1996, 70, 17–26, (In Japanese with English abstract). [Google Scholar]
- Department of Agriculture Hokkaido Research Organization. Analytical Methods for Soil and Crop Nutrition Diagnosis; Department of Agriculture Hokkaido Research Organization: Sapporo, Japan, 2012. [Google Scholar]
- Sakaguchi, M.; Sakurai, M.; Nakatsuji, T. Rapid Analysis of Autoclave-Extractable Nitrogen for Assessing Soil Nitrogen Fertility by UV Absorptiometry of L−tryptophan as a Standard Substance. Jpn. J. Soil. Sci. Plant Nutr. 2010, 81, 130–134. (In Japanese) [Google Scholar] [CrossRef]
- Okazaki, T.; Fueki, N.; Koyano, S.; Tanaka, T.; Sato, T.; Ozawa, T.; Ueda, H. Estimation of Soil Autoclaved Nitrogen of Upland and Grassland Soils by Near Infrared Spectroscopy. Jpn. J. Soil. Sci. Plant Nutr. 2020, 91, 228–231. (In Japanese) [Google Scholar] [CrossRef]
- Matsunaga, T.; Moriizumi, M. Methods of Soil Analysis for Available Nitrogen: Past Progress and Future Prospects. Jpn. J. Soil. Sci. Plant Nutr. 2012, 83, 625–629. (In Japanese) [Google Scholar] [CrossRef]
- Nakatsu, S.; Tamura, H. Effects of Thirty Years Continuous Application of Organic Materials (Bark Manure and Crop Residues) on Total Carbon, Total Nitrogen and Physical Characteristics of Upland Field Soil in Light Colored Andosol in Hokkaido. Jpn. J. Soil. Sci. Plant Nutr. 2008, 79, 139–145, (In Japanese with English abstract). [Google Scholar] [CrossRef]
- Nakatsu, S.; Higashida, S.; Yamagami, M. Effects of Continuous Manure Application on Yield and Quality of Upland Crop and Soil in Light Colored Andosol. Jpn. J. Soil. Sci. Plant Nutr. 2000, 71, 97–100. (In Japanese) [Google Scholar] [CrossRef]
- Nakatsu, S.; Tamura, H. Effects of Thirty Years Continuous Application of Organic Matter (Cattle Manure with Bark and Crop Residues) on Yield and Quality of Upland Crops in Light Colored Andosol in Hokkaido. Bull. Hokkaido Pref. Agr. Exp. Stn. 2009, 94, 81–88, (In Japanese with English abstract). [Google Scholar]
- Fueki, N.; Sato, K.; Nakatsu, S. Interpretation of Soil Mineral Nitrogen by Scoring Organic Matter and Nitrogen Management as an “N-Score” in the Fields of Hokkaido before Sugar Beet Planting. Soil. Sci. Plant Nutr. 2010, 56, 750–759. [Google Scholar] [CrossRef][Green Version]
- Tarkalson, D.D.; Bjorneberg, D.L.; Camp, S.; Dean, G.; Elison, D.; Foote, P. Improving Nitrogen Management in Pacific Northwest Sugarbeet Production. J. Sugar Beet Res. 2016, 53, 14–38. [Google Scholar] [CrossRef]
- Ishikura, K. Reduction of Greenhouse Gas Emission by Clean Agriculture. Greentechno Inf. 2023, 19, 12–15. (In Japanese) [Google Scholar]
- Taniguchi, T. The Effect of Manuring Practice on Processing Quality of Potato. Jpn. J. Soil. Sci. Plant Nutr. 1992, 63, 723–727. (In Japanese) [Google Scholar] [CrossRef]
- Vos, J. Nitrogen Responses and Nitrogen Management in Potato. Potato Res. 2009, 52, 305–317. [Google Scholar] [CrossRef]
- Oka, H. Studies on the High Productivity of Potato in the Tokachi District of Hokkaido Part II Relation between the Growth of Potatoes and the Use of Applied Nitrogen under Heavy Application of Phosphoric Acid. Res. Bull. Hokkaido Natl. Agr. Exp. Stn. 1969, 95, 46–52, (In Japanese with English abstract). [Google Scholar]
- Fueki, N.; Otsuka, S.; Tamura, H.; Nakamoto, H.; Watanabe, Y. Nitrogen Fertilization Method for Potato Processing for Chips, Fries, Croquettes and Salads Based on Relationships between Vendible Tuber Yield, Nitrogen Uptake by Potatoes, and Soil Autoclaved Nitrogen. Jpn. J. Soil. Sci. Plant Nutr. 2020, 91, 341–350, (In Japanese with English abstract). [Google Scholar] [CrossRef]
- Ministry of Agriculture Forestry and Fisheries Trends of Production and Distribution of Domestic Wheat. Available online: https://www.maff.go.jp/j/seisan/boueki/mugi_zyukyuu/attach/pdf/index-10.pdf (accessed on 3 December 2023).
- Sato, K.; Nakatsu, S.; Miki, N.; Nakamura, R.; Fueki, N.; Shiga, H. Recommendation of Nitrogen Fertilizer Application for Winter Wheat Based on Using Diagnosis of Soil Nitrate-N in Early Spring in Hokkaido. Jpn. J. Soil. Sci. Plant Nutr. 2008, 79, 45–51, (In Japanese with English abstract). [Google Scholar] [CrossRef]
- Cui, Z.; Zhang, F.; Chen, X.; Dou, Z.; Li, J. In-Season Nitrogen Management Strategy for Winter Wheat: Maximizing Yields, Minimizing Environmental Impact in an over-Fertilization Context. Field Crops Res. 2010, 116, 140–146. [Google Scholar] [CrossRef]
- Rasmussen, I.S.; Dresbøll, D.B.; Thorup-Kristensen, K. Winter Wheat Cultivars and Nitrogen (N) Fertilization-Effects on Root Growth, N Uptake Efficiency and N Use Efficiency. Eur. J. Agron. 2015, 68, 38–49. [Google Scholar] [CrossRef]
- Fueki, N.; Nakamura, R.; Sawaguchi, A.; Watanobe, K.; Suzuki, T.; Uchida, T.; Onodera, M. Effect of Timing of Additional N Fertilization on Spike Number, Grain Yield, Grain Protein and N Use Efficiency of Winter Wheat Cultivar “Kitahonami. ” Bull. Hokkaido Res. Organization Agr. Exp. Stn. 2015, 99, 61–72. [Google Scholar]
- Fueki, N.; Nakamura, R.; Sawaguchi, A.; Watanobe, K.; Suzuki, T.; Uchida, T.; Onodera, M. Prediction of Nitrogen Uptake by Winter Wheat (Triticum Aestivum L.) by Measurement of Superior Stem Number and Leaf Color Value, for Decision-Making Regarding Additional Nitrogen Fertilization. Soil. Sci. Plant Nutr. 2015, 61, 769–774. [Google Scholar] [CrossRef]
- Hayashi, Y.; Hatano, R. Annual Nitrogen Leaching to Subsurface Drainage Water from a Clayey Aquic Soil Cultivated with Onions in Hokkaido, Japan. Soil. Sci. Plant Nutr. 1999, 45, 451–459. [Google Scholar] [CrossRef]
- Hatano, R.; Nagumo, T.; Hata, H.; Kuramochi, K. Impact of Nitrogen Cycling on Stream Water Quality in a Basin Associated with Forest, Grassland, and Animal Husbandry, Hokkaido, Japan. Ecol. Eng. 2005, 24, 509–515. [Google Scholar] [CrossRef]
- Yang, X.; Lu, Y.; Ding, Y.; Yin, X.; Raza, S.; Tong, Y. Optimising Nitrogen Fertilisation: A Key to Improving Nitrogen-Use Efficiency and Minimising Nitrate Leaching Losses in an Intensive Wheat/Maize Rotation (2008–2014). Field Crops Res. 2017, 206, 1–10. [Google Scholar] [CrossRef]
- Nakatsuji, T.; Fueki, N.; Nakatsu, S.; Suzuki, K.; Shiga, H. Validity of a Concept of Permissible Nitrogen Input as an Index for Risk Assessment of Nitrate Pollution in Groundwater. Jpn. J. Soil. Sci. Plant Nutr. 2016, 87, 360–364. (In Japanese) [Google Scholar] [CrossRef]
- Liang, L.; Nagumo, T.; Hatano, R. Nitrogen Flow in the Rural Ecosystem of Mikasa City in Hokkaido, Japan. Pedosphere 2006, 16, 264–272. [Google Scholar] [CrossRef]
- Nagumo, T.; Hatano, R. Regional Characteristics of Stream Water Quality during the Snow-Melting Season in Hokkaido. Jpn. J. Soil. Sci. Plant Nutr. 2001, 72, 41–48, (In Japanese with English abstract). [Google Scholar] [CrossRef]
- Matsumoto, T.; Tou, S. Risk Assessment of Nitrate Pollution in Groundwater Based on the Environmental Nitrogen-Assimilation Capacity of Agricultural Lands in Hokkaido. Jpn. J. Soil. Sci. Plant Nutr. 2006, 77, 17–24, (In Japanese with English abstract). [Google Scholar] [CrossRef]
- Dybowski, D.; Dzierzbicka-Glowacka, L.A.; Pietrzak, S.; Juszkowska, D.; Puszkarczuk, T. Estimation of Nitrogen Leaching Load from Agricultural Fields in the Puck Commune with an Interactive Calculator. PeerJ 2020, 8, e8899. [Google Scholar] [CrossRef]
- Meisinger, J.J.; Delgado, J.A. Principles for Managing Nitrogen Leaching. J. Soil. Water Conserv. 2002, 57, 485–498. [Google Scholar] [CrossRef]
- Calvin, K.; Dasgupta, D.; Krinner, G.; Mukherji, A.; Thorne, P.W.; Trisos, C.; Romero, J.; Aldunce, P.; Barrett, K.; Blanco, G.; et al. Climate Change 2023: Synthesis Report. Contribution of Working Groups I, II and III to the Sixth Assessment Report of the Intergovernmental Panel on Climate Change; Core Writing Team, Lee, H., Romero, J., Eds.; IPCC: Geneva, Switzerland, 2023. [Google Scholar]
- Lal, R. Soil Carbon Sequestration Impacts on Global Climate Change and Food Security. Science 2004, 304, 1623–1627. [Google Scholar] [CrossRef] [PubMed]
- Minasny, B.; Malone, B.P.; McBratney, A.B.; Angers, D.A.; Arrouays, D.; Chambers, A.; Chaplot, V.; Chen, Z.S.; Cheng, K.; Das, B.S.; et al. Soil Carbon 4 per Mille. Geoderma 2017, 292, 59–86. [Google Scholar] [CrossRef]
- Iwasaki, S.; Endo, Y.; Hatano, R. The Effect of Organic Matter Application on Carbon Sequestration and Soil Fertility in Upland Fields of Different Types of Andosols. Soil. Sci. Plant Nutr. 2017, 63, 200–220. [Google Scholar] [CrossRef]
- Van Groenigen, J.W.; Velthof, G.L.; Oenema, O.; Van Groenigen, K.J.; Van Kessel, C. Towards an Agronomic Assessment of N 2 O Emissions: A Case Study for Arable Crops. Eur. J. Soil. Sci. 2010, 61, 903–913. [Google Scholar] [CrossRef]
- Shcherbak, I.; Millar, N.; Robertson, G.P. Global Metaanalysis of the Nonlinear Response of Soil Nitrous Oxide (N2O) Emissions to Fertilizer Nitrogen. Proc. Natl. Acad. Sci. USA 2014, 111, 9199–9204. [Google Scholar] [CrossRef]
- Nagatake, A.; Mukumbuta, I.; Yasuda, K.; Shimizu, M.; Kawai, M.; Hatano, R. Temporal Dynamics of Nitrous Oxide Emission and Nitrate Leaching in Renovated Grassland with Repeated Application of Manure and/or Chemical Fertilizer. Atmosphere 2018, 9, 485. [Google Scholar] [CrossRef]
- Kitamura, R.; Sugiyama, C.; Yasuda, K.; Nagatake, A.; Yuan, Y.; Du, J.; Yamaki, N.; Taira, K.; Kawai, M.; Hatano, R. Effects of Three Types of Organic Fertilizers on Greenhouse Gas Emissions in a Grassland on Andosol in Southern Hokkaido, Japan. Front. Sustain. Food Syst. 2021, 5, 649613. [Google Scholar] [CrossRef]
- Mizuno, N.; Amano, Y.; Mizuno, T.; Nanzyo, M. Changes in the Heavy Mineral Content and Element Concentration of Tarumae-a Tephra with Distance from the Source Volcano. Soil. Sci. Plant Nutr. 2008, 54, 839–845. [Google Scholar] [CrossRef]
- Nakatsu, S.; Nakamoto, H.; Matsumoto, T.; Igarashi, T.; Sugawara, A. Factors Affecting Cadmium Concentration in Lowland Rice in Hokkaido and Countermeasures for the Control of Cadmium Uptake. Jpn. J. Soil. Sci. Plant Nutr. 2010, 81, 514–517. (In Japanese) [Google Scholar]
- Sugikawa, Y.; Goto, E.; Asaka, D. Application Standard of Lime-Treated Sewage Sludge Compost for Paddy Rice in Hokkaido. Jpn. J. Soil. Sci. Plant Nutr. 2009, 80, 530–533. (In Japanese) [Google Scholar] [CrossRef]
- Hara, K.; Suda, T.; Watanobe, K. Evaluation of Sensor-Based Variable Rate Nitrogen Fertilization for Winter Wheat Production. J. Jpn. Soc. Agr. Mach. Food Eng. 2015, 77, 485–493, (In Japanese with English abstract). [Google Scholar] [CrossRef]
- Niwa, K.; Yokobori, J.; Yoneyama, A.; Shinagawa, H. The Monitoring of Soil Information within an Agricultural Field Using Low Altitude Remote Sensing. Water Land. Environ. Eng. 2016, 84, 752–794. (In Japanese) [Google Scholar] [CrossRef]
- Niwa, K.; Seino, N.; Akashi, N.; Kikuchi, K. Drawing of Large-Scaled Soil Map on Volcanic Acid Soil Area in Tokachi District of Hokkaido. Jpn. J. Soil. Sci. Plant Nutr. 2004, 75, 69–78, (In Japanese with English abstract). [Google Scholar] [CrossRef]
- Niwa, K.; Yokobori, J.; Hara, K.; Fueki, N.; Wakabayashi, M. Use of Remote-Sensing Data on Soil Nitrogen Availability and Wheat Growth to Estimate Factors That Affect within-Field Variation in Wheat Growth. Jpn. J. Soil. Sci. Plant Nutr. 2018, 89, 544–551, (In Japanese with English abstract). [Google Scholar] [CrossRef]
- Zhou, P.; Ou, Y.; Yang, W.; Gu, Y.; Kong, Y.; Zhu, Y.; Jin, C.; Hao, S. Variable-Rate Fertilization for Summer Maize Using Combined Proximal Sensing Technology and the Nitrogen Balance Principle. Agriculture 2024, 14, 1180. [Google Scholar] [CrossRef]
- Shahandeh, H.; Wright, A.L.; Hons, F.M. Use of Soil Nitrogen Parameters and Texture for Spatially-Variable Nitrogen Fertilization. Precis. Agric. 2011, 12, 146–163. [Google Scholar] [CrossRef]
- Mirzakhaninafchi, H.; Singh, M.; Bector, V.; Gupta, O.P.; Singh, R. Design and Development of a Variable Rate Applicator for Real-Time Application of Fertilizer. Sustainability 2021, 13, 8694. [Google Scholar] [CrossRef]
- Basso, B.; Fiorentino, C.; Cammarano, D.; Schulthess, U. Variable Rate Nitrogen Fertilizer Response in Wheat Using Remote Sensing. Precis. Agric. 2016, 17, 168–182. [Google Scholar] [CrossRef]
- Guerrero, A.; De Neve, S.; Mouazen, A.M. Data Fusion Approach for Map-Based Variable-Rate Nitrogen Fertilization in Barley and Wheat. Soil. Tillage Res. 2021, 205, 104789. [Google Scholar] [CrossRef]
- Guerrero, A.; De Neve, S.; Mouazen, A.M. Current Sensor Technologies for in Situ and On-Line Measurement of Soil Nitrogen for Variable Rate Fertilization: A Review. Adv. Agron. 2021, 168, 1–38. [Google Scholar] [CrossRef]
- Heiß, A.; Paraforos, D.S.; Sharipov, G.M.; Griepentrog, H.W. Real-Time Control for Multi-Parametric Data Fusion and Dynamic Offset Optimization in Sensor-Based Variable Rate Nitrogen Application. Comput. Electron. Agric. 2022, 196, 106893. [Google Scholar] [CrossRef]
- Kazlauskas, M.; Šarauskis, E.; Lekavičienė, K.; Naujokienė, V.; Romaneckas, K.; Bručienė, I.; Buragienė, S.; Steponavičius, D. The Comparison Analysis of Uniform-and Variable-Rate Fertilizations on Winter Wheat Yield Parameters Using Site-Specific Seeding. Processes 2022, 10, 2717. [Google Scholar] [CrossRef]
- Sanches, G.M.; Faria, H.M.; Otto, R.; Neto, A.S.; Corá, J.E. Using Soil Apparent Electrical Conductivity (ECa) to Assess Responsiveness of Nitrogen Rates and Yield in Brazilian Sugarcane Fields. Agronomy 2025, 15, 606. [Google Scholar] [CrossRef]
- Niwa, K.; Yokobori, J.; Ishikura, K.; Hara, K.; Fueki, N.; Imada, S. The Possibility of Introducing Variable-Rate Nitrogen Application in Uplands of Andosol Areas as Evaluated by Surface Soil and Crop Growth Attributes Estimated from Satellite Images. Jpn. J. Soil. Sci. Plant Nutr. 2021, 92, 249–254, (In Japanese with English abstract). [Google Scholar] [CrossRef]
- Takata, Y.; Yamada, H.; Kanuma, N.; Ise, Y.; Kanda, T. Digital Soil Mapping Using Drone Images and Machine Learning at the Sloping Vegetable Fields in Cool Highland in the Northern Kanto Region, Japan. Soil. Sci. Plant Nutr. 2023, 69, 221–230. [Google Scholar] [CrossRef]
- Morishita, M.; Ishitsuka, N. Mapping of Soil Management Zones by Unsupervised Classification of Drone Aerial Images. Jpn. J. Soil. Sci. Plant Nutr. 2023, 94, 254–262, (In Japanese with English abstract). [Google Scholar] [CrossRef]
- Morishita, M.; Ishitsuka, N. Estimation of Soil Properties Distribution Using UAV Observation and Machine Learning-Application of Data Augmentation to Soil Physicochemical Properties. J. Jpn. Agr. Syst. Soc. 2021, 37, 21–28, (In Japanese with English abstract). [Google Scholar] [CrossRef]
- Morishita, M.; Ishitsuka, N. Estimation of Soil Moisture Distribution in Soybean Field Using UAV-Application of Machine Learning by Data Augmentation of Ground Truth. J. Jpn. Agr. Syst. Soc. 2020, 36, 55–61, (In Japanese with English abstract). [Google Scholar] [CrossRef]
- Ishikura, K.; Fueki, N.; Hara, K.; Niwa, K.; Seshimo, T. Evaluation of Soil Physical Properties in Agricultural Fields Using Satellite Images and Topographic Information I. Poor Water Retention. Jpn. J. Soil. Sci. Plant Nutr. 2024, 95, 11–20, (In Japanese with English abstract). [Google Scholar] [CrossRef]
- Ishikura, K.; Fueki, N.; Hara, K.; Niwa, K.; Seshimo, T. Evaluation of Soil Physical Properties in Agricultural Fields Using Satellite Images and Topographic Information II. Poor Drainage. Jpn. J. Soil. Sci. Plant Nutr. 2024, 95, 21–29. [Google Scholar] [CrossRef]
- Niwa, K.; Yokobori, J.; Imada, S. Estimation of Factors Affecting Sugar Beet Growth in Lowland Soils Based on Satellite Imagery Data from Two Different Years. Jpn. J. Soil. Sci. Plant Nutr. 2025, in press (In Japanese with English abstract). [Google Scholar]
- Ishikura, K.; Fueki, N.; Suda, T.; Sugikawa, Y.; Tou, S. Estimation of Nitrogen Uptake and Tiller Number of Winter Wheat Using a Handheld Optical Sensor in Hokkaido, Japan. Soil. Sci. Plant Nutr. 2020, 66, 828–836. [Google Scholar] [CrossRef]
Disclaimer/Publisher’s Note: The statements, opinions and data contained in all publications are solely those of the individual author(s) and contributor(s) and not of MDPI and/or the editor(s). MDPI and/or the editor(s) disclaim responsibility for any injury to people or property resulting from any ideas, methods, instructions or products referred to in the content. |
© 2025 by the authors. Licensee MDPI, Basel, Switzerland. This article is an open access article distributed under the terms and conditions of the Creative Commons Attribution (CC BY) license (https://creativecommons.org/licenses/by/4.0/).