Abstract
Achieving the twin objectives of increasing economic efficiency and lowering environmental pollution in agricultural modernization requires regions to increase agricultural energy efficiency. This study used the DEA-EBM model, an efficiency evaluation tool, to measure and analyze the agricultural energy efficiency and input redundancy of 30 Chinese regions from 2000 to 2022. It also examined the factors that influence these metrics. According to the findings, China’s agricultural energy efficiency varies greatly by region, with the eastern region performing at its best and the western region performing at a relatively low level. However, this gap is gradually closing. In the meantime, agricultural energy efficiency shows clear spatial correlation, and the energy efficiency of different regions and crop production is influenced by a combination of factors. Moreover, there is a significant degree of land and energy redundancy, and the potential for energy savings exhibits a declining and then rising tendency. In the course of advancing agricultural modernization, this study offers municipalities a valuable reference base upon which to develop unique strategies based on their unique qualities.
1. Introduction
China uses less than 7% of its arable land to feed almost 22% of the world’s population. At the same time, the “unsustainable” issue with China’s agricultural expansion has gained more attention. China suggested early on that “mechanization is the fundamental way out for agriculture”. This high-energy agricultural development model was successful in fostering agricultural economic growth in the early years. However, as society and the economy have changed, petroleum-based agriculture has proven to have numerous drawbacks, and issues like rising costs, environmental contamination, and diminishing land fertility have arisen [1]. As the level of agricultural mechanization increases, it is expected that the amount of agricultural energy inputs will continue to increase [2], and in 2021, China applied roughly 21% of the world’s fertilizer, and 7% of the world’s pesticides [3]. China continues to struggle with the conflict between rapid agricultural expansion and ecological environment protection in the near term. The coercive effect of agricultural development on the ecological environment is generally very harsh.
If China continues to take the old road of “oil agriculture”, it is bound to cause irreversible damage to the rural ecological environment; if it reduces agricultural output, it will affect the safety of the food supply. Therefore, it is crucial to use agricultural energy efficiently in order to increase agricultural economic efficiency and reduce environmental damage. As a result, accurate measurement of agricultural energy efficiency, analysis of input redundancy, energy-saving potential of China’s agricultural development, and comprehensive study of factors affecting agricultural energy efficiency are crucial for agricultural modernization and sustainable development.
Scholars, both domestically and internationally, have undertaken a wealth of research in the realm of energy efficiency. Wang Qingyi [4] and ShiDan [5] classified energy efficiency into two types of indicators: energy–economic efficiency and energy–technical efficiency. Energy–technical efficiency is the ratio of energy inputs to energy outputs when energy is used as a raw material and then processed and converted to create another form of energy. Energy–economic efficiency is the ratio of energy inputs to final production results when energy is used as fuel and power. Using annual net generation as the target output, Toshiyuki et al. [6] assessed the energy–technical efficiency of coal-fired power plants covered by the U.S. Clean Air Act (CAA). Even though this indication is more resilient to price correlations and swings, it can still create two or more outputs from numerous inputs, and it can be challenging to add up different outputs [7]. Thus, the metrics of energy–economic efficiency are the main emphasis of this work. In this study, energy efficiency refers to energy–economic efficiency, unless otherwise noted.
The approaches to gauge energy efficiency can generally be categorized into two groups [8]: single-factor indicators and multi-factor indicators. Single-factor energy efficiency is calculated by directly comparing outputs with energy inputs; the production volume is used to measure outputs. This method is commonly used for government decision-making but has some obvious drawbacks. On the one hand, it fails to reflect energy technology efficiency in the calculations [9]. On the flip side, it excessively emphasizes energy input while neglecting the substitution effects among other production factors. Hu and Wang [10] introduced the concept of multi-factor energy efficiency, considering the capacity to substitute and combine various inputs in the production process. This effectively addresses the limitations of single-factor energy efficiency indicators. Currently, scholars generally adopt methods to measure multi-factor energy efficiency, focusing on national and regional levels or specific sectors such as agriculture [11] and industry. Widely employed measurement techniques encompass non-parametric Data Envelopment Analysis (DEA), parametric Stochastic Frontier Analysis (SFA), and models utilizing slack variables (EBM).
As environmental issues resulting from energy utilization increasingly become a focus, scholars have begun incorporating environmental pollution into efficiency measurement frameworks. In terms of carbon emissions from agricultural energy consumption, Shi Changliang [12], Li Guozhi, and Li Zongshi [13] comprehensively estimated the CO2 emissions from agricultural energy consumption in several Chinese provinces and discovered that the emissions’ magnitude has been gradually rising over time. In terms of assessing the efficiency of agricultural CO2 emissions and its influencing factors, taking into account the problem of agricultural carbon emissions, Li et al. [14] used the EBM model to assess China’s agricultural energy efficiency from 1995 to 2018 and came to the conclusion that the regional differences in agricultural energy efficiency are steadily widening. By building the ML function, Liu Qitao [15] assessed the agricultural carbon emission efficiency of every province in China between 2000 and 2013. He discovered that there is a significant disparity in the efficiency levels of various provinces, and that technological advancement, industrial structure, and economic level, among other factors, have a significant influence on its change.
In addition, sustainable agricultural development needs to focus on energy inputs. Domestic researchers have carried out fewer studies on agricultural energy inputs and efficiency, and the majority of them directly use the primary industry energy terminal consumption data expressed in the regional energy balance sheet to conduct analyses. Only Niu Liangyun et al. [16] and Li Nan [17] have incorporated fertilizers, pesticides, and other indirect energy sources into the accounting system of agricultural energy inputs in their studies. Scholars primarily use the advanced level of international energy efficiency as a benchmark when analyzing China’s potential for energy efficiency, and they use international comparisons to assess China’s energy efficiency and potential for energy savings. However, international comparisons of energy efficiency only offer a target value for China’s energy efficiency improvement, and we are unable to calculate the potential energy savings that China may have [5]. In 2014, Lin Boqiang [18] evaluated the energy-saving potential of industrial energy component allocation from 2000 to 2009 using a stochastic frontier production function model based on panel data from 37 sectors in China’s industrial sector. However, agricultural research is lacking.
In the research on factors influencing agricultural energy efficiency, scholars generally believe that industrial agglomeration, industrial structure, urbanization, per capita income, energy consumption structure, technological progress, and energy prices can affect energy efficiency. In 2014, Wu et al. [19] concentrated on the industrial agglomeration in 30 provinces in China spanning from 2000 to 2016. His findings indicated that industrial agglomeration could enhance the enhancement of agricultural energy efficiency. Liu et al. [20] scrutinized the outcomes of agricultural energy efficiency across major continents and suggested that economic structure, urbanization, and per capita income act as impediments to agricultural energy efficiency. According to Zhou Hui et al. [21] and Ran Qi-Ying et al. [22], agricultural energy efficiency is influenced by the rise in rural income, advancements in agricultural technology, and the growth in the proportion of agricultural output value. But, without taking geographical considerations into account, the majority of the aforementioned studies used panel regression models or Tobit models. Indeed, there is a clear spatial correlation in agricultural expansion because of the spatial mobility of agricultural factors of production and the spread of technology [23].
Investigating energy efficiency in the agricultural sector is instrumental in advancing the shift toward agricultural modernization and serves as a crucial reference for attaining sustainable agricultural development. Therefore, there is an urgent need to strengthen research in this field. However, the existing literature rarely incorporates non-expected outputs, such as carbon dioxide, into output indicators during calculations [22]. Moreover, there is still a relative lack of research on the calculation of energy efficiency in the production of different crops. In addition, geographical spatial factors can significantly affect agricultural development [24]. The use of ordinary regression models may introduce considerable bias, potentially affecting the accuracy of conclusions. Therefore, there is a need for more comprehensive and accurate methods to conduct research in this area.
In light of the aforementioned, this essay attempts to respond to the following queries. Initially: What are China’s agricultural energy efficiency levels by province and region? What is the energy efficiency of China’s primary crops—soybeans, corn, and wheat? What are the variations in efficiency between regions and provinces? Second: How much of China’s labor, land, capital, and energy are redundant? Specifically, how much energy may be saved by using energy redundancy? Third: Are China’s various areas spatially correlated? Considering geography, what are the elements influencing agricultural energy efficiency?
2. Analysis of Energy Efficiency in Agriculture
This study concentrates on the agricultural domain, utilizing panel data encompassing 30 provinces (municipalities, autonomous regions) in China from 2000 to 2022. The EBM model is deployed to evaluate the energy efficiency of both the overall agricultural sector, input redundancies, and energy-saving potentials, as well as the specific energy efficiencies of wheat, corn, and soybean production. The research delves into their developmental trajectories and regional disparities, examining influencing factors to achieve a more nuanced comprehension of China’s agricultural energy efficiency.
2.1. Connotation and Measurement of Energy Efficiency in Agriculture
The DEA model employs linear programming to assess the efficiency of homogeneous decision-making units without the need for preset weights, which is widely used in the study of energy efficiency, but the traditional DEA model cannot solve the bias caused by slack variables on efficiency measurement well and also cannot incorporate the non-expected outputs into the measurement framework. Tone [25] set the slack variables in the objective function and proposed the SBM model in 2004, which can effectively make up for the lack of error caused by slack variables and also incorporate the non-expected outputs into the whole framework. The specific formula can be found in Equation :
In the above equation, i represents the number of input variables; denotes the input of the evaluated object; denotes the desired output of the evaluated object; denotes the non-expected output of the evaluated object; , and are the slack variables; is the weighting variable; and denotes the optimal efficiency. When , it means that the current production is valid; when < 1, it suggests that there is potential for enhancement in the existing inputs and outputs. Avkiran and Rowlands [26] mentioned in 2008 that the non-radial SBM model considers slack variables, but there are still shortcomings. Due to the inclusion of non-desired outputs in the model, there is a radial relationship between resources, energy consumption, and non-desired outputs, which are indivisible, while there is a non-radial relationship between inputs and outputs, such as capital, land, etc., which are indeed divisible. Thus, SBM does not deal with the situation when variables are characterized by both radial and non-radial features. On this basis, Tone and Tsutsui [27] introduced the EBM model in 2010, a hybrid model incorporating both radial and non-radial functions, thereby addressing the limitations of conventional DEA and SBM models. The EBM model, incorporating non-expected output can be found in Equation :
Here, and are radial partial planning parameters; , and denote the parameters linking radial and non-radial relaxation conditions; and , and denote the weights of the ith input, the rth desired output, and the kth non-desired output, respectively. The rest of the variables and the interpretation of the efficiency values are consistent with the SBM model.
Based on the total factor productivity framework, in 2006, Hu and Wang [10] defined the total factor energy efficiency index by using the DEA method and calculated the energy efficiency through the ratio of “optimal energy input” and “actual energy input” on the frontier curve, and this paper is based on their ideas to establish a model for measuring agricultural energy efficiency. The model is as follows:
where i stands for ith province (city or autonomous region); t for time; EE for energy efficiency; AEI for actual energy inputs; LEI for lost energy inputs (i.e., the amount of energy improvement or redundancy in energy inputs); and TEI for target energy inputs (i.e., the ideal number of energy inputs needed to reach a specific level of outputs when production technology is at its current level).
On this basis, input redundancy studies can be conducted as Equation :
where the input redundancy ratio is denoted by . At the same time, the energy-saving potential of agriculture can be analyzed based on the redundancy of energy inputs, which is currently agreed in most of the literature on China’s energy saving potential as reflecting the gap between the actual energy consumption and the target energy consumption. In this paper, based on the theory of total factor energy efficiency, the energy saving potential is measured and analyzed by the redundancy results of energy efficiency measurement.
In addition to addressing the problem of slack variables, the SBM and EBM models incorporate carbon emissions from undesired outputs into the framework for measuring efficiency. In contrast to the SBM model, the EBM model takes into account scenarios where variables exhibit both radial and non-radial characteristics, thereby avoiding result biases. Consequently, considering that agricultural energy efficiency is closely linked to carbon emissions, the EBM model is chosen to evaluate agricultural energy efficiency in China, along with the energy efficiency of wheat, corn, and soybean production regions.
It should be noted that, the panel data of 30 regions from 2000 to 2022 used in this study demonstrate that, from a time span perspective, the direction of the evolution of agricultural production technology in each region shows a certain degree of convergence in the long-term development, despite the notable differences in the level of agricultural development among regions [28]. At the same time, a certain level of uniformity in agricultural production technology has been achieved in some regions as a result of China’s extensive implementation of a number of national technical promotion and policy support initiatives in the agricultural sector. Furthermore, while regional variations exist in the magnitude of factor inputs, the inputs of agricultural production (land, labor, capital, and energy) share similarities in terms of technology use and production factor aims, fulfilling the homogeneity premise of DEA model.
2.2. Description of Indicators for Measuring Energy Efficiency in Agriculture
Based on existing and relevant studies on energy efficiency [29,30] and data availability, this study utilizes panel data spanning the years 2000 to 2022 from 30 provinces (municipalities and autonomous regions) in China, drawing insights from previous scholarly work. Input factors considered in the analysis include labor, energy, capital, and land. Desired outputs encompass the total output value of agriculture, forestry, animal husbandry, and fishery, while non-desired outputs consist of total agricultural CO2 emissions. All indicators are standardized, with the reference year being 2000. Specific indicators are shown in Table 1.

Table 1.
Input–output indicator system for energy efficiency in agriculture.
The following parameters were specified:
- (1)
- Input variables
Labor Input: The measurement of labor input indicators in this study is based on the employment figures in the primary sector.
Energy Input: This paper classifies energy input into two categories—direct energy input and indirect energy input [31]. As there are insufficient data available on the direct energy consumption in agriculture for individual provinces, this study tackles the challenge of the unavailability of specific data on direct energy consumption in agriculture for each province by introducing a standardization process for major agricultural energy sources across diverse regions. The principal direct energy inputs in Chinese agricultural production encompass coal, diesel, gasoline, and electricity, with their conversion rates based on the proportion of energy input in the primary industry within each province. Beyond these direct inputs, agriculture involves additional indirect energy inputs like agricultural films, fertilizers, pesticides, etc. For the purposes of this study, the consumption of agricultural films, pesticides, and fertilizers in each province from 2000 to 2022 has been converted into standard coal consumption, serving as an indicator for indirect energy input. The General Principles for the Comprehensive Calculation of Energy Consumption, Oak Ridge National Laboratory and the Intergovernmental Panel on Climate Change (IPCC) are the sources of coal conversion factors.
The calculation can be found in Equation :
where denotes total converted agricultural energy consumption and represents the physical volume of agricultural energy consumption in category i. denotes the discounted standard coal coefficient for agricultural energy in category i. The conversion factors are shown Table A1.
Capital Inputs: The correlation between agricultural machinery and agricultural capital is relatively weak [32]. Using agricultural machinery input or fixed agricultural capital as the stock of agricultural capital may not accurately reflect the actual level of capital stock in each region [33]. Therefore, this paper adopts the perpetual inventory method to estimate the stock of agricultural capital. The basic formula can be found in Equation :
Upon deformation, the above equation can be found in Equation :
where and denote the agricultural capital stock in period t and period t – 1. This paper follows the approach of Hall and Jones [34], where represents the capital depreciation rate, with a value of 5.42% [33]. represents the agricultural capital investment in the t-th period, following the practice of Li et al. [33] and Xu et al. [35], using the formation of fixed agricultural capital as the indicator. denotes depreciation in period. The calculation of agricultural capital depreciation is conducted using the ratio of investment in agricultural fixed assets, the proportion of depreciation of agricultural fixed assets to total social fixed asset investment, and a depreciation rate of 5.42%. The results obtained from these methods show minimal differences [33]. Therefore, this study employs the amount of depreciation of agricultural fixed assets as an indicator of agricultural capital depreciation. The calculation method involves multiplying the ratio of investment in agricultural fixed assets by the total depreciation of all fixed assets in society.
Land Inputs: Drawing on scholarly research, this paper uses the area sown to crops to measure land inputs.
- (2)
- Desired output
In this study, the constant-price gross output value of agriculture, forestry, livestock, and fisheries for the base year of 2000 are used as the target output. Additionally, the production of wheat, maize, and soybeans for the current year is considered as the desired output. Additionally, the desired output for wheat, corn, and soybeans is the total production for the year, which is expressed as the product of the yield of the main product per acre and the area sown.
- (3)
- Undesired outputs
This paper draws on the research of Li [17] and selects the agricultural energy carbon dioxide emissions as the undesired output indicator.
This paper selects 30 provinces (municipalities and autonomous regions) across the country. When calculating the energy efficiency of wheat, corn, and soybean production, the main producing provinces of each crop are chosen as the study scope, including 14 provinces for wheat production, 20 provinces for corn production, and 11 provinces for soybean production. The specific regions are listed in Table A2 in Appendix A.
The primary data sources for the computation include the China Statistical Yearbook, China Rural Statistical Yearbook, China Energy Statistical Yearbook, regional statistical yearbooks, and National Compendium of Agricultural Product Cost and Benefit Information. The energy input coefficients in terms of standard coal are based on the General Rules for Calculating Comprehensive Energy Consumption. To calculate undesired outputs, this study adopts the methodology of the IPCC, while the carbon emission coefficients are referenced from the General Rules for Calculating Comprehensive Energy Consumption, the Intergovernmental Panel on Climate Change (IPCC) and data provided by the Oak Ridge National Laboratory of the United States.
2.3. Analysis of Overall National Agricultural Energy Efficiency
The agricultural energy efficiency values in different years for various regions are presented in Table 2. High-efficiency regions such as Beijing, Shanghai, Fujian, Hainan, and Sichuan consistently maintain high levels of agricultural energy efficiency in multiple years. Some regions, such as Anhui, Guizhou, and Tianjin, show significant annual fluctuations, possibly influenced by local natural disasters and other factors. Relatively inefficient regions, including Shanxi, Qinghai, and Ningxia, indicate a need for enhanced management and improvement in agricultural energy utilization.

Table 2.
Energy efficiency values and averages by region for major years.
Figure 1 illustrates the variations in agricultural energy efficiency nationwide and in the four primary regions from 2000 to 2022. In the figure, energy efficiency in the east and northeast regions consistently hovers around 0.85 and 0.7, respectively, exhibiting a stable overall change trend. Conversely, the central regions experience more pronounced fluctuations, and the northeastern region demonstrates a fluctuating decline. The three major regions, excluding the eastern region, contribute to dragging down the national average, necessitating proactive adjustments in the structure of agricultural production inputs to enhance current energy utilization practices.
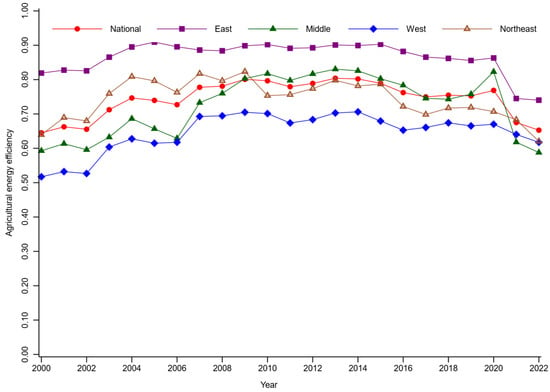
Figure 1.
Changes in agricultural energy efficiency at the national level and in the four regions, 2000–2022.
Figure 2 uses Shanxi and Fujian as examples to illustrate the disparities between high-efficiency and low-efficiency regions. Figure 2 illustrates that, while Shanxi Province’s efficiency value was below 0.5 from 2000 to 2009 and has since improved, it only varies up and down by 0.5. In contrast, Fujian Province’s agricultural energy efficiency has been maintained at a high level for a long time, reaching 1. Three viewpoints are used to further investigate the causes of the discrepancies: geography, crop choice, and policy requirements. First, Shanxi has a dry environment with significant land desertification, whereas Fujian has a warm, humid climate, with mountains and hills making up 80% of the province’s territory, and abundant water resources. Second, when it comes to crop selection, Shanxi is dominated by traditional grain crops like maize and wheat and lags behind in terms of machinery levels, whereas Fujian is dominated by tropical fruits like lychee and longan, tea, and other high-value crops; it also encourages facility-based agriculture and three-dimensional planting patterns and improves energy efficiency through precision irrigation and biological control. Last but not least, in terms of policy support, Shanxi is dominated by a coal economy, agricultural policies have long been marginalized, and agricultural mechanization subsidies are not widely available, whereas Fujian improves energy efficiency through eco-subsidy and carbon-constraint policies.
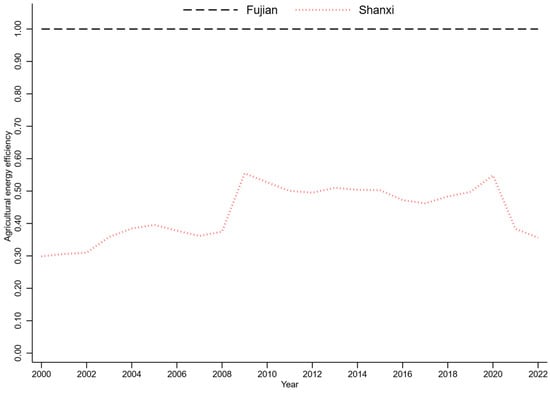
Figure 2.
Comparison of agricultural energy efficiency values in Fujian and Shanxi, 2000–2022.
2.4. Analysis of Agricultural Input Redundancy
The input redundancy ratio can be calculated according to Equation (see Table A3 for specific data). Land has the largest redundancy ratio, reaching 20.79%. Moreover, China’s agriculture is comparatively more efficient in the distribution of manpower and capital resources, as seen by the lower labor redundancy ratio and capital redundancy ratio, which stand at 6.09% and 3.19%, respectively.
As shown in Figure 3, although the degree of redundancy varies widely, the rankings of redundancy rates in China’s east, center, west, and northeast is consistent with the overall ranking. Notably, the labor redundancy rate is relatively low at 6.09% on average for China. Especially in the northeast, the labor redundancy rate is close to zero. From a technical point of view, this is mainly due to the high level of agricultural mechanization in the northeast. The high level of mechanization reduces the reliance on traditional labor, making it possible to accurately match labor inputs with actual demand, thus avoiding labor redundancy. From the management level, the intensive agricultural production model implemented in the northeast has optimized the efficiency of resource allocation. Even in the face of declining population and tight supply of agricultural labor, it has been able to efficiently integrate resources and maintain the labor redundancy rate at a level close to zero.
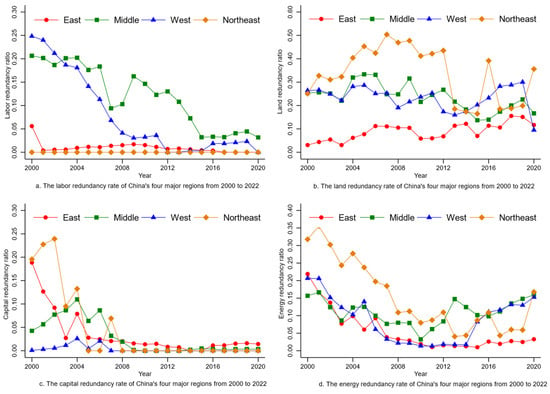
Figure 3.
The labor, land, capital, and energy redundancy rates of China’s four major regions from 2000 to 2022.
The central region exhibits the lowest capital redundancy rate (0.32%), attributed to an improved investment climate, industrial diversification, and efficient resource allocation. The eastern area has the lowest land redundancy rate (9.88%) because of its highly developed economy, cutting-edge agricultural technology, and management strategies that optimize the use of land for agricultural production. The northeast and western areas exhibit higher rates of energy redundancy. Despite having a high degree of technological agricultural mechanization and a high intensity of agricultural energy inputs, the northeast region has the highest energy redundancy rate (14.95%). This may be due to the large scale of agricultural production in the northeast, where diseconomies of scale lead to discrepancies between energy inputs and outputs.
The high level of energy redundancy in the western region stems from the limitations imposed by its natural conditions and the difficulty of implementing agricultural technologies. The western region is dominated by mountains and plateaus, with rich climate types, resulting in small plots of land and scattered farmland, making it difficult to apply large-scale agricultural machinery and equipment, and farmers are forced to rely on small machinery to repeat farming many times, with a significant increase in energy consumption per unit area; in addition, the western region is ecologically fragile, with weak infrastructure, and the cost and difficulty of utilizing high-tech methods results in the low level of agricultural technology and the high level of energy consumption of agriculture.
In Figure 4, according to the average input redundancy for each province, the agricultural energy efficiency is higher and the redundancy of labor, land, capital, and energy inputs is lower in Fujian, Hubei, Hainan, and Shaanxi Provinces than the national average. Natural limitations, technical lags, and the necessity for ecological protection all contribute to Shaanxi Province’s low agricultural energy efficiency and low input redundancy. Shaanxi Province’s vast north–south expanse, stark natural condition variations, and inadequate infrastructure compel agriculture to embrace a conservative approach of “low inputs and low redundancy”. At the same time, Shaanxi Province is responsible for ecological barrier functions including protecting Qinling Mountain and conserving the soil and water of the Yellow River. Agricultural policies must balance ecology and productivity, which further limits the use of high-energy technologies. Consequently, despite the low level of agricultural inputs, efficiency is limited by the infrastructure and degree of technology application. Beijing, Hebei, Shanxi, Zhejiang, Jiangxi, Shandong, Hunan, and Guangxi provinces have only one input redundancy higher than the national average, and their agricultural energy efficiency is high. Despite high agricultural energy efficiency in provinces such as Anhui, Henan, Gansu, and Xinjiang, the agricultural structure still needs to be adjusted to reduce redundancy rates. These provinces have an average redundancy rate of 0 percent for some inputs, but there is still a need to further balance the efficiency of the use of different inputs in order to achieve higher quality development.
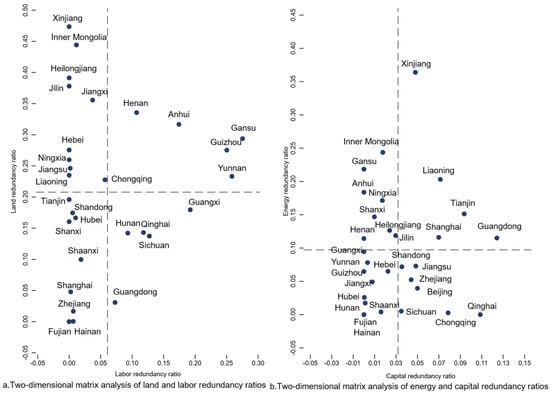
Figure 4.
Average input redundancy of agricultural inputs in 30 provinces of China from 2000 to 2022.
Generally speaking, in terms of labor inputs, we should take a cue from the northeast region’s experience, aggressively advance technological agriculture mechanization, and apply intense management while bolstering skill development to increase labor efficiency. Regarding land input, it is necessary to enhance the degree of land conservation and intense usage, implement creative land-saving models, optimize land use structure, and clarify land use planning. In terms of capital investment, the agricultural investment environment should be optimized, social capital investment should be directed, industrial policies should be strengthened, and financial support should be reinforced. For energy input redundancy, energy management practices should be strengthened to avoid energy redundancy due to diseconomies of scale while expanding production.
2.5. Analysis of Agricultural Energy-Saving Potential
One essential strategic resource for economic growth is energy. China’s fast economic expansion since it’s economic reform and opening up has increased the demand for energy, but excessive use has resulted in progressively severe shortages and environmental issues. Thus, scientific evaluation of energy-saving potential is especially crucial.
The energy-saving potential of China’s agriculture between 2000 and 2022 is depicted in Figure 5. From 2000 to 2022, China’s agricultural sector’s capacity to save energy exhibits a trend of initially declining and then rising. The first phase of China’s agricultural modernization process is the years 2000–2003. The state increased policy support for agricultural mechanization and energy-saving potential decreased from 20.37 million tons to 11.62 million tons, a decrease of 43%; this is related to the technological increase in the level of agricultural mechanization and the initial improvement in the management of efficiency of energy use. Energy-saving potential rose to 16.39 million tons in 2003–2005, probably due to the expansion of agriculture at the management level and the increase in energy demand, which led to the intensification of the phenomenon of energy waste. In 2005–2010 there was a decline, and in 2010, out of all the years between 2000 and 2022, China’s energy-saving potential reached the lowest value, at 3.81 million tons, mainly because, during this period, the country introduced a series of policies to support agricultural mechanization, energy saving, and emission reduction, causing agricultural science and technology innovation to speed up the gradual promotion of energy-saving technologies such as high-efficiency irrigation, precision fertilizer application, etc. Between 2010 and 2020, the energy-saving potential rose overall, reflecting the accelerated process of agricultural modernization and increased energy consumption, but the energy-saving potential was still not exploited as fully as it could have been.
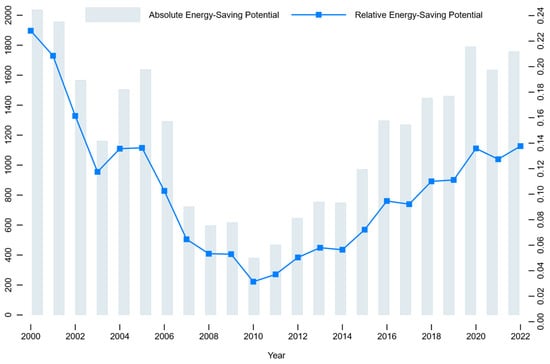
Figure 5.
Energy-saving potential of China’s agriculture from 2000 to 2022.
China’s agricultural energy use and potential for energy savings vary significantly by province in Figure 6. The wide discrepancies between the targeted and actual energy consumption in the provinces of Xinjiang, Inner Mongolia, Henan, and Anhui—all of which surpass 900,000 tons—indicate that there is a significant amount of energy waste in agricultural output in these areas. Large agricultural provinces or resource-intensive areas with extensive agricultural production make up the majority of these provinces; nevertheless, poor energy management or inadequate use of technology results in low energy utilization efficiency. In contrast, the provinces of Fujian, Hainan, and Qinghai, on the other hand, have the lowest actual energy consumption in the nation, with an energy-saving potential of 0, which may be due to their smaller agricultural production scales, better climates, or widespread use of energy-saving technologies.
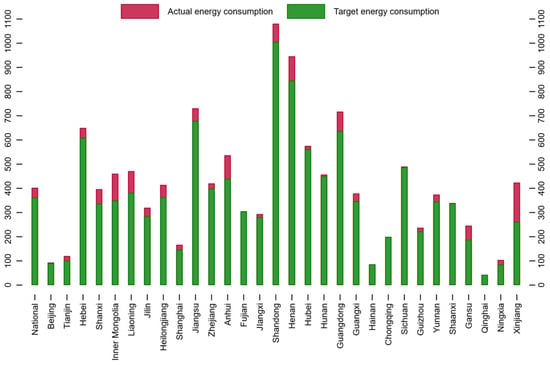
Figure 6.
Average actual energy consumption and optimal energy consumption of agriculture in each province and municipality from 2000 to 2022.
From a national perspective, the average energy consumption in China is 4.03 million tons, the average target energy consumption is 3.62 million tons, and the average energy-saving potential is 400,000 tons. Eleven provinces have energy-saving potential that is higher than the national average, suggesting that there is still some energy waste in China’s agriculture overall.
2.6. Analysis of Energy Efficiency in Wheat, Corn, and Soybean Production
The energy efficiency values of wheat production in the main years for wheat-producing regions are presented in Figure 7. Eastern provinces such as Hebei and Shandong exhibit relatively high energy efficiency in wheat production in most years, showing a trend of small fluctuations; the central province of Henan has maintained a high level in most years. Western provinces like Shaanxi also demonstrate relatively stable energy efficiency in wheat production. In contrast, Hubei, Ningxia, and Xinjiang show significant fluctuations, with energy efficiency values varying between different years. These findings indicate variations in the energy utilization dynamics of wheat production across different regions, potentially shaped by factors like climate, technology, and policies. A thorough examination of the factors driving changes in wheat production energy efficiency within these provinces will aid in formulating more precise strategies and resource management plans for wheat agriculture.
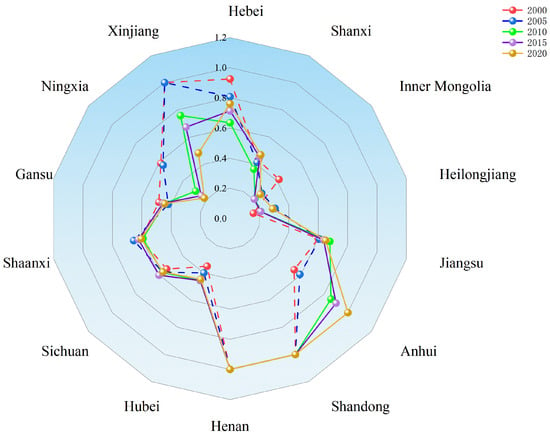
Figure 7.
The changes in agricultural energy efficiency in each province within main wheat producing areas in key years.
In Figure 8, the energy efficiency values of corn production in key years in corn-producing regions are presented. Eastern provinces such as Hebei and Shandong show a relatively stable trend. Meanwhile, western provinces such as Inner Mongolia, Guizhou, Ningxia, Xinjiang, and those in the northeast, including Jilin and Heilongjiang, also demonstrate relatively stable production energy efficiency with high average levels. In contrast, central provinces such as Hubei and western provinces such as Guangxi show significant fluctuations in corn production energy efficiency, probably affected by different factors such as climatic conditions, technological levels, and management practices.
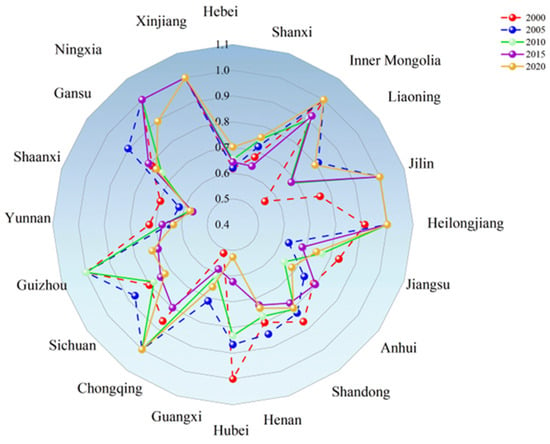
Figure 8.
The changes in agricultural energy efficiency in each province within main corn producing areas in key years.
Figure 9 illustrates the energy efficiency metrics for soybean production in regions specializing in soybean cultivation. Areas like Shandong, Jilin, and Heilongjiang exhibit comparatively high energy efficiency, boasting mean values surpassing 0.9. In contrast, Inner Shanxi and Shaanxi have lower efficiency values. Shanxi and Shaanxi experienced significant fluctuations in energy efficiency values, mainly due to their relatively stable inputs, but the significant fluctuations in output caused by changes in planting areas affected the performance of efficiency values.
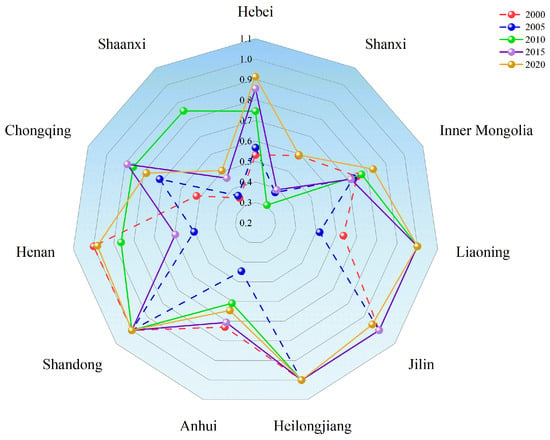
Figure 9.
The changes in agricultural energy efficiency in each province within main soybean producing areas in key years.
Overall, both maize and soybeans have an average agricultural energy efficiency of 0.75, but wheat has a slightly lower average of 0.59. While energy efficiency has usually increased in areas that produce corn and soybeans between 2000 and 2022, energy efficiency in wheat shows a fluctuating decline, which may be related to changes in machinery inputs in wheat production. Figure 10 plots the ratio of machinery inputs for wheat in 2000–2022; the ratio of machinery inputs is denoted by machinery input costs/(labor input costs + machinery input costs), and a larger value of the ratio, means that more machinery is used. It is obvious from Figure 10 that the proportion of machinery inputs for wheat remained relatively stable from 2000 to 2005, while it increased year by year between 2005 and 2010, reaching a peak of 0.38 in 2008, and then gradually declined and basically stabilized at about 0.30. This trend of increasing and then decreasing before stabilizing may be one of the reasons for the fluctuating decline in the energy efficiency value of wheat.
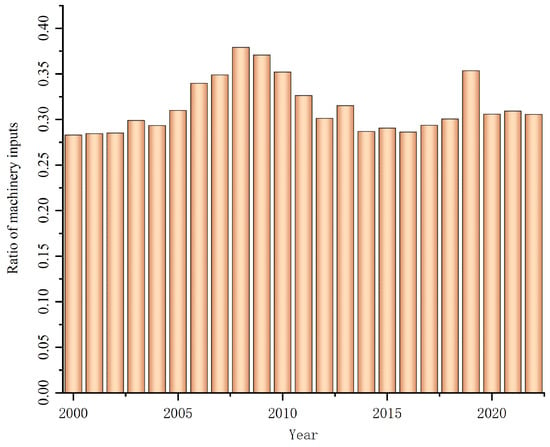
Figure 10.
The changes in the machinery input ratio of wheat production across China, 2000–2022.
2.7. Analysis of Regional Differences in Agricultural Energy Efficiency
The Thiel index is a commonly used metric to assess regional imbalances because of its capacity to break down both intra- and inter-regional inequalities [36]. This study examines intra- and inter-regional disparities in agricultural energy efficiency across China’s four main regions by employing the Thiel index. The Thiel index and decomposition formula can be found in Equation (8):
In Equation , and denote the within-region variance Theil index and the between-region variance Theil index, respectively. indicates the number of provinces in one of the four regions, N represents the total count of provinces within the country, denotes the average agricultural energy efficiency in the region, denotes the energy efficiency of province i in the region, and denotes national average agricultural energy efficiency.
Figure 11 demonstrates the differences in agricultural energy efficiency in China. First of all, from the total disparities, there are more obvious fluctuations in the overall differences among the four regions. However, looking at the overall trend, the Theil index decreased from 0.051 in 2000 to 0.028 in 2022, showing a trend of narrowing the overall gap. Based on the breakdown findings, the tendency of within-region Theil index is the same as that of overall index. The Theil index for inter-regional differences in the four major regions decreased from 0.020 in 2000 to 0.005 in 2022, and the inter-regional differences continued to shrink.
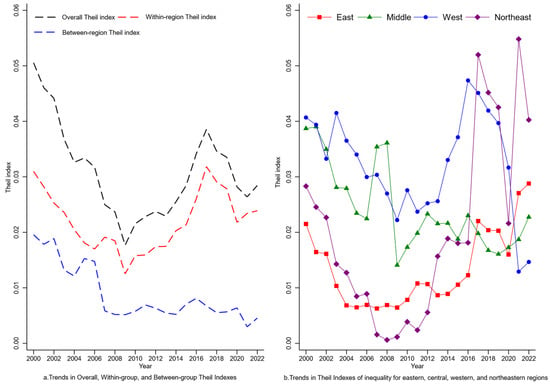
Figure 11.
The Thiel index of agricultural energy efficiency in China, 2000–2022.
Specifically, between 2000 and 2009, the Thiel index decreased from 0.051 to 0.018, indicating a further narrowing of the overall disparity. This is mostly because Central Document No. 1 has been focusing on the “Three Rural Issues” since 2004 and the agricultural tax was completely abolished in 2006, the policy of agricultural production subsidies that followed helped to reduce the regional development gap and effectively stimulate the input of agricultural factors in different regions. The central government’s 2012 proposal to speed up agricultural science and technology innovation and increase the level of agricultural modernization may have contributed to the fluctuating upward trend in the difference between 2009 and 2016; the uneven development of the level of mechanization in different regions due to natural endowments and the challenge of implementing technology has widened the gap. From 2016 to 2022, China’s agricultural development is significantly influenced by the country’s emphasis on greening, particularly with the implementation of the Three-Year Action Plan for Winning the Battle for the Blue Sky in 2018 and the goal of “Carbon Peak and Carbon Neutrality” in 2021; environmental protection policies were tightened, which resulted in the formation of synergistic development of various regions in the application of green technology, ecological compensation mechanisms, etc., and narrowed the gap overall. In 2020, the gap was reduced overall. The years 2021 and 2022 will see the Thiel index drop below 0.030.
In this context, the variations among provinces in the eastern region are the least pronounced, potentially attributed to its comparatively advanced development, elevated technological standards, and more equitable agricultural energy efficiency. The variations among provinces in the western region are the most pronounced. This is mostly caused by the unequal distribution of resources and economic development in the western region; arid regions in the northwest, like Gansu, are limited by nature and have poor infrastructure, while Sichuan has better agricultural conditions and higher energy efficiency. However, between 2000 and 2022, the western region’s agricultural energy efficiency gap shrank the fastest, from 0.041 to 0.015. Strong national policies that have recently encouraged agricultural development in the western region have led to a steady optimization of the agrarian structure. Therefore, to address variations among major regions, enhancing communication in terms of factors and technology, boosting support for less efficient regions, and aiding them in enhancing agricultural energy efficiency are imperative to mitigate overall disparities.
3. Analysis of Influencing Factors of Agricultural Energy Efficiency in China
Evaluating the influencing factors of agricultural energy efficiency helps us understand why there are temporal and spatial differences in agricultural energy efficiency. Given the spatial correlation of agricultural energy efficiency, we use spatial models to evaluate the influencing factors.
3.1. Spatial Autocorrelation Analysis of Agricultural Energy Efficiency in China
Everything exhibits a certain degree of correlation, and this correlation is inversely proportional to the distance; the closer the distance, the stronger the correlation [37]. This paper employs the Moran index to examine the spatial correlation of China’s agricultural development. Moran’s index can be divided into global Moran’s index and local Moran’s index. The formula for the global Moran index can be found in Equation :
The formula for the local Moran’s index, which expresses the spatial correlation of different regions, can be found in Equation :
In the above equation, n denotes the number of provinces, denotes the agricultural energy efficiency index for province I, denotes the agricultural energy efficiency index in province j, is the national average of energy efficiency, and represents the spatial distance weighting matrix of neighboring areas in province i and province j. This matrix is the inverse of the geographic distance between provinces in terms of latitude and longitude.
3.1.1. Global Autocorrelation
The global Moran index calculated according to the above formula is shown in Figure 12, and it is consistently positive across all years, except for 2021, where significance tests were conducted for the remaining years. This indicates that there is a significant spatial autocorrelation in agricultural energy efficiency in China. Moreover, the Moran’s I index of agricultural energy efficiency showed considerable fluctuation between 2000 and 2022; changes in policy direction and the broad adoption of agricultural technologies may cause regionally autocorrelated swings in agricultural energy efficiency.
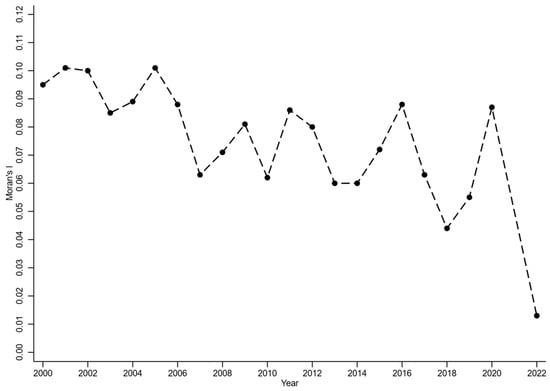
Figure 12.
Global Moran index, 2000–2022.
3.1.2. Local Autocorrelation
A local autocorrelation test can depict the efficiency differences among specific regions. Due to spatial limitations, this article presents the spatial distribution tables of the local Moran index for 2005, 2010, 2015, and 2020, as shown in Figure 13.
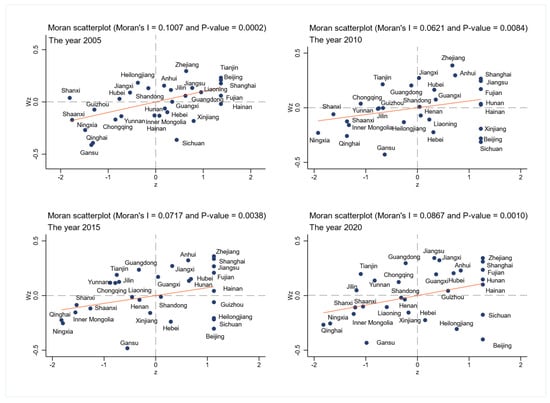
Figure 13.
Localized Moran index distribution.
H-H Regions: Predominantly in China’s eastern coastal areas, characterized by favorable natural conditions, strong economic foundations, and advanced technology. Frequent factor exchanges stimulate economic development, contributing to improved agricultural energy efficiency.
L-L Regions: Mainly in the northern and northeastern parts of the country, reflecting a reliance on a primitive agricultural model and suboptimal factor inputs.
H-L and L-H Regions: Found in the central and southwestern regions, indicating significant differences in agricultural energy efficiency between neighboring areas. The possible reasons for this are that regions with high energy efficiency have a limited driving effect on neighboring low-efficiency regions, or that low-efficiency regions are unable to receive radiation from high-efficiency regions, resulting in slow efficiency growth.
3.2. Analysis of Factors Affecting Energy Efficiency in Agriculture
Provincial agricultural energy efficiency may exhibit correlation, influenced by factor mobility among regions. The efficiency of a province is likely influenced by its neighboring provinces, highlighting the significance of considering spatial interactions in the model.
Spatial econometric models serve as essential tools for analyzing spatial data, primarily encompassing three categories: the Spatial Error Model (SEM), the Spatial Lag Model (SAR), and the Spatial Durbin Model (SDM). This paper considers the possible spatial correlation between the variables and decides on the use of the Spatial Durbin model proposed by [38] to analyze the combination of the two. The formula can be found in Equation :
is the spatial geographic distance weight matrix; and denote agricultural energy efficiency in provinces i and j; and denote factors affecting agricultural energy efficiency in provinces i and j; is a spatial coefficient reflecting the spatial interaction of agricultural energy efficiency; denotes the coefficient of the degree of influence of neighboring provinces’ influencing factors on the province’s energy efficiency; and , and denote individual effects, time effects, and residuals, respectively.
As shown in Table 3, following the model selection procedure, the initial determination is whether to opt for a fixed-effects model or a random-effects model. Based on the results of the Hausman test, the fixed-effects model is chosen. Furthermore, according to the preliminary Likelihood Ratio (LR) test outcomes, this study ultimately selects a two-way fixed-effects model for subsequent analysis.

Table 3.
Tests for the Spatial Durbin Model.
Subsequently, the Spatial Durbin Model (SDM) can degenerate into both the Spatial Error Model (SEM) and the Spatial Lag Model (SAR), necessitating additional LR tests. The results of the LR tests indicate that the SDM rejects degeneration into both the SAR and SEM, thus validating the appropriateness of employing the SDM for estimation.
3.2.1. Description of Indicators of Factors Affecting Energy Efficiency in Agriculture
Regarding the analysis of factors affecting energy efficiency in agriculture, the indicators selected in this paper are shown in Table 4.

Table 4.
Factors influencing agricultural energy efficiency in China.
These variables and their relevance are explained in further detail below:
- (1)
- Farmers’ income levels: Farmers’ incomes will affect the economic behavior of farmers, higher income will help farmers to improve production facilities, rational allocation of inputs of production materials [39].
- (2)
- Agricultural production structure: The agricultural sector includes planting, animal husbandry, fisheries, and forestry, and there are more obvious differences in production methods and factor allocation between industries and their development has different energy requirements. Hence, this study opts to utilize the configuration of animal husbandry and the internal composition of cultivation as indicators reflecting the makeup of agricultural production.
- (3)
- Rural human capital level: Regions with higher human capital levels are inclined to integrate advanced technologies into agricultural production, resulting in enhanced efficiency in both production processes and the utilization of agricultural energy. This study employs the average years of education for the rural labor force as an indicator [40].
- (4)
- Financial support for agriculture: Government funding can assist farmers in improving production equipment, optimizing agricultural production conditions, and thereby enhancing overall agricultural energy efficiency [41,42].
- (5)
- Degree of agricultural price incentives: If the gap between the price of agricultural products and the price of means of production is too large, it will greatly affect the rationality of the allocation of resources by farmers, resulting in the reduction in agricultural energy efficiency. However, farmers will also adjust their input structure in accordance with price changes, optimizing production to enhance agricultural energy efficiency.
- (6)
- Degree of agricultural agglomeration: This paper utilizes the entropy of agricultural location in each province as an indicator of the degree of agricultural industry agglomeration. The specific formula can be found in Equation (12).
denotes the degree of agricultural industry agglomeration in province i, denotes the gross value of agricultural production in province i, denotes the gross regional product of province i, denotes gross national agricultural output, and Q denotes gross national product.
- (7)
- Machinery input ratio: Machinery costs incurred during crop cultivation also affect agricultural energy efficiency, so this paper employs the ratio of machinery input costs to labor input and machinery input costs as measures for the machinery input ratio.
- (8)
- Meteorological disasters: Climate change directly impacts agricultural output. To mitigate the effects of meteorological disasters, farmers often increase the use of agricultural machinery and other production means. This paper draws on the work of Wu et al. [43], utilizing the ratio of the affected crop area to the total sown area as an indicator of meteorological disasters.
The data required for the calculations are primarily sourced from publications such as the China Statistical Yearbook, China Rural Statistical Yearbook, China Energy Statistical Yearbook, various regional statistical yearbooks, and the Compilation of National Agricultural Cost and Income Data.
3.2.2. Analysis of Factors Affecting Overall Agricultural Energy Efficiency in China
Previously, the spatial correlation of China’s agricultural energy efficiency was examined, revealing a correlation among the agricultural energy efficiency of each province. The Spatial Durbin model is employed to analyze and decompose the influencing factors affecting China’s overall agricultural energy efficiency, as well as the energy efficiency of wheat-producing, corn-producing, and soybean-producing areas. Specific results are shown in Table 5.

Table 5.
Decomposition of spatial effects of factors affecting agricultural energy efficiency in China.
In Table 5, rho is −0.435 and significant at the 5% level, suggesting a notable spillover effect on agricultural energy efficiency in China. The improvement in agricultural energy efficiency within a province is not solely determined by the economic activities within that province but is also influenced by the economic advancements in neighboring regions.
The positive and significant direct, indirect, and overall effects of farmers’ income levels on agricultural energy efficiency from 2000 to 2022 show that an increase in farmers’ incomes directly affected agricultural energy efficiency, allowing them to invest in more sophisticated agricultural equipment and technologies, which increased productivity and decreased energy waste. At the same time, the increase in farmers’ incomes also fueled the diffusion of technologies and improvements in production methods in nearby areas, resulting in positive external effects that further increased the region’s overall agricultural energy efficiency.
Both directly and indirectly, the internal organization of the plantation has a major detrimental influence on agricultural energy efficiency. This indicates that alterations to plantation layout typically lead to a reduction in agricultural energy efficiency. An increase in the area under food crops may lead to standardization of agricultural production methods and wasteful energy consumption, ultimately reducing energy efficiency in agriculture.
Although the direct effect is notably negative, the indirect effect is significantly positive. This means that, even though the growth of the livestock industry may result in higher energy consumption in the short term, an increase in the sector’s share of output value eventually encourages technological innovation and agricultural production diversification, which in turn improves energy utilization efficiency. Additionally, technological advancements and production method optimization within the livestock sector have created spillover effects that facilitate transformation and improvements in energy efficiency in other agricultural sectors.
Improving rural human capital plays a crucial role in improving overall agricultural energy efficiency. The overall impact of rural human capital on agricultural energy efficiency has been significantly positive, but the direct effect has been notably negative, while the indirect effect has been significantly positive. While improving rural education may not result in immediate improvements in agricultural energy efficiency—and may even cause labor to move to other industries—in the long run, increased education indirectly contributes to better agricultural energy efficiency through the spread of knowledge, improvements in agricultural technology, and the optimization of industrial structure.
Rural human capital levels have a significantly beneficial overall impact on agricultural energy efficiency, although the direct influence is notably negative and the indirect effect is significantly positive. These phenomena can be explained by the fact that improving rural education may not have an immediate positive influence on agricultural energy efficiency in the short term and may even have the opposite effect by redistributing labor to other industries. However, when educated rural populations move across regions, they not only bring management experience and cutting-edge technology to other provinces, but they also encourage the sharing and exchange of resources, information, and technology, which speeds up the spatial diffusion of technological innovations and indirectly improves agricultural energy efficiency. In addition, farmers’ ability for creativity and receptivity is greatly increased by education. This encourages interregional innovation exchanges and technological cooperation by making it simpler for them to adopt new technologies and refine them via practice. Lastly, education improves production, minimizes resource waste, and maximizes resource allocation. Therefore, over time, agricultural energy efficiency is greatly increased by rural human capital levels.
While the direct effect is significantly negative, the total and indirect effects of agricultural agglomeration on agricultural energy efficiency are negligible, indicating that an increase in agricultural agglomeration may result in a short-term decrease in energy efficiency. By increasing the share of agricultural output in some regions, agricultural agglomeration may lead to excessive concentration of resources and intensification of production methods in these regions, increasing energy consumption; though agglomeration may result in scale effects, intensive production patterns are typically accompanied by higher energy consumption, resulting in limited improvements in agricultural energy efficiency.
Financial support for agriculture has a significantly favorable direct effect and a significantly negative indirect effect, but overall, the effect on agricultural energy efficiency is not significant. This implies that while increasing agricultural funding can directly encourage the improvement of agricultural energy efficiency, in certain places or regions, the use of financial incentives might not have produced the desired outcomes, resulting in a decrease in energy efficiency. Unfair funding distribution or the inability of certain inputs to be successfully converted into energy efficiency gains could be the cause of negative indirect effects.
The impact of the level of agricultural price incentives on agricultural energy efficiency primarily occurs indirectly. Increased pricing incentives can boost farmers’ incentive to produce, encourage better resource allocation and agricultural production process optimization, and ultimately improve energy efficiency. The non-significant direct effect might be the result of the incentives’ delayed implementation; farmers may need some time to modify their production patterns and implement energy-saving technologies after accepting the price signals.
The positive total effect of meteorological hazards on agricultural energy efficiency may be due to the fact that these events force agricultural producers to take additional coping mechanisms to deal with unstable climatic conditions, such as investing more in agricultural infrastructure, changing the cropping structure, or adopting more efficient energy technologies.
3.2.3. Analysis of Factors Affecting Energy Efficiency in Wheat, Corn, and Soybean Production
The spatial effects influencing the energy efficiency of wheat, corn, and soybean production are shown in Table 6. While the level of agricultural price incentives may cause farmers to over-rely on energy-intensive production methods, which would hinder wheat energy efficiency, the efficiency of maize is negatively impacted by livestock structure, which reflects the resource-intensive nature of the livestock sector, which raises the energy demand for maize production.

Table 6.
Spatial decomposition of factors influencing energy efficiency in wheat, corn, and soybean production.
In terms of direct effects, the optimization of farmers’ income levels and agricultural cropping structure significantly increased wheat energy efficiency because farmers had more money to spend on efficient agricultural techniques and equipment, and cropping structure adjustments helped to improve land use and reduce energy consumption.
In terms of indirect effects, while the positive impact of livestock structure on wheat and maize suggests that it contributes to resource recycling, the positive impact of agricultural support on maize and soybeans suggests that it contributes to the upgrading of agricultural technologies and facilities, and the negative impact on wheat may be due to the failure of financial support to promote the transformation of efficient production patterns. The level of farmers’ income promotes soybean energy efficiency by improving production technology, and the structure of agricultural cultivation and the level of rural human capital also enhance the energy efficiency of corn and soybean by optimizing resource allocation and technology application.
4. Conclusions and Policy Implications
Considering the existence of undesired outputs, this study adopts the EBM model to measure the overall agricultural energy efficiency, the redundancy of various inputs, and the potential for energy saving in China from 2000 to 2022. It also analyzes the energy efficiency of wheat, corn, and soybean production, and explores the spatial effects in depth, leading to the following key conclusions.
Firstly, China’s agricultural energy efficiency varies significantly both within and between regions. The eastern and northeastern regions’ energy efficiencies exhibit a more constant trend, staying at roughly 0.85 and 0.7, respectively. Notably, the eastern region’s energy efficiency ratings are continuously higher than the national average. The central region, on the other hand, has more noticeable variations in agricultural energy efficiency. Throughout the observed years, there was a fluctuating trend in both within-region differences and between-region energy efficiency which showed convergence. In addition, the energy efficiency of major crops such as wheat, corn, and soybeans varies greatly in the production process, with the average value of energy efficiency of corn and soybeans being 0.75, while that of wheat is only 0.59.
Secondly, China has the largest land redundancy rate at 20.79%, and lower labor and capital redundancy rates at 6.09% and 3.19%, respectively. In the meantime, there are notable regional differences in China’s redundancy levels, with the east having the lowest land redundancy rate, the center having the lowest capital redundancy rate, and the northeast having the lowest rate of labor redundancy. In terms of energy redundancy, with an average energy-saving potential of 400,000 tons between 2000 and 2022, China’s agriculture as a whole has a tendency of first declining and then increasing.
Lastly, spatial correlation is seen in China’s agricultural energy efficiency. In particular, the eastern and surrounding regions have higher energy efficiency, whereas the northern and northeastern regions have poorer energy efficiency. Additionally, it is interesting that China’s agricultural energy efficiency has a regional spillover effect, with various causes affecting different regions and production areas. Farmers’ income wealth, the level of rural human capital, and the level of incentives for agricultural prices are favorable for improving agricultural energy efficiency, while the internal structure of the plantation is unfavorable for improving energy efficiency.
Finally, the article offers the following suggestions in light of the aforementioned findings.
Firstly, in order to promote regional development, regional policies must be tailored to local circumstances. Through innovation in agricultural technology, the east, an area with high agricultural energy efficiency, might advance green agriculture. Given the low level of mechanization in the west, land preparation and infrastructural development should be prioritized. Specifically, the west can rely on the terrain to strengthen the construction of water conservancy infrastructure, such as farmland construction, low-pressure irrigation and other infrastructure, and at the same time should strengthen the transportation and communication and other modern facilities to continue to improve and reduce the difficulty of agricultural technology implementation. However, in areas such as Gansu and Shaanxi, where the Yellow River Basin and the Qinling Mountains are mainly protected by ecological functions, a balance between protection and development should still be struck, and ecological agriculture should be actively developed.
Secondly, to maximize the movement and distribution of agricultural production factors, cross-regional collaboration and exchanges have to be encouraged. China should investigate the creation of a regional coordinating structure, fully utilize local governments’ administrative authority, and remove institutional obstacles that prevent the movement of labor, science, technology, and other production inputs across regional borders. Technical and management extension services ought to be offered in the eastern and northeastern regions. Provinces should actively develop and introduce professional and technical abilities, improve close collaboration in agricultural production, and learn from adjacent provinces about effective management practices and cutting-edge technology.
Thirdly, the internal structure of the plantation sector will impede the expansion of agricultural energy efficiency, while farmers’ income, education, and price incentives for agricultural products would encourage it. By offering market-based price incentives and enhancing price support for agricultural products, provinces should boost agricultural education and training, enhance farmers’ technical literacy, environmental awareness, and management abilities, increase their income levels, and motivate them to boost production. At the same time, it is critical to concentrate on reforming the planting business, accounting for energy use as scale increases, and avoiding “diseconomies of scale” that would reduce energy efficiency. For major crops such as wheat, corn, and soybeans, differentiated policies should be adopted, focusing on improving the agricultural energy efficiency and mechanization level of wheat, improving the financial support for soybeans and corn, and increasing the planting scale of wheat and corn, so as to improve the agricultural energy efficiency of China’s major agricultural products.
The limitation of this study is that only carbon emission is used as a non-desired output indicator, and other factors of agricultural surface pollution, such as soil pollution, are not included. Meanwhile, although the provinces showed some technological homogeneity in terms of factor inputs and policy objectives, the results of the study revealed significant differences among the provinces. Future studies could further categorize the provinces through cluster analysis and calculate their agricultural energy efficiency separately or adopt a multi-stage DEA approach to enhance the rigor and accuracy of the findings.
Author Contributions
Conceptualization, T.W. and T.J.; methodology, T.W. and W.L.; software, T.J. and W.L.; validation, J.W. and J.L.; formal analysis, T.W., T.J. and W.L.; investigation, T.W. and J.W.; resources, T.W.; data curation, T.W. and W.L.; writing—original draft preparation, T.W. and T.J.; writing—review and editing, W.L. and J.W.; visualization, T.J. and W.L.; supervision, T.W. and J.L.; project administration, T.W.; funding acquisition, T.W. All authors have read and agreed to the published version of the manuscript.
Funding
This research was funded by the National Natural Science Foundation of China, grant numbers 72173046 and 72174113.
Institutional Review Board Statement
No ethics-related information.
Informed Consent Statement
This study is based on publicly available data and does not involve direct interaction with human participants. Therefore, informed consent is not applicable.
Data Availability Statement
The datasets are available from the corresponding author on reasonable request.
Conflicts of Interest
The authors declare no conflicts of interest.
Appendix A

Table A1.
Agricultural energy conversion factors for standard coal [1].
Table A1.
Agricultural energy conversion factors for standard coal [1].
| Direct Energy Category | Discount Factor for Standard Coal | Indirect Energy Category | Discount Factor for Standard Coal |
|---|---|---|---|
| Raw coal | 0.7143 kgce/kg | Fertilizers | 0.8956 kgce/kg |
| Diesel fuel | 1.4571 kgce/kg | Agrochemical | 5.18 kgce/kg |
| Diesel | 1.4714 kgce/kg | Agro-film | 4.9341 kgce/kg |
| Electrical power | 0.1229 kgce/kw·h |
Note [1]: The discounted standard coal coefficients for the direct energy category are derived from the General Rules for Calculating Comprehensive Energy Consumption (GB/T2589-2008) [44], and the discounted standard coal coefficients for the indirect energy category are derived from the Oak Ridge National Laboratory of the U.S.A. and Intergovernmental Panel on Climate Change (IPCC).

Table A2.
Study region.
Table A2.
Study region.
| Study Region | Specific Provinces |
|---|---|
| Nationwide (30 provinces) | Beijing, Tianjin, Hebei, Shanxi, Inner Mongolia, Liaoning, Jilin, Heilongjiang, Shanghai, Jiangsu, Zhejiang, Anhui, Fujian, Jiangxi, Shandong, Henan, Hubei, Hunan, Guangdong, Guangxi, Hainan, Chongqing, Sichuan, Guizhou, Yunnan, Shaanxi, Gansu, Qinghai, Ningxia, Xinjiang |
| Wheat production region (14 provinces) | Hebei, Shanxi, Inner Mongolia, Heilongjiang, Jiangsu, Anhui, Shandong, Henan, Hubei, Sichuan, Shaanxi, Gansu, Ningxia, Xinjiang |
| Corn production region (20 provinces) | Hebei, Shanxi, Inner Mongolia, Liaoning, Jilin, Heilongjiang, Jiangsu, Anhui, Shandong, Henan, Hubei, Guangxi, Chongqing, Sichuan, Guizhou, Yunnan, Shaanxi, Gansu, Ningxia, Xinjiang |
| Soybean production region (11 provinces) | Hebei, Shanxi, Inner Mongolia, Liaoning, Jilin, Heilongjiang, Anhui, Shandong, Henan, Chongqing, Shaanxi |

Table A3.
Analysis of input redundancy in agricultural energy efficiency of China’s four major regions.
Table A3.
Analysis of input redundancy in agricultural energy efficiency of China’s four major regions.
| Region. | Slack Ratio (%) | 2000 | 2002 | 2004 | 2006 | 2008 | 2010 | 2012 | 2014 | 2016 | 2018 | 2020 | 2022 | Average |
|---|---|---|---|---|---|---|---|---|---|---|---|---|---|---|
| National | Labor | 14.40 | 11.26 | 11.34 | 9.35 | 5.10 | 6.53 | 5.01 | 2.94 | 1.71 | 1.91 | 1.17 | 4.23 | 6.09 |
| Land | 18.12 | 19.11 | 23.45 | 25.15 | 21.11 | 18.72 | 19.90 | 15.98 | 17.47 | 20.17 | 15.46 | 34.2 | 20.79 | |
| Capital | 9.82 | 8.40 | 8.50 | 4.40 | 1.38 | 0.46 | 0.28 | 0.08 | 0.49 | 0.63 | 0.60 | 7.99 | 3.19 | |
| Energy | 20.34 | 15.19 | 12.63 | 9.95 | 5.55 | 2.89 | 5.05 | 5.77 | 7.78 | 9.08 | 11.68 | 15.38 | 9.72 | |
| East | Labor | 5.59 | 0.54 | 0.94 | 1.09 | 1.52 | 1.53 | 0.70 | 0.62 | 0.36 | 0.00 | 0.00 | 0.00 | 0.95 |
| Land | 3.09 | 5.46 | 6.18 | 11.20 | 10.53 | 5.86 | 6.81 | 12.18 | 11.37 | 15.54 | 11.66 | 20.82 | 9.88 | |
| Capital | 18.86 | 9.19 | 7.88 | 2.47 | 2.02 | 1.37 | 0.83 | 0.00 | 1.13 | 1.52 | 1.44 | 19.06 | 4.88 | |
| Energy | 21.88 | 13.73 | 9.87 | 9.27 | 3.27 | 1.89 | 1.54 | 1.27 | 2.61 | 2.74 | 3.28 | 20.62 | 6.84 | |
| Middle | Labor | 24.82 | 21.17 | 18.07 | 11.30 | 4.11 | 3.25 | 0.00 | 0.35 | 1.88 | 2.07 | 0.00 | 0.00 | 7.03 |
| Land | 26.40 | 24.90 | 28.14 | 25.13 | 19.07 | 23.65 | 17.35 | 17.42 | 23.25 | 28.81 | 9.52 | 38.20 | 24.62 | |
| Capital | 0.08 | 0.56 | 2.60 | 2.07 | 0.00 | 0.00 | 0.00 | 0.00 | 0.00 | 0.00 | 0.00 | 0.14 | 0.32 | |
| Energy | 20.64 | 15.18 | 10.28 | 6.10 | 2.19 | 1.37 | 1.85 | 1.73 | 11.06 | 13.17 | 15.29 | 9.11 | 8.95 | |
| West | Labor | 20.64 | 18.67 | 20.22 | 18.35 | 10.30 | 14.64 | 13.01 | 7.27 | 3.32 | 4.07 | 3.18 | 11.54 | 11.90 |
| Land | 25.37 | 25.11 | 31.97 | 33.14 | 24.79 | 21.58 | 26.74 | 18.28 | 13.95 | 20.04 | 16.65 | 41.23 | 25.16 | |
| Capital | 4.26 | 7.73 | 10.98 | 8.63 | 1.92 | 0.00 | 0.00 | 0.21 | 0.32 | 0.33 | 0.33 | 4.38 | 2.95 | |
| Energy | 15.67 | 12.43 | 12.31 | 9.99 | 7.99 | 3.24 | 8.36 | 12.45 | 9.84 | 13.46 | 15.96 | 14.53 | 11.34 | |
| North east | Labor | 0.00 | 0.00 | 0.00 | 0.00 | 0.00 | 0.00 | 0.00 | 0.00 | 0.00 | 0.00 | 0.00 | 0.00 | 0.00 |
| Land | 25.10 | 31.06 | 40.41 | 42.43 | 46.95 | 41.19 | 43.51 | 17.37 | 39.16 | 18.78 | 35.61 | 45.03 | 33.48 | |
| Capital | 19.56 | 23.92 | 13.25 | 0.00 | 0.00 | 0.00 | 0.00 | 0.00 | 0.00 | 0.00 | 0.00 | 0.00 | 4.17 | |
| Energy | 31.77 | 30.23 | 27.72 | 19.72 | 10.90 | 7.98 | 10.95 | 4.36 | 10.92 | 6.02 | 16.76 | 13.62 | 14.95 |
References
- Wu, X. Petroleum Agriculture and Ecological Agriculture. Dev. Res. 2004, 6, 32–34. [Google Scholar]
- Guo, X.; Zhu, L.; Fan, Y. Evaluation of potential reductions in carbon emissions in Chinese provinces based on environmental DEA. Energy Policy 2011, 39, 2352–2360. [Google Scholar] [CrossRef]
- FAOSTAT. Emissions from Energy Use in Agriculture. Available online: https://www.fao.org/faostat/zh/#data/GN (accessed on 1 January 2023).
- Wang, Q. China’s Energy Efficiency and International Comparisons (Part I). Energy Conserv. Environ. Prot. 2003, 8, 5–7. [Google Scholar]
- Shi, D. Regional Differences in China’s Energy Efficiency and Analysis of Energy-Saving Potential. China Ind. Econ. 2006, 10, 49–58. [Google Scholar]
- Sueyoshi, T.; Goto, M.; Ueno, T. Performance analysis of US coal-fired power plants by measuring three DEA efficiencies. Energy Policy 2010, 38, 1675–1688. [Google Scholar] [CrossRef]
- Wei, C.; Shen, M. Energy Efficiency and Energy Productivity: A Provincial Data Comparison Based on DEA Method. J. Quant. Tech. Econ. 2007, 9, 110–121. [Google Scholar]
- Fei, R.; Lin, B. Energy efficiency and production technology heterogeneity in China’s agricultural sector: A meta-frontier approach. Technol. Forecast. Soc. Chang. 2016, 109, 25–34. [Google Scholar] [CrossRef]
- Wilson, B.; Trieu, L.H.; Bowen, B. Energy efficiency trends in Australia. Energy Policy 1994, 22, 287–295. [Google Scholar] [CrossRef]
- Hu, J.-L.; Wang, S.-C. Total-factor energy efficiency of regions in China. Energy Policy 2006, 34, 3206–3217. [Google Scholar] [CrossRef]
- Yang, Z.; Wang, D.; Du, T.; Zhang, A.; Zhou, Y. Total-Factor Energy Efficiency in China’s Agricultural Sector: Trends, Disparities and Potentials. Energies 2018, 11, 853. [Google Scholar] [CrossRef]
- Shi, C.; Guo, Y.; Zhan, P. Driving Factors and Decoupling Effects of Carbon Emissions from Agricultural Energy Consumption in China. Forum Sci. Technol. China 2017, 1, 136–143. [Google Scholar]
- Li, G.; Li, Z. Empirical Decomposition of Carbon Emission Factors in China’s Agricultural Energy Consumption: Based on LMDI Model. J. Agrotech. Econ. 2010, 10, 66–72. [Google Scholar]
- Li, H.; Luo, L.; Zhang, X.; Zhang, J. Dynamic change of agricultural energy efficiency and its influencing factors in China. Chin. J. Popul. Resour. Environ. 2021, 19, 311–320. [Google Scholar] [CrossRef]
- Liu, Q. Regional Differences in Agricultural Carbon Emission Efficiency in China: An Empirical Analysis Based on Malmquist-Luenberger Index. Jiangsu Agric. Sci. 2015, 43, 497–501. [Google Scholar]
- Niu, L.; Hou, B.; Wu, L. Grey Relational Entropy-Based Study on the Relationship Between Agricultural Energy Input and Grain Output in China. Financ. Trade Res. 2012, 23, 45–53. [Google Scholar]
- Li, N. Study on China’s Agricultural Energy Consumption and Greenhouse Gas Emissions. Doctoral Dissertation, Dalian University of Technology, Dalian, China, 2014. [Google Scholar]
- Sun, C.; Lin, B. Research on Energy Factor Allocation Efficiency and Energy-Saving Potential in China’s Industrial Sector. J. Quant. Tech. Econ. 2014, 31, 86–99. [Google Scholar]
- Wu, J.; Ge, Z.; Han, S.; Xing, L.; Zhu, M.; Zhang, J.; Liu, J. Impacts of agricultural industrial agglomeration on China’s agricultural energy efficiency: A spatial econometrics analysis. J. Clean. Prod. 2020, 260, 121011. [Google Scholar] [CrossRef]
- Liu, J.; Liu, S.; Cui, J.; Kang, X.; Lin, Q.; Osathanunkul, R.; Dong, C. Total-Factor Energy Efficiency and Its Driving Factors in China’s Agricultural Sector: An Empirical Analysis of the Regional Differences. Agronomy 2023, 13, 2332. [Google Scholar] [CrossRef]
- Zhou, H.; Ran, Q.; Wang, H. Analysis of China’s Agricultural Total-Factor Energy Efficiency and Its Influencing Factors. Ecol. Econ. 2016, 32, 133–138. [Google Scholar]
- Ran, Q.; Zhou, H. Research on Agricultural Total Factor Energy Efficiency under Environmental Constraints: Based on SBM—TOBIT Model. Econ. Probl. 2017, 1, 103–109. [Google Scholar]
- Shi, H. Spatial Dependence and Distribution Dynamics of Agricultural Productivity Across Chinese Provinces. Resour. Sci. 2010, 32, 1323–1332. [Google Scholar]
- Liu, Y.; Ouyang, Y.; Cai, H. Measurement and Spatiotemporal Evolution Characteristics of China’s Agricultural Green Total-Factor Productivity. J. Quant. Tech. Econ. 2021, 38, 39–56. [Google Scholar]
- Tone, K. Dealing with undesirable outputs in DEA: A slacks-based measure (SBM) approach. Present. NAPW III Tor. 2004, 25, 44–45. Available online: https://www.researchgate.net/publication/284047010 (accessed on 1 June 2022).
- Avkiran, N.K.; Rowlands, T. How to better identify the true managerial performance: State of the art using DEA. Omega-Int. J. Manag. Sci. 2008, 36, 317–324. [Google Scholar] [CrossRef]
- Tone, K.; Tsutsui, M. An epsilon-based measure of efficiency in DEA–a third pole of technical efficiency. Eur. J. Oper. Res. 2010, 207, 1554–1563. [Google Scholar] [CrossRef]
- Zheng, X.S.; Xu, R.M. Measurement and regional differences of total factor agricultural energy efficiency in China under carbon emission constraints. J. Yunnan Agric. Univ. 2022, 16, 134–142. [Google Scholar]
- Ge, P.; Wang, S.; Huang, X. Measurement for China’s agricultural green TFP. Chin. J. Popul. Resour. Environ. 2018, 28, 66–74. [Google Scholar] [CrossRef]
- Singh, P.; Singh, G.; Sodhi, G.P.S. Energy and carbon footprints of wheat establishment following different rice residue management strategies vis-à-vis conventional tillage coupled with rice residue burning in north-western India. Energy 2020, 200, 117554. [Google Scholar] [CrossRef]
- Tian, Y.; Zhang, J.; Li, B. Agricultural carbon emissions in China: Calculation, spatial-temporal comparison and decoupling effects. Resour. Sci. 2012, 34, 2097–2105. [Google Scholar]
- Butzer, R.; Mundlak, Y.; Larson, D.F. Measures of fixed capital in agriculture. In Productivity Growth in Agriculture: An International Perspective; CABI Wallingford UK: Wallingford, UK, 2012; pp. 313–334. [Google Scholar] [CrossRef]
- Li, G.; Fan, L.; Feng, Z. Capital Accumulation, Institutional Change and Agricultural Growth: An Empirical Estimation of China’s Agricultural Growth and Capital Stock from 1978 to 2011. Manag. Sci. 2014, 18, 67–79. [Google Scholar] [CrossRef]
- Hall, R.E.; Jones, C.I. Why do some countries produce so much more output per worker than others? Q. J. Econ. 1999, 114, 83–116. [Google Scholar] [CrossRef]
- Xu, X.; Zhou, J.; Shu, Y. Estimates of fixed capital stock by sector and region: 1978–2002. Stat. Res. 2007, 24, 6–13. [Google Scholar] [CrossRef]
- Tian, Q.; Zhao, T.; Yuan, R. An overview of the inequality in China’s carbon intensity 1997–2016: A Theil index decomposition analysis. Clean Technol. Environ. Policy 2021, 23, 1581–1601. [Google Scholar] [CrossRef]
- Tobler, W.R. A Computer Movie Simulating Urban Growth in the Detroit Region. Econ. Geogr. 1970, 46 (Suppl. S1), 234–240. [Google Scholar] [CrossRef]
- LeSage, J.P.; Pace, R.K. Spatial econometric models. In Handbook of Applied Spatial Analysis: Software Tools, Methods and Applications; Springer: Berlin/Heidelberg, Germany, 2009; pp. 355–376. [Google Scholar]
- Jianxu, L.; Heng, W.; Sanzidur, R.; Songsak, S. Energy Efficiency, Energy Conservation and Determinants in the Agricultural Sector in Emerging Economies. Agriculture 2021, 11, 80773. [Google Scholar] [CrossRef]
- Gao, F. Evolution trend and internal mechanism of regional total factor productivity in Chinese agriculture. J. Quant. Tech. Econ. 2015, 32, 3–19. [Google Scholar]
- Guo, L.; Guo, S.; Tang, M.; Su, M.; Li, H. Financial Support for Agriculture, Chemical Fertilizer Use, and Carbon Emissions from Agricultural Production in China. Int. J. Environ. Res. Public Health 2022, 19, 7155. [Google Scholar] [CrossRef]
- Ragasa, C.; Mazunda, J. The impact of agricultural extension services in the context of a heavily subsidized input system: The case of Malawi. World Dev. 2018, 105, 25–47. [Google Scholar] [CrossRef]
- Wu, X.; Zhang, J.; Tian, Y.; Li, P. Provincial agricultural carbon emissions in China: Calculation, performance change and influencing factors. Resour. Sci. 2014, 36, 129–138. [Google Scholar]
- GB/T 2589-2008; General Rules for Calculating Comprehensive Energy Consumption. Standards Press of China: Beijing, China, 2008.
Disclaimer/Publisher’s Note: The statements, opinions and data contained in all publications are solely those of the individual author(s) and contributor(s) and not of MDPI and/or the editor(s). MDPI and/or the editor(s) disclaim responsibility for any injury to people or property resulting from any ideas, methods, instructions or products referred to in the content. |
© 2025 by the authors. Licensee MDPI, Basel, Switzerland. This article is an open access article distributed under the terms and conditions of the Creative Commons Attribution (CC BY) license (https://creativecommons.org/licenses/by/4.0/).