Article

The Role of Agricultural Socialized Services in Mitigating Rural Labor Shortages: A Multi-Crop Analysis of Production Performance

1
College of Artificial Intelligences, Guangxi Minzu University, Nanning 530006, China
2
College of Economic, Guangxi Minzu University, Nanning 530007, China
3
School of Economics, Shandong University of Finance and Economics, Jinan 250014, China
*
Author to whom correspondence should be addressed.
Agriculture 2025, 15(11), 1151; https://doi.org/10.3390/agriculture15111151
Submission received: 29 April 2025 / Revised: 20 May 2025 / Accepted: 25 May 2025 / Published: 27 May 2025

Abstract

:
China’s agricultural sector faces unprecedented challenges due to rapid urbanization. The rural labor force is declining, and the agricultural workforce is aging significantly. This labor shortage, worsened by the exodus of agricultural technicians, threatens food security and agricultural sustainability. This study analyzes data from 30 Chinese provinces from 2011 to 2022 using a transcendental logarithmic production function. The research examines how agricultural socialized services can alleviate rural labor shortages by improving production efficiency. It also investigates these services’ impact on labor input intensity and grain yield across different crops and regions. The results show that socialized agricultural services effectively promote food production. At the national level, these services can promote a 54.4% increase in total crop production. Agricultural socialized services are gradually developing toward labor substitution. The significant negative interaction coefficient between services and labor confirms this substitution effect. The input–output elasticity of these services is positive for total crop and cereal crop production in major production areas. It also shows positive elasticity for total crop and tuber crop production in non-major production areas. The national-level “service-labor” technical elasticity of substitution maintains values above zero, averaging 0.37 across regions, offering an effective solution to agricultural labor shortages. This study identifies a threshold effect where these services’ impact on food production significantly increases with business scale expansion. These findings highlight the importance of optimizing agricultural socialized services through strengthened service systems, differentiated regional strategies, technological innovation, and comprehensive support policies. Such targeted approaches would enhance substitution effects and service efficiency, addressing labor shortages and boosting food production.

1. Introduction

1.1. Background

Agricultural labor shortages have emerged as a critical challenge for food security and agricultural sustainability worldwide, particularly in developing countries experiencing rapid urbanization [1]. Global agricultural employment continues to decline, with projections indicating a reduction of 43 million workers by 2100, accelerating the decoupling of labor from production [2]. This phenomenon affects numerous developing economies where accelerated urbanization creates significant workforce pressures in rural areas [3]. China’s agricultural sector faces severe structural challenges amid accelerating urbanization, with rates rising from 51.83% to 65.22% between 2011 and 2022, resulting in a dramatic reduction of 170 million agricultural workers and a more than doubled aging index of rural labor (23.4% to 48.6%), fundamentally threatening food production capacity and rural economic viability [4]. Advancing mechanization and modernization have significantly reduced direct engagement in agricultural production [5]. The extended production cycles, substantial investment requirements, and relatively low comparative efficiency of agriculture, combined with better opportunities elsewhere, have prompted skilled young and middle-aged workers to seek employment in non-agricultural sectors, exacerbating the rural brain drain [6].
Agricultural socialized services, for the purpose of this study, are defined as comprehensive support systems that extend beyond traditional agricultural extension services. These services encompass a wide range of professional operations provided by governmental institutions, enterprises, cooperatives, and various social organizations throughout the agricultural production cycle and value chain [7,8]. These services include, but are not limited to agricultural technology dissemination, machinery operations (plowing, planting, and harvesting), pest and disease prevention and control, irrigation management, post-harvest processing, product marketing, financial services (including credit access and insurance), and information services [9]. Unlike traditional self-sufficient farming where households perform all production activities independently, agricultural socialized services represent a division of labor and specialization in the agricultural sector, allowing farmers to outsource specific production tasks to professional service providers [10]. These services are characterized by their market-oriented nature, professional specialization, and ability to achieve economies of scale that individual farmers typically cannot attain on their own. In the Chinese context, these services have become increasingly important as a strategy to address rural labor shortages while maintaining or enhancing agricultural productivity [11].
National policies provide substantial financial support, technological resources, and institutional arrangements to promote agricultural socialized service networks across regions. This policy integration highlights their strategic importance in addressing labor shortages while enhancing productivity amid rapid urbanization and economic transformation [12]. The emergence of agricultural socialized services can be analyzed through several complementary economic theories. First, the theory of labor substitution suggests that when labor becomes scarce and expensive, economic systems naturally seek alternative production factors, particularly technology and capital investments, to sustain productivity [13]. In agriculture, socialized services facilitate this substitution process by providing specialized equipment, expertise, and resources that effectively replace manual labor while potentially increasing overall productivity [14]. Second, the theory of comparative advantage and economic specialization explains why agricultural socialized services emerge as efficient market responses to labor shortages. According to this theory, economic actors (in this case, farmers and service providers) benefit by specializing in activities where they have the greatest relative efficiency and outsourcing other tasks. This specialization increases overall system productivity through more efficient resource allocation [15]. Third, transaction cost economics helps explain the institutional arrangements of agricultural socialized services. When the transaction costs of hiring individual laborers (including search, negotiation, monitoring, and enforcement costs) exceed the costs of contracting with specialized service providers, farmers rationally choose to outsource production tasks [16]. As rural labor becomes scarcer, these transaction costs increase, making service outsourcing comparatively more efficient. The economic theory of induced innovation also provides valuable insights into this process. This theory suggests that the relative scarcity of production factors (in this case, labor) naturally stimulates the development and adoption of technologies and organizational arrangements that economize on the scarce factor. The proliferation of agricultural socialized services in China exemplifies this economic response to changing factor endowments, where service innovations are being induced by increasing labor scarcity and rising agricultural wages [17]. These economic theories collectively explain the emergence, structure, and increasing importance of agricultural socialized services in China’s rural economy.
Globally, service-based adaptation models addressing labor shortages exist beyond China, with notable variations in institutional contexts and implementation strategies. This reflects common challenges in responding to agricultural labor shifts while demonstrating diverse strategic approaches. In the United States, labor scarcity has accelerated precision agriculture development, where sensors, drones, and machine learning algorithms enable farmers to make targeted management decisions, optimizing productivity and reallocating farm labor [18]. In developing countries like Nepal, social institutions serve crucial functions. Agricultural cooperatives and mechanized services mitigate productivity losses from labor migration [19], providing alternative solutions through resource integration and technical support. In the EU region, agricultural services have gradually replaced traditional labor under intensive production systems. However, when technological conditions are favorable, farmers often prefer hiring laborers rather than relying solely on mechanization [20], suggesting technology complements rather than eliminates human labor, creating new human–machine collaboration models. These international cases offer valuable comparative perspectives on China’s response to agricultural labor shortages, highlighting both global challenges and context-specific strategic responses. This framework provides important insights for understanding China’s practices and future directions.
The theoretical framework of this study combines labor substitution theory and technological progress theory, which proposes that agricultural socialized services alleviate labor shortages through three primary mechanisms: technological substitution, resource optimization, and labor force reallocation [21]. This framework is complemented by innovation diffusion theory and institutional economics, which provide additional perspectives on how these services are adopted and implemented within agricultural systems. Innovation diffusion theory explains the process by which agricultural socialized services, as technological and organizational innovations, are communicated and adopted through specific channels over time among farmers [22]. This theoretical perspective helps explain the varying rates of service adoption across different regions and farmer demographics. Institutional economics further enriches our understanding by examining how formal institutions (policies, regulations, and legal frameworks) and informal institutions (cultural norms, traditions, and social networks) shape the development, delivery, and utilization of agricultural socialized services [23]. Technological substitution introduces mechanized equipment to reduce dependence on manual labor, thereby increasing operational efficiency while decreasing labor requirements. Resource optimization achieves more efficient resource allocation, enhancing production efficiency by matching specialized skills with appropriate tasks. Labor force reallocation transfers workers from low-productivity agricultural activities to higher-value economic sectors, optimizing overall economic productivity.
Within China’s policy framework, agricultural socialized services have gained strategic importance as integral components of national agricultural modernization initiatives. Since the issuance of the No. 1 Central Document on agricultural and rural development in 2004, the Chinese government has consistently prioritized agricultural modernization through various policy instruments. The Rural Revitalization Strategy and the 14th Five-Year Plan (2021–2025) have further reinforced the critical role of these services in achieving agricultural modernization and rural development goals [24]. These policy frameworks provide substantial financial support, technological resources, and institutional arrangements to promote service networks across different regions, highlighting their strategic importance in simultaneously addressing labor shortages and enhancing productivity amid rapid urbanization and economic transformation [25]. In the short term (through the 14th Five-Year Plan, 2021–2025), policy implementation focuses on establishing comprehensive service networks, improving service accessibility for smallholder farmers, and integrating traditional farming practices with modern technological approaches. The medium-term vision (through 2035) aims to develop fully professionalized agricultural service systems that facilitate the transition to modern agriculture while preserving rural communities’ social and cultural fabric. The long-term perspective (through 2050) envisions agricultural socialized services as integral elements of a fully modernized rural economy where agriculture achieves productivity parity with urban industrial sectors while maintaining environmental sustainability.
This study addresses the urgent need to improve food production sustainability amid rapid urbanization and evolving agricultural practices. Traditional farming models face severe challenges, necessitating innovative solutions to ensure food security and sustainable development. This research explores how agricultural socialized services mitigate labor shortages and enhance production efficiency, filling critical gaps in the existing literature. Such investigation is essential for developing effective sustainable development policies, particularly in China and other developing countries.

1.2. Objective

This study investigates the impact of socialized agricultural services on alleviating China’s agricultural labor shortage and promoting crop production. While previous research has typically focused on single crop types or aggregated agricultural output, this study offers a novel contribution by comprehensively analyzing different crop categories (cereals such as rice, wheat, corn, and barley; legumes; and tubers) and examining regional variations between major and non-major production areas. This multi-dimensional approach overcomes a significant limitation in the current literature, which has largely overlooked crop-specific responses to agricultural socialized services and regional heterogeneity of service effectiveness.
This research analyzes data spanning 30 provinces from 2011 to 2022, employing a transcendental logarithmic production function to examine the complex relationships between agricultural socialized services, labor inputs, and crop production across diverse agricultural contexts. By examining both crop-specific and region-specific effects, this study provides a more comprehensive understanding of how agricultural socialized services can be optimally deployed to address labor shortages while maintaining or enhancing productivity. The research methodology involves four key steps: (1) assessing whether agricultural socialized services promote production efficiency in different regions and crop types using the transcendental logarithmic production function; (2) implementing a new approach to measure the substitution relationship between agricultural socialized services and labor input; (3) employing a threshold effect model to explore the nonlinear threshold effect of agricultural land management scale; and (4) developing a comprehensive framework for understanding scale-dependent effects of agricultural socialized services.
This study makes several significant contributions to the existing literature. First, while previous research has typically examined agricultural socialized services in isolation or focused on single crop types, this study offers a novel multi-dimensional analysis that systematically compares service effectiveness across different crop categories (cereals, legumes, and tubers) and geographical contexts (major and non-major crop-producing regions). This comprehensive approach reveals previously undocumented heterogeneity in how these services affect different agricultural systems. Second, this study develops and applies an innovative methodological framework that quantitatively measures the technical elasticity of substitution between agricultural socialized services and labor inputs, providing the first empirical evidence of how this substitution relationship varies across crops and regions. Third, the research identifies a critical threshold effect in the relationship between operational scale and service effectiveness, demonstrating that the impact of agricultural socialized services on crop production significantly increases beyond specific scale thresholds. These findings provide crucial insights for developing targeted, context-specific agricultural policies that can effectively address rural labor shortages while enhancing food security in China and other countries experiencing similar agricultural transitions.
The remainder of this paper is organized as follows: Section 2 presents the literature review and theoretical framework; Section 3 describes the research design and methodology; Section 4 presents the empirical results and analysis; Section 5 discusses the findings; and Section 6 concludes with policy implications and recommendations.

2. Literature Review

2.1. The Evolution of Agricultural Socialized Services

Agricultural socialized services have emerged as a strategic response to the complex challenges facing contemporary agricultural systems, particularly in contexts experiencing rapid rural–urban migration and labor shortages. Understanding their development and impacts requires an integrated theoretical framework that combines perspectives from multiple disciplines.
The gradual evolution of agricultural socialization services represents a strategic response to contemporary agricultural challenges and demonstrates the necessity and effectiveness of modernizing agricultural practices. As a transformative intervention mechanism, agricultural socialization services have proven effective in addressing key issues in agricultural production [26]. Successful implementation models worldwide have provided a substantial empirical basis for research in this area, further validating their efficacy in promoting agricultural modernization [27]. In the United States, professional agricultural service companies apply advanced technologies in precision agriculture by providing full-process support from seed selection to harvesting and marketing, thereby optimizing resource allocation and enhancing production efficiency [28]. In developing countries, agricultural socialization services also demonstrate considerable potential. In Ghana specifically, the introduction of agricultural services has significantly increased maize yields, total farm incomes, and per capita food consumption, consequently improving rural household welfare [29]. In Ethiopia, comprehensive technical service packages had significantly more positive impacts on food security and farm incomes of smallholder farmers compared to single or partial technological interventions, particularly in wheat production [30].
Recent empirical studies have documented the far-reaching impacts of agricultural socialization services on various dimensions of agricultural production and rural development. Zhou et al. [31] demonstrated that access to agricultural production services can effectively reduce production costs and improve land use efficiency, thus enhancing overall agricultural production efficiency. Xu et al. [32] revealed that agricultural production services not only alleviate smallholder farmers’ constraints in accessing production factors but also promote improvements in green food production efficiency. Additionally, research indicates that for every 1% increase in agricultural machinery service utilization, food production weight loss and value loss decrease by 0.864% and 0.862%, respectively [33]. Cai et al. [34] established through quantitative analysis that the critical threshold for agricultural land use rights transfer is 33.18%, beyond which the impact of agricultural socialization services on crop production is significantly enhanced.
The aforementioned successful implementation models and empirical findings provide a crucial theoretical foundation for subsequent explorations of technological pathways for agricultural labor substitution. Furthermore, these results offer key references for understanding the scalability of socialized services and their differential impacts across agricultural contexts. Future research should focus on optimizing service models according to local conditions to maximize economic benefits and social welfare.

2.2. Beyond Manual Labor: Technological Pathways to Agricultural Labor Substitution

Agricultural labor dynamics have undergone a major transformation driven by technological innovation, providing diversified paths to break through traditional labor constraints while significantly improving agricultural production efficiency. Empirical studies indicate that employment effects of production subsidy policies differ across economic sectors: they increase employment levels in family agricultural sectors with lower labor elasticity, while reducing employment ratios in entrepreneurial agricultural sectors with higher labor elasticity [35].
Mechanization and technological advances, as key drivers, have effectively addressed labor shortages while ensuring stable or increased agricultural productivity [36,37]. In this context, mechanical substitution has emerged as one of the most mature and widely validated solutions. Existing studies consistently demonstrate significant labor-saving effects of mechanization across various agricultural systems. Zhang et al. [38] identified that an aging agricultural labor force exacerbates agricultural land abandonment due to low internet usage, insufficient participation in agricultural cooperatives, and limited mechanization. Similarly, Hammelman et al. [39] documented agricultural labor demand changes in Thailand during the COVID-19 pandemic, where heavy machinery usage increased from 33% pre-pandemic to 44% post-pandemic, highlighting the crucial role of mechanical substitution during exceptional circumstances.
Digital technology and smart agriculture represent a critical path for agricultural labor substitution. Contemporary studies demonstrate that smart agricultural practices optimize resource efficiency while substantially reducing dependence on traditional labor [40]. Okumu et al. [41] found that among female-headed households, a collective agricultural business model was preferred for reducing labor burdens, with climate-smart agricultural technologies being actively pursued. Furthermore, Walter et al. [42] confirmed that implementing a digital monitoring system reduced labor requirements in an intensive production system by 70%, while significantly improving input–output efficiency. These results underscore the significant role of digital technologies in agricultural transformation.
Automation and robotics represent the cutting edge of labor replacement in agriculture, with their commercial viability becoming increasingly evident across diverse agricultural scenarios. Yamashita et al. [43] demonstrated that drone technology application in rice cultivation can increase labor productivity by approximately 20%. Likewise, Lee et al. [44] revealed that farms employing robotics not only increased average daily milk production per cow from 2.44 kg to 2.88 kg but also reduced labor input by 0.15 to 0.30 person/head/week. The implementation of these advanced technologies provides practical solutions for agricultural labor replacement and establishes a solid foundation for achieving sustainable productivity growth.
These technological tools effectively address challenges posed by changing rural labor force dynamics while providing crucial support for agricultural modernization and sustainable development. Future efforts should focus on strengthening policy support and technological research to promote wider adoption of these technologies across diverse agricultural contexts, thereby achieving simultaneous improvements in agricultural productivity and resource utilization efficiency.

2.3. Service-Driven Productivity: The Multidimensional Impact of Agricultural Socialized Services on Crop Production

The connection between agricultural socialized services and productivity enhancement has become a key research focus [45]. Empirical evidence shows integrated service systems significantly boost agricultural productivity through multiple channels. Ragasa and Mazunda’s [46] Malawi study found that integrated services increased maize yields by 22% compared to single-service approaches. Fabregas et al.’s [47] meta-analysis demonstrated that information-based services increased crop yields by 26% while reducing input costs by 18%.
Agricultural socialization services enhance productivity through three interconnected mechanisms: technology diffusion, resource optimization, and market integration [48,49,50]. Massrie’s [51] Ethiopian coffee industry research revealed how services accelerate technology adoption, improving both farming practices and climate adaptation capabilities. In Crete, Gouta et al. [52] demonstrated how professional training optimizes labor allocation and addresses skill imbalances. Market integration research in India [53] showed 20𠄹25% yield increases in areas with developed service networks by improving market connectivity and information flow. In China, expanding agricultural service systems effectively addresses supply–demand mismatches and resource allocation inefficiencies [54], supporting agricultural modernization. From technology diffusion to resource optimization to market integration, this systematic progress fully demonstrates the transformative potential of comprehensive agricultural service systems.
Despite substantial evidence, critical research gaps persist. First, the literature has inadequately addressed the potential synergistic relationship between labor substitution and productivity enhancement, typically focusing on each dimension in isolation [55]. Second, existing research has insufficiently examined regional heterogeneity in service impacts and variations across different crop varieties [56]. Third, crop-specific variations in service effectiveness represent another critical research gap, as most studies focus on staple crops while neglecting other crop categories. Finally, methodological limitations in existing research have constrained our understanding of comprehensive impacts, with many studies relying on cross-sectional data or limited timeframes that prevent robust analysis of long-term adaptation processes [57].
This study employs a transcendental logarithmic production function to examine complex interactions between agricultural socialized services and labor inputs. The research hypothesizes that agricultural socialized services effectively promote crop production and possess substantial potential for labor substitution, with effects varying across regions and crop types. This study makes four significant contributions: (1) advancing theoretical understanding of labor substitution mechanisms by integrating agricultural socialized services into production function models; (2) providing robust empirical evidence of service effectiveness across different crop varieties while revealing regional heterogeneity; (3) developing a quantitative framework to measure substitution relationships between services and labor inputs; (4) investigating nonlinear threshold effects of land management scale on service–production relationships, providing practical insights for optimizing service delivery and resource allocation.

2.4. Input–Output Relationships and Production Dynamics

2.4.1. Impact of Agricultural Socialized Service Inputs on Crop Outputs

The structural transformation of agricultural production in response to labor market dynamics represents a central challenge in contemporary Chinese agriculture, requiring innovative approaches to labor substitution and resource optimization. Research on escalating rural labor costs in China has examined the structural transformation of agricultural production inputs, particularly focusing on labor substitution mechanisms [58]. As labor becomes increasingly scarce and expensive, production systems naturally shift toward capital-intensive and technology-driven approaches to maintain or enhance productivity. Traditional smallholder agriculture, characterized by intensive family labor utilization, often results in suboptimal labor productivity and inefficient resource allocation across sectors [59]. Agricultural socialized services offer a transformative solution through mechanized and large-scale production services delivered by specialized organizations [60]. These services operate through three primary mechanisms: technological introduction, providing access to advanced machinery that reduces labor requirements; knowledge transfer, disseminating specialized expertise to enhance production efficiency; and resource optimization, enabling more effective allocation of remaining labor resources through economies of scale. Farmers are able to reallocate labor resources to more productive non-agricultural sectors, thus optimizing the efficiency of resource allocation [61].
Intensifying rural labor shortages necessitate a critical re-examination of existing theoretical frameworks within China’s contemporary agricultural context. While labor substitution theory effectively explains the general shift toward technology-intensive agriculture, it has limitations in addressing rural China’s contextual complexity, particularly regarding technology adoption barriers in remote regions and new skill gaps emerging when traditional agricultural knowledge is replaced by technological requirements. Our study advances existing theoretical models by analyzing the impact of agricultural socialized services on labor substitution, emphasizing the dynamics of selective labor migration and wage appreciation (Figure 1). The proposed analytical framework employs a simplified model of farmer decision-making, concentrating on agricultural production activities and identifying labor and agricultural socialized services as primary production factors [62].
The diagram in Figure 1 illustrates the innovation possibility curve in period 0 (denoted as I0*), which consists of a series of more inelastic equal yield curves (such as i0). The equal cost line is labeled as L0S0. In the initial period, it is assumed that the iso-yield line I0* is tangent to the iso-cost line L0S0 at point A. When labor becomes increasingly scarce relative to agricultural socialized services from period 0 to period 1, the price of agricultural socialized services falls relative to the price of labor inputs. This change, coupled with the relative scarcity of resources, triggers adaptive shifts in production technology, leading to technological advancements in agricultural socialized services. These advancements lower the input costs of agricultural socialized services. Consequently, the attendant-labor relative price declines from L0S0 in period 0 to L1S1 in period 1, and the new, more labor-saving service technology (represented as i1) shifts the innovation possibility curve from I0* to I1*. The equal yield curve i1, corresponding to the new technology, becomes tangent to the equal cost curve L1S1 at point C, which establishes a new minimum cost equilibrium. As a result, farmers optimize their production mix by substituting labor with services, thus maximizing profits. The following hypotheses are proposed:
Hypothesis 1.
As agricultural development advances, farmers increasingly substitute agricultural labor with agricultural socialized services to enhance crop production efficiency, with substitution trends varying across different regions and crop varieties.

2.4.2. Input–Output Elasticity of Agricultural Socialized Services and Labor Inputs

First, the crop production function of a farmer is assumed to be as follows:
Y = F ( S , L , T , E )
In Equation (1), Y represents crop production, S denotes agricultural socialized services input, L indicates labor input, T represents land input, and E encompasses all other production inputs. These variables were selected as they constitute the critical factors influencing crop production. This model enables examination of how agricultural socialized services interact with traditional production factors to affect output. The transcendental logarithmic production function captures non-linear relationships and complex interactions between multiple factors, accurately representing the substitution and complementary dynamics between agricultural socialized services and labor inputs.
In the crop production function, the input–output elasticity of agricultural socialized services is expressed as follows:
Ԑ S = ( ԁ Y / Y ) / ( ԁ S / S ) = ( ԁ Y / ԁ S ) / ( S / Y ) = M P S ( S / Y )
In Equation (2),   Ԑ S is the input–output elasticity of agricultural socialize services, ԁ Y / ԁ S is the partial derivative of output with respect to service input, M P S is the marginal product of agricultural socialized services, and S / Y is the ratio of services input to total output.
Ԑ L = ( ԁ Y / Y ) / ( ԁ L / L ) = ( ԁ Y / ԁ L ) / ( L / Y ) = M P L ( L / Y )
In Equation (3), Ԑ L is the input output elasticity of labor, ԁ Y / ԁ L is the partial derivative of output with respect to labor input, M P L is the marginal product of labor, and L / Y is the ratio of labor input to total output.
In order to further elucidate the time-varying mechanism of agricultural socialized services and labor input–output elasticity in crop production, the following analysis is carried out in Figure 2. Since the time span of the sample data in the paper is from 2011 to 2022, the years 2011 and 2022 are selected as the time analysis nodes.
In the initial period of 2011, farmers operated at equilibrium point E1, characterized by labor inputs of L2011 and agricultural socialization service inputs of S2011. This period exhibited a distinctively high ratio of labor to service inputs, manifesting as a significant service input shortage alongside a labor surplus. This structural imbalance resulted in diminished marginal labor output (MPL), evidenced graphically by the relatively flat tangent slope at point E1, indicating minimal output gains from additional labor units. Subsequently, substantial rural–urban labor migration occurred concurrently with steadily increasing agricultural socialized services. These structural changes shifted the household crop production equilibrium to point E2 by 2022. Under this new equilibrium, labor inputs declined from L2011 to L2022, while agricultural socialized service inputs expanded from S2011 to S2022. The reduced labor-to-service input ratio signaled production structure optimization, consequently enhancing labor productivity. Graphically, the OE2 line segment’s steeper slope compared to OE1 demonstrates more substantial production increases per service input unit at point E2. Labor force reallocation not only optimized resource distribution but also increased marginal labor output (MPL). While MPL improvements remain modest due to substantial remaining transferable agricultural labor, the trend nonetheless indicates gradual labor utilization efficiency gains.
While theoretical models predict positive correlations between labor force restructuring and input–output efficiency, empirical evidence reveals more complex dynamics [63]. In China’s agricultural context, natural resource limitations prevent exclusive reliance on labor expansion for increasing crop production [64]. Research indicates that increased labor inputs may paradoxically reduce production efficiency through over-intensification rather than enhance yields [65]. The accelerating aging of China’s rural workforce presents additional challenges, as studies demonstrate that household aging correlates significantly with declining crop output [66,67].
During labor scarcity periods, agricultural enterprises often employ less skilled or elderly workers, resulting in diminished productivity compared to traditional workforce capabilities [68]. This challenge is compounded by two critical mechanisms. First, labor shortages lead to suboptimal machinery maintenance and utilization, where additional labor fails to achieve optimal efficiency due to inadequate machinery-to-worker ratios or insufficient operational expertise. Second, labor constraints frequently result in land abandonment or under-cultivation [69]. While efforts to reintegrate labor may encourage the recultivation of marginal lands, these areas typically exhibit low productivity and potential environmental degradation, ultimately reducing aggregate agricultural output [70].
Examining this phenomenon through the Overlapping Generations (OLG) model framework reveals additional insights regarding savings and capital formation. A decline in the young workforce typically corresponds with reduced savings rates, subsequently diminishing capital stock. Given the complementary relationship between capital and labor in production functions, insufficient capital prevents output expansion through increased labor due to the requirement for specific capital-to-labor ratios. Consequently, the marginal product of labor may approach zero or become negative as excessive labor creates inefficiencies through congestion effects and elevated management costs.
The total effective labor force in agriculture is as follows:
L = L y o u n g + γ L o l d ; γ < 1
where γ denotes the labor efficiency factor. Assuming that the total labor force is L t o t a l = L y o u n g + L o l d , but the effective labor force is decreased due to a decrease in the young labor force (to non-agricultural) and a decrease in the proportion of young people, φ = L y o u n g L o l d , caused by an increase in the aging elderly population or similar factors, then the effective labor force is as follows:
L = L t o t a l × [ φ + γ ( 1 φ ) ]
The derivation for L t o t a l is obtained as follows:
d L d L t o t a l = φ + γ ( 1 φ ) + L t o t a l × ( 1 γ ) d φ d L t o t a l
Since d φ d L t o t a l < 0 (the proportion of young people decreases with an increase in the total labor force), φ + γ ( 1 φ ) is the direct effect, and L t o t a l × ( 1 γ ) d φ d L t o t a l is the structural effect. If the structural effect dominates, such that d L d L t o t a l < 0 , it suggests that an increase in the total labor force reduces the effective labor force instead.
The output elasticity of the total labor force is as follows:
M P L ( L / Y ) = d Y d L t o t a l × L t o t a l Y = β × d L d L t o t a l × L t o t a l L
When d L d L t o t a l < 0 , then the elasticity M P L ( L / Y ) < 0 , indicating that the elasticity of labor inputs with respect to output is negative.
When labor shortages occur, and M P L ( L / Y ) < 0 , farmers will tend to decrease L and increase S to achieve the optimal production decision. This empirical finding demonstrates that agricultural socialized services effectively substitute for traditional labor, ensuring food security while addressing the dual challenges of labor shortage and workforce aging. Recent developments in agricultural socialized services have demonstrated remarkable innovation and dynamism, significantly contributing to rural business system enhancement, stable agricultural product supply maintenance, and sustainable agricultural development promotion. Consequently, expediting service development, enhancing service capabilities, and facilitating small farmers’ integration into modern agricultural systems has become increasingly urgent.
Nevertheless, regional variations and crop diversity create differentiated demands, potentially leading to disparate outcomes in the implementation of agricultural socialized services and labor inputs. Based on a comprehensive analysis of both the rapid evolution of agricultural socialized services and shifts in the labor-to-crop production ratio, this study proposes the following hypothesis:
Hypothesis 2.
Agricultural socialized services exhibit positive input–output elasticity trends, while labor force elasticity demonstrates negative patterns, with significant variation across different crop varieties and regions.

2.5. Substitution Elasticity Between Services and Labor

To quantify the intensity of labor substitution by agricultural socialized services, this study employs the concept of technical elasticity of substitution. Following Coelli et al. [71], the elasticity of technical substitution is defined as the ratio of percentage changes in input factors (service/labor) to percentage changes in the marginal rate of technical substitution, measured under constant output conditions. Based on this framework, the elasticity of technical substitution between services and labor is expressed as follows:
δ M L = ԁ ( L / M ) / ( L / M ) ԁ ( M P M / M P L ) / ( M P M / M P L ) = ԁ ( L / M ) / ( M P M / M P L ) ( L / M ) / ԁ ( M P M / M P L )
Within the framework of the two-factor production function, the marginal rate of technical substitution ( δ M L ) is limited to a range of values between 0 and positive infinity. Specifically, when the value of δ M L lies in the interval from 0 to 1, it indicates a complementary relationship between the two factors of production, i.e., an increase in one factor requires a corresponding increase in the other in order to maintain a given level of output; while when the value of δ M L is greater than 1, it implies that there is a substitutive relationship between the two factors of production, i.e., an increase in one factor can substitute for a decrease in the other factor without affecting output. However, in production functions with more than two factors, the elasticity of technical substitution can assume any real value. In this context, positive δ M L values indicate substitution relationships, while negative values denote complementary relationships. Since δ M L calculation relies on production function coefficient estimates, predicting its temporal trends becomes highly complex. Therefore, this study focuses on a theoretical analysis of how agricultural socialized services affect labor substitution techniques within the current context.
Agricultural socialized services facilitate labor substitution through two primary mechanisms. In the short term, technological substitution enables rapid workforce reduction through enhanced agricultural specialization [72]. These services promote specialized expertise development in specific production segments based on comparative advantages, optimizing the relationship between agricultural labor and production means, and fostering a more efficient agricultural economy. The input–output elasticity of these services not only reflects their direct impact on crop production but also significantly influences farmers’ resource allocation decisions. When agricultural socialized services demonstrate high elasticity values, farmers are more inclined to invest in these services rather than traditional inputs, thereby reconfiguring their production strategies toward technology-intensive approaches.
In the long term, agricultural socialized services crucially promote smallholder income growth and optimize labor allocation across sectors [73,74]. Services such as mechanized plowing, automated planting, precision management, mechanical harvesting, and drone-based plant protection simultaneously release agricultural labor for non-agricultural employment while enhancing farmers’ capacity to invest in productive services [75]. This dual effect creates a virtuous cycle where improved income generation capacity further reinforces farmers’ ability to access additional services, progressively transforming traditional agricultural production systems.
The substitution intensity of agricultural socialized services follows the law of diminishing marginal returns. Initial technology adoption generates higher substitution intensity through innovation and efficiency gains. However, as technology diffusion progresses, the marginal rate of substitution gradually decreases [76]. This pattern is reflected in changing elasticity values across implementation stages, with early adopters typically experiencing higher input–output elasticity compared to later-stage implementers. These elasticity differentials explain why service adoption patterns vary significantly among farming communities, even within similar agricultural contexts. Despite this trend, expanding control-intensive operations across crop varieties continues to generate increasing demand for socialized services. Regional variations in agricultural development and crop diversity create heterogeneous substitution intensities, necessitating differentiated policy approaches to address specific regional and crop-type needs. Based on these considerations, we propose the following hypothesis:
Hypothesis 3.
Agricultural socialized services demonstrate progressive development toward labor substitution, effectively mitigating agricultural labor shortages, as evidenced by positive “service-labor technology elasticity of substitution” values, with substitution intensity varying across different varieties and regions.

2.6. Nonlinear Threshold Effect of Farmland Operation Size on the Relationship Between Agricultural Socialized Services and Crop Production

Large-scale agricultural land management encompasses centralized operations designed to optimize land output efficiency, labor productivity, and agricultural commodity production while minimizing costs and enhancing economic returns. This operational paradigm reflects an inherent developmental trajectory of agricultural economies under market conditions, facilitating standardized and specialized production systems. The expansion of farming scale accelerates the dissemination of agricultural technology and machinery, with moderate scale expansion positively impacting agricultural production outsourcing [77,78].
As the operational scale expands, the marginal effects of agricultural socialized services may gradually shift, resulting in a non-linear relationship with crop production. When operations reach certain thresholds, the complementary effects between land scale and socialized services may transform into diminishing returns due to management complexity and coordination challenges. In small-scale operations, farmers typically encounter resource constraints across capital, technology, and labor dimensions, resulting in suboptimal productivity [79]. Although socialized services provide operational support, their impact remains constrained by scale limitations. As operational scale reaches critical thresholds, farmers achieve enhanced resource utilization efficiency. At this juncture, socialized services demonstrate increased effectiveness, particularly through technical extension and mechanization services, leading to substantial productivity gains [80]. Based on these theoretical considerations and empirical observations, we propose the following hypothesis:
Hypothesis 4.
Agricultural land operational scale exerts nonlinear threshold effects on the relationship between agricultural socialized services and crop production, characterized by distinct efficiency patterns across different scale intervals.
The conceptual framework of this study is illustrated in Figure 3.

3. Materials and Methods

3.1. Data Sources

This study utilizes provincial-level panel data covering 30 Chinese provinces from 2011 to 2022. The dataset is compiled from multiple official sources including the China Statistical Yearbook, China Rural Statistical Yearbook, and provincial statistical yearbooks and government work reports published by the National Bureau of Statistics and the Ministry of Agriculture and Rural Affairs. The 12-year study period (2011–2022) was selected to capture the significant rural labor transformations that occurred during this period, as evidenced by the increase in urbanization rates from 51.83% to 65.22% and the more than doubling of the aging index of rural labor from 23.4% to 48.6%. These provinces were further classified into major production areas (13 provinces) and non-major production areas (17 provinces) based on official designations by the Ministry of Agriculture and Rural Affairs, enabling regional comparative analysis.
Table 1 shows the descriptive statistics of the validated dataset. At the national level, the data reveal mean annual production values of 21,671,980 tons for total crop output, 20,013,440 tons for cereals, 609,060 tons for legumes, and 958,590 tons for tubers. For clarity, our study classifies crops into three main categories: cereals (including rice, wheat, corn, and barley), legumes, and tubers. The composition of crop production indicates cereal crops as the dominant category, accounting for 92.75% of total output, followed by tubers at 4.42% and legumes at 2.81%. Regional analysis demonstrates that main crop-producing regions consistently exceed non-main crop-producing regions in key metrics.

3.2. Selection of Variables

The study variable selection process was guided by theoretical considerations and previous empirical research on agricultural production functions. The dependent variables include total crop output (10,000 tons), cereal crop output (10,000 tons), legume crop output (10,000 tons), and tuber crop output (10,000 tons) [59]. This multi-dimensional approach enables a systematic assessment of how agricultural socialized services affect different crop systems. These variables were selected based on their comprehensive coverage of China’s staple crop crops and their importance for crop security considerations.
For quantifying agricultural socialized service inputs, we utilize the number of professional households providing agricultural mechanization services as our primary metric, capturing both quantitative changes and qualitative expansions in service provision [81]. These socialized agricultural mechanization services effectively address smallholder operational constraints while facilitating technological adoption across farmlands by integrating advanced production elements that enhance agricultural efficiency and output quality.
Agricultural labor input is quantified using a two-step methodology to ensure precision in measuring agricultural-specific employment. First, we calculate the ratio of agricultural output value to total agricultural, forestry, animal husbandry, and fishery output value for each province year. This ratio is then applied to the corresponding total sector employment figures to derive agricultural-specific employment levels. This approach, validated in previous research [65], ensures robust comparability across provinces with different agricultural structures.
Additional explanatory variables include agricultural machinery input (measured as the total power of agricultural machinery in 10,000 kilowatts), crop sown area (thousands of hectares), and fertilizer input (10,000 tons). These variables were selected based on their theoretical importance in crop production and consistent significance in previous studies [82]. Control variables include a policy dummy variable indicating land transfer policy implementation (coded as 1 for years after 2014 and 0 otherwise) and province-specific fixed effects to account for unobserved geographical heterogeneity.
Figure 4 illustrates the dynamic relationships and temporal trends among China’s total crop output, agricultural socialized service inputs, and rural labor inputs from 2011 to 2022. The data reveal synchronous growth between total crop output and agricultural socialized service inputs, with both metrics demonstrating consistent annual increases, underscoring the crucial role of agricultural socialized services in enhancing crop production efficiency. In contrast, agricultural labor inputs exhibit a distinct downward trend. This decline stems from substantial rural–urban migration and labor shifts to non-agricultural sectors, resulting in significantly reduced agricultural employment. The preferential outflow of high-quality labor seeking enhanced economic opportunities has intensified the risk of farm households abandoning agricultural production due to labor constraints, potentially threatening sustained agricultural output growth. Notably, despite this substantial labor force reduction, China’s total crop output maintained steady growth throughout 2011–2022. This paradox provides compelling evidence for the effectiveness of agricultural socialized services in substituting for traditional agricultural labor, enhancing productivity, and driving increased crop production. These findings establish a robust foundation for subsequent research investigations.

3.3. Analytical Methods

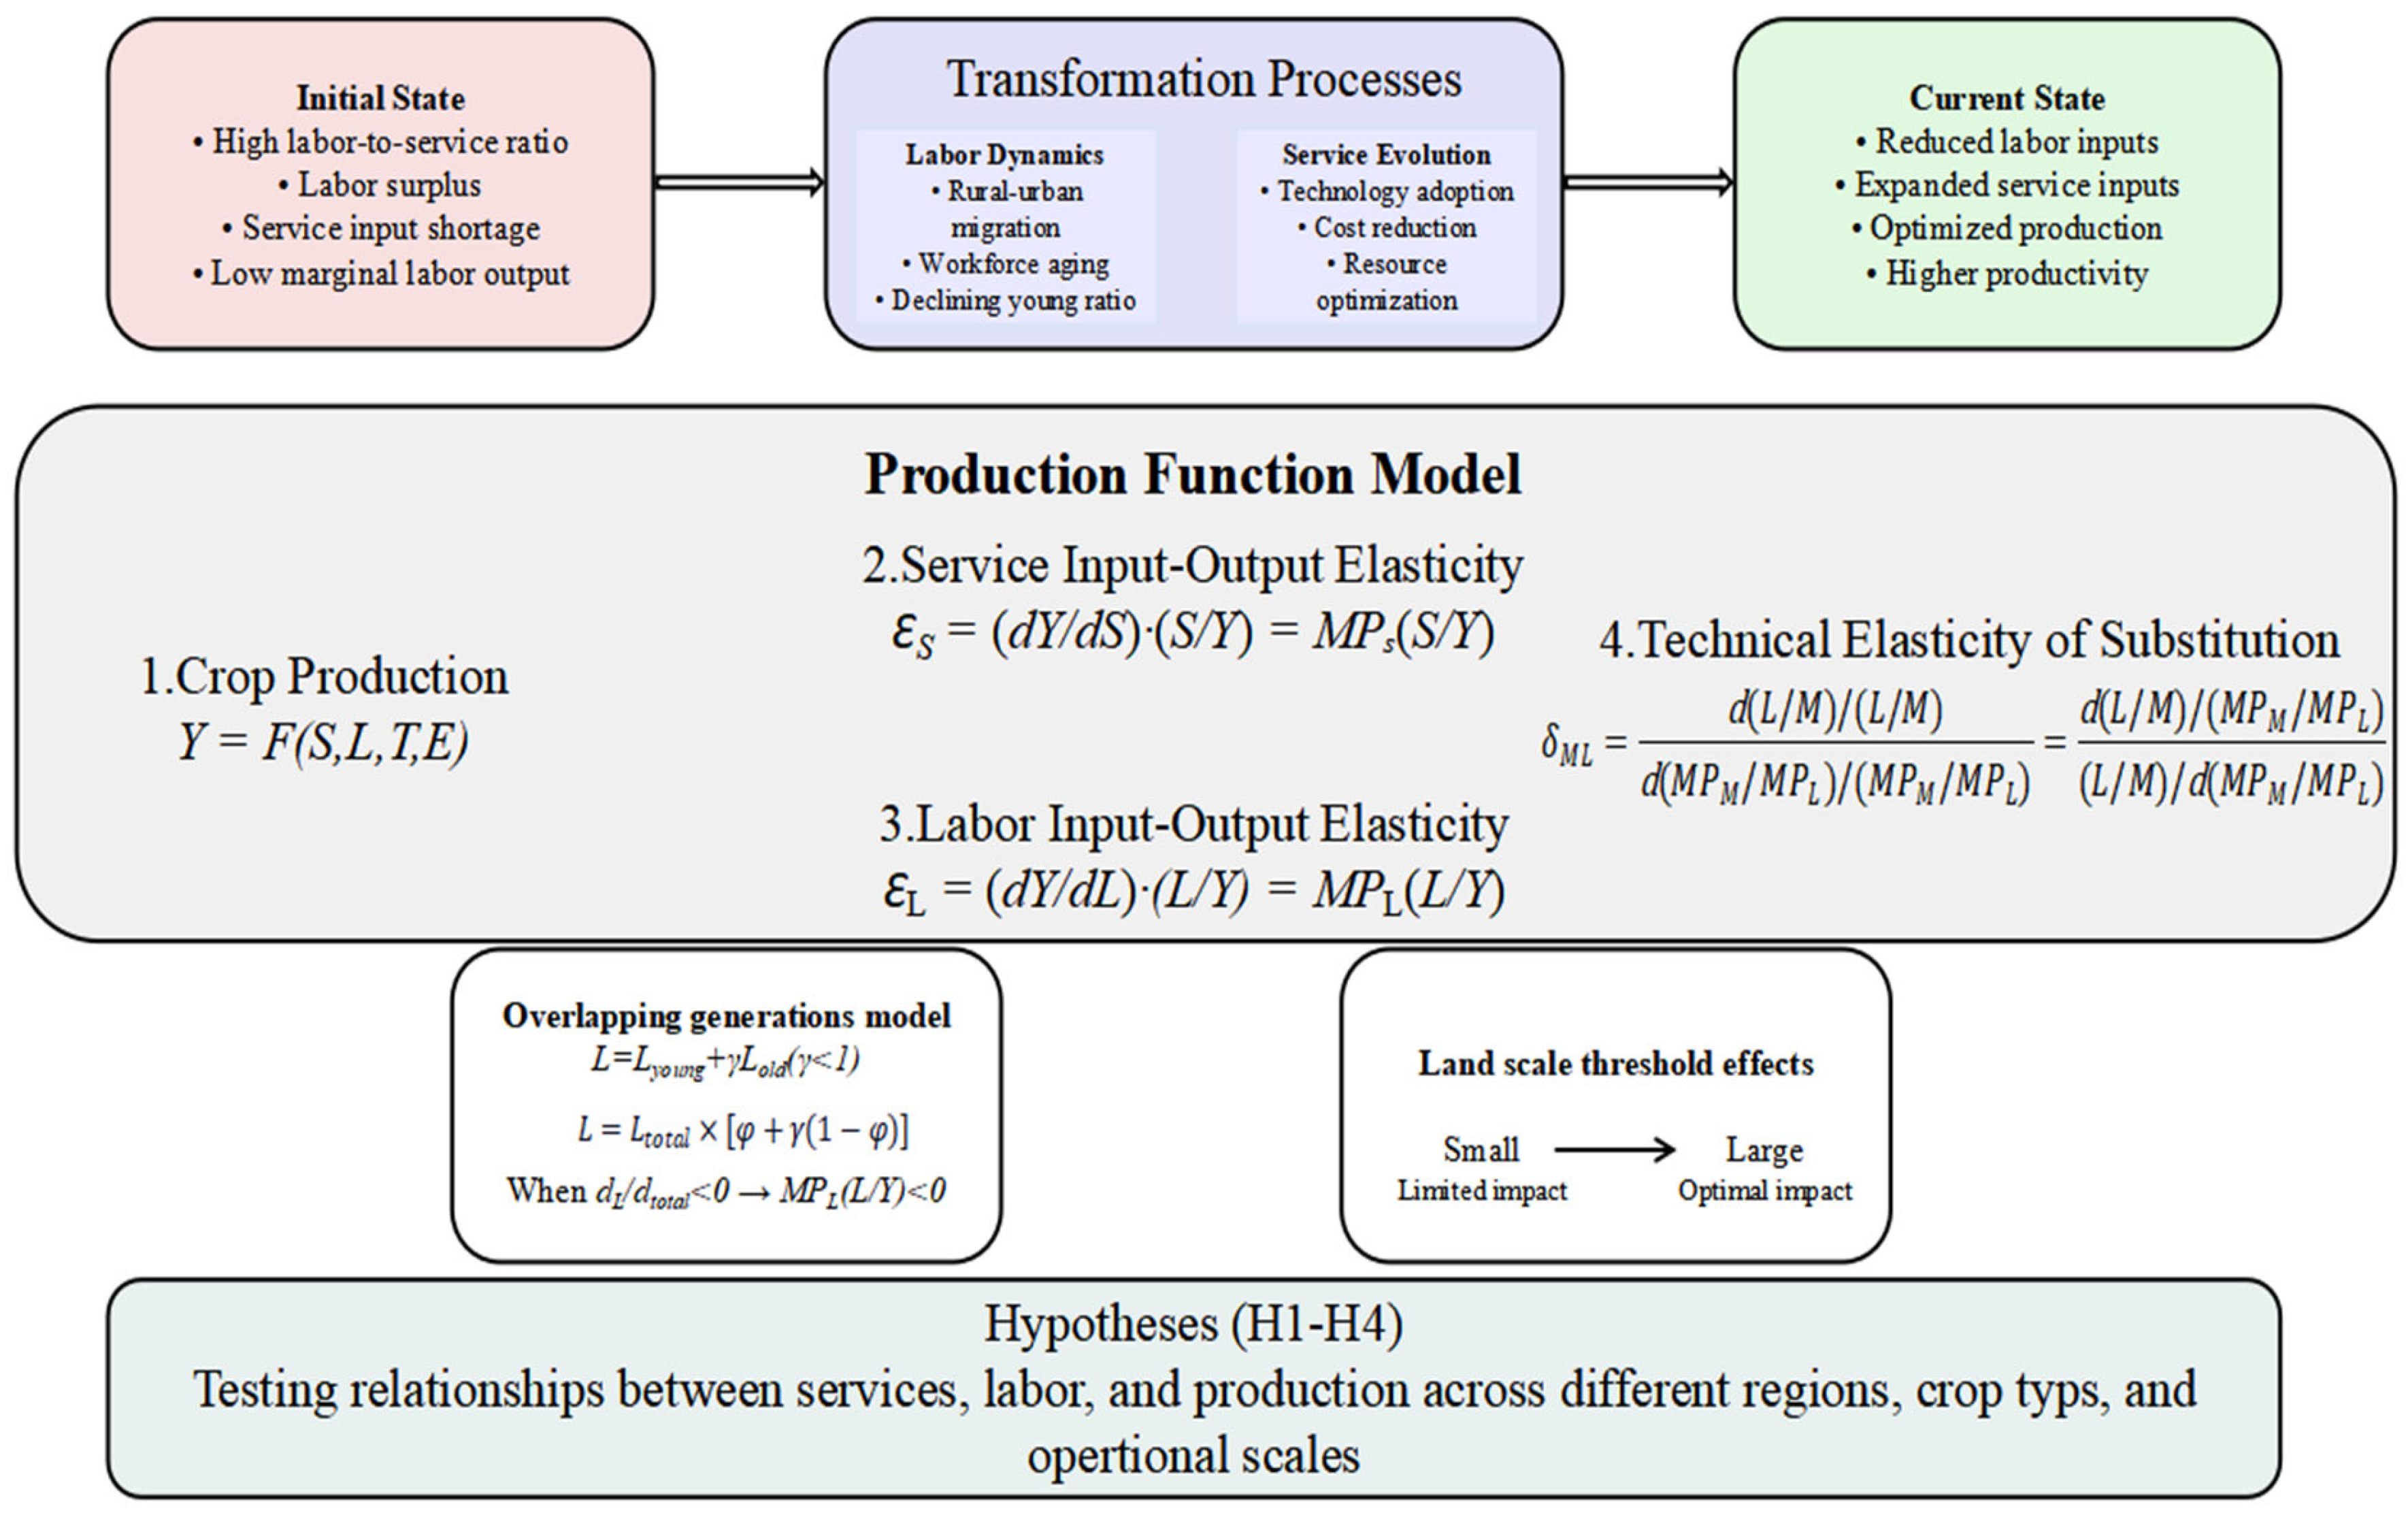
3.3.1. Production Function Modeling

Agricultural production emerges from complex interactions among multiple input factors, comprising both direct effects and indirect interactions that create a multidimensional production framework. Traditional production models, including Cobb–Douglas scale-invariant and CES functions, exhibit significant limitations in capturing these factor interactions due to restrictive assumptions such as constant factor substitution elasticity, which oversimplify real-world complexity and compromise explanatory power.
To address these limitations, this study employs the transcendental logarithmic (translog) production function developed by Christensen et al. [83] to analyze factor substitution and complementarity dynamics. The translog function provides a second-order approximation to any arbitrary production function without imposing restrictive constraints, avoiding unrealistic assumptions about market competition and substitution elasticity. Through quadratic terms, it captures both inter-factor interactions and nonlinear relationships.
Unlike the Cobb–Douglas model (which constrains substitution elasticities to unity) or the CES model (which restricts elasticity to constant values), the translog specification allows elasticities to vary with input levels, making it ideal for examining the evolving relationship between agricultural socialized services and labor inputs. This flexibility enables accurate representation of scale returns variations and technological progress in agricultural systems, from labor-intensive to capital-intensive approaches. The crop translog production function is specified as follows:
L n Y = α 0 + α k k = 1 4 L n X k + 1 2 K = 1 4 α X X ( L n X K ) 2 + α k j k = 1 4 j = 1 4 L n X k L n X j
In Equation (9), Y is crop production and X k   ( k = j = 1,2 , 3,4 , 5 ) represents the kth input factor. S, L, T, and E are used to represent service, labor, land, and other inputs, respectively. This paper first examines each production factor’s impact on crop production, then introduces a policy dummy variable representing farmland transfer to verify the overall incentive effect of farmland transfer policies implemented since 2014 on various agricultural inputs. Farmland transfer promotes more effective use of limited agricultural resources, driving optimal combinations of factors including rural labor and services, fostering development toward industrialization, specialization, and diversification. The function’s basic form is as follows:
L n Y i t = α 0 + α S L n S i t + α M L n M i t + α L L n L i t + α T L n T i t + α E L n E i t                                                                         + 1 2 α S S ( L n S i t ) 2 + 1 2 α M M ( L n M i t ) 2 + 1 2 α L L ( L n L i t ) 2                                                                         + 1 2 α T T ( L n T i t ) 2                                                                         + 1 2 α E E ( L n E i t ) 2 + α S M L n S i t L n M i t + α S L L n S i t L n L i t                                                                         + α S T L n S i t L n T i t + α S E L n S i t L n E i t + α M L L n M i t L n L i t                                                                         + α M T L n M i t L n T i t + α M E L n M i t L n E i t + α L T L n L i t L n T i t                                                                         + α L E L n L i t L n E i t + α T E L n T i t L n E i t + α d S d v L n S i t                                                                         + α d M d v L n M i t + α d L d v L n L i t + α d T d v L n T i t                                                                         + α d E d v L n E i t + μ i + ν t + ε i t
In Equation (10), L n Y i t is the natural logarithm of crop output for province i in year t; L n S i t , L n M i t , L n L i t , L n T i t , and L n E i t are the natural logarithms of agricultural socialized services, agricultural mechanization, labor input, land input, and other inputs, respectively; dv is a policy dummy variable (1 for years after 2014, 0 otherwise); α 0 is the intercept; α S , α M , α L , α T , and α E are the coefficients for the main effects; α S S , α M M , α L L , α T T , and α E E are coefficients for the quadratic terms; α S M , α S L , etc. are coefficients for the interaction terms; α d S , α d M , etc. are coefficients for the interaction between the policy dummy and each input; μ i is the province fixed effect; ν t is the time fixed effect; and ε i t is the error term. The translog function can be viewed as an approximation obtained by expanding the potential production function through a second-order Taylor series [84], providing high flexibility to capture nonlinear relationships and complex factor interactions.
Model estimation employs panel data regression with two-way fixed effects to control for both province-specific and time-specific unobserved heterogeneity. This approach addresses potential endogeneity concerns related to omitted variables that might be correlated with both agricultural socialized services and crop production.
Robust standard errors clustered at the provincial level are used to address potential heteroskedasticity and serial correlation in the error terms. All variables are log-transformed (except the binary policy variable) to facilitate elasticity interpretation and mitigate potential non-normality in the data distribution. Variance inflation factors were calculated to assess multicollinearity, with all values below the conventional threshold of 10 after variable centering, indicating acceptable levels of correlation among predictors.

3.3.2. Calculation of Input–Output Elasticities

Following model estimation, we calculate the input–output elasticities of agricultural socialized services and labor using Equations (11) and (12). These elasticities, which represent the percentage change in output associated with a one percent change in the respective input, provide direct measures of the relative productivity of different inputs across regions and crop types. Unlike the regression coefficients, which capture direct and interactive effects in the model, these calculated elasticities incorporate both the direct effects and the interaction effects to provide comprehensive measures of input contributions to output.
ε S = d L n Y i t / d L n S i t = α S + α S S L n S i t + α S M L n M i t + α S L L n L i t + α S T L n T i t + α S E L n E i t
ε L = d L n Y i t / d L n L i t = α L + α L L L n L i t + α S L L n S i t + α M L L n M i t + α L T L n T i t + α L E L n E i t

3.3.3. Technical Elasticity of Substitution Analysis

To quantify the substitution relationship between agricultural socialized services and labor, this study calculates the technical elasticity of substitution using Equation (13). This measure, which captures the percentage change in input ratios relative to percentage changes in marginal rates of technical substitution, provides a direct indicator of substitution intensity. Positive values indicate substitution relationships, while negative values denote complementary relationships.
σ S L = [ 1 + ( 2 α S L ε S ε L α S S ε L ε S α L L ) ( ε S ε L ) 1 ] 1

3.4. Threshold Effect Modeling

To examine this issue with greater empirical rigor, this study employs a threshold regression model. Specifically, we use the number of farm households operating farmland with an area of 30 mu or more (transformed by natural logarithm) as the threshold variable to explore the relationship between agricultural socialized services, farmland scale operation, and total crop production. The regression model is specified as follows:
l n Y = δ 0 + δ 1 l n S i t × I ( C i t T H ) + δ 2 l n S i t × I ( C i t > T H ) + δ i l n X i t + ε i t
where T H denotes the threshold to be estimated and C i t is the threshold variable. Once the optimal threshold is identified, separate regression coefficients are estimated for observations below and above the threshold. This approach enables quantification of how the relationship between agricultural socialized services and crop production changes across different operational scales, providing empirical evidence of scale-dependent effects.

4. Results and Discussion

4.1. The Impact of Agricultural Socialized Services on Crop Output

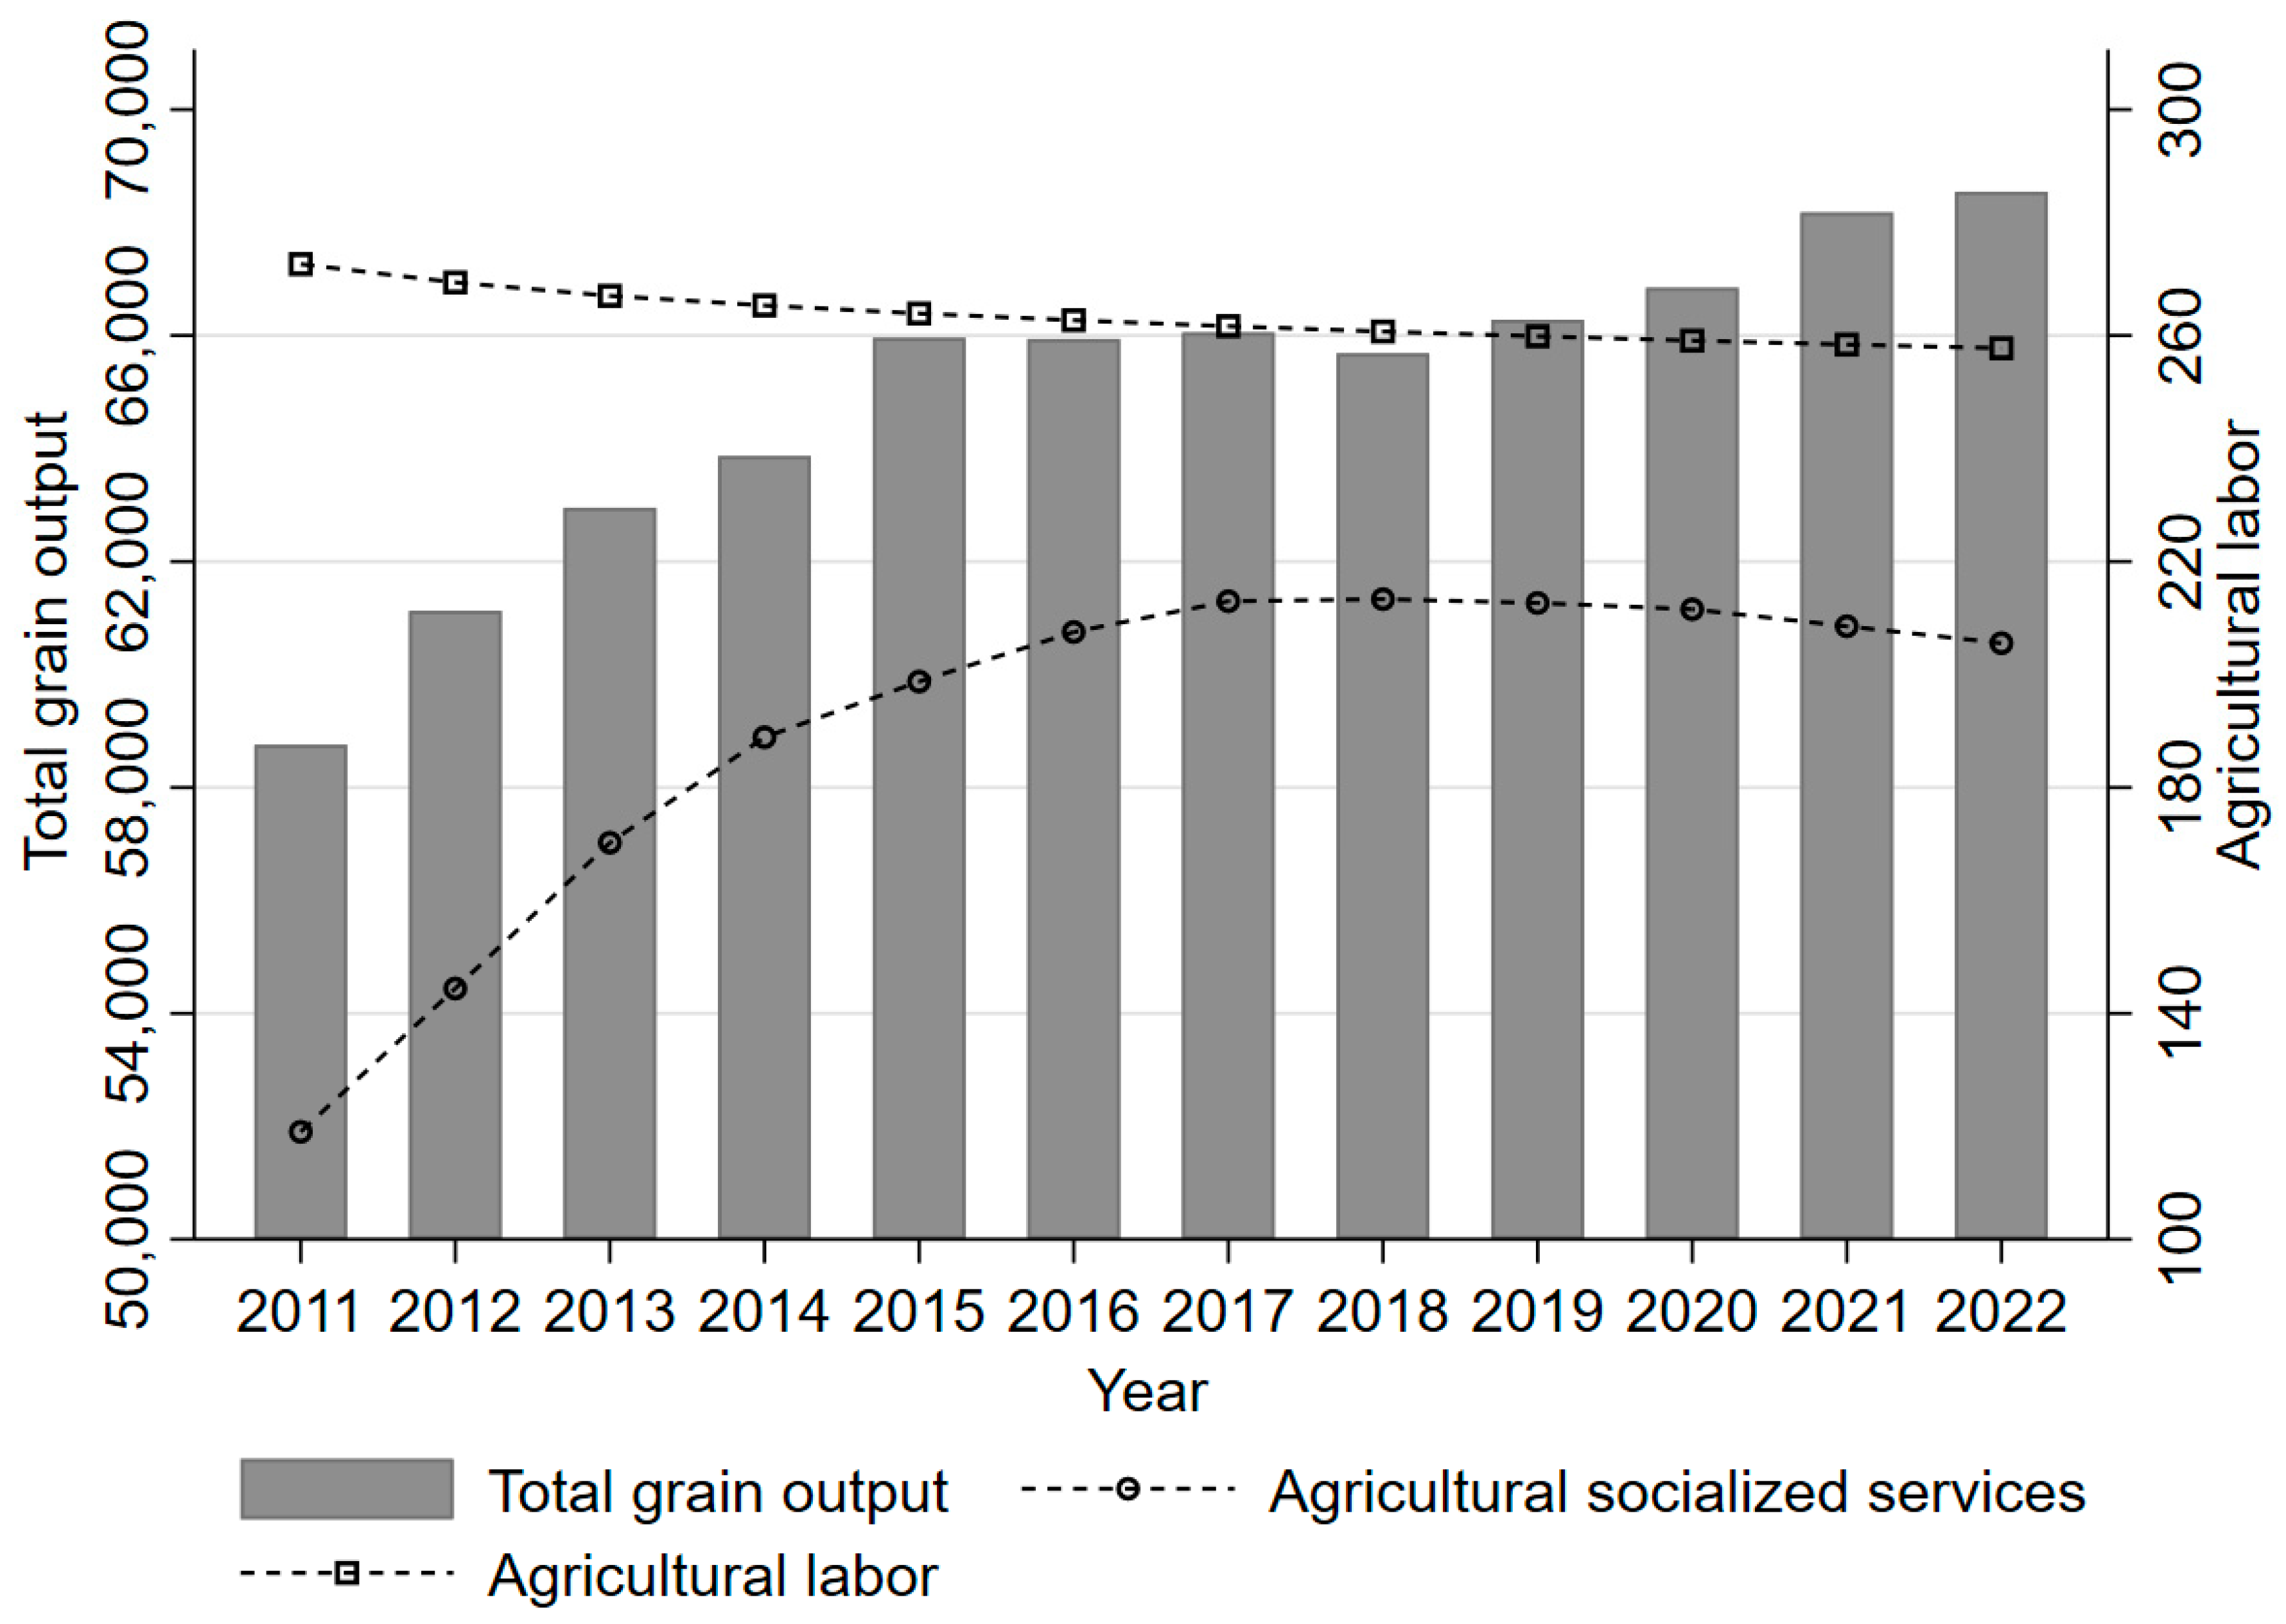
4.1.1. The Impact of Agricultural Socialized Services on Total Crop Output

Table 2 reveals the differential impacts of production factors on total crop output across geographical regions. At the national level, agricultural socialized service inputs, agricultural mechanization, and labor inputs demonstrate varying effects on crop production.
Agricultural socialized services exhibit a robust positive contribution with a coefficient of 0.544 (p < 0.01), aligning with recent studies that demonstrate these services are crucial in boosting crop production by addressing land cultivation and farming method challenges. This positive effect has been confirmed in provincial panel data spanning 2011–2020, with researchers noting that agricultural socialized services play a pivotal role in providing essential support to smallholder farmers in grain-producing regions [29].
Agricultural mechanization shows a significant negative effect with a coefficient of −2.158 (p < 0.01), which contrasts with some existing literature. Winarno et al. (2025) found that agricultural labor transfer actually leads farmers to increase mechanical inputs and expand crop acreages, thereby increasing crop output rather than decreasing it [85]. Additionally, recent studies examining the green total factor productivity (GTFP) of grain in China from 2001 to 2019 found a consistent upward trend between agricultural mechanization and grain productivity, with a positive spatial correlation between them [86]. However, supporting our findings, some researchers have noted that agricultural mechanization has led to a significant decline in local gross domestic product by changing the sector’s production structure, with mechanization leading to cash crops being increasingly replaced by grain crops and reducing total agricultural output in some cases [87]. The negative coefficient in our study suggests that the current deployment of agricultural mechanization may be suboptimal, possibly due to inefficient allocation, inappropriate technology selection, or implementation challenges. Nevertheless, all three factors play interconnected roles in China’s agricultural modernization.
Labor inputs show a significant positive effect on crop production (coefficient = 1.104, p < 0.01), highlighting the continued importance of China’s traditional labor-intensive agricultural model. This finding is consistent with research showing that even as farmers participate in non-agricultural employment, households maintain agricultural productivity by applying mechanization selectively, with mechanization paths—including both self-purchased machinery and machinery leasing—serving as substitutes for traditional labor without completely eliminating its importance [88]. The substantial negative quadratic term (coefficient = −0.634, p < 0.01) indicates significant diminishing returns from additional labor inputs, reflecting the challenges of labor-driven agricultural growth amid accelerating rural–urban migration, workforce aging, and rising labor costs. The crop sown area shows a significant positive effect (coefficient = 1.407, p < 0.01), indicating that expanding the cultivation area remains an effective strategy for increasing production despite land resource constraints. Interestingly, fertilizer input demonstrates a negative but non-significant effect (coefficient = −0.413), suggesting mixed outcomes from current fertilizer application practices and highlighting the need for more precise, sustainable input management.
The negative coefficient of the agricultural socialized services quadratic term (−0.119, p < 0.01) indicates diminishing marginal returns as service inputs increase, suggesting that while initial investments yield substantial productivity gains, their marginal contribution decreases at higher input levels—possibly resulting from resource allocation inefficiencies, quality limitations, or technology adoption barriers across diverse regions. This observation is consistent with research indicating that the effectiveness of agricultural socialized services varies based on regional factors such as grain cultivation proportions and internet penetration rates.
Notably, the interaction term between agricultural socialized services and labor (lnS × lnL) demonstrates a significant negative coefficient (−0.152, p < 0.01) at the national level, providing empirical validation for the substitution effect of agricultural socialized services on agricultural labor. This aligns with research showing that China has achieved a comprehensive agricultural mechanization rate of 71.25% despite only 16.64% of farmers directly investing in agricultural machinery, highlighting how agricultural mechanization services (AMS) provide farmers with cost-effective alternatives to traditional labor-intensive production methods [89]. This negative interaction suggests that as agricultural socialized service inputs increase, the marginal productivity contribution of labor decreases, confirming our hypothesis that farmers are increasingly substituting traditional labor inputs with specialized agricultural services. Studies have further demonstrated this substitution effect is particularly beneficial for small-scale farmers, with research finding that “APS can enable different farmers to have similar production management methods, thereby eliminating the income gap between farmers with lower and higher grain yields” [90]. This substitution effect reflects the ongoing structural transformation in China’s agricultural sector, where rising labor costs and rural–urban migration are driving the adoption of more efficient, service-based production models.
The interaction between the land reform policy dummy variable and agricultural socialized services yields a non-significant negative coefficient (−0.015), indicating that land system reforms implemented since 2014 have not significantly enhanced service accessibility and effectiveness at the national level as might have been expected. This finding suggests that while these reforms have facilitated land consolidation and operational scale expansion, they have not yet fully translated into improved service utilization across all regions. Similarly, the positive but non-significant interaction coefficient between the policy dummy and agricultural labor force (0.114) suggests that land reforms may have modestly enhanced farmer motivation and improved labor allocation efficiency, though the effect has not reached statistical significance at the national level.
Regional analysis reveals distinct patterns that illuminate spatial heterogeneity in China’s agricultural development. In major production areas, fertilizer inputs exhibit a significant positive effect on grain production (9.126, p < 0.01), highlighting fertilizer’s crucial role in yield enhancement within these productivity-focused regions. Strikingly, agricultural socialized services (−4.935, p < 0.01), labor inputs (−7.321, p < 0.01), and sown area (−5.271, p < 0.10) all demonstrate significant negative effects, while agricultural mechanization shows a positive but non-significant effect (1.810). These patterns suggest complex production dynamics and potential resource misallocation or production inefficiencies in these regions’ current development model. The significant negative interaction between agricultural socialized services and labor (lnS × lnL = −0.394, p < 0.01) in main grain-producing areas reveals an even stronger substitution effect than at the national level, indicating that in these productivity-oriented regions, the transition from labor-intensive to service-oriented production models is occurring more rapidly and intensively. This enhanced substitution effect likely stems from greater service availability, more advanced technological integration, and stronger policy support in these economically critical agricultural regions [91].
The non-significant interaction coefficient between policy variables and agricultural socialized services in major production areas (−0.018) further suggests incomplete synergy between land system reforms and agricultural service development, whereas the significant positive interaction between policy and agricultural mechanization (0.148, p < 0.05) indicates that land reforms have successfully enhanced mechanization effectiveness in these regions. Additionally, the significant positive coefficient (0.299, p < 0.05) for the policy-agricultural labor force interaction demonstrates that land reforms have successfully enhanced farmer motivation and operational efficiency within these regions, partially offsetting the negative main effect of labor inputs.
In contrast, non-major production areas exhibit distinctly different patterns. Agricultural socialized services show a significant positive coefficient (2.142, p < 0.01), whereas agricultural mechanization demonstrates a significant negative effect (−2.193, p < 0.01), demonstrating differential impacts of these technological inputs across regional contexts. The positive effect of socialized services suggests they effectively address farmer needs and have achieved significant improvements in service relevance and effectiveness, contributing to stable crop production growth despite less favorable agricultural conditions. Interestingly, the interaction between agricultural socialized services and labor (lnS × lnL) in non-major production areas shows a positive but non-significant coefficient (0.066), indicating that the labor substitution effect observed at the national level and in major production areas is not yet prominent in these regions. This regional heterogeneity suggests that the transition toward service-based production models may be progressing at different rates across China’s diverse agricultural landscape, with non-major production areas potentially facing implementation barriers such as limited service accessibility, insufficient technical support, or regional economic constraints.

4.1.2. Impact of Agricultural Socialized Services on the Output of Different Crop Types

Table 3 demonstrates the differential impact of agricultural socialized services on various crop categories across regions. At the national level, regression analysis reveals that agricultural socialized services show significant positive contributions to cereal crops (coefficient = 0.650, p < 0.01) and legume crops (coefficient = 1.708, p < 0.01), while exhibiting a negative but non-significant effect on tuber crops (coefficient = −0.222). Agricultural mechanization demonstrates significant negative effects on cereal production (−3.346, p < 0.01), non-significant negative effects on legumes (−0.792), and positive effects on tubers (4.671). These findings indicate that agricultural socialized services enhance production efficiency primarily in cereal and legume cultivation, with substantially stronger effects for legumes, where the elasticity coefficient is more than twice that of cereals. The quadratic term for cereal crops is significantly negative (−0.192, p < 0.01), indicating diminishing returns to scale, whereas the positive quadratic term for tubers (0.407, p < 0.01) suggests increasing returns to scale, implying that a threshold level of service inputs may be necessary before benefits materialize in tuber production.
The interaction between agricultural socialized services and labor inputs (lnS × lnL) reveals significant negative coefficients for cereals (−0.227, p < 0.01) and legumes (−0.678, p < 0.01), providing empirical evidence that agricultural socialized services effectively substitute for agricultural labor in these crop categories. The substitution effect is notably stronger for legumes than for cereals, indicating that legume production may be more amenable to labor-saving technologies and specialized services. Conversely, the significant positive interaction coefficient for tubers (0.792, p < 0.01) indicates a complementary relationship between services and labor in tuber cultivation, suggesting that the labor substitution effect varies substantially across different crop types.
Labor inputs show significant positive effects on crop production for cereals (1.137, p < 0.01) and legumes (8.740, p < 0.01) while showing a non-significant negative effect for tubers (−0.396). This pattern reflects the differential labor intensity across crop categories, with legume production being particularly responsive to labor inputs. For agricultural mechanization and labor, the interaction shows a non-significant negative effect for cereals (−0.186), a significant positive effect for legumes (1.560, p < 0.01), and a non-significant positive effect for tubers (0.443), revealing crop-specific patterns of complementarity and substitution between these inputs. Sown area effects exhibit significant variation across crop types, with a positive effect for cereals (1.848, p < 0.01), a negative effect for legumes (−4.170, p < 0.01), and a positive but non-significant effect for tubers (2.107). These findings suggest that area expansion remains effective for cereals, while legume production requires more focused attention to soil quality improvement and technical support rather than simple area expansion.
Regional analysis reveals distinct patterns in agricultural input effectiveness. In major production areas, socialized services show a significant positive impact on cereal production (2.390, p < 0.01) and legume production (3.691, p < 0.01), but a non-significant effect on tuber production (0.817). In contrast, non-major production areas display a significant negative effect of socialized services on cereal production (−5.311, p < 0.01) and non-significant negative effects on legumes (−1.734) and tubers (−1.905). This regional heterogeneity indicates that the effectiveness of agricultural socialized services is highly context-dependent, likely influenced by regional infrastructure, service quality, and alignment with local production systems.
The interaction between socialized services and labor (lnS × lnL) exhibits intriguing regional variations. In major production areas, this interaction is significantly positive for cereals (0.175, p < 0.01) but significantly negative for legumes (−1.039, p < 0.01) and tubers (−1.745, p < 0.01). This suggests that in these productivity-focused regions, agricultural socialized services complement labor in cereal production but substitute for labor in legume and tuber cultivation. The strong substitution effect for legumes in major production areas is particularly noteworthy, as it indicates that specialized services may be especially effective at replacing traditional labor inputs in legume production systems where service infrastructure is well-developed. In non-major production areas, the interaction is significantly negative for cereals (−0.426, p < 0.01) but non-significant for legumes (0.321) and tubers (0.400), indicating that the labor substitution effect of agricultural socialized services for cereal production is actually stronger in these peripheral regions, possibly reflecting greater labor constraints and higher incentives for service adoption.
Labor input analysis shows a highly significant positive coefficient for tuber crops in major production areas (19.279, p < 0.01), reflecting the labor-intensive nature of tuber cultivation in these established agricultural areas. In non-major production areas, cereal production exhibits significantly negative labor input coefficients (−6.374, p < 0.05), suggesting potential labor resource misallocation. These contrasting patterns highlight the complex regional dynamics of agricultural labor utilization, which may explain the varying degrees of labor substitution achieved through agricultural socialized services across different regions.
Fertilizer inputs demonstrate varying significance across regions and crop types. In major production areas, fertilizer shows mostly non-significant effects, while in non-major production areas, fertilizer shows a significant positive effect on cereal crops (7.967, p < 0.01) and legumes (10.858, p < 0.10). This regional variation in fertilizer effectiveness suggests that scientific application enables more effective soil nutrient management in non-major production areas, where appropriate fertilizer use may help overcome inherent soil quality limitations.
The interaction terms between policy variables and agricultural inputs reveal important temporal dynamics. For cereals at the national level, the marginally significant positive interaction coefficient for socialized services (0.064, p < 0.10) indicates that land reform policies have slightly enhanced the effectiveness of agricultural socialized services over time. However, the significant negative interaction between socialized services and tubers (−0.736, p < 0.01) suggests that policy reforms have had differential effects across crop types, highlighting the need for more nuanced and crop-specific policy approaches.

4.2. Robustness Test

To verify the positive impact of agricultural socialized services on crop production, two distinct robustness tests were conducted. First, an alternative explanatory variable was employed by choosing the number of agricultural mechanization service organizations as an alternative indicator, as it effectively reflects the scope and quality of professional service provision while maintaining consistency in methodology. Second, the Cobb–Douglas production function was utilized as an alternative regression model. This widely established functional form offers several advantages for robustness testing: it provides a more parsimonious specification than the main translog model, allows for direct interpretation of coefficients as elasticities, and imposes different structural assumptions about the relationships between inputs. By testing the hypotheses under this alternative functional form, verification can be made whether the findings remain consistent under different modeling approaches. The results are shown in Table 4.
As shown in Table 4, when replacing the explanatory variable, the estimated coefficient of agricultural socialized services (lnS) on total crop output is 0.108, which is positive and significant at the 1% level. This confirms the theoretical framework that agricultural socialized services enhance productivity and reduce land abandonment. The crop-specific results further support the main findings. For cereal crops, the services coefficient (0.097, p < 0.05) shows a positive and significant impact. For legumes, the coefficient (0.468, p < 0.01) remains strongly positive and highly significant, while for tubers, the coefficient (0.119) is positive but non-significant, suggesting more variable effects across production contexts.
In the second robustness test using the Cobb–Douglas production function as an alternative regression model, the coefficient of agricultural socialized services on total crop output is 0.176, which is positive and significant at the 1% level. The crop-specific results show positive and significant effects for cereals (0.201, p < 0.01) and legumes (0.226, p < 0.01). Interestingly, for tubers, the coefficient (−0.278, p < 0.01) is negative and significant, suggesting a complex relationship between socialized services and tuber production, which may be influenced by specific technological or management factors unique to this crop category.
These consistent results across different variable specifications and model formulations demonstrate that agricultural socialized services effectively promote production across diverse crop systems, though with varying magnitudes and significance levels that reflect crop-specific production characteristics.

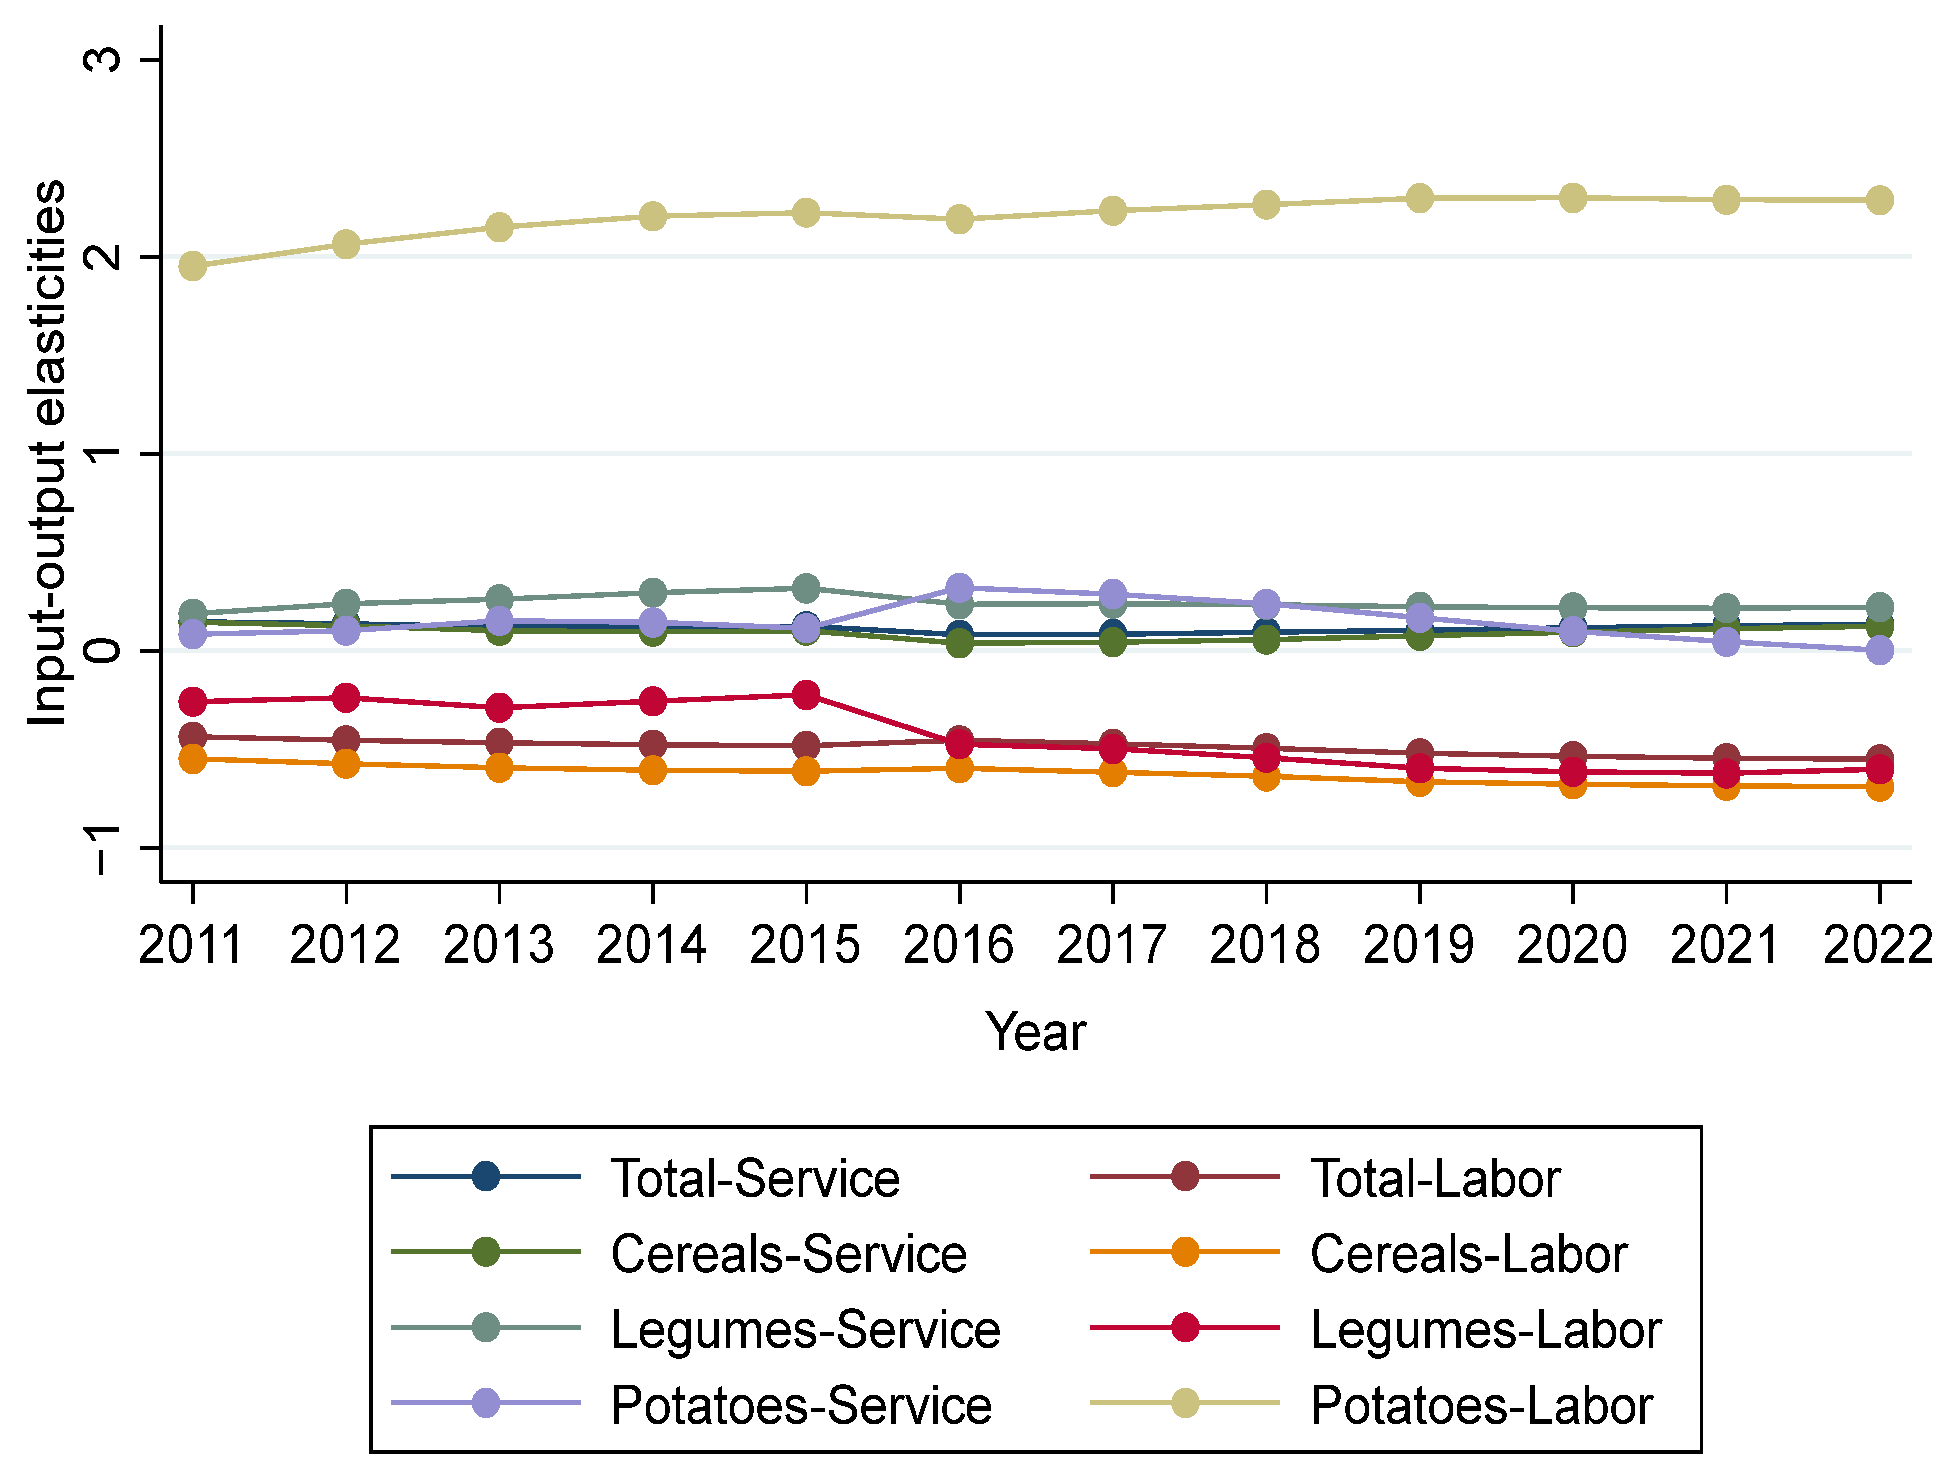
4.3. Input–Output Elasticity of Agricultural Socialized Services and Labor Force

The estimated coefficients from Table 2 and Table 3 were substituted into Equations (11) and (12) to calculate agricultural socialization and labor input–output elasticities across regions and crop varieties for each year (Figure 5 and Figure 6). To account for varying input–output elasticities with factor inputs, the calculations utilize annual average factor input values.
At the national level (Figure 5), agricultural socialized services exhibit consistently positive input–output elasticities across all crop types from 2011 to 2022, confirming their positive contribution to agricultural production efficiency. This finding indicates that investments in these services generate positive output returns across diverse agricultural systems. Notably, tuber crops demonstrate the highest input–output elasticity for agricultural socialized services among all crop types, indicating superior yield responsiveness to incremental service inputs. This suggests that allocating additional service resources to tuber production would yield proportionally larger output gains, reflecting exceptional efficiency potential in these production systems.
In contrast, labor input–output elasticity shows negative values for all crops except tubers (Figure 6), indicating that merely increasing labor quantities fails to enhance yields for most crop types. This pattern reflects diminishing marginal returns to labor in modern agricultural production, driven by technological advancement and increasing operational scale. These structural changes have reduced traditional labor’s productivity contribution while elevating socialized services as critical efficiency drivers.
Regional analysis (Figure 6) reveals that major production areas demonstrate higher positive input–output elasticities of agricultural socialized services for both total crop and cereal production compared to non-major production areas. This regional pattern demonstrates that agricultural socialized services function as productivity-enhancing factors, particularly in specialized production regions, where their economic value is maximized through integration with large-scale, intensive agriculture. The enhanced significance for cereals likely stems from their larger production scale and higher technological requirements, creating a more urgent demand for agricultural socialized services.
While non-major production areas show positive but significantly lower elasticity coefficients, the consistent positive values indicate that socialized services contribute to productivity enhancement even in less favorable agricultural contexts, albeit with more modest economic returns.
These findings align with theoretical predictions regarding the evolving role of production factors in modernizing agricultural systems. The consistently positive elasticity values for agricultural socialized services confirm their critical role as productivity drivers in contemporary agriculture, while the predominantly negative labor elasticity values underscore the fundamental transformation in production techniques from labor-intensive to knowledge-intensive, technology-driven systems.

4.4. Substitution Intensity of Agricultural Socialized Services for Labor Force

This paper applies Equation (13) to calculate the technical elasticity of substitution of “service-labor” in the production process of total crop output and three major crop varieties, with the results of the calculation presented at the national level and by region in Table 5 and Table 6.

4.4.1. Substitution Intensity of Agricultural Socialized Services for Labor in the Production Process of Total Crop Output

Analysis of the 2011–2022 period (Table 5) reveals significant substitution patterns between agricultural socialized services and labor inputs. At the national level, the elasticity of substitution remained consistently positive, increasing from 0.115 to 0.125, indicating a strengthening substitution effect over time. These positive coefficients demonstrate that agricultural socialized services effectively substitute for traditional labor inputs in crop production systems, critically maintaining or enhancing productivity amid rural–urban migration and workforce aging.
Major production areas displayed a dynamic transition from complementary to substitutive relationships. Initially showing negative substitution elasticity (−0.153 in 2011), these regions experienced a structural shift to positive values by 2016 (0.044), which continued to strengthen to 0.059 by 2022. This shift represents a fundamental transformation in production relationships in China’s most important agricultural regions. Through specialized service outsourcing, farmers can focus on core competencies and exploit comparative advantages, enhancing efficiency and optimizing resource allocation.
Non-major production areas exhibited more variable patterns, transitioning from positive (0.046 in 2011) to negative elasticity during 2013–2017, before returning to positive values (0.020 by 2022). This fluctuating pattern suggests these regions experienced a more complex adaptation process in integrating agricultural socialized services into their production systems.
These findings confirm Hypothesis 3: agricultural socialized services have progressively developed into effective labor substitutes, addressing agricultural labor shortages and contributing to agricultural modernization.

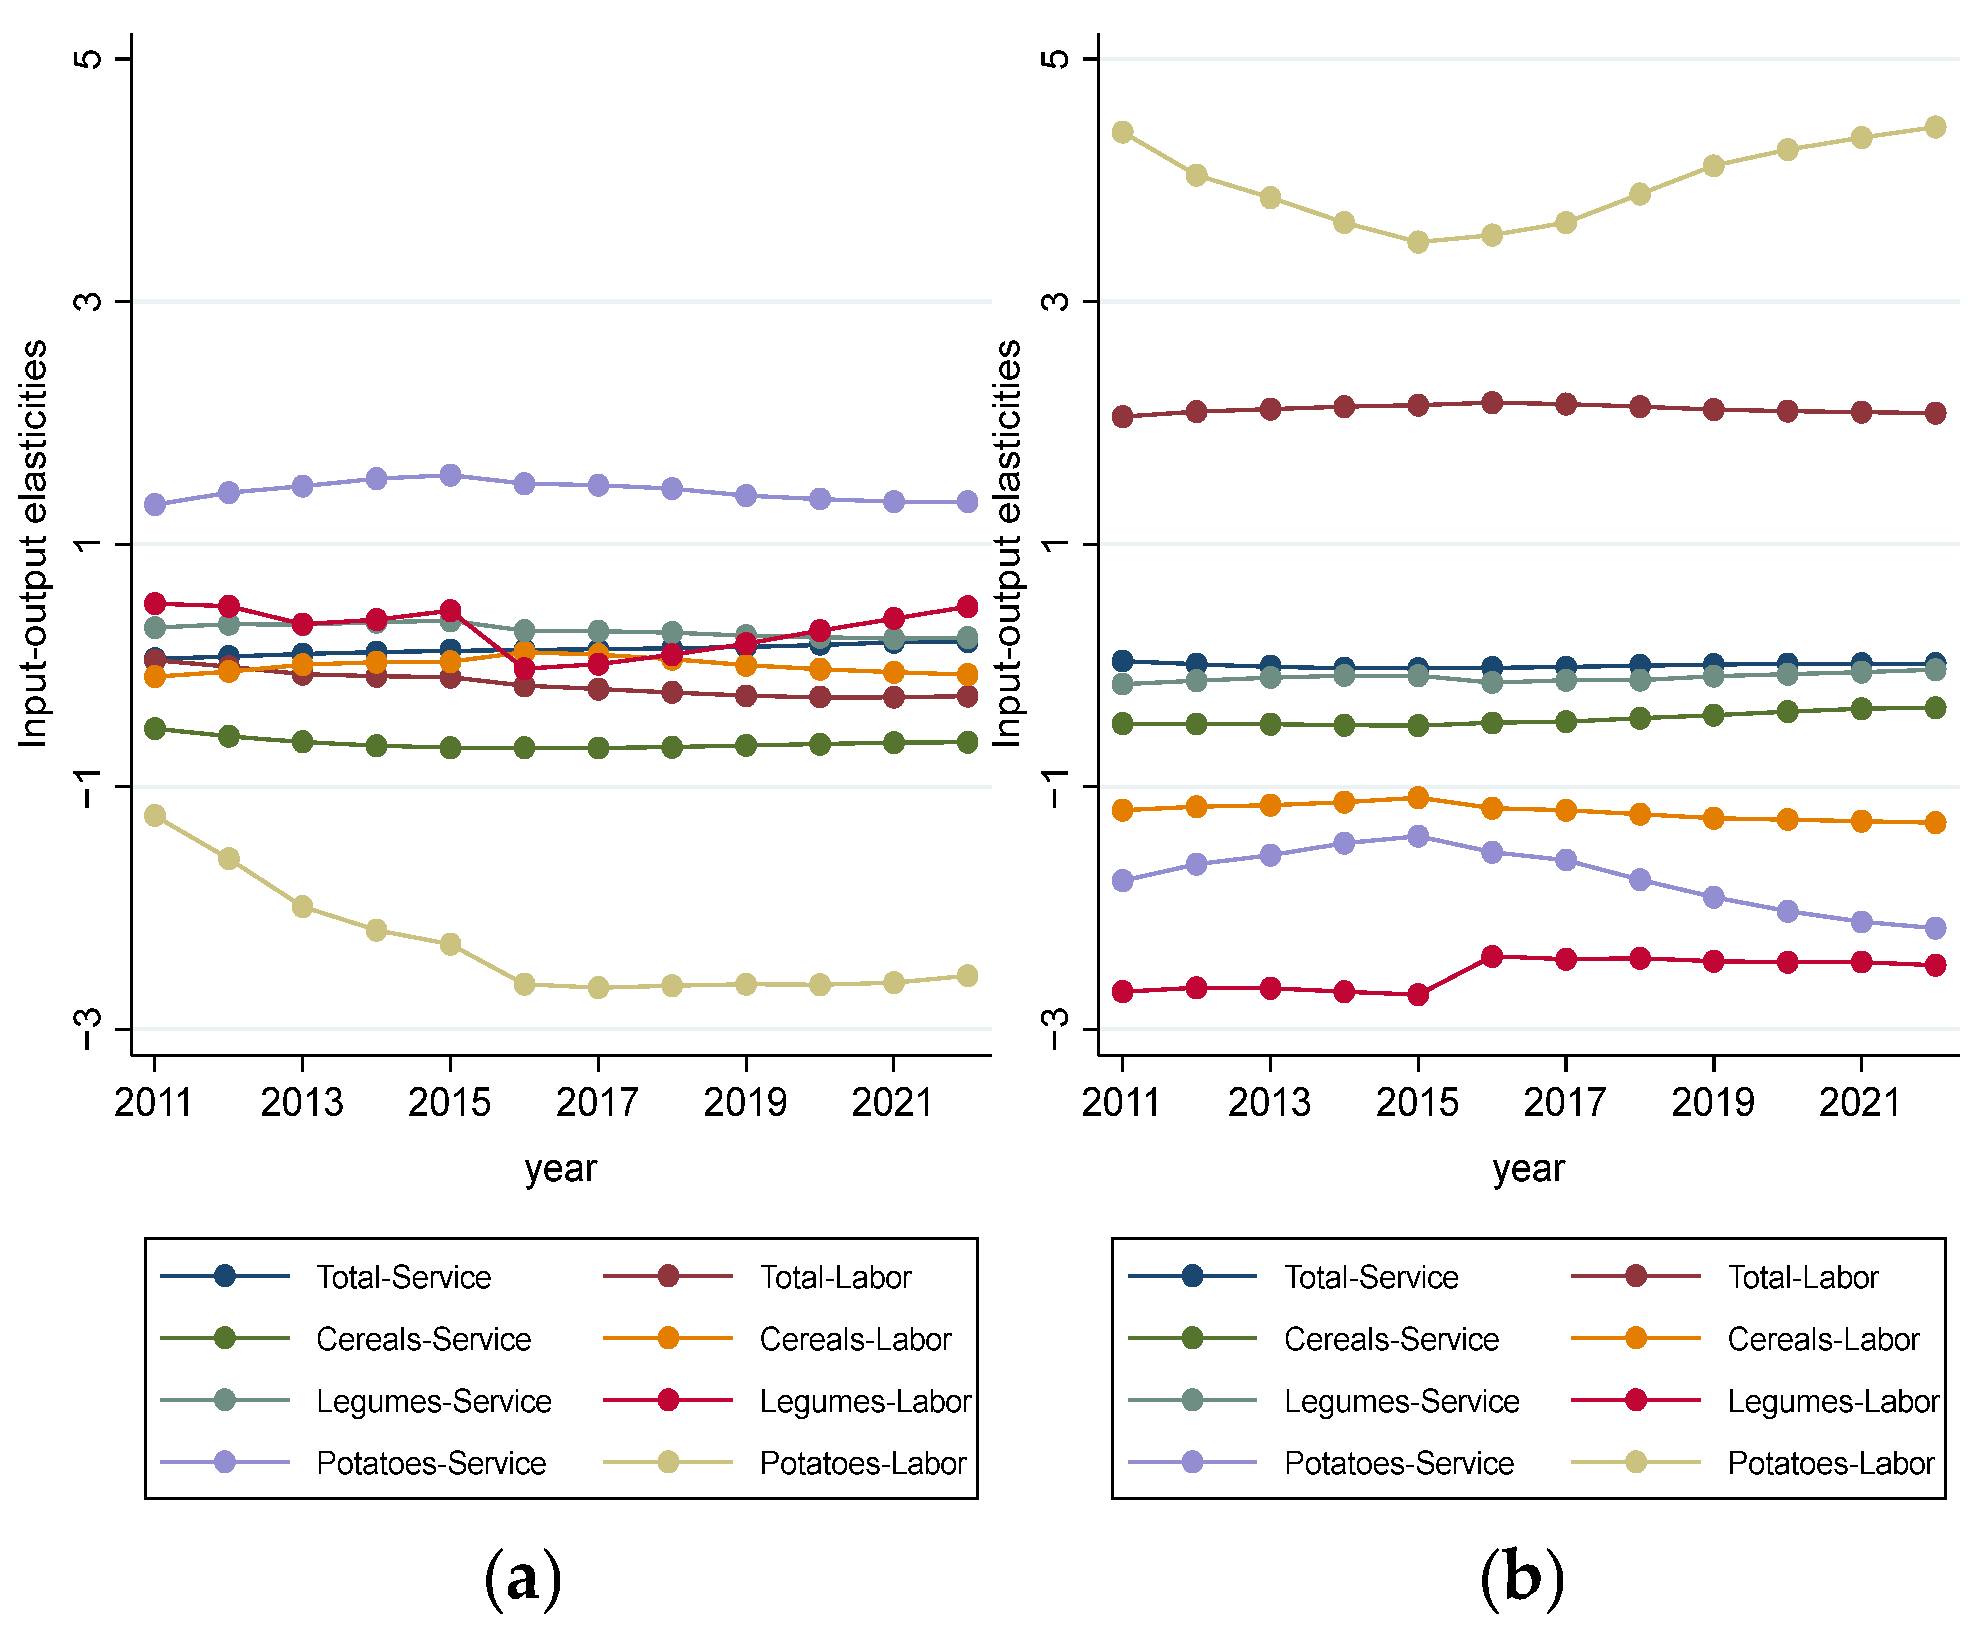
4.4.2. Substitution Intensity of Agricultural Socialized Services for Labor in the Production Process of Different Crop Types

Table 6 demonstrates that the “service-labor” substitution elasticity varies substantially across crop types. At the national level, cereal crops maintained positive elasticity throughout 2011–2022, ranging from 0.041 to 0.104, following a U-shaped trajectory with an initial decrease followed by recovery after 2016. This pattern likely reflects phased adjustments in production technology—an initial decline from implementation challenges followed by recovery as technologies matured.
For legumes, national-level elasticity fluctuated around zero, ranging from −0.029 to 0.042, indicating a weaker but still present substitution effect. In contrast, tuber crops consistently displayed negative elasticity (−0.002 to −0.256), signifying complementarity rather than substitution between services and labor inputs in tuber production.
Regional analysis reveals distinct patterns across agricultural zones. For cereal crops, major production areas demonstrated a complex evolutionary pattern, transitioning from strongly negative elasticity (−0.502 in 2011) to positive values during 2013–2019, before reverting to negative values (−0.416 by 2022). This non-linear development suggests ongoing technological adjustments and varying adoption rates across production cycles.
Notably, tuber crops in major production areas exhibited exceptionally high positive substitution elasticity, increasing substantially from 0.130 in 2012 to 1.466 by 2022, significantly contrasting with the national-level complementarity pattern. This regional divergence highlights the importance of localized factors, including superior infrastructure, technology diffusion networks, and targeted policy support, in determining substitution capabilities.
Non-major production areas demonstrate more stable but distinct patterns. Cereal crops maintained consistently high positive elasticity (0.720–0.785), indicating strong service-labor substitution even in less favorable agricultural contexts. Conversely, legumes displayed persistent negative elasticity (−0.014 to −0.070), while tubers showed moderate positive values (0.099–0.125).
These findings demonstrate that while agricultural socialized services have significantly influenced labor utilization across China’s agricultural systems, the substitution process varies markedly across crop varieties and regions. The effectiveness of service-labor substitution depends on production characteristics, regional conditions, technological foundations, and service maturity levels. These variations underscore the necessity for crop-specific and regionally targeted approaches when formulating agricultural modernization policies.

4.5. Adequate Scale Farming Under the Objective of Increasing Crop Production

While there is a general consensus in the academic community that the development of agricultural socialized services must be fundamentally rooted in the process of land operation scale, empirical evidence on this relationship remains limited [85]. Agricultural socialized services have demonstrated remarkable potential in promoting agricultural modernization, enabling farmers to effectively adopt agricultural machinery even under relatively small-scale conditions. This adoption greatly improves the fit between agricultural operational efficiency and farmers’ production needs, thereby weakening the external constraints imposed by the operational scale on the efficacy of agricultural socialized services. However, the extent to which this positive effect demonstrates that agricultural socialized services can universally adapt to and facilitate any scale of operation warrants systematic investigation.
Sequential estimation of single-threshold and double-threshold models was conducted to identify the optimal threshold structure. The results in Table 7 indicate that the single-threshold model achieves statistical significance at the 10% level, demonstrating its capacity to capture nonlinear relationships between variables. However, the double-threshold model yielded an F-value of 17.95 with a probability of 0.220, which fails to achieve statistical significance at conventional levels. This indicates that incorporating a second threshold does not significantly enhance the model’s explanatory power or provide additional insights. Nevertheless, considering both statistical and theoretical considerations, the analysis proceeded with a single-threshold model specification, while presenting the double-threshold results for comparative purposes.
Based on the estimated threshold (Table 8), the analysis reveals a significant difference in the impact of agricultural socialized services on crop production across farm scales. For operations below the threshold (lnO ≤ 4.117), the coefficient is 0.063 (p < 0.01), while for larger operations (lnO > 4.117), the coefficient increases to 0.073 (p < 0.01). This 15.9% increase in effectiveness demonstrates that agricultural socialized services achieve greater efficiency as operational size expands beyond the critical threshold.
These findings establish a clear positive correlation between the impact of agricultural socialized services and farm operational scale. The results indicate that the service–scale relationship follows a positive growth pattern without exhibiting diminishing returns at higher scales. This scale-dependent effectiveness has significant implications for agricultural policy design, suggesting that measures facilitating appropriate scale expansion—whether through land transfers or cooperative arrangements—could significantly enhance the effectiveness of investments in agricultural socialized services, thereby boosting crop production and strengthening food security.

5. Conclusions and Recommendations

5.1. Conclusions

In response to the challenges of labor shortages and rising costs, agricultural production is transitioning toward the substitution of labor by agricultural socialized services. Using data from 30 Chinese provinces (2011–2022), this research examines the impact of agricultural socialized services on labor input intensity and crop output across different crop varieties and regions. The findings reveal the following:
First, agricultural socialized services significantly enhance crop production performance. The implementation of land transfer policies and the promotion of large-scale farming have amplified the effectiveness of these services, thereby strengthening food security.
Second, the transition from traditional to modern agricultural production factors represents an inevitable trend in agricultural modernization. Agricultural socialized services consistently demonstrated positive contributions across various crop categories, including cereals (rice, wheat, corn, and barley), legumes, and tubers throughout the study period. Regional analysis reveals significant geographical differences: in major production areas, these services exhibit positive input–output elasticity for total crop output, legume crops, and potato crops, while in non-major production areas, they exhibit positive elasticity for total crop output.
Third, agricultural socialized services are gradually developing towards effective labor substitution. The overall positive value of the “service labor technology substitution elasticity” of the total crop output indicates a substitution relationship between services and labor inputs. The analysis of specific crop varieties shows that the technical elasticity of grain and legume substitutes in China exceeds zero, and the overall elasticity of legume and tubers crops in major production areas also exceeds zero. Similarly, cereal and tuber crops in non-major production areas typically maintain positive substitution elasticity.
Fourth, agricultural socialized services exhibit nonlinear threshold effects on productivity. Threshold effect modeling demonstrated that their impact on total crop production varies systematically with operational scale, showing progressive increases across different scale thresholds. This pattern suggests that service development can partially mitigate agriculture’s dependence on land scale. These scaling effects confirm that promoting service-driven operations is crucial for maximizing agricultural productivity.

5.2. Recommendations

Based on this, the following policy recommendations are put forward:
First, strengthen the agricultural socialized service system through comprehensive policy measures. Governments should implement targeted financial subsidies, tax incentives, and low-interest loans to encourage social capital investment in agricultural socialized services. Establishing regional service networks, digital matching platforms, and public–private partnerships will optimize resource allocation and ensure convenient service access for farmers regardless of scale or location.
Second, develop differentiated strategies according to regional and crop-specific characteristics. In major production areas, prioritize services for cereal crops, including mechanized farming, precision irrigation, and harvest management systems, with particular support for large-scale agricultural machinery acquisition. In non-major production areas, implement customized solutions for specialty crops such as tubers through specialized technical guidance, storage facilities, and market access services. Support should target small and medium-sized agricultural machinery designed for specialty crop production and develop crop-specific technical service teams to enhance regional competitive advantages.
Third, enhance technological innovation and knowledge dissemination systems for agricultural socialized services. Increase investment in agricultural mechanization and intelligent technology research, particularly addressing technical barriers to tubers crop mechanization. Establish comprehensive technology promotion networks, including demonstration gardens, technical training centers, and digital learning platforms. Develop human capital through specialized education programs and industry–academia partnerships to cultivate skilled professionals in both technical and managerial aspects of modern agricultural services.
Finally, implement a comprehensive policy framework to support sustainable development of agricultural socialized services. Design tiered subsidy structures, risk-sharing mechanisms, and accessible financial instruments specifically for service providers based on scale, type, and regional focus. Simultaneously develop standardization systems through industry associations, certification programs, and regulatory frameworks to ensure service quality and reliability. Create knowledge-sharing platforms and implement monitoring protocols to continuously improve service effectiveness. These coordinated efforts will alleviate agricultural labor shortages while accelerating modernization, enhancing food security, and promoting rural revitalization.

6. Limitations

This article primarily examines the relationship between macro-level crop output, labor input–output, and agricultural socialized services, neglecting micro-level factors. Future research should investigate the relationship between crop output, labor input–output, and agricultural socialized services at the micro level to better assess the impact of agricultural socialized services on labor input and China’s crop production. In the context of rising labor costs, this article focuses on the impact of agricultural socialized services on the substitution effect of agricultural labor, without examining its potential impact on other production factors such as land costs and capital inputs. Future research should explore the impact of other production factors on grain yield and conduct an in-depth analysis of how multiple factors collectively facilitate the transformation of agricultural production methods.

Author Contributions

Conceptualization, Z.L.; methodology, Y.W. and R.L.; software, Z.L. and R.L.; validation, Y.W.; formal analysis, J.L.; investigation, Z.L., Y.W., and J.L.; resources, Z.L., R.L., and J.L.; data curation, Y.W.; writing—original draft preparation, Z.L.; writing—review and editing, Y.W. and R.L.; visualization, J.L.; supervision, Z.L., R.L., and J.L.; project administration, Z.L., R.L., and J.L.; funding acquisition, Z.L. All authors have read and agreed to the published version of the manuscript.

Funding

This study was funded by the Chinese National Funding of Social Sciences (No. 20BJY042).

Institutional Review Board Statement

Not applicable.

Data Availability Statement

The data presented in this study are available upon request from the corresponding author.

Conflicts of Interest

The authors declare no conflicts of interest.

References

  1. Cohen, B. Urbanization in developing countries: Current trends, future projections, and key challenges for sustainability. Technol. Soc. 2006, 28, 63–80. [Google Scholar] [CrossRef]
  2. Greene, J.M.; Wallace, J.; Williams, R.B.; Leytem, A.B.; O’Neill, B.C.; Wise, M.A.; Zhao, X. Labour Market Evolution is a Key Determinant of Global Agroeconomic and Environmental Futures. Nat. Food 2025, 6, 123–135. [Google Scholar] [CrossRef]
  3. World Bank. Agriculture for Development: World Development Report 2008; World Bank: Washington, DC, USA, 2007. [Google Scholar] [CrossRef]
  4. Zhang, K.H.; Song, S. Rural-urban migration and urbanization in China: Evidence from time-series and cross-section analyses. China Econ. Rev. 2003, 14, 386–400. [Google Scholar] [CrossRef]
  5. Liu, J.; Wang, M.; Yang, L.; Rahman, S.; Sriboonchitta, S. Agricultural Productivity Growth and Its Determinants in South and Southeast Asian Countries. Sustainability 2020, 12, 4981. [Google Scholar] [CrossRef]
  6. Wang, X.; Yamauchi, F.; Huang, J. Rising wages, mechanization, and the substitution between capital and labor: Evidence from small scale farm system in China. Agric. Econ. 2016, 47, 309–317. [Google Scholar] [CrossRef]
  7. Bai, Y.; Wei, Y.; Liao, R.; Liu, J. The Role of Agricultural Socialized Services in Unlocking Agricultural Productivity in China: A Spatial and Threshold Analysis. Agriculture 2025, 15, 957. [Google Scholar] [CrossRef]
  8. Hu, R.; Yang, Z.; Kelly, P.; Huang, J. Agricultural Extension System Reform and Agent Time Allocation in China. China Econ. Rev. 2009, 20, 303–315. [Google Scholar] [CrossRef]
  9. Li, X.; Zhu, M. The Role of Agricultural Mechanization Services in Reducing Pesticide Input: Promoting Sustainable Agriculture and Public Health. Front. Public Health 2023, 11, 1242346. [Google Scholar] [CrossRef]
  10. Lin, J.Y. Rural Reforms and Agricultural Growth in China. Am. Econ. Rev. 1992, 82, 34–51. Available online: https://www.jstor.org/stable/2117601 (accessed on 15 April 2025).
  11. Deininger, K.; Jin, S. The Potential of Land Rental Markets in the Process of Economic Development: Evidence from China. J. Dev. Econ. 2005, 78, 241–270. [Google Scholar] [CrossRef]
  12. Chen, T.; Rizwan, M.; Abbas, A. Exploring the Role of Agricultural Services in Production Efficiency in Chinese Agriculture: A Case of the Socialized Agricultural Service System. Land 2022, 11, 347. [Google Scholar] [CrossRef]
  13. Autor, D.H. Why Are There Still So Many Jobs? The History and Future of Workplace Automation. J. Econ. Perspect. 2015, 29, 3–30. [Google Scholar] [CrossRef]
  14. Fuglie, K.; Gautam, M.; Goyal, A.; Maloney, W.F. Harvesting Prosperity: Technology and Productivity Growth in Agriculture; World Bank: Washington, DC, USA, 2020. [Google Scholar] [CrossRef]
  15. Barrett, C.B.; Christiaensen, L.; Sheahan, M.; Shimeles, A. On the Structural Transformation of Rural Africa. J. Afr. Econ. 2017, 26, i11–i35. [Google Scholar] [CrossRef]
  16. Reardon, T.; Echeverria, R.; Berdegué, J.; Minten, B.; Liverpool-Tasie, S.; Tschirley, D.; Zilberman, D. Rapid Transformation of Food Systems in Developing Regions: Highlighting the Role of Agricultural Research & Innovations. Agric. Syst. 2019, 172, 47–59. [Google Scholar] [CrossRef]
  17. Olmstead, A.L.; Rhode, P.W. Reshaping the landscape: The impact and diffusion of the tractor in American agriculture, 1910–1960. J. Econ. Hist. 2001, 61, 663–698. [Google Scholar] [CrossRef]
  18. Ogunyiola, A.; Stock, R.; Gardezi, M. Precision agriculture and the future of agrarian labor in the US food system. Agric. Hum. Values 2025, 42, 383–403. [Google Scholar] [CrossRef]
  19. Paudel, G.P.; Nguyen, T.T.; Grote, U. Trade-offs between labour migration and agricultural productivity: Evidence from smallholder wheat systems in Nepal. J. Int. Dev. 2025, 37, 202–229. [Google Scholar] [CrossRef]
  20. Kołodziejczak, M. The Use of Agricultural Services in European Union Regions Differing in Selected Agricultural Characteristics. Agriculture 2024, 14, 2346. [Google Scholar] [CrossRef]
  21. Acemoglu, D.; Restrepo, P. The Race between Man and Machine: Implications of Technology for Growth, Factor Shares, and Employment. Am. Econ. Rev. 2018, 108, 1488–1542. [Google Scholar] [CrossRef]
  22. Torma, G.; Aschemann-Witzel, J. Social Acceptance of Dual Land Use Approaches: Stakeholders' Perceptions of the Drivers and Barriers Confronting Agrivoltaics Diffusion. J. Rural Stud. 2023, 97, 610–625. [Google Scholar] [CrossRef]
  23. Poulton, C.; Dorward, A.; Kydd, J. The Future of Small Farms: New Directions for Services, Institutions, and Intermediation. World Dev. 2010, 38, 1413–1428. [Google Scholar] [CrossRef]
  24. Liu, Y.; Liu, J.; Zhou, Y. Spatio-temporal Patterns of Rural Poverty in China and Targeted Poverty Alleviation Strategies. J. Rural Stud. 2017, 52, 66–75. [Google Scholar] [CrossRef]
  25. Yi, F.; Sun, D.; Zhou, Y. Grain Subsidy, Liquidity Constraints and Food Security—Impact of the Grain Subsidy Program on the Grain-Sown Areas in China. Food Policy 2015, 50, 114–124. [Google Scholar] [CrossRef]
  26. Zhang, X.; Davidson, E.A.; Mauzerall, D.L.; Searchinger, T.D.; Dumas, P.; Shen, Y. Managing Nitrogen for Sustainable Development. Nature 2015, 528, 51–59. [Google Scholar] [CrossRef]
  27. Pretty, J.; Bharucha, Z.P. Sustainable Intensification in Agricultural Systems. Ann. Bot. 2014, 114, 1571–1596. [Google Scholar] [CrossRef]
  28. Schimmelpfennig, D. Farm Profits and Adoption of Precision Agriculture; ERR-217; U.S. Department of Agriculture, Economic Research Service: Washington, DC, USA, 2016. [Google Scholar] [CrossRef]
  29. Zenbaba, O.S.; Ketema, M.; Jaleta, M.; Jemal, K. Impact of wheat production technology packages adoption on smallholder farmers' food security and income in Horo Guduru Wollega Zone, Ethiopia. J. Innov. Entrep. 2025, 14, 48. [Google Scholar] [CrossRef]
  30. Asante, B.O.; Prah, S.; Addai, K.N.; Anang, B.; Ng'ombe, J.N. Agricultural services and rural household welfare: Empirical evidence from Ghana. Int. J. Soc. Econ. 2025, 52, 157–176. [Google Scholar] [CrossRef]
  31. Zhou, K.; Zheng, X. How Does the Growth of Digital Technology Influence Farmland Abandonment? Evidence from Rural China. Sustainability 2025, 17, 2227. [Google Scholar] [CrossRef]
  32. Xu, Y.; Lyu, J.; Yuan, D.; Yin, G.; Zhang, J. The Impact of Agricultural Machinery Services on Food Loss at the Producer Level: Evidence from China. Agriculture 2025, 15, 263. [Google Scholar] [CrossRef]
  33. Xu, K.; Yi, X.; Zhou, L. Impacts of agricultural production services on green grain production efficiency: Factors allocation perspective. J. Environ. Manage 2025, 380, 125136. [Google Scholar] [CrossRef]
  34. Cai, B.; Liao, W.; Shi, F.; Abate, M.; Geremew, B.; Addis, A. Agricultural socialized services and Chinese food security: Examining the threshold effect of land tenure change. Front. Sustain. Food Syst. 2024, 8, 1371520. [Google Scholar] [CrossRef]
  35. Kostov, P.; Davidova, S.; Nikulina, Y.; Arefieva, V. Subsidies and Employment: Exploring the Experience of Corporate and Family Farms in Russia. East. Eur. Econ. 2023, 63, 537–563. [Google Scholar] [CrossRef]
  36. Megbowon, E.; Zerihun, M. Sectoral Labour Productivity and Unemployment in South Africa. Int. J. Bus. Ecosyst. Strategy 2025, 7, 131–141. [Google Scholar] [CrossRef]
  37. Foster, A.D.; Rosenzweig, M.R. Agricultural Productivity Growth, Rural Economic Diversity, and Economic Reforms: India, 1970–2000. Econ. Dev. Cult. Change 2004, 52, 509–542. [Google Scholar] [CrossRef]
  38. Zhang, Z.; Ding, J.; Zhang, K.; Deng, X. Impact of Aging on Farmland Abandonment: Evidence from Rural China. Land 2025, 14, 393. [Google Scholar] [CrossRef]
  39. Hammelman, C.; Chen, G.; Tontisirin, N.; Anantsuksomsri, S.; Moore, F.; Ly, S.; Birla, S.; Archambault, Z.; Fleming, E.; Gwanfogbe, J.; et al. The COVID-19 Pandemic's lasting consequences for tropical crop cultivation in Eastern Thailand. Appl. Geogr. 2025, 179, 103636. [Google Scholar] [CrossRef]
  40. Lowenberg-DeBoer, J.; Erickson, B. Setting the Record Straight on Precision Agriculture Adoption. Agron. J. 2019, 111, 1552–1569. [Google Scholar] [CrossRef]
  41. Okumu, B.; Radeny, M.; Cramer, L. Welfare Effects and Gender Dimensions of Adoption of Climate Smart Agriculture Practices: Evidence from Kenyan Small-Scale Farmers. World Dev. Sustain. 2025, 6, 100204. [Google Scholar] [CrossRef]
  42. Walter, A.; Finger, R.; Huber, R.; Buchmann, N. Smart Farming is Key to Developing Sustainable Agriculture. Proc. Natl. Acad. Sci. USA 2017, 114, 6148–6150. [Google Scholar] [CrossRef]
  43. Yamashita, R.; Kidoguchi, K.; Oshima, T.; Ishigaki, A. Sustainable paddy farming in rural Japan: Leveraging farmer integration and agricultural UAVs for synergistic solutions. J. Clean. Prod. 2024, 475, 143685. [Google Scholar] [CrossRef]
  44. Lee, Y.-G.; Han, K.; Chung, C.; Ji, I. Effects of Smart Farming on the Productivity of Korean Dairy Farms: A Case Study of Robotic Milking Systems. Sustainability 2024, 16, 9991. [Google Scholar] [CrossRef]
  45. de Janvry, A.; Sadoulet, E. Agricultural Growth and Poverty Reduction: Additional Evidence. World Bank Res. Obs. 2010, 25, 1–20. [Google Scholar] [CrossRef]
  46. Ragasa, C.; Mazunda, J. The Impact of Agricultural Extension Services in the Context of a Heavily Subsidized Input System: The Case of Malawi. World Dev. 2018, 105, 25–47. [Google Scholar] [CrossRef]
  47. Fabregas, R.; Kremer, M.; Schilbach, F. Realizing the Potential of Digital Development: The Case of Agricultural Advice. Science 2019, 366, eaay3038. [Google Scholar] [CrossRef]
  48. Birner, R.; Davis, K.; Pender, J.; Nkonya, E.; Anandajayasekeram, P.; Ekboir, J.; Mbabu, A.; Spielman, D.J. From Best Practice to Best Fit: A Framework for Designing and Analyzing Pluralistic Agricultural Advisory Services Worldwide. J. Agric. Educ. Ext. 2009, 15, 341–355. [Google Scholar] [CrossRef]
  49. Anderson, J.R.; Feder, G. Agricultural Extension: Good Intentions and Hard Realities. World Bank Res. Obs. 2004, 19, 41–60. [Google Scholar] [CrossRef]
  50. Barrett, C.B.; Carter, M.R.; Timmer, C.P. A Century-Long Perspective on Agricultural Development. Am. J. Agric. Econ. 2010, 92, 447–468. [Google Scholar] [CrossRef]
  51. Massrie, K.D. Why is the price of coffee rising globally? Future prospects for Ethiopian coffee. Front. Sustain. Food Syst. 2025, 9, 1545168. [Google Scholar] [CrossRef]
  52. Gouta, P.; Konstantidelli, V.; Henderson, S.; Tzouramani, I. Mapping stakeholders' perceptions of agroecological farming practices adoption in Crete, Greece. Environ. Sci. Policy 2025, 167, 104030. [Google Scholar] [CrossRef]
  53. Birthal, P.S.; Kumar, S.; Negi, D.S.; Roy, D. The Impacts of Information on Returns from Farming: Evidence from a Nationally Representative Farm Survey in India. Agric. Econ. 2015, 46, 549–561. [Google Scholar] [CrossRef]
  54. Tang, R.; Liu, Q.; Ou, Y. The Construction of a Socialized Service Platform and System for “Internet + Agriculture” in China. Platforms 2024, 2, 211–220. [Google Scholar] [CrossRef]
  55. Wang, X.; Yamauchi, F.; Huang, J.; Rozelle, S. What Constrains Mechanization in Chinese Agriculture? Role of Farm Size and Fragmentation. China Econ. Rev. 2020, 62, 101221. [Google Scholar] [CrossRef]
  56. Pingali, P. Agricultural Mechanization: Adoption Patterns and Economic Impact. Handb. Agric. Econ. 2007, 3, 2779–2805. [Google Scholar] [CrossRef]
  57. Diao, X.; Magalhaes, E.; Silver, J. Cities and Rural Transformation: A Spatial Analysis of Rural Livelihoods in Ghana. World Dev. 2019, 121, 141–157. [Google Scholar] [CrossRef]
  58. Zhang, X.; Yang, J.; Wang, S. China Has Reached the Lewis Turning Point. China Econ. Rev. 2011, 22, 542–554. [Google Scholar] [CrossRef]
  59. Fan, S.; Chan-Kang, C. Is Small Beautiful? Farm Size, Productivity, and Poverty in Asian Agriculture. Agric. Econ. 2005, 32, 135–146. [Google Scholar] [CrossRef]
  60. Huang, J.; Rozelle, S. Technological Change: Rediscovering the Engine of Productivity Growth in China's Rural Economy. J. Dev. Econ. 1996, 49, 337–369. [Google Scholar] [CrossRef]
  61. Benjamin, D.; Brandt, L. Property Rights, Labour Markets, and Efficiency in a Transition Economy: The Case of Rural China. Can. J. Econ. 2002, 35, 689–716. [Google Scholar] [CrossRef]
  62. Rozelle, S.; Taylor, J.E.; DeBrauw, A. Migration, Remittances, and Agricultural Productivity in China. Am. Econ. Rev. 1999, 89, 287–291. [Google Scholar] [CrossRef]
  63. Carter, M.R.; Yao, Y. Local versus Global Separability in Agricultural Household Models: The Factor Price Equalization Effect of Land Transfer Rights. Am. J. Agric. Econ. 2002, 84, 702–715. [Google Scholar] [CrossRef]
  64. Huang, J.; Rozelle, S. Environmental Stress and Grain Yields in China. Am. J. Agric. Econ. 1995, 77, 853–864. [Google Scholar] [CrossRef]
  65. Li, T.; Long, H.; Zhang, Y.; Tu, S.; Ge, D.; Li, Y.; Hu, B. Analysis of the Spatial Mismatch of Grain Production and Farmland Resources in China Based on the Potential-Cropping System. Land Use Policy 2017, 60, 26–36. [Google Scholar] [CrossRef]
  66. Huang, J.; Ding, J. Institutional Innovation and Policy Support to Facilitate Small-Scale Farming Transformation in China. Agric. Econ. 2016, 47, 227–237. [Google Scholar] [CrossRef]
  67. Zhang, X.; Yang, J.; Thomas, R. Mechanization Outsourcing Clusters and Division of Labor in Chinese Agriculture. China Econ. Rev. 2017, 43, 184–195. [Google Scholar] [CrossRef]
  68. Liu, Y.; Barrett, C.B.; Pham, T.; Violette, W. The Intertemporal Evolution of Agriculture and Labor over a Rapid Structural Transformation: Lessons from Vietnam. Food Policy 2020, 94, 101913. [Google Scholar] [CrossRef]
  69. Li, L.; Wang, C.; Segarra, E.; Nan, Z. Migration, Remittances, and Agricultural Productivity in Small Farming Systems in Northwest China. China Agric. Econ. Rev. 2013, 5, 5–23. [Google Scholar] [CrossRef]
  70. Deininger, K.; Jin, S.; Xia, F.; Huang, J. Moving Off the Farm: Land Institutions to Facilitate Structural Transformation and Agricultural Productivity Growth in China. World Dev. 2014, 59, 505–520. [Google Scholar] [CrossRef]
  71. Coelli, T.J.; Rao, D.S.P.; O'Donnell, C.J.; Battese, G.E. An Introduction to Efficiency and Productivity Analysis, 2nd ed.; Springer: New York, NY, USA, 2005. [Google Scholar] [CrossRef]
  72. Yang, J.; Huang, Z.; Zhang, X.; Reardon, T. The Rapid Rise of Cross-Regional Agricultural Mechanization Services in China. Am. J. Agric. Econ. 2013, 95, 1245–1251. [Google Scholar] [CrossRef]
  73. Otsuka, K.; Liu, Y.; Yamauchi, F. Growing Advantage of Large Farms in Asia and Its Implications for Global Food Security. Glob. Food Secur. 2016, 11, 5–10. [Google Scholar] [CrossRef]
  74. Liao, R.; Chen, Z.; Sirisrisakulchai, J.; Liu, J. Enhancing Rural Economic Sustainability in China Through Agricultural Socialization Services: A Novel Perspective on Spatial-Temporal Dynamics. Agriculture 2025, 15, 267. [Google Scholar] [CrossRef]
  75. Taylor, J.E.; Rozelle, S.; de Brauw, A. Migration and Incomes in Source Communities: A New Economics of Migration Perspective from China. Econ. Dev. Cult. Change 2003, 52, 75–101. [Google Scholar] [CrossRef]
  76. Fan, S.; Zhang, X.; Robinson, S. Structural Change and Economic Growth in China. Rev. Dev. Econ. 2003, 7, 360–377. [Google Scholar] [CrossRef]
  77. Ji, C.; Guo, H.; Jin, S.; Yang, J. Outsourcing agricultural production: Evidence from rice farmers in Zhejiang Province. PLoS ONE 2017, 12, e0170861. [Google Scholar] [CrossRef]
  78. Li, X.; Lee, H. An Analysis on the Determining Factors of Farmers’ Land-Scale Management: Empirical Analysis Based on the Micro-Perspective of Farmers in China. Land 2022, 11, 1278. [Google Scholar] [CrossRef]
  79. Wang, R.; Zhang, Y.; Zou, C. How Does Agricultural Specialization Affect Carbon Emissions in China? J. Clean. Prod. 2022, 370, 133463. [Google Scholar] [CrossRef]
  80. Li, B.; Qian, Y.; Kong, F. Does Outsourcing Service Reduce the Excessive Use of Chemical Fertilizers in Rural China? The Moderating Effects of Farm Size and Plot Size. Agriculture 2023, 13, 1869. [Google Scholar] [CrossRef]
  81. Diao, X.; Cossar, F.; Houssou, N.; Kolavalli, S. Mechanization in Ghana: Emerging Demand and the Search for Alternative Supply Models. Food Policy 2014, 48, 168–181. [Google Scholar] [CrossRef]
  82. Jin, S.; Ma, H.; Huang, J.; Hu, R.; Rozelle, S. Productivity, Efficiency and Technical Change: Measuring the Performance of China's Transforming Agriculture. J. Prod. Anal. 2010, 33, 191–207. [Google Scholar] [CrossRef]
  83. Christensen, L.R.; Jorgenson, D.W.; Lau, L.J. Transcendental Logarithmic Production Frontiers. Rev. Econ. Stat. 1973, 55, 28–45. [Google Scholar] [CrossRef]
  84. Dewan, S.; Min, C. The Substitution of Information Technology for Other Factors of Production: A Firm Level Analysis. Manag. Sci. 1997, 43, 1660–1675. [Google Scholar] [CrossRef]
  85. Winarno, K.; Sustiyo, J.; Aziz, A.A.; Permani, R. Unlocking Agricultural Mechanisation Potential in Indonesia: Barriers, Drivers, and Pathways for Sustainable Agri-Food Systems. Agric. Syst. 2025, 226, 104305. [Google Scholar] [CrossRef]
  86. Ma, W.; Liu, T.; Li, W.; Yang, H. The Role of Agricultural Machinery in Improving Green Grain Productivity in China: Towards Trans-Regional Operation and Low-Carbon Practices. Heliyon 2023, 9, e20279. [Google Scholar] [CrossRef] [PubMed]
  87. Zou, B.; Chen, Y.; Mishra, A.K.; Hirsch, S. Agricultural Mechanization and the Performance of the Local Chinese Economy. Food Policy 2024, 125, 102648. [Google Scholar] [CrossRef]
  88. Xu, G.; Ma, Y.; Qin, G.; Wang, Z.; Zhao, M.; Zhou, Y. Why Chinese Farmers Are Reluctant to Transfer Their Land in the Context of Non-Agricultural Employment: Insights from Agricultural Mechanization. Humanit. Soc. Sci. Commun. 2025, 12, 428. [Google Scholar] [CrossRef]
  89. Zhang, W. The Impact of Agricultural Machinery Services on Farmland Transfer: An Analytical Perspective Based on the Profitability of Grain Production. Front. Sustain. Food Syst. 2024, 8, 1431005. [Google Scholar] [CrossRef]
  90. Han, G.; Cui, W.; Chen, X.; Gao, Q. The Sustainability of Grain Production: The Impact of Agricultural Productive Services on Farmers' Grain Profits. Front. Sustain. Food Syst. 2024, 8, 1430643. [Google Scholar] [CrossRef]
  91. Zerihun, M.F.; Muchie, M.; Worku, Z. Determinants of Agroforestry Technology Adoption in Eastern Cape Province, South Africa. Dev. Stud. Res. 2014, 1, 382–394. [Google Scholar] [CrossRef]
Figure 1. Effect of agricultural socialized services in replacing agricultural laborers.
Agriculture 15 01151 g001
Figure 2. Relationship of labor inputs to crop output in the two-factor scenario.
Agriculture 15 01151 g002
Figure 3. Conceptual framework of the relationship between agricultural socialized services, labor inputs, and crop production.
Agriculture 15 01151 g003
Figure 4. Total crop output, number of agricultural socialized services, and number of people employed in agriculture (2011–2022).
Agriculture 15 01151 g004
Figure 5. Input–output elasticities of agricultural socialized services and labor at the national level.
Agriculture 15 01151 g005
Figure 6. Input–output elasticities of agricultural socialized services and labor in major production (a) and non-major production (b) areas.
Agriculture 15 01151 g006
Table 1. Descriptive statistics.
NationwideMajor Production AreasNon-Major Production Areas
MeanStd. Dev.MeanStd. Dev.MeanStd. Dev.
Total crop production (10,000 tons)2167.1981869.0873921.5691496.738832.503580.015
Cereal crop production (10,000 tons)2010.1341781.8183691.661404.756724.261522.925
Legume crop production (10,000 tons)60.906120.856111.789168.19821.99526.800
Tubers crop production (10,000 tons)95.859108.167109.470126.01585.45191.186
Agricultural mechanization service socialization service professional households (number of households)63,708.54092,333.9101,199,214.2116,746.521,263.0222,185.42
Total power of agricultural mechanization (10,000 kilowatts)3443.8492927.1315781.6362927.9871656.1291093.113
Number of people working in agriculture (10,000 units)877.363642.5621224.385643.840611.993500.354
Crops sown (1000 hectares)5514.6033902.2978867.1533013.9002950.8882179.93
Agricultural fertilizer inputs (10,000 tons)188.278143.095290.614137.820110.02186.637
Table 2. Estimates of the crop translog production function.
NationwideMajor Production AreasNon-Major Production Areas
lnS0.544 ***−4.935 ***2.142 ***
(0.164)(1.403)(0.225)
lnM−2.158 ***1.810−2.193 ***
(0.526)(2.726)(0.760)
lnL1.104 ***−7.321 ***1.008 *
(0.289)(2.395)(0.568)
lnT1.407 ***−5.271 *1.724 **
(0.448)(2.974)(0.713)
lnE−0.4139.126 ***0.109
(0.505)(2.412)(0.585)
lnS2−0.119 ***0.027−0.151 ***
(0.032)(0.043)(0.028)
lnM20.087−0.604 ***1.048 ***
(0.183)(0.226)(0.204)
lnL2−0.634 ***−0.088−0.815 ***
(0.211)(0.261)(0.280)
lnT2−0.689 ***0.655−0.697 *
(0.289)(0.678)(0.358)
lnE2−0.592 ***−0.401−0.672 ***
(0.132)(0.372)(0.130)
lnS × lnL−0.152 ***−0.394 ***0.066
(0.054)(0.144)(0.063)
lnS × lnM0.287 ***0.031−0.073
(0.048)(0.105)(0.047)
lnS × lnT0.0121.021 ***0.061
(0.076)(0.207)(0.065)
lnS × lnE−0.100 *−0.352 **−0.214 ***
(0.0.060)(0.143)(0.069)
lnM × lnL−0.248 **0.316 *−0.391 ***
(0.103)(0.181)(0.133)
lnM × lnT0.133−0.523−0.093
(0.132)(0.323)(0.155)
lnM × lnE−0.1750.983 ***−0.391 **
(0.170)(0.257)(0.152)
lnL × lnT0.430 ***0.537 **0.401 ***
(0.099)(0.225)(0.087)
lnL × lnE0.515 ***0.842 **0.642 **
(0.163)(0.342)(0.250)
lnT × lnE0.297 *−1.915 ***0.516 **
(0.160)(0.524)(0.213)
dv × lnS−0.015−0.018−0.024
(0.028)(0.051)(0.037)
dv × lnM0.0070.148 **−0.067
(0.064)(0.058)(0.088)
dv × lnL0.1140.299 **0.820 **
(0.094)(0.128)(0.332)
dv × lnT−0.057−0.410 **−0.435 **
(0.102)(0.176)(0.194)
dv × lnE−0.0500.071−0.276 *
(0.063)(0.101)(0.146)
_con−0.35748.821 ***−9.063 ***
(0.878)(9.631)(1.575)
Year FEYesYesYes
Province FEYesYesYes
N360360360
R20.9860.9640.994
Prob > F0.0000.0000.000
Note: *, **, and *** indicate significance at the level of 10%, 5%, and 1%, respectively.
Table 3. Estimates of the translog production function for different crop types.
NationwideMajor Production AreasNon-Major Production Areas
Cereals CropsLegumes CropsTubers CropsCereals CropsLegumes CropsTubers CropsCereals CropsLegumes CropsTubers Crops
lnS0.650 ***1.708 ***−0.2222.390 ***3.691 ***0.817−5.311 ***−1.734−1.905
(0.213)(0.458)(0.819)(0.255)(0.802)(1.196)(1.619)(4.206)(8.024)
lnM−3.346 ***−0.7924.671−3.538 ***−4.683−2.5800.7258.9027.372
(0.673)(2.022)(3.009)(0.934)(3.295)(3.707)(2.986)(7.246)(13.394)
lnL1.137 ***8.740 ***−0.3960.2933.675 **19.279 ***−6.374 **−8.883−4.225
(0.352)(1.051)(1.698)(0.652)(1.684)(2.984)(2.631)(5.999)(10.657)
lnT1.848 ***−4.170 ***2.1072.159 ***3.956 *−5.362 **−2.195−16.320 **−24.939 *
(0.566)(1.514)(2.311)(0.824)(2.370)(2.554)(3.220)(6.487)(14.224)
lnE−0.198−2.128−1.0700.906−0.469−2.3247.967 ***10.858 *−16.903
(0.710)(1.511)(2.159)(0.778)(1.179)(1.689)(2.700)(5.821)(10.530)
lnS2−0.192 ***0.0420.407 ***−0.227 ***−0.0760.1340.0050.415 **−0.009
(0.038)(0.074)(0.105)(0.040)(0.082)(0.169)(0.046)(0.160)(0.270)
lnM20.2041.284 *−0.6391.691 ***2.923 ***−6.155 ***−0.853 ***−2.251 **6.436 ***
(0.241)(0.680)(1.122)(0.277)(0.930)(1.339)(0.262)(0.885)(1.759)
lnL2−0.789 ***−2.747 ***2.016 **−0.961 ***−4.033 ***2.009−0.108−2.411 ***7.353 ***
(0.245)(0.584)(0.828)(0.326)(0.699)(1.232)(0.289)(0.828)(1.537)
lnT2−1.007 ***4.277 ***0.112−0.994 **1.8880.232−0.1570.07911.479 ***
(0.257)(0.876)(1.113)(0.395)(1.249)(1.428)(0.755)(1.651)(3.251)
lnE2−0.737 ***−0.942 ***0.453−0.784 ***−0.139−0.110−0.535−3.461 ***3.969 *
(0.182)(0.317)(0.466)(0.180)(0.260)(0.499)(0.421)(1.167)(2.111)
lnS × lnL−0.227 ***−0.678 ***0.792 ***0.175 **−1.039 ***−1.745 ***−0.426 ***0.3210.400
(0.062)(0.141)(0.201)(0.068)(0.204)(0.428)(0.153)(0.377)(0.666)
lnS × lnM0.420 ***0.586 ***−1.395 ***−0.0800.554 **0.542 **−0.0410.3570.641
(0.058)(0.159)(0.252)(0.056)(0.275)(0.243)(0.114)(0.313)(0.587)
lnS × lnT0.067−0.584 ***−0.2440.117−0.591 **−0.2451.264 ***−0.531−2.891 ***
(0.088)(0.177)(0.261)(0.074)(0.230)(0.371)(0.239)(0.559)(1.095)
lnS × lnE−0.171 **0.558 ***0.758 ***−0.352 ***0.961 ***1.587 ***−0.477 ***−0.6303.411 ***
(0.079)(0.175)(0.272)(0.081)(0.193)(0.330)(0.155)(0.464)(0.799)
lnM × lnL−0.1861.560 ***0.443−0.573 ***3.281 ***1.830 **0.518 **−1.656 ***−0.629
(0.125)(0.465)(0.632)(0.147)(0.579)(0.770)(0.200)(0.493)(1.099)
lnM × lnT0.066−2.133 ***1.866 *−0.231−3.540 ***4.929 ***−0.2330.667−6.083 ***
(0.166)(0.634)(1.009)(0.187)(0.679)(0.813)(0.371)(0.756)(1.724)
lnM × lnE−0.361 *−1.719 ***−0.784−0.624 ***−3.506 ***−1.976 ***0.984 ***2.062 **−1.829
(0.216)(0.563)(0.820)(0.192)(0.601)(0.721)(0.290)(0.940)(1.634)
lnL × lnT0.533 ***−0.874 **−2.293 ***0.567 ***0.836 **−4.057 ***0.1923.507 ***−0.900
(0.120)(0.352)(0.541)(0.105)(0.338)(0.573)(0.244)(0.665)(1.293)
lnL × lnE0.576 ***2.245 ***−0.7000.760 **0.2480.9741.008 **0.611−6.621 ***
(0.181)(0.358)(0.501)(0.292)(0.573)(0.885)(0.387)(0.859)(1.854)
lnT × lnE0.591 ***−0.0990.0520.797 ***2.023 ***−0.722−1.676 ***−0.7722.136
(0.186)(0.514)(0.706)(0.237)(0.729)(0.746)(0.583)(1.590)(2.801)
dv × lnS0.064 *−0.168−0.736 ***0.048−0.343 **−0.1240.0070.063−0.760 ***
(0.035)(0.118)(0.148)(0.051)(0.168)(0.233)(0.054)(0.176)(0.282)
dv × lnM−0.1130.504 *0.820 **−0.0841.192 ***−0.2660.189 ***−0.054−0.243
(0.076)(0.257)(0.378)(0.116)(0.394)(0.550)(0.064)(0.196)(0.426)
dv × lnL0.179 *0.501 *−1.392 ***0.613−6.170 ***−2.8840.340 **1.079 ***−2.650 ***
(0.103)(0.287)(0.386)(0.442)(1.136)(1.862)(0.140)(0.369)(0.658)
dv × lnT−0.078−0.532 *0.998 **−0.3793.040 ***1.930 *−0.536 ***−0.7274.148 ***
(0.121)(0.313)(0.433)(0.257)(0.674)(1.074)(0.193)(0.503)(0.848)
dv × lnE−0.073−0.2510.384−0.2032.393 ***1.548 *0.111−0.299−1.332 ***
(0.073)(0.211)(0.252)(0.193)(0.529)(0.839)(0.110)(0.233)(0.462)
_con1.168−14.445 ***−21.498 ***−6.712 ***−26.702 ***−26.705 ***41.876 ***39.386154.508 ***
(1.175)(3.134)(4.602)(1.928)(5.415)(6.004)(10.441)(28.860)(54.207)
Year FEYesYesYesYesYesYesYesYesYes
Province FEYesYesYesYesYesYesYesYesYes
N360360360204204204156156156
R20.9820.9310.8290.9910.9690.9510.9560.9430.759
Prob > F0.0000.0000.0000.0000.0000.0000.0000.0000.000
Note: *, **, and *** indicate significance at the level of 10%, 5%, and 1%, respectively.
Table 4. Robustness test results.
Replace Explanatory VariablesReplace Regression Model
Total Crop OutputCereals CropsLegumes CropsTubers CropsTotal Crop OutputCereals CropsLegumes CropsTubers Crops
lnS0.108 ***0.097 **0.468 ***0.1190.176 ***0.201 ***0.226 ***−0.278 ***
(0.038)(0.043)(0.073)(0.121)(0.014)(0.018)(0.056)(0.069)
lnM−1.349 ***−2.465 ***2.0894.7720.080 **0.101 **−0.324 **−0.243
(0.487)(0.622)(1.860)(2.974)(0.033)(0.049)(0.140)(0.234)
lnL0.792 **0.849 **7.432 ***−0.688−0.390 ***−0.499 ***−0.0161.458 ***
(0.314)(0.376)(1.086)(1.786)(0.022)(0.025)(0.099)(0.122)
lnT2.147 ***2.611 ***−1.3712.4070.859 ***0.733 ***1.773 ***1.510 ***
(0.438)(0.568)(1.465)(2.163)(0.024)(0.031)(0.144)(0.156)
lnE−0.959 *−0.780−4.125 ***−1.2030.325 ***0.522 ***−0.383 ***−1.231 ***
(0.522)(0.737)(1.520)(2.067)(0.033)(0.044)(0.075)(0.117)
lnS2−0.034−0.110 ***0.387 ***0.471 ***
(0.033)(0.040)(0.093)(0.120)
lnM2−0.280−0.159−0.170−0.869
(0.189)(0.238)(0.689)(1.127)
lnL2−0.429 **−0.577 **−1.979 ***2.092 ***
(0.204)(0.242)(0.586)(0.793)
lnT2−0.667 ***−0.974 ***4.324 ***0.074
(0.223)(0.252)(0.821)(1.110)
lnE2−0.655 ***−0.814 ***−1.126 ***0.492
(0.133)(0.184)(0.312)(0.456)
lnS × lnL−0.075−0.148 ***−0.388 ***0.824 ***
(0.047)(0.054)(0.149)(0.188)
lnS × lnM0.320 ***0.469 ***0.653 ***−1.453 ***
(0.055)(0.066)(0.150)(0.236)
lnS × lnT−0.081−0.009−1.011 ***−0.377
(0.080)(0.093)(0.214)(0.290)
lnS × lnE−0.178 ***−0.273 ***0.350 **0.834 ***
(0.050)(0.064)(0.149)(0.222)
lnM × lnL−0.316 ***−0.258 **1.310 ***0.423
(0.101)(0.123)(0.457)(0.628)
lnM × lnT0.2250.119−1.619 **2.114 **
(0.140)(0.171)(0.647)(0.972)
lnM × lnE0.114−0.054−0.661−0.709
(0.144)(0.184)(0.602)(0.784)
lnL × lnT0.313 ***0.405 ***−1.289 ***−2.306 ***
(0.093)(0.111)(0.358)(0.535)
lnL × lnE0.450 ***0.515 ***1.971 ***−0.761
(0.154)(0.174)(0.374)(0.500)
lnT × lnE0.284 *0.599 ***−0.234−0.062
(0.148)(0.175)(0.504)(0.737)
dv × lnS−0.107 ***−0.034−0.505 ***−0.761 ***
(0.029)(0.033)(0.097)(0.122)
dv × lnM0.053−0.0660.681 ***0.842 **
(0.073)(0.087)(0.244)(0.380)
dv × lnL−0.0040.0610.044−1.455 ***
(0.086)(0.096)(0.264)(0.380)
dv × lnT0.1280.1180.1501.049 ***
(0.092)(0.109)(0.296)(0.397)
dv × lnE−0.082−0.112−0.3430.404
(0.058)(0.069)(0.211)(0.250)
_con−1.6530.058−20.242 ***−23.157 ***−1.032 ***−0.741 ***−8.671 ***−7.791 ***
(1.070)(1.405)(3.252)(4.510)(0.096)(0.129)(0.425)(0.588)
Year FEYesYesYesYesYesYesYesYes
Province FEYesYesYesYesYesYesYesYes
N360360360360360360360360
R20.9870.9820.9360.8300.9790.9690.8510.690
Prob > F0.0000.0000.0000.0000.0000.0000.0000.000
Note: *, **, and *** indicate significance at the level of 10%, 5%, and 1%, respectively.
Table 5. “Service-labor” technology elasticity of substitution for total crop output.
NationwideMajor Production AreasNon-Major Production Areas
20110.115−0.1530.046
20120.115−0.1220.013
20130.111−0.031−0.008
20140.111−0.027−0.026
20150.114−0.041−0.032
20160.0870.044−0.021
20170.0910.064−0.017
20180.0980.0800.002
20190.1070.0920.010
20200.1150.0830.017
20210.1210.0710.019
20220.1250.0590.020
Table 6. “Service-labor” technology elasticity of substitution in the production of different crop types.
NationwideMajor Production AreasNon-Major Production Areas
Cereals CropsLegumes CropsTubers CropsCereals CropsLegumes CropsTubers CropsCereals CropsLegumes CropsTubers Crops
20110.1040.014−0.047−0.5020.153−0.0670.741−0.0700.121
20120.0990.000−0.059−0.2470.1810.1300.735−0.0560.113
20130.0880.006−0.0930.0340.2470.4230.732−0.0430.108
20140.086−0.010−0.0870.1120.2460.5390.727−0.0360.103
20150.089−0.029−0.0670.1270.2190.6100.720−0.0370.099
20160.0410.034−0.2560.324−0.0871.1060.738−0.0640.102
20170.0470.035−0.2180.2861.4821.1710.742−0.0550.105
20180.0590.038−0.1650.192−2.1691.2280.751−0.0540.111
20190.0740.041−0.1040.0130.3081.3910.762−0.0380.117
20200.0870.042−0.057−0.1410.1491.5150.770−0.0310.121
20210.0970.042−0.024−0.2970.1101.5880.779−0.0230.123
20220.1040.041−0.002−0.4160.1001.4660.785−0.0140.125
Table 7. Threshold effect test.
ThresholdRSSMSEFstatProbCrit10Crit5Crit1
Single0.9370.00345.970.04130.04041.59674.993
Double0.8910.00317.950.22023.18228.42437.031
Table 8. Threshold effect regression results.
lnY
lnS × I (lnO ≤ 4.117)0.063 ***
(0.021)
lnS × I (lnO ≥ 4.117)0.073 ***
(0.021)
_cons−0.457
(2.084)
ControlsYES
N360
R20.779
Note: *** indicate significance at the level of 1%, respectively.
Disclaimer/Publisher’s Note: The statements, opinions and data contained in all publications are solely those of the individual author(s) and contributor(s) and not of MDPI and/or the editor(s). MDPI and/or the editor(s) disclaim responsibility for any injury to people or property resulting from any ideas, methods, instructions or products referred to in the content.

