Article

Health Assessment of Natural Selenium-Rich Soil in Yuanzhou District Based on Selenium–Cadmium Principal Factors and the Accumulation of Selenium and Cadmium in the Area Crops

1
School of life Science and Resources and Environment, Yichun University, Yichun 336000, China
2
Research Center of Ecological Sciences, Jiangxi Agricultural University, Nanchang 330045, China
3
School of Landscape Architecture and Art Design, Hunan Agricultural University, Changcha 410128, China
4
School of Marine Sciences, Zhuhai Key Laboratory of Marine Bioresources and Environment, Guangdong Provincial Key Laboratory of Marine Resources and Coastal Engineering, Pearl River Estuary Marine Ecosystem Research Station, Ministry of Education, Research Center of Ocean Climate, Sun Yat-Sen University, Southern Marine Science and Engineering Guangdong Laboratory (Zhuhai), Zhuhai 519082, China
*
Authors to whom correspondence should be addressed.
These authors contributed equally to this work.
Agriculture 2025, 15(11), 1149; https://doi.org/10.3390/agriculture15111149
Submission received: 24 March 2025 / Revised: 16 May 2025 / Accepted: 24 May 2025 / Published: 27 May 2025
(This article belongs to the Section Agricultural Soils)

Abstract

:
Selenium (Se) is essential for human health, but it interacts with cadmium (Cd). However, there has been little focus on developing soil health evaluation models based on the interaction between Se and heavy metals, or the transport of Se and Cd in oilseed rape. Through detection, it was found that the soil in Yuanzhou District is mostly Se-rich (average 0.62 mg kg−1). Correlation analysis of the soil showed a positive correlation between Se content with Cd (r = 0.62, p < 0.01) and organic matter (r = 0.60, p < 0.01). A soil health score model was developed and performed well, indicating that the model can be used to estimate relevant soil health scores. Furthermore, the natural Se content of rice ranges from 0.07 to 0.28 mg kg−1, and the overall enrichment ability of Se and Cd in oilseed rape is stronger than it is in rice. According to the correlation analysis, the Cd content in the soil was significantly correlated with the stems of oilseed rape (r = 0.49, p < 0.01) and rice (r = 0.37, p < 0.05). As a result, this study suggests using the rice/oilseed rape intercropping model of farming to transfer Cd into oilseed rape to reduce the Cd content in rice.

1. Introduction

Selenium (Se) is an essential micronutrient of major metabolic significance to human health [1,2]. Chronic Se deficiency can culminate in various diseases, such as cancer or cardiovascular disease, as well as increased susceptibility to viral infections, Keshan disease, and Kashin–Beck disease [3,4,5]. Chronic excessive selenium intake can lead to selenosis, which is characterized by gastrointestinal discomfort, neurological impairment, and metabolic disturbances. These effects are primarily attributed to selenium’s interference with the metabolism of sulfur-containing amino acids and its role in inducing oxidative stress [6,7]. The distribution of Se in the soil around the world is highly uneven, and more than 40 countries are located in areas with low Se concentrations [8]. A national nutritional survey in China revealed that over 105 million people in 366 counties, accounting for 51% of the country’s total area [9], are facing adverse health impacts due to Se deficiency [10]. Therefore, nutritional supplementation with Se is necessary. A common method of supplementation is the use of Se-rich products, such as Se-rich yeast, vegetables, and mushrooms, which can be converted into forms that are easier for the body to absorb and utilize through biotransformation, thereby reducing the potential toxicity of Se. Selenium-rich rice is another common method of selenium supplementation, especially in geographical areas that are rich in selenium, such as China’s Hubei, Jiangxi, and other places, as well as Minas Gerais in Brazil, where there are traditional practices of growing selenium-rich rice.
In China, Se-rich areas are generally characterized by a high geological background of cadmium (Cd) [11,12,13]. Cd is a nonessential trace element that is considered one of the most hazardous heavy metals due to its non-redox nature and its toxicity to humans, animals, and plants [14,15]. In addition, other metals, such as arsenic (As), chromium (Cr), mercury (Hg), and lead (Pb), exhibit toxicity at trace concentrations and can result in cancer, acute kidney injury, bone damage, and damage to the cardiovascular, reproductive, and immune systems [16,17,18,19,20,21,22,23]. However, several studies have found significant interactions between Se and other toxic heavy metals in rice, including Hg, As, and Cd [24,25,26,27]. Moreover, the outcomes of the interaction between Se and Cd in pot experiments are highly dependent on the speciation, relative dose in the pot soil, plant growth stage, and application method of Se [28,29,30]. Notably, the speciation and environmental behavior of Se in naturally Se-rich areas are generally different from those under the control of experimental conditions [12]. Therefore, studying the bioaccumulation patterns of Se and other heavy metals in rice in natural Se-rich land, as well as developing soil health evaluation models based on these indicators, are crucial for green agriculture and food safety.
In recent years, numerous studies have focused on using rotation patterns to remediate areas of agricultural land contaminated by heavy metals [31,32,33]. Most of the Se-rich soils in China contain high levels of Cd, as evidenced by representative regions: Enshi, Hubei (total Se: 3.2–28.7 mg/kg; Cd: 0.8–5.6 mg/kg; 9.3–18.7× exceeding GB 15618-2018 limits) [34] and Kaiyang, Guizhou (Se: 0.6–4.8 mg/kg; Cd: 0.5–2.3 mg/kg) [35,36]. Therefore, to safeguard food safety and maintain the quality of Se-rich rice, it is crucial to adopt some measures to reduce the heavy metal content of soil before planting rice in Se-rich regions. Growing a crop before rice cultivation lowers soil heavy metal levels, resulting in less heavy metal content in the harvested rice. This proactive approach can help minimize risks to health and promote healthier agricultural practices. For example, Yang et al. (2017) demonstrated that an oil crop rotation system (oilseed rape–sunflower, oilseed rape–peanut, and oilseed rape–sesame) reduced bioavailable Cd and Pb in soil by 19–34% and 25–43%, respectively [31]. Studies have demonstrated that oil crops serve as an excellent agricultural strategy, significantly improving economic returns while enhancing soil conservation and strengthening food security.
The existing studies on Se-Cd migration and crop accumulation in Se-rich regions of China are mainly based on soils found in Enshi of Hubei Province and Shitai County of Anhui Province [32,37]. Yichun in Jiangxi Province is another of the many natural Se-rich sites in China, with the total Se content in the soil of the Mingyue Mountain area of Yichun City having been measured at 0.167–0.905 mg kg−1, i.e., a Se-rich state. However, there are few reports on the site as a research setting. Thus, the aims of this study were to (1) analyze the Se, Cd, As, Cr, Hg, and Pb contents and nutrient elements of the soil of Binjiang Township in Yuanzhou District, (2) construct a model to evaluate soil health using various environmental quality indicators, (3) explore the transport and accumulation of Se and Cd in the oilseed rape and rice of the area, and (4) develop a crop rotation model for oilseed rape and rice. This research was conducted to provide the necessary information and a theoretical reference for the development of Se-rich agriculture.

2. Materials and Methods

2.1. Study Sites and Sampling Points

The sampling area was located in Yuanzhou District (at the coordinates of 113°54′–114°37′ E, 27°33′–28°05′ N) of Yichun City in Jiangxi Province, and included an area of 2537.45 km2. The area has a humid subtropical monsoon climate with an annual average temperature of 18.1 °C. In this study, soil samples and plant grain samples were collected from 187 sampling sites from five townships in Yuanzhou District (Figure 1). A global positioning system (GPS) was used to locate the points for the actual sampling process (Table 1).

2.2. Sample Collection and Chemical Analysis

In total, 187 soil samples, 13 oilseed rape samples, and 32 rice grain samples were collected. During the soil sample collection process, a stainless-steel shovel was used to collect approximately 500 g of surface soil (at a depth of 0–20 cm) from five points of 1 m × 1 m sample squares: the four vertices and center point. The five samples were then transferred into a poly-ethylene sample bag and mixed together to provide a representative sample of the sampling point. Next, the soil samples were taken back to the laboratory, naturally air-dried, ground with a grinder, and filtered through a 100-mesh screen (0.15 mm) to prepare them for testing [38].
At the time of soil sample collection, a GPS locator was used to obtain the longitude and latitude coordinate information of each soil sampling point (Figure 1). Next, photos were taken of the sampling environment. The pH value of each soil sample was measured using a pH meter according to a water-to-soil ratio of 2.5/1. A bamboo spoon was used to select soil samples that were not touched by the shovel. The determination of the total amount of Se in the soil samples was carried out in accordance with the “Determination of Total Se in Soil” (NY/T 1104-2006) [38], which is the standard detection method for selenium in soil in China. The Cd content was determined using graphite furnace atomic absorption spectrophotometry (GF-AAS). According to the national standard method, quality control samples were established during the experiment using national standard substances to ensure the accuracy and precision of the results.
The selection of samples primarily involved a combination of random sampling and systematic layout. Initially, potential sampling areas were identified based on the geographical information and land use types of the research area. Subsequently, specific sampling points within these areas were chosen using the random sampling method to minimize human bias and systematic errors. The fresh oilseed rape samples were divided into roots and stems. All of the plant samples were placed in an oven at 105 °C for 30 min, dried at 55 °C for 12 h to a consistent weight, crushed, and ground through a 100-mesh screen (0.15 mm). To determine the total amount of Se in the samples, an atomic fluorescence spectrometer equipped with a Se hollow cathode lamp was used. The crop samples were processed in accordance with the National Food Safety Standard for the Determination of Se in Food [39], a standard detection method for selenium in soil in China [40]. Finally, to determine the total amount of Cd in the plant samples, the samples were digested by the wet method, after which they were placed in a graphite furnace and measured using an atomic absorption spectrophotometer.

2.3. Risk Assessment and Selection of the Parameters for Risk Evaluation

In the risk control standard for the soil contamination of agricultural land (trial), the risk assessment of heavy metals in soil is divided according to pH (Table 2) [34]. The parameters selected for the soil health risk evaluation included paddy fields with organic matter (OM) as a fertility indicator; total nitrogen (TN) as a soil nutrient; Se as a soil health element; and As, Cd, Cr, Hg, and Pb as soil heavy metal pollution risk elements. Based on the adjustment of the weights of specific elements, the parameter weights of each element are presented in Table 3. This soil health model aims to predict the overall health status of soil using a “multi-parameter comprehensive scoring” method. It is based on the following indicators: (1) heavy metal pollution risk (Cd, Hg, As, Pb, and Cr, with negative weights adjusted according to pH); (2) beneficial elements (Se, with positive weights classified according to selenium abundance levels); and (3) nutritional indicators (OM and TN, both with positive weights). The model generates a comprehensive score through normalization and weighted summation, reflecting the overall quality of the soil in terms of pollution risk, nutrient content, and selenium abundance.

2.4. Risk Assessment Model for Soil Heavy Metals in the Soil

Normalization refers to the scaling of feature values to a certain range (usually between 0 and 1) to ensure that the different features have the same importance in calculations.
X n o r m = X X m i n X m a x X m i n
X denotes parameters, such as Cd and Se content, X n o r m denotes the normalized X value, and X m i n and X m a x are the minimum and maximum values of feature X.
S c o r e = i ( W i × X i , n o r m )
The score calculation is a weighted sum based on the weights of different features (Table 3). W i denotes the weight of the i-th feature, and X i , n o r m is the normalized value of the i-th feature.

2.5. Data Analysis

All sample types were tested in triplicate. Statistical analyses, including one-way ANOVA with Pearson correlation analysis, were conducted using SPSS 20.0 (IBM Corp., Armonk, NY, USA). Data visualization was performed in Origin 2018 (OriginLab Corporation, Northampton, MA, USA).

3. Results and Discussion

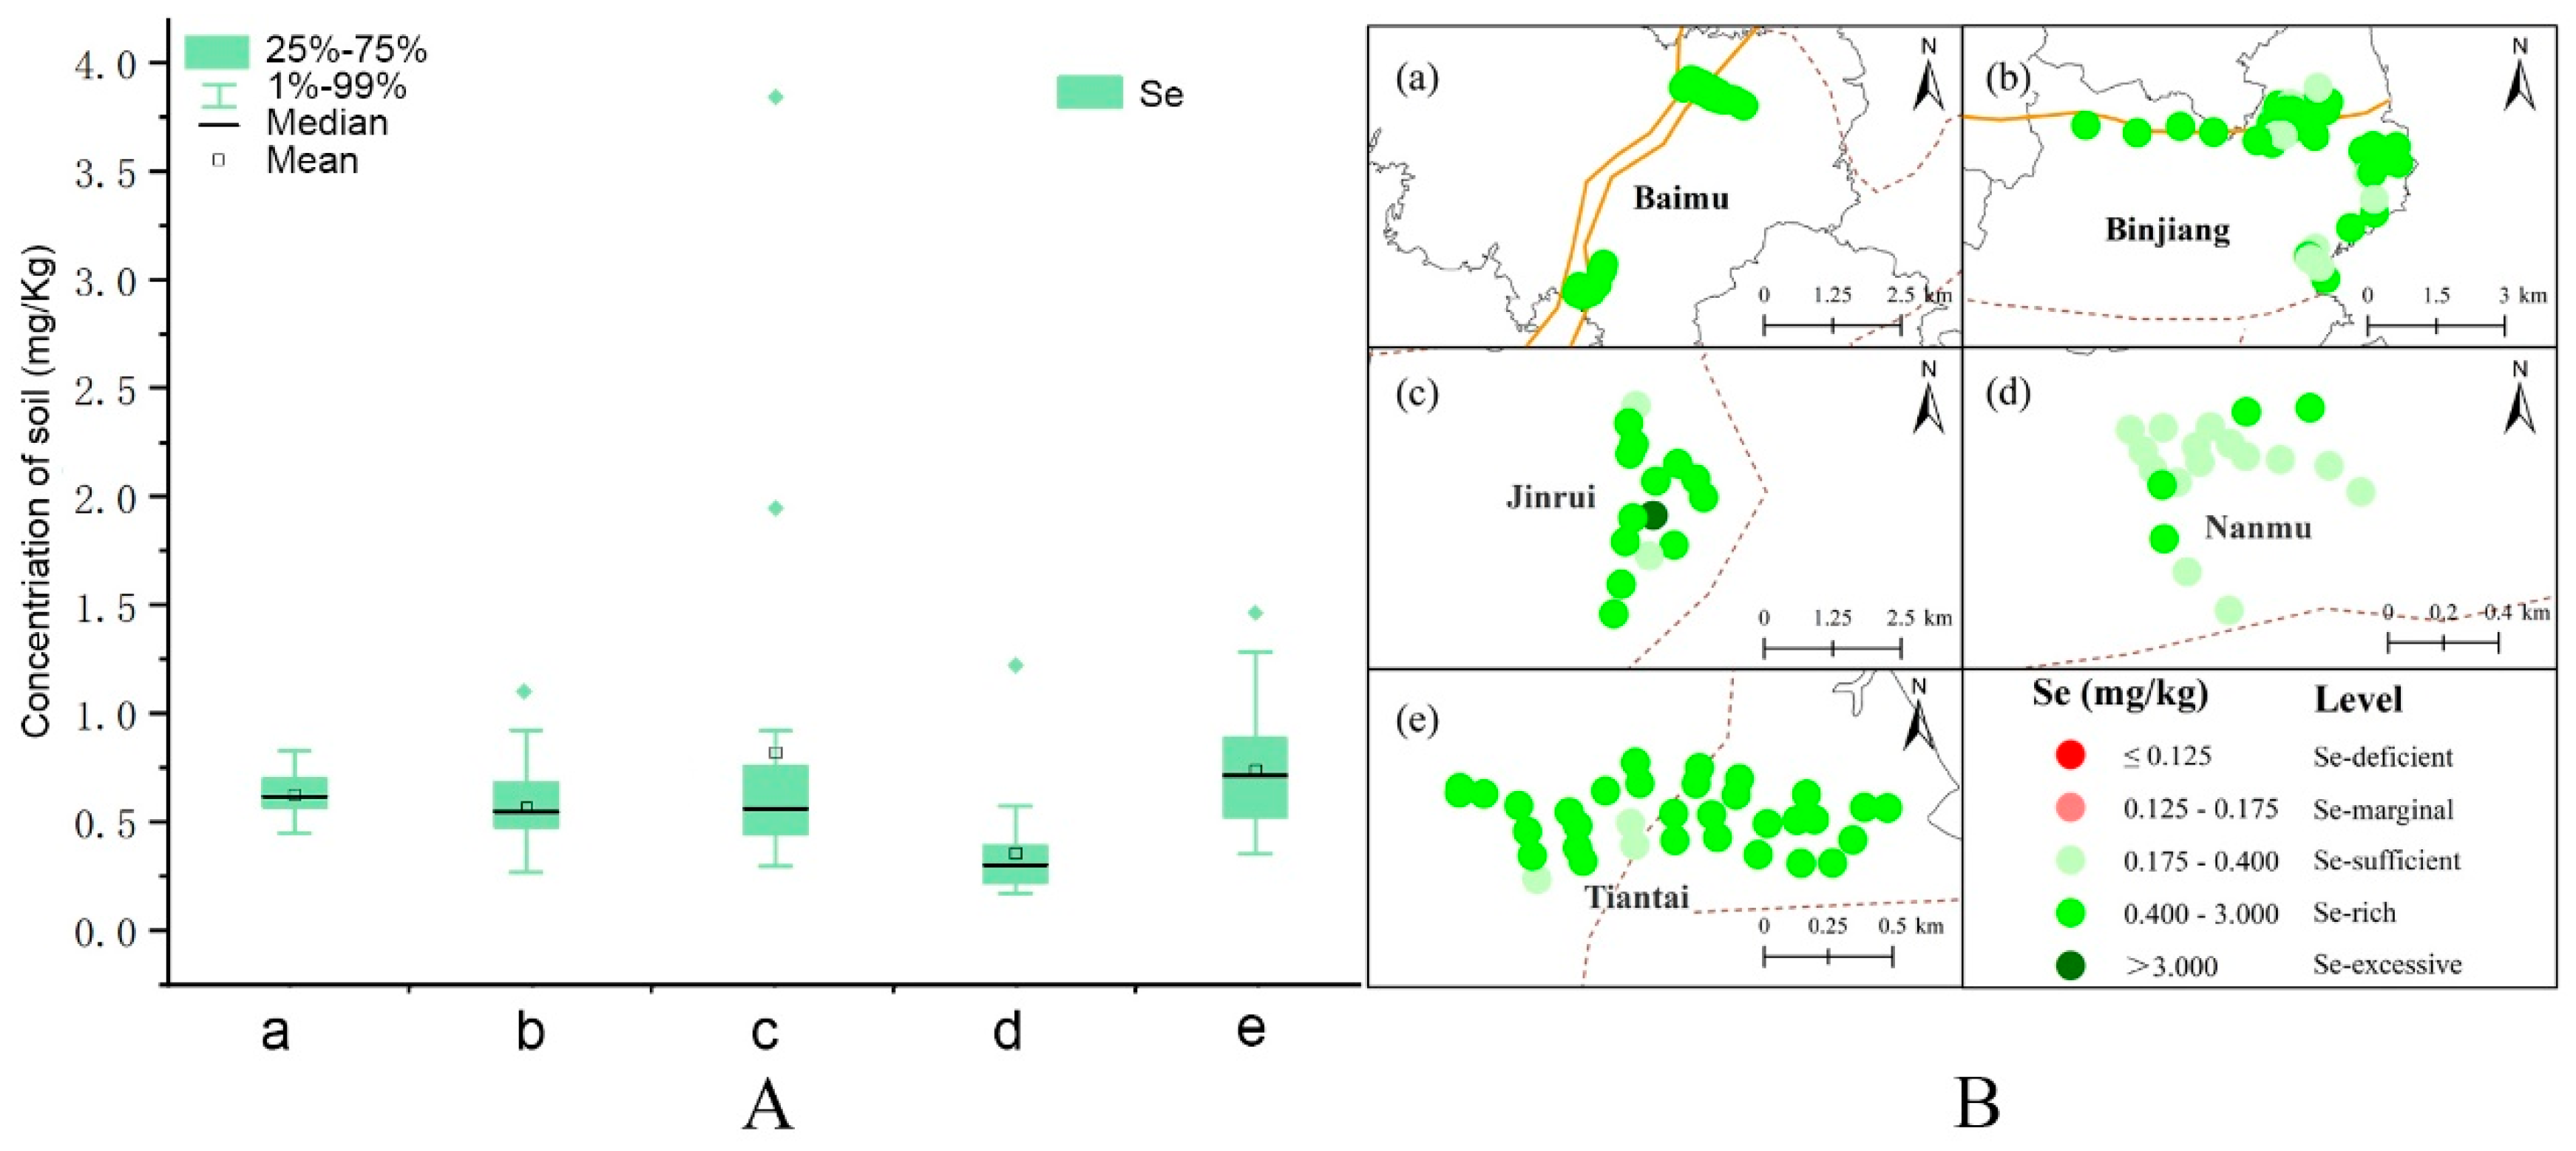
3.1. Total Se Levels in the Soil

Total soil Se concentrations exhibited significant spatial heterogeneity across the study regions (Figure 2A): Baimu (0.45–0.83 mg kg−1, mean 0.62), Binjiang (0.27–1.11; 0.57), Jinrui (0.30–3.84; 0.82), Nanmu (0.18–1.23; 0.36), and Tiantai (0.35–1.46; 0.74), with an overall range of 0.18–3.84 mg kg−1 (mean 0.64). The exceptional Se hotspot in Jinrui Town (3.84 mg kg−1) exceeded the national seleniferous soil threshold (3.0 mg kg−1) [41], suggesting that investigations into the natural Se enrichment mechanisms of this area should be prioritized.
The Se content measured in this study was higher than that of previous research on the same area (0.20–1.23 mg kg−1, with an average value of 0.50 mg kg−1) [42]. These values were well above the global mean Se concentration of 0.4 mg kg−1 [43]. Tan et al. (2002) proposed abundance and deficiency thresholds based on the total Se concentration in soil (Figure 2B) [41]. All soil samples from Baimu Town (100%), 86% from Binjiang Town, 82% from Jinrui Town, 25% from Nanmu Town, and 91% from Tiantai County were classified as selenium-rich soils. In addition, the total concentration of Se in other soil samples reached the Se-sufficient level (Figure 2B).

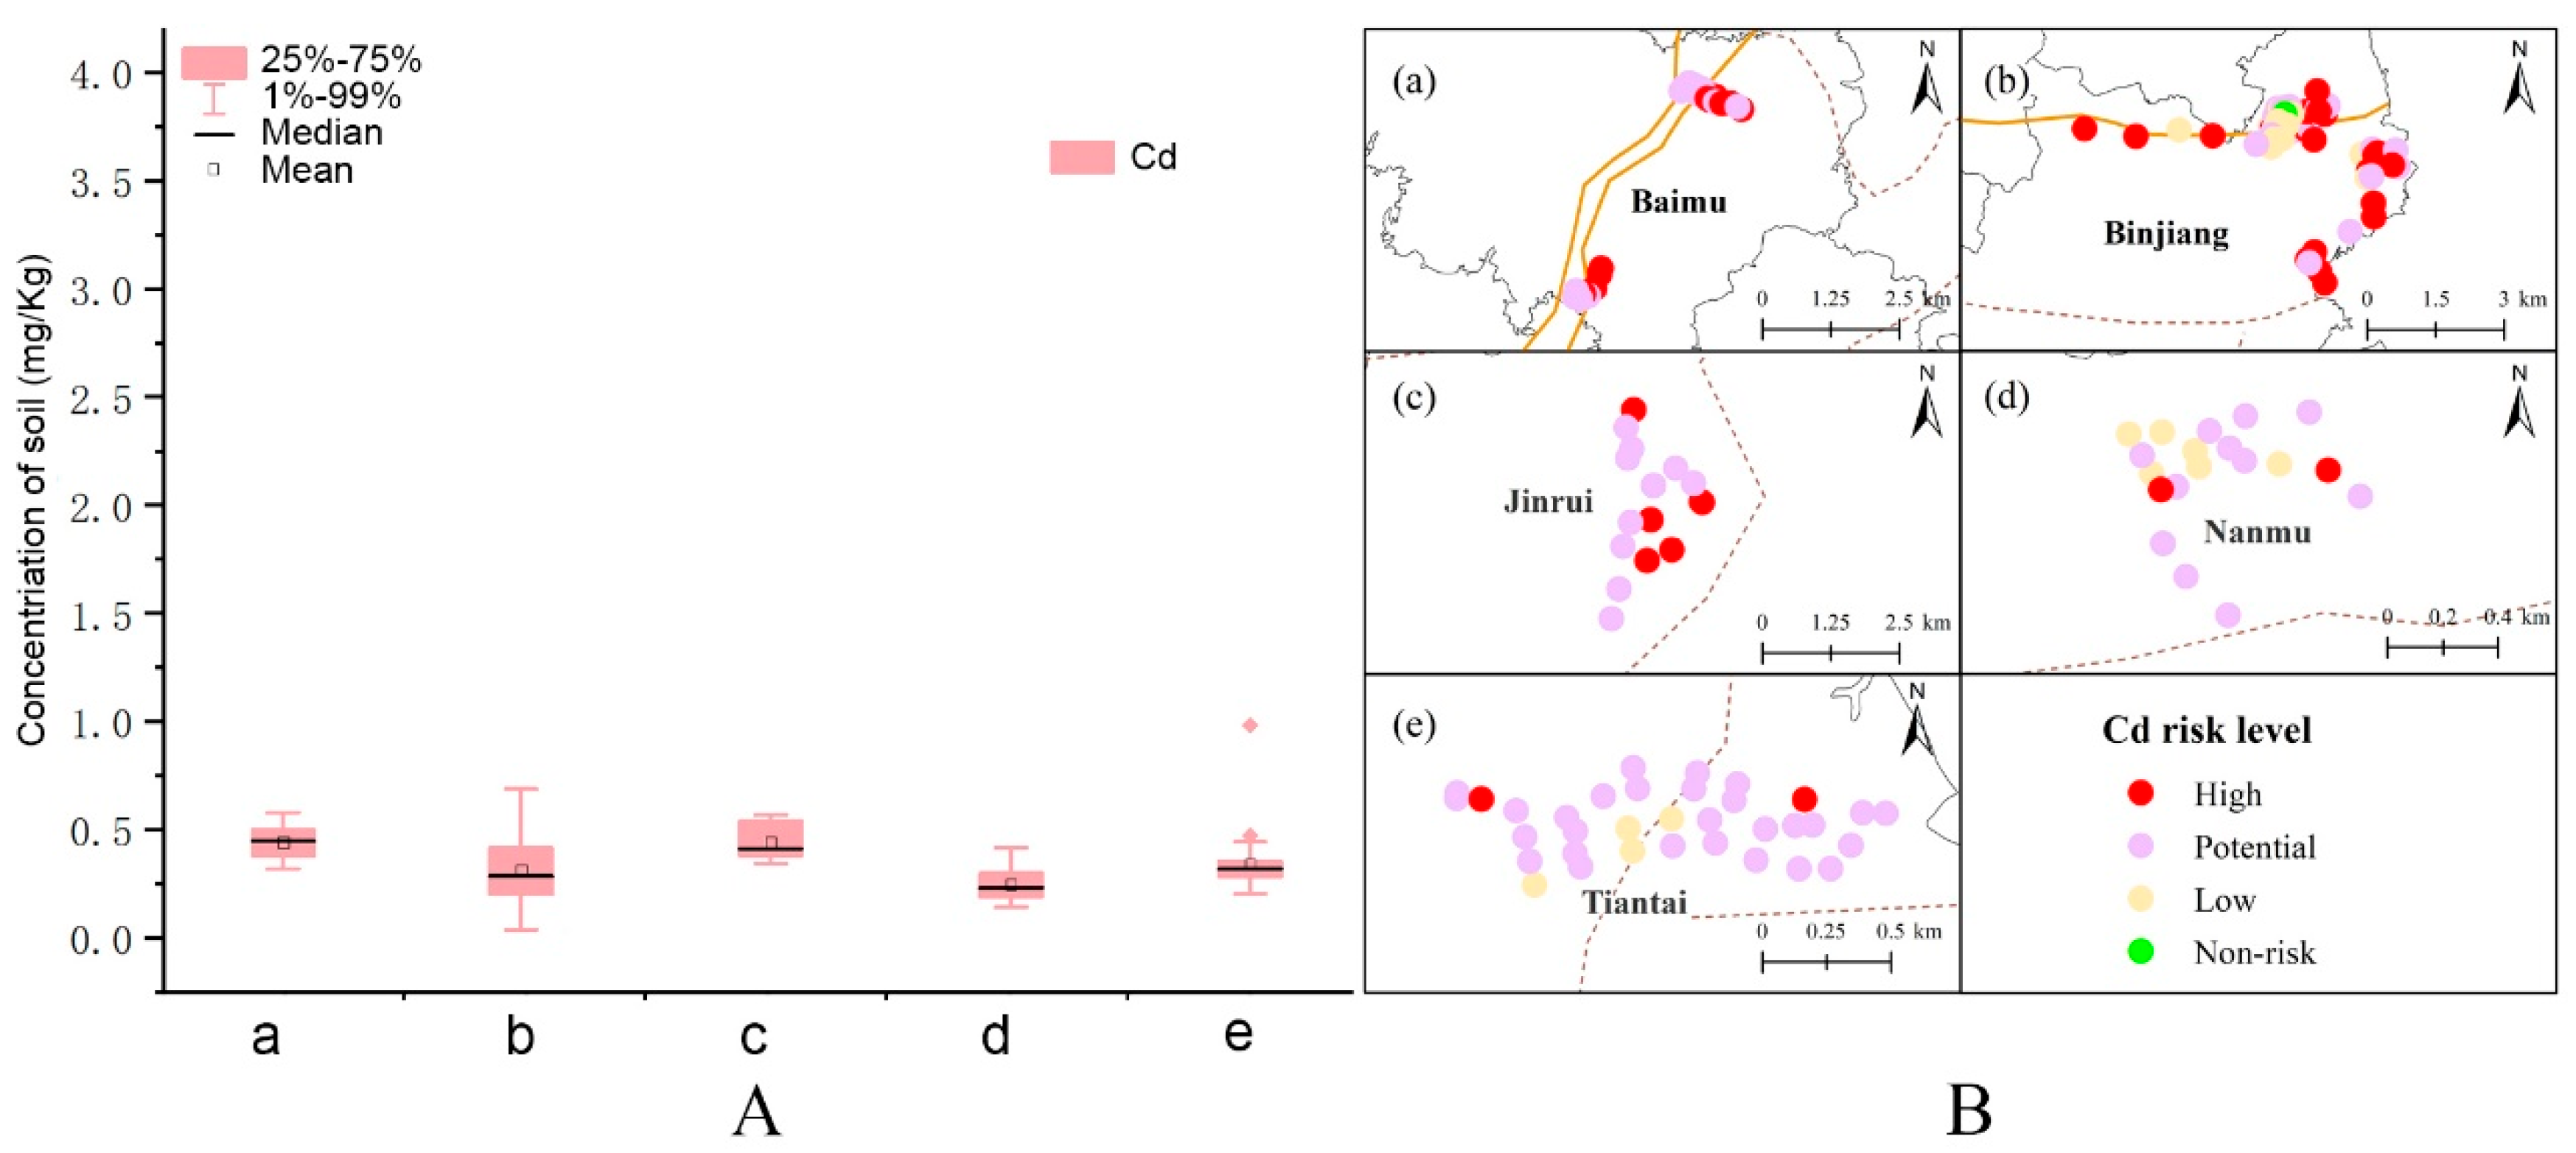
3.2. Levels of Cd and Related Risk Assessment in Se-Rich Soil

Soil Cd concentrations across all regions (0.04–0.98 mg kg−1) remained below China’s agricultural soil risk screening thresholds [34], with maxima < 1.5 mg kg−1 (Figure 3A). Regional means ranked as follows: Jinrui (0.44 mg kg−1) ≈ Baimu (0.44) > Tiantai (0.34) > Binjiang (0.32) > Nanmu (0.25). The Cd content in the soil of this region was lower than the content measured previously (0.07–1.00 mg kg−1, with an average value of 0.42 mg kg−1) [42].
Most of the soil samples were acidic, with pH values in Baimu County, Binjiang Town, Jinrui Town, Nanmu Town, Tiantai County ranging from 5.02 to 6.88, 4.39 to 7.3, 5.76 to 6.82, 5.05 to 6.63, and 6.09 to 6.87, respectively, with spatial heterogeneity influencing Cd bioavailability. The risk assessment of the Cd in the soil was divided according to pH values, as shown in Figure S1 [34]. High-risk Cd proportions (pH-adjusted) [34] GB 15618-2018 thresholds) varied substantially: Baimu (43.2%) > Jinrui (35.3%) > Binjiang (31.7%) > Nanmu (10.0%) > Tiantai (5.9%), yielding an overall compliance rate of 72.7% (Figure 3B and Figure S1). Notably, 27.3% of sites exceeded regulatory limits, which requires special attention.
Therefore, it is crucial to mitigate soil acidification, regulate the bioavailability of heavy metals in soil, and reduce the risk of their uptake by plants. This is one of the crucial steps to lower ecological risks and safeguard public health. It also helps to preserve the health and productivity of the soil and is significant for safeguarding plant safety and keeping heavy metals out of the food chain.

3.3. Risk Assessment of Heavy Metals in Se-Rich Soil

Through the analysis detailed above, it was determined that the Se content in the soil of Binjiang Town was high, while the Cd content was low. Consequently, Binjiang Town was chosen for further analysis and research. In Binjiang Town, 37 soil samples were chosen to detect their levels of As, Cd, Cr, Hg, OM, Se, Pb, and TN. The relationship between these elements was then examined (Figure 4A). Pearson correlation analysis (two-tailed, α = 0.05) revealed significant positive associations between soil Se and Cd (r = 0.62, p < 0.01), Pb (r = 0.38, p < 0.05), and OM (r = 0.60, p < 0.01). The significant positive correlation between total Se and Cd may be linked to the elemental content in the rocks of the unique Permian strata in this area. The results suggested that the Se and Cd may have originated from the same source. Elements such as Se and Cd often coexist and are enriched in specific sedimentary rocks, including organic-matter-rich black shales and phosphate ores. In the black shale of Enshi, Hubei Province, China, the Se concentration can reach 10–50 milligrams per kilogram, while the Cd concentration can reach 5–20 milligrams per kilogram [36]. In soils derived from the weathering of black shale, Se and Cd exhibit a significant positive correlation (r = 0.65, p < 0.01), with the homogeneity of the parent rock being the primary driving factor [37]. The same phenomenon has also been observed in the Se-rich soils of the Hainan rice fields and several other regions. This suggests that the relationship is universal in terms of geological distribution. At the same time, it has been confirmed that naturally Se-rich areas in China generally have high geological backgrounds of heavy metals [11,12,13]. Reducing Cd levels in Se-rich areas is crucial. Studies have demonstrated that implementing rotation strategies with oilseed rape and other plants can effectively absorb Cd, ultimately enhancing the safety and quality of Se-enriched products [31]. Taking action now will ensure food safety and provide health benefits to consumers.
In terms of the correlation between Se and Pb, this may reflect the natural soil composition or the influence of Pb on Se’s behavior in soil, but the reason for this is unclear and needs to be investigated in the future. On the other hand, the relationship between selenium (Se) and organic matter (OM) in soil suggests that the Se content in soil is influenced by OM, which acts as a key carrier of Se in soil. That is, OM in soil primarily originates from plant and animal residues, as well as microbial biomass. When organic matter decomposes, it forms organic-bound Se (OM-Se), which securely binds Se. This combined form of Se’s bioavailability is influenced by various factors, but it generally remains stable and is not easily washed away [44]. The decomposition of OM, especially the release of organic acids, can influence the soil’s pH level, which in turn affects the chemical form and solubility of Se. In acidic conditions, Se exists mainly as selenite, while in alkaline conditions, it exists mainly as selenate [45]. According to Zhang et al. (2021), OM can adsorb and fix Se in soil. Therefore, from the perspective of geochemical behavior, the high content of OM in soil contributes to the stability and bioavailability of the soil’s Se [46].
The Cd level was highly significant positively correlated to the soil’s OM (r = 0.63, p < 0.01), thus indicating that Cd may strongly bind to soil’s OM or that the presence of OM can lead to increased Cd accumulation. However, the level of Cd had no significant correlation with any of the other elements. In particular, Ca shows a weak correlation with other heavy metals, such as Hg, As, and Pb, suggesting a common source of pollution, potentially from industrial activity or agricultural chemical use. In addition, OM was significantly positively correlated to the TN (r = 0.41, p < 0.05). This phenomenon exhibits a special manifestation in cadmium-contaminated farmland with high selenium content. Selenium reconfigures the C-N metabolic network, transforming the traditional C-N uncoupling system into a synergistic enhancement mode [47].
Based on the correlation analysis of heavy metals and beneficial elements in the soil, Table 3 presents the risk weights for heavy metal pollution, the weights of healthy elements, and the nutrient weights, all of which were derived through optimization and parameterization. The feature weights for each element, along with their standardized values, were combined and summed to calculate the overall score for the planted area. The determination of weights employs a method that combines expert experience with data-driven optimization. The specific steps are as follows: (1) Guided by expert knowledge, the negative weights of heavy metals (such as Cd, Hg, As, etc.) are established based on their toxicity and pollution risk levels. The absolute value of the weight assigned to high-risk areas is greater, aligning with the classification logic outlined in the “Soil Pollution Risk Control Standards for Agricultural Land” (GB 15618-2018) [34]. (2) The positive weights of beneficial elements (such as Se, OM, and TN) are allocated according to their contributions to soil fertility. For instance, the weight of selenium in selenium-rich soils is set at 0.4, which is consistent with the agricultural soil selenium classification standard (Table 3). (3) Through data-driven optimization, Pearson correlation analysis is employed to verify the relationships between indicators, revealing significant positive correlations between soil Se and Cd, as well as OM, with correlation coefficients of 0.62 and 0.60, respectively. This analysis further supports the rationale behind the weight allocation. Based on the adjustment of the weights of specific elements, the parameter weights of each element are presented in Table 3. Among the above parameters, Se, OM, and TN can promote ecological health with positive values, while As, Cd, Cr, Hg, and Pb have ecological risk factors with negative values.
The established model underwent rigorous internal validation through performance evaluations of both the training set and the test sets. The internal verification process involved dataset splitting, yielding the following results: (1) Training set performance: R2 = 0.93, indicating that the model can account for 93% of the variance in the training data, demonstrating an excellent fit. The mean squared error (MSE) is 15.94, reflecting a relatively low prediction error on the training data. (2) Test set performance: R2 = 0.64, showing that the model can explain 64% of the variance in the test data, thus exhibiting a moderate degree of generalization ability. The MSE is 81.80 and the mean absolute error (MAE) is 6.33, indicating that the average prediction error on unseen data remains within an acceptable range. (3) Residual analysis: The mean of the residuals is −1.24 and the standard deviation is 9.58, suggesting that the predicted values are slightly higher than the actual values overall; however, the error distribution is reasonable and shows no significant systematic bias. These metrics collectively demonstrate that the model has successfully passed stringent statistical validation within the dataset and can effectively differentiate various soil health states.
In addition, the established model implemented 5-fold cross-validation using the existing data (34 samples). The results demonstrated that the model exhibited relatively stable explanatory power across different data subsets (average R2 = 0.61), which closely aligns with the outcome from the independent test set (R2 = 0.64). Additionally, the average mean squared error (MSE) of the cross-validation was 85.2, which is slightly higher than the MSE of the test set (81.80), yet within a reasonable range. The average mean absolute error (MAE) was 6.90, comparable to the MAE of the test set (6.33), with no significant deviation observed in the error distribution. These findings indicate that the model performs consistently under various data partitions. Figure 4B illustrates the soil health scores for the Binjiang sample plot as derived through this model, highlighting its effectiveness in assessing soil quality.

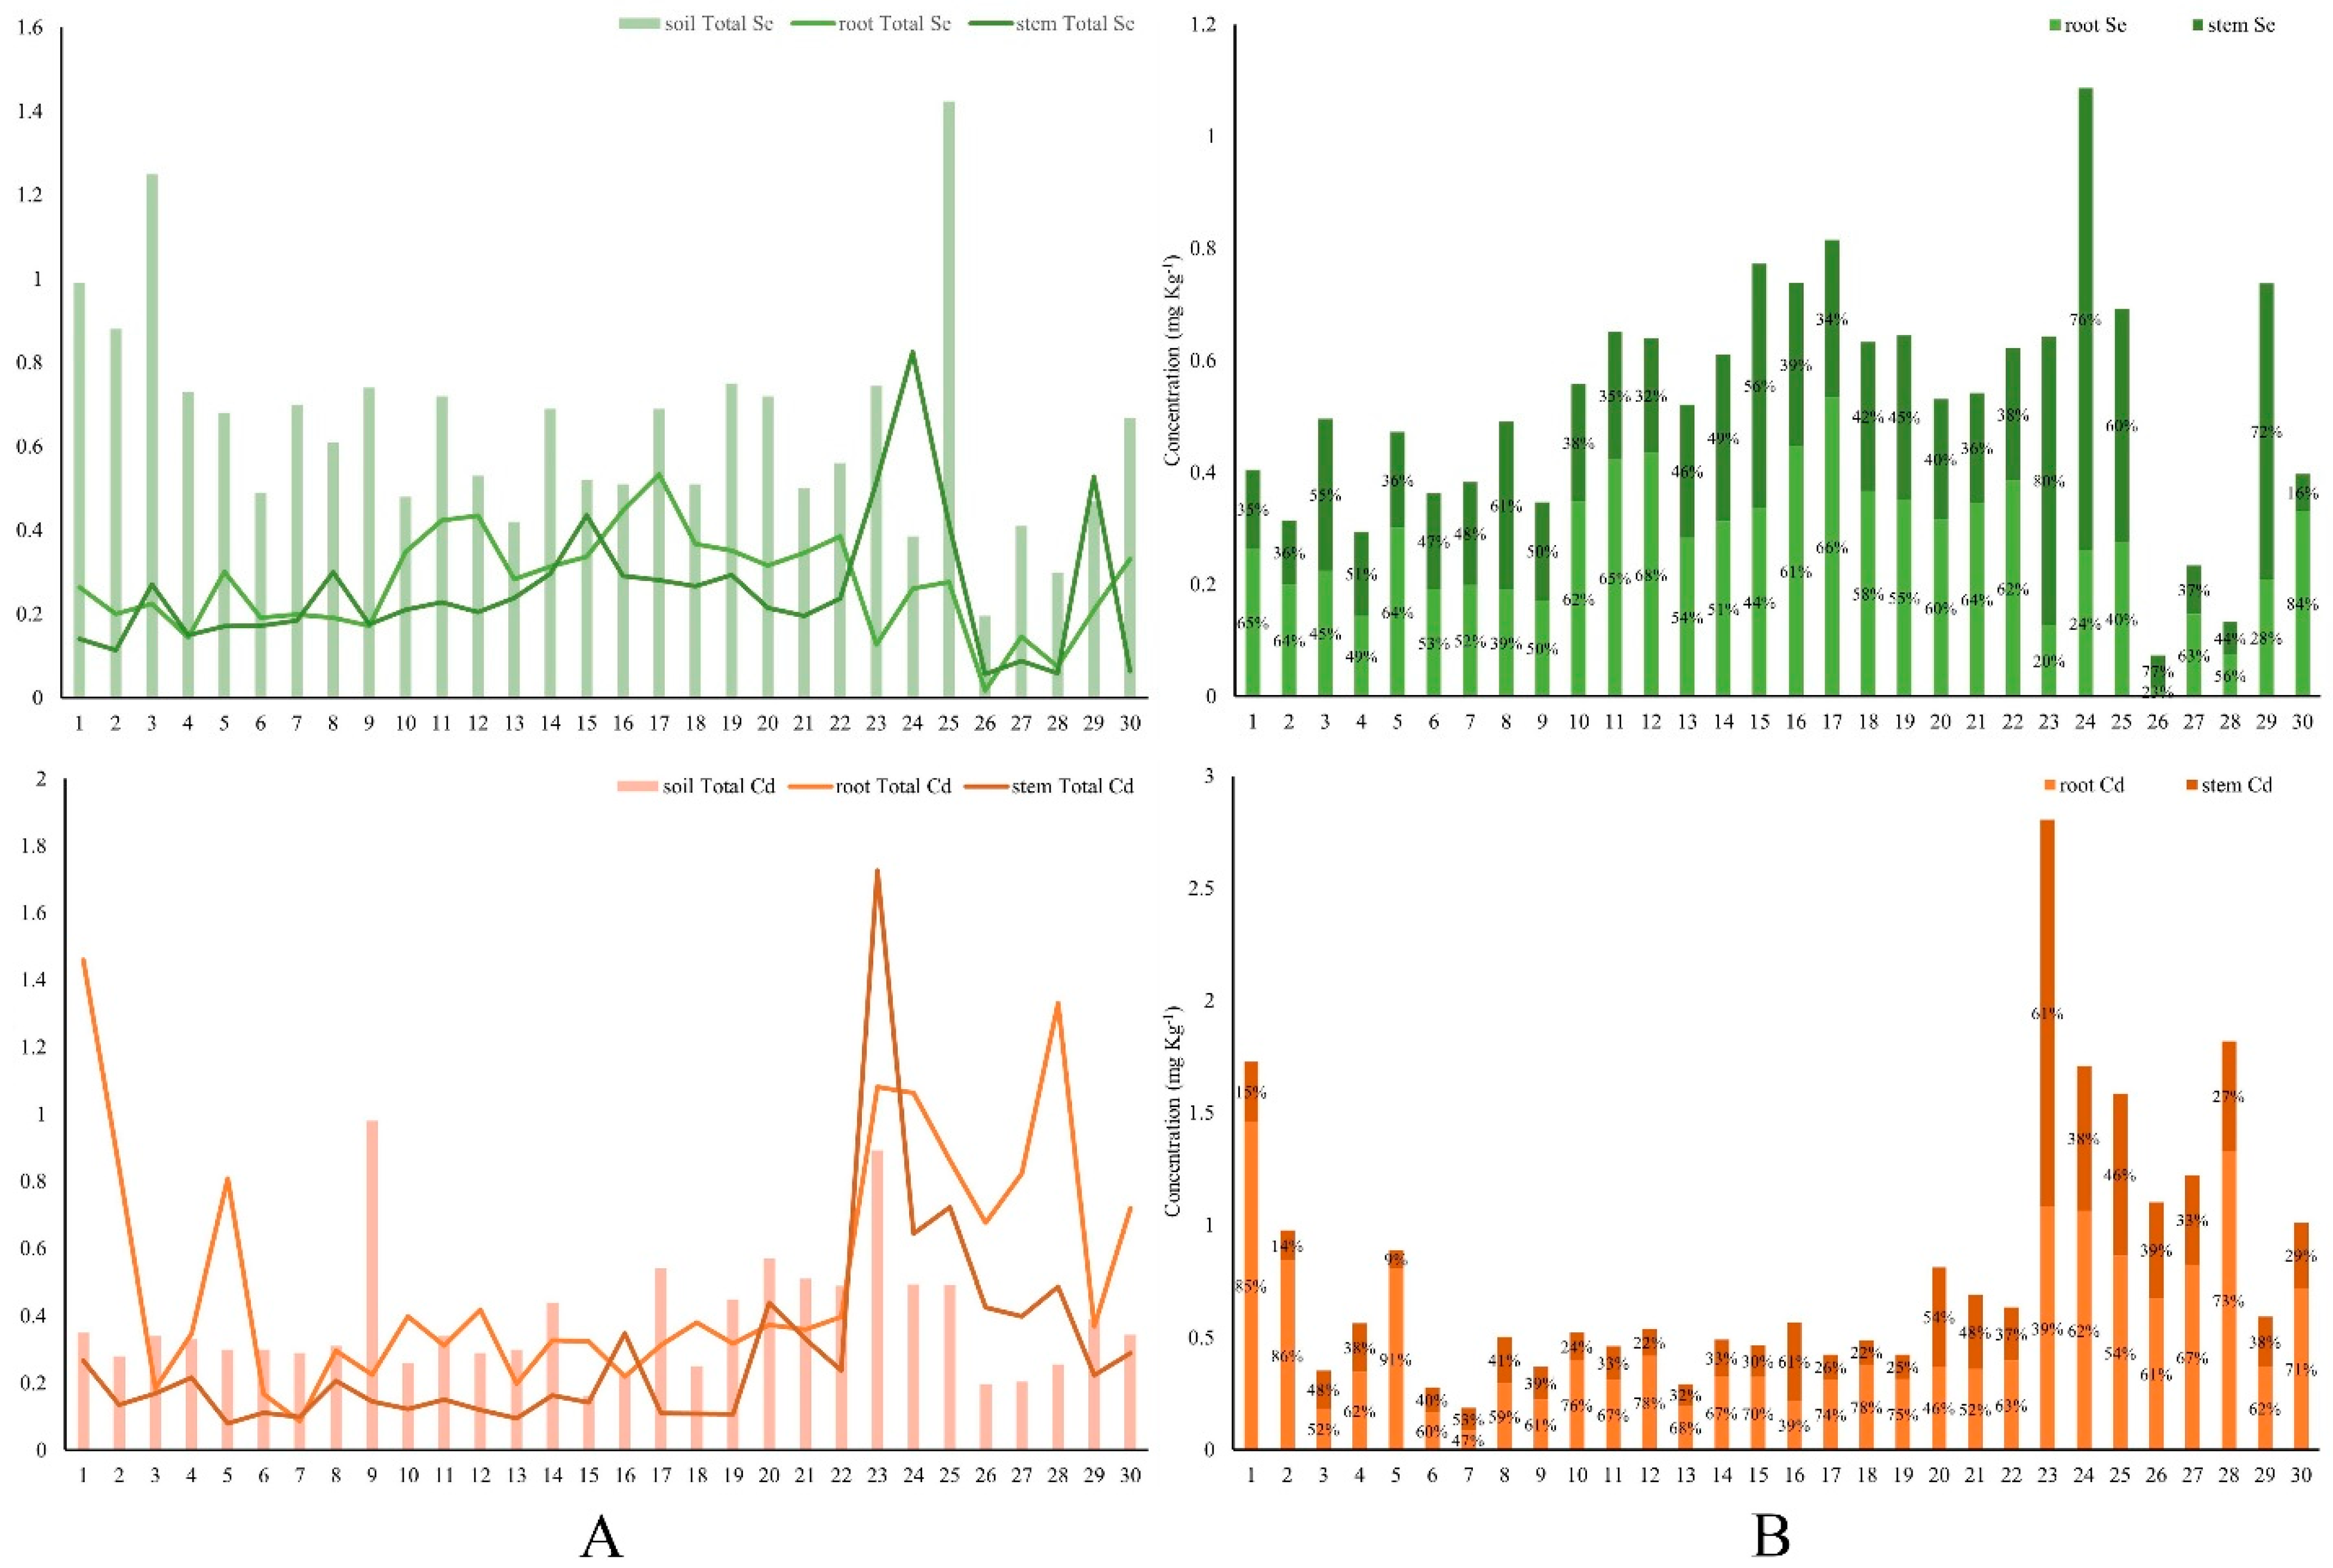
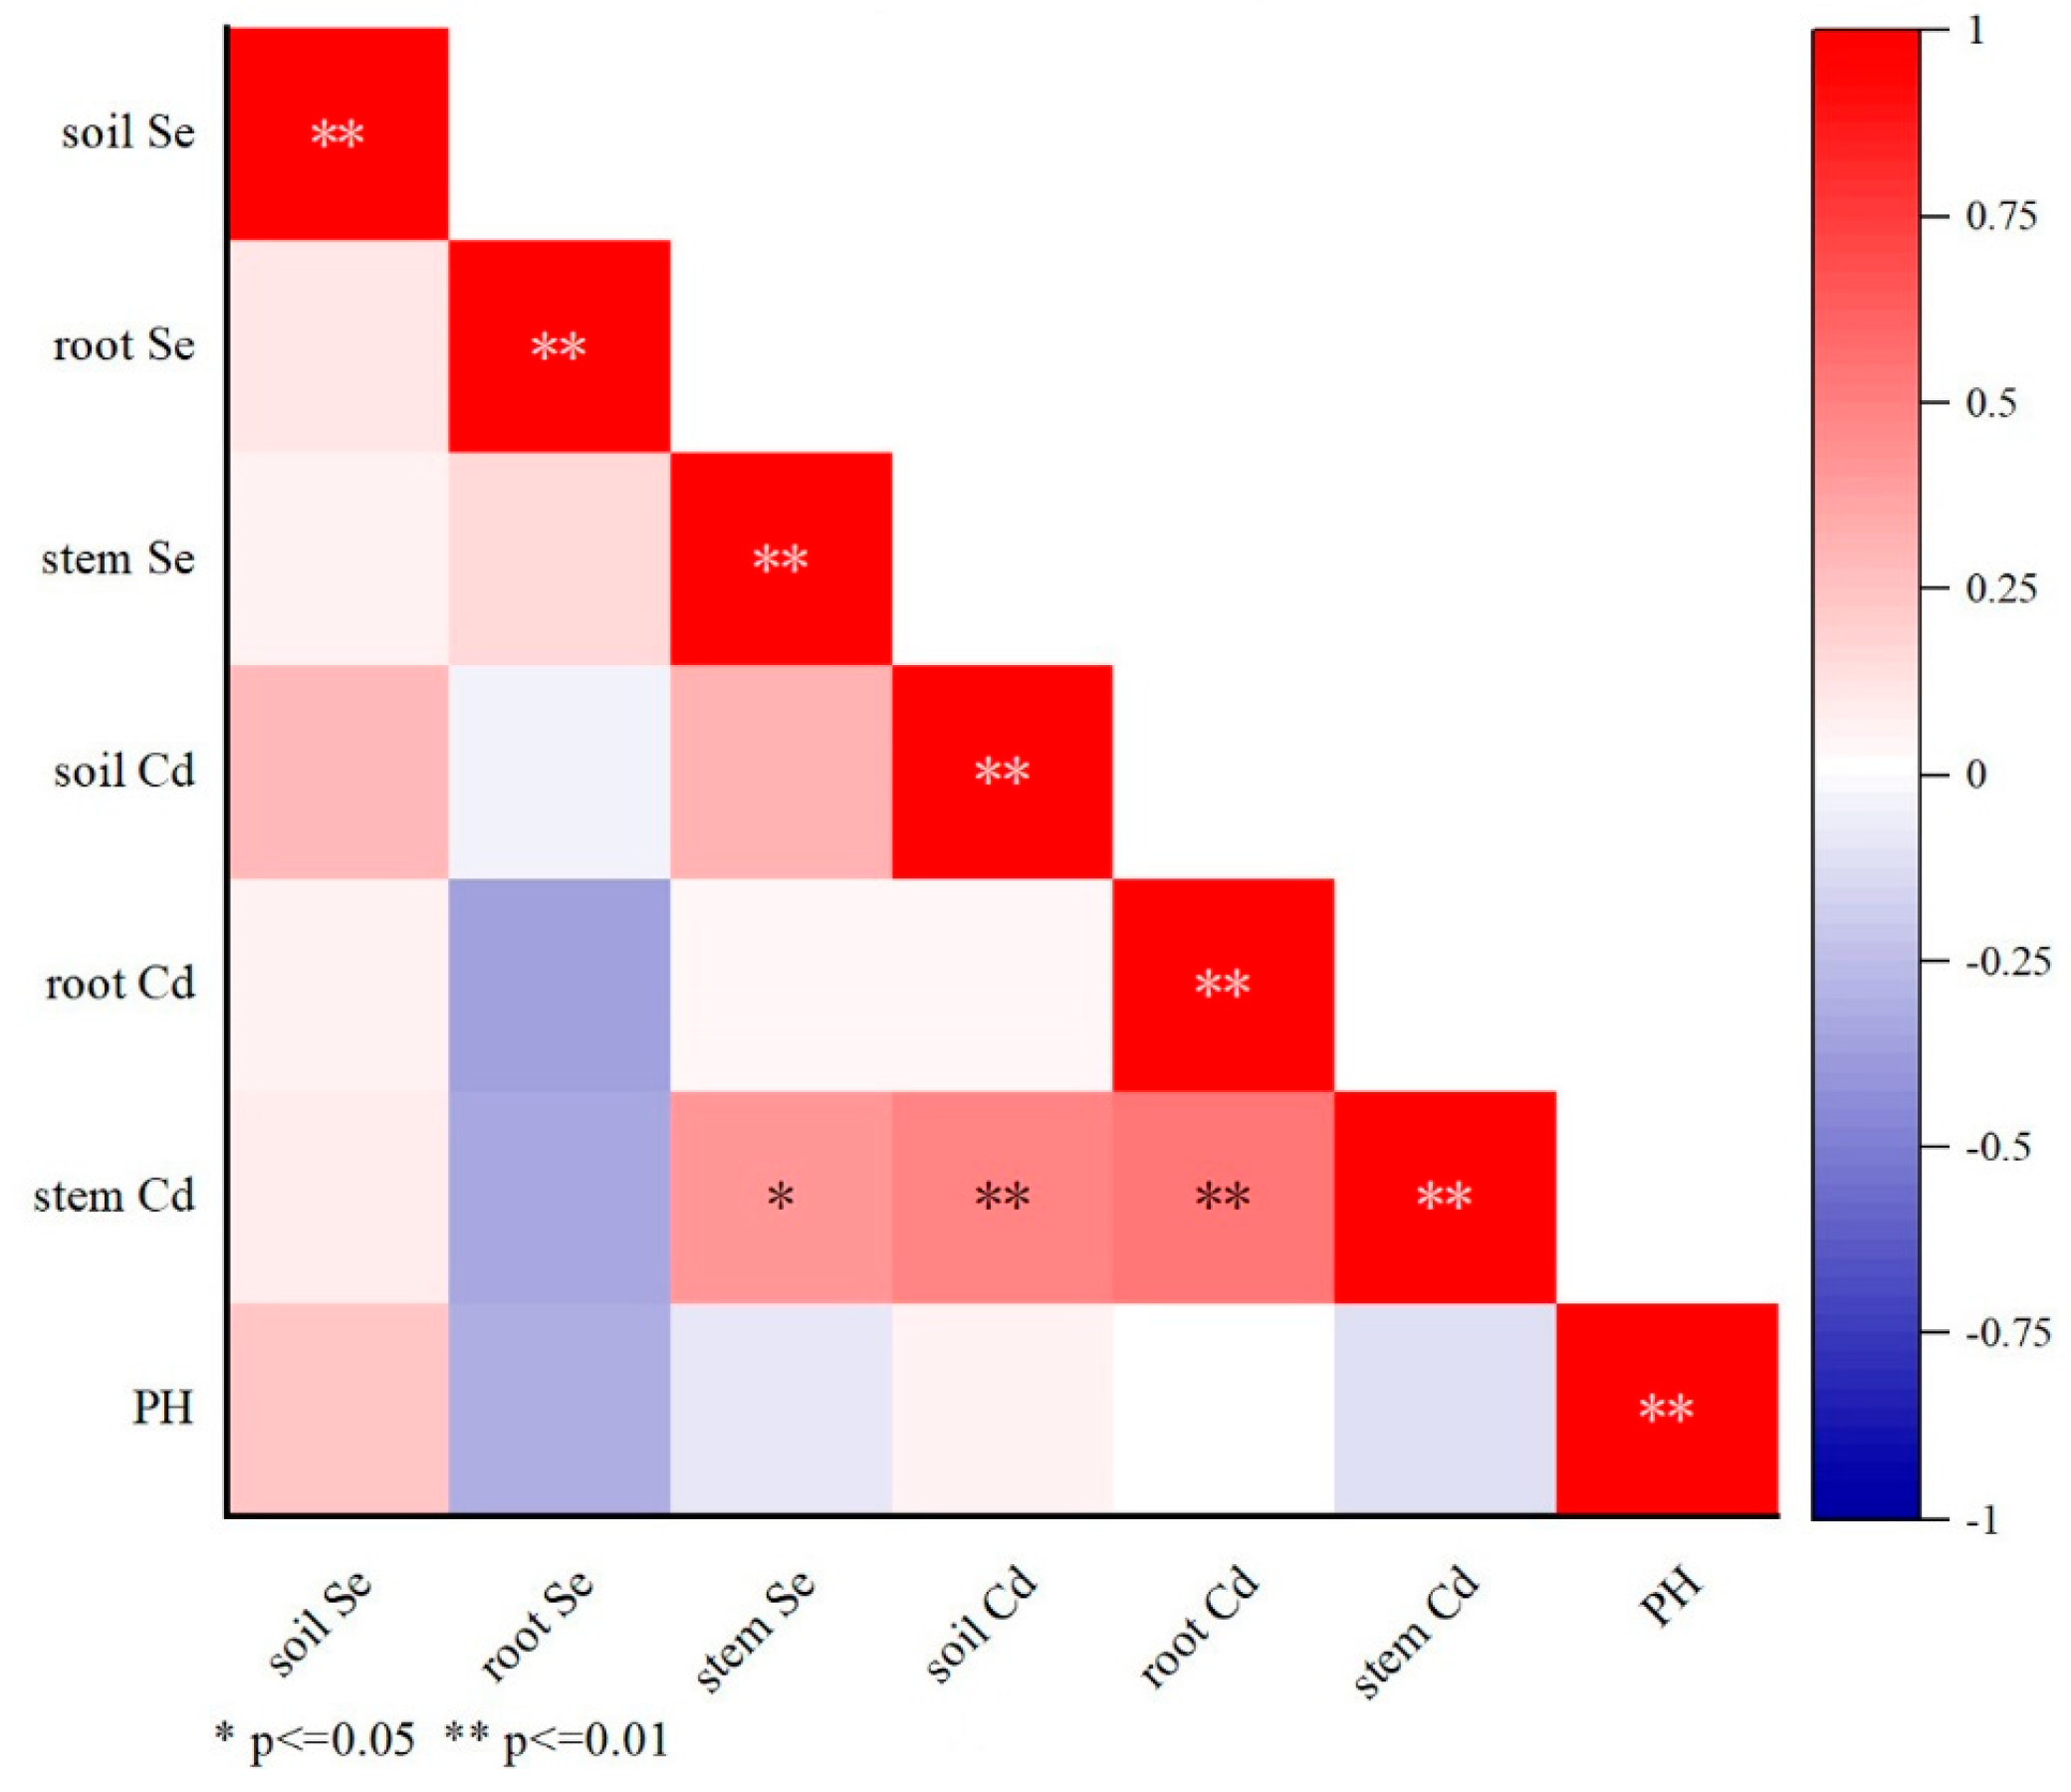
3.4. Accumulation of Se and Cd in Different Parts of Oilseed Rape Plants

The content of Se and Cd in the stems and roots of oilseed rape (Brassica napus L.) plants is listed in Figure 5A. The content of Se in the soil was 0.20–1.42 mg kg−1, while in the stems and roots of oilseed rape samples, the concentration of Se was 0.06–0.83 mg kg−1 and 0.02–0.53 mg kg−1, respectively. In terms of Cd content, the soil’s level was 0.16–0.98 mg kg−1, and the Cd concentration in the oilseed rape stems and roots was 0.08–1.73 mg kg−1 and 0.09–1.46 mg kg−1, respectively. The average absorption rates of Se in the stems and roots were 44.40% and 45.94%, respectively, while the average absorption rates of Cd were 78.47% and 158.64%, respectively.
In the comparison of the Se and Cd content in the oilseed rape roots (Figure 5B), it was observed that the levels of Se and Cd were generally higher than those in the stems. Specifically, the average Se content in the stems was 0.25 mg kg−1, while in the roots it was 0.27 mg kg−1. The Ca content was 0.29 mg kg−1 in the stems and 0.52 mg kg−1 in the roots. These findings suggest that the roots of the oilseed rape plant have a stronger capacity to accumulate these two metal elements compared to the stems. Hamid et al. (2019) revealed that Cd in the soil tends to accumulate in the roots of crops, which is followed by transport to the stems [15].
The correlation between soil content and the stem–root uptake of Cd and Se content was analyzed, and the level of Se in the stems was found to have a significant positive correlation with the stem’s level of Cd (r = 0.40, p < 0.05) (Figure 6). Moreover, stem Cd was highly significantly positively correlated with root Cd (r = 0.53, p < 0.01) and soil Cd (r = 0.49, p < 0.01) (Figure 6).
Lyu et al. (2022) found that crop Se concentrations were highly consistent with soil Se concentrations, with plants with high Se concentrations growing in high-Se soils [48]. In the present study, soil Se and Cd levels were weakly correlated with the Se and Cd levels in the root systems of oilseed rape. This suggests that soil Se and Cd contents are not the only factors that affect Se and Cd accumulation in oilseed rape roots. The accumulation of selenium and cadmium in crops is influenced not only by the background concentrations in the soil, but also by various factors, including competitive ions, agronomic practices, and microbial symbiosis [49,50]. In addition, the Se and Cd concentrations in the oilseed rape roots were usually higher than in the stems, which suggests that roots are the main site of Cd accumulation in most plants [51]. This study suggested that the correlation between Se and Cd in soil may explain this phenomenon. Surprisingly, in this study, the soil’s Cd content showed a weak correlation with the Cd content of the oilseed rape roots, but it also showed a positive correlation with the oilseed rape stem Cd content, which needs to be explained by subsequent studies.

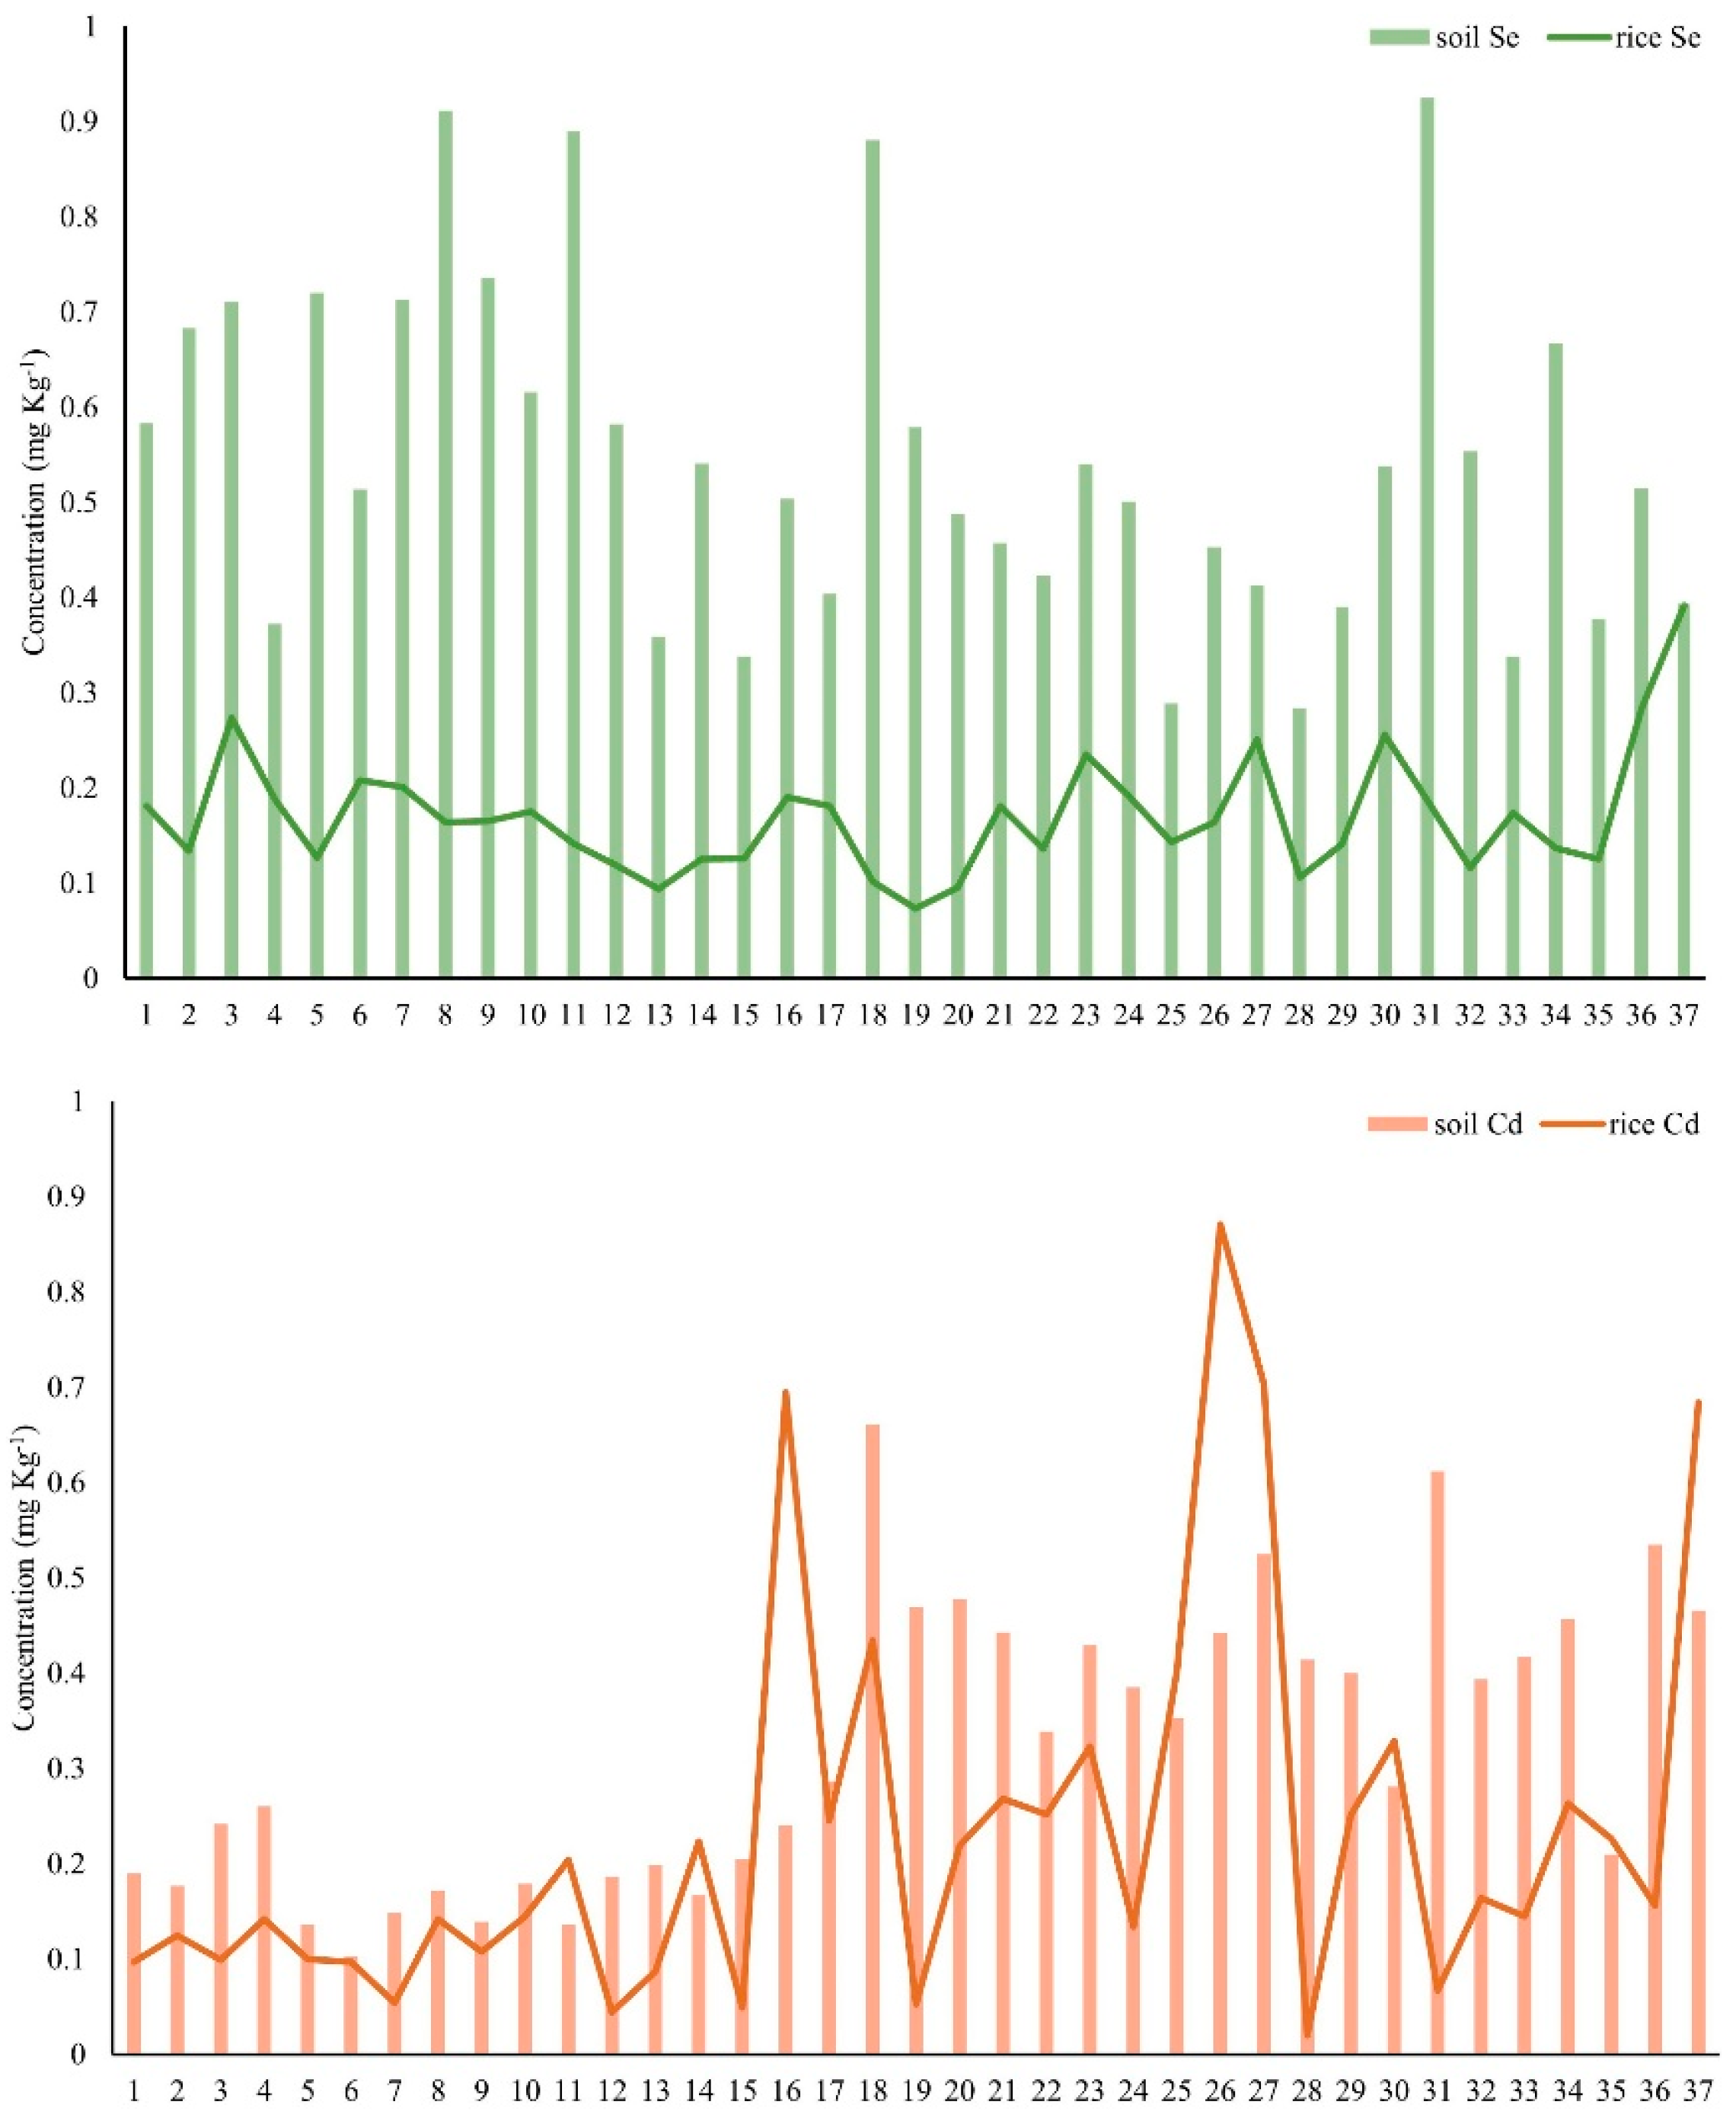
3.5. Accumulation of Se and Cd in the Soil–Rice System

The content of Se in the rice grains varied between 0.07 and 0.28 mg kg−1, with a mean of 0.12 mg kg−1 (Figure 7). Indeed, the mean Se content in the rice grains was higher than in rice in other parts of world (0.10 mg kg−1) [52]. In addition, the Se content of the rice grains in the region examined in this study was also higher than the standard proposed by the World Health Organization for the Se-deficiency limit in grains (0.05 mg kg−1) [53]. In previous study by, it was found that the average Se content of rice in Longnan in Jiangxi Province was 0.05 mg kg−1. Notably, the Se concentration in the rice in this study was higher than that [54].
The average Cd content of the rice samples was 0.23 mg kg−1, ranging from 0.02 to 0.87 mg kg−1, thereby reaching the edible standard for agricultural products (Figure 7) [39]. The average absorption rate of Se in the rice was 34.23%, while the average absorption rate of Cd was 76.70% (Figure 7). While these figures meet the national food safety standards [39], regions with elevated Cd concentrations may pose a risk. It is crucial to take proactive measures to monitor and manage these levels to ensure the safety and health of consumers, especially given that rice is a major crop grown in China. When compared to other food crops, rice exhibits a notably higher capacity to absorb Cd through its root system. In soils with low pH, this toxic metal can readily enter the plant and cause elevated Cd levels in the rice itself [55]. This underscores the importance of monitoring soil conditions to safeguard food safety.
In the study area, there was a significant correlation (r = 0.37, p < 0.05) between the Cd content in the rice ears and the risk index of Cd pollution in the soil (Figure 8). The distribution of Cd in the rice plants showed a certain degree of positive correlation, which was closely related to the content distribution in the soil. This aligns with Liu et al. (2022), who emphasized the importance of assessing the content of heavy metals in soil before developing Se-rich soil [56]. This is because heavy metals in soil and water can be absorbed by Se-rich plants and pose potential threats to human health through the food chain. In addition, there was a significant positive correlation between the Cd and Se content in the rice (r = 0.37, p < 0.05) (Figure 8). Chang et al. (2022) discovered that Cd transcription factors are inversely related to Se levels in rice [57]. They proposed that the interaction between Se and Cd inhibited the transport of Cd from rice roots to grains.

3.6. Green Crop Rotation Patterns in Se-Rich Areas

The total content of Cd in the 30 samples of oilseed rape was 0.186–2.807 mg kg−1, with a mean of 0.817 mg kg−1. The content of Cd in the 37 rice samples was 0.23 mg kg−1, ranging from 0.02 to 0.87 mg kg−1. The Cd content in oilseed rape is significantly higher than that in rice. The average uptake of Se by oilseed rape stems and roots was 44.40% and 45.94%, and that of Cd was 78.47% and 158.64%, respectively (Figure 5). The average absorption rate of Se in the rice examined in this study was 34.23%, while the average absorption rate of Cd was 76.70% (Figure 7). The absorption rate of total Se in the roots of oilseed rape is slightly higher than that in stems, which may be attributed to the form of Se. Total Se can be categorized into organic Se and inorganic Se. Among these, Se (VI) in inorganic selenium is more likely to be transported to the above-ground parts, while Se (IV) predominantly remains in the root system [58]. The preferential Cd uptake in rapeseed and rice roots stems from Cd2+’s higher bioavailability via cation transporters (e.g., OsNramp5 with Km = 0.8 μM for Cd) compared to Se’s anionic forms (SeO32−/SeO42−), which compete with PO43−/SO42− [59,60]. It can be seen that the absorption rate of Se in all parts of the oilseed rape plants was low, but Cd had a strong enrichment capacity in all of the plant parts, especially in the roots. This enrichment ability of Cd may be due to the special absorption and enrichment mechanism of oilseed rape roots. Because Cd is a known harmful heavy metal, high Cd levels in oilseed rape may limit its suitability as a food source. However, Cd ions are polar, whereas oils and fats are nonpolar, and the two are not miscible. Therefore, Cd in oilseed rape does not affect the quality of canola oil.
Therefore, this paper proposes that farmers use the oilseed rape/rice intercropping model of farming to enrich oilseed rape with Cd to reduce the Cd content in rice. The oilseed rape/rice rotation system in Se-rich regions can serve as a powerful strategy to combat Cd contamination. Planting canola first allows for a significant reduction in Cd levels in the soil due to the crop’s high uptake rate of this pollutant. After harvesting the canola, rice can be planted, ensuring the safety of the rice while also enhancing the economic performance of the farmland (Figure 9). Embracing this approach can allow China to achieve significant ecological benefits while simultaneously enhancing economic returns [31,33].

4. Conclusions

The soil Se content in the study area ranged from 0.18 to 3.84 mg kg−1, with an average content of 0.62 mg kg−1. Most of the areas in the study area showed Se-rich soil. The average soil Cd content in the study area was 0.36 mg kg−1. Some areas were considered potential high-risk areas and require control measures; as such, the proposed method in this paper entails the implementation of a rape–rice rotation system to mitigate cadmium absorption from the soil.
In the study area, there was a moderate positive correlation between Se and Cd in Se-rich soil (r = 0.62). Additionally, there was a positive correlation between the level of Se and OM in the soil (r = 0.60), which suggested that OM plays an important role as a carrier of Se in the soil. The soil health scoring model that was constructed performed well on the training set, with an R2 value of 0.93 and an MSE value of 15.9. This indicated that the model can be used for the estimation of soil health scores.
The Se content of rice ranges from 0.07 to 0.28 mg kg−1, with an average of 0.12 mg kg−1. However, the Se concentration in the rice in this study was higher than previously found in the province. The average absorption rate of Se in the rice in this study was 34.23%, while the average absorption rate of Cd was 76.70%. The average uptakes of Se by the oilseed rape stems and roots were 44.40% and 45.94%, respectively, and the uptakes of Cd were 78.47% and 158.64%, respectively. The overall enrichment ability of Se and Cd is stronger in oilseed rape than it is in rice. Since Cd is a heavy metal and its ions are polar, given that oils are non-polar, the two do not mix. Their solubility in rapeseed oil is extremely low. Therefore, even if the cadmium content in the roots and stems of rapeseed is high, it will not significantly impact the quality of the rapeseed oil. Furthermore, the primary accumulation sites of oil are in the roots and stems, while the concentration in the seeds is comparatively lower. A correlation study examining Se and Cd in soil with crops revealed no correlation between the Se content in the two crops. However, the Cd content in the stems of oilseed rape was highly significantly correlated with the levels found in both the soil and roots, whereas the correlation with rice was only significant. This suggests that the overall enrichment ability of Se and Cd in oilseed rape is stronger than it is in rice. Even though the soil in the study area is naturally rich in Se, there is a potential risk of Cd exceeding the standard of Cd risk. To mitigate the risk of Cd pollution, therefore, rotating between oilseed rape and rice can be beneficial. Low-Cd rice grown in Se-rich areas commands a higher market price. Expanding sales channels for Se-rich and low-Cd rice can further increase farmers’ income.

Supplementary Materials

The following supporting information can be downloaded at: https://www.mdpi.com/article/10.3390/agriculture15111149/s1. Figure S1: The concentrations and risk assessment of Cd in soil of the Yichun area. a: Baimu Township; b: Binjiang Town; c: Jinrui Town; d: Nanmu Township; e: Tiantai Town.

Author Contributions

Conceptualization, Z.Z., N.H. and X.S.; investigation, N.H., F.H. and C.H.; data curation, Y.S., D.Y. and Z.Z.; writing—original draft preparation, N.H. and Y.S.; writing—review and editing, X.L., Z.Z. and X.S.; visualization, Y.S. and D.Y.; funding acquisition, Z.Z. All authors have read and agreed to the published version of the manuscript.

Funding

This work was supported by the National Science Foundation of China (grant numbers 72364034), Science and Technology Research Project of Jiangxi Provincial Department of Education (grant numbers GJJ2201734), Humanities and Social Science Research Project of Jiangxi Provincial University (grant numbers JC21210).

Institutional Review Board Statement

Not applicable.

Data Availability Statement

The original contributions presented in this study are included in the article/Supplementary Material. Further inquiries can be directed to the corresponding authors.

Acknowledgments

We thank the Institute of Geophysical and Geochemical Exploration, Chinese Academy of Geological Sciences, and the Yunnan Bureau of Geological and Mineral Exploration and Development for their technical assistance in soil and crop testing.

Conflicts of Interest

The authors declare that they have no conflicts of interest.

References

  1. Brown, K.M.; Arthur, J.R. Selenium, selenoproteins and human health: A review. Public Health Nutr. 2001, 4, 593–599. [Google Scholar] [CrossRef] [PubMed]
  2. Roman, M.; Jitaru, P.; Barbante, C. Selenium biochemistry and its role for human health. Metallomics 2014, 6, 25–54. [Google Scholar] [CrossRef] [PubMed]
  3. Fordyce, F.M. Selenium deficiency and toxicity in the environment. In Essentials of Medical Geology; Selinus, O., Ed.; Springer: New York, NY, USA, 2013; pp. 375–416. [Google Scholar] [CrossRef]
  4. Shi, Z.; Pan, P.; Feng, Y.; Kan, Z.; Li, Z.; Wei, F. Environmental water chemistry and possible correlation with Kaschin-Beck Disease (KBD) in northwestern Sichuan, China. Environ. Int. 2017, 99, 282–292. [Google Scholar] [CrossRef] [PubMed]
  5. Wang, Z.; Gao, Y. Biogeochemical cycling of selenium in Chinese environments. Appl. Geochem. 2001, 16, 1345–1351. [Google Scholar] [CrossRef]
  6. Sargsyan, E.; Witkowska, K.; Park, K.; Gladyshev, V.N. Molecular mechanisms of selenium-induced neurotoxicity through misincorporation into protein disulfide bonds. Redox Biol. 2020, 34, 101521. [Google Scholar] [CrossRef]
  7. Köhrle, J. Selenium and the thyroid: A close-knit connection in health and disease. Nat. Rev. Endocrinol. 2020, 16, 265–266. [Google Scholar] [CrossRef]
  8. Xu, Z.; Shao, H.; Li, S.; Zheng, C. Relationships between the selenium content in flue-cured tobacco leaves and the selenium content in soil in Enshi, China tobacco-growing area. Pak. J. Bot. 2012, 44, 1563–1568. [Google Scholar]
  9. Dinh, Q.T.; Cui, Z.; Huang, J.; Tran, T.A.T.; Wang, D.; Yanga, W.; Zhou, F.; Wang, M.; Yu, D.; Liang, D. Selenium distribution in the Chinese environment and its relationship with human health: A review. Environ. Int. 2018, 112, 294–309. [Google Scholar] [CrossRef]
  10. Wang, J.; Li, H.; Yang, L.; Li, Y.; Wei, B.; Yu, J.; Feng, F. Distribution and translocation of selenium from soil to highland barley in the Tibetan Plateau Kashin-Beck disease area. Environ. Geochem. Health 2017, 39, 221–229. [Google Scholar] [CrossRef]
  11. Chang, C.; Chen, C.; Yin, R.; Shen, Y.; Mao, K.; Yang, Z.; Feng, X.; Zhang, H. Bioaccumulation of Hg in rice leaf facilitates selenium bioaccumulation in rice (Oryza sativa L.) leaf in the Wanshan mercury mine. Environ. Sci. Technol. 2021, 54, 3228–3236. [Google Scholar] [CrossRef]
  12. Yang, B.B.; Yang, C.; Shao, Z.Y.; Wang, H.; Zan, S.T.; Zhu, M.; Zhou, S.B.; Yang, R.Y. Selenium (Se) does not reduce cadmium (Cd) uptake and translocation in rice (Oryza sativa L.) in naturally occurred Se-rich paddy fields with a high geological background of Cd. Bull. Environ. Contam. Toxicol. 2019, 103, 127–132. [Google Scholar] [CrossRef] [PubMed]
  13. Zhang, Z.; Yuan, L.; Qi, S.; Yin, X. The threshold effect between the soil bioavailable molar Se: Cd ratio and the accumulation of Cd in corn (Zea mays L.) from natural Se-Cd rich soils. Sci. Total Environ. 2019, 688, 1228–1235. [Google Scholar] [CrossRef] [PubMed]
  14. Arasimowicz-Jelonek, M.; Floryszak-Wieczorek, J.; Gwóźdź, E.A. The message of nitric oxide in cadmium challenged plants. Plant Sci. 2011, 181, 612–620. [Google Scholar] [CrossRef] [PubMed]
  15. Hamid, Y.; Tang, L.; Sohail, M.I.; Cao, X.; Hussain, B.; Aziz, M.Z.; Usman, M.; He, Z.L.; Yang, X. An explanation of soil amendments to reduce cadmium phytoavailability and transfer to food chain. Sci. Total Environ. 2019, 660, 80–96. [Google Scholar] [CrossRef] [PubMed]
  16. Domingo, J.L.; Marquès, M. The effects of some essential and toxic metals/metalloids in COVID-19: A review. Food Chem. Toxicol. 2021, 152, 112161. [Google Scholar] [CrossRef]
  17. Esplugas, R.; Mari, M.; Marquès, M.; Schuhmacher, M.; Domingo, J.L.; Nadal, M. Biomonitoring of trace elements in hair of schoolchildren living near a hazardous waste incinerator—A 20 years follow-up. Toxics 2019, 7, 52. [Google Scholar] [CrossRef]
  18. Lippert, J.; Montgomery, J.; DeMarco, C. Lead health fairs: A community-based approach to addressing lead exposure in Chicago. Health Educ. Behav. 2020, 48, 758–768. [Google Scholar] [CrossRef]
  19. Mo, A.; Huang, Y.; Gu, Z.; Liu, C.; Wang, J.; Yuan, Y. Health risk assessment and bioaccumulation of heavy metals in Procambarus clarkii from six provinces of China. Environ. Sci. Pollut. Res. 2022, 29, 2539–2546. [Google Scholar] [CrossRef]
  20. Rahman, M.S.; Saha, N.; Kumar, S.; Khan, M.D.H.; Islam, A.R.M.T.; Khan, M.N.I. Coupling of redundancy analysis with geochemistry and mineralogy to assess the behavior of dust arsenic as a base of risk estimation in Dhaka, Bangladesh. Chemosphere 2022, 287, 132048. [Google Scholar] [CrossRef]
  21. Subhani, M.; Mustafa, I.; Alamdar, A.; Katsoyiannis, I.A.; Ali, N.; Huang, Q.; Peng, S.; Shen, H.; Eqani, S.A.M.A.S. Arsenic levels from different land-use settings in Pakistan: Bio-accumulation and estimation of potential human health risk via dust exposure. Ecotoxicol. Environ. Saf. 2015, 115, 187–194. [Google Scholar] [CrossRef]
  22. Sundseth, K.; Pacyna, J.M.; Pacyna, E.G.; Pirrone, N.; Thorne, R.J. Global sources and pathways of mercury in the context of human health. Int. J. Environ. Res. Public Health 2017, 14, 105. [Google Scholar] [CrossRef] [PubMed]
  23. Zhou, B.; Zeng, X.; Wang, Q.; Liu, Y.; Liu, X.; Wu, Y.; Gong, Z.; Fang, M. Exposure and health risk assessment of heavy metal in crayfish from the middle and lower reaches of the Yangtze River. Biol. Trace Elem. Res. 2024, 202, 332–345. [Google Scholar] [CrossRef] [PubMed]
  24. Ding, Y.; Wang, R.; Guo, J.; Wu, F.; Xu, Y.; Feng, R. The effect of selenium on the subcellular distribution of antimony to regulate the toxicity of antimony in paddy rice. Environ. Sci. Pollut. Res. 2015, 22, 5111–5123. [Google Scholar] [CrossRef]
  25. Kumar, A.; Singh, R.P.; Singh, P.K.; Awasthi, S.; Chakrabarty, D.; Trivedi, P.K.; Tripathi, R.D. Selenium ameliorates arsenic induced oxidative stress through modulation of antioxidant enzymes and thiols in rice (Oryza sativa L.). Ecotoxicology 2014, 23, 1153–1163. [Google Scholar] [CrossRef]
  26. Wan, Y.; Yu, Y.; Wang, Q.; Qiao, Y.; Li, H. Cadmium uptake dynamics and translocation in rice seedling: Influence of different forms of selenium. Ecotoxicol. Environ. Saf. 2016, 133, 127–134. [Google Scholar] [CrossRef] [PubMed]
  27. Wang, Y.; Dang, F.; Evans, R.D.; Zhong, H.; Zhao, J.; Zhou, D. Mechanistic understanding of MeHg-Se antagonism in soil-rice systems: The key role of antagonism in soil. Sci. Rep. 2016, 6, 19477. [Google Scholar] [CrossRef]
  28. Ding, Y.; Feng, R.W.; Wang, R.; Guo, J.; Zheng, X. A dual effect of Se on Cd toxicity: Evidence from plant growth, root morphology and responses of the antioxidative systems of paddy rice. Plant Soil 2013, 375, 289–301. [Google Scholar] [CrossRef]
  29. Feng, R.W.; Zhao, P.P.; Zhu, Y.M.; Yang, J.G.; Wei, X.Q.; Yang, L.; Liu, H.; Rensing, C.; Ding, Y.Z. Application of inorganic selenium to reduce accumulation and toxicity of heavy metals (metalloids) in plants: The main mechanisms, concerns and risks. Sci. Total Environ. 2021, 771, 144776. [Google Scholar] [CrossRef]
  30. Guo, Y.; Mao, K.; Cao, H.; Ali, W.; Lei, D.; Teng, D.; Chang, C.; Yang, X.; Yang, Q.; Niazi, N.K.; et al. Exogenous selenium (cadmium) inhibits the absorption and transportation of cadmium (selenium) in rice. Environ. Pollut. 2021, 268, 115829. [Google Scholar] [CrossRef]
  31. Yang, Y.; Zhou, X.; Tie, B.; Peng, L.; Li, H.; Wang, K.; Zeng, Q. Comparison of three types of oil crop rotation systems for effective use and remediation of heavy metal contaminated agricultural soil. Chemosphere 2017, 188, 148–156. [Google Scholar] [CrossRef]
  32. Yang, Y.; Xiao, C.; Wang, F.; Peng, L.; Zeng, Q.; Luo, S. Assessment of the potential for phytoremediation of cadmium polluted soils by various crop rotation patterns based on the annual input and output fluxes. J. Hazard. Mater. 2022, 423, 127183. [Google Scholar] [CrossRef] [PubMed]
  33. Zhou, J.; Chen, L.H.; Peng, L.; Luo, S.; Zeng, Q.R. Phytoremediation of heavy metals under an oil crop rotation and treatment of biochar from contaminated biomass for safe use. Chemosphere 2020, 247, 125856. [Google Scholar] [CrossRef] [PubMed]
  34. GB15618-2018; Soil Environmental Quality: Risk Control Standard for Soil Contamination of Agricultural Land (Trial). Environmental Standards. Ministry of Ecology and Environment of China, China Environmental Science Press: Beijing, China, 2018.
  35. Li, X.; Yang, H.; McGrath, S.P. Cadmium bioavailability in contrasting soils under rice-wheat rotation: The role of soil selenium. Chemosphere 2019, 235, 550–558. [Google Scholar] [CrossRef]
  36. Zhu, Y.; Zhao, C.; Li, H.; Smith, S.E.; Smith, F.A. Geogenic cadmium pollution in multi-metal mining areas: A case study in Se-rich soils of Enshi, China. Environ. Sci. Technol. 2022, 56, 1623–1632. [Google Scholar]
  37. Yang, R.; He, Y.; Luo, L.; Zhu, M.; Zan, S.; Guo, F.; Wang, B.; Yang, B. The interaction between selenium and cadmium in the soil-rice-human continuum in an area with high geological background of selenium and cadmium. Ecotoxicol. Environ. Saf. 2021, 222, 112516. [Google Scholar] [CrossRef]
  38. NY/T 1104-2006; Agricultural Industry Standards of the People’s Republic of China: Determination of Selenium in Soils. Ministry of Agriculture of the People’s Republic of China: Beijing, China, 2006.
  39. GB2762-2017; National Standard for Food Safety: Limits for Contaminants in Food. Environmental Standards. Ministry of Ecology and Environment of China, China Environmental Science Press: Beijing, China, 2017.
  40. GB 5009.93–2017; National standards of the People’s Republic of China: National Food Safety Standard for the Determination of Se in Food. National Health and Family Planning Commission of the People’s Republic of China and National Medical Products Administration of the People’s Republic of China: Beijing, China, 2017.
  41. Tan, J.A.; Zhu, W.; Wang, W.; Li, R.; Hou, S.; Wang, D.; Yang, L. Selenium in soil and endemic diseases in China. Sci. Total Environ. 2002, 284, 227–235. [Google Scholar] [CrossRef]
  42. Liu, K.; Cai, H.S.; Zhang, X.L.; He, Q.G. Spatial correlation and influencing factors of soil selenium and heavy metal content in Yuanzhou district. Southwest China J. Agric. Sci. 2023, 36, 1492–1503. [Google Scholar]
  43. Natasha, M.S.; Niazi, N.K.; Khalid, S.; Murtaza, B.; Bibi, I.; Rashid, M.I. A critical review of selenium biogeochemical behavior in soil-plant system with an inference to human health. Environ. Pollut. 2018, 234, 915–934. [Google Scholar] [CrossRef]
  44. Zhao, Z.G. Selenium Health & Selenium Products; Science and Technology Literature Press: Beijing, China, 2022. [Google Scholar]
  45. Wang, J.; Li, H.R.; Li, Y.H.; Yu, J.P.; Yang, L.S.; Feng, F.J.; Chen, Z. Speciation, distribution and bioavailability of soil selenium in the Tibetan plateau KashinBeck disease area-a case study in Songpan County, Sichuan Province, China. Biol. Trace Elem. Res. 2013, 156, 367–375. [Google Scholar] [CrossRef]
  46. Zhang, L.; Zhang, N.; Zhang, Y.; Deng, H.; Yang, H. Spatial Distribution of Se Content and Its Influencing Factors in Cultivated Topsoil in Yunnan. Soils 2021, 53, 578–584. [Google Scholar] [CrossRef]
  47. Doane, T.A.; Horwáth, W.R. Soil organic matter decomposition and nitrogen mineralization in soil. Biol. Fertil. Soils 2003, 38, 219–227. [Google Scholar] [CrossRef]
  48. Lyu, C.; Chen, J.; Li, L.; Zhao, Z.; Liu, X. Characteristics of Se in water-soil-plant system and threshold of soil Se in seleniferous areas in Enshi, China. Sci. Total Environ. 2022, 827, 154372. [Google Scholar] [CrossRef] [PubMed]
  49. Chen, Z.; Li, J.; Wang, Y.; Smith, F.A. Arbuscular mycorrhizal fungi enhance selenium uptake and mitigate cadmium toxicity in oilseed rape (Brassica napus L.) through rhizosphere redox regulation. Soil Biol. Biochem. 2023, 176, 108891. [Google Scholar] [CrossRef]
  50. Rinklebe, H.; Shaheen, S.M.; Frohne, T. Redox-induced mobilization of cadmium, selenium, and other trace elements in flooded soils: Mechanisms and management strategies. J. Hazard. Mater. 2020, 384, 121432. [Google Scholar]
  51. Wu, X.; Song, H.; Guan, C.; Zhang, Z. Boron alleviates cadmium toxicity in brassica napus by promoting the chelation of cadmium onto the root cell wall components. Sci. Total Environ. 2020, 728, 138833. [Google Scholar] [CrossRef]
  52. Williams, P.N.; Lombi, E.; Sun, G.X.; Scheckel, K.; Zhu, Y.G.; Feng, X.; Zhu, J.; Carey, A.M.; Adomako, E.; Lawgali, Y.; et al. Selenium characterization in the global rice supply chain. Environ. Sci. Technol. 2009, 43, 6024–6030. [Google Scholar] [CrossRef]
  53. WHO. Vitamin and Mineral Requirements in Human Nutrition, 2nd ed.; World Health Organization and Food and Agriculture Organization of the United Nations: Geneva, Switzerland, 2004. [Google Scholar]
  54. Wen, B.Y.; Zhang, T.L.; Li, X.Z.; Xie, Z.D. A feasibility study of selenium-rich soil development in Longnan County of Jiangxi Province. Geol. China 2014, 41, 256–263. (In Chinese) [Google Scholar]
  55. Fujiwara, Y.; Lee, J.Y.; Tokumoto, M.; Satoh, M. Cadmium renal toxicity via apoptotic pathways. Biol. Pharm. Bull. 2012, 35, 1892–1897. [Google Scholar] [CrossRef]
  56. Liu, Y.; Liu, S.; Zhao, W.; Xia, C.; Wu, M.; Wang, Q.; Wang, Z.; Jiang, Y.; Zuza, A.V.; Tian, X. Assessment of heavy metals should be performed before the development of the selenium-rich soil: A case study in China. Environ. Res. 2022, 210, 112990. [Google Scholar] [CrossRef]
  57. Chang, C.; Zhang, H.; Huang, F.; Feng, X. Understanding the translocation and bioaccumulation of cadmium in the Enshi seleniferous area, China: Possible impact by the interaction of Se and Cd. Environ. Pollut. 2022, 300, 118927. [Google Scholar] [CrossRef]
  58. Broadley, M.R.; White, P.J.; Bryson, R.J.; Meacham, M.C.; Bowen, H.C.; Johnson, S.E.; Zhao, F.J. Biofortification of UK food crops with selenium. Plant Physiol. 2010, 153, 989–996. [Google Scholar] [CrossRef] [PubMed]
  59. Schiavon, M.; Pilon-Smits, E.A.H.; Wirtz, M.; Hell, R.; Malagoli, M. Selenium fertilization alters sulfur and selenium metabolism in Brassica juncea. J. Exp. Bot. 2015, 66, 6011–6023. [Google Scholar] [CrossRef]
  60. Uraguchi, S.; Kamiya, T.; Sakamoto, T.; Kasai, K.; Sato, Y.; Nagamura, Y.; Kyozuka, J.; Fujiwara, T. Low-affinity cation transporter (OsLCT1) regulates cadmium transport into rice grains. Plant Cell 2011, 23, 648–664. [Google Scholar] [CrossRef] [PubMed]
Figure 1. Locations of study areas and sampling sites in Yuanzhou District, Yichun, Jiangxi Province, China. (a) Baimu Township; (b) Binjiang Town; (c) Jinrui Town; (d) Nanmu Township; (e) Tiantai Town.
Agriculture 15 01149 g001
Figure 2. The concentrations and spatial distribution of Se in the selenium-rich soil of the Yichun area. (a) Baimu Township; (b) Binjiang Town; (c) Jinrui Town; (d) Nanmu Township; (e) Tiantai Town. (A) Box plot of Se content in each region. (B) Maps of Se enrichment in each region.
Agriculture 15 01149 g002
Figure 3. The concentrations and risk assessment of Cd in the selenium-rich soil of the Yichun area. (a) Baimu Township; (b) Binjiang Town; (c) Jinrui Town; (d) Nanmu Township; (e) Tiantai Town. (A) Box plot of Cd content in each region. (B) Maps of Cd risk level in each region.
Agriculture 15 01149 g003
Figure 4. Pearson’s correlation analysis between heavy metal content and fractions in soil profile (A), and soil health scores in the selenium-rich soil of Yichun area (B).
Agriculture 15 01149 g004
Figure 5. The accumulation of Se-Cd in soil and the tissues of oilseed rape. (A) The accumulation of Se-Cd in soil and the tissues of oilseed rape. (B) Comparison of Se-Cd content in stem and root of oilseed rape.
Agriculture 15 01149 g005
Figure 6. Heat map of Se-Cd correlation analysis between stem and root of oilseed rape and soil.
Agriculture 15 01149 g006
Figure 7. The accumulation of Se-Cd in soil and the tissues of rice.
Agriculture 15 01149 g007
Figure 8. Heat map of Se-Cd correlation analysis between rice and soil.
Agriculture 15 01149 g008
Figure 9. The pattern of Cd reduction in oilseed rape–rice rotation.
Agriculture 15 01149 g009
Table 1. The acreage of sampling sites.
NumberSiteLongitudeLatitude
aBaimu Country114.50°–114.55° E27.75°–27.80° N
bBinjiang Town114.65°–114.73° E27.85°–27.92° N
cJinrui Town114.35°–114.42° E27.68°–27.75° N
dNanmu Country114.58°–114.65° E27.60°–27.67° N
eTiantai Town114.78°–114.85° E27.95°–28.02° N
Table 2. Risk assessment values in agricultural soil (mg kg−1) [34].
Heavy MetalpHHigh RiskPotential RiskLow RiskNon-Risk
AspH ≤ 5.5>30.0018.0–30.009.00–18.00<9.00
5.5 < pH ≤ 6.5>30.0018.0–30.009.00–18.00<9.00
6.5 < pH ≤ 7.5>25.0025.00–15.007.50–15.00<7.50
pH ≥ 7.5>20.0012.00–20.006.00–12.00<6.00
CdpH ≤ 5.5>0.30.18–0.30.09–0.18<0.09
5.5 < pH ≤ 6.5>0.40.24–0.40.12–0.24<0.12
6.5 < pH ≤ 7.5>0.60.36–0.60.18–0.36<0.18
pH ≥ 7.5>0.80.48–0.80.24–0.48<0.24
CrpH ≤ 5.5>250.00150.00–250.0075.00–150.00<75.00
5.5 < pH ≤ 6.5>250.00150.00–250.0075.00–150.00<75.00
6.5 < pH ≤ 7.5>300.00180.00–300.0090.00–180.00<90.00
pH ≥ 7.5>350.00210.00–350.00105.00–210.00<105.00
HgpH ≤ 5.5>0.500.30–0.500.15–0.30<0.15
5.5 < pH ≤ 6.5>0.500.30–0.500.15–0.30<0.15
6.5 < pH ≤ 7.5>0.600.36–0.600.18–0.36<0.18
pH ≥ 7.5>1.000.60–1.000.30–0.60<0.30
PbpH ≤ 5.5>80.0048.00–80.0024.00–48.00<24.00
5.5 < pH ≤ 6.5>100.0060.00–10.0030.00–60.00<30.00
6.5 < pH ≤ 7.5>140.0084.00–140.0042.00–84.00<42.00
pH ≥ 7.5>240.00144.00–240.0072.00–144.00<72.00
Table 3. Indicator system and weights of comprehensive soil health scoring model based on Se-Cd principal factor.
DimensionIndicatorIndicator WeightIndicator Properties
Heavy metal contamination risk elements in paddy fieldsCd−0.4
(Non-risk: −0.1,
Low risk: −0.2,
Potential risk: −0.3,
High risk: −0.4)
Negative direction
Hg−0.15
(Non-risk: −0.01,
Low risk: −0.05,
Potential risk: −0.1,
High risk: −0.15)
Negative direction
As−0.15
(Non-risk: −0.01,
Low risk: −0.05,
Potential risk: −0.1,
High risk: −0.15)
Negative direction
Pb−0.15
(Non-risk: −0.01,
Low risk; −0.05,
Potential risk: −0.1,
High risk: −0.15)
Negative direction
Cr−0.15
(Non-risk: −0.01,
Low risk: −0.05,
Potential risk: −0.1,
High risk: −0.15)
Negative direction
Healthy element in paddy fieldsSe0.4
(Se-deficient: 0.1,
Se-marginal: 0.2,
Se-sufficient: 0.3,
Se-rich: 0.4,
Se-excessive: 0)
Positive direction
Fertility indicatorOM0.3Positive direction
Nutrients in paddy fieldsTN0.3Positive direction
Disclaimer/Publisher’s Note: The statements, opinions and data contained in all publications are solely those of the individual author(s) and contributor(s) and not of MDPI and/or the editor(s). MDPI and/or the editor(s) disclaim responsibility for any injury to people or property resulting from any ideas, methods, instructions or products referred to in the content.

