Article

Design and Experiment of Seeding Device for Morchella Planter in Southern Xinjiang Desert

1
College of Mechanical and Electronic Engineering, Tarim University, Alar 843300, China
2
Xinjiang Production and Construction Corps Key Laboratory of Utilization and Equipment of Special Agricultural and Forestry Products in Southern Xinjiang, Alar 843300, China
3
Modern Agricultural Engineering Key Laboratory, Universities of Education Department of Xinjiang Uygur Autonomous Region, Tarim University, Alar 843300, China
*
Author to whom correspondence should be addressed.
Agriculture 2025, 15(11), 1140; https://doi.org/10.3390/agriculture15111140
Submission received: 7 March 2025 / Revised: 14 April 2025 / Accepted: 21 April 2025 / Published: 26 May 2025
(This article belongs to the Section Agricultural Technology)

Abstract

:
In seeding operations, fermented seeds with weak surface energy tend to experience problems such as adhesion, seed leakage, and clogging on the seeder’s end. To improve seed distribution uniformity, a three-stage spiral seeding device with “seed filling, transport, and dispersing” functions was designed. Kinematic and dynamic models of fermented seeds under spiral conveying conditions were developed to analyze the motion and force characteristics of the seeds under various working states. A discrete element method (DEM) and multi-body dynamics (MBD) coupled simulation model was established, along with a comprehensive evaluation system for seed distribution uniformity and seeding effectiveness. The influence of spiral speed, pitch, and forward speed of the seeding operation on seed dispersion uniformity and operational efficiency was studied, and optimal structural and operational parameters for the spiral seeder were selected. A prototype of the spiral seeding device was fabricated, and field seeding tests were conducted. The results showed that when the seeder’s rotational speed was 12 r/min, the pitch was 63 mm, and the forward speed of seeder was 3.5 km/h, the seed distribution uniformity index reached 84.53%, with excellent seeding effectiveness and a comprehensive evaluation index of 92.26%. The field application demonstrated good performance, significantly improving both the operational reliability and efficiency of the spiral seeding device.

1. Introduction

Southern Xinjiang, China, is a typical inland desert arid area. The use of yellow sand substrate to cultivate Morchella can achieve a win-win situation in regard to increasing the yield of Morchella and improving the physical and chemical properties of yellow sand [1]. Morchella is rich in nutritional value, rich in flavor, crisp and tender, and deeply loved by consumers. It also has a relatively high economic value in the current edible fungus industry [2]. According to the market analysis data of Morchella industry, the output of Morchella in China was far more than 240,000 tons in 2023, accounting for more than 99% of the total output of artificial cultivation in the world [3]. The Morchella cultivated in yellow sand matrix in Southern Xinjiang is cultivated in solar greenhouses. However, at present, the sowing methods of Morchella are mostly artificial sowing, with poor sowing uniformity, high labor intensity, poor seed dispersion uniformity, and low operation efficiency, which seriously restrict the large-scale and commercial development of the Morchella industry. Therefore, the design and experiment of morel seeder under yellow sand substrate cultivation mode were carried out, and a crawler self-propelled morel seeder was developed by integrating the agronomy of morel cultivation in facilities to replace the traditional artificial sowing, improve the yield and quality of morel, and promote the sustainable development of edible fungi industry in Southern Xinjiang.
The seeding device is a key component of agricultural seeding operations. According to the different seeding principles and applicable scenarios, it is mainly divided into mechanical, air-suction, air-blowing, and combined seeding devices. Morchella esculenta seeds belong to low-temperature fermentation fungi, which have the characteristics of high moisture content and weak adhesion between particles. The moisture content of seed particles makes it easy to form a granular structure, which is a typical granular material [4]. Considering the characteristics of Morchella seeds, their planting agronomic requirements, and their economic value, the research on related seeding devices at home and abroad is mainly based on mechanical screw conveyors. The screw conveying device has the characteristics of simple structure, convenient operation, and strong scene adaptability, which can meet the requirements of seed-intensive planting of Morchella [5,6]. Among them, Tian et al. [7] designed a spiral groove direct seeding device suitable for hill rice planting, and they studied the influence of seed movement trajectory and rotation speed of rice bud seeds in the spiral groove, and the working length of the spiral wheel on the number of seeds in the ridge. Mei et al. [8] used particle mechanics, continuum mechanics, and particle swarm theory to theoretically model and analyze the mechanism of multi-head vertical spiral conveying, and they established a particle mechanics model for the stable motion of material particles in a vertical spiral unloader. Then, they determined the type of material free surface in the longitudinal section of the conveyor and its discrimination and solution methods. This study determined the pressure distribution law of material particle groups on the conveying pipe wall and spiral surface, providing a theoretical basis for the transportation of material particle groups. Yi et al. [9] improved the structure of the outer groove wheel seeding device and used the uniformity and seeding rate as the evaluation criteria to verify the performance by experimental methods. Karayel et al. [10] explored the problem of poor consistency of seeding spacing of the outer slotted wheel seeding device.
However, when it is applied to fermented seeds with weak surface energy by means of spiral groove forced propulsion, it is easy to cause seed damage, adhesion, seed leakage, and blockage [11,12,13,14], and it is difficult to ensure the uniform growth of Morchella mycelium [15]. For this reason, Chen et al. [16] designed a shaft screw conveyor seeding device which does not easily damage the seed and has good continuity of transportation. However, in the process of transportation, the seed material is easy to squeeze into an agglomerate structure, resulting in the blockage of the discharge port, and the application effect of the bulk material with large water content is poor. Zhu et al. [17] designed a flexible shaftless screw fertilizer device. EDEM simulation was used to carry out quadratic regression orthogonal rotation test and response surface analysis method, and the optimal parameter matching of the flexible shaftless screw fertilizer device was carried out. However, its research fails to fully consider the coupling relationship between the seed and the seed metering device, and the uniformity coefficient of variation is used as a single evaluation standard for parameter matching and seeding performance verification, which has certain limitations.
Therefore, this paper combines the advantages of axial spiral and non-axial spiral, considering the surface parameters of Morchella seeds and multi-factor coupling contact characteristics, a three-stage spiral metering device with the function of “seed filling-conveying-breaking” is designed. By constructing a comprehensive evaluation system of seed seeding uniformity evaluation index and seeding effect evaluation index, the discrete element method (DEM) and multi-body dynamics (MBD) joint simulation method are used to optimize the pitch, screw speed, and seeding speed of the spiral seeding device. The three key parameters were optimized. The parameters of pitch, screw speed, and seeding speed of the spiral seeding device were optimized, and the prototype was trial-produced to carry out field experiments, which verified the feasibility and effectiveness of the design scheme, provide a theoretical basis for the design of seeders with surface energy particle seeds.

2. Materials and Methods

2.1. Overall Structure

A morel mushroom seeder suitable for yellow sand substrate soil in Southern Xinjiang includes a mobile chassis, with crawler-type walking mechanisms installed on both sides of the chassis to adapt to the terrain of the yellow sand substrate. The crawler-type walking mechanism consists of crawler drive wheels controlled by independent drive motors, which can be remotely controlled via the remote-control system to achieve constant speed, enabling automatic cruising of the crawler walking mechanism. The middle section of the mobile chassis is equipped with a seeding module, which is configured with multiple sowing positions. The four-corner lifting mechanism includes a lifting frame capable of vertical movement, with a trenching module and a soil-covering module positioned below the seeding module. The mobile chassis is equipped with a lifting drive mechanism to drive the four corners of the lifting frame to move synchronously, adjusting the sowing depth. This morel mushroom seeder, combining a crawler walking design with adjustable trenching and soil-covering modules, is well-suited for morel mushroom cultivation in Southern Xinjiang’s yellow sand substrate soil. It allows for precise adjustment of sowing depth and seed quantity, improving the seed distribution uniformity index. The detailed structure is shown in Figure 1.

2.2. Structural Design of the Spiral Seeding Device

The spiral seeding device continuously conveys seeds by using spiral blades and consists of a seed box, spiral components, and a seeding tube, as shown in Figure 2.
The working process of the spiral seeder is divided into three stages based on the structure of the spiral component and the position of the seeds during the seeding process: seed filling, conveying, and dispersing stages [18,19]. The seed filling stage is located inside the seed box, where a shafted spiral extends upward from the bottom of the box by two pitch lengths. The motor drives the spiral shaft to rotate, and the morel mushroom seeds, under their own gravity, enter the spiral groove within the seed box. The seeds are conveyed by the rotating spiral blades into the discharge tube, as shown in Figure 2.
The conveying stage is located in the discharge tube beneath the seed box and is configured with a shafted spiral blade. In this stage, the shafted spiral works in a small clearance with the discharge tube. The seed particles enter the spiral groove formed by the shafted spiral and the discharge tube, and under the effect of the rotating spiral blade and the restriction of the tube wall, along with the gravitational force of the seeds, the spiral blade rotates one full turn, moving the seeds downward by one pitch. The seed quantity can be precisely controlled by adjusting the motor speed.
The dispersing stage is located below the conveying stage and is configured with a shaftless spiral blade that is twice the length of the pitch. In this stage, the seeds are forced out of the conveying section by the power of pushing from the spiral blade, and under the combined influence of thrust and gravity, the seed particles fall along the shaftless spiral blade, with some of the scattered seeds falling through the hollow shaft.
Under the condition of ensuring sufficient and stable seed intake, the seeds in the device maintain a stable filling coefficient [20]. Therefore, by reasonably designing the spiral parameters, the seeding amount can be controlled, and good uniformity can be achieved. To analyze the factors affecting the uniformity of the seeder during operation, a detailed force analysis of the particles at each stage was conducted. Seeds in the spiral movement state effectively reduces the bonding force between the seeds, when out of the constraints of the spiral groove and the spiral thrust, the seeds are freely dispersed along the seed discharge tube in the grooves opened by the trenchers.

2.2.1. Seed Filling Stage

In the seed filling stage, the seed particles enter the shafted spiral seeder under their own gravity and are gradually fed into the spiral seeding trough. As the spiral seeder rotates, the seed particles are forced into the next pitch [21]. The fixed reference frame, oxyz, is established based on the seeding tube, while the dynamic reference frame, O’XYZ, is established based on the rotating spiral seeding shaft. The axes of the seeding tube and the spiral seeder are aligned along the z-axis and Z-axis, respectively, and they coincide with each other, as shown in Figure 2.
Randomly selected seed particles, i, are taken as the research object. Since morel mushroom seeds are fermented, the particles exhibit weak surface energy, resulting in pressure between the seeds, and the interaction between adjacent particles cannot be ignored. Given the large number of seed particles, the pressure is directly analogized to that of a liquid. The pressure formula is as follows:
F f i = ρ g s h ,
where ρ is the seed density, g is the gravitational acceleration, s is the maximum cross-sectional area of the particles, and F f i is pressure force.
The height, h, of seeds in the seed box is related to the particle transfer capacity. Assuming that the particle storage is always level, the pressure force formula is as follows:
h = W Q t ρ s ,
where h is the total height of the seeds at this time, W is the initial total seed weight, Q is the seed transport capacity, s is the bottom area of the seed box, and t is time.
Assume that, at a certain moment, t, seed particle i enters the outer contour of the spiral seeder, sliding relative to the spiral surface, and that the velocity of seed i is the same as the tangential velocity of the outer edge of the spiral seeder. A force analysis of seed i at this moment is performed, and the initial force state of the particle is shown in Figure 3.
At this moment, t, the forces acting on particle i include gravity, Gi; sliding friction, Fi; the supporting force from the spiral surface, Ni; connected inertial force, Fe1; and Coriolis force, Fc1. The dynamic equation for seed i is as follows:
F i = G i + F f i ( μ N i ) + N i + F e 1 + F c 1 = G i + μ i N i + N i + m i ω i 2 r i + 2 m i w v i ,
where mi is the mass of the selected particle, in kg; s is the cross-sectional area of the seed particle, in m2; ωi is the angular velocity of the spiral seeder, in rad/s; vi is the relative velocity of the particle with respect to the spiral seeder, in m/s; ri is the distance from the particle’s center of mass to the Z-axis, in m; ω is the relative angular velocity of the particle’s center of mass with respect to the Z-axis, in rad/s; and μ is the coefficient of friction between the particle and the spiral surface of the seeder.
Clearly, in the seed filling stage, the interaction between the adjacent seed particles and the selected particle, i, must be considered. Since the relative angular velocity of particle i with respect to the outer edge of the spiral seeder is very small, it can be ignored. Therefore, the formulas for calculating the normal and tangential accelerations of particle i at this moment are as follows:
a r n = G i s i n β 2 m i ω i v i N i m i
a r τ = μ N i G i c o s a m i ,
In the normal seed filling state of the spiral seeder, seed particle i can only slide relative to the spiral surface, i.e.,
a r n = 0
a r τ = d v i d t = d 2 s i d t 2 ,
N i = G i s i n β 2 m i w v i ,
a r τ = u i ( G i s i n β 2 m i w v i ) G i c o s β m i
a r τ = G i ( u i s i n β c o s β ) m i 2 u i w v i
d v i d t = G i ( v i s i n β c o s β ) m i 2 w u i v i
v i = a r τ d t = 1 2 u i w G i ( u i s i n β c o s β ) m i c e 2 u i w t
Under initial conditions, we have the following:
v i t = v 0 = w r i ,
Then, we need the following:
c = G i ( u i s i n β c o s β ) m i 2 w 2 r i v i ,
where α is the spiral angle of the spiral surface (°).
In the normal seed filling state of the spiral seeder, seed particle i can only slide relative to the spiral surface. The acceleration formula is as follows:
v i = e 2 t μ i ω ω r i g ( μ i sin α cos α ) ( e 2 t μ i ω 1 ) 2 μ i ω ,
At this moment, the absolute velocity, va, of particle i; the tangential velocity, ve, of the outer edge of the spiral seeder; and the relative velocity of particle i along the outer edge of the spiral seeder are part of the following:
v a = v e + v i ,
In the equation, ve > vi > 0 and is in the same direction as the tangential velocity of the outer edge of the spiral seeder. Seed particle i begins to slide along the outer edge of the spiral seeder with relative velocity, vi, and the interaction with adjacent particles and the spiral surface drives particle i into the next pitch, thus completing the seed filling process. From Equation (16), it can be seen that the seed filling process of particle i is related to the angular velocity, ω, of the spiral seeder (seeder rotation speed n); the distance from the center of mass of the particle on the outer edge of the spiral to the Z-axis (spiral seeder diameter D); and the spiral angle of the spiral surface, α (pitch S).

2.2.2. Conveying Stage

When seed particles complete the seed filling stage and enter the conveying stage, as the spiral blades rotate, the seed particles that entered the seeding tube during the seed filling stage will be conveyed to the next pitch [22]. As the spiral seeder continues to rotate, after a time interval of ∆t, the seed particles are delivered to the bottom of the spiral seeder and leave the conveying section under the influence of gravity and the forced thrust of the spiral blades.
Randomly selecting seed particle i as the research object, assume that particle i is at the bottom of the first pitch section of the spiral surface when it enters the conveying process, and at this moment, particle i is stationary relative to the spiral surface. Using the fixed reference frame, oxyz, established during the seed filling stage, and the dynamic reference coordinate system, O’XYZ, based on the rotating spiral seeding shaft, the force analysis of seed particle i before it enters the next pitch section is performed, as shown in Figure 4.
At this moment, the dynamic equation for seed particle is as follows:
G i + F i + F e 2 + F c 2 + N + N i = 0 ,
where Gi is the gravitational force on seed particle i; Fi is the static friction force; Fe2 is the connected inertial force; Fc2 is the Coriolis force; N is the support force from the seed box wall on the seed particle; and Ni is the support force from the spiral surface on the seed particle.
Since seed particle i has not undergone relative displacement, the Coriolis force, Fc2, is zero. When seed particle i begins to slide, it starts to exhibit relative motion along the spiral surface and moves away from the seed box. At this point, the support force, N, is zero. The force situation is shown in Figure 5.
At the moment seed particle i begins to slide, its motion trend is along the spiral surface, and the particle is subjected to static friction. It is assumed that the direction of the static friction force is the same as the direction of the impending motion trend. The static friction force is projected onto the coordinate plane, XO’Z, and the angle between the static friction force (Fi) and its projection plane is γ. As shown in Figure 5, the larger the angle γ, the more the relative motion trajectory of particle i approaches the Y-axis, making it easier to enter the next pitch, while the sliding distance along the Z-axis becomes smaller. Conversely, the smaller the angle γ, the harder it is for particle i to enter the next pitch, and the seed filling coefficient within the pitch decreases. By projecting Equation (17) onto the X, Y, and Z axes, the mechanical equation for seed particle i at the moment of sliding is as follows:
F e 2 + N i c o s θ = 0 ,
N i s i n θ F i s i n γ = 0 ,
ρ g h s m i g + F i c o s γ s i n a + N i c o s θ = 0 ,
F e 2 = m i ω 2 r i ,
F i = u i r i ,
where θ is the angle between the X-axis and the x-axis, in (°); mi is the mass of the seed particle; ri is the distance from the seed particle’s center of mass to the Z-axis; and μi is the coefficient of friction between the particle and the spiral surface of the spiral seeder.
By solving Equations (18)–(22), we obtain the following:
tan γ = r i ω 2 sin θ cos α g cos θ r i ω 2 sin α ,
From Equation (23), it can be seen that the angle γ is related to the angular velocity ω of the spiral seeder (seeder rotation speed n), the distance from the center of mass of the particle on the outer edge of the spiral to the Z-axis (spiral seeder diameter D), the initial angle θ at which the particle begins to slide, and the spiral angle α of the spiral surface (pitch S).

2.2.3. Dispersing Stage

When the seeds enter the equal dispersing stage of the hollow shaft spiral, as the spiral seeder rotates, the seeds are discharged from the seed feeding section into the dispersing section. Since the dispersing section is designed with a hollow spiral blade, the seed particles suddenly lose support from the core shaft. As a result, the force state of the seed particles changes. Some scattered seeds fall through the hollow shaft, while the remaining agglomerated seeds and some scattered seeds fall from the hollow spiral surface, ignoring collision issues [23].
At time t, assuming that the seed particles enter the equal dispersing stage, their force state is shown in Figure 6.
The force distribution of seeds during the dispersing Stage can be divided into four types: The first case occurs when the seed particle suddenly loses support from the core shaft and slides out from the hollow shaft side; The second case occurs when the seed particle stays on the spiral surface or slides out and is positioned at the bottom; The third case occurs when the seed particle stays on the spiral surface and remains in the middle; The fourth case occurs when the seed particle stays on the spiral surface and is located on the outer side.
The variations in the forces are shown in Figure 6. Since the velocity does not change immediately, the horizontal force toward the outside includes the connected inertial force (Fe1) and Coriolis force (Fc1), and the other forces are as follows:
For the first case, when the seed particle suddenly loses support from the inner side and slides out from the inner side, the force equation is as follows:
F i = G i + N i + F e 1 + F c 1 ,
F i = G i tan 6 0 ° F e 1 F c 1 ,
The second case occurs when the seed particle stays on the spiral surface or slides out and is positioned at the bottom. The force equation is as follows:
F i = G k + G i + N i + F e 1 + F c 1 + f ( μ N i ) ,
where Gk…… is the particles pressing on the seed from the top, which may be more than one.
When the seed particle does not slide down, we have the following:
N i G k sin 6 0 ° G i = 0 ,
G k cos 60 ° F e 1 F c 1 μ n i = 0 ,
When the seed particle slides down, we have the following:
F = G k cos 6 0 ° F e 1 F c 1 μ N i ,
The third case occurs when the seed particle stays on the spiral surface and remains in the middle. The force equation is as follows:
F i = G k + G l + G i + N i + F e 1 + F c 1 = 0 ,
The fourth case occurs when the seed particle stays on the spiral surface and is located on the outer side. The force equation is as follows:
F i = N c i + G i + N i + F e 1 + F c 1 = 0 ,
where Nci is the support force from the inner surface.
d v x d t = x d 2 y d t 2 + d y d t = y m d 2 x d t 2 = 0 m d 2 y d t 2 = m g ,
y = 1 2 g t 2 + v y t x = v x t ,
From Equation (33), it can be seen that the motion trajectory of the seed particles during the seeding process follows a parabolic path, and the horizontal initial velocity is related to the forward speed of the operating machine. Since the machine operates at a constant speed, only the speed during the initial and final seeding phases changes, while the seeding performance indicators remain almost constant during the uniform-speed operation.
In summary, the diameter, rotational speed, pitch, and forward speed of the spiral seeder are the key parameters affecting seeding uniformity. Based on the practical operational requirements of the spiral seeding device, this paper will conduct theoretical calculations to determine the reasonable range of values for these key parameters.

2.3. Structural Parameter Design

2.3.1. Diameter of the Spiral Seeder

The diameter of the spiral seeder is one of the key parameters of the seeder, directly affecting the coefficient of variation in seeding uniformity. It also determines the seeding rate, which in turn influences the dimensions, installation position, and structure of the trenching device [24]. The diameter of the spiral seeder is designed based on the characteristics of morel mushroom seeds, the structure of the seeder, and the intended use. According to the agronomic requirements for machine seeding, the target seeding rate is set to 3000 kg/hm2, with a ridge width of 1.1 m, and the seeding machine moves at a speed of 3 km/h, seeding an area of 0.33 hm2/h. Since the trenching device is a standard 10 cm wide component, a higher lateral distribution density is beneficial for seeding uniformity. Based on the available installation space, a configuration of 9 rows with 4 in the front and 5 in the rear is selected for the trenching device. Thus, the conveying capacity Q is 0.11 t/h, and the calculation formula for the diameter of the spiral seeder is as follows:
D = K 2.5 Q ϕ ρ c ,
where K is the material transport characteristic coefficient, set to 0.075; and Q is the conveying capacity of the spiral seeder, in t/h.
The nominal diameter (D) and pitch (S) of the spiral seeder are the main parameters affecting the seeding rate. Generally, the calculation formula for the spiral seeding shaft diameter is d = (0.2 − 0.35) D, with a coefficient of 0.3. Therefore, the standard diameter of the spiral seeding shaft is taken as 2.1 cm.

2.3.2. Pitch

The pitch of the spiral seeder not only determines the seeding rate but also has a significant impact on seeding uniformity [25]. Changes in the pitch can lead to variations in the displacement velocity of seed particles. With a fixed conveying capacity Q and diameter D, the pitch is a key factor affecting seeding performance.
Typically, the calculation formula for the pitch of the spiral seeder is as follows:
S = K 1 D ,
where K1 is the coefficient, typically ranging from 0.8 to 1.0, depending on the material flowability.
The spiral seeder designed in this study follows a vertical layout, and since the fermented particles have poor flowability, based on existing design experience, the pitch value is chosen to be 5.6–7.0 cm.

2.3.3. Seeder Rotational Speed

Under the condition that the seeding rate meets the agronomic requirements, the rotational speed of the spiral seeder is designed based on the seeding rate, the diameter of the spiral seeder, and the parameters of the morel mushroom seeds. To minimize the impact of centrifugal force on the seeds, the rotational speed is designed to be as low as possible while ensuring seeding efficiency, so that the gravitational force of the seed and the centripetal force satisfy the seeding conditions [26]. Therefore, the rotational speed is limited to not exceed the critical value. When the particles on the outermost edge of the spiral blades do not experience radial movement, the seed’s own gravitational force should be less than the maximum centrifugal force it experiences, which is expressed as follows:
m ω 2 R m g ,
2 π n m a x 60 g R m g ,
m ( 2 π n 60 ) 2 R m g ,
where m is the mass of the seed, in kg; ω is the angular velocity, in rad/s; R is the spiral radius, in mm; g is the gravitational acceleration, in m2/s.
Considering the influence of different particles, there are the following:
n 30 k π g R = 30 k π 2 g D ,
A = 30 k 2 g π ,
n m a x = A D ,
where A is the material composite coefficient; k is the material composite characteristic coefficient; nmax is the maximum rotational speed of the spiral seeder, in r/min; and n is the actual rotational speed of the spiral seeder, in r/min.
Substituting the diameter D into the maximum rotational speed formula gives nnmax ≤ 11.99 r/min. The seeding capacity per row Q is 0.11 t/h.
The standard integer series for the spiral seeder’s rotational speed is used, and the rotational speed n is adjusted to 12 r/min.

3. Coupled Simulation and Analysis of the Spiral Seeder

The discrete element method (DEM) and multi-body dynamics (MBD) have been increasingly applied in the field of agricultural engineering in recent years. In the three-stage spiral seeder, seeds are separated from the seed mass by the motion of the spiral blades, with the seeds acting as particles. Since the seed particles in the spiral seeder are influenced by inter-seed forces during operation, DEM is used for analysis. Additionally, the spiral seeder operates with both the rotation of the spiral blades and the linear velocity of the entire machine’s displacement, which requires MBD for analysis. The motion trajectory of the seeds to be sown is similar to the spiral trajectory, and since commonly used DEM and MBD simulation software cannot individually meet these requirements, a coupled DEM-MBD approach is adopted for the analysis.

3.1. Coupled Simulation Model Construction

RecurDyn and EDEM coupled simulation uses the relative coordinate system motion equation theory and the full recursive algorithm, making it highly suitable for solving large-scale multi-body system dynamics problems [27,28].
The working process of the three-stage spiral seeder involves various motions. Therefore, a simplified geometric model of the seeder is created using SolidWorks, and the model is imported into RecurDyn in STP format. Constraints, contacts, and other properties are added to build the multi-body dynamics model. Using RecurDyn’s built-in coupling interface, the components of the seeder are imported into EDEM as wall files to create the Discrete Element Model. This is shown in Figure 7.
In accordance with the agronomic requirements for morel mushrooms in the Southern Xinjiang yellow sand substrate, morel mushroom seed particles were randomly selected as experimental materials. Based on prior material property measurements, the seed parameters for morel mushrooms were obtained. A total of 32,000 morel mushroom seed particles were generated at a rate of 5000 seeds per second, in the direction of gravity.
Pre-calibrated discrete element particles with contact parameters were used to set up the particle factory for the morel mushroom seed particles. The intrinsic and contact parameters of the material are crucial during the discrete element simulation process. Intrinsic parameters include material density, Poisson’s ratio, elastic modulus, etc. [4], while contact parameters include collision coefficient, sliding friction coefficient [29], and rolling friction coefficient, the morel mushroom seed particles were generated in EDEM using multi-sphere aggregation filling, as shown in Table 1.
During the operation of the spiral seeding device, the motor drives the spiral blades to rotate, completing the seed filling, conveying, and dispersing of the morel mushroom seeds. Therefore, in RecurDyn, constraints need to be added. The main constraints are as follows: the spiral is added with a rotational joint, using Ground as the reference frame; the seeding tube and seed box are added with translational joints, using Ground as the reference frame. A driving function is added to the rotational joint of the spiral seeder, and when coupled with EDEM, the seeder does not operate during seed generation. According to the actual operation, the morel mushroom seed particles first fall from the seed box into the filling section. Therefore, the mechanism does not move during the seed filling process, as shown in Figure 8.

3.2. Coupled Simulation Scheme and Evaluation Index Construction

The pitch, rotational speed, and forward speed are selected, and a three-factor, three-level coupled simulation scheme is designed, as shown in Table 2.
The naming rule for the experimental scheme is pitch–forward speed–rotational speed (with units: mm, mm/s, and r/s) and seed count (in number of seeds). The seed count statistics are shown in Table 3, as shown in Figure 9.
The grid method is used to statistically analyze the seeding uniformity [30]. The groove is divided into 17 experimental repeat zones, each 500 mm long, along the x-axis. The interval is 500 mm, divided into 17 groups, and the statistical results from the 7th to the 15th interval are used to calculate the seed mean within the interval. In the constant speed interval, the number of seeds within the grids of intervals 7 to 15 is counted. The grid setup is shown in Figure 10.
By calculating the mean values of seed particle statistics from Figure 10, the experimental results are shown in Table 4.

3.3. One-Factor Analysis

3.3.1. Rotational Speed of the Spiral Seeder

Theoretically, the rotational speed of the spiral seeder affects the seeding uniformity. Based on theoretical calculations, in the seeding experiment, the forward speed of the spiral seeder is set to 2.5 km/h, with a pitch of 56 mm. The rotational speeds of 10 r/min, 12 r/min, and 14 r/min are set to study the effect of spiral speed on uniformity and seeding efficiency.
As shown in Figure 11, with the increase in rotational speed, the variation in interval particles is small, showing a trend of increasing first and then decreasing.

3.3.2. Pitch of the Spiral Seeder

In the seeding experiment, the forward speed of the seeder is set to 3 km/h, with a rotational speed of 10 r/min. The pitches are set to 56 mm, 63 mm, and 70 mm to study the effect of pitch on uniformity and seeding efficiency. The results are shown in Figure 12.
As shown in Figure 12, with the increase in pitch, the interval particles show an increasing trend, and the effect of pitch variation on the interval particles is significant. When the pitch increases from 56 mm to 63 mm, the seeding effect improves. However, when the pitch increases from 63 mm to 70 mm, seed leakage begins to appear.

3.3.3. Forward Speed of the Spiral Seeder

The linear speed of the spiral seeder during operation has a certain impact on seeding uniformity. In the experiment, the pitch of the spiral seeder is set to 63 mm, with a rotational speed of 12 r/min. The forward speeds are set to 2.5 km/h, 3 km/h, and 3.5 km/h to study the effect of forward speed on uniformity and seeding efficiency, as shown in Figure 13.
As shown in Figure 13, with the increase in forward speed, the interval particles show a decreasing trend, and the effect of the change in forward speed on the interval particles is quite noticeable.

3.3.4. Analysis of Variance Results

As shown in Table 5, the order of the factors influencing the single-seed rate is pitch, rotational speed, and forward speed, with the interaction between pitch and rotational speed being noteworthy.

3.4. Evaluation Indexes

3.4.1. Construction of Seeding Uniformity Evaluation Index

To accurately assess the impact of different pitch, rotational speed, and forward speed parameters on seeding stability and uniformity in the coupled simulation experiment, the evaluation indexes are constructed based on the experimental methods specified in JB/T 9783-2013 [31].
The seeding uniformity coefficient is used to measure the uniformity of seeding. After the simulation, the discharged seed particles are statistically segmented, and the calculation formula for the average number, N ¯ , of seed particles is as follows:
N ¯ = i = 1 m N i p ,
where Ni is the number of seeds in the interval, and p is the number of measured interval sections.
The calculation formula for the standard deviation of seed count in the sample area is as follows:
σ = i = 1 m ( N i N ¯ ) 2 p 1 ,
The calculation formula for the morel mushroom seed uniformity coefficient is as follows:
E = ( N ¯ σ ) N ¯ × 100 %
The larger the uniformity coefficient, E, the higher the uniformity of seeding, and the better the seeding performance, as shown in Table 6.

3.4.2. Construction of Seeding Performance Evaluation Index

As shown in Table 7, the sowing efficiency, Q, approaches the ideal range, i × N0 (0.1–0.9), indicating optimal sowing performance. When Q > i × N0 (0.1–0.9), the sowing density per unit area exceeds the standard value, leading to oversowing. Conversely, when Q < i × N0 (0.1–0.9), the sowing density is below the standard value, resulting in undersowing. Specifically, i × N0 (0.1–0.9) in the range of (0.1–0.9) indicates undersowing, while i × N0 (0.1–0.9) in the range of (1.1–1.9) indicates oversowing. Based on experimental observations, the optimal number of seeds, N0, for every 500 mm of furrow length is 90 seeds.

3.4.3. Comprehensive Evaluation Indicators

As shown in the formula,
R = a × E + b × Q,
As shown in Table 8, the parameter set 63-974-12 demonstrated the best performance in the comprehensive evaluation and is recommended for further experimental analysis.

3.5. Parameter Optimization Selection

Note: Based on the uniformity evaluation index and operational efficiency evaluation index, the optimal parameters for the prototype of the helical seed metering device were selected, as shown in Table 9.

4. Field Test

4.1. Field Test Materials

In November 2024, a field seeding experiment was conducted at the Tarim University Modern Agricultural Machinery Experimental Training Base in Alar City, Xinjiang. The selected area was a 10 m × 150 m greenhouse, and the soil tested was yellow sand substrate soil after rotary tillage. The soil moisture content (0–100 mm) was 39%.
As show in Figure 14, the main materials tested in the field experiment included morel mushroom seeder, morel mushroom seeds, tape measure, seed collection cloth, electronic scale, etc.

4.2. Test Method

The main objective of the trial was to test the performance of the screw seeder under specific test conditions. According to the agronomic requirements of “morel mushroom” seeding, by measuring the amount and uniformity of seeding and comparing the depth of seeding, it is determined that the seeder is able to meet the agronomic requirements of morel mushroom cultivation. First, the seeder’s trenching device was raised above the soil surface, and a seed collection cloth was placed on the ground to test the seeding rate and uniformity. Then, the seed collection cloth was removed, and the trenching device was set to a depth of 5 cm. The covering device was raised and did not participate in the work. The testing distance for each group was 10 m, with five repetitions for each group, and the average value was taken as the final result, as show in Figure 15.

4.3. Test Design

According to the Box–Behnken experimental design principles, combined with the results of the single-factor experiment, the three factors that have a greater impact on the composite score were selected: pitch, spiral speed, and forward speed, and each of them was taken to three levels, −1, 0, and 1, respectively. The response surface analysis was carried out for a total of 17 experimental points at the factor level, and the data were analyzed using the Design-Expert software to obtain the optimal parameter combinations, as show in Table 10.

4.4. Results Analysis

4.4.1. Comprehensive Evaluation Modelling and Analysis

The response variables were related to the experimental variables by analyzing the experimental data with a quadratic regression equation. Following the second-order polynomial equation, the software was applied to the experimental data in Table 10 to fit the multiple regression to the experimental data, setting the pitch, rotational speed, and forward speed as A, B, and C, respectively, and fitting the multiple regression with the composite score as the response value to obtain the quadratic polynomial regression equation:
Y = 91.25 − 1.54 × A + 2.63 × B + 6.8 × C + 7.59 × AB − 0.76 × AC + 0.37 × BC − 8.65 × A2 − 6.39 × B2 − 3.03 × C2
A multiple regression was fitted with the comprehensive evaluation as the response value, and the results of the regression model coefficients and significance tests are shown in Table 11.
Further regression analysis of the model and regression coefficients, the results are shown in Table 12 and Table 13, from Table 12 it can be seen that the regression model P < 0.0001 (highly significant), and its loss of fit term P = 0.1673 > 0.05 (insignificant), indicating that the model is well fitted, and the regression equation can be predicted by the corresponding regression value, while the model regression coefficient R2 = 0.9864, regulated R2 = 0.9689, indicating that 96.89 per cent of the data can be explained by the model, with a coefficient of variation of 1.90 and (precision) of 22.523, indicating that the equation is highly reliable.

4.4.2. Interaction of Factors

Based on the regression equations, the shapes of the response surface plots and contour plots were examined to analyze the effects of pitch, rotational speed, and forward speed on the composite scores. Response surface plots and contour lines can respond well to the interaction between independent variables. The degree of influence of the two on the response values is determined by observing the steepness of the slope of the response surface plot; the steeper the response surface plot is, the more pronounced the interaction between the two.
As shown in Figure 16a,b’s intersection surface, when the value of the rotational speed is small, the slope of the change in the composite score shows a tendency of first flattening and then decreasing with the increase in pitch; when the value of the rotational speed is large, the slope of the change in the composite score shows a tendency of first increasing and then decreasing with the increase in pitch. The slope tends to increase and then flatten with the increase in rotational speed, and the contour lines are elliptical, which indicates that there is a significant interaction between pitch and rotational speed, and the composite scores achieve the maximum value when the pitch is about 59.5–66.5 mm and the rotational speed is in the range of 11–13 r/min, considering the conditions of the interaction between the two only.
Figure 17 shows the effect of the interaction of pitch and forward speed on the composite score. In the AC interaction surface, the slope of change in the composite score shows a trend of increasing and then decreasing with the increase in pitch; the slope of change in the composite score shows a gradual increase with the increase in forward speed; and the composite score achieves the maximum value when the pitch is about 59.5–66.5 mm and the forward speed is 3.1–3.5 km/h. At 3.5 km/h, the composite score achieves the maximum value, and the slope of the change in forward speed is greater than the pitch, indicating that the effect of forward speed on the composite score is greater than the pitch. The surface plot is also consistent with the results of ANOVA in Table 12.
As shown in Figure 18, the interaction between rotational speed and forward speed affects the composite score. In the BC interaction surface, the slope of change in composite score shows a tendency to increase and then decrease with the increase in rotational speed, and the slope of change in composite score shows a tendency to gradually increase with the increase in forward speed. And under the condition of considering the interaction of the two only, the comprehensive evaluation index is maximized in the range of 11–13 r/min and 3.3–3.5 km/h forward speed, the composite score achieves the maximum value, and the slope of the change in forward speed is larger than that of rotational speed, thus indicating that the influence of forward speed on the composite score is larger than that of the rotational speed. The surface plot is also consistent with the results of ANOVA in Table 12.

4.4.3. Validation of Field Trial Results

According to the regression equation model, taking the maximum value of the overall score as the optimization objective, the predicted optimal conditions were pitch, 62.708 mm; rotational speed, 12.417 r/min; and forward speed, 3.50 km/h. According to the actual experimental conditions, the conditions were revised to pitch, 63.0 mm; rotational speed, 12.0 r/min; and forward speed, 3.5 km/h. Under this optimal condition, after five parallel tests, the seed-discharge uniformity index of the screw seeder was 84.53%, and its comprehensive score was 92.26%, which was within a 5% difference from the predicted value of 95.375, confirming the good correlation between the predicted value and the experimental value.

5. Conclusions

(1)
A spiral seeder for morel mushroom planting was designed. Through theoretical analysis, the key influencing factors for the operational performance of the spiral seeder during its three working stages were identified. Mathematical calculations determined the diameter value of the spiral seeder and the value ranges for three factors: rotational speed, pitch, and forward speed.
(2)
Using DEM-MBD coupled simulation technology, with seeding uniformity as the response indicator, a series of one-factor simulations were conducted to analyze the impact of different spiral seeder pitches and operational parameters on its performance. Through one-factor experiments and a second-order orthogonal rotation combination seeding test, the influence of each factor on the seeding uniformity index and the factors’ hierarchical relationships were analyzed. The results show that the pitch, rotational speed, and forward speed of the spiral seeder affect the uniformity coefficient in the order of pitch > rotational speed > forward speed.
(3)
A regression equation was used to establish an optimization model, and the optimal working parameters were determined: the seeder pitch was 63 mm, the spiral seeder rotational speed was 12 r/min, and the forward speed of the seeding machine was 3.5 km/h. Under these conditions, the seeding uniformity index of the spiral seeder was 84.53%, the seeding performance was excellent, and the comprehensive evaluation index was 92.26%. The verification of the field comparison test shows that the spiral seeder worked stably, had a low blockage rate, had a high seeding uniformity coefficient, and had an error of 3.27%, with performance parameters superior to those of traditional seeding devices.

Author Contributions

Conceptualization, M.L., X.H. and X.W.; data curation, G.Z. and J.L.; formal analysis, X.P.; funding acquisition, X.H. and X.W.; investigation, K.G.; methodology, X.H. and X.W.; project administration, X.H.; resources, X.W.; software, M.L., G.Z., X.P. and K.G.; supervision, X.W. and J.L.; validation, M.L.; writing—original draft, M.L.; writing—review and editing, M.L. and J.L. All authors have read and agreed to the published version of the manuscript.
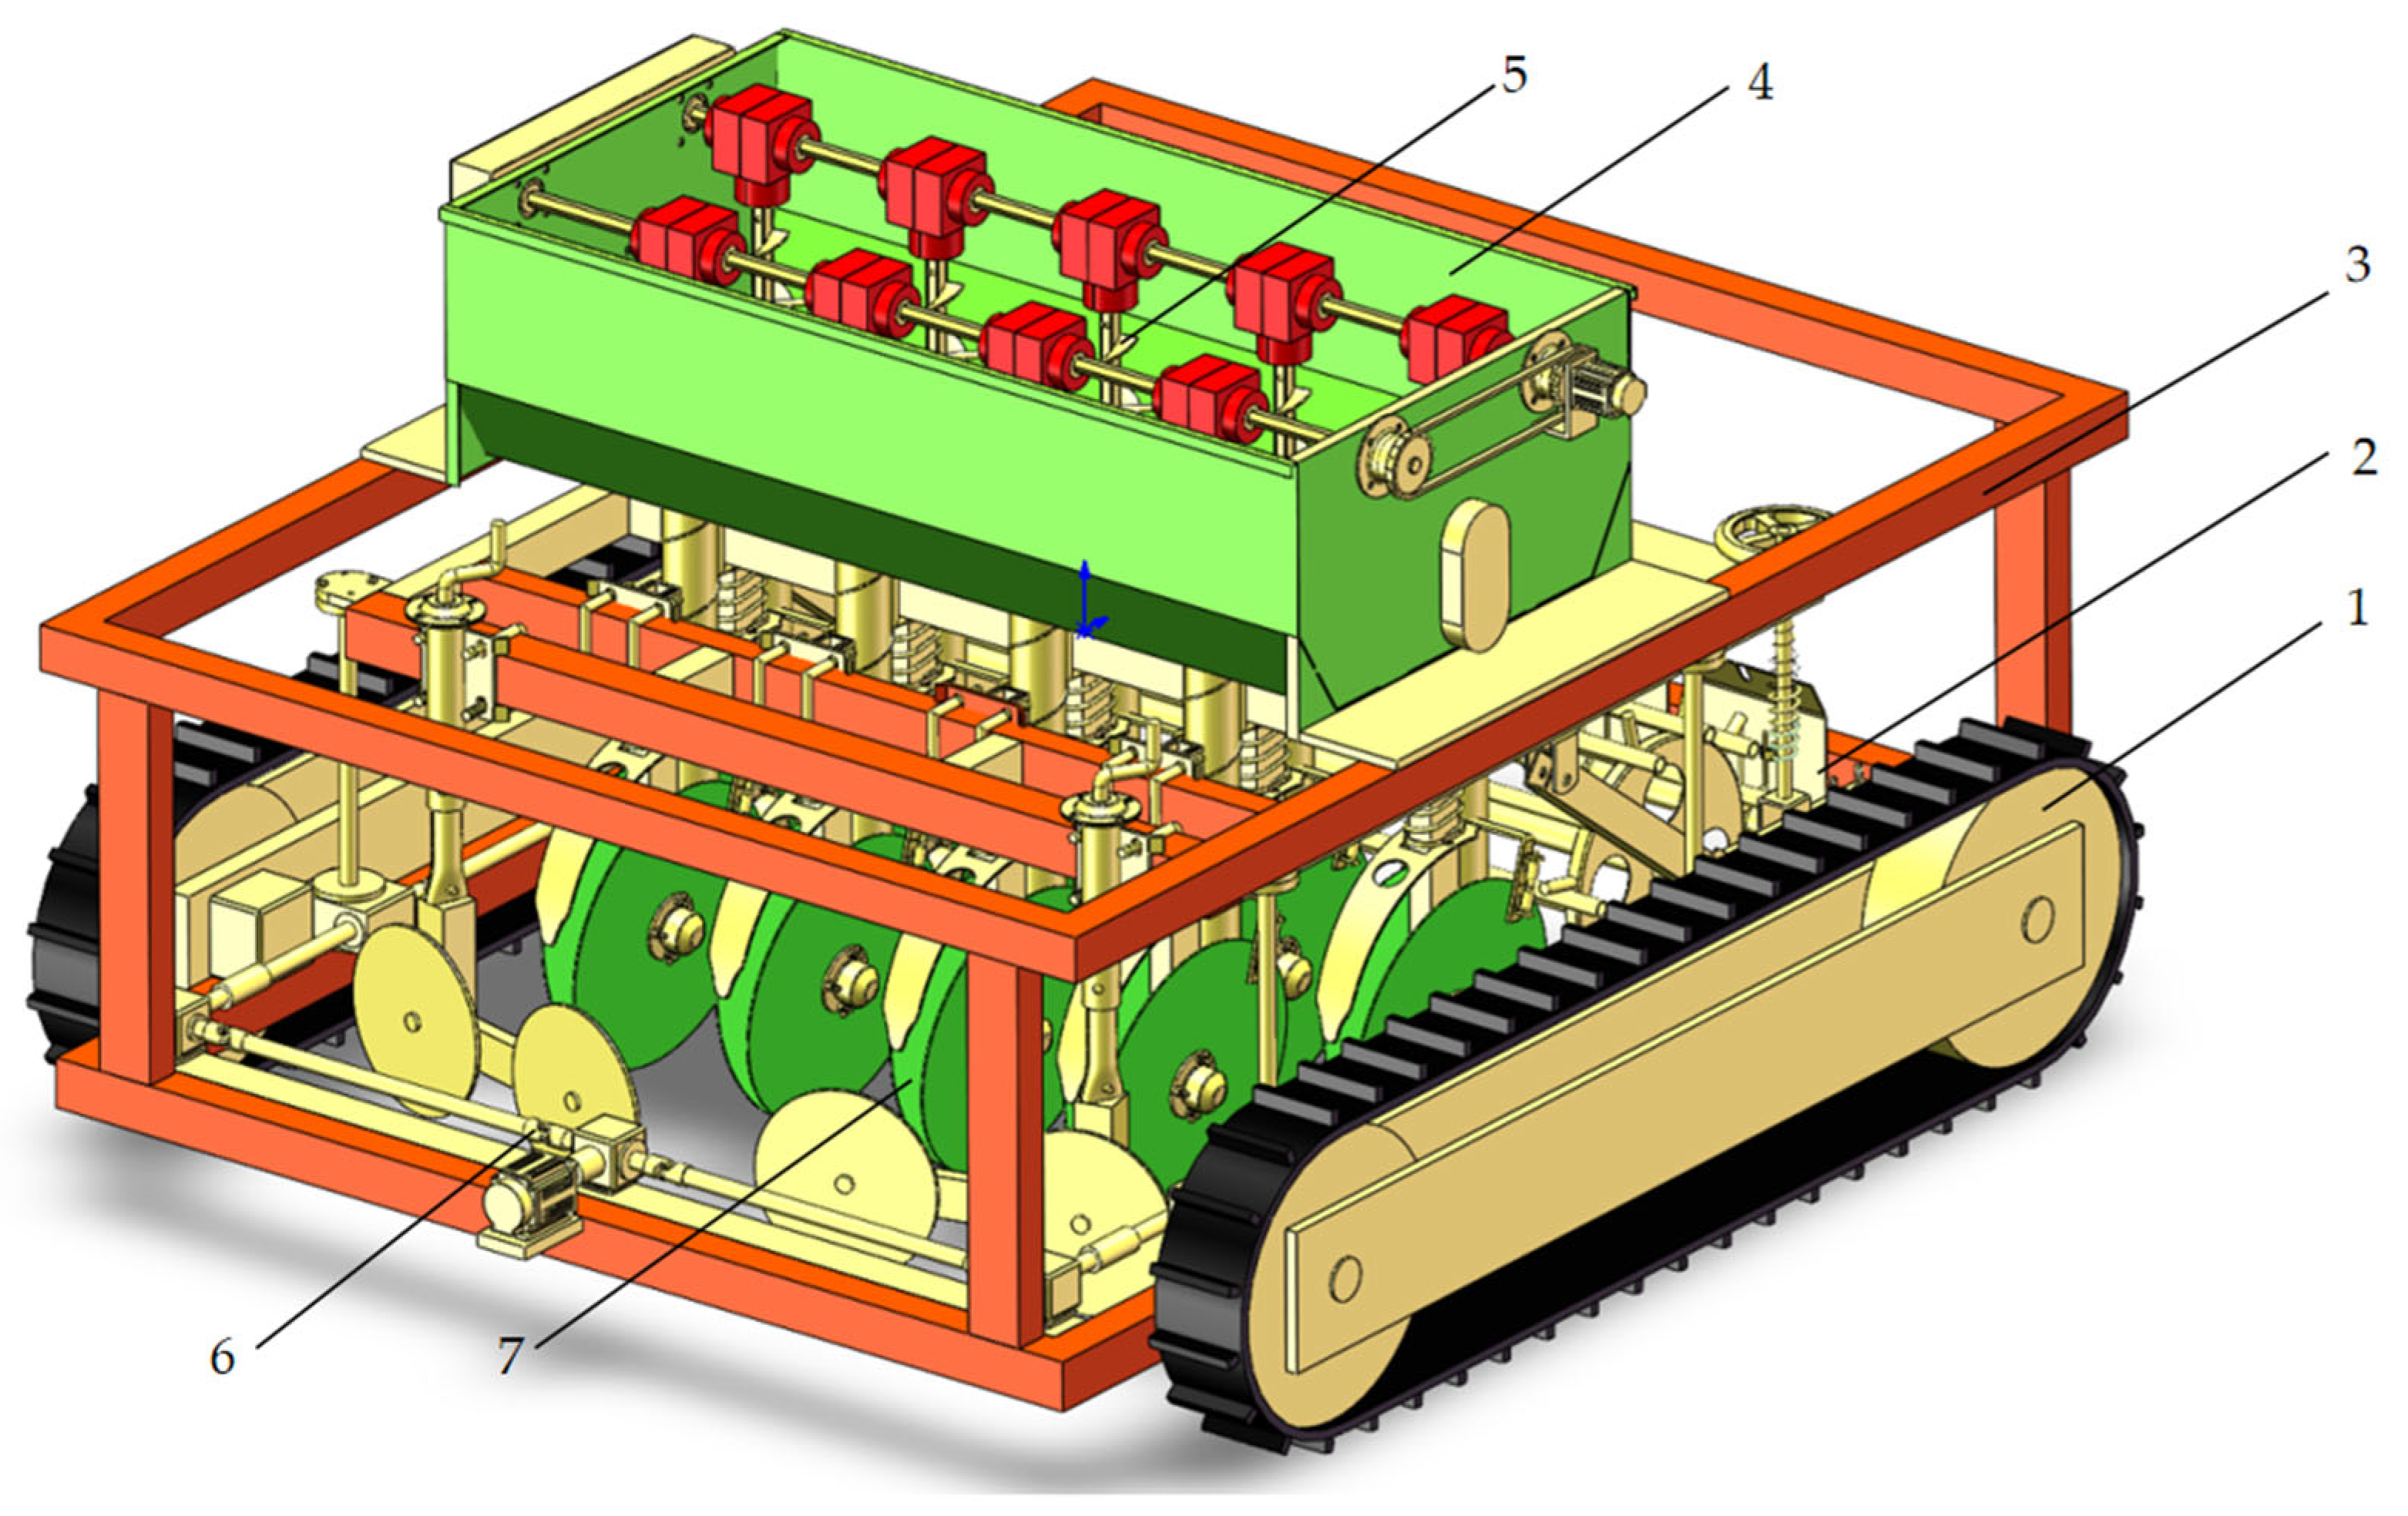
Funding

This research was supported by the Science and Technology Planning Project of First Division of the City of Alar (Grant No. 2023ZB02), the Science and Technology Planning Project of Xinjiang Production and Construction Corps (Grant No. 2023AB005), the Agriculture Bureau Project (Grant No. 2023AA304), the Tarim University President Fund Project (Grant No. TDZKSS202113), and The Vegetable Industry System (XJARS-07-25). We extend our heartfelt gratitude to these funding agencies for their generous support, which was crucial for the successful completion of our study.

Institutional Review Board Statement

Not applicable.

Informed Consent Statement

Informed consent was obtained from all subjects involved in the study.

Data Availability Statement

The original contributions presented in the study are included in the article; further inquiries can be directed toward the corresponding author.

Acknowledgments

The authors would like to thank their schools and colleges, as well as the funding providers of the project. All support and assistance are sincerely appreciated.

Conflicts of Interest

The authors declare no conflicts of interest.

References

  1. Xue, L.; Zhang, X.; Lei, J.; Li, S. Spatio-temporal evolution of atmospheric particulate matter pollution dust composition in Xinjiang. J. China Environ. Sci. 2024, 44, 3012–3020. [Google Scholar]
  2. Ma, J.; Dong, M.; Quan, X.; Shao, Q.; Jin, M.; Wang, Y. Effects of different drying methods on quality characteristics rehydration performance of Morchella esculenta. J. Trans. Chin. Soc. Agric. Eng. 2024, 40, 288–297. [Google Scholar]
  3. Dong, H.; Yu, H.; Zhou, F.; Chen, H.; Chen, M.; Zhang, M.; Tang, J.; Tan, Q. Development status trend of rare edible fungi industry in China. J. Edible Med. Mushrooms 2024, 32, 77–83. [Google Scholar]
  4. Li, M.; He, X.; Zhu, G.; Liu, J.; Gou, K.; Wang, X. Modeling and Parameter Calibration of Morchella Seed Based on Discrete Element Method. Appl. Sci. 2024, 14, 11134. [Google Scholar] [CrossRef]
  5. Wei, L.; Wang, Q.; Niu, K.; Bai, S.; Wei, L.; Qiu, C.; Han, N. Design and Test of Seed–Fertilizer Replenishment Device for Wheat Seeder. Agriculture 2024, 14, 374. [Google Scholar] [CrossRef]
  6. Liu, J.; Jiang, P.; Chen, J.; Zhang, X.; Xu, M.; Huang, D.; Shi, Y. Optimal Design of and Experiment on a Dual-Spiral Ditcher for Orchards. Agriculture 2023, 13, 1628. [Google Scholar] [CrossRef]
  7. Tian, L.; Wang, J.; Tang, H.; Li, S.; Zhou, W.; Shen, H. Design and performance test of spiral groove type rice hole direct seeding metering device. Trans. Chin. Soc. Agric. Mach. 2016, 47, 46–52. [Google Scholar]
  8. Mei, L.; Cheng, C.; Fan, Z. The Mechanical Research of Vertical Screw Conveyor Particle Group Based on the Radial Change of Material Speed. J. Phys. Conf. Ser. 2021, 1952, 032026. [Google Scholar] [CrossRef]
  9. Yi, M.; Zhang, S.; Liu, C.; Wen, Q. Design and Experimental Analysis of New Type Force Feed for Alfalfa Sowing. J. Agric. Mech. Res. 2014, 36, 161–164. [Google Scholar]
  10. Karayel, D.; Wiesehoff, M.; Merzi, A.O.; Müller, J. Laboratory measurement of seed drill seed spacing and velocity of fall of seeds using highspeed camera system. Comput. Electron. Agric. 2006, 50, 89–96. [Google Scholar] [CrossRef]
  11. Chen, P.; Huang, T.; Wu, B.; Qian, H.; Xie, F.; Liu, B.; Liu, D.; Li, X. Modeling the Discharge Rate of a Screw Conveyor Considering Hopper–Conveyor Coupling Parameters. Agriculture 2024, 14, 1203. [Google Scholar] [CrossRef]
  12. Gao, X.; Zhao, P.; Li, J.; Xu, Y.; Huang, Y.; Wang, L. Design and Experiment of Quantitative Seed Feeding Wheel of Air-Assisted High-Speed Precision Seed Metering Device. Agriculture 2022, 12, 1951. [Google Scholar] [CrossRef]
  13. Ding, Y.; Li, H.; Gao, J.; Yu, H.; Wang, Y.; Feng, D. Parameter Optimization of Finger Clip Plate Garlic Seed-Metering Device. Agriculture 2023, 13, 2071. [Google Scholar] [CrossRef]
  14. Qiao, X.; Liu, D.; Wang, X.; Li, W.; Wang, J.; Zheng, D. Design and Experiment of Double-Row Seed-Metering Device for Buckwheat Large Ridges. Agriculture 2023, 13, 1953. [Google Scholar] [CrossRef]
  15. An, X.; Zhou, Q.; Li, T. Growth and Accumulation Response of Morchella Mycelium to Cadmium, Lead, and Their Combined Pollution. J. Basic Sci. Eng. 2008, 1, 35–42. [Google Scholar]
  16. Chen, P.; Su, J.; Xu, J.; Liu, M. Design and Experiment of Vertical Spiral Ditch Fertilizer Machine for Hill Orchards. J. Trans. Chin. Soc. Agric. Mach. 2024, 55, 223–233+274. [Google Scholar]
  17. Zhu, H.; Wu, X.; Bai, L.; Wang, M.; Lei, F.; Fang, Y. Design and Experiment of Shaftless Spiral Fertilizer Discharge Device for No-Tillage Seeder. J. Trans. Chin. Soc. Agric. Mach. 2023, 54 (Suppl. S1), 125–134. [Google Scholar]
  18. Dai, F.; Xin, S.; Zhao, W.; Liu, F.; Xin, B.; Ma, M. Design and Experiment of Full-Membrane Covered Potato Seeding Combined Operation Machine. J. Trans. Chin. Soc. Agric. Mach. 2017, 48, 76–83+56. [Google Scholar]
  19. Wei, G.; Shi, S.; Zhou, J.; Liu, H. Design and Experiment of 2BHQL-4 Pneumatic Precision Peanut Seeder. J. Agric. Mech. Res. 2021, 43, 72–77. [Google Scholar] [CrossRef]
  20. Wang, Y.; Xia, Z.; He, J.; Zhao, J.; Liu, H.; He, P. Design and Experiment of Vertical Spiral Quantitative Fertilizer Machine. J. Agric. Mech. Res. 2018, 40, 88–92. [Google Scholar]
  21. Li, H.; Zhao, C.; Yan, B.; Ling, L.; Meng, Z. Design and Verification of the Variable Capacity Roller-Wheel Precision Rice Direct Seed-Metering Device. Agronomy 2022, 12, 1798. [Google Scholar] [CrossRef]
  22. Wang, W.; Liu, W.; Yuan, L.; Qu, Z.; He, X.; Lv, Y. Modeling of Wheat Plant and Simulation of Material Motion in a Single Longitudinal Axial Flow System. J. Trans. Chin. Soc. Agric. Mach. 2020, 51 (Suppl. S2), 170–180. [Google Scholar]
  23. Ren, L.; Xia, D.; Ye, Y. Design of a High-Temperature Mechanized Discharge Shaftless Spiral for Magnesium Reduction Process. Chin. J. Nonferrous Met. 2012, 22, 2882–2889. [Google Scholar]
  24. Song, C.; Dong, Y.; Li, Y.; Zhao, H. Study on the Design and Lifetime Prediction of Spiral Shaft for Screw Conveyor. China Mech. Eng. 2003, 12, 180–185. [Google Scholar]
  25. Yu, W.; Zou, D.; Li, D.; Wang, Q.; Peng, P. Development of Models Relating Screw Conveying Capacity of Concrete to Operating Parameters and Their Use in Conveyor Operating Strategies to Consider Batch Production. Appl. Sci. 2024, 14, 6351. [Google Scholar] [CrossRef]
  26. Cao, Y.; Liang, G.; Li, X.; Zhang, Y.; Ma, J. Integrated Parametric Finite Element and Response Surface-Based Lightweight Design of Screw Conveyor Shaft for Mining. J. Mach. Des. 2024, 41, 99–105. [Google Scholar]
  27. Dong, X.; Su, C.; Zheng, H.; Han, R.; Li, Y.; Wan, L.; Song, J.; Wang, J. Analysis of soil disturbance process of vibrating subsoiling based on DEM-MBDcoupling algorithm. Trans. Chin. Soc. Agric. Eng. 2022, 38, 34–43. [Google Scholar]
  28. Lai, Q.; Xie, G.; Su, W.; Zhao, J.; Sun, W.; Chen, Z. Design experiment of chain spoon flipping type broad bean precision metering device. J. Trans. Chin. Soc. Agric. Mach. 2022, 53, 82–92. [Google Scholar]
  29. Yang, W.; Meng, W.; Gao, L.; Tan, Y.; Fottner, J.; Dai, X.; Yao, F.; Yuan, Y.; Sun, X. Analysis of the Screw Flight Wear Model and Wear Regularity of the Bulk Transport in Screw Ship Unloader. Iran. J. Sci. Technol. Trans. Mech. Eng. 2022, 46, 15–29. [Google Scholar] [CrossRef]
  30. Wang, B.; Na, Y.; Chen, M.; Ge, Z.; Pan, Y.; Liu, J.; Wu, W.; Luo, X. Design and Experiment on a Distributed Seed Delivery System with a Pneumatic Central-Cylinder Seeder. Agronomy 2023, 13, 1337. [Google Scholar] [CrossRef]
  31. JB/T 9783-2013; Fluted-Wheel Feeder of Sower. Ministry of Industry and Information Technology of the People’s Republic of China, Mechanical Industry Press: Beijing, China, 2013.
Figure 1. Design drawings of morel mushroom seeder: 1, crawler chassis; 2, soil-covering module; 3, mobile chassis; 4, seeding module; 5, spiral seeding device; 6, four-corner lifting mechanism; and 7, trenching module.
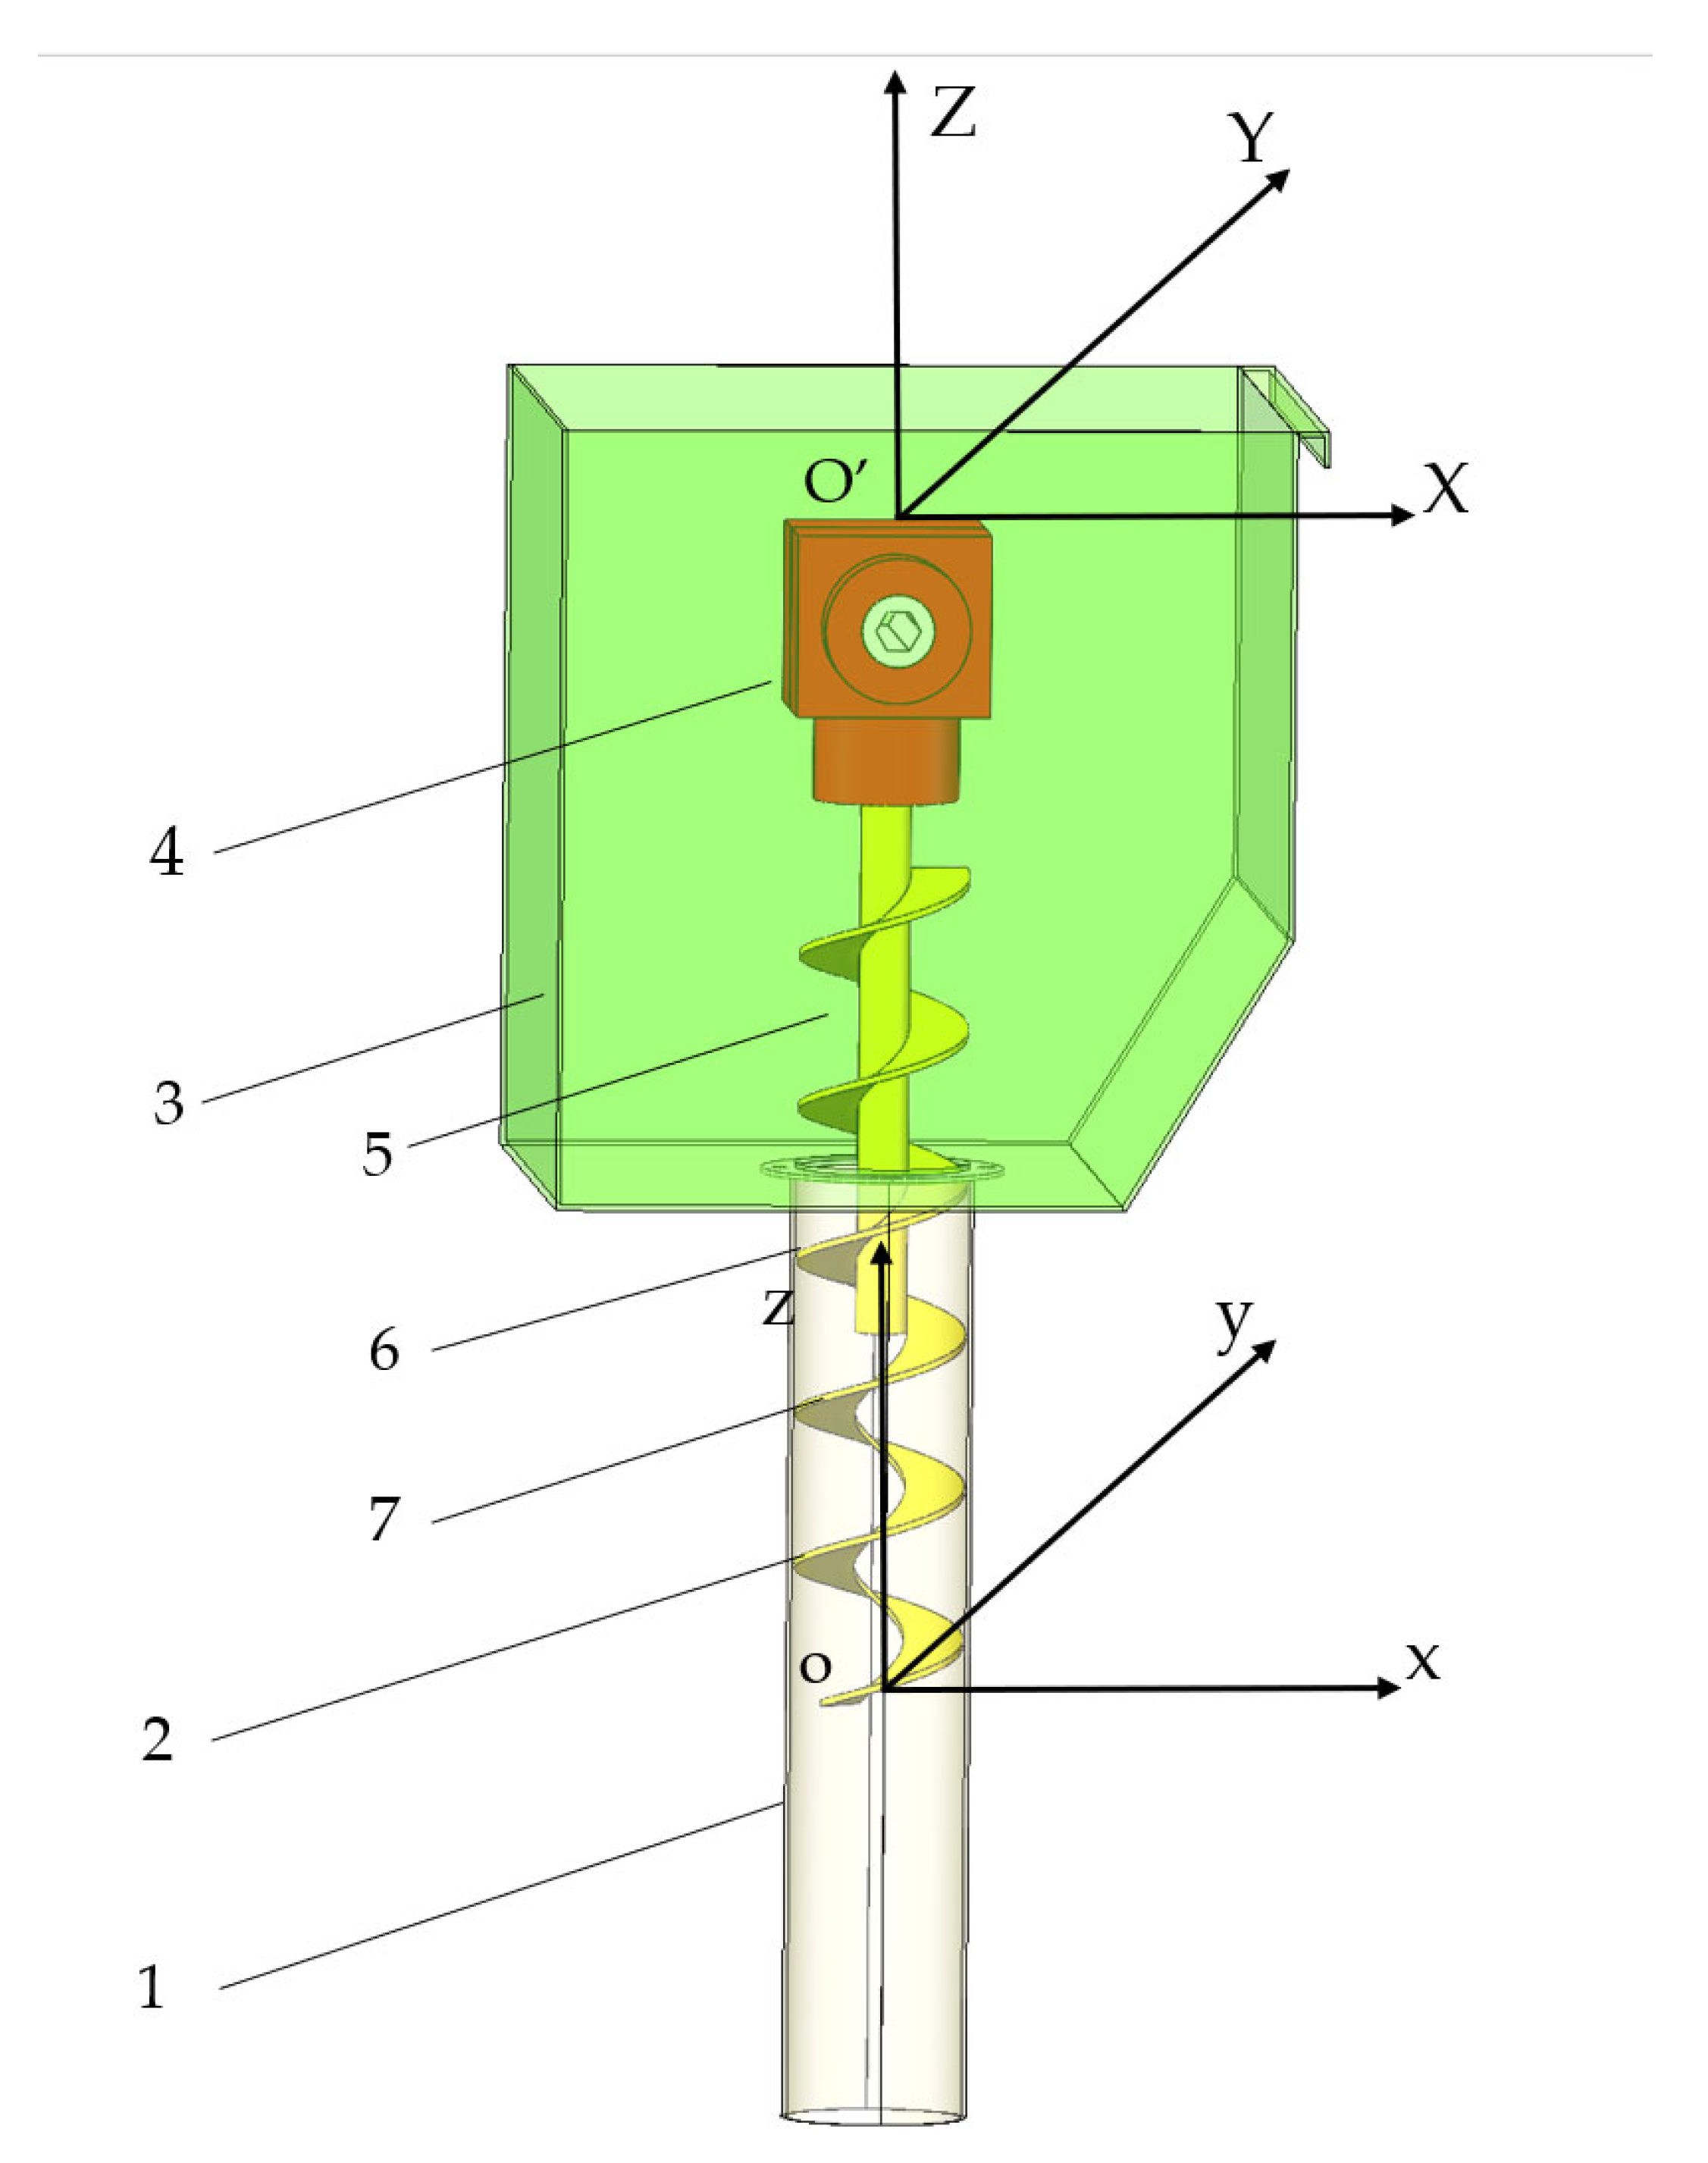
Agriculture 15 01140 g001
Figure 2. Spiral seeding device and coordinate system establishment: 1, seeding tube; 2, spiral components; 3, seed box; 4, bevel gear steering device; 5, seed filling stage; 6, transport stage; and 7, dispersing stage.
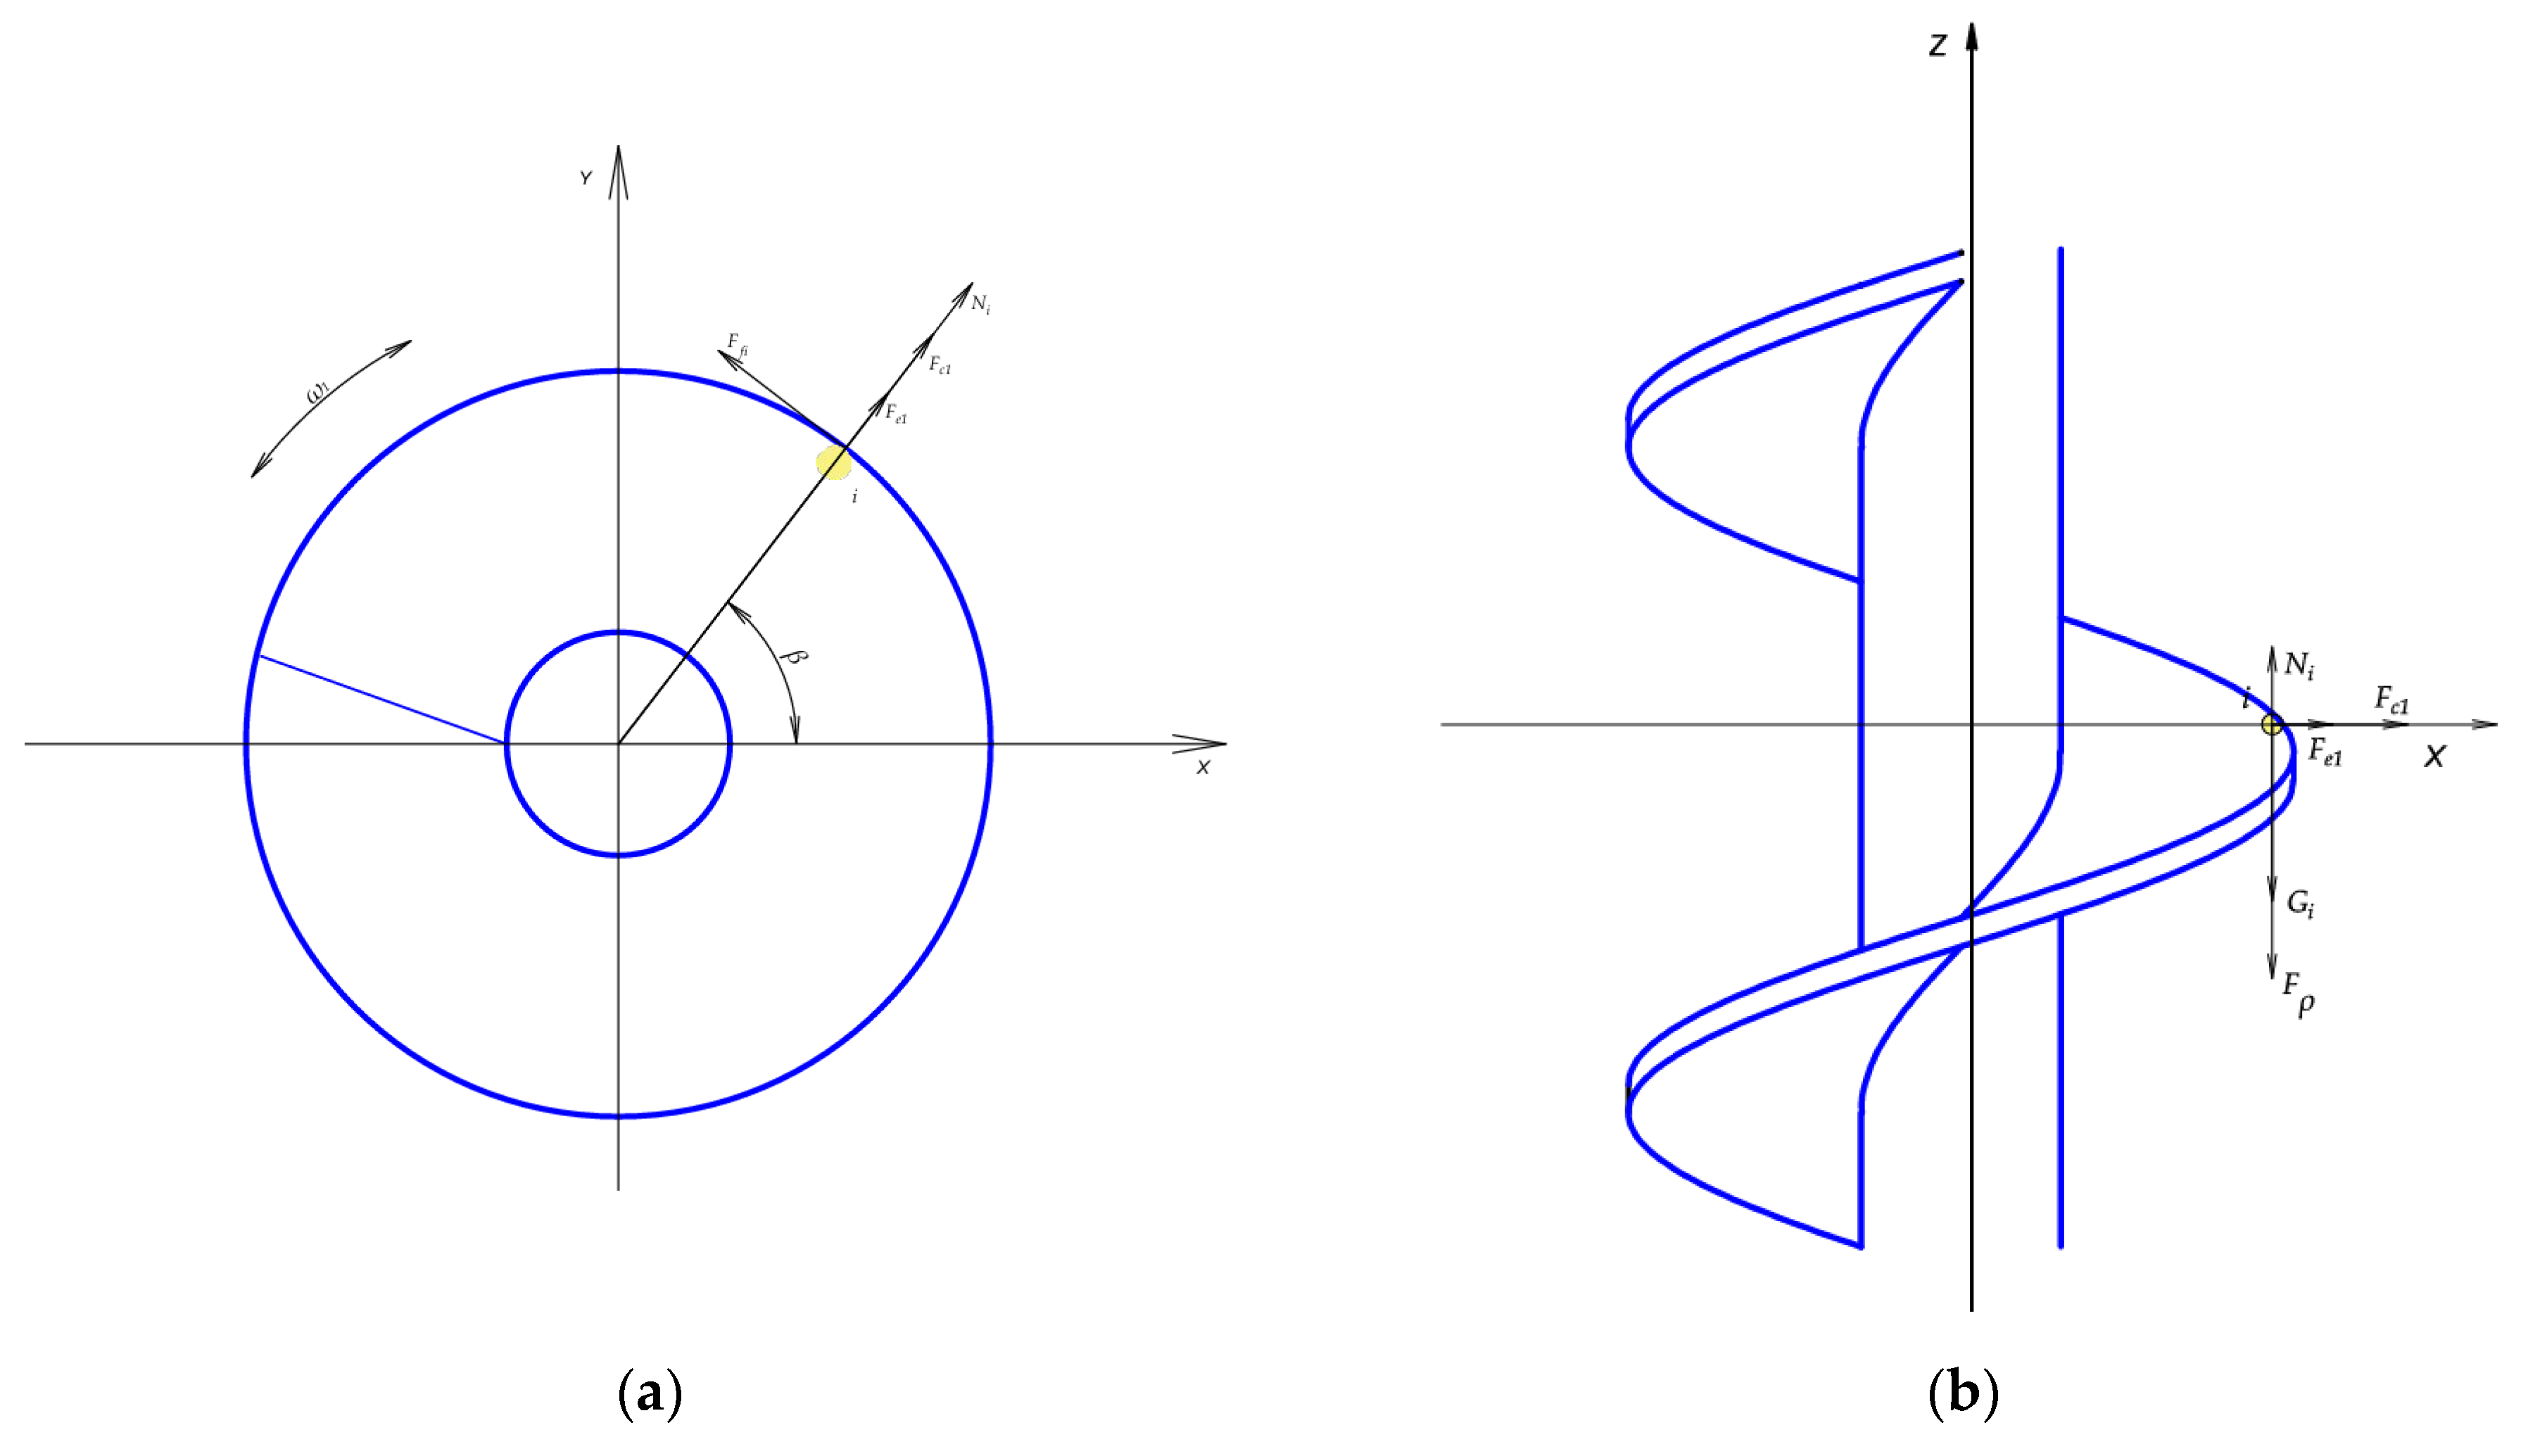
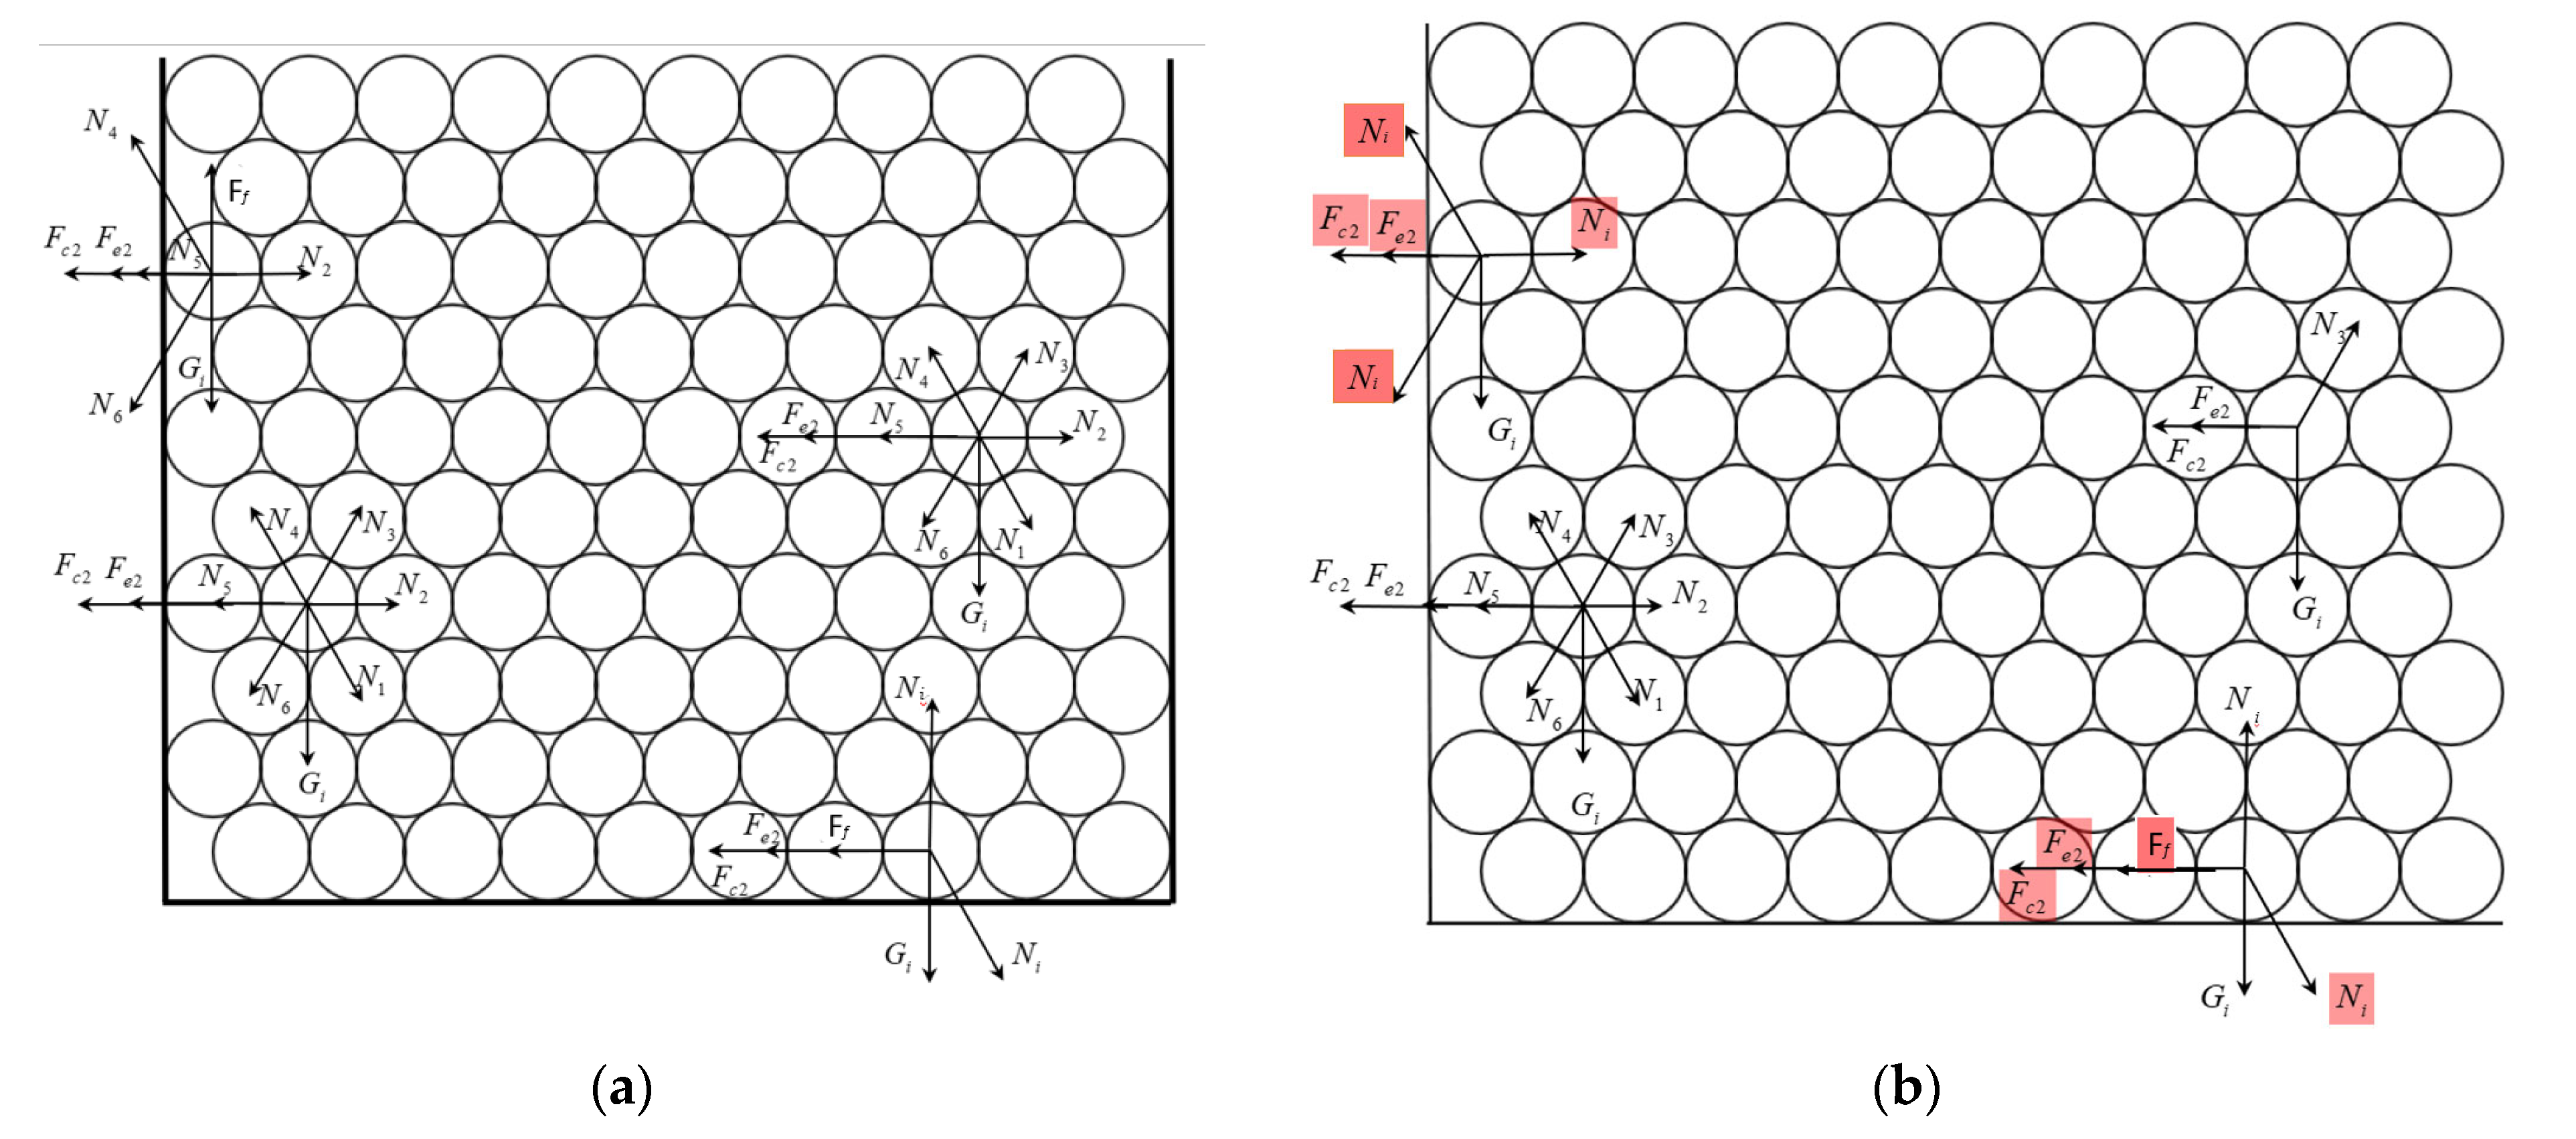
Agriculture 15 01140 g002
Figure 3. Initial force analysis of seed particles: (a) XO’Y plane and (b) XO’Z plane.
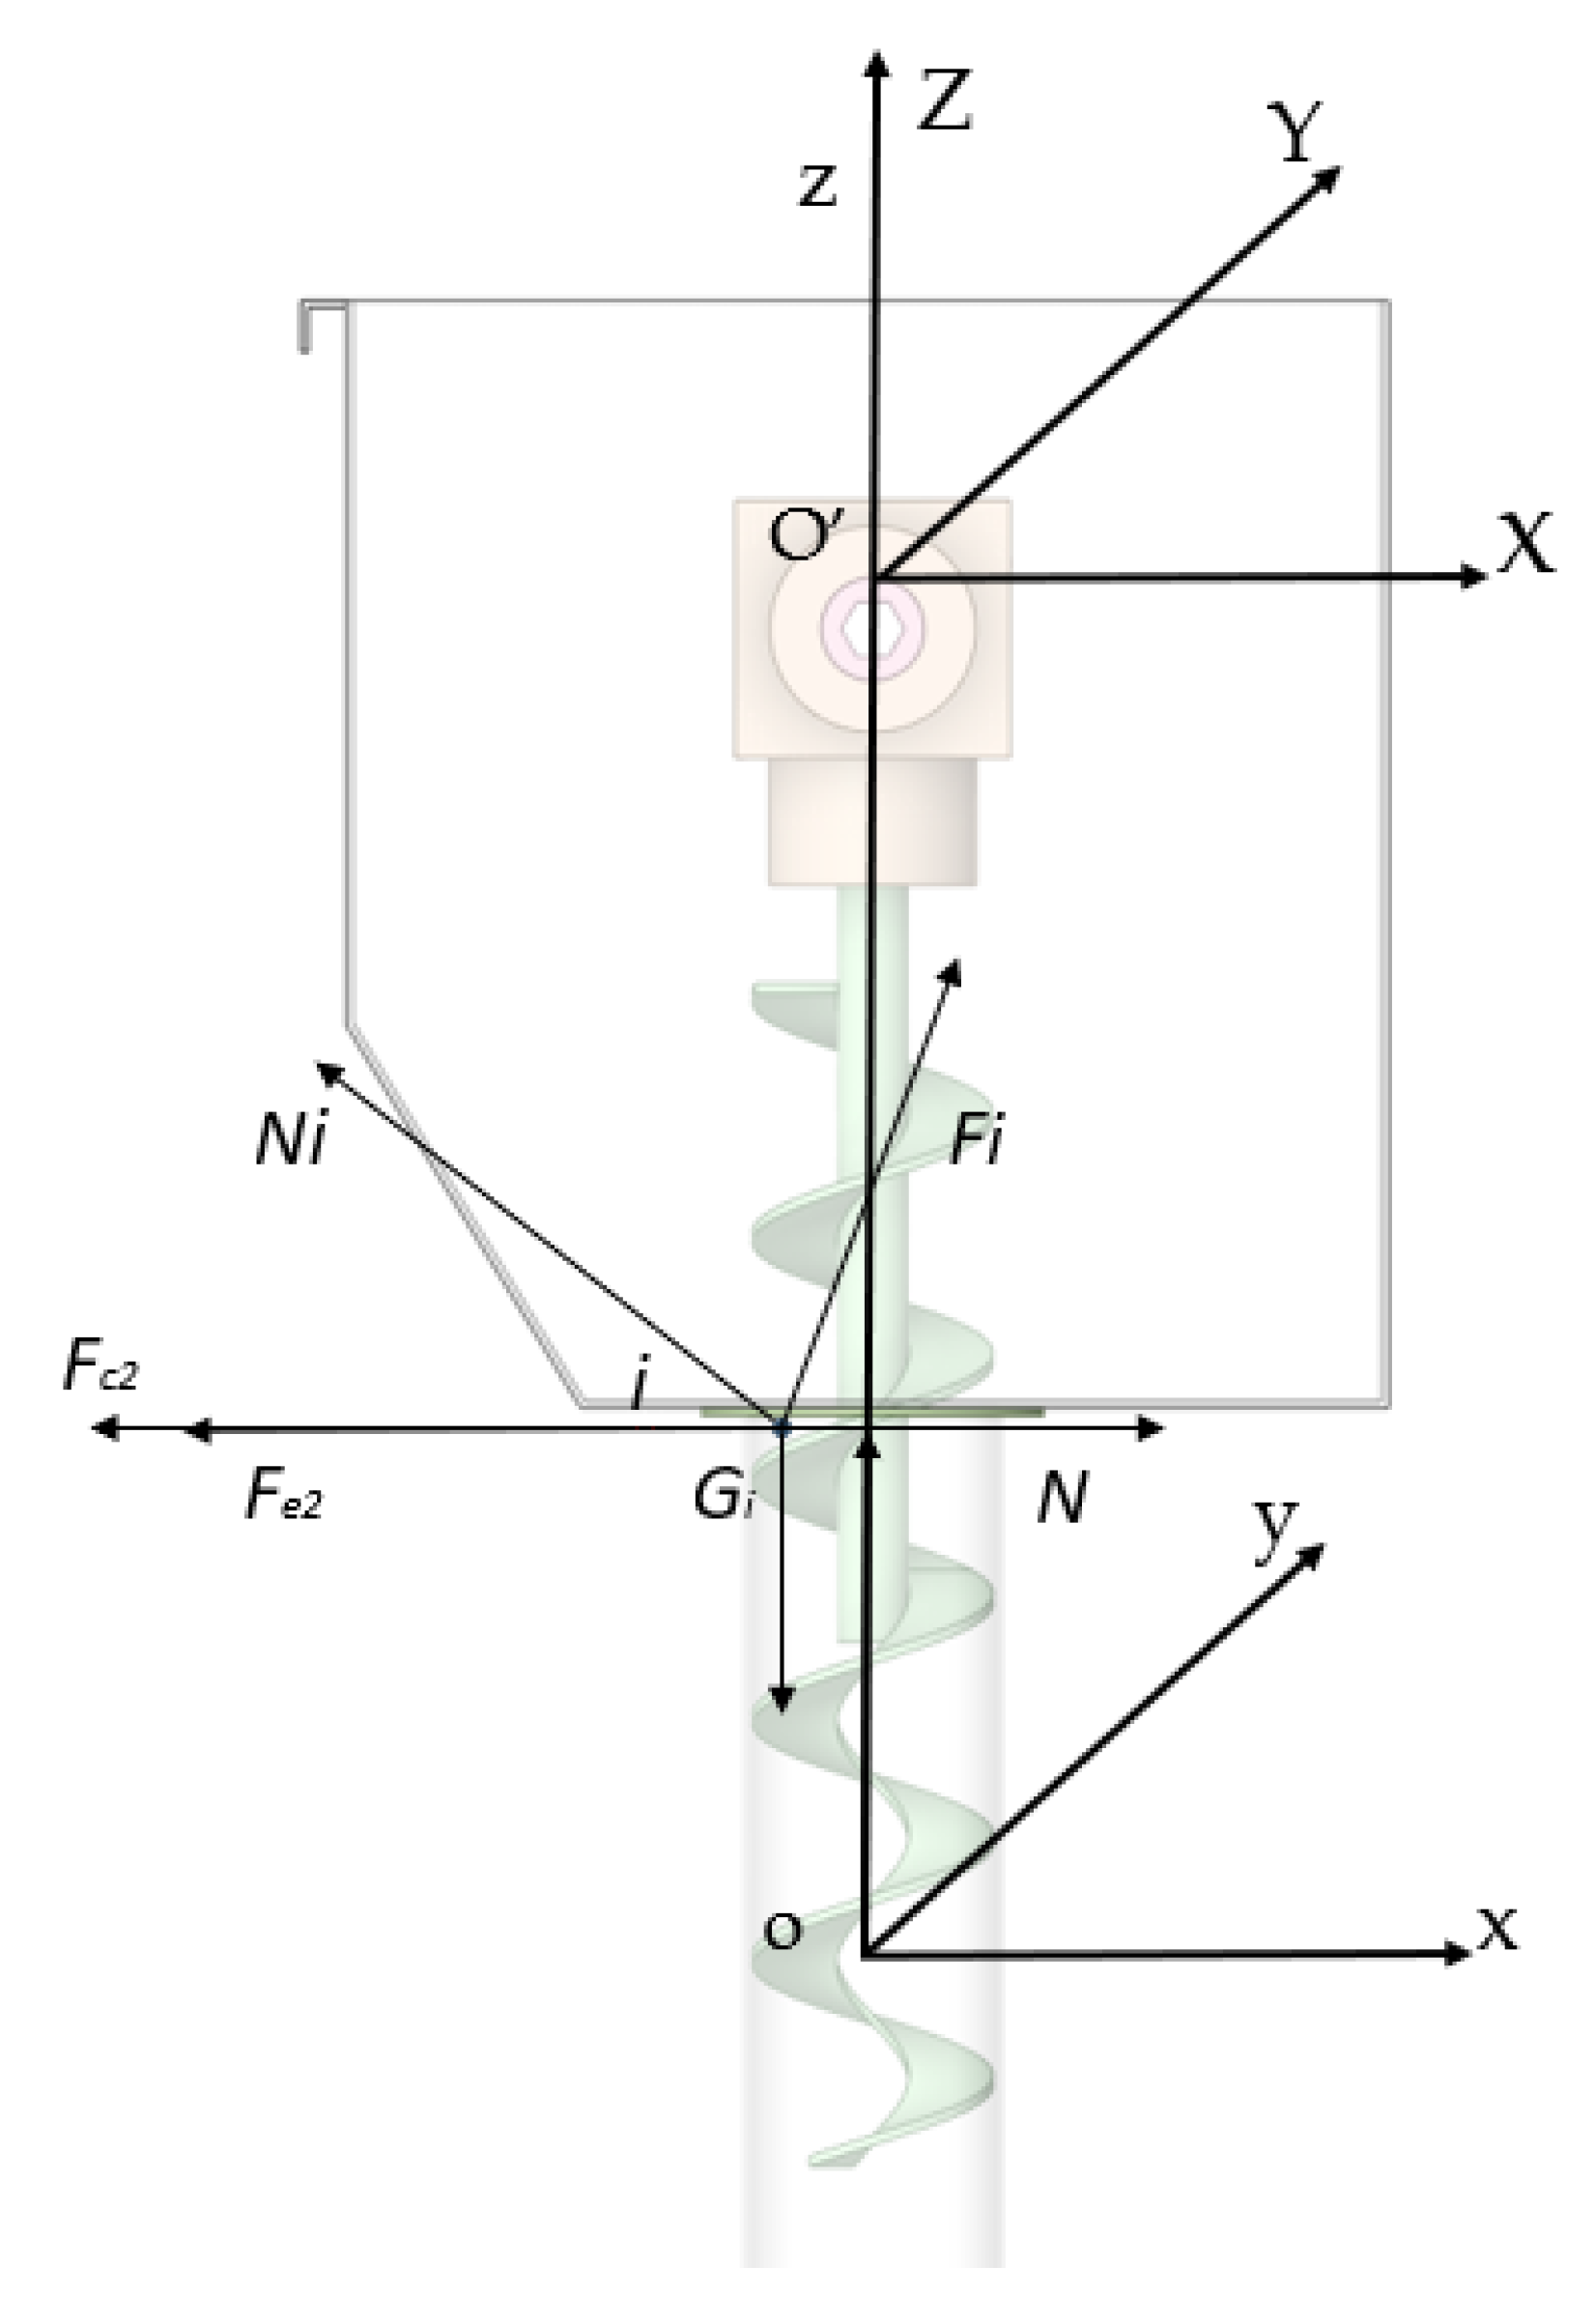
Agriculture 15 01140 g003
Figure 4. Force analysis in reference coordinate system.
Agriculture 15 01140 g004
Figure 5. Force analysis of seed particles at the instant of sliding: (a) Y direction and (b) Z direction.
Agriculture 15 01140 g005
Figure 6. Force diagram of the dispersing stage: (a) having inner wall support and (b) losing side wall support.
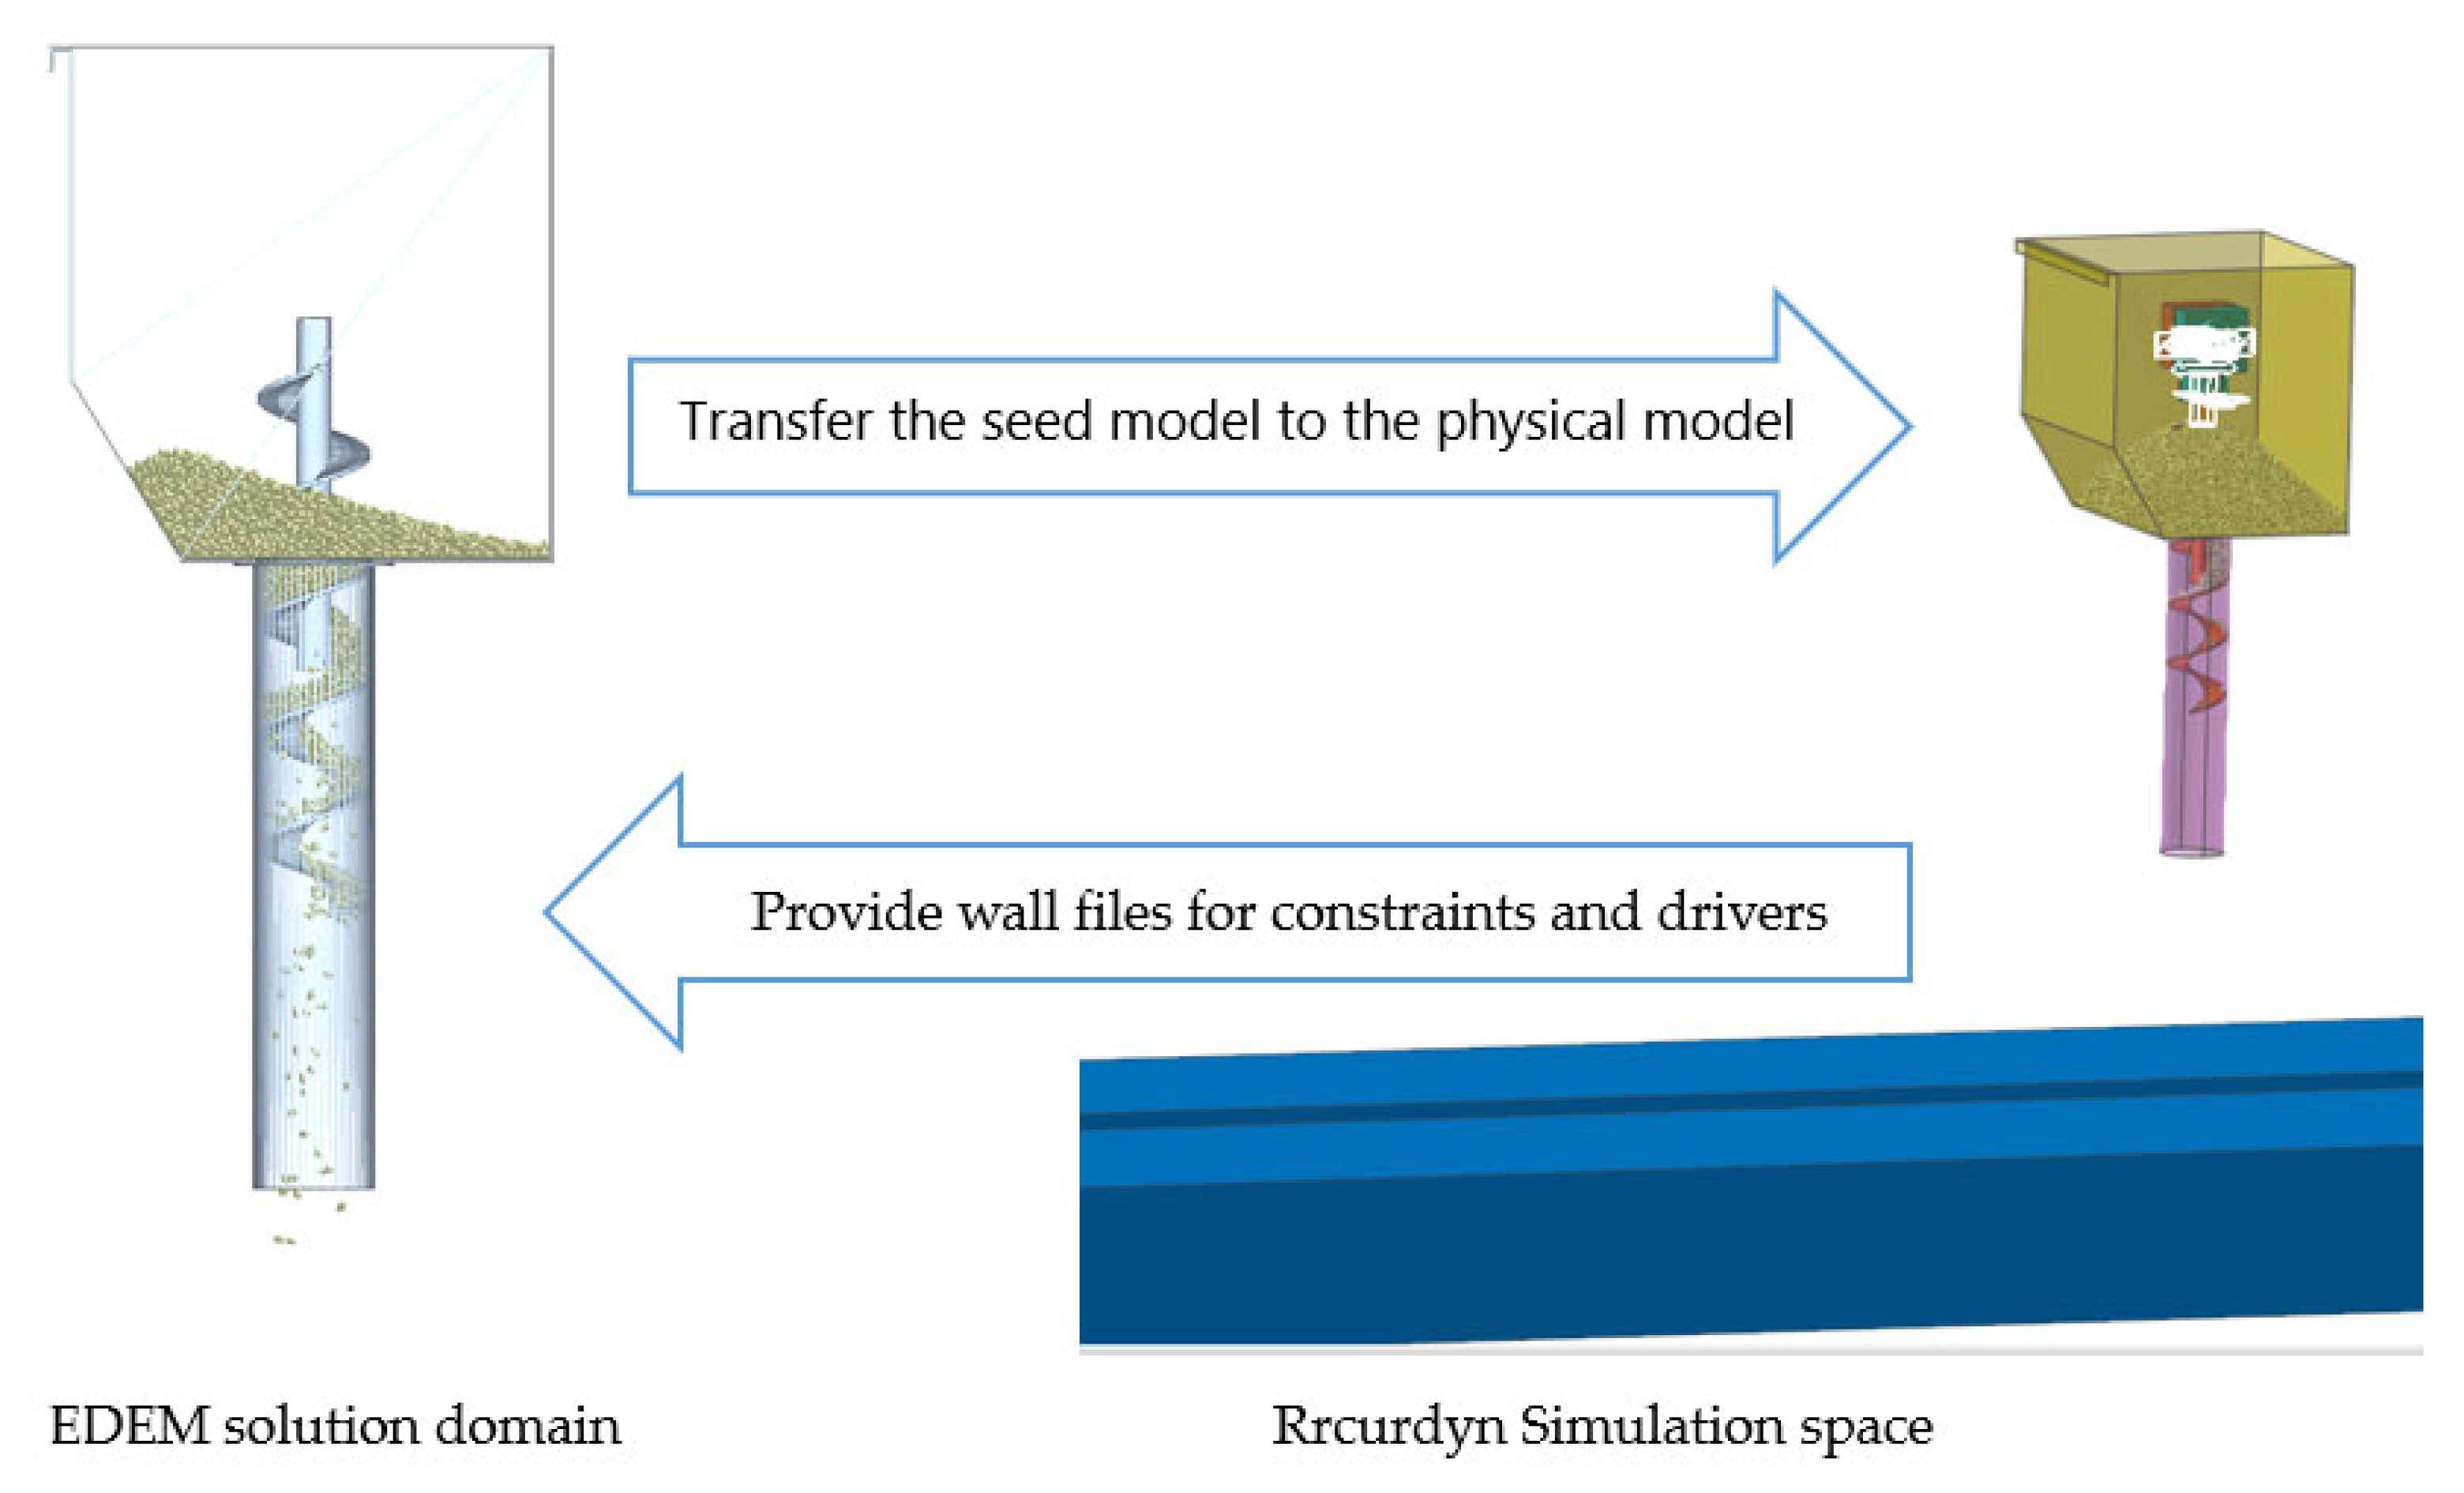
Agriculture 15 01140 g006
Figure 7. Joint simulation model.
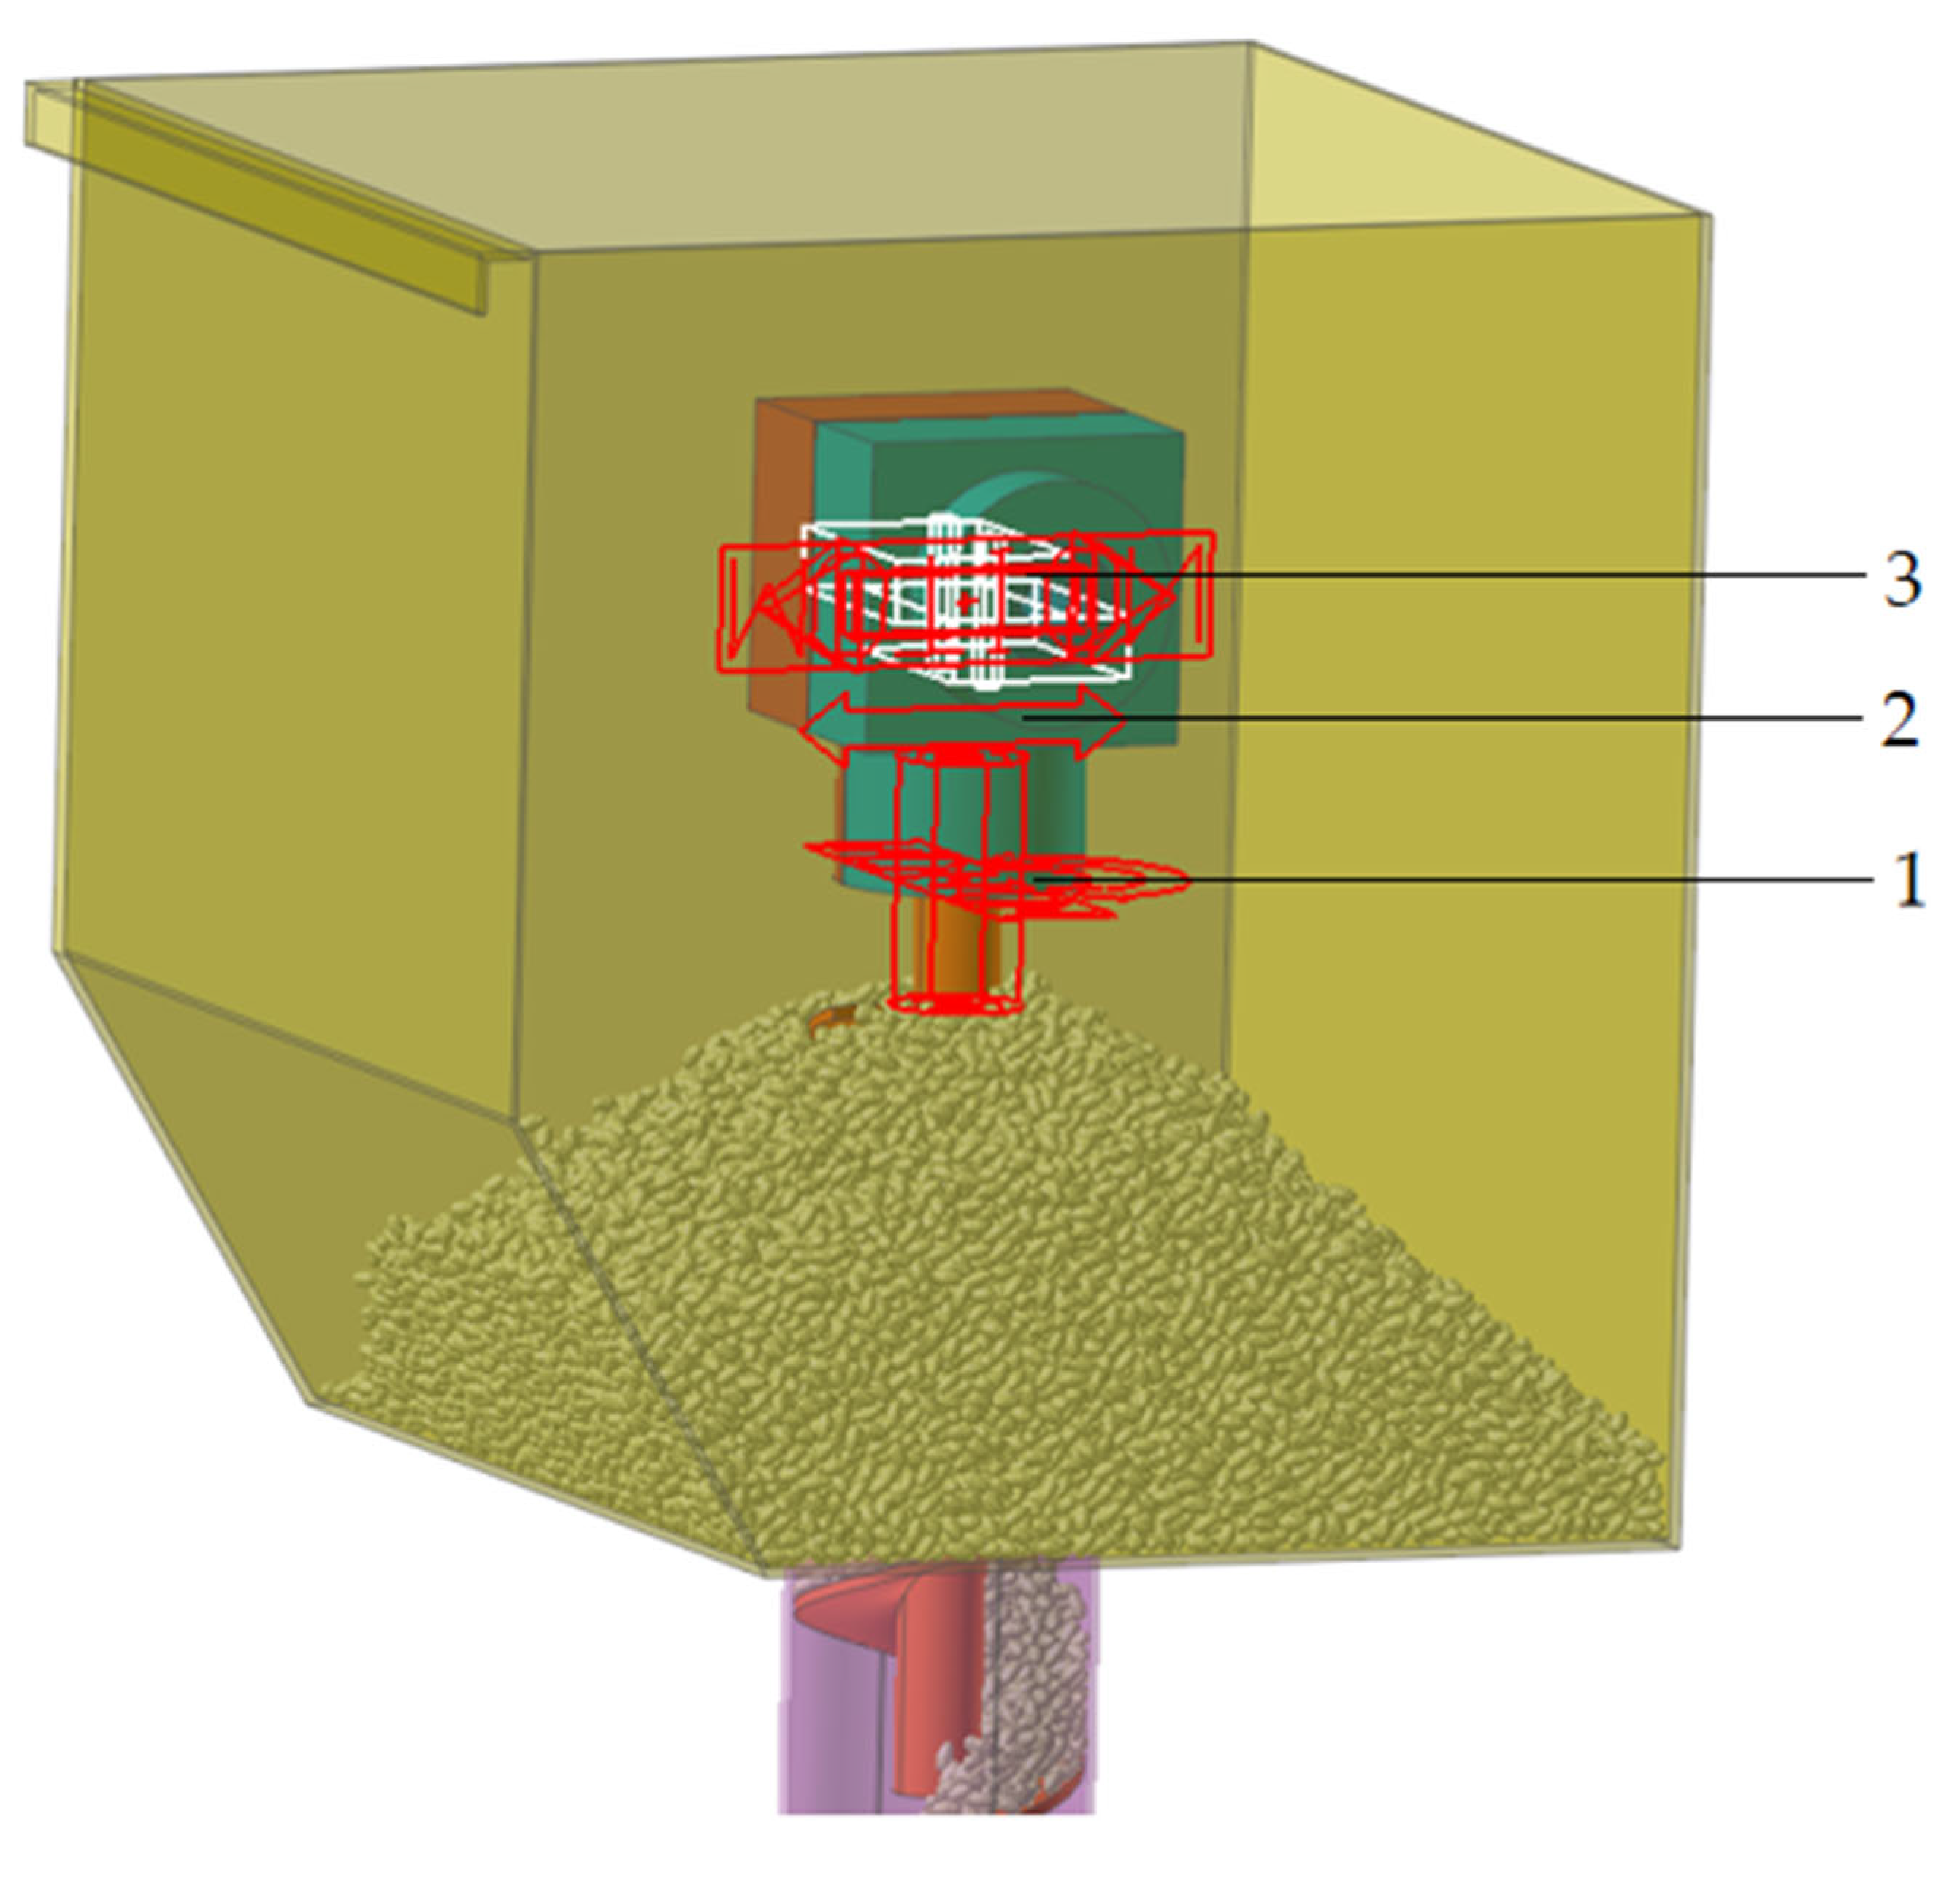
Agriculture 15 01140 g007
Figure 8. Constraints and driving settings of EDEM–RecurDyn coupled simulation: 1, rotational Joint; 2, translational Joint; and 3, fixed joint.
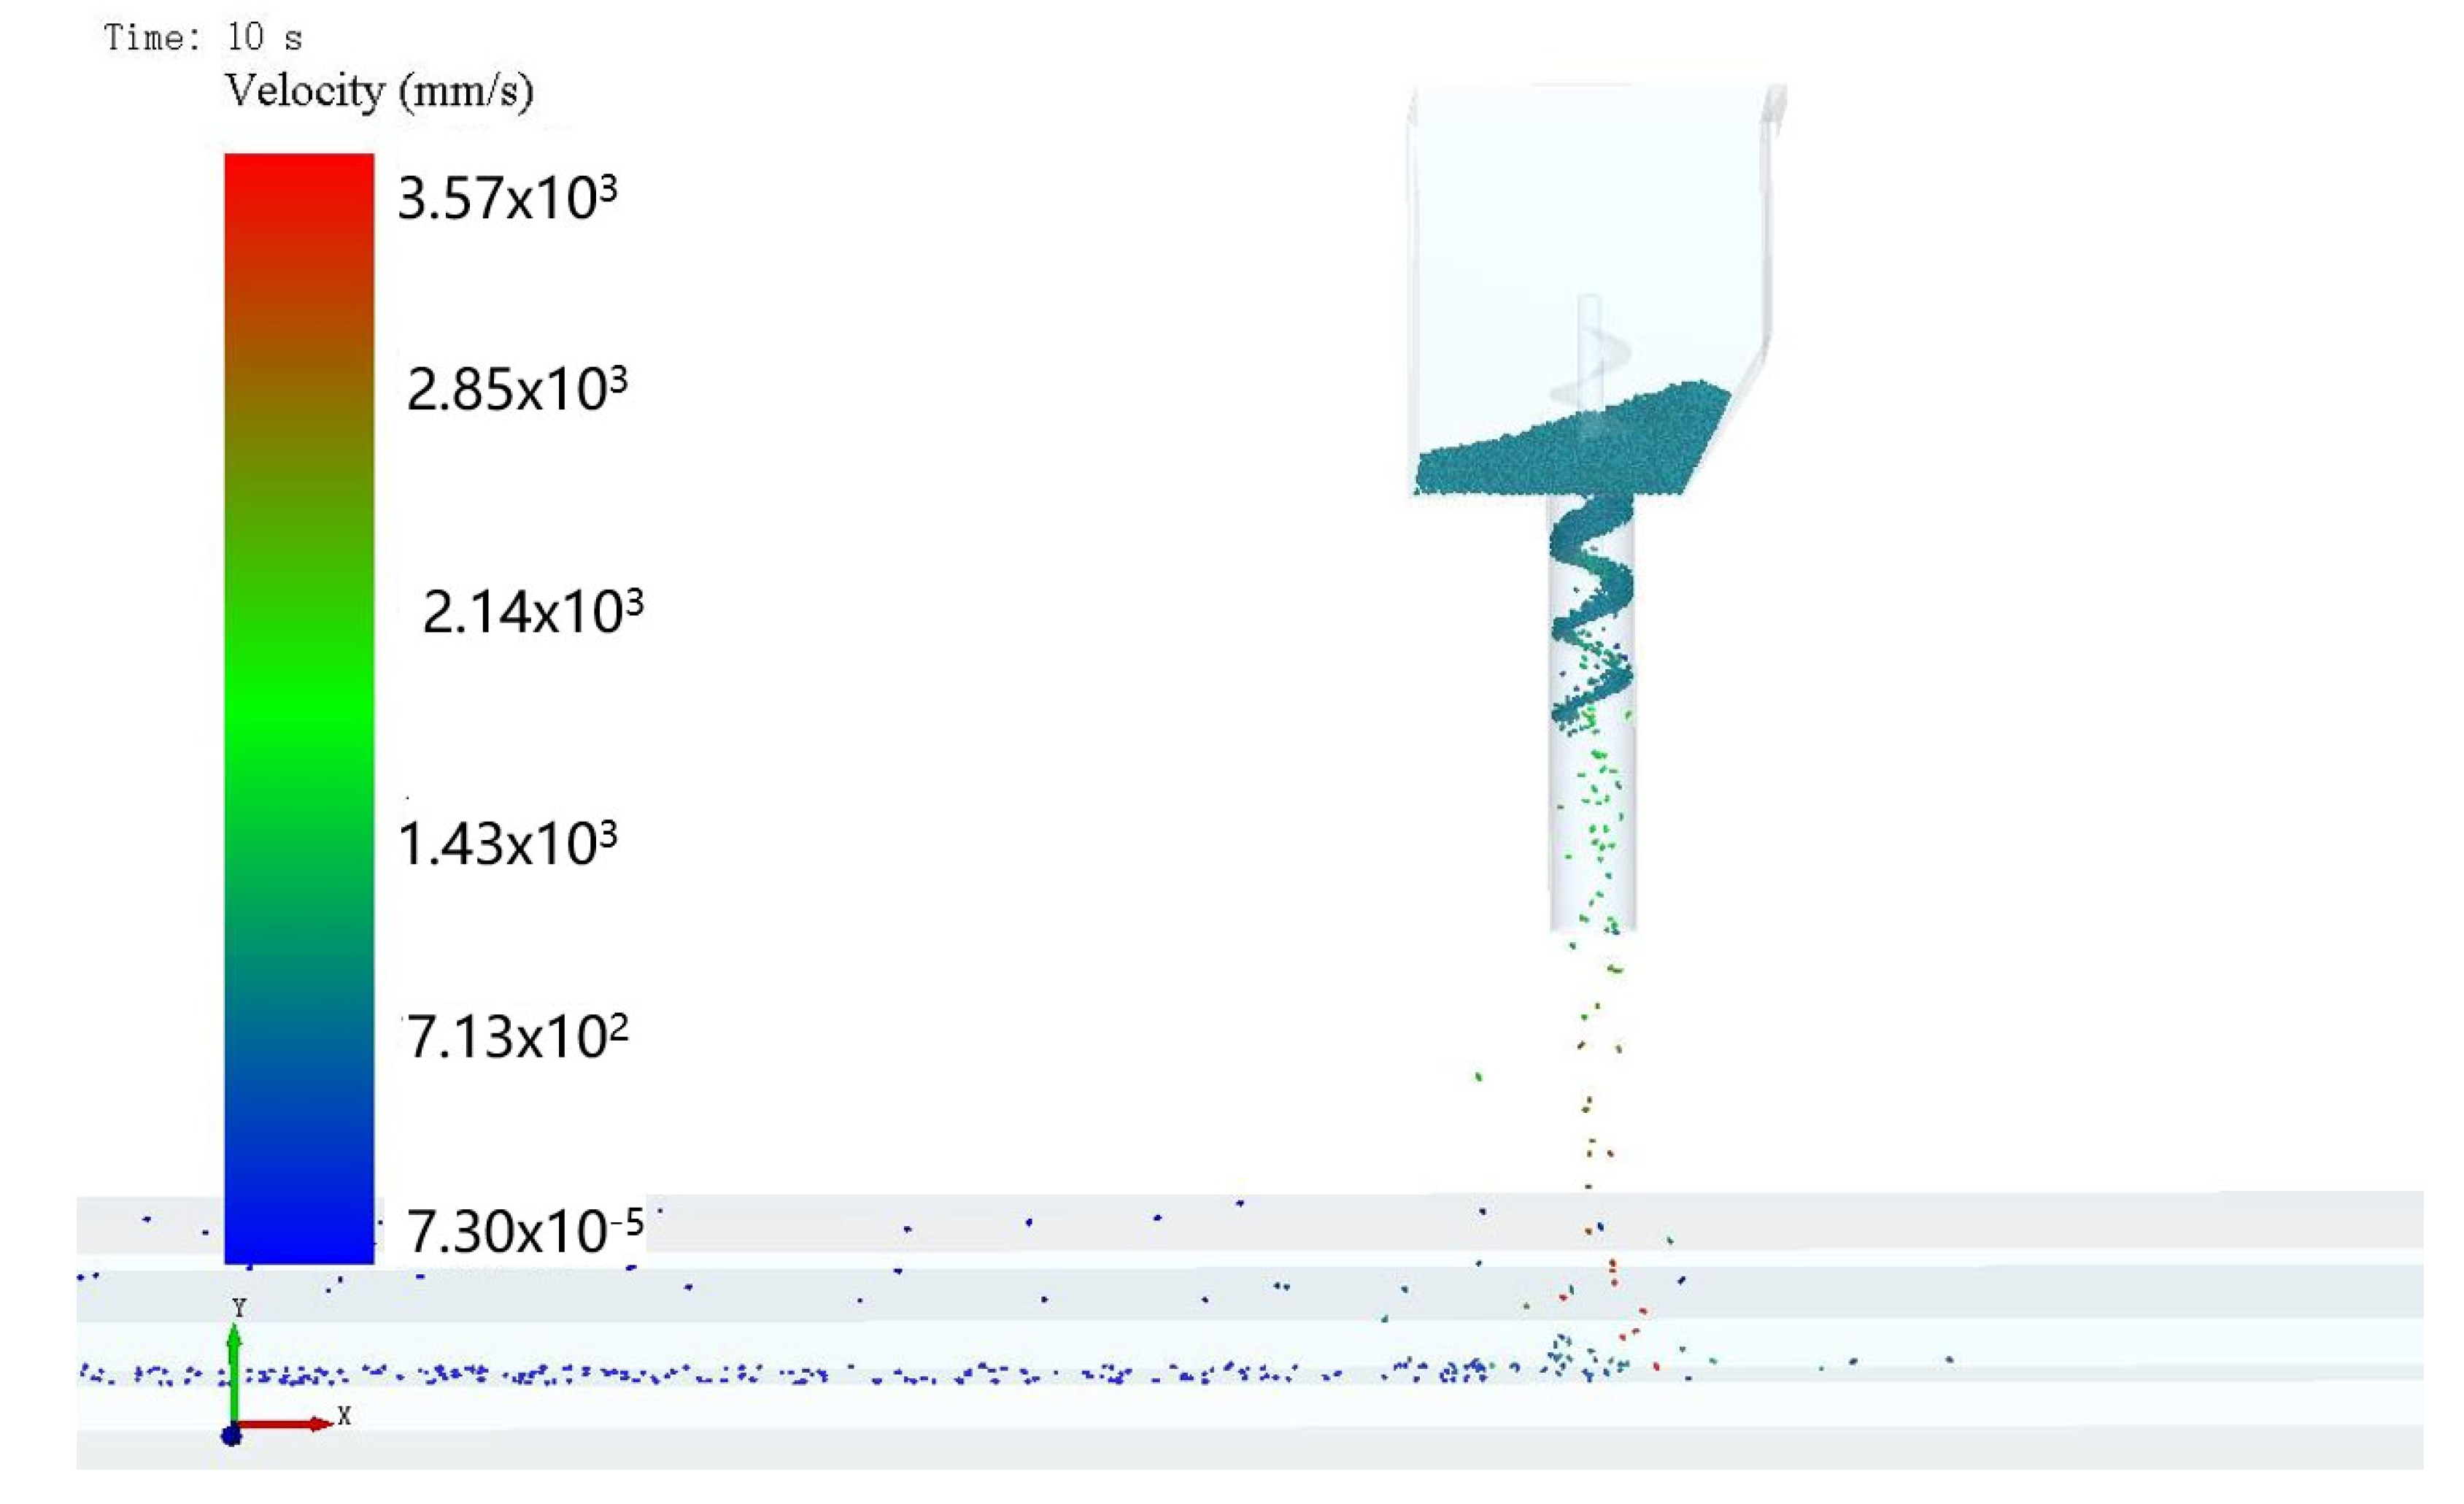
Agriculture 15 01140 g008
Figure 9. Coupled DEM-MBD approach is adopted for the analysis.
Agriculture 15 01140 g009
Figure 10. Interval statistics diagram: (a) interval statistics for pitch 56 mm, (b) interval statistics for pitch 63 mm, and (c) interval statistics for pitch 70 mm. The red color in the picture is the projection of the seed box.
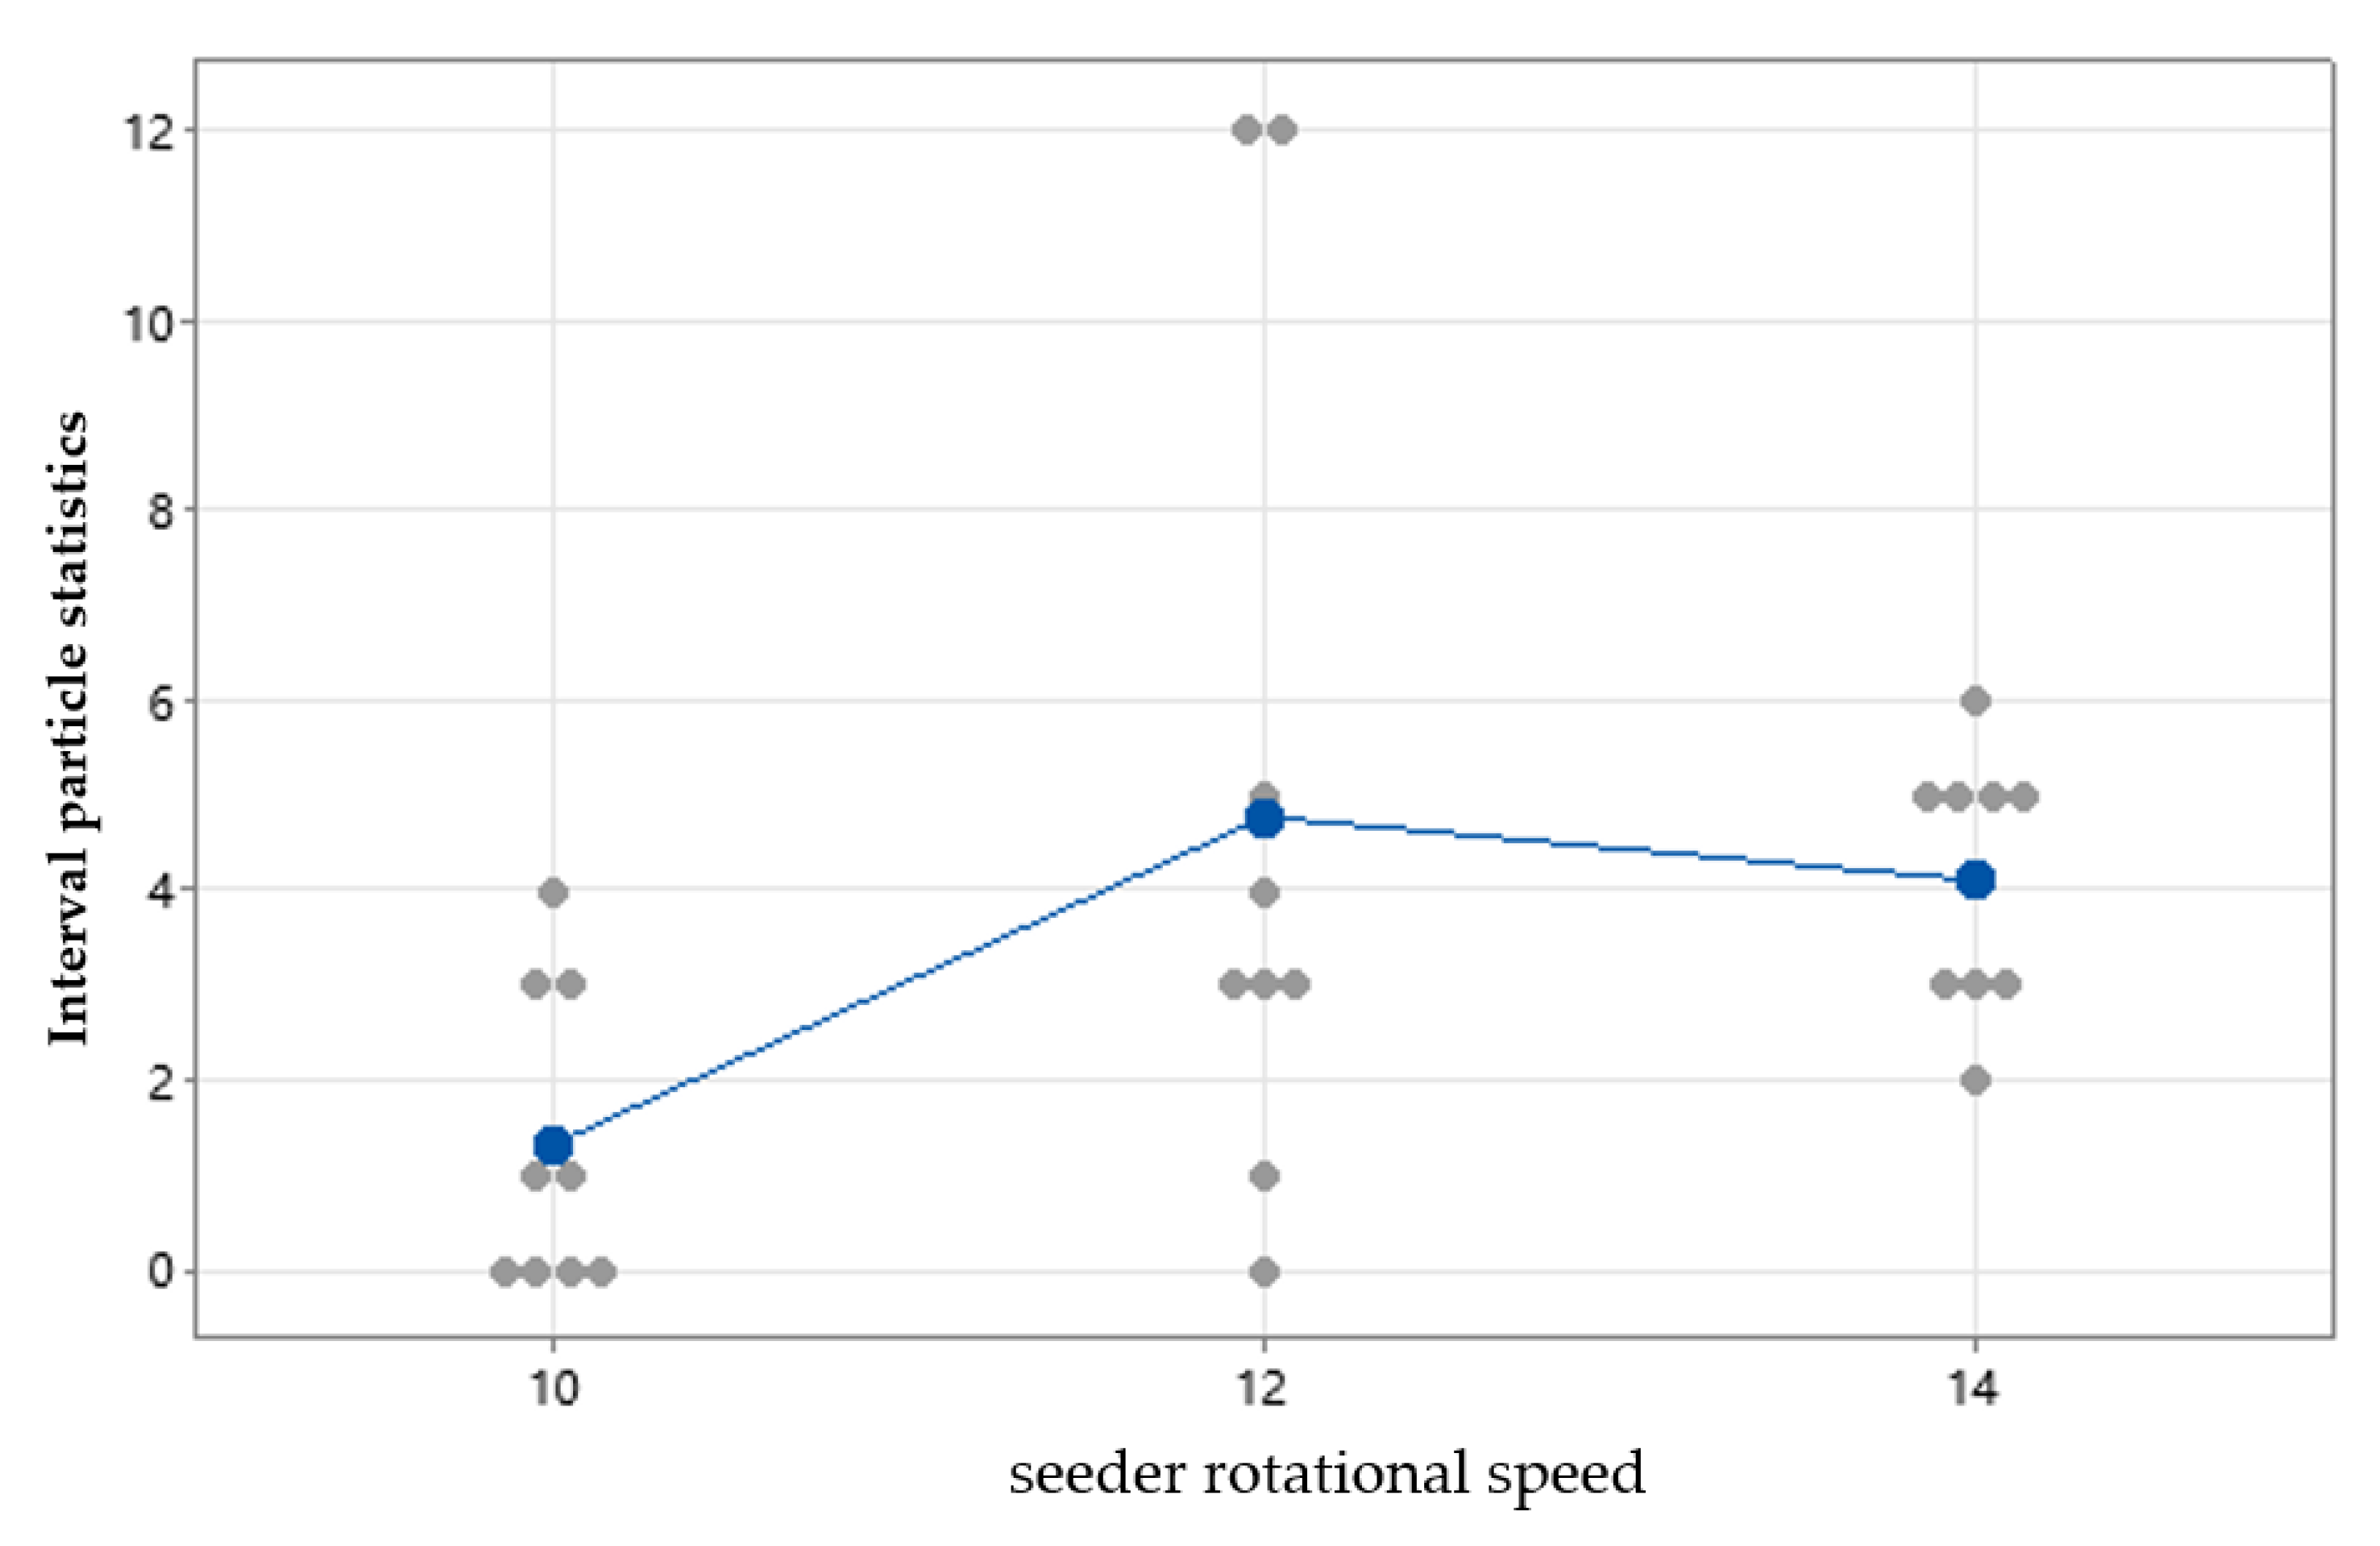
Agriculture 15 01140 g010
Figure 11. Single-value of interval particle statistics fluctuate as the rotational speed of the planter increases.
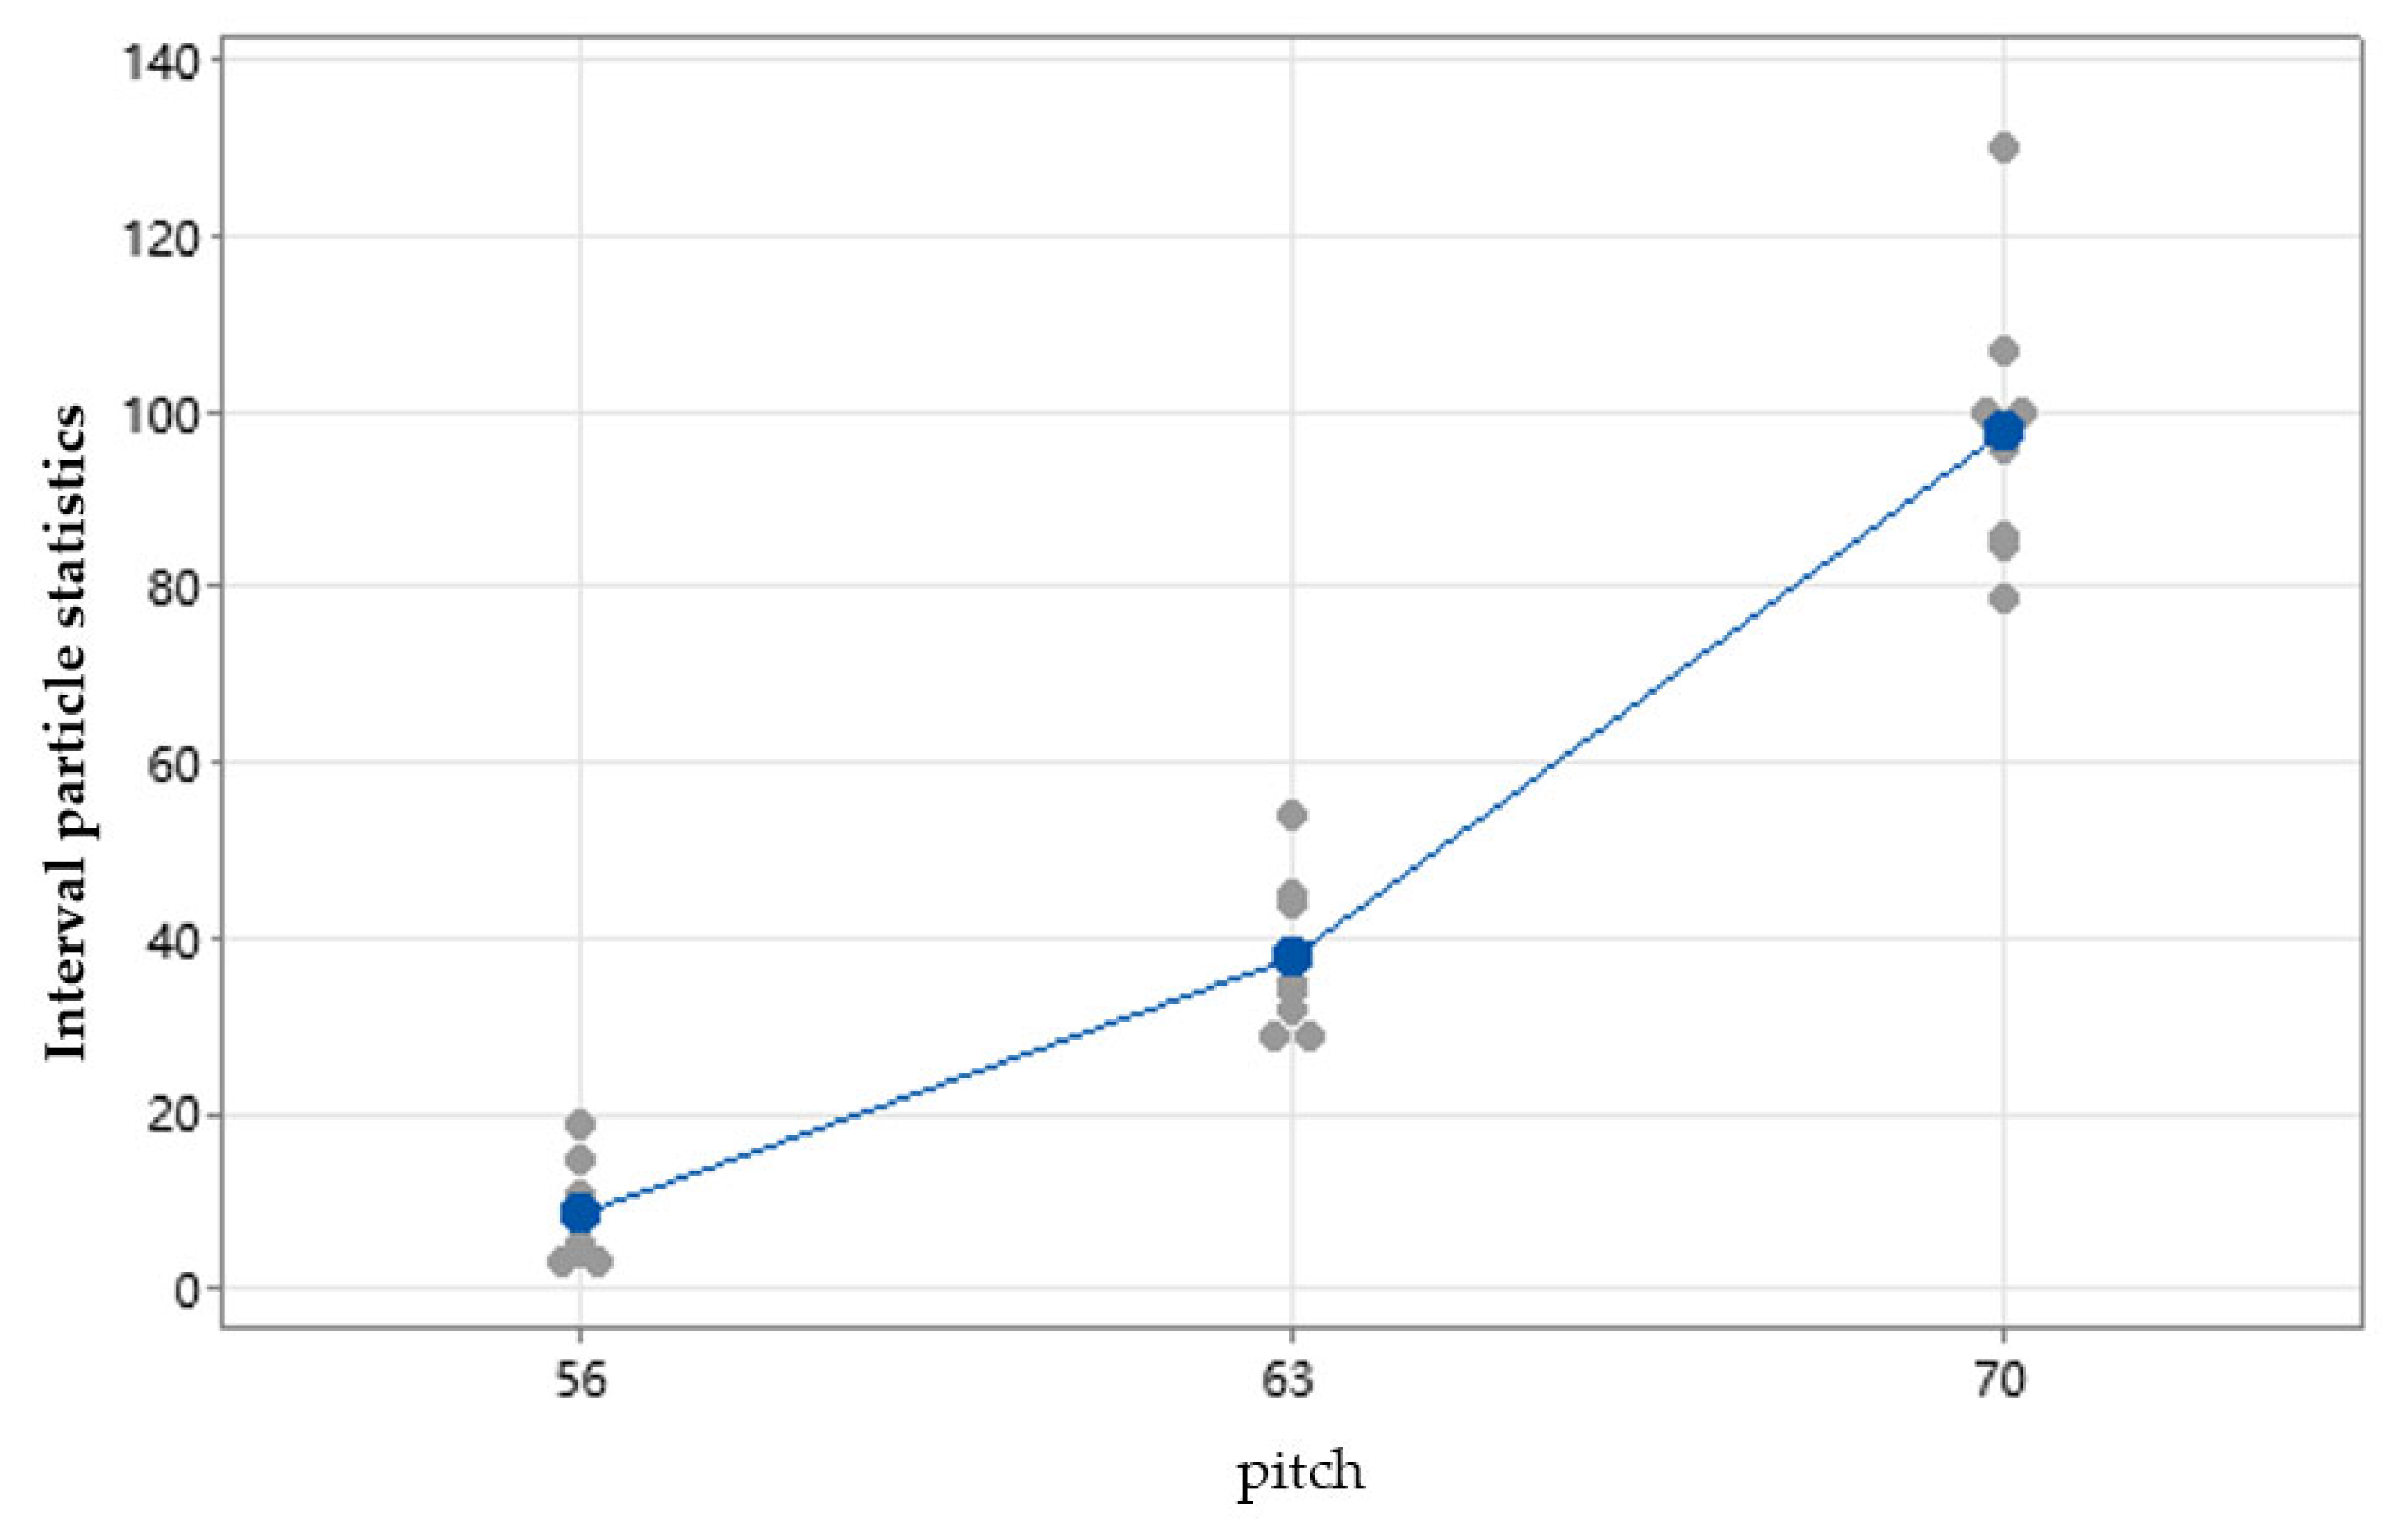
Agriculture 15 01140 g011
Figure 12. Single-value plot of interval particle statistics and grouping with the increase in pitch.
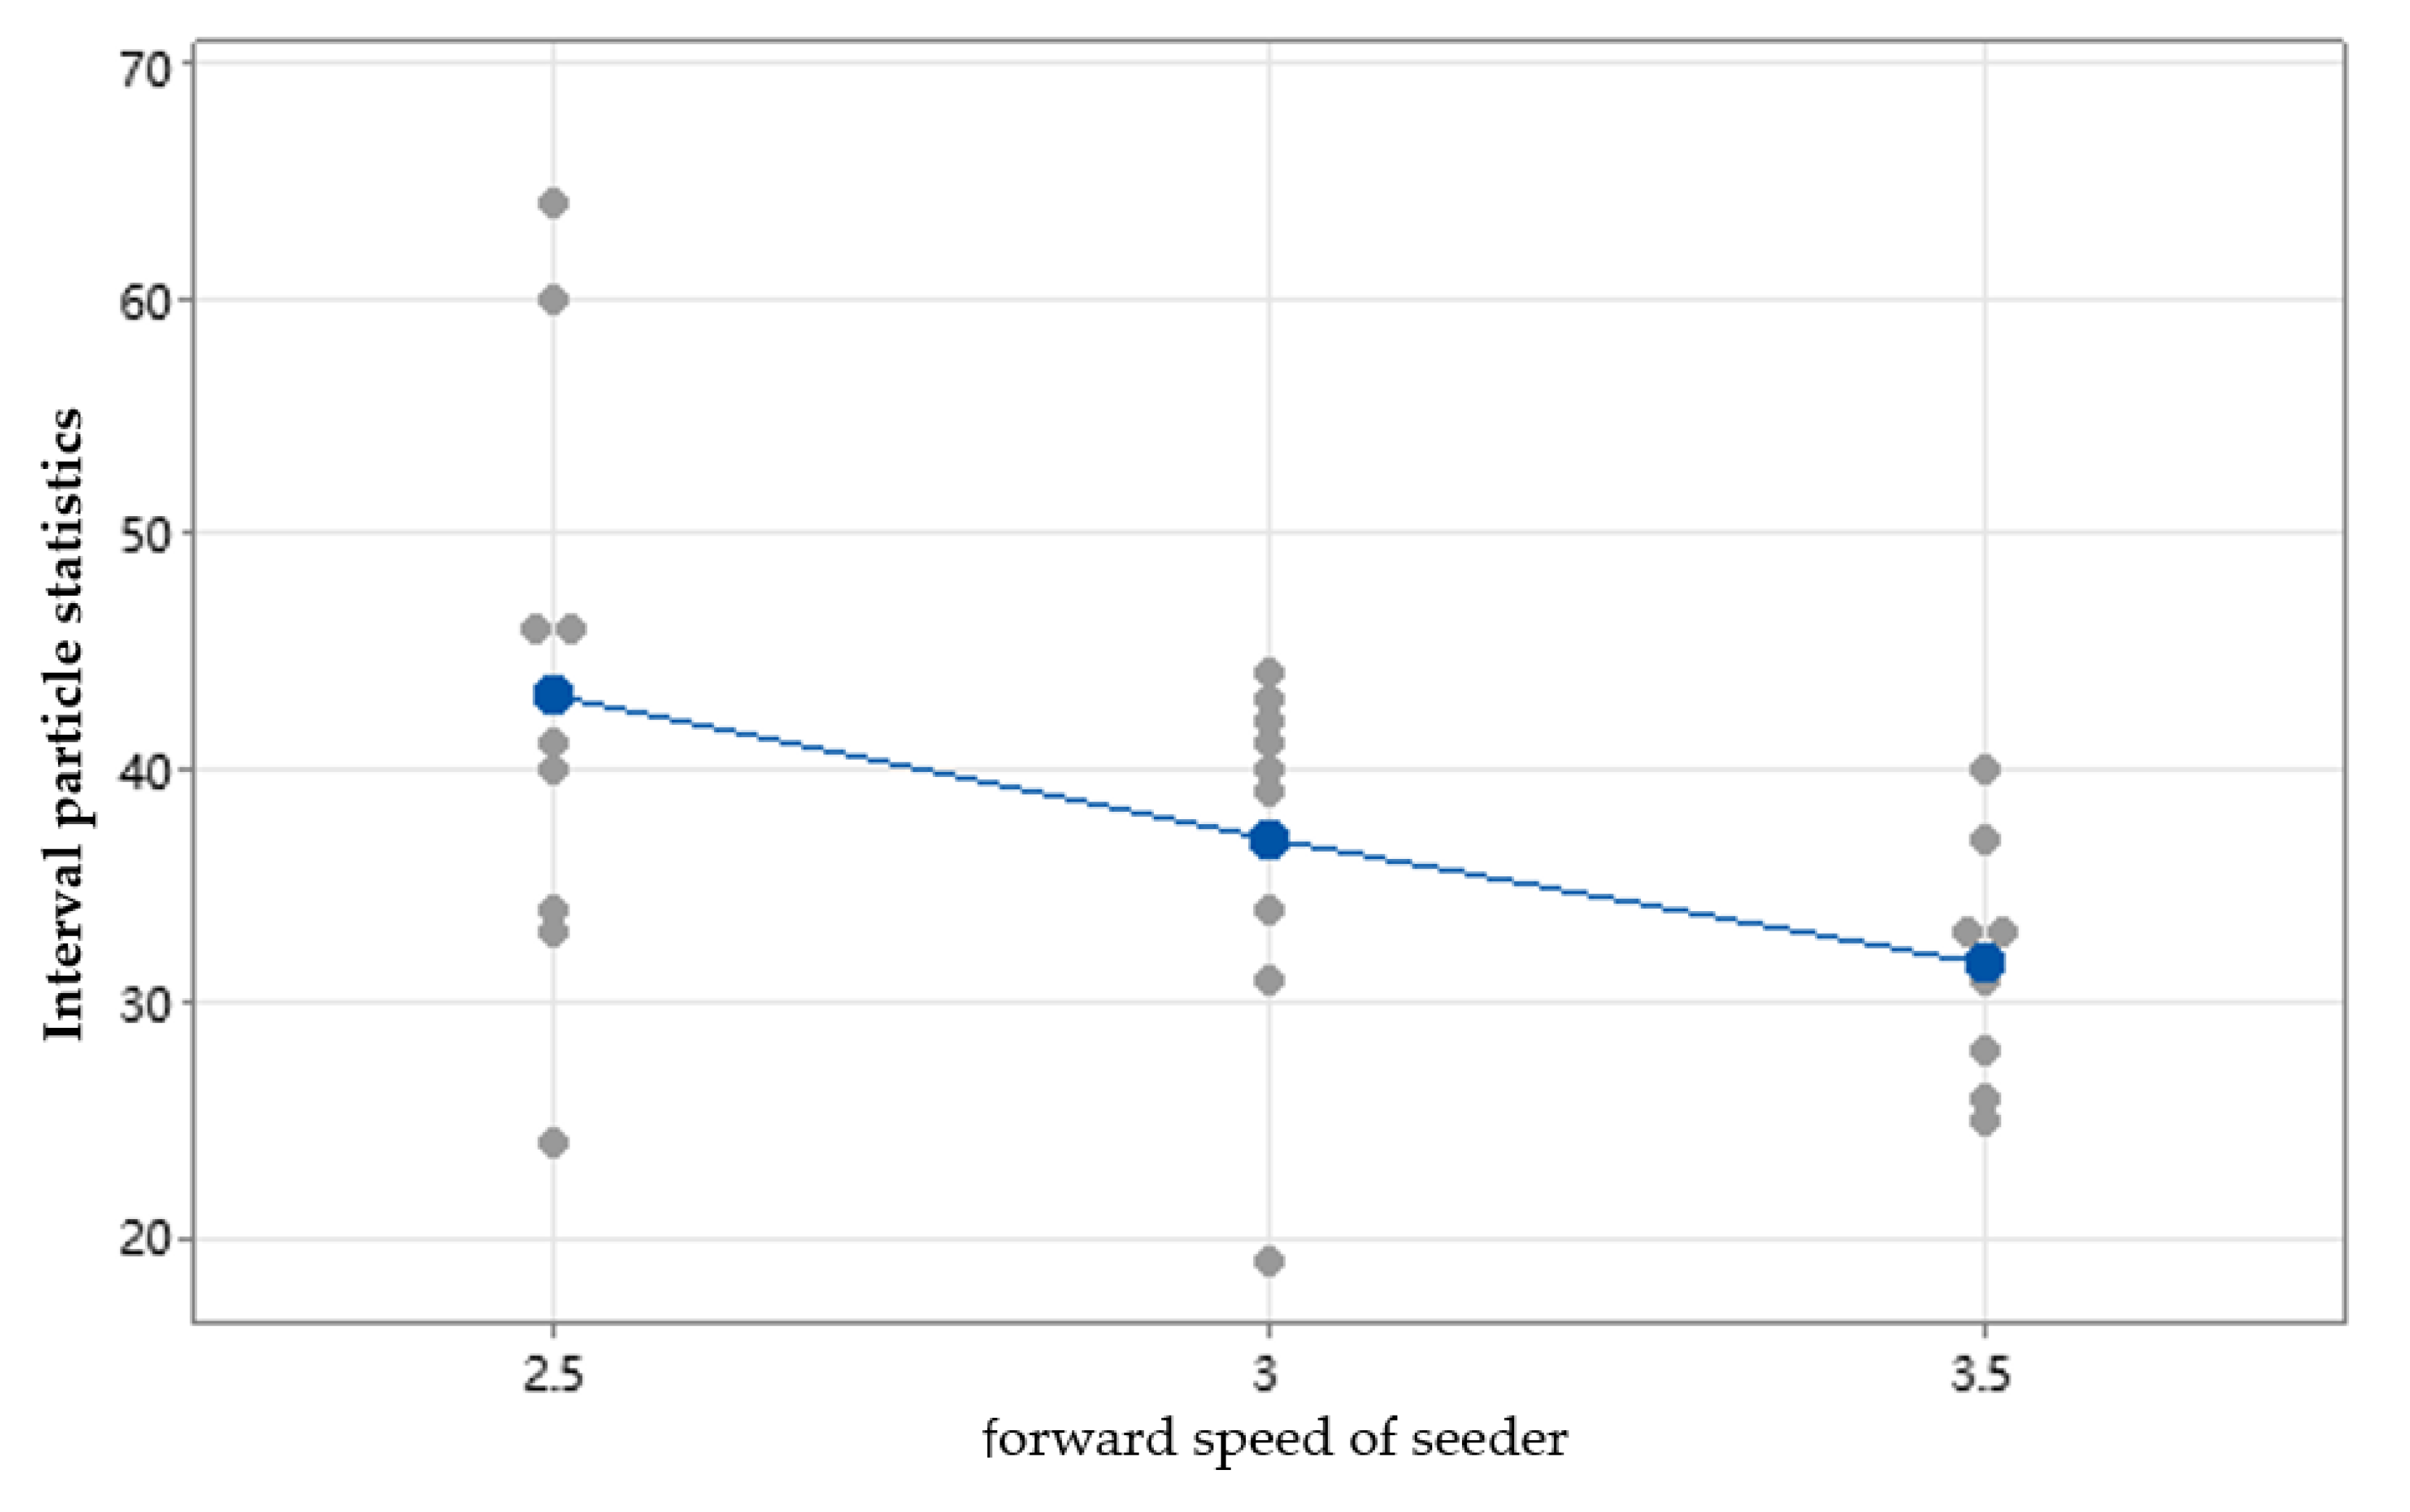
Agriculture 15 01140 g012
Figure 13. Single-value plot of interval particle statistics and grouping with increasing forward speed of the seeder.
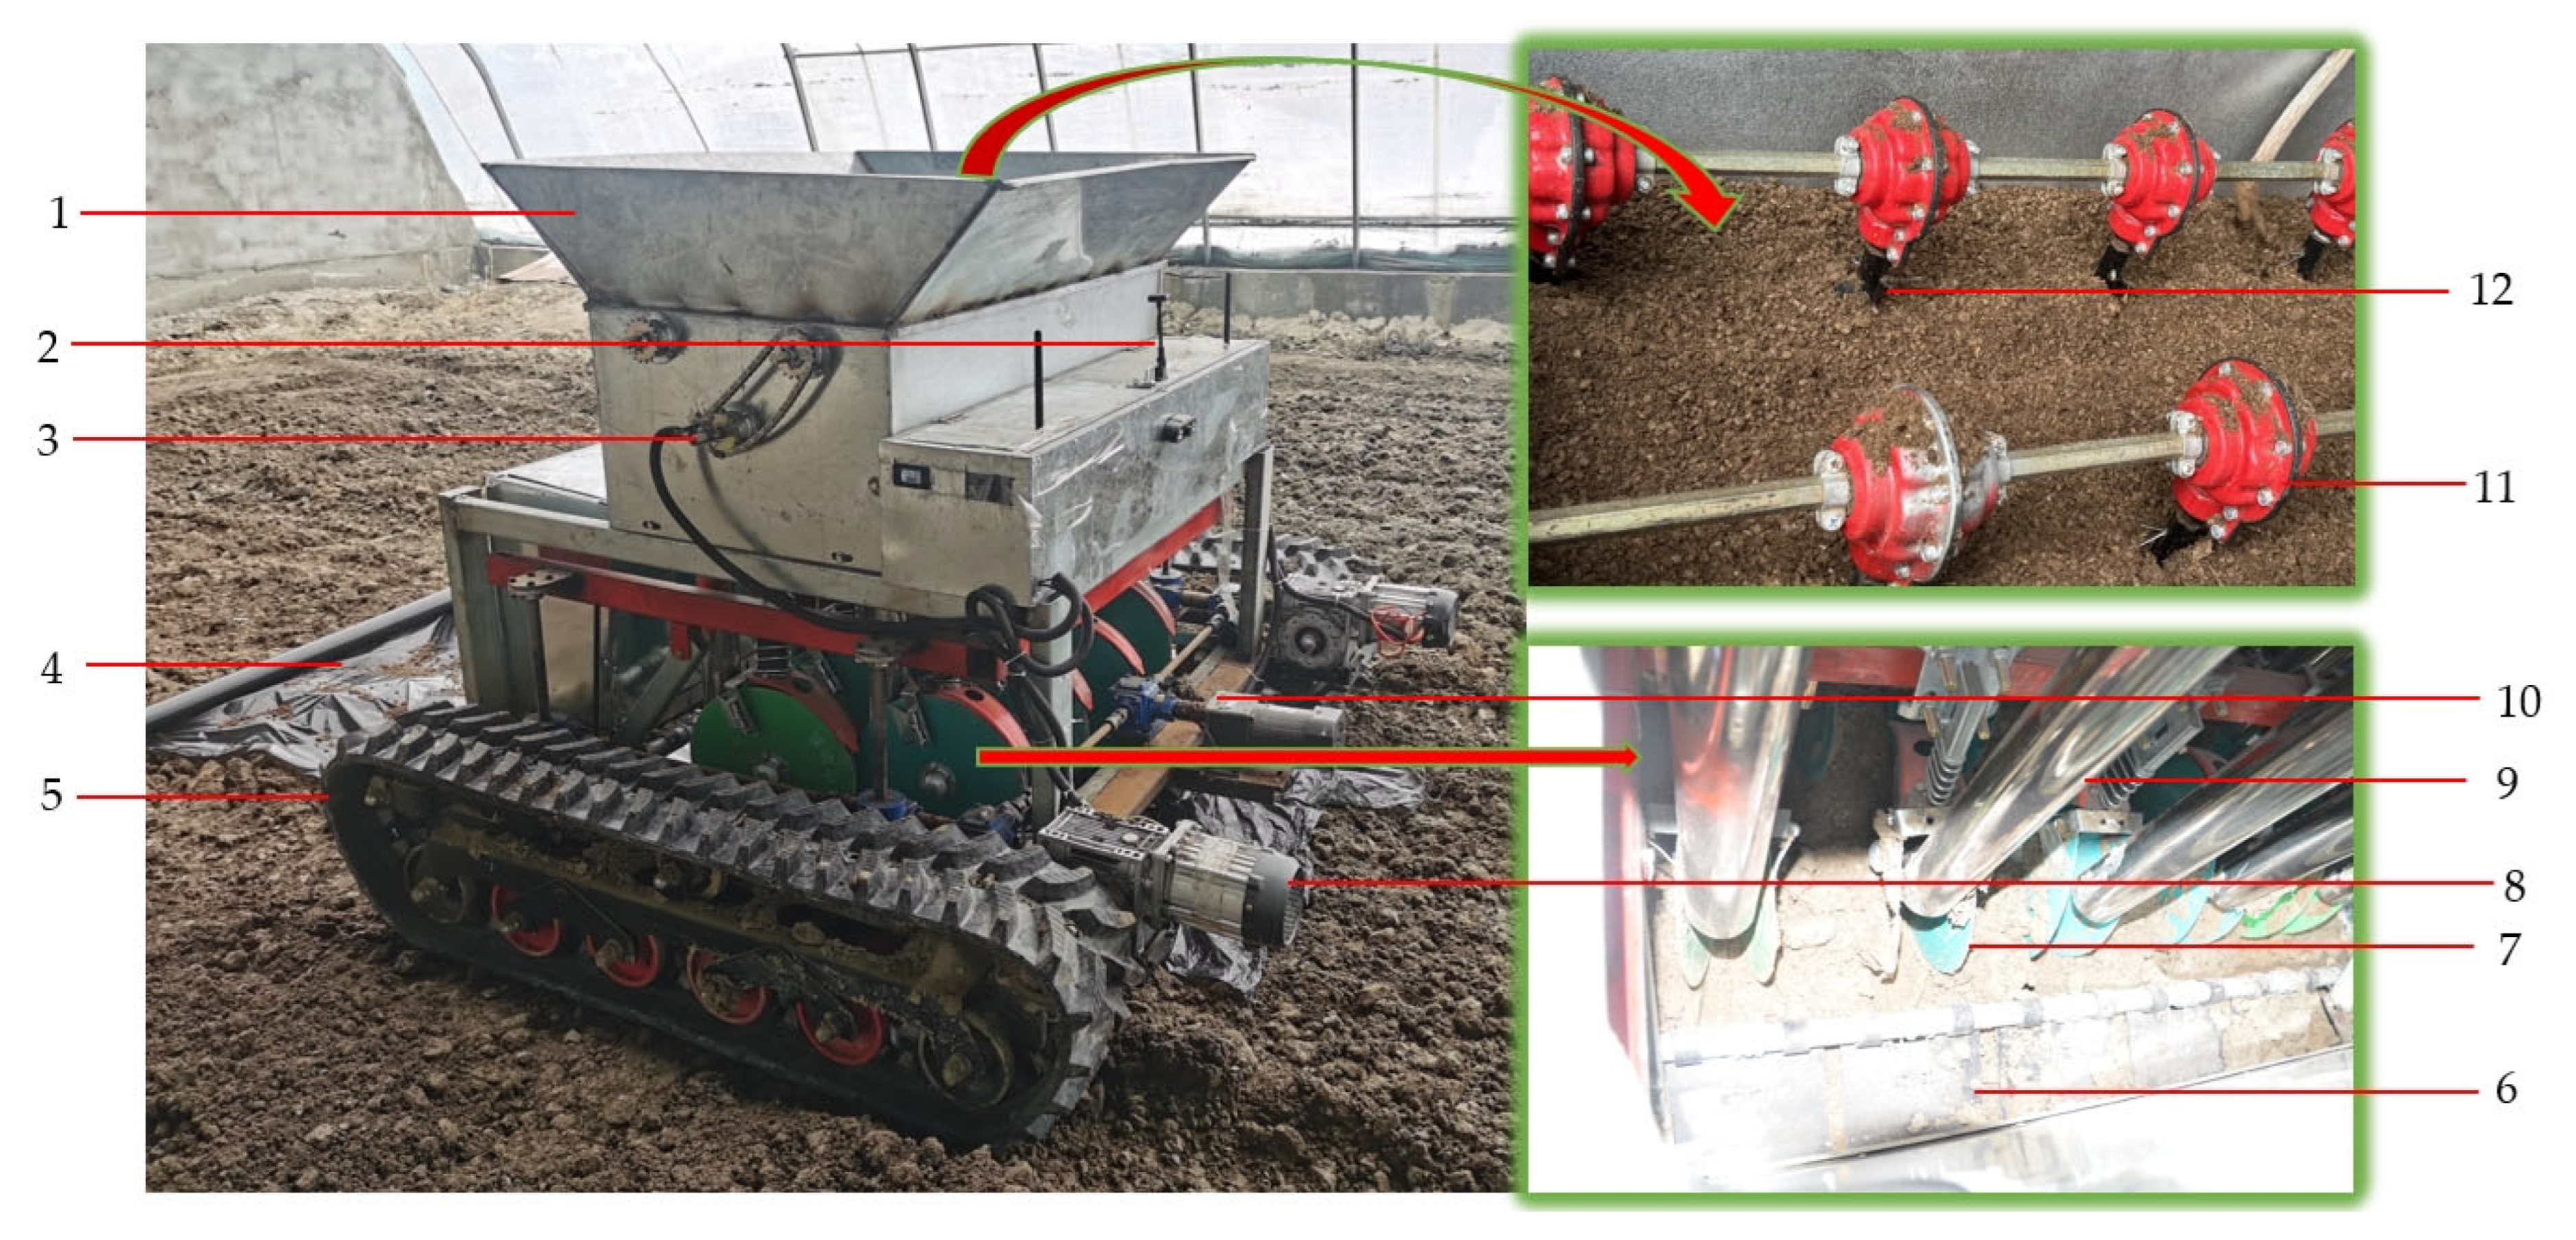
Agriculture 15 01140 g013
Figure 14. Prototype of morel mushroom seeder: 1, seeding module; 2, GPS; 3, seeder power unit; 4, seed collection cloth; 5, crawler chassis; 6, soil-covering module; 7, trenching module; 8, chassis drive motor; 9, seeding tube; 10, four-corner lifting mechanism; 11, sowing positions; and 12, spiral components.
Agriculture 15 01140 g014
Figure 15. 
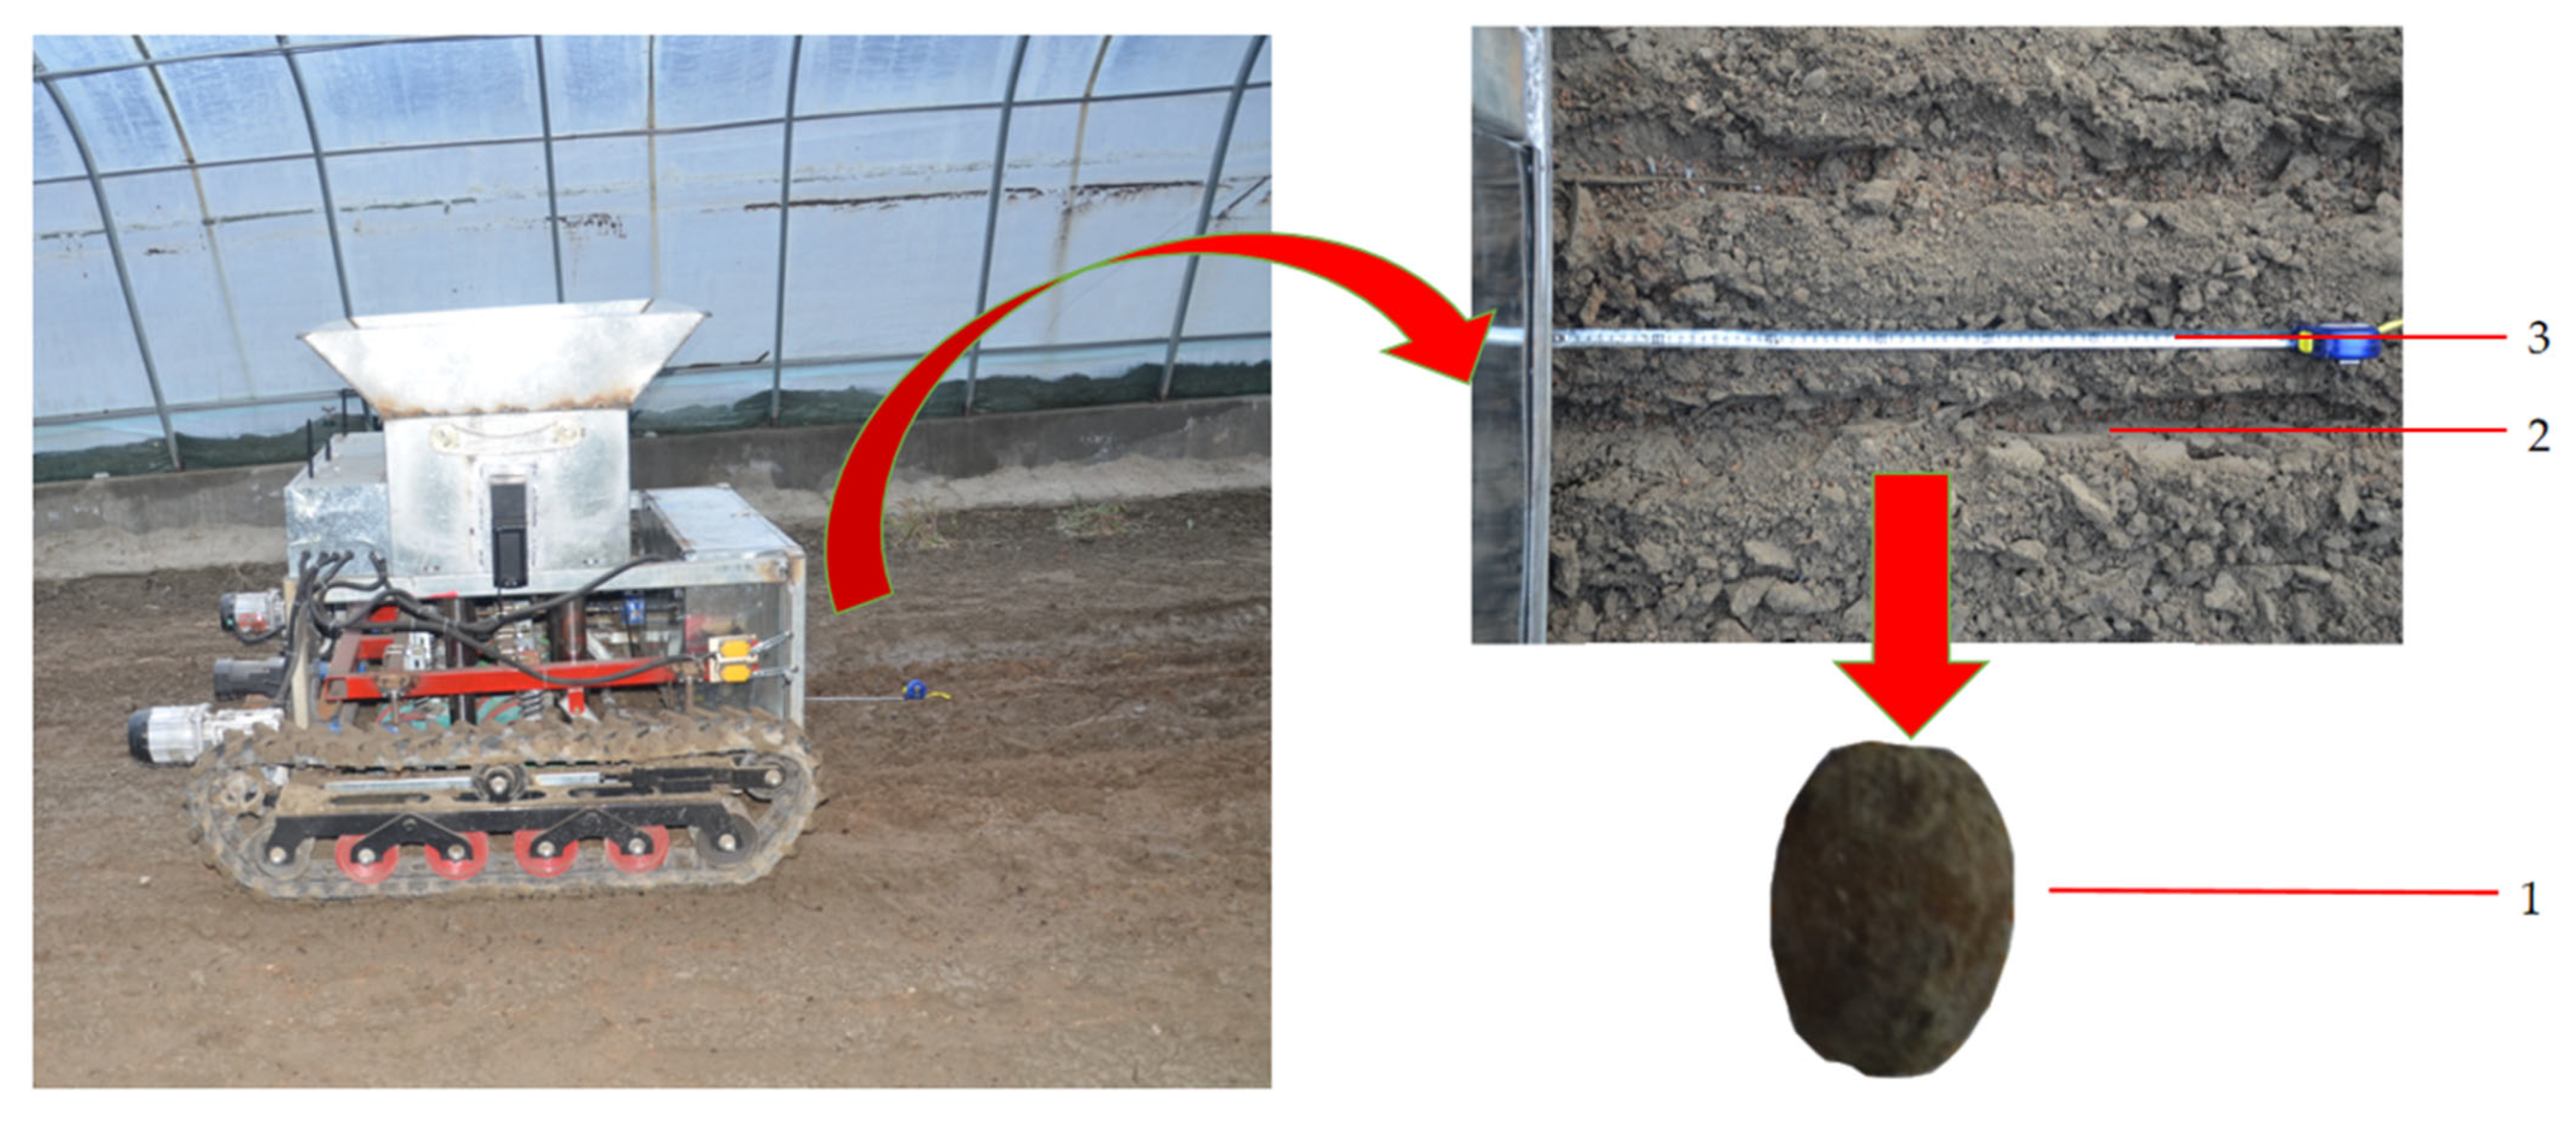
Trials of seeding with a morel mushroom seeder: 1, morel mushroom seeds; 2, seeding furrow; and 3, tape measure.
Agriculture 15 01140 g015
Figure 16. Response surface plots and contour plots of AB against composite scores: (a) response surfaces to composite scores and (b) contour plots were examined.
Agriculture 15 01140 g016
Figure 17. Response surface plots and contour plots of AC against composite scores: (a) main view of the test area and (b) side view of test area.
Agriculture 15 01140 g017
Figure 18. Response surface plots and contour plots of BC to composite scores.
Agriculture 15 01140 g018
Table 1. Simulation parameters of discrete element.
ParametersMean Value
Seed size (mm × mm × mm)7.33 × 4.51 × 4.43
Seed density (kg/m3)400
Seed Poisson’s ratio0.34
Seed shear modulus (Pa)1.23 × 10⁶
Steel density (kg/m3)7865
Steel Poisson’s ratio0.3
Steel shear modulus (Pa)7.90 × 10¹⁰
Seed-to-seed static friction coefficient0.4
Seed-to-seed kinetic friction coefficient0.45
Seed-to-steel static friction coefficient0.4
Seed-to-steel kinetic friction coefficient0.6
Table 2. Experimental factors and codes.
CodeFactors
Pitch (mm)Rotational Speed (r/min)Forward Speed (km/h)
156102.5
263123
370143.5
Unit conversion: km/h = 1,000,000/3600 mm/s; r/min = 1/60 r/s.
Table 3. Statistical information on the number of seeds.
PartitionPitch (mm)–Forward Speed (mm/s)–Rotational Speed (r/s)
56-694-0256-694-016756-694-023456-833-016763-694-0263-833-0263-833-016763-974-0270-694-0270-833-016770-833-023470-833-02
1405940192928811078592
2123383434292586857891
31205113331343187866985
431654143383710296100106
5045346424526881309786
63333464035338710093114
710246041543210779106107
851519644444331001009190
93031524393240102989474
Uniformity Coefficient29.5718.5966.8234.3770.4078.4677.7884.5390.0084.7187.3886.50
Table 4. Results of the experiment.
Run SequenceForward Speed (km/h)Pitch (mm)Spiral Speed (r/min)Interval Seed Mean
12.556122.50
22.5631243.11
32.556101.33
43.5631231.67
52.556144.11
103.056108.56
113.0701490.33
143.0631237.00
182.5701293.33
233.0701097.89
Table 5. Analysis of variance.
SourcedfAdj SSAdj MSF-Valuep-Value
Model613,813.52302.2650.910.001
Linear35365.71788.5639.550.002
Forward speed1216.6216.584.790.094
Pitch14009.64009.6188.670.001
Spiral speed1154.1154.053.410.139
2-Factor interaction3141.547.151.040.465
Forward speed   ×  pitch161.361.311.360.309
Speed  × spiral speed1139.3139.343.080.154
Pitch   ×  spiral speed196.096.042.120.219
Error4180.945.22
Total1013,994.4
Table 6. Summary of calculation results.
Partition56-694-0256-694-016756-694-023456-833-016763-694-0263-833-0263-833-016763-974-0270-694-0270-833-016770-833-023470-833-02
Uniformity coefficient (%)29.5718.5966.8134.3770.4078.4677.7884.5390.0084.7287.3886.49
Table 7. Evaluation index.
Interval ClassificationAssessment of Sowing Performance
0.9 × N0 ≤ N0 ≤ 1.1 × N0100%Excellent
1.1 × N0 < N0 ≤ 1.2 × N0, 0.8 × N0 ≤ N0 < 0.9 × N090%
1.2 × N0 < N0 ≤ 1.3 × N0, 0.7 × N0 ≤ N0 < 0.8 × N080%
1.3 × N0 < N0 ≤ 1.4 × N0, 0.6 × N0 ≤ N0 < 0.7 × N070%Qualified
1.4 × N0 < N0 ≤ 1.5 × N0, 0.5 × N0 ≤ N0 < 0.6 × N060%
1.5 × N0 < N0 ≤ 1.6 × N0, 0.4 × N0 ≤ N0 < 0.5 × N050%
1.6 × N0 < N0 ≤ 1.7 × N0, 0.3 × N0 ≤ N0 < 0.4 × N040%
1.7 × N0 < N0 ≤ 1.8 × N0, 0.2 × N0 ≤ N0 < 0.3 × N030%
1.8 × N0 < N0 ≤ 1.9 × N0, 0.1 × N0 ≤ N0 < 0.2 × N020%
1.9 × N0 < N0, N0 < 0.1 × N010%Poor
Table 8. Comprehensive evaluation results.
Parameter SettingsUniformity Index (%)Evaluation Index (%)Comprehensive Evaluation Index (%)
56-694-0229.571019.79
56-694-016718.591014.29
56-694-023466.812043.41
56-833-016734.373032.19
63-694-0270.406065.20
63-833-0278.468079.23
63-833-016777.788078.89
63-974-0284.5210092.26
70-694-0290.011050.00
70-833-016784.721047.36
Table 9. Optimal parameter values.
Forward Speed (km/h)Helical Pitch (mm)Rotation Speed (r/min)
Optimal Parameters3.56312
Table 10. Response surface analysis experimental design.
FactorsLevels
−101
A—Pitch(mm)566370
B—Rotational speed(r/min)101214
C—Forward speed(km/h)2.533.5
Table 11. Response surface optimization integrated scoring test design and results.
Test NumberA—PitchB—Spiral SpeedC—Forward SpeedY1—Uniformity IndexY2—AmountY—Comprehensive Evaluation Index
15610390.064781.86
27010342.584963.6
35614343.657373.63
47014362.858485.74
556122.548.567074.4
670122.566.654872.86
756123.578.967387.8
870123.575.486583.2
963102.562.395272.75
1063142.566.3912575.56
1163103.572.8510287.35
1263143.582.5210191.63
136312391.2511290.73
146312387.6511090.09
156312392.4111490.4
166312389.6310692.48
176312388.7410592.53
Table 12. Results of the analysis of regression coefficients.
SourceAdj SSd fAdj MSF-Valuep-ValueSignificance
Model1253.679139.3056.34<0.0001**
A—Pitch18.88118.887.640.0280*
B—Rotationalspeed55.13155.1322.300.0022**
C—Forward speed370.061370.06149.67<0.0001**
AB230.581230.5893.26<0.0001**
AC2.3412.340.950.3629
BC0.5410.540.220.6544
A2314.901314.90127.36<0.0001**
B2171.951171.9569.55<0.0001**
C238.73138.7315.670.0055**
Residual17.3172.47
Lack of fit11.8233.942.870.1673ns
Error5.4941.37
Total1270.9816
Note: p < 0.01 is highly significant and denoted by **, p < 0.05 is significant and denoted by *, p > 0.05 is not significant and denoted by ns.
Table 13. Results of correlation analysis.
ProjectsValueProjectsValue
Standard1.57Model coefficients (R2)0.99
Mean value82.74Calibration decision factor (R2Adj)0.97
Coefficient of variation/%1.90Predicted coefficient of decision (R2Pre)0.84
Sum of squares of errors in forecasts197.65Relative accuracy22.52
Disclaimer/Publisher’s Note: The statements, opinions and data contained in all publications are solely those of the individual author(s) and contributor(s) and not of MDPI and/or the editor(s). MDPI and/or the editor(s) disclaim responsibility for any injury to people or property resulting from any ideas, methods, instructions or products referred to in the content.

