Article

DMN-YOLO: A Robust YOLOv11 Model for Detecting Apple Leaf Diseases in Complex Field Conditions

1
College of Information Engineering, Tarim University, City of Aral 843300, China
2
College of Cyber Security, Tarim University, City of Aral 843300, China
3
Key Laboratory of Tarim Oasis Agriculture, Ministry of Education, City of Aral 843300, China
4
School of Computer Science, Wuhan University, Wuhan 430072, China
*
Author to whom correspondence should be addressed.
Agriculture 2025, 15(11), 1138; https://doi.org/10.3390/agriculture15111138 (registering DOI)
Submission received: 16 April 2025 / Revised: 19 May 2025 / Accepted: 22 May 2025 / Published: 25 May 2025

Abstract

:
Accurately identifying apple leaf diseases in complex field environments is a critical concern for intelligent agriculture, as early detection directly affects crop health and yield outcomes. However, accurate feature recognition remains a significant challenge due to the complexity of disease symptoms, background interference, and variations in lesion color and size. In this study, we propose an enhanced detection framework named DMN-YOLO. Specifically, the model integrates a multi-branch auxiliary feature pyramid network (MAFPN), along with Superficial Assisted Fusion (SAF) and Advanced Auxiliary Fusion (AAF) modules, to strengthen feature interaction, retain shallow-layer information, and improve high-level gradient transmission, thereby enhancing multi-scale lesion detection performance. Furthermore, the RepHDWConv module is incorporated into the neck network to increase the model’s representational capacity. To address difficulties in detecting small and overlapping lesions, a lightweight RT-DETR decoder and a dedicated detection layer (P2) are introduced. These enhancements effectively reduce both missed and false detections. Additionally, a normalized Wasserstein distance (NWD) loss function is introduced to mitigate localization errors, particularly for small or overlapping lesions. Experimental results demonstrate that DMN-YOLO achieves a 5.5% gain in precision, a 3.4% increase in recall, and a 5.0% improvement in mAP@50 compared to the baseline, showing consistent superiority across multiple performance metrics. This method offers a promising solution for robust disease monitoring in smart orchard applications.

1. Introduction

The Aksu region in Xinjiang is a major apple-producing area in China, renowned for its unique climatic conditions and high-quality fruit. According to statistics, the apple cultivation area in Aksu reached 34,353 hectares in 2024, with an annual output of 901,000 tons [1]. However, during the growth period, apple trees are highly susceptible to various diseases and pests, particularly brown spot and powdery mildew. These diseases pose a serious threat to tree health, leading to reduced yield and fruit quality, thereby impacting farmers’ economic returns and hindering the sustainable development of the regional agricultural economy.
Traditionally, identifying leaf diseases has relied on manual observation and expert assessment [2,3], which are not only labor-intensive and slow but also prone to inconsistency and environmental interference. This limits the scalability and reliability of disease monitoring in large orchards. To address these shortcomings, numerous researchers have turned to computer vision and machine learning technologies to develop automated diagnostic tools [4]. Dubey et al. [5] developed an apple disease classification approach based on image processing, where optimized K-Means clustering was used to segment diseased regions, and a multi-class support vector machine (SVM) was employed for classification, achieving an accuracy of 93%. Omrani et al. [6] evaluated the performance of artificial neural networks (ANNs), support vector machines (SVMs), and support vector regression (SVR) in classifying apple leaf diseases such as spot and black spot, finding that SVMs outperformed ANNs in classification accuracy. Compared with traditional manual monitoring, these methods proved faster, more cost-effective, and more efficient, offering a viable automated solution for large-scale disease management in orchards. Pallathadka et al. [7] further explored the use of SVMs, Naïve Bayes, and convolutional neural networks (CNNs) for disease classification, employing histogram equalization for preprocessing and principal component analysis (PCA) for feature extraction. While methods like SVM and K-Means clustering can enhance detection efficiency, they heavily depend on complex preprocessing and manual feature extraction. These techniques tend to perform well under controlled conditions with uniform backgrounds but exhibit poor adaptability and robustness in complex real-world environments [8,9]. In practice, disease symptoms manifest in diverse shapes, sizes, and colors, often randomly distributed on leaf surfaces. Early-stage lesions are usually small and evolve dynamically over time, with variations in color, size, and morphology. These factors present substantial challenges to traditional detection algorithms, limiting their effectiveness in practical applications.
The advancement of deep learning technology has introduced new solutions for agricultural disease detection. In particular, the widespread adoption of object detection models in computer vision has made disease identification more accurate and efficient. Zhong et al. [10] employed a DenseNet-121-based model to classify six types of apple leaf diseases using regression, multi-label classification, and an attention-augmented loss approach. These techniques yielded accuracies of 93.51%, 93.31%, and 93.71% on a dataset comprising 2462 leaf samples, outperforming the standard cross-entropy method (92.29%). Wang et al. [11] designed MGA-YOLO, a compact detection network with a file size of 10.34 MB, which attained a mean average precision (mAP) of 94.0% on a custom dataset. Similarly, Zhu et al. [12] proposed the EADD-YOLO model, which optimized the network structure for the detection of apple leaf diseases and achieved a mAP of 95.5% and a detection speed of 625 FPS on an ALDD dataset. Compared to recent approaches, EADD-YOLO improved accuracy by 12.3%, increased the detection speed by 59.6 FPS, and significantly reduced both the model parameters and computational load, thereby enhancing overall detection efficiency. Despite these advancements, leaf disease detection under complex conditions still presents significant challenges. Illumination variability, overlapping foliage, intricate backgrounds, and subtle lesion patterns continue to challenge the robustness and generalizability of existing models.
To effectively manage detection complexity in field conditions, we propose a new YOLOv11-based model named DMN-YOLO. The novelty and contributions of the proposed method can be outlined as follows:
(1)
A multi-branch auxiliary feature pyramid network (MAFPN) is integrated into the YOLOv11 framework to enhance feature interaction and fusion. To improve multi-scale lesion detection, the Shallow Auxiliary Fusion (SAF) module is designed to retain fine-grained features from early layers, while the Advanced Auxiliary Fusion (AAF) module facilitates efficient top-down gradient propagation. Together, these components enhance the model’s feature representation across different spatial resolutions.
(2)
The Reparameterized Heterogeneous Depthwise Convolution (RepHDWConv) module is incorporated into the neck of the network. This module combines multi-scale depthwise separable convolution with a reparameterization strategy, enabling enhanced feature representation through multi-scale extraction during training. In the inference phase, it is restructured into a single convolutional layer via structural reparameterization, thereby effectively reducing computational costs without compromising accuracy.
(3)
To strengthen the detection of small and partially obscured targets, the RT-DETR decoder is integrated as the terminal detection head within the YOLOv11 framework. Additionally, a supplementary detection layer (P2) is appended to the feature pyramid to focus on fine-scale feature extraction. This architectural enhancement improves the model’s sensitivity to densely clustered or occluded lesions. Experimental evaluation confirms that the revised design reduces both false negatives and false positives while also improving discrimination between overlapping lesions and diseases with similar visual characteristics.
(4)
To address the localization errors often encountered in detecting small or overlapping lesions using traditional loss functions, the normalized Wasserstein distance (NWD) is adopted as a novel regression loss function. This modification alleviates the low sensitivity of conventional loss functions to targets of varying scales, thus enhancing both the robustness and localization accuracy of the model.

2. Materials and Methods

2.1. Subsection Dataset Description

The experimental images were collected from an apple orchard in the Hongqipo area of Aksu, Xinjiang, China. The dataset was acquired over six months from March to September 2024, covering various stages of apple growth and disease progression. All images were captured using a smartphone camera (iPhone 13, Apple Inc., manufactured in Foxconn, Zhengzhou, China) equipped with a 12 MP wide-angle lens (f/1.6 aperture, 26 mm focal length, 1.7 µm pixel size) under natural lighting conditions. The resolution of most images was 2048 × 1365 pixels. The device was handheld at a distance of approximately 30–50 cm from the leaf surface, ensuring consistent framing and focus. These diseases, caused by various pathogens, can negatively affect plant health and reduce apple yield. The dataset primarily focuses on seven common apple leaf diseases: spotted leaf spot, brown spot, frogeye leaf spot, mosaic, powdery mildew, rust, and scab, each with distinct morphological and symptomatic features. Table 1 outlines the characteristic symptoms associated with each type of apple leaf disease included in this study.
Figure 1 presents typical images of the annotated apple leaf diseases used in this study, each demonstrating unique pathological features that contribute to inter-class variability. These lesions vary greatly in morphology, color, and distribution. Some lesions exhibit well-defined circular or oval shapes, whereas others appear more diffuse, with irregular and indistinct boundaries. The lesions exhibit a broad range of colors, including shades of light yellow, dark brown, and dark green, which correspond to different stages of disease progression. Notably, many lesions are small in size and exhibit high-density, irregular distribution, adding complexity and challenge to the disease detection process.

2.2. Description Processing and Data Selection

A total of 2431 high-quality images were selected for this experiment, consisting of 719 single-background images and 1712 complex-background images. The single-background images were captured in a controlled laboratory environment, making it easier for the model to learn disease characteristics. On the other hand, the complex-background images were taken in a natural environment, which helps enhance the model’s generalization ability and ensures accurate disease detection in real orchard scenes. A labeling tool was used to precisely annotate the images. The dataset was randomly divided into a training set (1701 images), a validation set (486 images), and a test set (244 images) in a 7:2:1 ratio to assess the model’s ability to generalize across unseen data. Data augmentation was then applied individually within each subset to ensure that augmented variants of a given image remained in the same set, thus preserving the independence of the validation and test sets. Figure 2 illustrates the dataset containing apple leaf disease images.
The detection of apple leaf diseases can be impeded by inconsistent lighting conditions encountered during the image capture process. Strong light can cause reflections, blurring the edges of lesions, while weak light or shadow areas can make lesions unclear, making it more difficult to accurately identify the disease. To address these challenges and simulate the impact of light changes in complex environments, this study utilized the Albumentations library for data augmentation. By randomly adjusting parameters such as contrast, brightness, and saturation, three versions of each apple leaf disease image were generated under different light intensities. This approach increased the diverse composition of the training samples, helping to promote better generalization behavior in the model in detecting lesions under varying lighting conditions. As a result, the dataset was expanded to a total of 6301 images depicting various apple leaf diseases, providing a more robust foundation for training the detection model. Figure 3 displays examples of apple leaf disease images captured under varying lighting conditions.

2.3. YOLOv11 Model Selection

YOLOv11 [20,21] (You Only Look Once version 11) represents a significant advancement in the widely adopted YOLO real-time object detection framework, which is acclaimed for its high detection speed and robust accuracy. Building on the foundational strengths of its predecessors, YOLOv11 integrates a series of architectural enhancements aimed at improving both detection performance and computational efficiency in complex visual recognition tasks.
The architecture of YOLOv11 is composed of three principal modules [22]. The Backbone module is constructed upon an improved Darknet-53 architecture, which serves as the primary feature extractor. It incorporates CSPLayer to enhance gradient flow, improve feature representation, and maintain the lightweight nature of the network. The Neck module adopts a hybrid FPN (Feature Pyramid Network) + PAN (Path Aggregation Network) structure to effectively fuse multi-scale feature representations, thereby reducing spatial distortion, accelerating candidate box generation, and lowering computational costs. Finally, the Head module employs a decoupled detection head alongside an anchor-free mechanism to optimize the assignment of positive and negative samples, ultimately achieving more accurate and efficient object localization and classification.

2.4. DMN-YOLO Apple Leaf Disease Detection Model

While the YOLOv11 model demonstrates strong performance in general object detection, it still faces several challenges when applied to apple leaf disease detection. These include difficulty in detecting lesions of varying scales, a tendency to miss small lesions due to complex backgrounds and diverse lesion patterns, and low sensitivity to overlapping diseased areas. To overcome these challenges, we present the DMN-YOLO model, incorporating multiple significant enhancements. First, a multi-branch auxiliary feature pyramid network (MAFPN) is incorporated to strengthen feature interaction and fusion across scales. Second, the RepHDWConv module is added to the neck of the network to enhance the model’s feature representation capabilities. Third, the RT-DETR decoder is used as the detection head to improve recognition accuracy, particularly in complex scenarios. In addition, detection performance on minor lesions is enhanced through the addition of a P2 layer, and bounding box precision is further improved using the NWD loss function. Figure 4 presents a structural overview of the proposed DMN-YOLO model.

2.5. Efficient MAFPN Structure

In convolutional neural networks, shallow feature maps preserve more precise localization information and fine-grained textures due to their smaller receptive fields. In contrast, deep feature maps, obtained through multiple convolutional operations, contain richer semantic information but tend to lose spatial details and localization accuracy, particularly for small targets. YOLOv11 addresses this issue by integrating multi-scale features from different layers through the FPN-PAN structure, thereby enhancing the model’s adaptability. However, the repeated up-sampling and down-sampling operations involved in the FPN-PAN structure can cause significant alterations in feature map resolution. This leads to the degradation of object localization accuracy and blurring of edge details, ultimately weakening the model’s capacity for extracting detailed feature representations. To overcome this limitation, the proposed DMN-YOLO model incorporates a multi-branch auxiliary feature pyramid network (MAFPN) [23], which enables more effective utilization of the original backbone features without excessive reliance on FPN-PAN-processed features. This improvement enhances the semantic richness of the final feature map and increases the model’s ability to detect multi-scale targets.
In the context of identifying diseases in apple foliage, the Superficial Assisted Fusion (SAF) module effectively captures the spatial characteristics of diseased regions and enhances the model’s attention to local features, particularly in the presence of complex lesions such as rust. The configuration of SAF is diagrammed in Figure 5. This module primarily improves feature fusion by leveraging a spatial attention mechanism, thereby strengthening the network’s ability to distinguish fine-grained lesion details. The output result of applying the SAF module is defined in Equation (1):
H = c o n c a t ( δ C D H n 1 , H n , U ( H n + 1 ) )
where H n 1 ,   H n , and H n + 1 R h × w × c represent feature maps at different resolutions, H n ,   H n , and H n represent the feature layers of the backbone and the two paths of MAFPN, δ represents the SiLU (Sigmoid Linear Unit) activation function, D ( . ) represents the down-sampling using a 3 × 3 convolution, U ( . ) represents the up-sampling operation, and C represents the 1 × 1 convolution, which serves to align the number of channels to ensure that the channel dimensions match when different scale features are fused.
In apple leaf disease detection, lesion characteristics such as color and texture are often distributed across different feature channels. To better integrate this diverse information, the MAFPN incorporates an Advanced Auxiliary Fusion (AAF) module, deeply embedded within the neck network at a deeper layer.
As illustrated in Figure 6, the AAF module aggregates information from four sources: the latent high-resolution shallow layer H n + 1 , the latent low-resolution shallow layer H n 1 , the sibling shallow layer H n , and the preceding layer H n 1 . By fusing features from these four layers, the AAF module enhances the network’s ability to detect medium-scale targets. In addition, the AAF module applies a 1 × 1 convolution to regulate the contribution of each input layer to the final output, thereby maintaining a balanced integration of multi-scale information. The output of the AAF module is expressed in Equation (2):
H n = c o n c a t ( δ C D H n 1 , δ C D H n 1 H n , C ( U ( H n + 1 ) ) )

2.6. RT-DETR Detector Head Structure

In apple leaf disease detection, the lesions are typically small and exhibit various shapes, which poses a challenge for accurate detection. YOLOv11, as one of the advanced target detection models, adopts an anchor-free design to enhance both the detection speed and accuracy. However, despite these improvements, the model’s detection accuracy remains limited, especially in scenarios involving small objects, cluttered backgrounds, and occlusions. To tackle such challenges, the detection head in this work is based on an RT-DETR model augmented with a probe. Results from the experiments indicate that this approach significantly enhances performance, especially in detecting small lesions in apple leaf disease detection.
The RT-DETR (Real-Time Detection Transformer) [24,25] model employs an efficient hybrid encoder for feature extraction. Initially, the model utilizes the Attention-based Internal Feature Interaction (AIFI) to enhance the representation of lesions at various scales. It then integrates multi-level features using the Cross-Scale Feature Fusion Module (CCFM), which helps mitigate the loss of information from small targets. To further improve performance, the model employs a Minimum Uncertainty Query Selection mechanism that identifies high-confidence query points, reducing the influence of low-quality candidate boxes. Finally, the decoder and detection head are based on the Transformer architecture, enabling end-to-end target parsing without requiring non-maximum suppression (NMS) post-processing. This approach not only accelerates inference but also reduces the number of redundant detection boxes. The RT-DETR detection head structure is illustrated in Figure 7.

2.7. Small Target Lesion Detection Based on NWD Loss Function

As depicted in Figure 8, example illustrations of Intersection over Union (IoU) are used to demonstrate its sensitivity when applied to tiny versus normal-sized lesions. The figure shows how small shifts in predicted bounding boxes can lead to large fluctuations in IoU values, particularly for small objects, thereby highlighting the instability of IoU-based loss functions in such contexts. Traditional Intersection over Union (IoU) presents several challenges in detecting small objects: (a) When the predicted and ground-truth boxes do not overlap, IoU fails to provide meaningful gradients, hindering the network’s ability to optimize small objects effectively. (b) Small deviations in predictions can lead to significant fluctuations in IoU, causing instability in the optimization process. This issue is particularly pronounced in lesion detection tasks, where even slight shifts in the bounding box can result in large changes in the loss function. (c) Furthermore, these small prediction errors exacerbate the instability of IoU, making it difficult to achieve accurate optimization for small objects, such as lesions, where only minor pixel shifts can cause substantial loss variation.
To overcome the issues mentioned above, this study introduces the normalized Wasserstein distance (NWD) loss function [26,27], which provides a robust alternative to traditional IoU-based loss functions, especially for small or overlapping objects. Instead of relying solely on spatial overlap, NWD models the predicted and ground-truth bounding boxes as two-dimensional Gaussian distributions, enabling a more informative similarity measurement that considers both location and scale.
Let a horizontal bounding box be defined as R = (cx, cy, w, h), where (cx, cy) are the center coordinates, and w, h are the width and height, respectively. The bounding box follows a two-dimensional Gaussian distribution, as depicted in Equation (3):
N = N ( m , Σ )
The mean vector m signifies the center of the bounding box, as shown in Equation (4):
m = c x c y
The covariance matrix Σ, assuming independence between the x and y directions, is defined as shown in Equation (5):
Σ = ( w 2 ) 2 0 0 ( h 2 ) 2
The predicted box P and the real box G are represented as two-dimensional Gaussian distributions, as formulated in Equations (6) and (7), respectively:
N p m p , Σ p = c x p c y p , ( w p 2 ) 2 0 0 ( h p 2 ) 2
N g m g , Σ g = c x g c y g , ( w g 2 ) 2 0 0 ( h g 2 ) 2
The second-order Wasserstein distance ( W 2 2 ) quantifies the difference between two probability distributions and is computed as shown in Equation (8):
W 2 2 N p , N g = m p m g 2 2 + Σ p 1 2 Σ g 1 2 F 2 = c x p c x g 2 + c y p c y g 2 + w p w g 2 4 + h p h g 2 4  
This distance captures both the center discrepancy and size differences between the predicted and ground-truth boxes. To ensure numerical stability and scale invariance, the distance is normalized using a constant C, which is set based on empirical image resolution considerations. The final normalized Wasserstein distance is redefined as shown in Equation (9):
N W D N p , N g = e x p W 2 2 N p , N g C
Finally, the loss function based on NWD is expressed as Equation (10):
L N W D = 1 N W D N p , N g = 1 e x p c x p c x g 2 + c y p c y g 2 + w p w g 2 4 + h p h g 2 4 C
This formulation smooths the gradient and avoids discontinuities when there is no overlap between boxes (unlike IoU). It is particularly robust for tiny objects, where minor coordinate deviations can lead to large IoU errors but only modest Wasserstein differences.

3. Results

3.1. Experimental Environment

The system used for the experiments was equipped with Windows 10 Professional Edition, an Intel® Xeon® W-2223 processor (3.60 GHz), and an NVIDIA RTX 4060Ti (16 GB) GPU, providing ample computational capacity for deep learning applications. Table 2 outlines the experimental configuration designed to ensure stable convergence and efficient resource utilization.

3.2. Evaluation Index

The evaluation of the model’s performance in this study is done quantitatively using important metrics such as precision, recall, mean average precision at IoU threshold 0.5 (mAP@50), the F1-score, and FPS. The evaluation metrics are defined in Equations (11)–(15):
P r e c i s i o n = T r u e   P o s i t i v e T r u e   p o s i t i v e + F a l s e   P o s i t i v e
R e c a l l = T r u e   P o s i t i v e T r u e   p o s i t i v e + F a l s e   N e g a t i v e
A P = 0 1 P e r c i s i o n ( R e c a l l ) d ( R e c a l l )
m A P @ 50 = 1 N i N A P i
F P S = 1 P r o c e s s i n g   t i m e   p e r   f r a m e

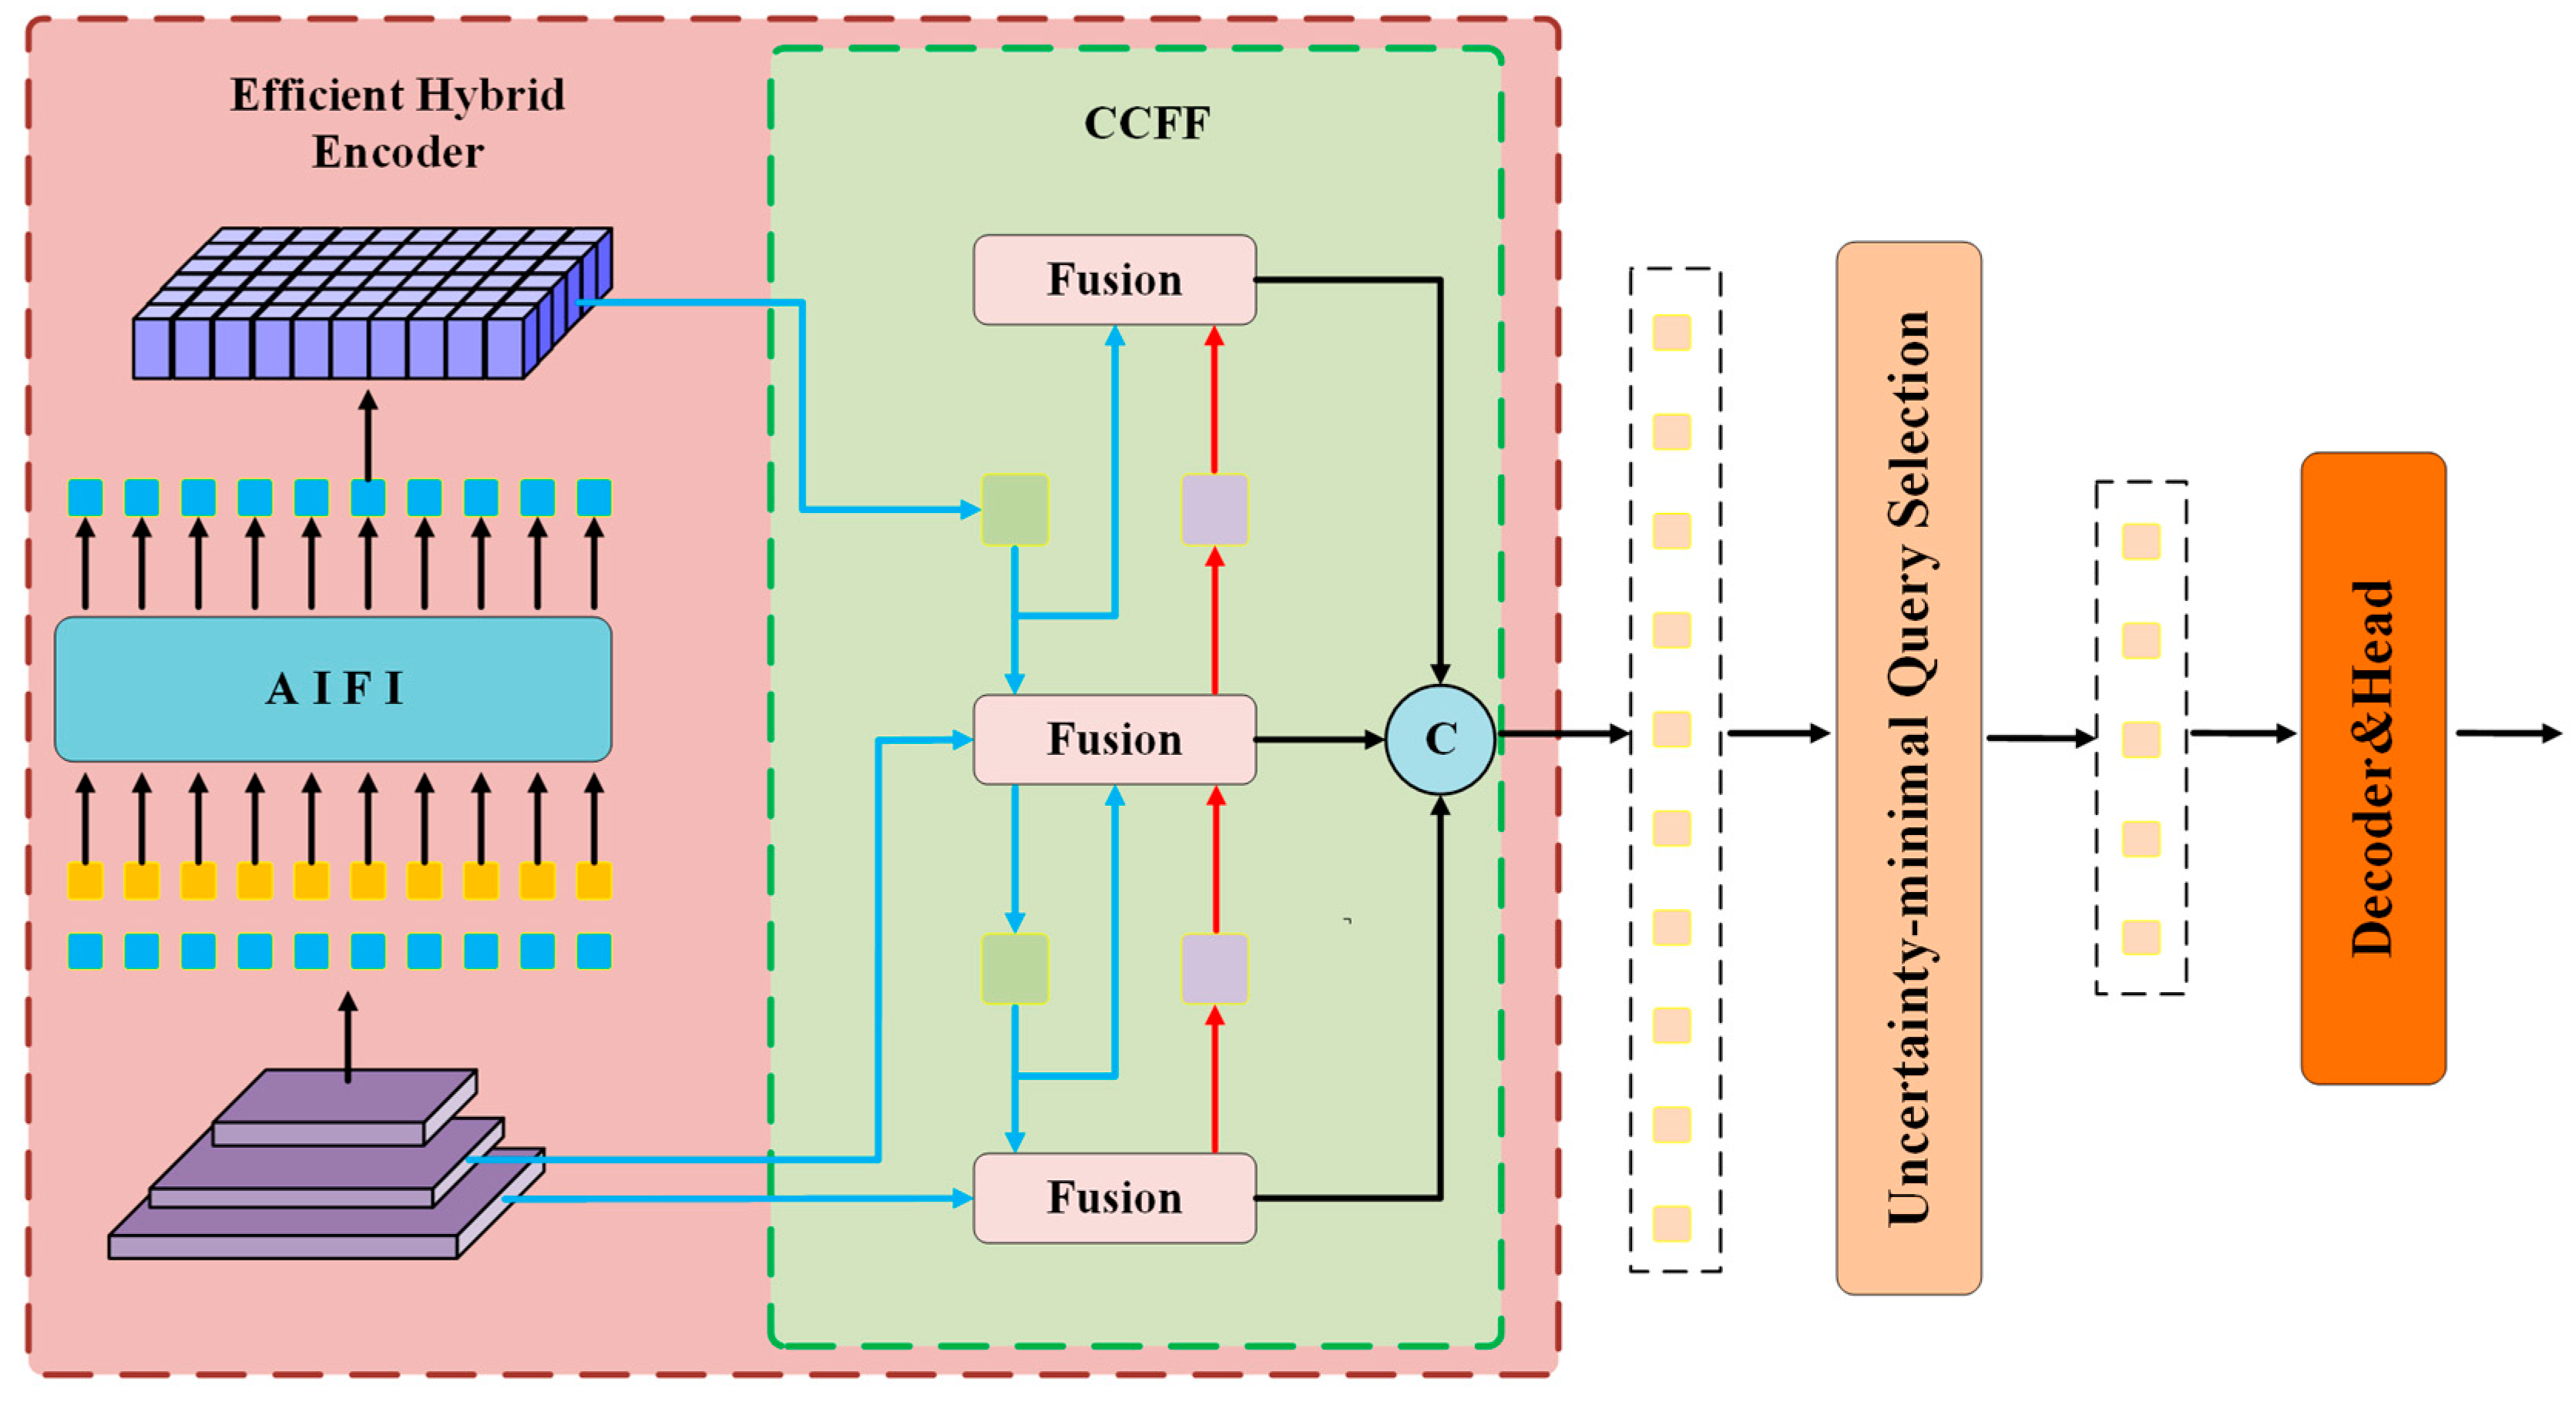
3.3. DMN-YOLO Model Performance

The detection performance metrics of the DMN-YOLO model for various disease categories are shown in Table 3. The results indicate that DMN-YOLO demonstrates robust recognition capabilities and performs effectively in diverse apple leaf disease detection tasks. Specifically, for brown spot disease, the model achieved a precision of 86.7%, a recall of 86.5%, and a mAP@50 of 98.9%. In the case of frogeye leaf spot, the precision reached 88.3%, the recall was 94.2%, and mAP@50 attained 97.9%. These experimental findings confirm that DMN-YOLO provides high detection accuracy across multiple disease types, underscoring its potential for precise identification and monitoring in agricultural disease management applications.
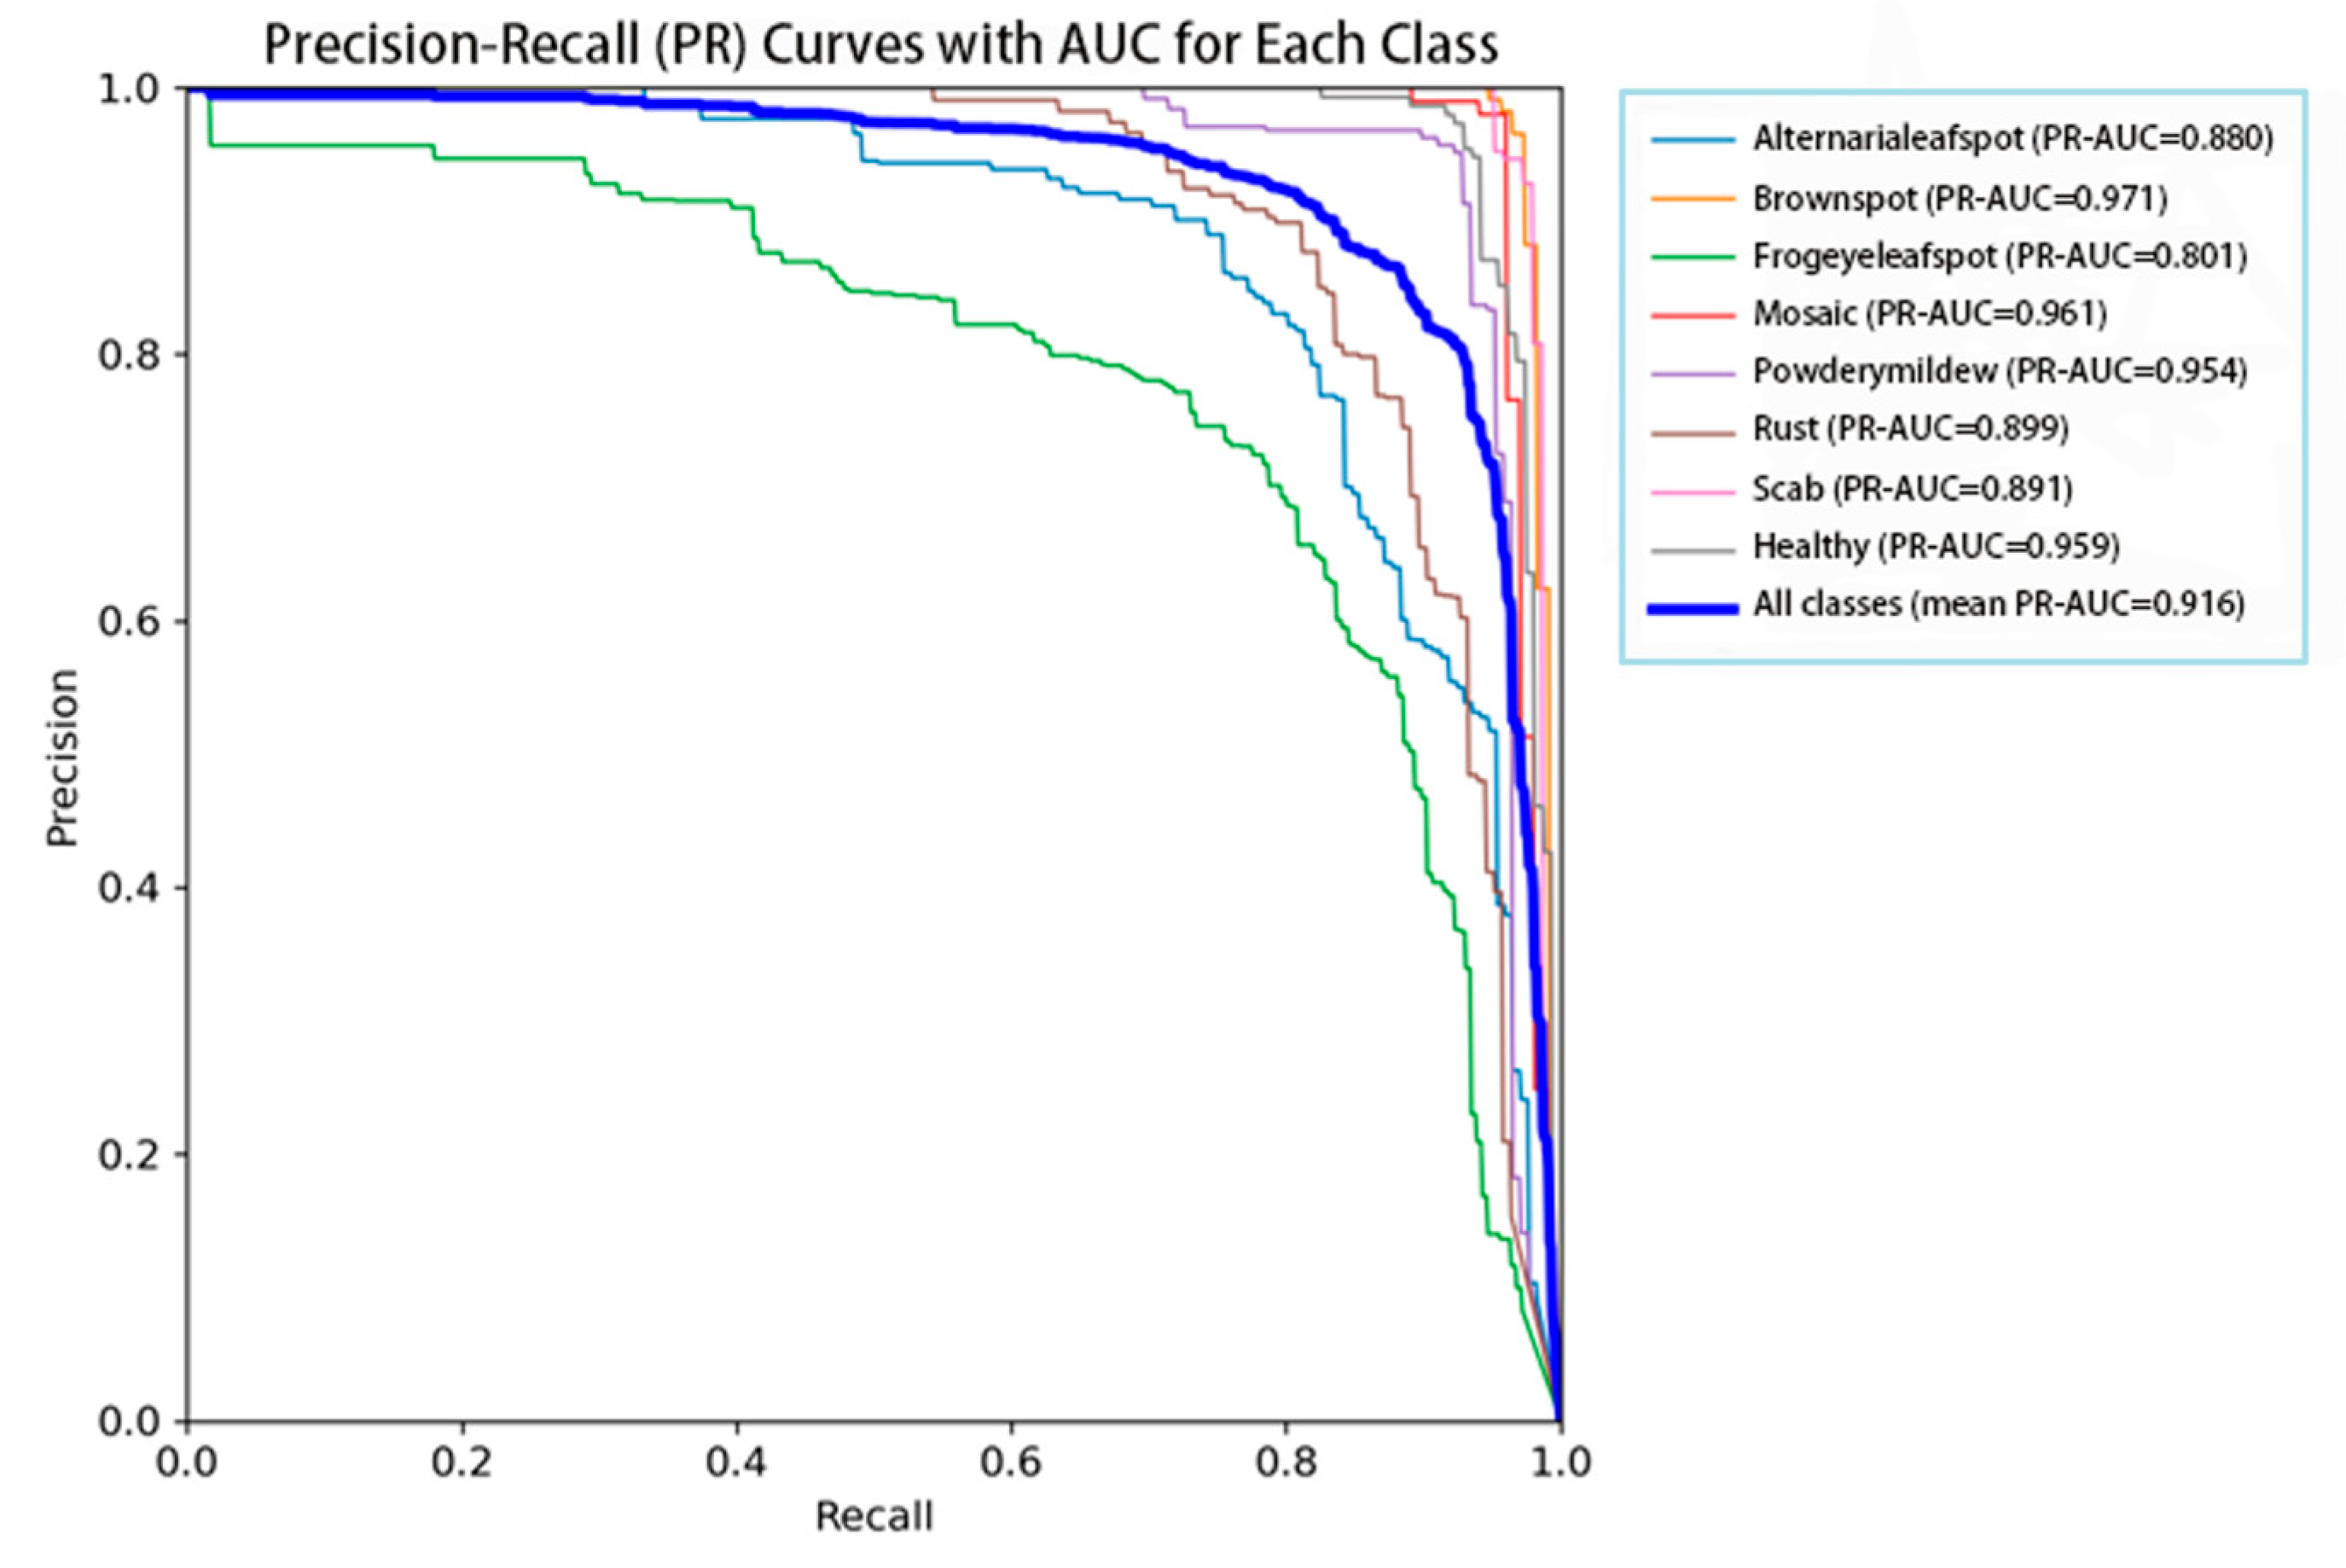
To assess the classification performance of the proposed model, the area under the precision–recall curve (PR-AUC) was calculated for seven apple leaf disease categories and healthy leaves. As shown in Figure 9, the average PR-AUC reached 91.6%, indicating that the model achieves a good balance between precision and recall across all classes. The highest PR-AUC values were obtained for brown spot (97.1%) and mosaic (96.1%), suggesting that these categories have more distinctive visual features or a higher representation in the training dataset. In contrast, the lowest PR-AUC was recorded for frogeye leaf spot (80.1%), which may be attributed to inter-class similarity or class imbalance. For the healthy class, the PR-AUC reached 95.9%, demonstrating the model’s effectiveness in distinguishing between healthy and diseased leaves—an essential requirement for practical agricultural applications. Overall, the results demonstrate that the proposed DMN-YOLO model achieves robust and reliable performance in multi-class apple leaf disease recognition.
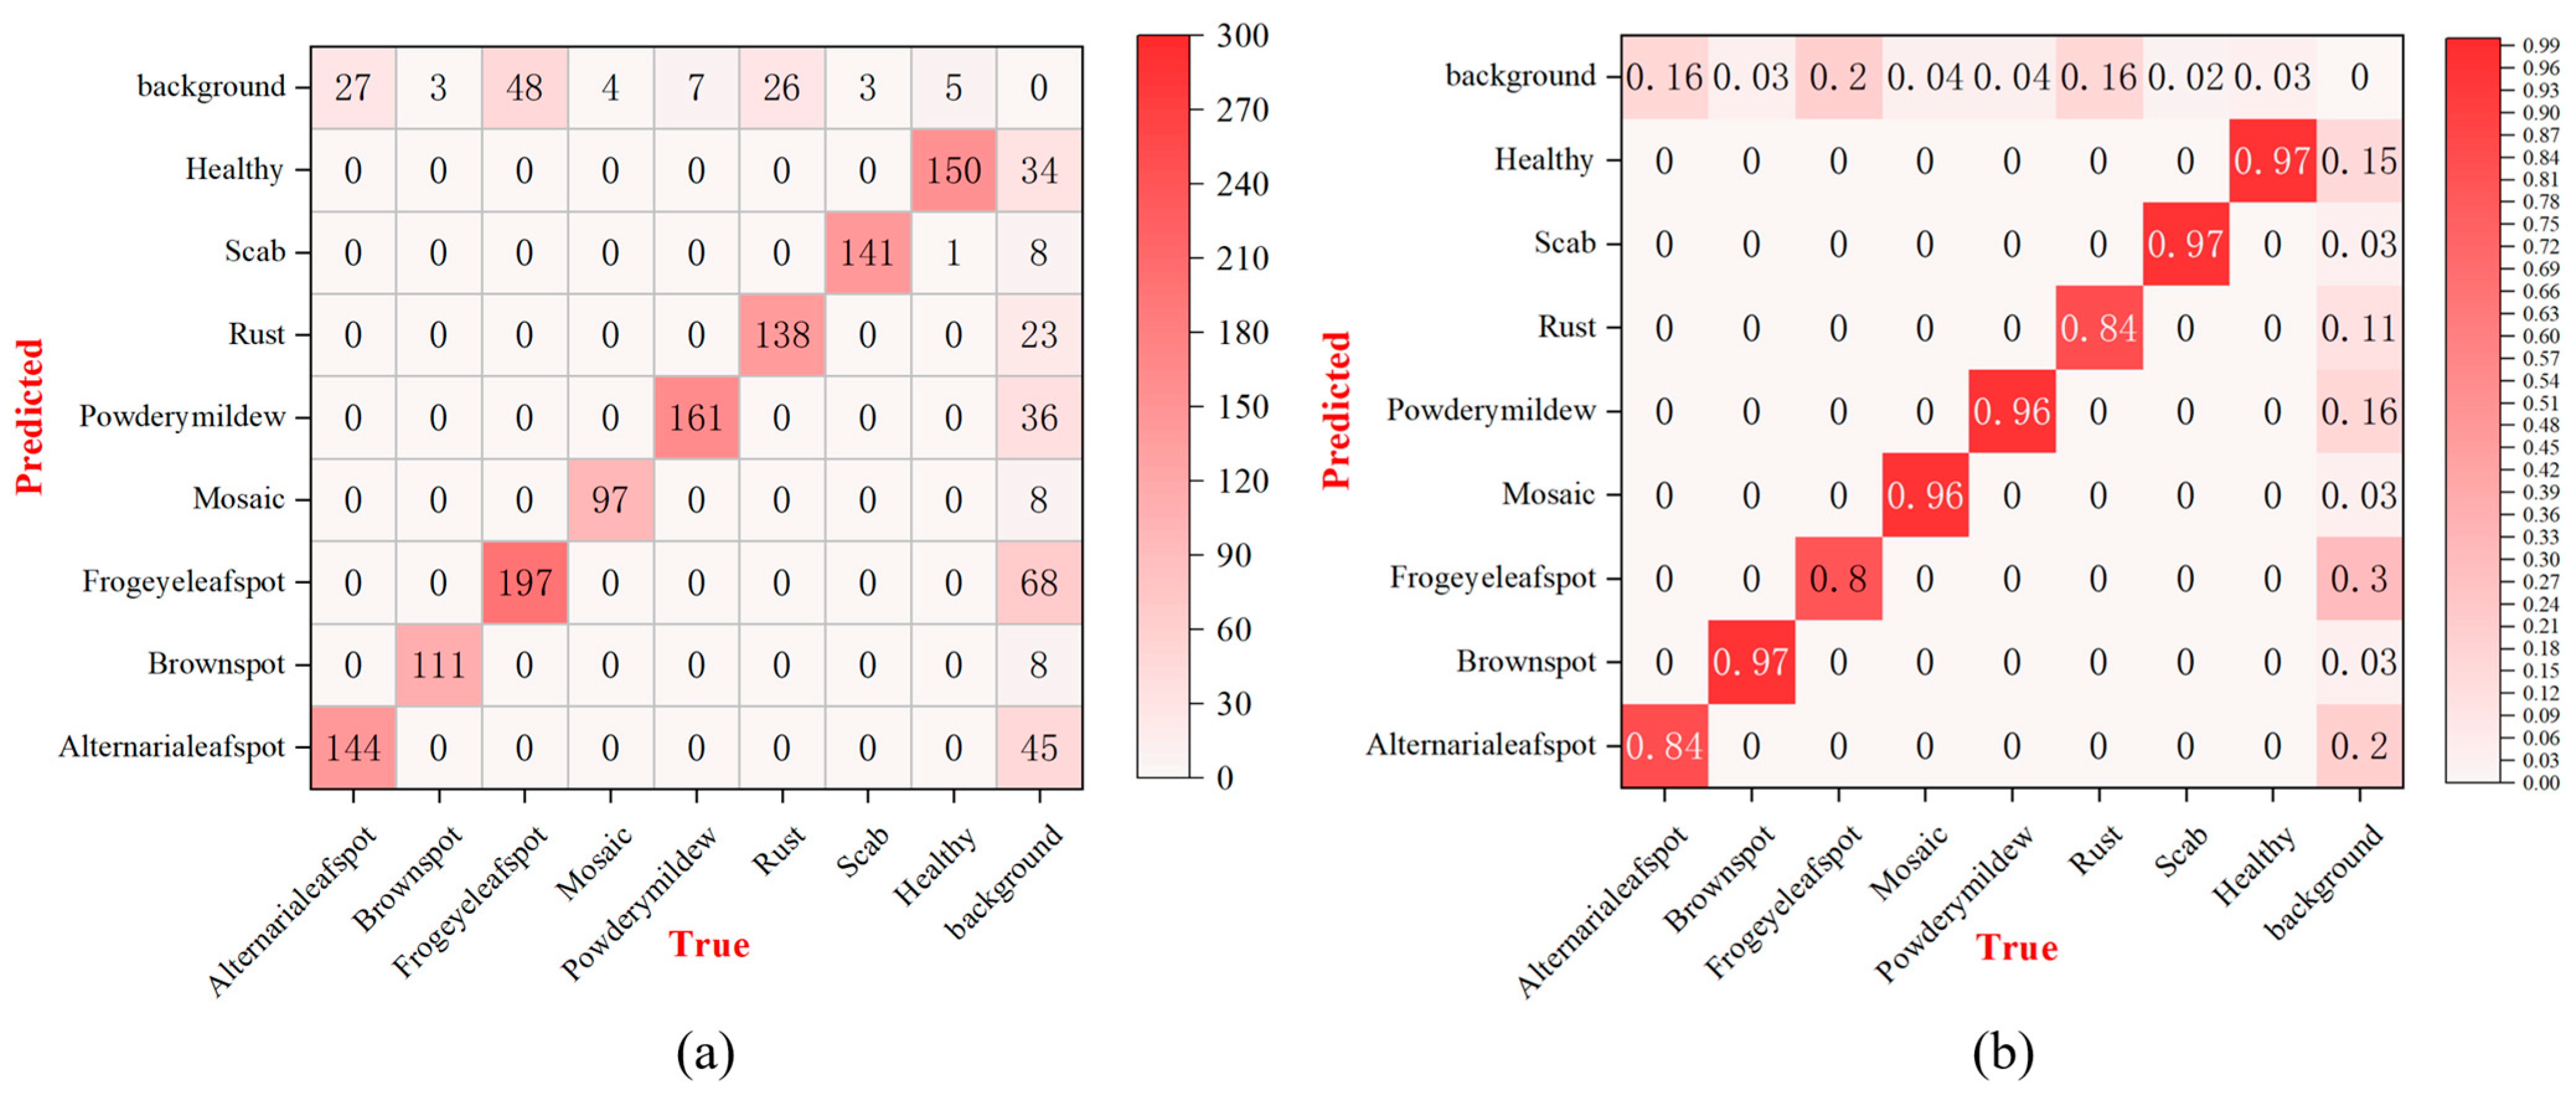
Figure 10 presents the confusion matrix analysis results for the proposed DMN-YOLO model in the task of apple leaf disease classification. Figure 10a, which displays the absolute prediction counts, shows that the model achieves excellent classification performance for disease types such as powdery mildew (161 correct predictions), scab (141), and frogeye leaf spot (197), demonstrating its strong capability in accurately distinguishing these categories. However, some misclassifications are observed in categories like Alternaria leaf spot and healthy leaves, where samples are occasionally confused with the background or other diseases due to visual similarities and complex image backgrounds. Figure 10b, the normalized confusion matrix, further emphasizes the model’s high detection accuracy across most categories, with powdery mildew and scab achieving 96.0% and 97.0% accuracy, respectively, and brown spot reaching 97.0%. Although the recall rate for Alternaria leaf spot is slightly lower at 84.0%, the model still exhibits robust overall performance. These results confirm the effectiveness and reliability of the DMN-YOLO model, highlighting its potential for accurate and practical apple leaf disease identification in intelligent agricultural systems.

3.4. Ablation Experiment

An ablation study was conducted to assess the individual contribution of each proposed module to the overall detection performance. 
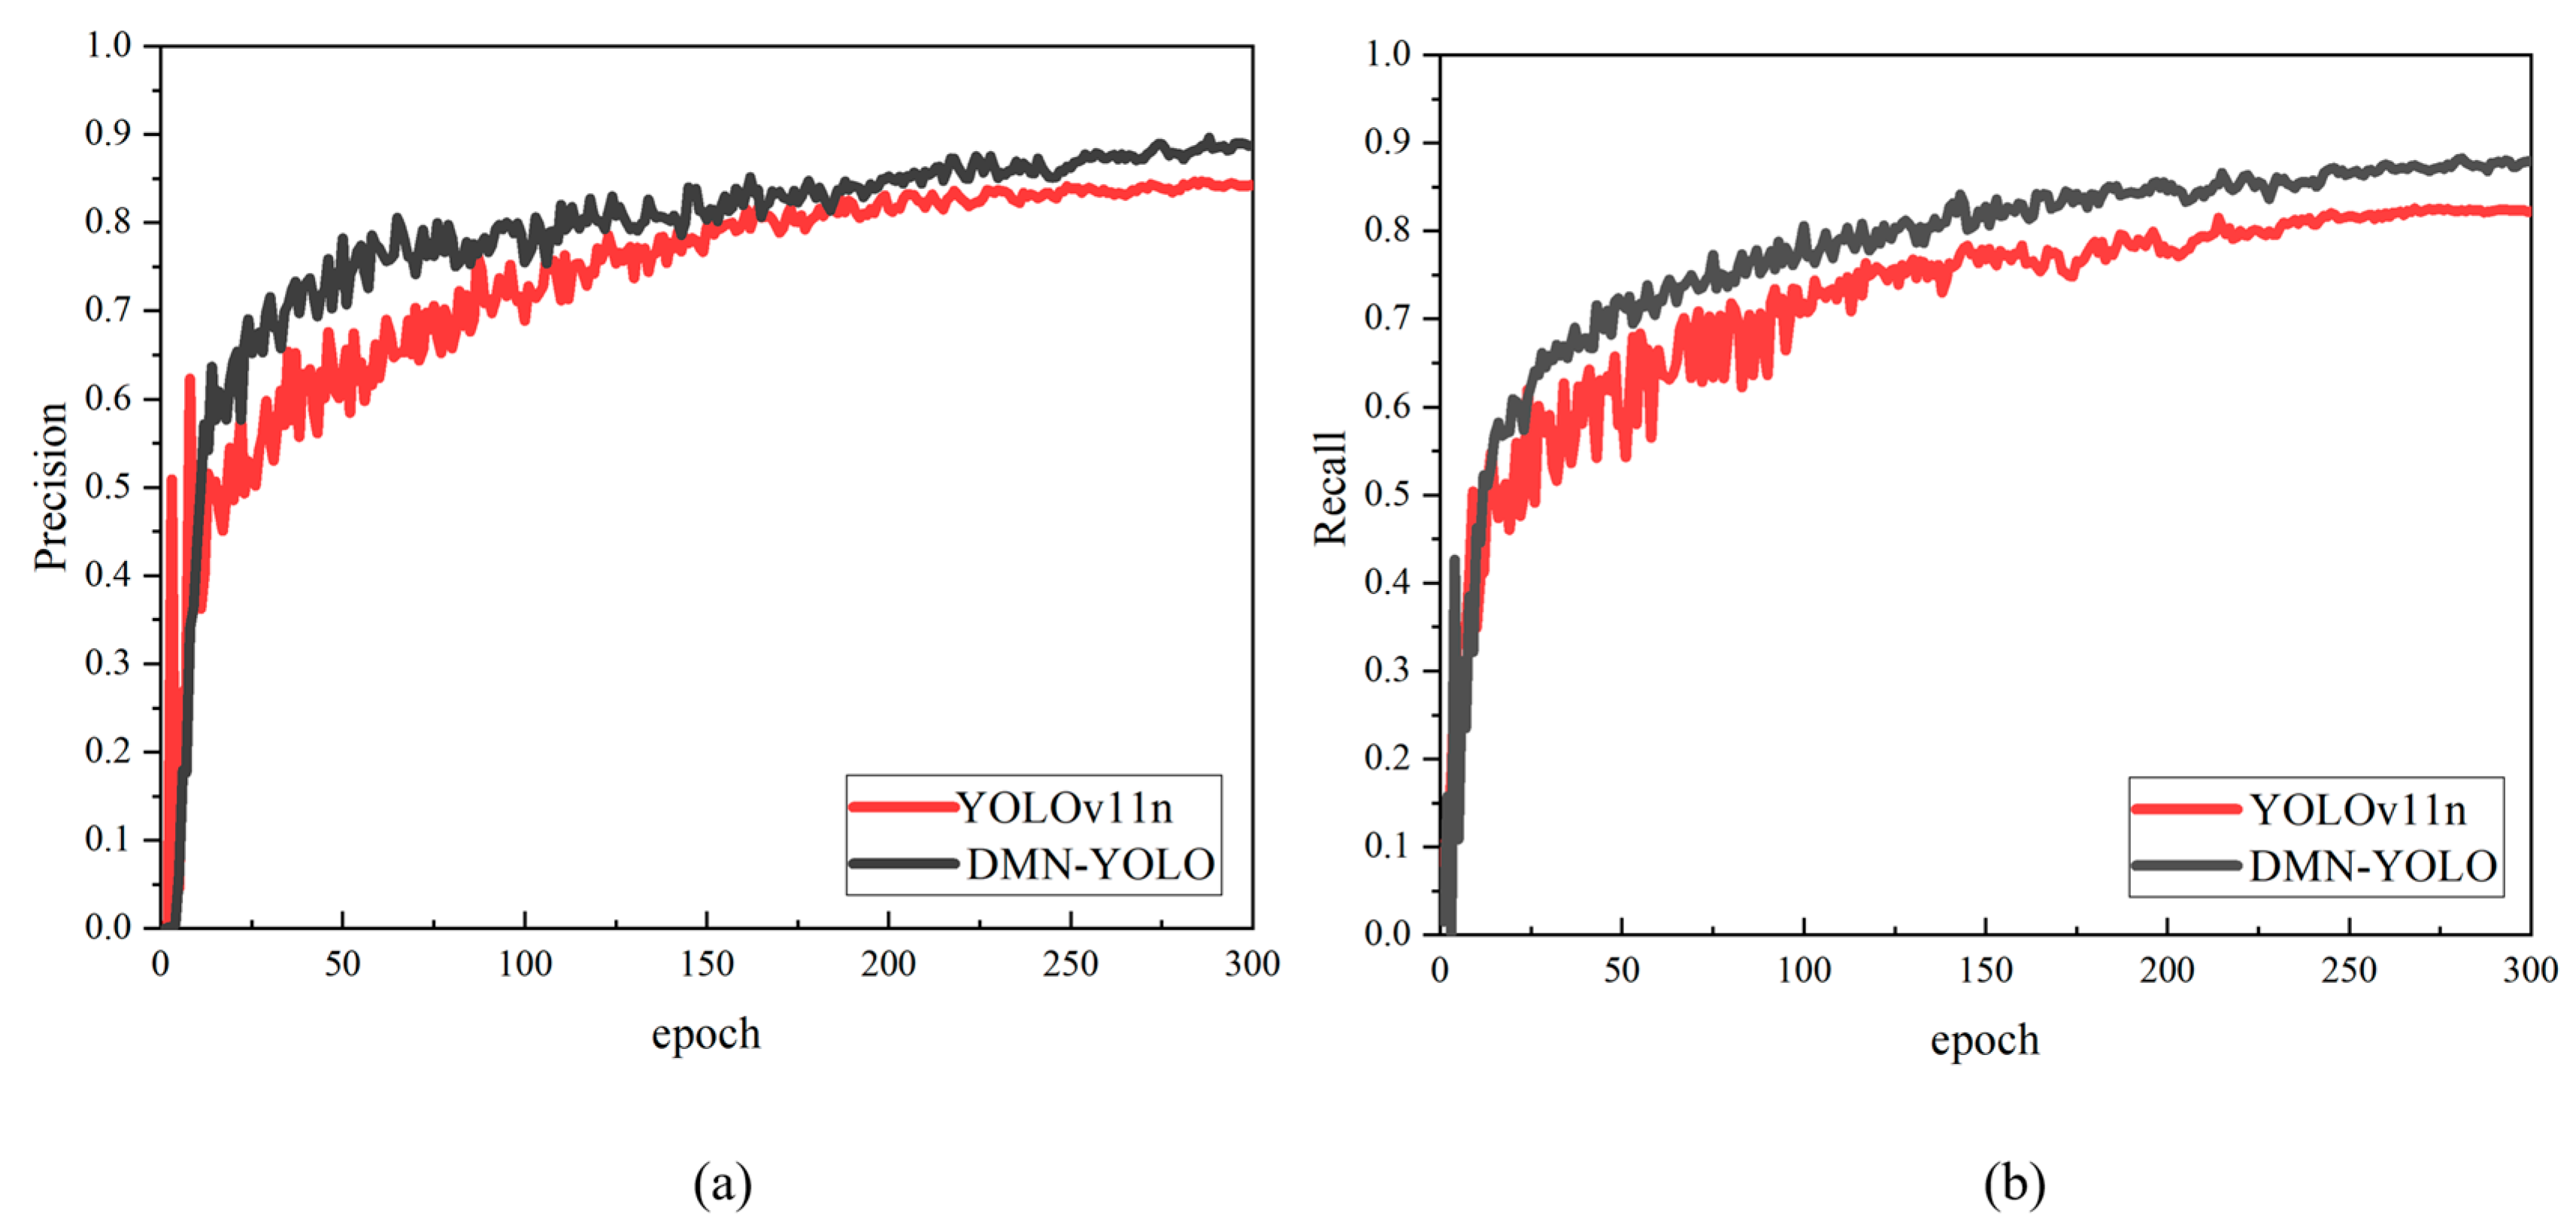
Table 4 illustrates that integrating the MAFPN module into the baseline model resulted in a 2.1% increase in precision, a 1.6% increase in recall, a 3.4% improvement in mAP@50, and a 1.8% gain in the F1-score. These results demonstrate that MAFPN effectively enhances multi-scale feature aggregation and significantly improves the model’s capability to recognize targets of varying scales. Following the integration of the RepHDWConv module in the neck structure, precision experienced a slight decline of 0.2%; however, recall and the F1-score increased by 2.1% and 1.0%, respectively. This indicates that while maintaining lightweight architecture, the module enhances local feature extraction and provides a stronger representation of object boundaries and texture details. Substituting the original detection head with the RT-DETR detection head (DetrHead) from the RT-DETR framework resulted in precision of 86.9%, a mAP@50 of 91.8%, and an F1-score of 86.6%. These improvements highlight the module’s superior capacity for modeling global contextual relationships and enhancing localization accuracy, particularly in complex scenes. Additionally, replacing the conventional bounding box regression loss with the normalized Wasserstein distance (NWD) loss function yielded increases of 3.5%, 2.1%, and 3.0% in precision, recall, and F1-score, respectively. This modification notably enhances the model’s ability to detect small and densely distributed objects. Overall, the optimized DMN-YOLO model achieved precision, recall, mAP@50, and F1-score values of 88.8%, 87.9%, 93.2%, and 88.1%, respectively. Compared to the YOLOv11n model, this represents improvements of 5.5% in precision, 3.4% in recall, 5.0% in mAP@50, and 4.2% in the F1-score. These ablation results comprehensively validate the effectiveness and superiority of the proposed enhancements. As illustrated in Figure 11, a comparison of the precision–recall curves between the DMN-YOLO and YOLOv11n models further confirms the former’s strong performance in apple leaf disease detection tasks.
Figure 12 presents the XGrad-CAM [28,29] visualization heatmaps of the model before and after the enhancements, providing an intuitive representation of the model’s attention to critical regions. Areas with higher heat intensity correspond to regions that the model identifies as important features. The YOLOv11n model exhibits a relatively diffuse attention distribution, which may result in inaccurate localization of diseased areas. In contrast, the improved DMN-YOLO model demonstrates a more concentrated and precise focus on pathological regions, thereby enhancing its capacity to detect various types of apple leaf diseases. These visual results, combined with quantitative performance improvements, further validate the enhanced model’s superior detection accuracy and demonstrate its effectiveness in practical agricultural disease monitoring applications.

3.5. Performance Comparison Using YOLOv11n with Different Feature Vector Pyramid Structures

To analyze the effect of different feature pyramid architectures on YOLOv11n’s detection capabilities, this research involved a sequence of comparative experimental evaluations by replacing its original neck structure with five alternative modules: MAFPN [30], AFPN [31], BiFPN [32], GDFPN [33], and HSFPN [34]. The resulting models were denoted as YOLOv11-M, YOLOv11-A, YOLOv11-B, YOLOv11-G, and YOLOv11-H, respectively. The results in Table 5 demonstrate that the YOLOv11-M model, which incorporates the proposed MAFPN, consistently outperforms the other variants across all evaluation metrics. Specifically, compared with YOLOv11-A, YOLOv11-M achieves improvements of 3.5% in precision, 2.0% in recall, 3.3% in mAP@50, and 2.7% in F1-score. Compared to YOLOv11-B, the improvements are even more pronounced, with gains of 10.3%, 4.8%, 6.3%, and 7.7%, respectively. Additionally, YOLOv11-M surpasses YOLOv11-H by 4.1% in precision, 4.0% in recall, 6.6% in mAP@50, and 4.1% in F1-score. Furthermore, YOLOv11-M exhibits superior detection capabilities when compared to YOLOv11-G. Overall, these findings indicate that the MAFPN module offers enhanced feature extraction and fusion capabilities, significantly improving the comprehensive performance of the YOLOv11n model in the challenging task of apple leaf disease detection.

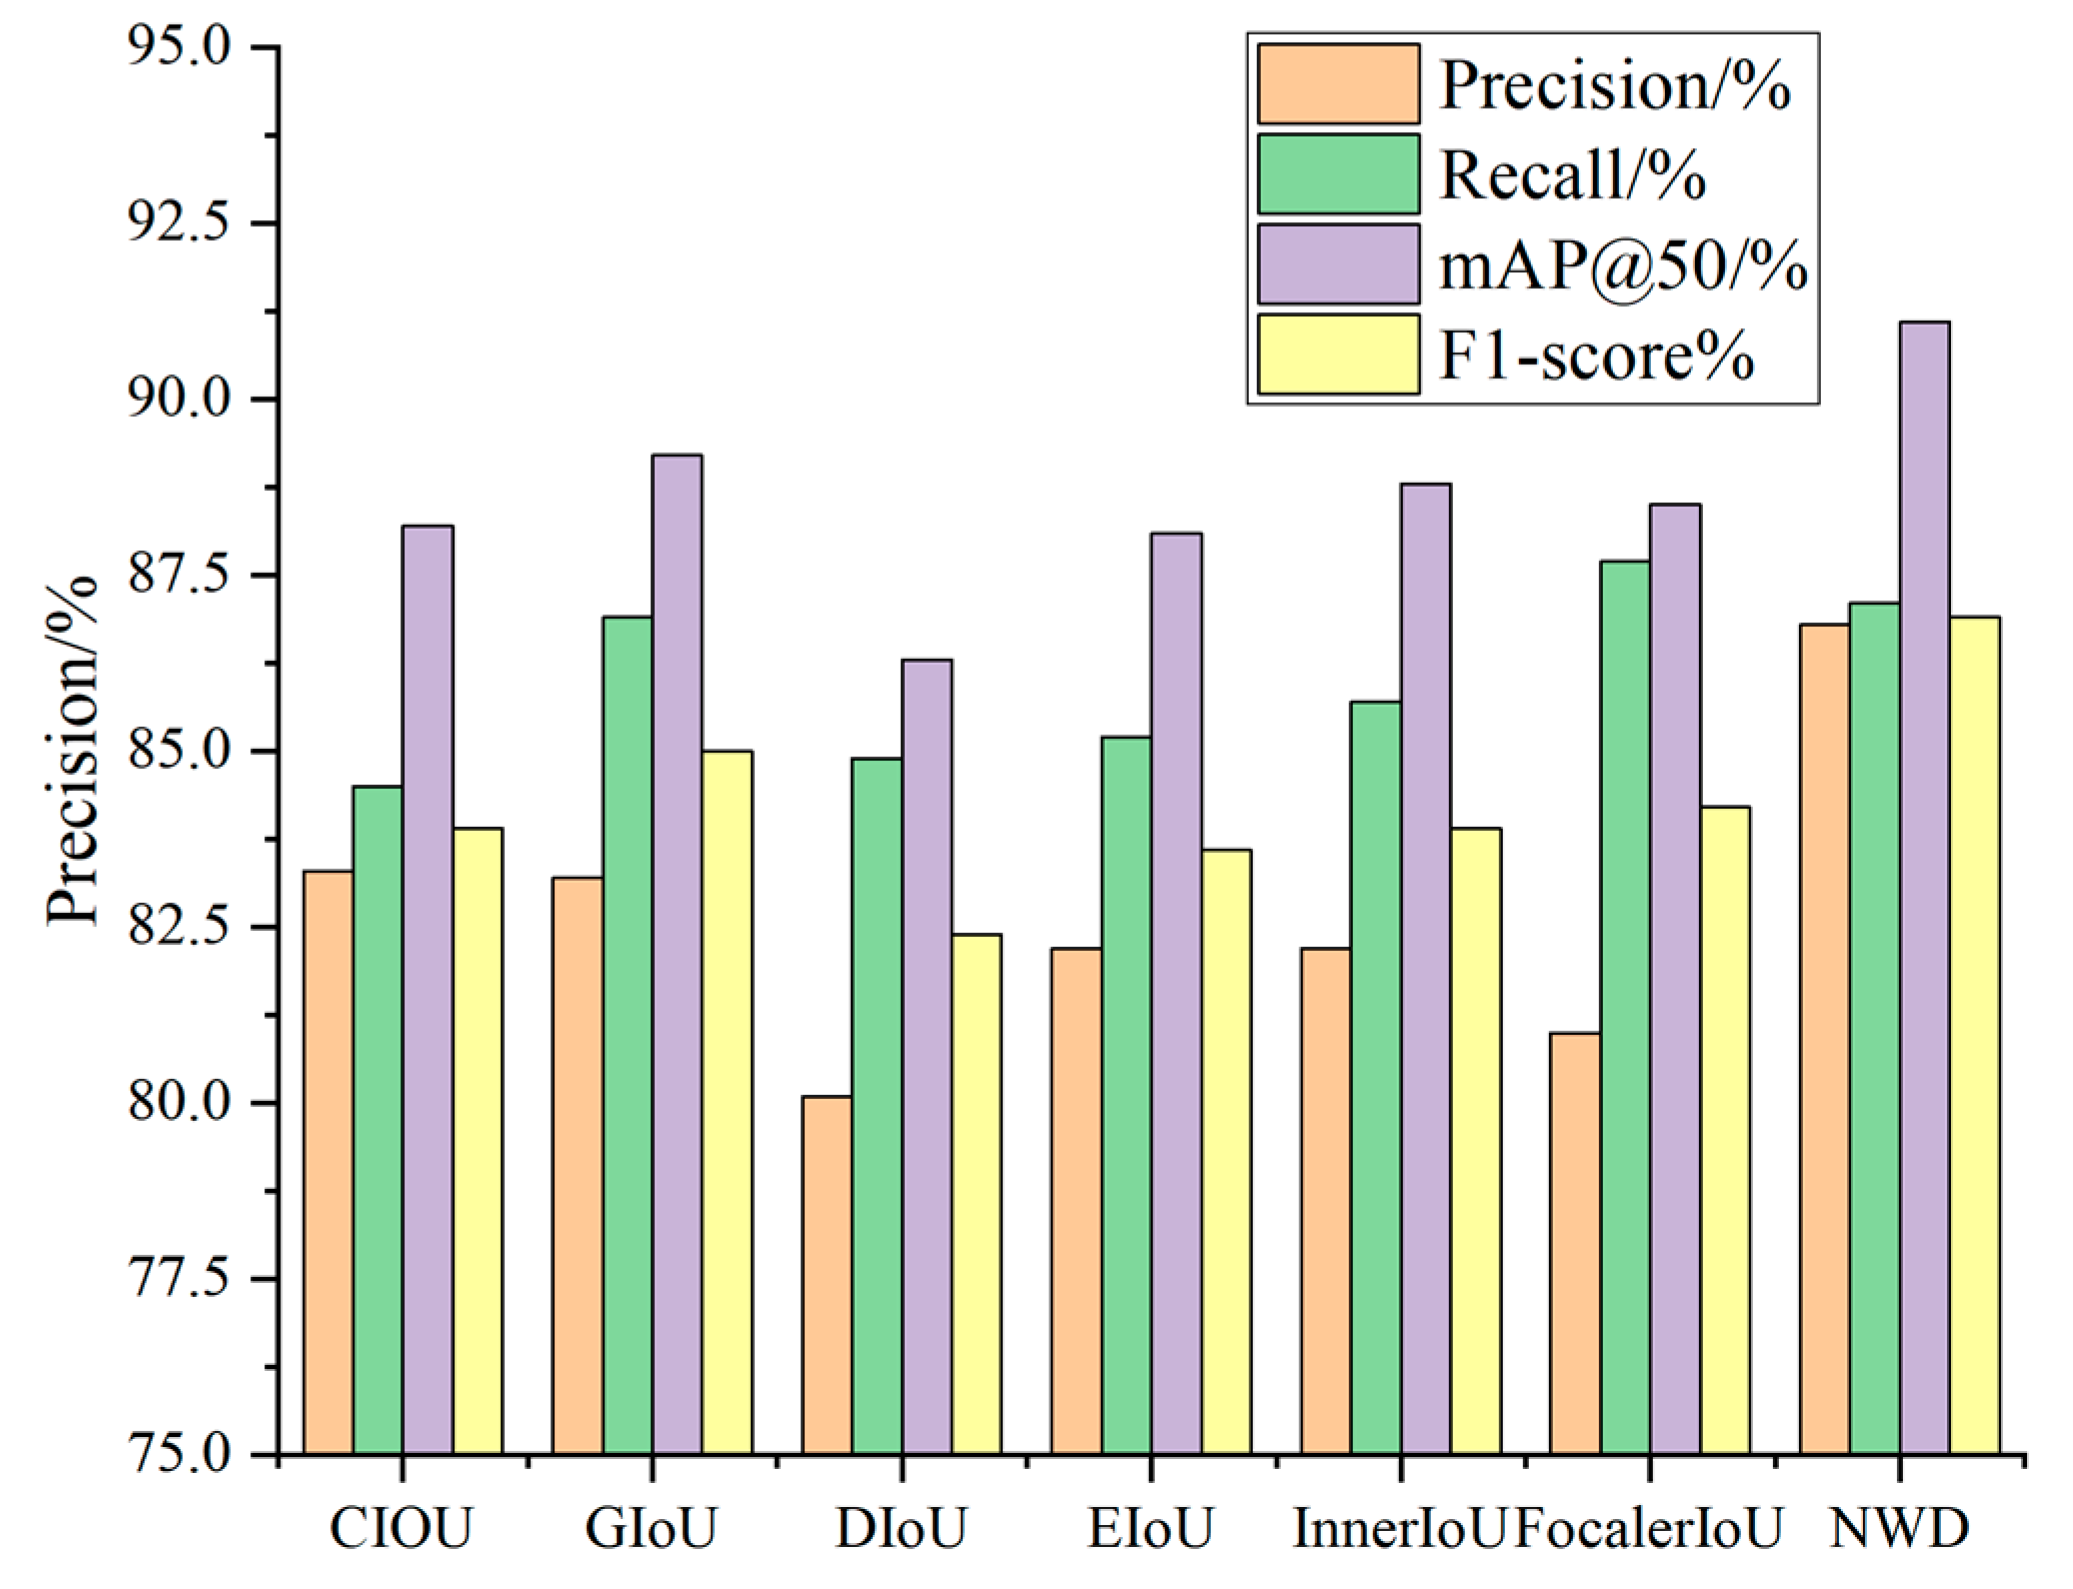
3.6. Comparison of YOLOv11n Models Using Different Loss Functions

To investigate the impact of various loss functions on the performance of the YOLOv11n model and identify the most effective one, this study replaces the original CIoU loss function in YOLOv11n with GIoU, DIoU, EIoU, InnerIoU, FocalerIoU, and NWD loss functions. Comparative experiments are conducted to evaluate their effects. Table 6 presents the detection results for each loss function, while Figure 12 provides a visual comparison of how different loss functions influence model performance.
As demonstrated in Table 6, a comparison of the performance of various loss functions reveals that the NWD loss function significantly outperforms other widely used loss functions across multiple key metrics. Specifically, in comparison with the original CIoU loss function, NWD enhances precision by 3.5%, recall by 2.6%, mAP@50 by 2.9%, and the F1-score by 3.0%. When compared to the GIoU loss function, NWD achieves a 3.6% improvement in precision. In comparison with the DIoU loss function, NWD improves precision by 6.7% and mAP@50 by 4.8%. Furthermore, when compared to the EIoU loss function, NWD yields a 4.6% increase in precision and a 3.3% improvement in the F1-score. Similar to the InnerIoU loss function, NWD results in a 4.6% improvement in precision and a 3.0% increase in the F1-score. Although NWD slightly lags behind FocalerIoU in recall, it surpasses FocalerIoU by 5.8% in precision. As shown in Figure 13, the NWD loss function achieves a good balance between precision and recall while also improving detection accuracy, mAP@50, and the F1-score, confirming its outstanding results in apple leaf disease detection.

3.7. Comparative Experiments on Different Models

This study conducted a comprehensive comparison between DMN-YOLO and several mainstream object detection models, including YOLOv12n [35], RT-DETR [36], YOLOv10n [37], YOLOv9s [38], YOLOv9t [39], YOLOv8n [40], and YOLOv5n [41]. The comparison was based on multiple performance metrics, including precision, recall, mAP@50 (mean average precision at IoU 0.5), the F1-score, and FPS (frames per second, indicating inference speed), as summarized in Table 7.
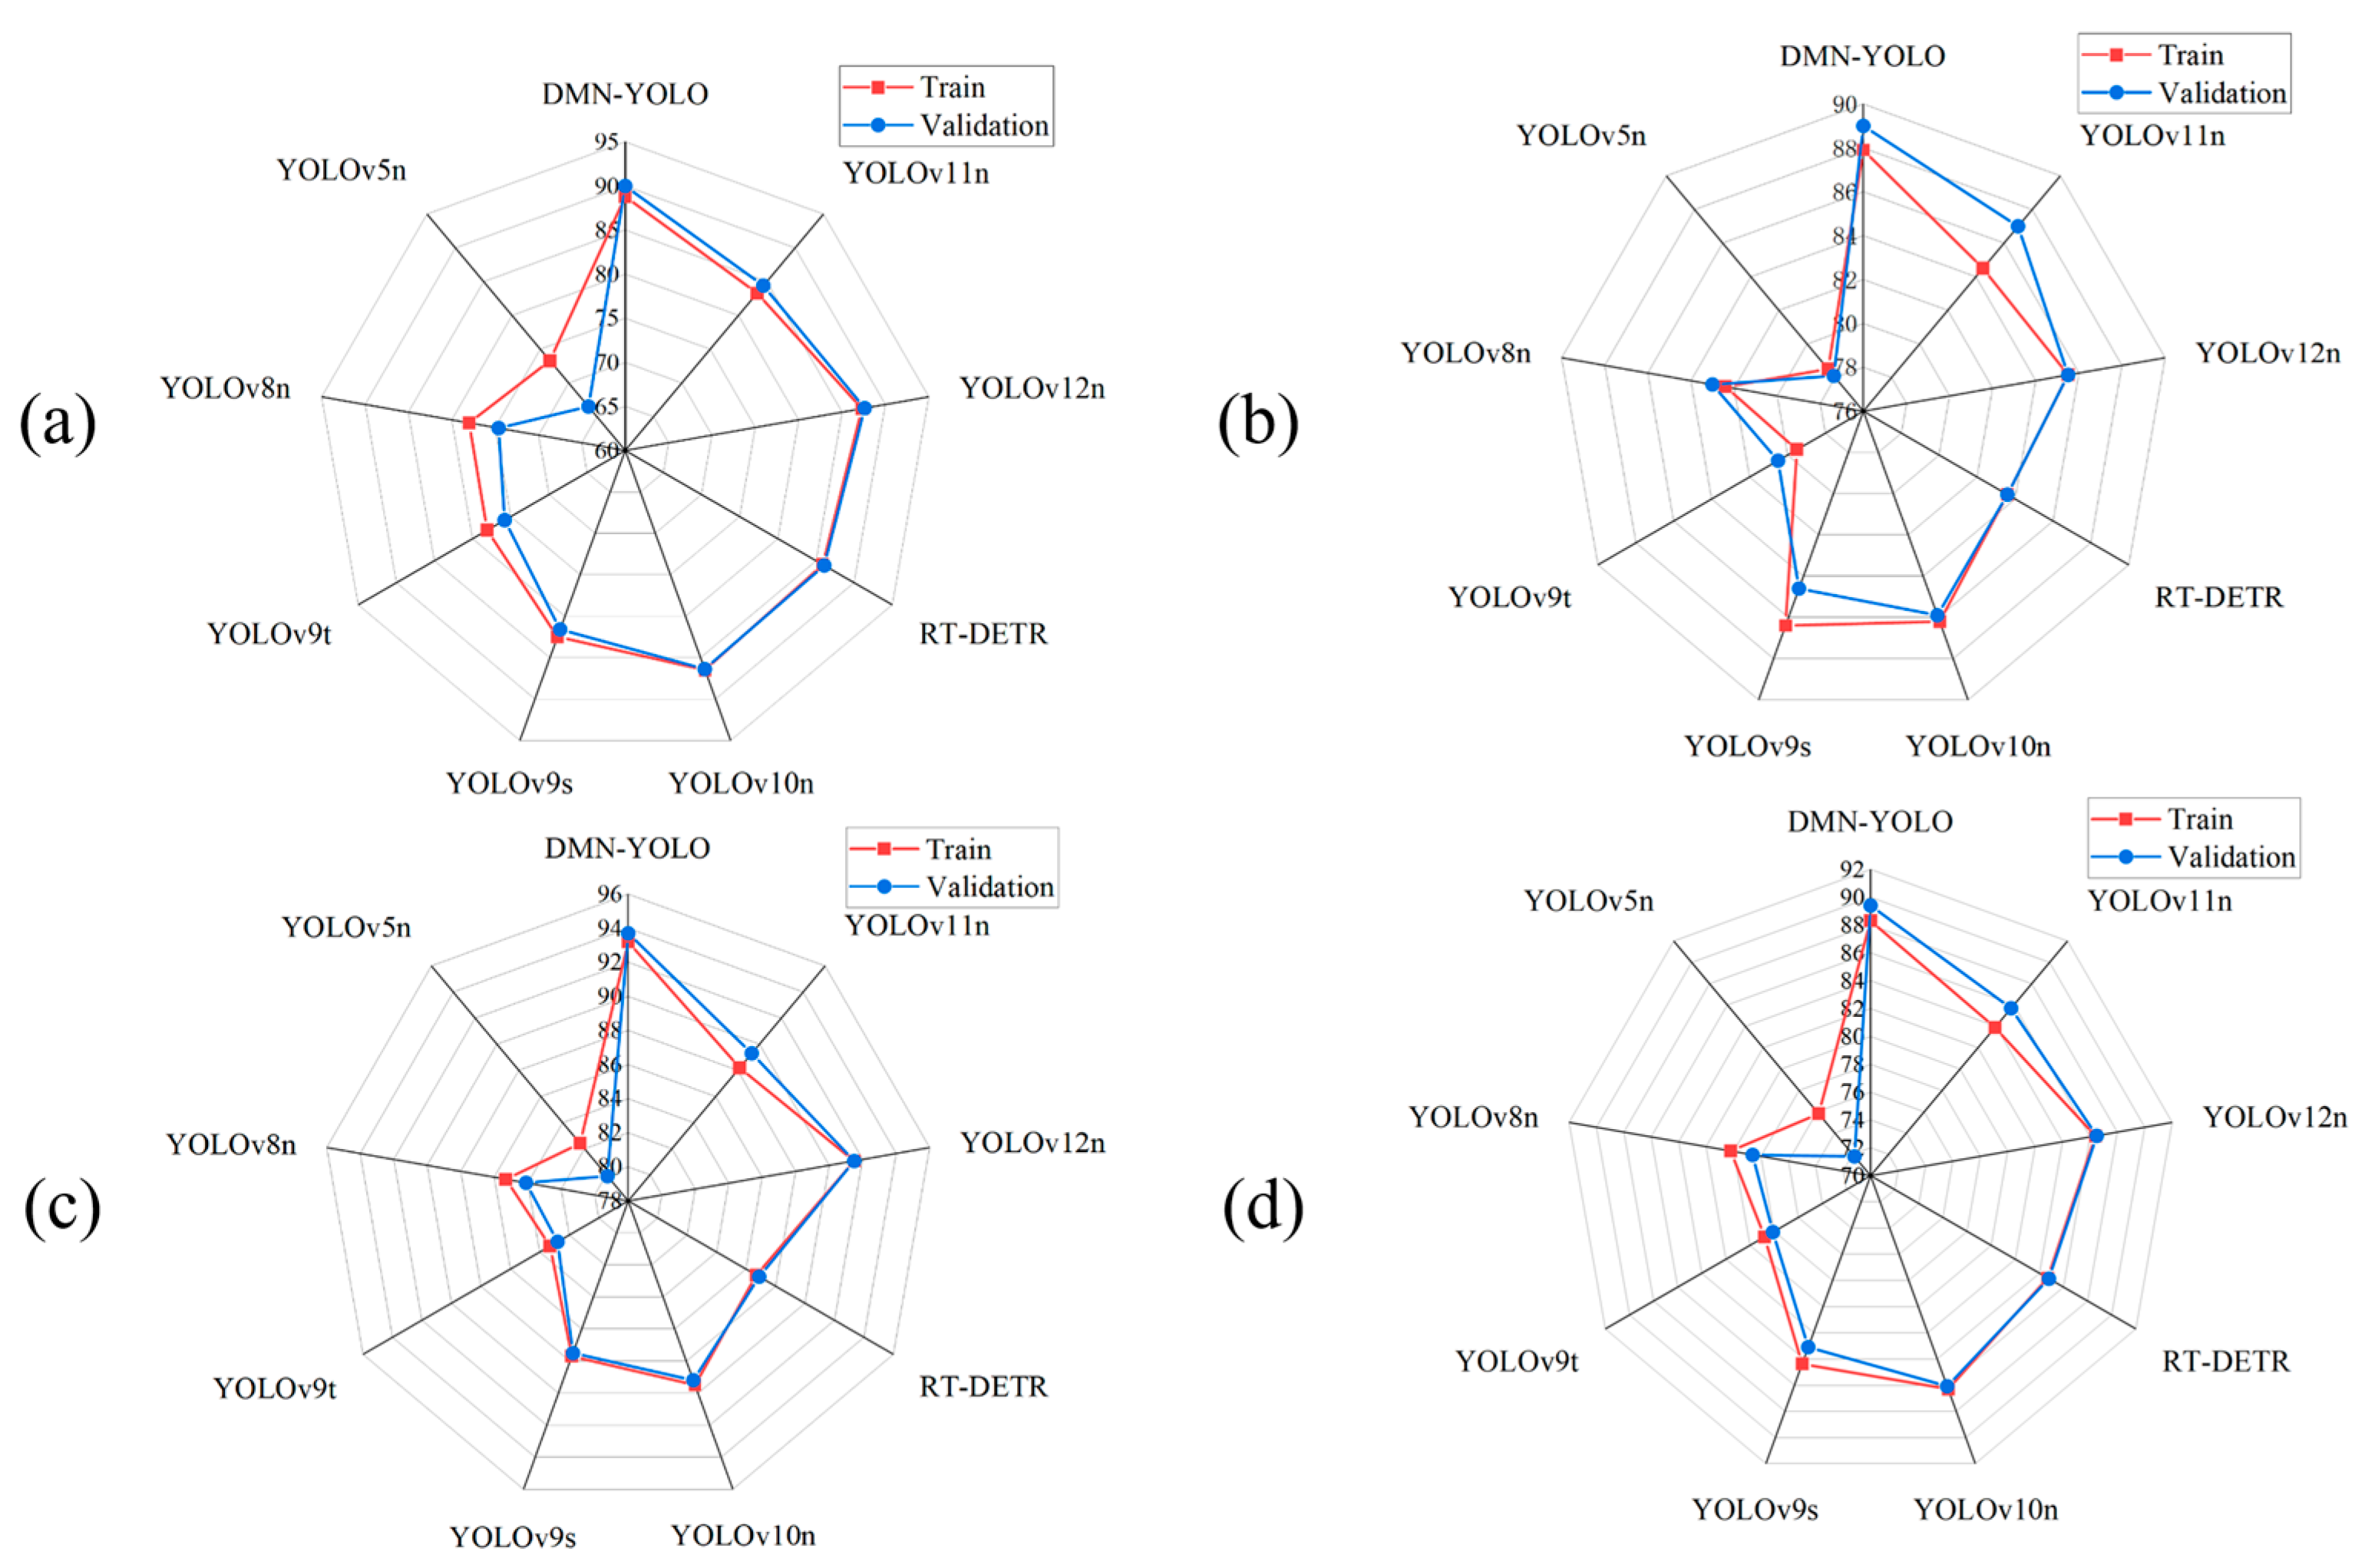
The proposed DMN-YOLO model demonstrates superior performance compared to all mainstream models across all evaluation indicators. Specifically, on the training set, DMN-YOLO achieved a precision of 88.8%, a recall of 87.9%, a mAP@50 of 93.2%, and an F1-score of 88.3%, outperforming all other models in terms of detection accuracy. Moreover, it attained an inference speed of 235.3 FPS, significantly exceeding that of models such as YOLOv9s (58.2 FPS) and YOLOv10n (140.7 FPS), thereby highlighting its superior efficiency and real-time processing capabilities. On the validation set, DMN-YOLO continued to exhibit leading performance, with a precision of 90.0%, a recall of 89.0%, a mAP@50 of 93.7%, and an F1-score of 89.4%. These values notably surpass those of the strong baseline YOLOv12n (87.6% precision, 85.5% recall, 91.5% mAP@50, and 86.5% F1-score), further validating the enhanced generalization ability of the proposed model. In summary, DMN-YOLO offers comprehensive improvements in detection accuracy, recall, inference speed, and robustness, establishing itself as the most effective and reliable object detection framework among all the models evaluated in this study.
Figure 14 shows a comprehensive set of radar charts that compare the performance of DMN-YOLO with other mainstream object detection models. While advanced models like RT-DETR and the latest YOLO versions (e.g., YOLOv10n and YOLOv12n) exhibit competitive performance in certain indicators, they still fall short in comprehensive detection effectiveness when compared to DMN-YOLO. Notably, the minimal difference observed between the radar chart curves of the training and validation sets suggests that DMN-YOLO demonstrates robust generalization ability and minimal risk of overfitting. Overall, DMN-YOLO demonstrates superior performance, robustness, and stability across multiple key evaluation metrics, underscoring its effectiveness and applicability in practical scenarios involving apple leaf disease detection.
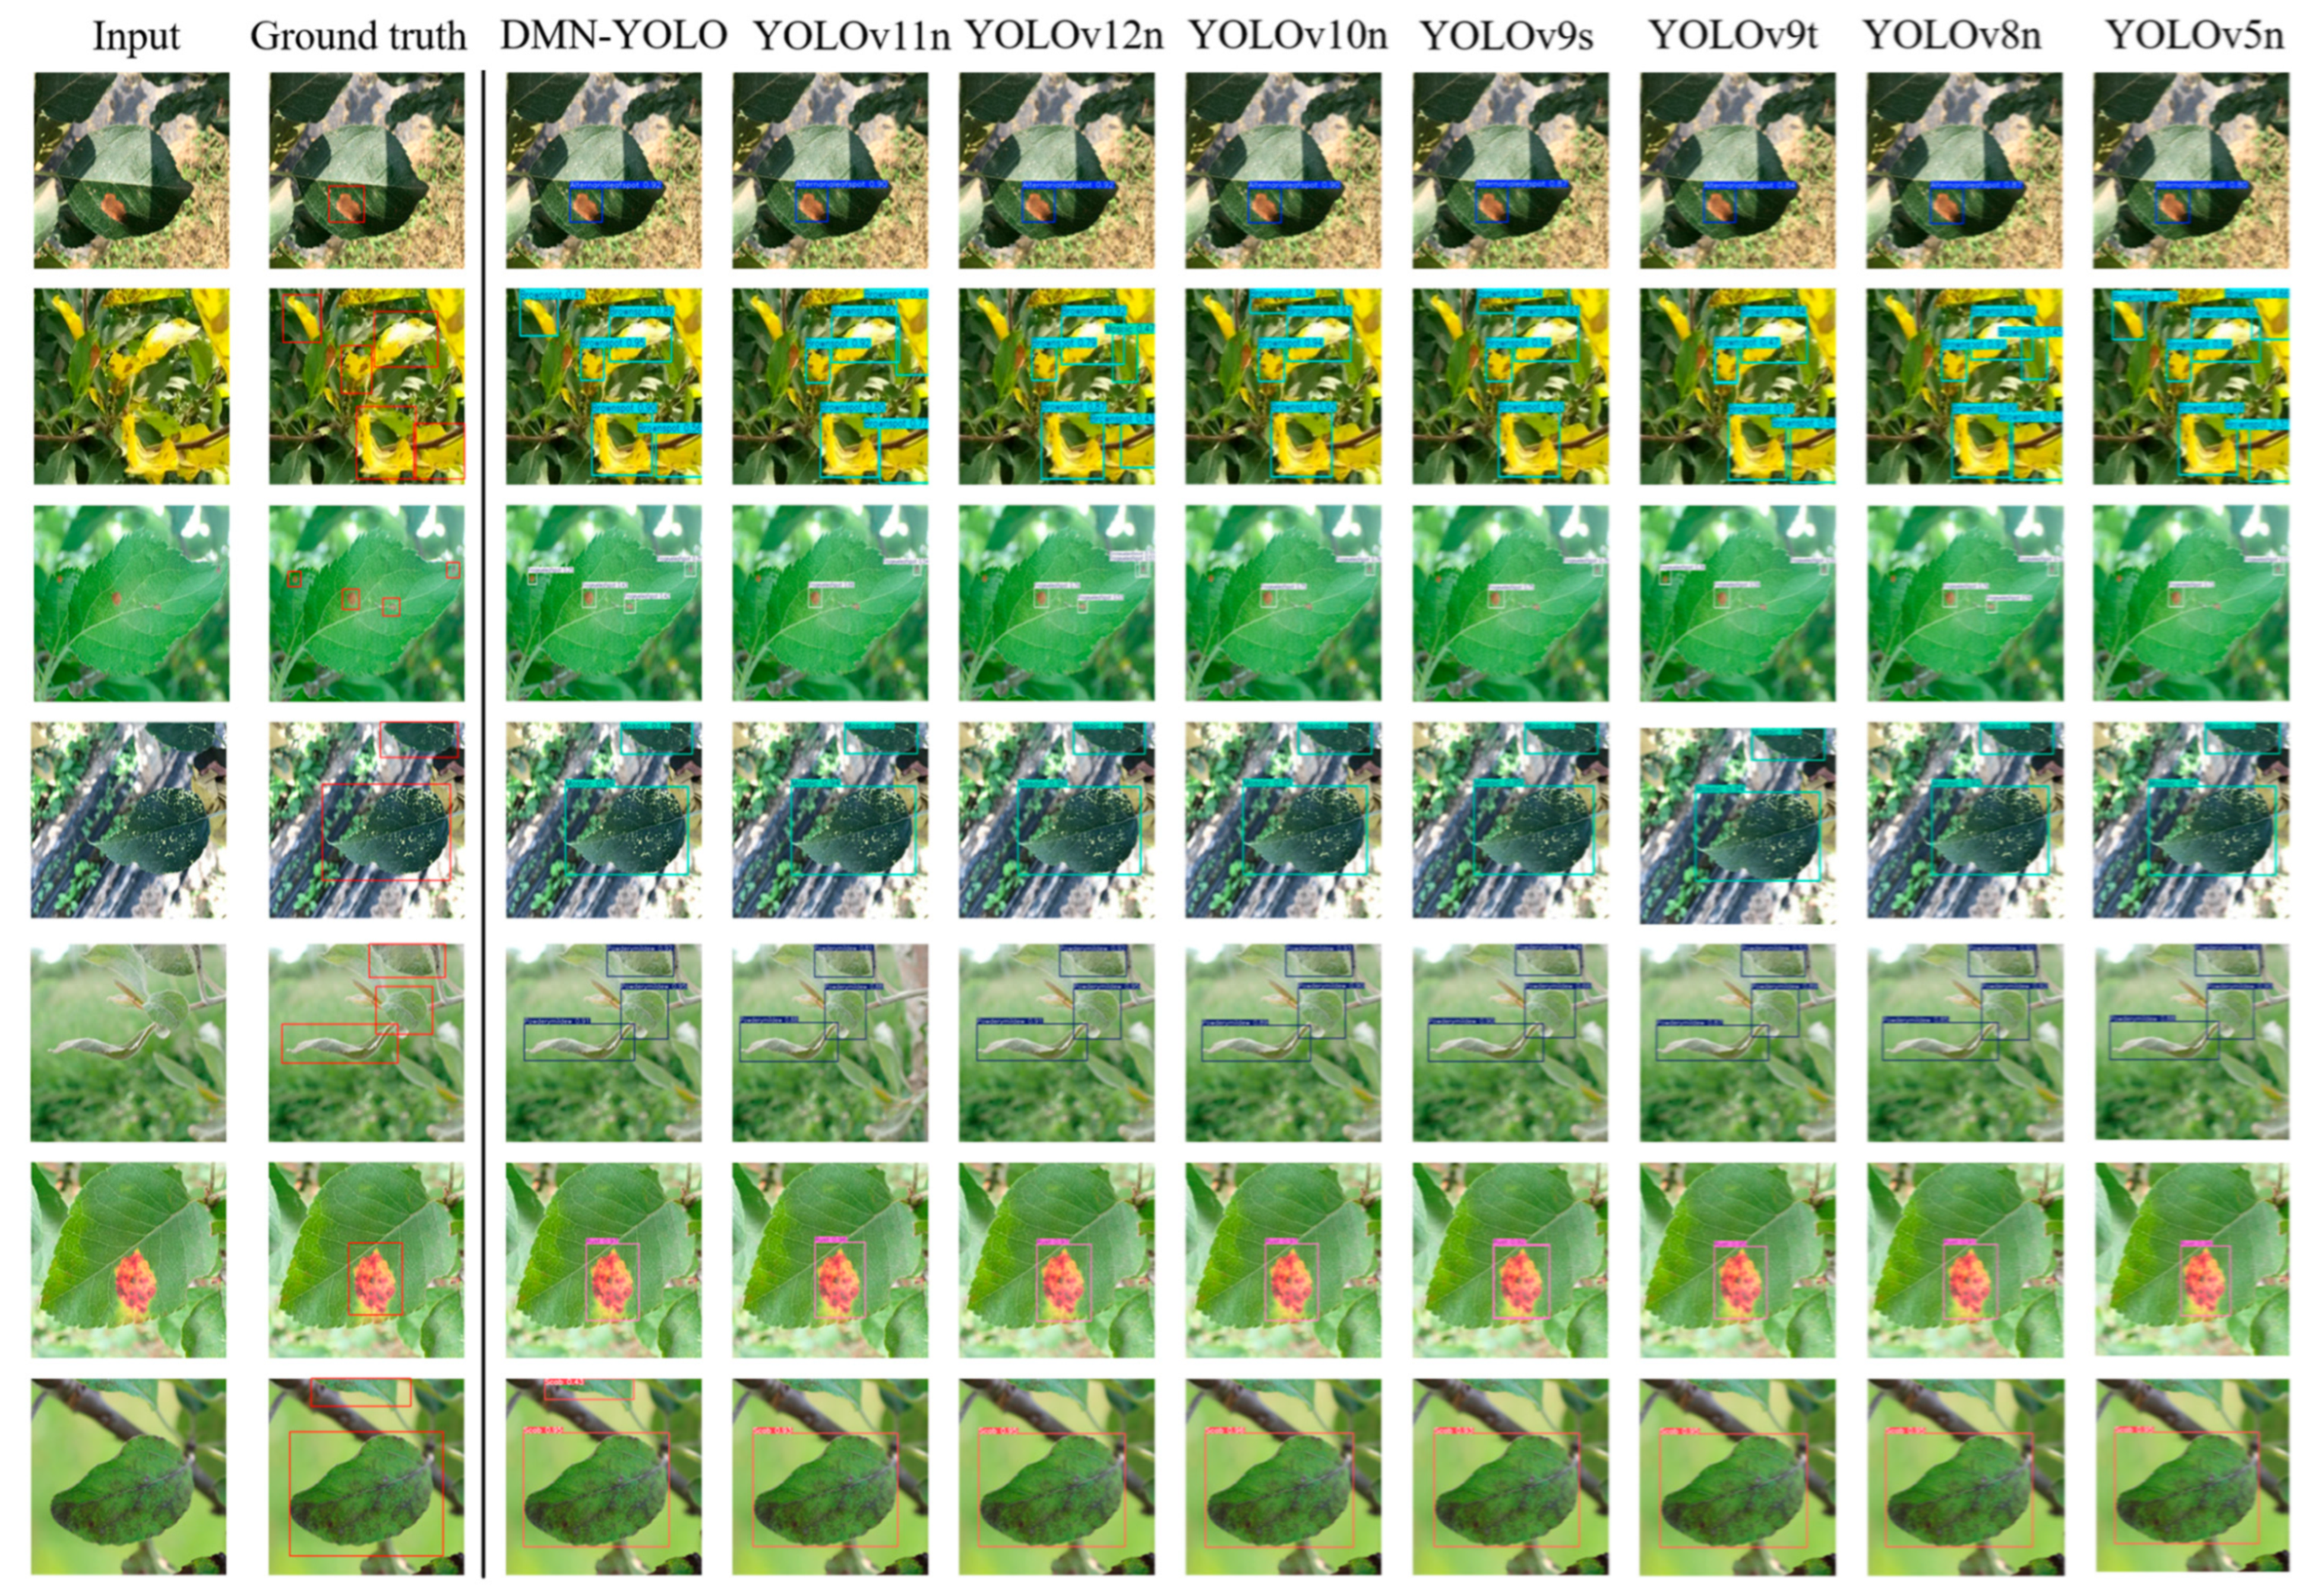
To intuitively illustrate the detection effectiveness of the proposed DMN-YOLO model, Figure 15 provides a visual comparison with several representative YOLO-based models. The experiment randomly selects one representative image from each disease category in the test dataset. As shown in Figure 14, the first column displays the input test images, followed by the ground-truth annotations, the third column displays the detection results of the DMN-YOLO model, and columns 4 through 10 depict the results of other detection models, including YOLOv11n, YOLOv12n, YOLOv10n, YOLOv9s, YOLOv9t, YOLOv8n, and YOLOv5n. Each row corresponds to a specific apple leaf disease category.
For the detection of leaf spot disease in the first row, the bounding boxes predicted by DMN-YOLO are closest to the ground truth, whereas models such as YOLOv10n and YOLOv5n exhibit inaccuracies such as oversized or misaligned bounding boxes. In the case of dense brown spot disease (second row), DMN-YOLO accurately detects all lesion areas and successfully differentiates between adjacent diseased regions. In contrast, YOLOv11n, YOLOv9s, and YOLOv9t suffer from missed detections or overlapping bounding boxes. The third row illustrates the detection of frogeye leaf spot disease, characterized by small and subtle lesions. DMN-YOLO demonstrates superior capability in recognizing all lesion areas while effectively avoiding confusion with leaf texture or shadows. Other models, including YOLOv9t and YOLOv8n, produce false positives in these scenarios. Moreover, under complex background conditions (rows 4 to 6), DMN-YOLO consistently maintains accurate localization of disease regions, whereas several YOLO variants are prone to errors due to background interference, leading to false detection results or misaligned bounding boxes. Overall, among all the compared detection models, DMN-YOLO yields detection results that are the most consistent with ground-truth annotations, demonstrating its excellent performance, robustness, and practical application potential in the context of apple leaf disease detection.
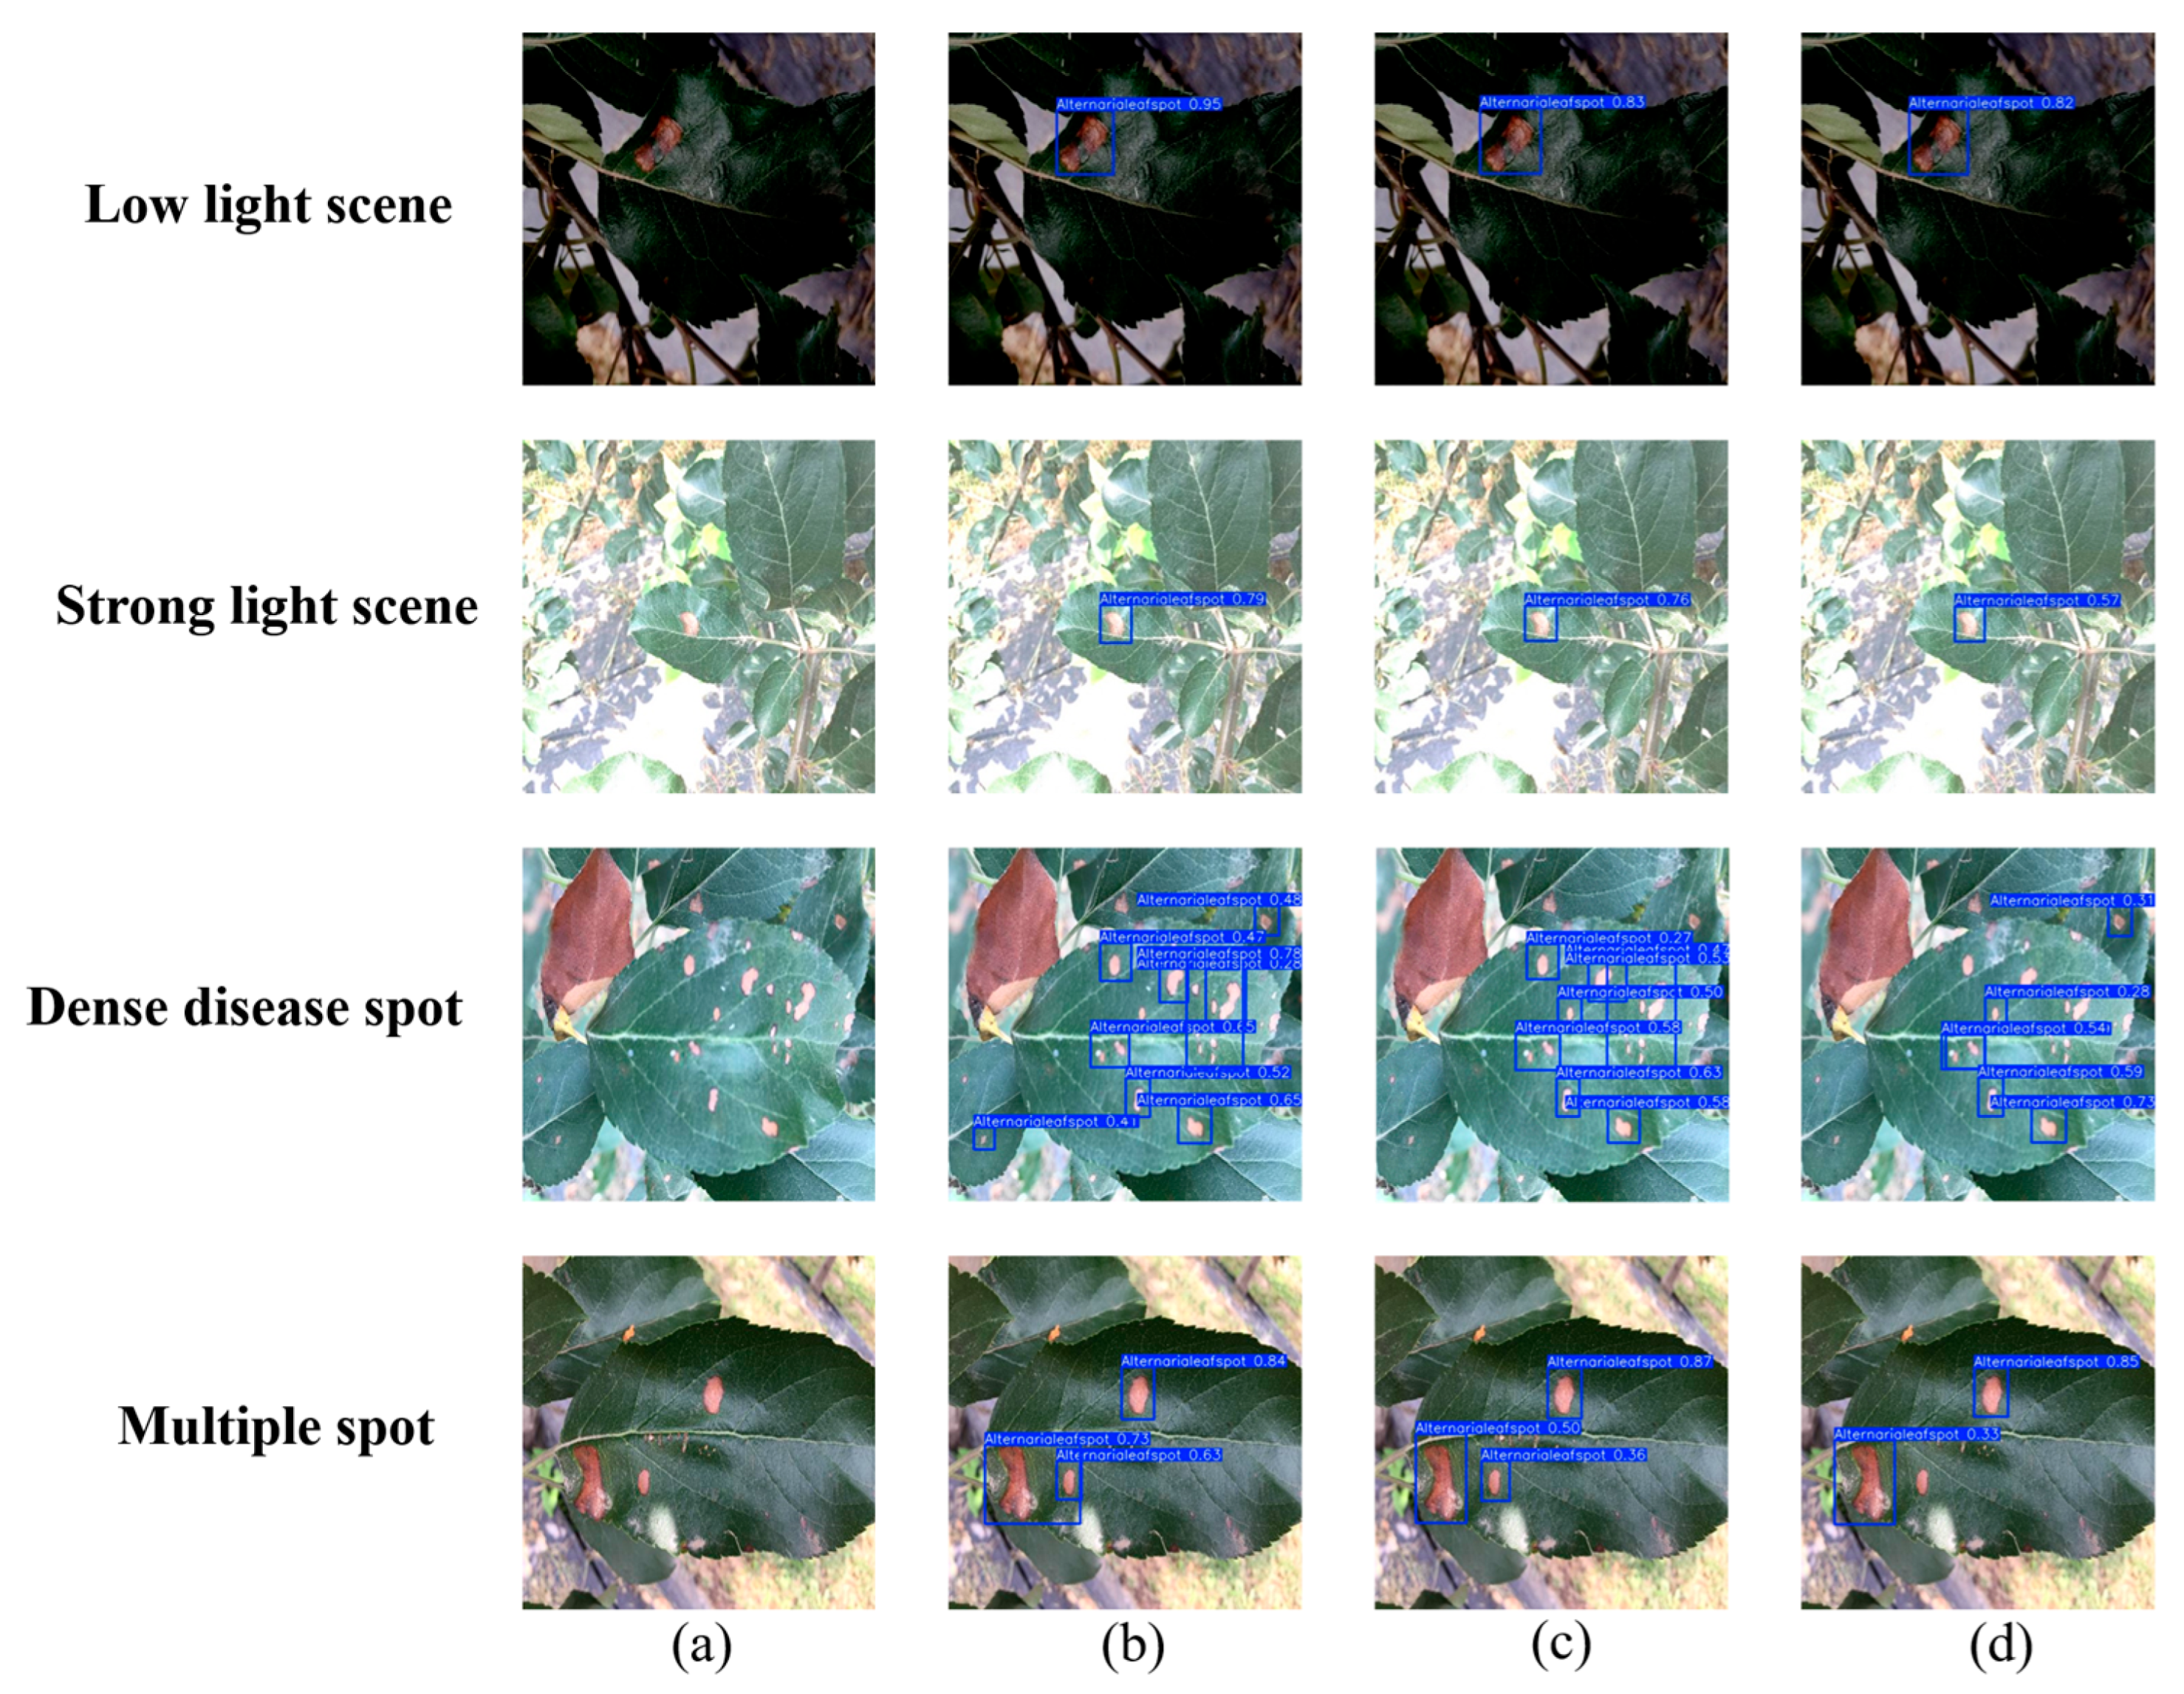
Figure 16 compares the detection performance of DMN-YOLO, YOLOv12n, and YOLOv11n on apple leaf disease images across four challenging conditions. The experimental results reveal that both YOLOv12n and YOLOv11n are prone to missing dark lesion areas, particularly in cases with strong background interference, and often suffer from inaccurate bounding box localization. In contrast, DMN-YOLO effectively identifies and localizes the lesion regions with high accuracy.
Under conditions of strong illumination, where background overexposure severely affects image quality, YOLOv12n and YOLOv11n exhibit significant instances of missed detections. However, DMN-YOLO demonstrates robust performance by maintaining the reliable detection of disease spots even in overexposed environments. In scenarios where lesions are densely clustered, YOLOv12n tends to merge adjacent lesions into one detection result, failing to capture the subtle differences between them. YOLOv11n will miss detections in this case. In contrast, DMN-YOLO shows superior performance, accurately distinguishing and detecting multiple closely spaced small lesions and achieving clear separation. Furthermore, in multi-spot scenarios, DMN-YOLO detects a greater number of lesion areas and delineates their boundaries more precisely, indicating superior capability in handling complex disease distribution patterns. These results highlight the robustness, precision, and fine-grained detection advantages of DMN-YOLO in diverse and challenging detection environments.
The detection results of disease images by different models under various scenarios, as illustrated in Figure 4 and Figure 5, align with the quantitative evaluation metrics presented in Table 4. The comprehensive comparison demonstrates that the DMN-YOLO model outperforms other mainstream models in complex environmental conditions, exhibiting superior detection performance and robustness.

3.8. Generalization Experiment

To comprehensively evaluate the generalization capability of the proposed model across various crop disease recognition tasks, a generalization experiment was conducted using a grape leaf disease dataset. The disease composition of this dataset is presented in Table 8, with representative disease images illustrated in Figure 17. Given that grapes are a widely cultivated fruit crop, this experiment serves as an effective validation of the model’s robustness and adaptability when confronted with diverse data distributions. Consequently, it underscores the model’s potential applicability and versatility in real-world agricultural scenarios.
Table 9 shows the generalization performance of the DMN-YOLO model on the grape leaf disease dataset. The DMN-YOLO model achieved better performance than the YOLOv11n model on the training set across all evaluation indicators. Specifically, it achieved a precision of 85.8%, a recall of 86.4%, a mAP@50 of 91.3%, and an F1-score of 86.0%, representing improvements of 3.6%, 3.5%, 2.8%, and 3.5%, respectively, over the baseline. Similarly, on the validation set, DMN-YOLO maintained its advantage, attaining a precision of 85.4%, a recall of 85.9%, a mAP@50 of 91.6%, and an F1-score of 85.6%, which correspond to increases of 3.5%, 3.2%, 3.1%, and 4.4%, respectively. These experimental results demonstrate that the DMN-YOLO model possesses enhanced feature representation capability and improved detection accuracy for object detection tasks, reflecting the effectiveness of the model’s architectural improvements. The generalization results on the grape leaf disease dataset further confirm DMN-YOLO’s robustness and adaptability, supporting its practical application in diverse plant disease detection tasks.
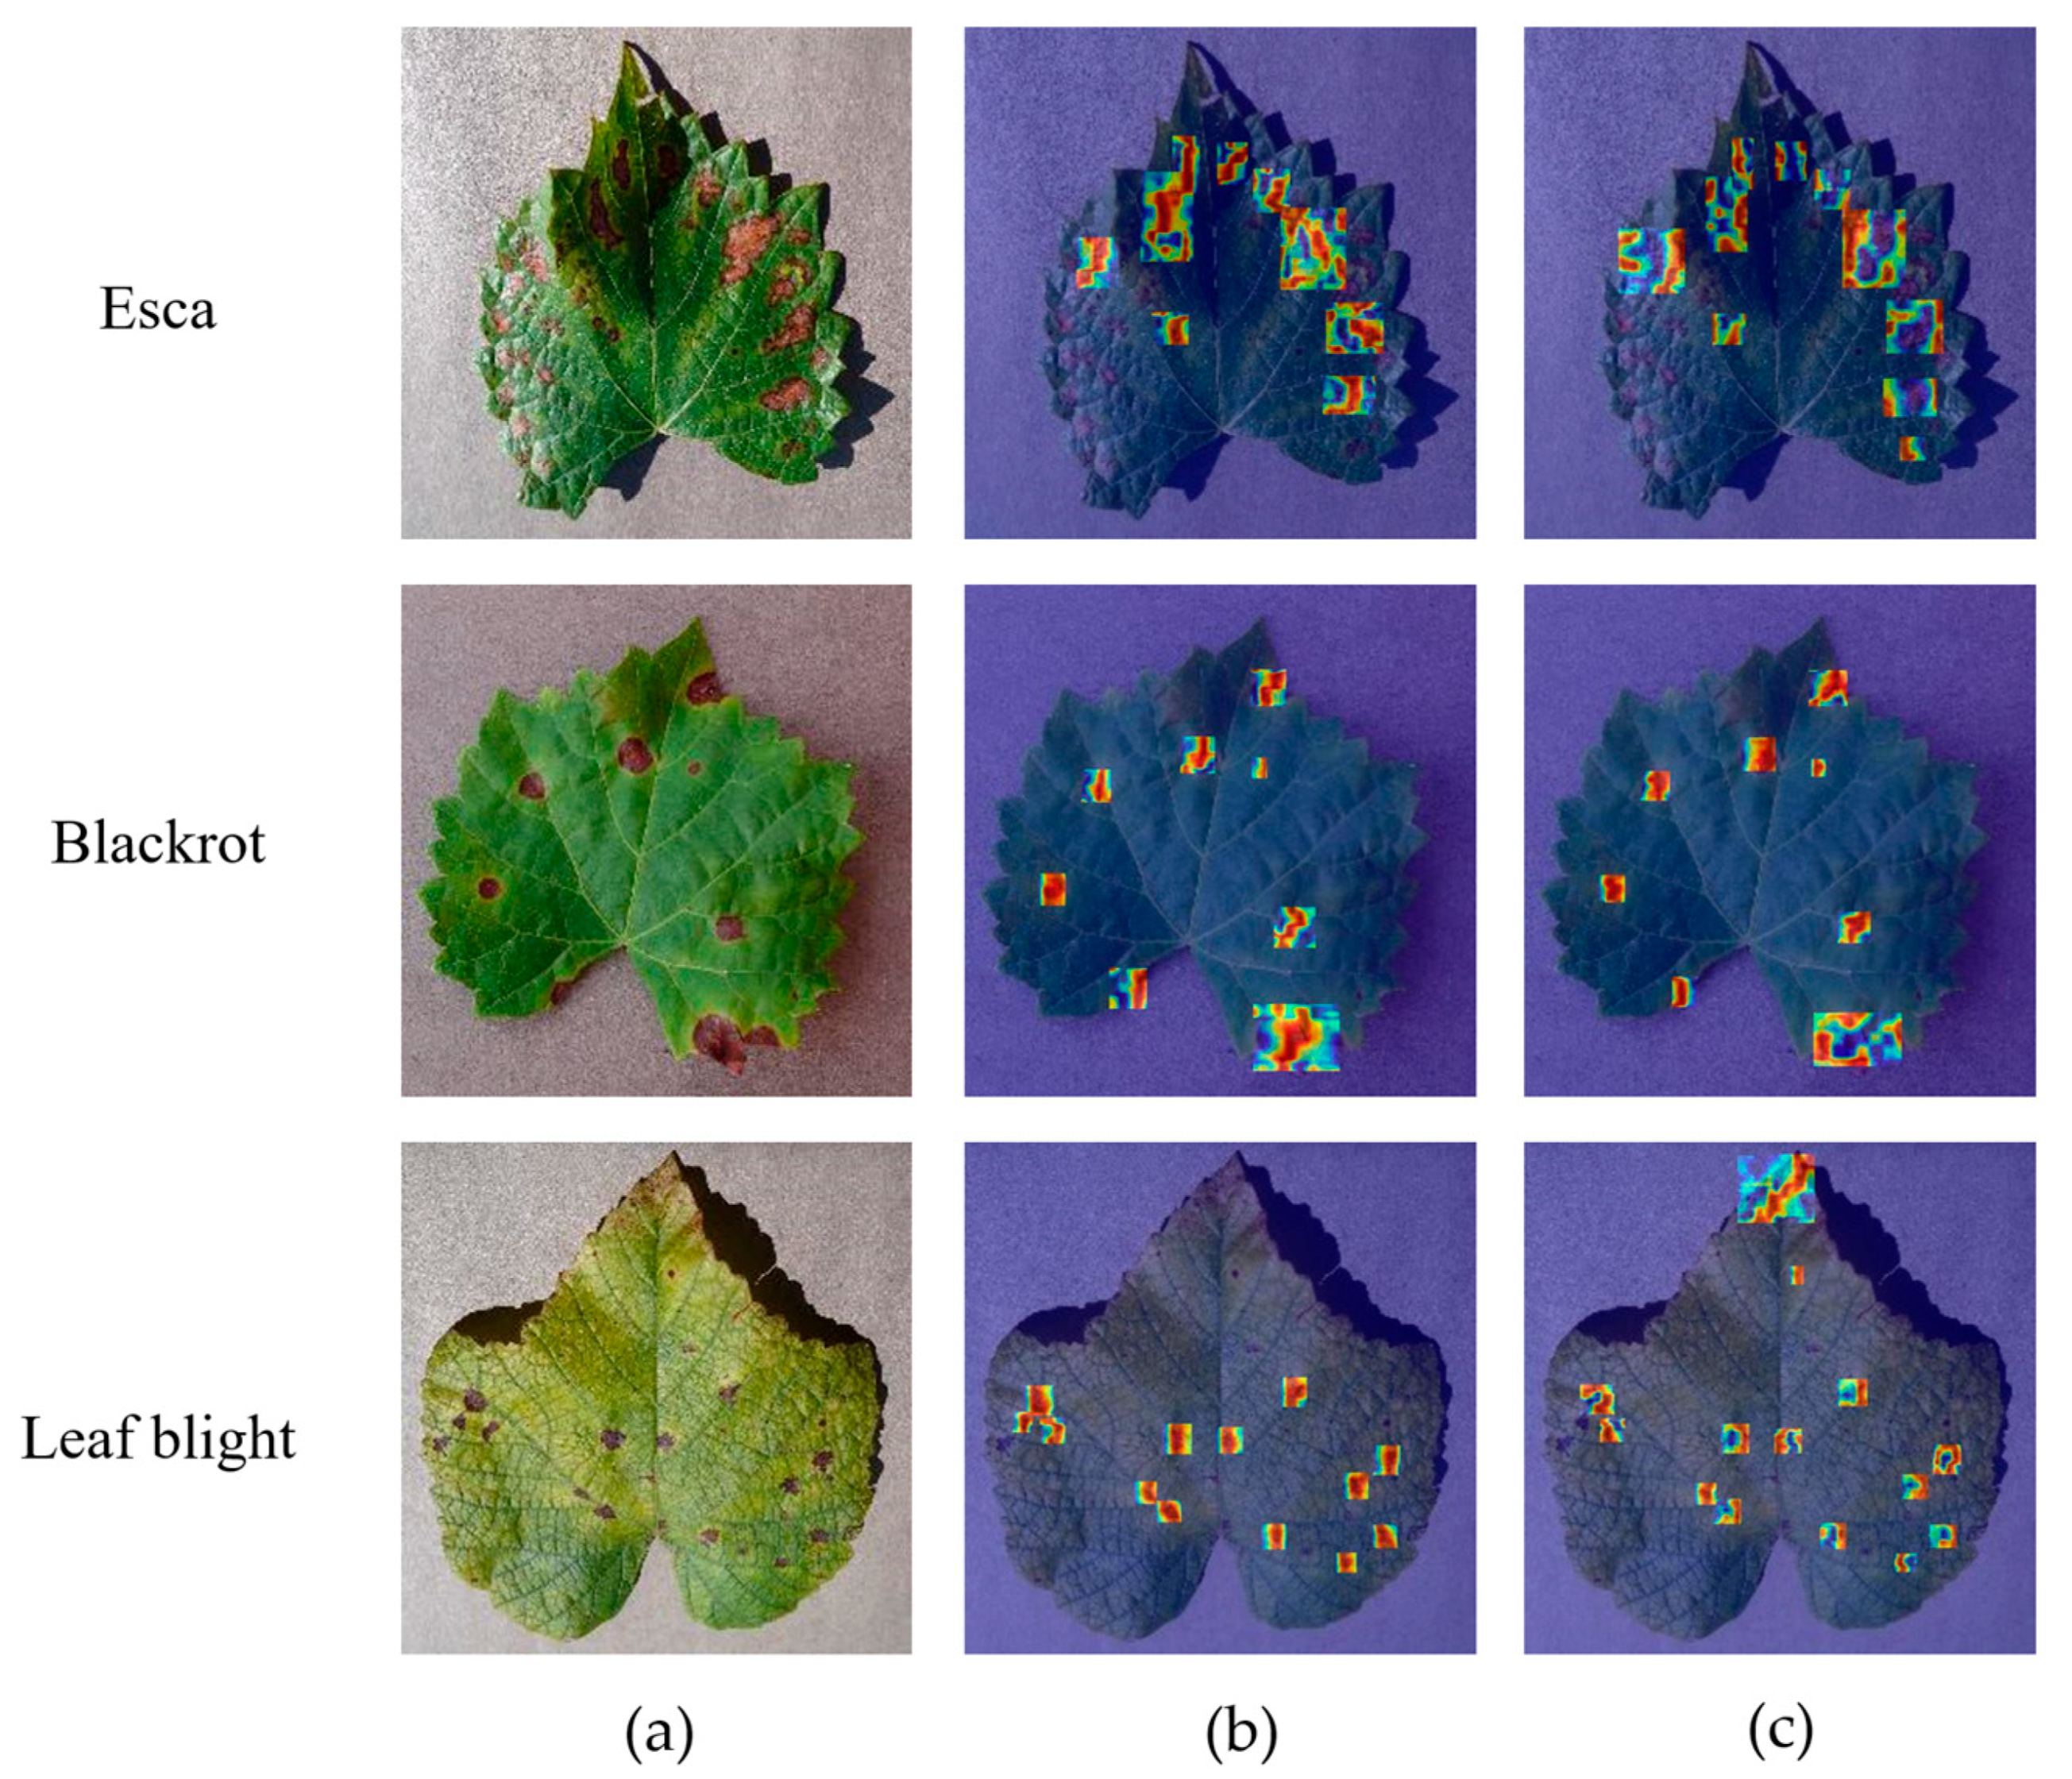
This study utilized Grad-CAM++ to visualize heatmaps and verify the model’s ability to detect grape leaf disease regions across multiple categories of infected leaf images. As shown in Figure 18, while YOLOv11n responds to diseased areas in some samples, issues such as misalignment and background interference are evident. In the cases of grape esca and grape black rot, the heatmap from YOLOv11n fails to focus accurately on the actual diseased areas, with some responses deviating from key regions, thus reducing the model’s discriminatory performance. In the grape leaf blight sample, the response area is more scattered, lacking a clear focus on the diseased area. In contrast, DMN-YOLO demonstrates superior positioning and focus capabilities across all three disease types. Its response areas are more concentrated and effectively cover the diseased regions. Notably, in the grape black rot and grape leaf blight images, the heatmap accurately highlights multiple characteristic diseased areas, showcasing the DMN-YOLO model’s enhanced feature extraction and area recognition capabilities.

4. Conclusions

This study introduces an improved version of the DMN-YOLO framework, specifically designed to address the challenges of apple leaf disease detection in complex field environments. The architecture leverages MAFPN, a multi-branch auxiliary feature pyramid network, which simultaneously addresses two key challenges: preserving shallow semantic cues via the SAF mechanism and enhancing top-down gradient flow using the AAF module. These modifications significantly enhance the model’s ability to perceive multi-scale diseased regions. Additionally, the RepHDWConv module is introduced into the network’s neck, which combines multi-scale depthwise separable convolutions with a structural reparameterization strategy. To enhance the detection of small and partially occluded objects, the model incorporates the RT-DETR decoder along with an additional low-level detection layer (P2), which collectively help reduce both missed detection results and false alarms. Moreover, to address the limitations of traditional regression loss functions in localizing small or overlapping targets, the paper introduces the normalized Wasserstein distance (NWD) as a novel regression loss function, further enhancing the model’s robustness and localization accuracy across multi-scale targets. These integrated enhancements lead to notable gains in the model’s effectiveness at identifying diverse lesion morphologies and strengthen its suitability for field-level deployment. Compared to the baseline YOLOv11n, the proposed DMN-YOLO model yields performance gains of 5.8%, 3.4%, and 5.0% in precision, recall, and mAP@50, respectively, as verified by experimental results. In challenging scenarios involving complex lighting conditions, background interference, dense lesions, and small target recognition, DMN-YOLO consistently exhibits superior detection accuracy and robustness, significantly outperforming existing state-of-the-art models.
Although the DMN-YOLO model has demonstrated significant improvements in apple leaf disease detection, it still has several limitations. While the enhancements increase detection accuracy, they also introduce greater computational complexity, which restricts the model’s practical deployment on edge devices with constrained resources. Although generalization experiments have been carried out on grape disease recognition, the dataset used is relatively small in scale and limited in diversity, making it insufficient to fully demonstrate the model’s robustness under large-scale crop and environmental variability.
In future work, this study will explore the integration of lightweight convolutional modules or knowledge distillation techniques to reduce model size and enhance its deployment on mobile devices or drones. Furthermore, the dataset will be expanded using images captured under varied geographical, seasonal, and illumination conditions, thereby establishing a more complex benchmark to thoroughly test the model’s resilience and generalization capacity in real-world agricultural scenarios.

Author Contributions

Conceptualization, H.W. and L.G.; methodology, L.G.; software, H.C.; validation, L.G., H.Z., and H.W.; formal analysis, H.W. and H.Z.; investigation, H.C.; resources, H.W.; data curation, H.W.; writing—original draft preparation, L.G.; writing—review and editing, H.W. and L.G; visualization, H.Z.; supervision, H.C.; project administration, H.W.; funding acquisition, H.W. and L.G. All authors have read and agreed to the published version of the manuscript.

Funding

This research was supported by the Science and Technology Bureau of Xinjiang Production and Construction Corps (BTYJXM-2024-S13); Central Guidance for Local Science and Technology Development Fund (ZYYD2025QY19); Bingtuan Science and Technology Program (2018ZYYD-1).

Institutional Review Board Statement

Not applicable.

Data Availability Statement

The data that support the findings of this study are available on request from the corresponding author.

Acknowledgments

We sincerely thank our adviser for their guidance and support and our colleagues for their technical help. We also appreciate everyone who assisted us during the writing of this paper.

Conflicts of Interest

The authors declare no conflicts of interest.

References

  1. Cao, H.; Wang, H.; Li, Y.; Hamani, A.K.M.; Zhang, N.; Wang, X.; Gao, Y. Evapotranspiration partition and dual crop coefficients in apple orchard with dwarf stocks and dense planting in arid region, Aksu oasis, southern Xinjiang. Agriculture 2021, 11, 1167. [Google Scholar] [CrossRef]
  2. Khan, A.I.; Quadri, S.; Banday, S.; Shah, J.L. Deep diagnosis: A real-time apple leaf disease detection system based on deep learning. Comput. Electron. Agric. 2022, 198, 107093. [Google Scholar] [CrossRef]
  3. Hasan, S.; Jahan, S.; Islam, M.I. Disease detection of apple leaf with combination of color segmentation and modified DWT. J. King Saud Univ. Comput. Inf. Sci. 2022, 34, 7212–7224. [Google Scholar] [CrossRef]
  4. Yang, L.; Zhang, T.; Zhou, S.; Guo, J. AAB-YOLO: An Improved YOLOv11 Network for Apple Detection in Natural Environments. Agriculture 2025, 15, 836. [Google Scholar] [CrossRef]
  5. Dubey, S.R.; Jalal, A.S. Detection and classification of apple fruit diseases using complete local binary patterns. In Proceedings of the 2012 Third International Conference on Computer and Communication Technology, Allahabad, India, 23–25 November 2012; pp. 346–351. [Google Scholar] [CrossRef]
  6. Omrani, E.; Khoshnevisan, B.; Shamshirband, S.; Saboohi, H.; Anuar, N.B.; Nasir, M.H.N.M.J.M. Potential of radial basis function-based support vector regression for apple disease detection. Measurement 2014, 55, 512–519. [Google Scholar] [CrossRef]
  7. Pallathadka, H.; Ravipati, P.; Sajja, G.S.; Phasinam, K.; Kassanuk, T.; Sanchez, D.T.; Prabhu, P. Application of machine learning techniques in rice leaf disease detection. Mater. Today Proc. 2022, 51, 2277–2280. [Google Scholar] [CrossRef]
  8. Jiang, P.; Chen, Y.; Liu, B.; He, D.; Liang, C. Real-time detection of apple leaf diseases using deep learning approach based on improved convolutional neural networks. IEEE Access 2019, 7, 59069–59080. [Google Scholar] [CrossRef]
  9. Tao, J.; Li, X.; He, Y.; Islam, M.A. CEFW-YOLO: A High-Precision Model for Plant Leaf Disease Detection in Natural Environments. Agriculture 2025, 15, 833. [Google Scholar] [CrossRef]
  10. Zhong, Y.; Zhao, M. Research on deep learning in apple leaf disease recognition. Comput. Electron. Agric. 2020, 168, 105146. [Google Scholar] [CrossRef]
  11. Wang, Y.; Wang, Y.; Zhao, J. MGA-YOLO: A lightweight one-stage network for apple leaf disease detection. Front. Plant Sci. 2022, 13, 927424. [Google Scholar] [CrossRef]
  12. Zhu, S.; Ma, W.; Wang, J.; Yang, M.; Wang, Y.; Wang, C. EADD-YOLO: An efficient and accurate disease detector for apple leaf using improved lightweight YOLOv5. Front. Plant Sci. 2023, 14, 1120724. [Google Scholar] [CrossRef] [PubMed]
  13. Zhang, Q.; Xu, C.; Wei, H.; Fan, W.; Li, T. Two pathogenesis-related proteins interact with leucine-rich repeat proteins to promote Alternaria leaf spot resistance in apple. Hortic. Res. 2021, 8, 219. [Google Scholar] [CrossRef]
  14. Hou, Y.; Zhang, X.; Zhang, N.; Naklumpa, W.; Zhao, W.; Liang, X.; Zhang, R.; Sun, G.; Gleason, M.L. Genera Acremonium and Sarocladium cause brown spot on bagged apple fruit in China. Plant Dis. 2019, 103, 1889–1901. [Google Scholar] [CrossRef]
  15. Venkatasubbaiah, P.; Sutton, T.; Chilton, W. Effect of phytotoxins produced by Botryosphaeria obtusa, the cause of black rot of apple fruit and frogeye leaf spot. Phytopathology® 1991, 81, 243–247. [Google Scholar] [CrossRef]
  16. Nabi, S.U.; Manoj, Y.; Nida, Y.; Wasim, H.; Kavi, S.; Saurabh, D.; Damini, J. Apple mosaic disease: Potential threat to apple productivity. EC Agric 2019, 5, 614–618. [Google Scholar]
  17. Strickland, D.A.; Hodge, K.T.; Cox, K.D. An examination of apple powdery mildew and the biology of Podosphaera leucotricha from past to present. Plant Health Prog. 2021, 22, 421–432. [Google Scholar] [CrossRef]
  18. Zhang, Y.; Cao, B.; Pan, Y.; Tao, S.; Zhang, N. Metabolite-mediated responses of phyllosphere microbiota to rust infection in two Malus species. Microbiol. Spectr. 2023, 11, e03831-22. [Google Scholar] [CrossRef]
  19. Bowen, J.K.; Mesarich, C.H.; Bus, V.G.; Beresford, R.M.; Plummer, K.M.; Templeton, M.D. Venturia inaequalis: The causal agent of apple scab. Mol. Plant Pathol. 2011, 12, 105–122. [Google Scholar] [CrossRef] [PubMed]
  20. Khanam, R.; Hussain, M. Yolov11: An overview of the key architectural enhancements. arXiv 2024, arXiv:2410.17725. [Google Scholar]
  21. Rasheed, A.F.; Zarkoosh, M. YOLOv11 Optimization for Efficient Resource Utilization. arXiv 2024, arXiv:2412.14790. [Google Scholar]
  22. Liao, Y.; Li, L.; Xiao, H.; Xu, F.; Shan, B.; Yin, H. YOLO-MECD: Citrus Detection Algorithm Based on YOLOv11. Agronomy 2025, 15, 687. [Google Scholar] [CrossRef]
  23. Yang, Z.; Guan, Q.; Zhao, K.; Yang, J.; Xu, X.; Long, H.; Tang, Y. Multi-branch Auxiliary Fusion YOLO with Re-parameterization Heterogeneous Convolutional for Accurate Object Detection. In Proceedings of the Chinese Conference on Pattern Recognition and Computer Vision (PRCV), Urumqi, China, 18–20 October 2024; pp. 492–505. [Google Scholar]
  24. Zhao, Y.; Lv, W.; Xu, S.; Wei, J.; Wang, G.; Dang, Q.; Liu, Y.; Chen, J. Detrs beat yolos on real-time object detection. In Proceedings of the IEEE/CVF Conference on Computer Vision and Pattern Recognition, Seattle, WA, USA, 17–18 June 2024; pp. 16965–16974. [Google Scholar]
  25. Li, X.; Cai, M.; Tan, X.; Yin, C.; Chen, W.; Liu, Z.; Wen, J.; Han, Y.J. An efficient transformer network for detecting multi-scale chicken in complex free-range farming environments via improved RT-DETR. Comput. Electron. Agric. 2024, 224, 109160. [Google Scholar] [CrossRef]
  26. Xu, C.; Wang, J.; Yang, W.; Yu, H.; Yu, L.; Xia, G.-S. Detecting tiny objects in aerial images: A normalized Wasserstein distance and a new benchmark. ISPRS J. Photogramm. Remote Sens. 2022, 190, 79–93. [Google Scholar] [CrossRef]
  27. Su, N.; Zhao, Z.; Yan, Y.; Wang, J.; Lu, W.; Cui, H.; Qu, Y.; Feng, S.; Zhao, C. MMPW-Net: Detection of Tiny Objects in Aerial Imagery Using Mixed Minimum Point-Wasserstein Distance. Remote Sens. 2024, 16, 4485. [Google Scholar] [CrossRef]
  28. Wang, S.; Jiang, H.; Yang, J.; Ma, X.; Chen, J.; Li, Z.; Tang, X. Lightweight tomato ripeness detection algorithm based on the improved RT-DETR. Front. Plant Sci. 2024, 15, 1415297. [Google Scholar] [CrossRef] [PubMed]
  29. Zhang, X.; Li, H.; Sun, S.; Zhang, W.; Shi, F.; Zhang, R.; Liu, Q. Classification and identification of apple leaf diseases and insect pests based on improved ResNet-50 model. Horticulturae 2023, 9, 1046. [Google Scholar] [CrossRef]
  30. Zhang, X.; Guo, W.; Xing, Y.; Wang, W.; Yin, H.; Zhang, Y. AugFCOS: Augmented fully convolutional one-stage object detection network. Pattern Recognit. 2023, 134, 109098. [Google Scholar] [CrossRef]
  31. Yang, G.; Lei, J.; Zhu, Z.; Cheng, S.; Feng, Z.; Liang, R. AFPN: Asymptotic feature pyramid network for object detection. In Proceedings of the 2023 IEEE International Conference on Systems, Man, and Cybernetics (SMC), Honolulu, HI, USA, 1–4 October 2023; pp. 2184–2189. [Google Scholar] [CrossRef]
  32. Doherty, J.; Gardiner, B.; Kerr, E.; Siddique, N. BiFPN-yolo: One-stage object detection integrating Bi-directional feature pyramid networks. Pattern Recognit. 2025, 160, 111209. [Google Scholar] [CrossRef]
  33. Wong, J.; Wei, H.; Zhou, D.; Cao, Z. The target detection of wear particles in ferrographic images based on the improved YOLOv8. Lubricants 2024, 12, 280. [Google Scholar] [CrossRef]
  34. Xin, D.; Li, T. Revolutionizing tomato disease detection in complex environments. Front. Plant Sci. 2024, 15, 1409544. [Google Scholar] [CrossRef]
  35. Sapkota, R.; Karkee, M. Improved yolov12 with llm-generated synthetic data for enhanced apple detection and benchmarking against yolov11 and yolov10. arXiv 2025, arXiv:2503.00057. [Google Scholar]
  36. Wu, M.; Qiu, Y.; Wang, W.; Su, X.; Cao, Y.; Bai, Y. Improved RT-DETR and its application to fruit ripeness detection. Front. Plant Sci. 2025, 16, 1423682. [Google Scholar] [CrossRef] [PubMed]
  37. Huang, Y.; Liu, Z.; Zhao, H.; Tang, C.; Liu, B.; Li, Z.; Wan, F.; Qian, W.; Qiao, X. YOLO-YSTs: An Improved YOLOv10n-Based Method for Real-Time Field Pest Detection. Agronomy 2025, 15, 575. [Google Scholar] [CrossRef]
  38. Shi, Y.; Duan, Z.; Qing, S.; Zhao, L.; Wang, F.; Yuwen, X. YOLOV9S-Pear: A lightweight YOLOV9S-Based improved model for young Red Pear Small-Target recognition. Agronomy 2024, 14, 2086. [Google Scholar] [CrossRef]
  39. Yaseen, M. What is yolov9: An in-depth exploration of the internal features of the next-generation object detector. arXiv 2024, arXiv:2409.07813. [Google Scholar]
  40. Wang, M.; Li, F. Real-Time Accurate Apple Detection Based on Improved YOLOv8n in Complex Natural Environments. Plants 2025, 14, 365. [Google Scholar] [CrossRef]
  41. Wang, C.; Wang, C.; Wang, L.; Wang, J.; Liao, J.; Li, Y.; Lan, Y. A lightweight cherry tomato maturity real-time detection algorithm based on improved YOLOV5n. Agronomy 2023, 13, 2106. [Google Scholar] [CrossRef]
Figure 1. Representative images of apple leaf diseases used in this study: (a) Alternaria leaf spot; (b) brown spot; (c) frogeye leaf spot; (d) mosaic; (e) powdery mildew; (f) rust; (g) scab. The red box in each image indicates the diseased area of the leaf.
Agriculture 15 01138 g001
Figure 2. Dataset statistics: (a) Distribution of disease types in the collected dataset; (b) counts of single-background and complex-background images before and after data augmentation.
Agriculture 15 01138 g002
Figure 3. Augmented apple leaf images under different lighting conditions. Variations were introduced via contrast, brightness, and saturation adjustments using the Albumentations library: (a) original images; (b) images after data augmentation.
Agriculture 15 01138 g003
Figure 4. Overall architecture of the proposed DMN-YOLO network for apple leaf disease detection.
Agriculture 15 01138 g004
Figure 5. Structural illustration of the Superficial Assisted Fusion (SAF) module proposed in this study.
Agriculture 15 01138 g005
Figure 6. Architecture of the Adaptive Attention Fusion (AAF) module proposed in this study.
Agriculture 15 01138 g006
Figure 7. Structural diagram of the detection head in the RT-DETR (Real-Time Detection Transformer) model.
Agriculture 15 01138 g007
Figure 8. Example IoU illustrations demonstrating sensitivity to localization shifts for tiny and normal lesions in apple leaf disease detection. Each grid represents 1 pixel. Box A is the ground-truth bounding box, while boxes B and C are predicted bounding boxes used to visualize how small deviations impact IoU values.
Agriculture 15 01138 g008
Figure 9. Precision-recall (PR) curves and per-class area under the curve (PR-AUC) for apple leaf disease classification using the DMN-YOLO model.
Agriculture 15 01138 g009
Figure 10. Confusion matrix results of the DMN-YOLO model for apple leaf disease detection: (a) absolute confusion matrix; (b) normalized confusion matrix.
Agriculture 15 01138 g010
Figure 11. Comparison between the original and improved model performance: (a) precision curve comparison; (b) recall curve comparison.
Agriculture 15 01138 g011
Figure 12. Comparison of XGard-CAM visualization results of the models before and after improvement: (a) original image; (b) YOLOv11n model; (c) DMN-YOLO model.
Agriculture 15 01138 g012
Figure 13. Comparing experimental results based on the YOLOv11n model with various loss functions.
Agriculture 15 01138 g013
Figure 14. Comparative analysis of DMN-YOLO and other models on different evaluation indicators: (a) precision (%) comparison, (b) recall (%) comparison, (c) mean average precision @50 (%) comparison, (d) F1-score (%) comparison.
Agriculture 15 01138 g014
Figure 15. Detection comparison using DMN-YOLO and other YOLO models.
Agriculture 15 01138 g015
Figure 16. Comparative analysis of the detection effectiveness of various models on apple disease images in complex conditions: (a) original image; (b) output prediction of the DMN-YOLO model; (c) output prediction of the YOLOv12n model; (d) output prediction of the YOLOv11n model.
Agriculture 15 01138 g016
Figure 17. Some images of grape leaf diseases: (a) esca; (b) black rot; (c) leaf blight. The red box in each image highlights the leaf disease spot area.
Agriculture 15 01138 g017
Figure 18. Evaluation of Grad-CAM++ visualization results comparing model performance before and after improvements: (a) original image; (b) YOLOv11n model; (c) DMN-YOLO model. In the Grad-CAM++ visualization, deeper colors indicate regions where the model focuses more attention, highlighting important areas influencing the model’s predictions.
Agriculture 15 01138 g018
Table 1. Description of common apple leaf diseases.
Disease TypeCauseSymptomsPeriod of High Incidence
Alternaria leaf spot [13]Alternaria alternata f. sp. mali infection of apples.Initially, small 2–3 mm brown to dark-brown circular spots form on the apple leaves, surrounded by purple halos with well-defined edges. Over time, the spots can expand to 5–6 mm in diameter, darken in color, and may partially merge into irregular shapes. In a humid environment, black–green to dark-black mold may develop on the underside of the leaves.June–September
Brown spot [14]Caused by Marssonina mali fungus.Initially, small purple–brown to dark-brown blisters appear on the leaf surface, which then develop into needle-shaped, concentric ring-shaped, or mixed large spots. The affected area turns yellow, while the surrounding area remains green, causing the diseased leaves to prematurely fall off.April–August
Frogeye leaf spot [15]Caused by the fungus Cabomycella ferruginea.Circular or irregular brown spots appear on the leaves, with gray–brown or purple–red centers, surrounded by yellow halos, giving the appearance of frog eyes.April–July
Mosaic [16]Caused by apple mosaic virus (ApMV).Irregular yellow or white patches appear on the leaves, forming a mosaic pattern. The leaves may become deformed and misshapen, resulting in restricted growth, while the fruit may become smaller.Visible all year round, symptoms are more pronounced in spring
Powdery mildew [17]Podosphaera leucotricha and other fungi.White powder appears on the surface of the leaves, with the spots gradually expanding. The leaves may turn yellow and eventually fall off, and the infection can spread to the branches as well.April–June
Rust [18]Caused by fungi of the genus Gymnosporangium.Orange–yellow rust spots appear on the leaves with clear edges, and fine powder forms on the surface. In severe cases, the leaves dry up and eventually fall off.April–July
Scab [19]Caused by the fungus Venturia inaequalis.Round or irregular brown spots appear on the leaves, with dark-brown or gray–green centers and yellow edges. In severe cases, the affected leaves may fall off.March–June
Table 2. Parameter settings for the experiment.
Experimental EnvironmentExperimental Configuration
Python Version3.8.0
Deep Learning FrameworkPyTorch 1.10.0
GPU Acceleration (CUDA)11.7
Input Image Size640 × 640 pixels
OptimizerAdamW
Momentum0.937
Initial Learning Rate0.1
Weight Decay0.0005
Number of Training Epochs300
Batch Size16
Table 3. Analysis of the DMN-YOLO model’s performance in detecting different types of diseases.
Type of DiseasePrecision/%Recall/%mAP@50/%
Alternaria leaf spot85.980.086.0
Brown spot86.786.598.9
Frogeye leaf spot88.394.297.9
Mosaic85.186.097.9
Powdery mildew83.395.095.4
Rust87.581.390.6
Scab85.085.988.4
Table 4. Ablation experiment.
MAFPNRepHDWConvDetrHeadNWDPrecision/%Recall/%mAP@50/%F1-Score%
83.384.588.283.9
85.486.191.685.7
83.286.989.285.0
86.986.391.886.6
86.887.191.186.9
88.887.993.288.1
Table 5. Experiment on the performance impact of different feature pyramid structures on YOLOv11n.
ModelPrecision/%Recall/%mAP@50/%F1-Score%
YOLOv11-A81.984.188.383.0
YOLOv11-B75.181.385.378.0
YOLOv11-G84.185.990.884.9
YOLOv11-H81.382.185.081.6
YOLOv11-M85.486.191.685.7
Table 6. Comparison of YOLOv11n models using different loss functions.
ModelLoss FunctionPrecision/%Recall/%mAP@50/%F1-Score/%
YOLOv11nCIoU83.384.588.283.9
GIoU83.286.989.285.0
DIoU80.184.986.382.4
EIoU82.285.288.183.6
InnerIoU82.285.788.883.9
FocalerIoU81.087.788.584.2
NWD (ours)86.887.191.186.9
Table 7. Comparative experiments on different models.
ModelDatasetPrecision/%Recall/%mAP@50/%F1-Score/%FPS
YOLOv5nTrain73.378.582.475.8152.5
Validation66.578.179.971.8-
YOLOv8nTrain78.082.485.380.2184.7
Validation74.683.084.178.6-
YOLOv9tTrain78.179.583.378.867.8
Validation75.880.582.878.1-
YOLOv9sTrain82.586.487.784.458.2
Validation81.684.687.583.1-
YOLOv10nTrain86.586.289.586.3140.7
Validation86.485.989.286.1-
RT-DETRTrain85.983.686.784.7217.8
Validation86.183.686.984.8-
YOLOv12nTrain87.385.591.586.4226.6
Validation87.685.591.586.5-
YOLOv11nTrain83.384.588.283.9183.1
Validation84.487.089.385.7-
DMN-YOLOTrain88.887.993.288.3235.3
Validation90.089.093.789.4-
Table 8. Grape leaf disease dataset.
Grape Leaf DiseasesTotal Number of SamplesNumber of Training SetsValidation Set NumberTest Set Number
Esca1107775221111
Black rot94466018896
Leaf blight86160317286
All29122038581293
Table 9. Comparative experiments on a grape leaf disease dataset.
ModelDatasetPrecision/%Recall/%mAP@50/%F1-Score/%
YOLOv11nTrain82.282.988.582.5
Validation81.982.788.581.2
DMN-YOLOTrain85.886.491.386.0
Validation85.485.991.685.6
Disclaimer/Publisher’s Note: The statements, opinions and data contained in all publications are solely those of the individual author(s) and contributor(s) and not of MDPI and/or the editor(s). MDPI and/or the editor(s) disclaim responsibility for any injury to people or property resulting from any ideas, methods, instructions or products referred to in the content.

