
Nitrate Nitrogen Quantification via Ultraviolet Absorbance: A Case Study in Agricultural and Horticultural Regions in Central China

 ,
,  ,
,  ,
,  , ,
, , 

Abstract
1. Introduction
2. Materials and Methods
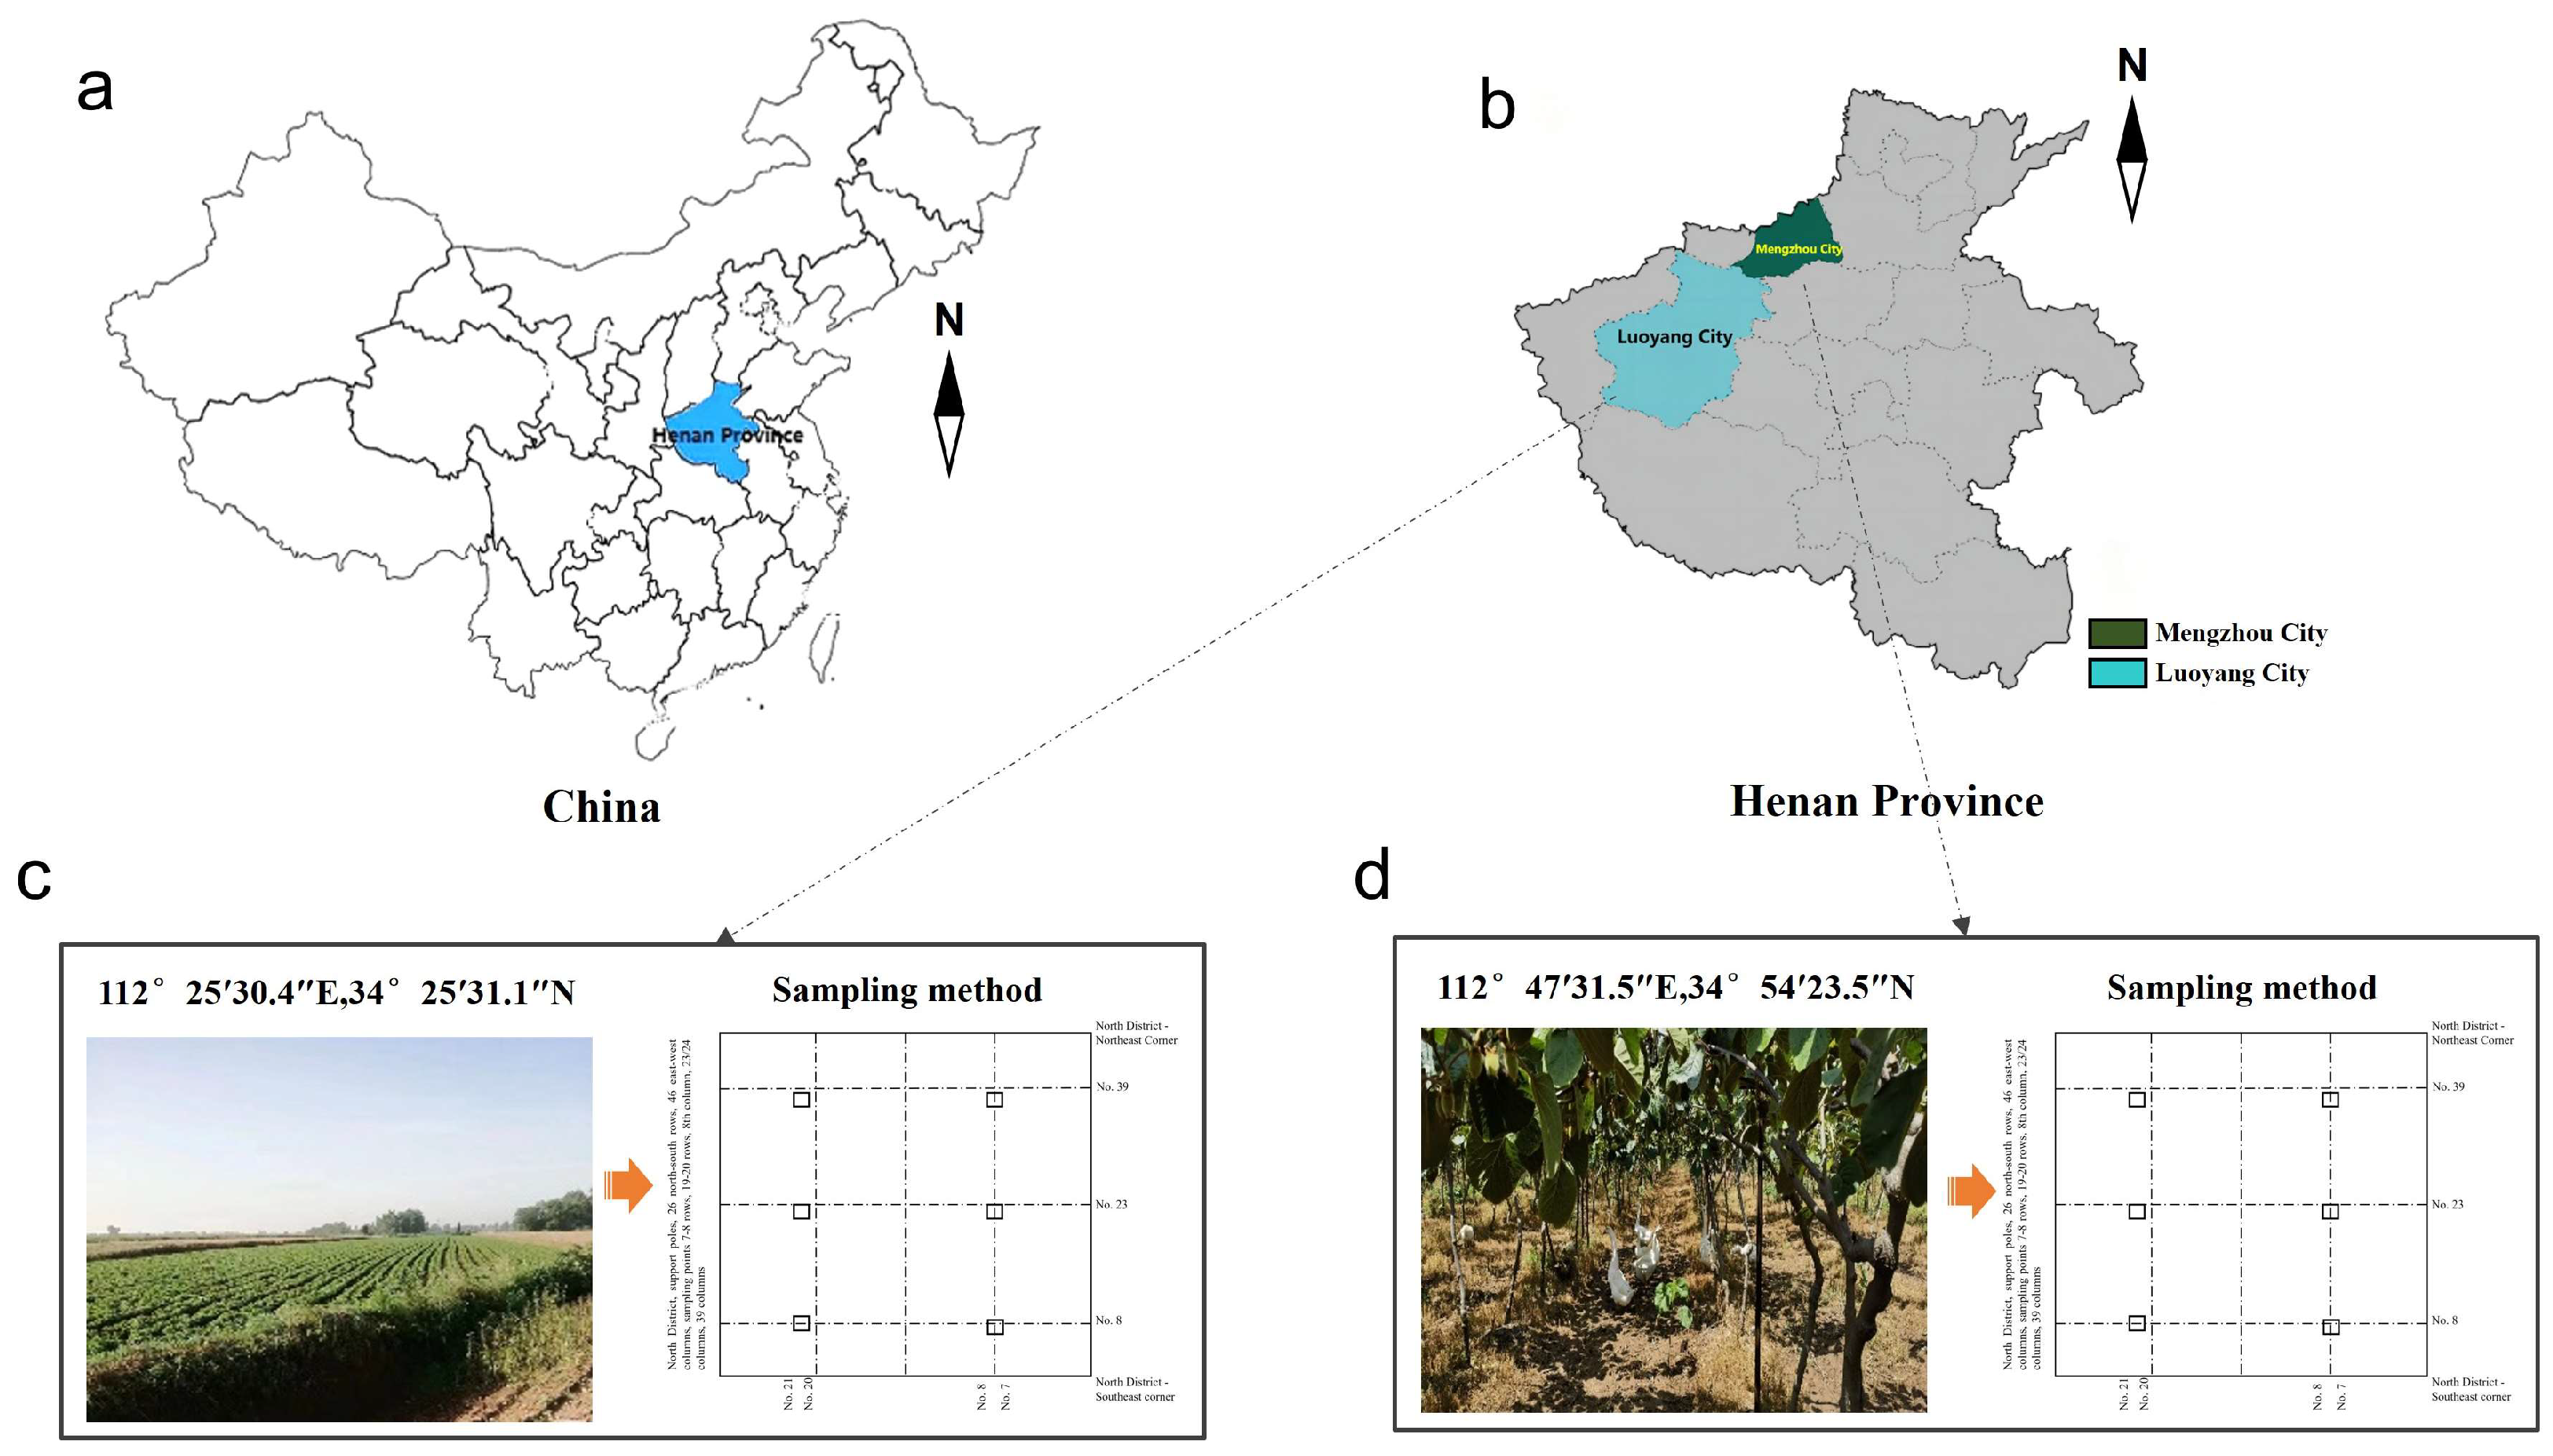
2.1. Study Area and Field Sampling
2.2. Chemical Treatment and Analysis
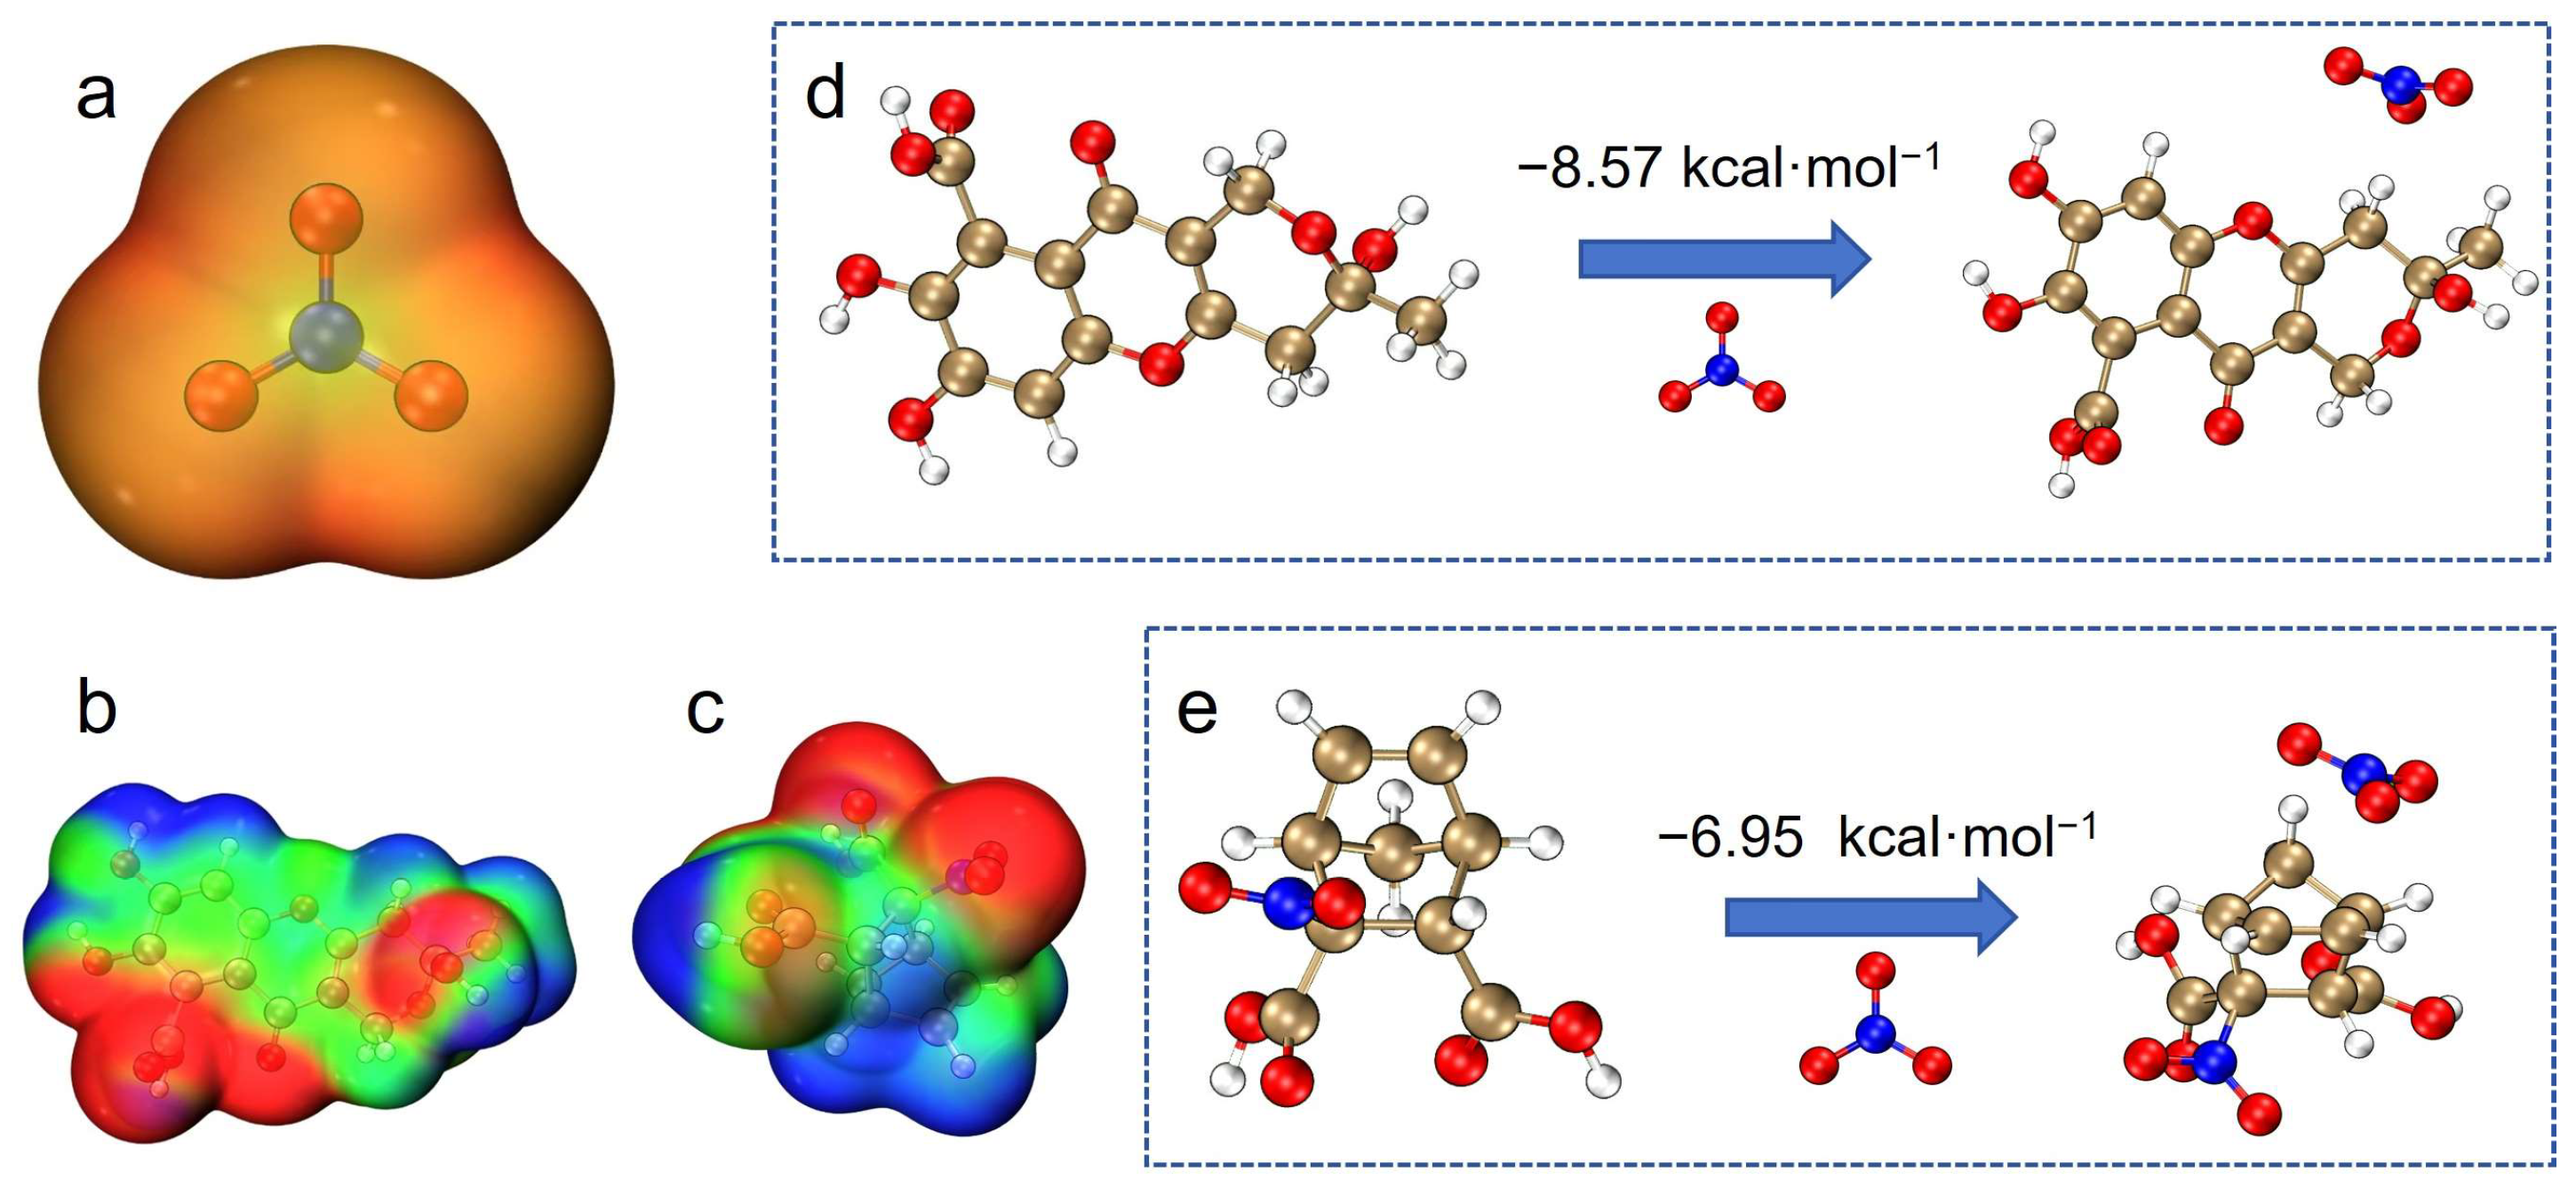
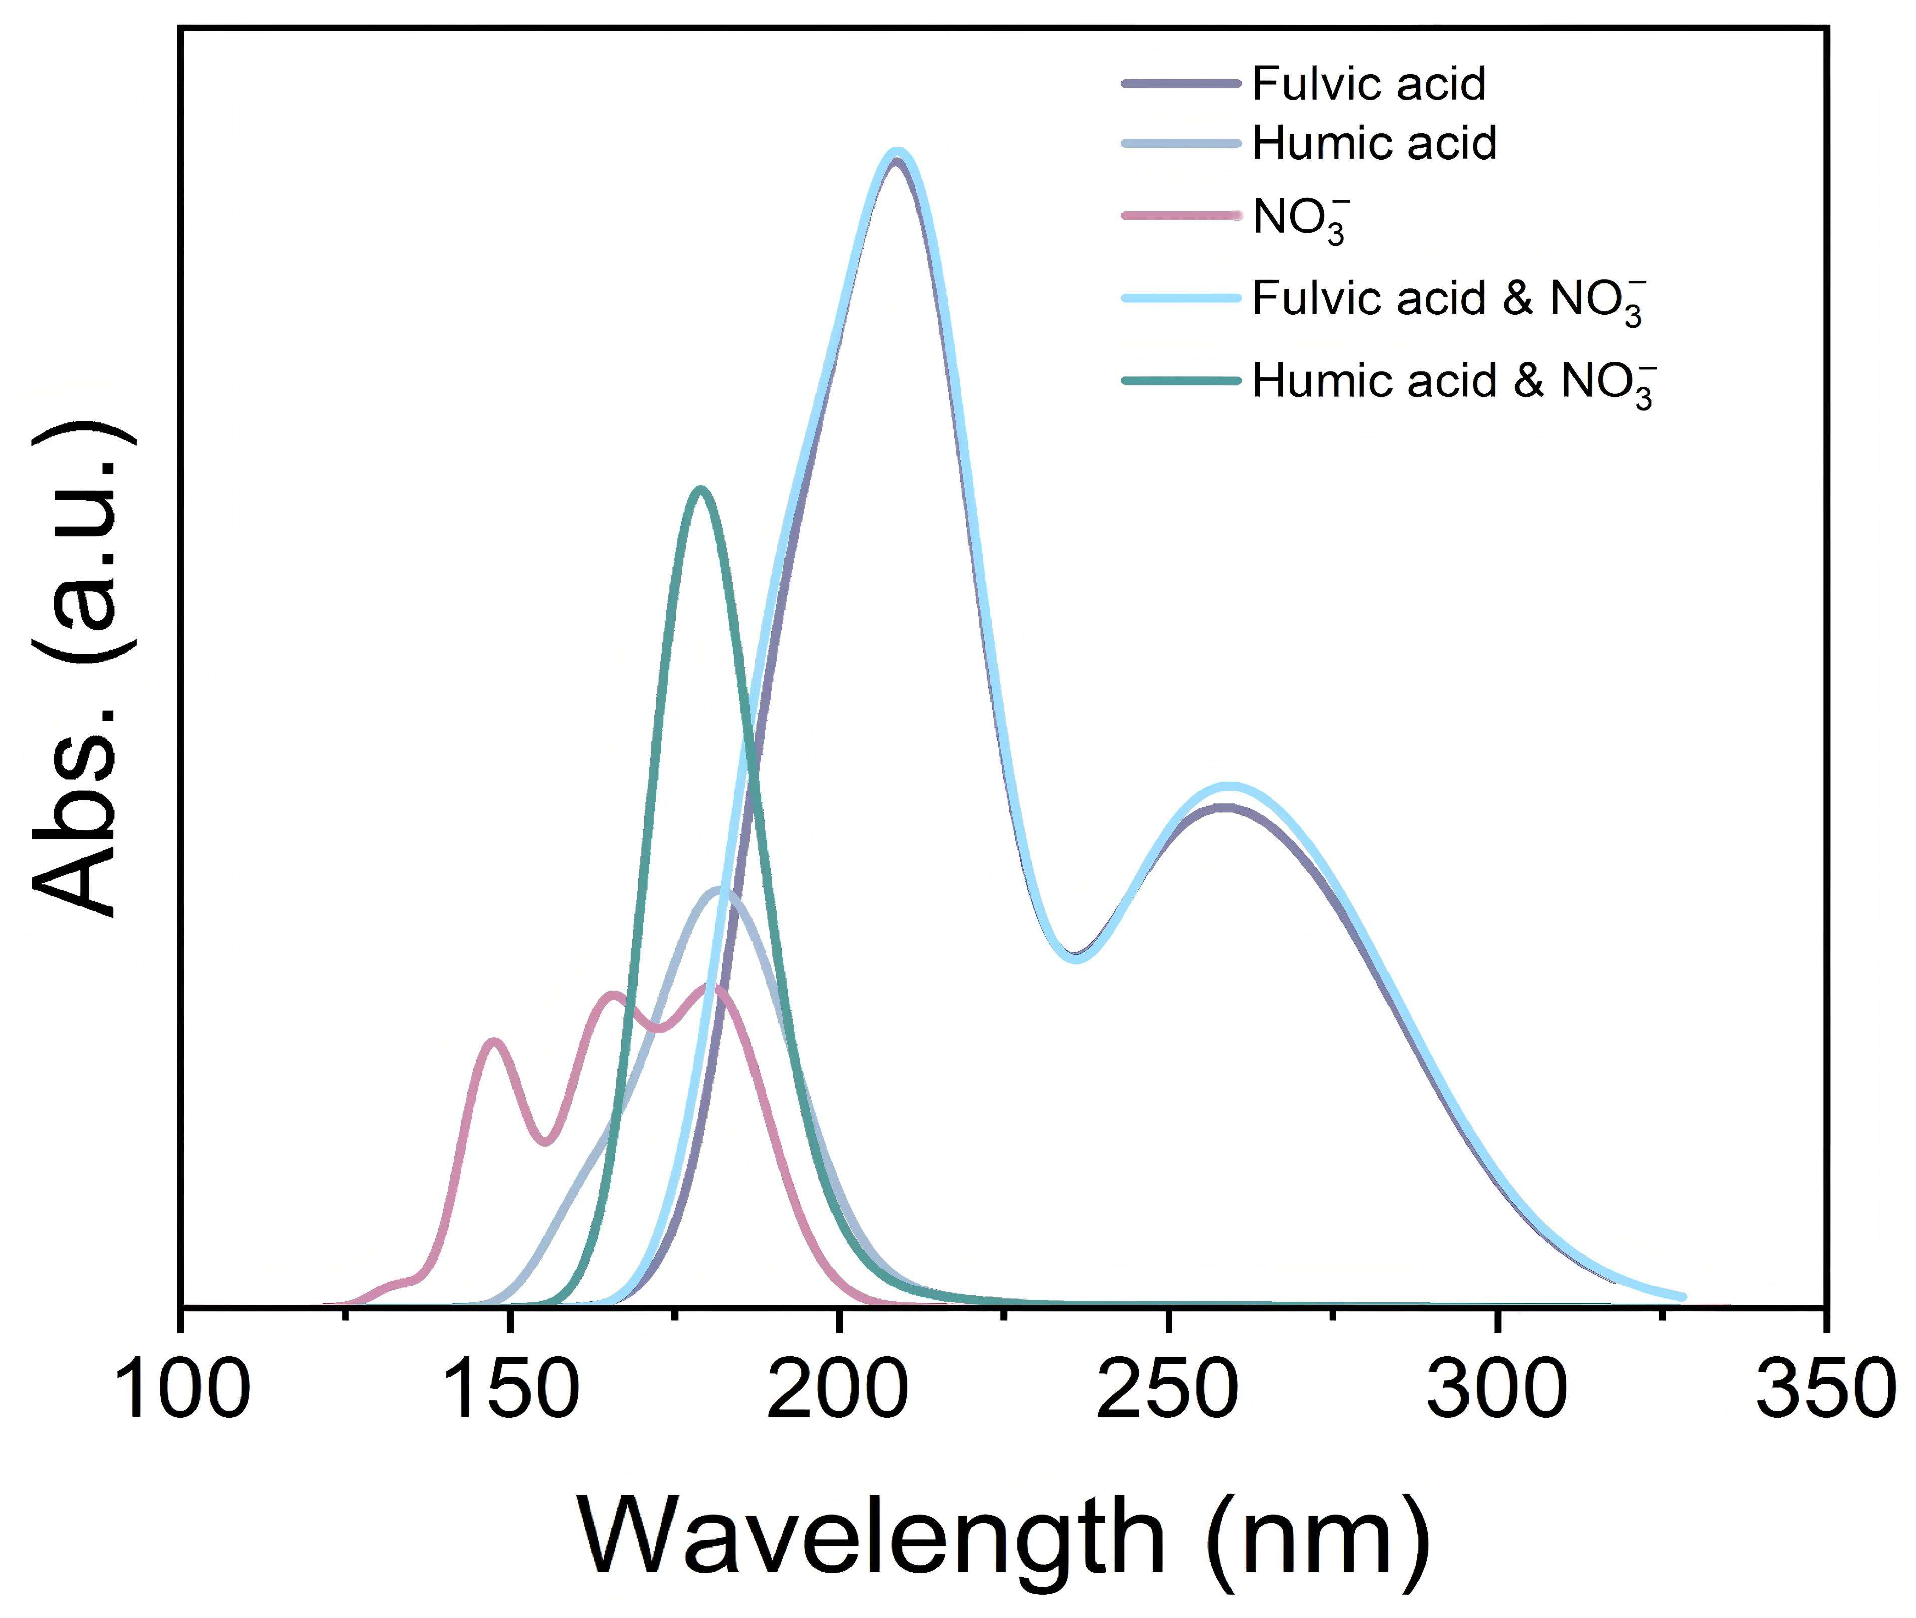
2.3. Absorption Spectrum Computation of Organic Matter and NO3−
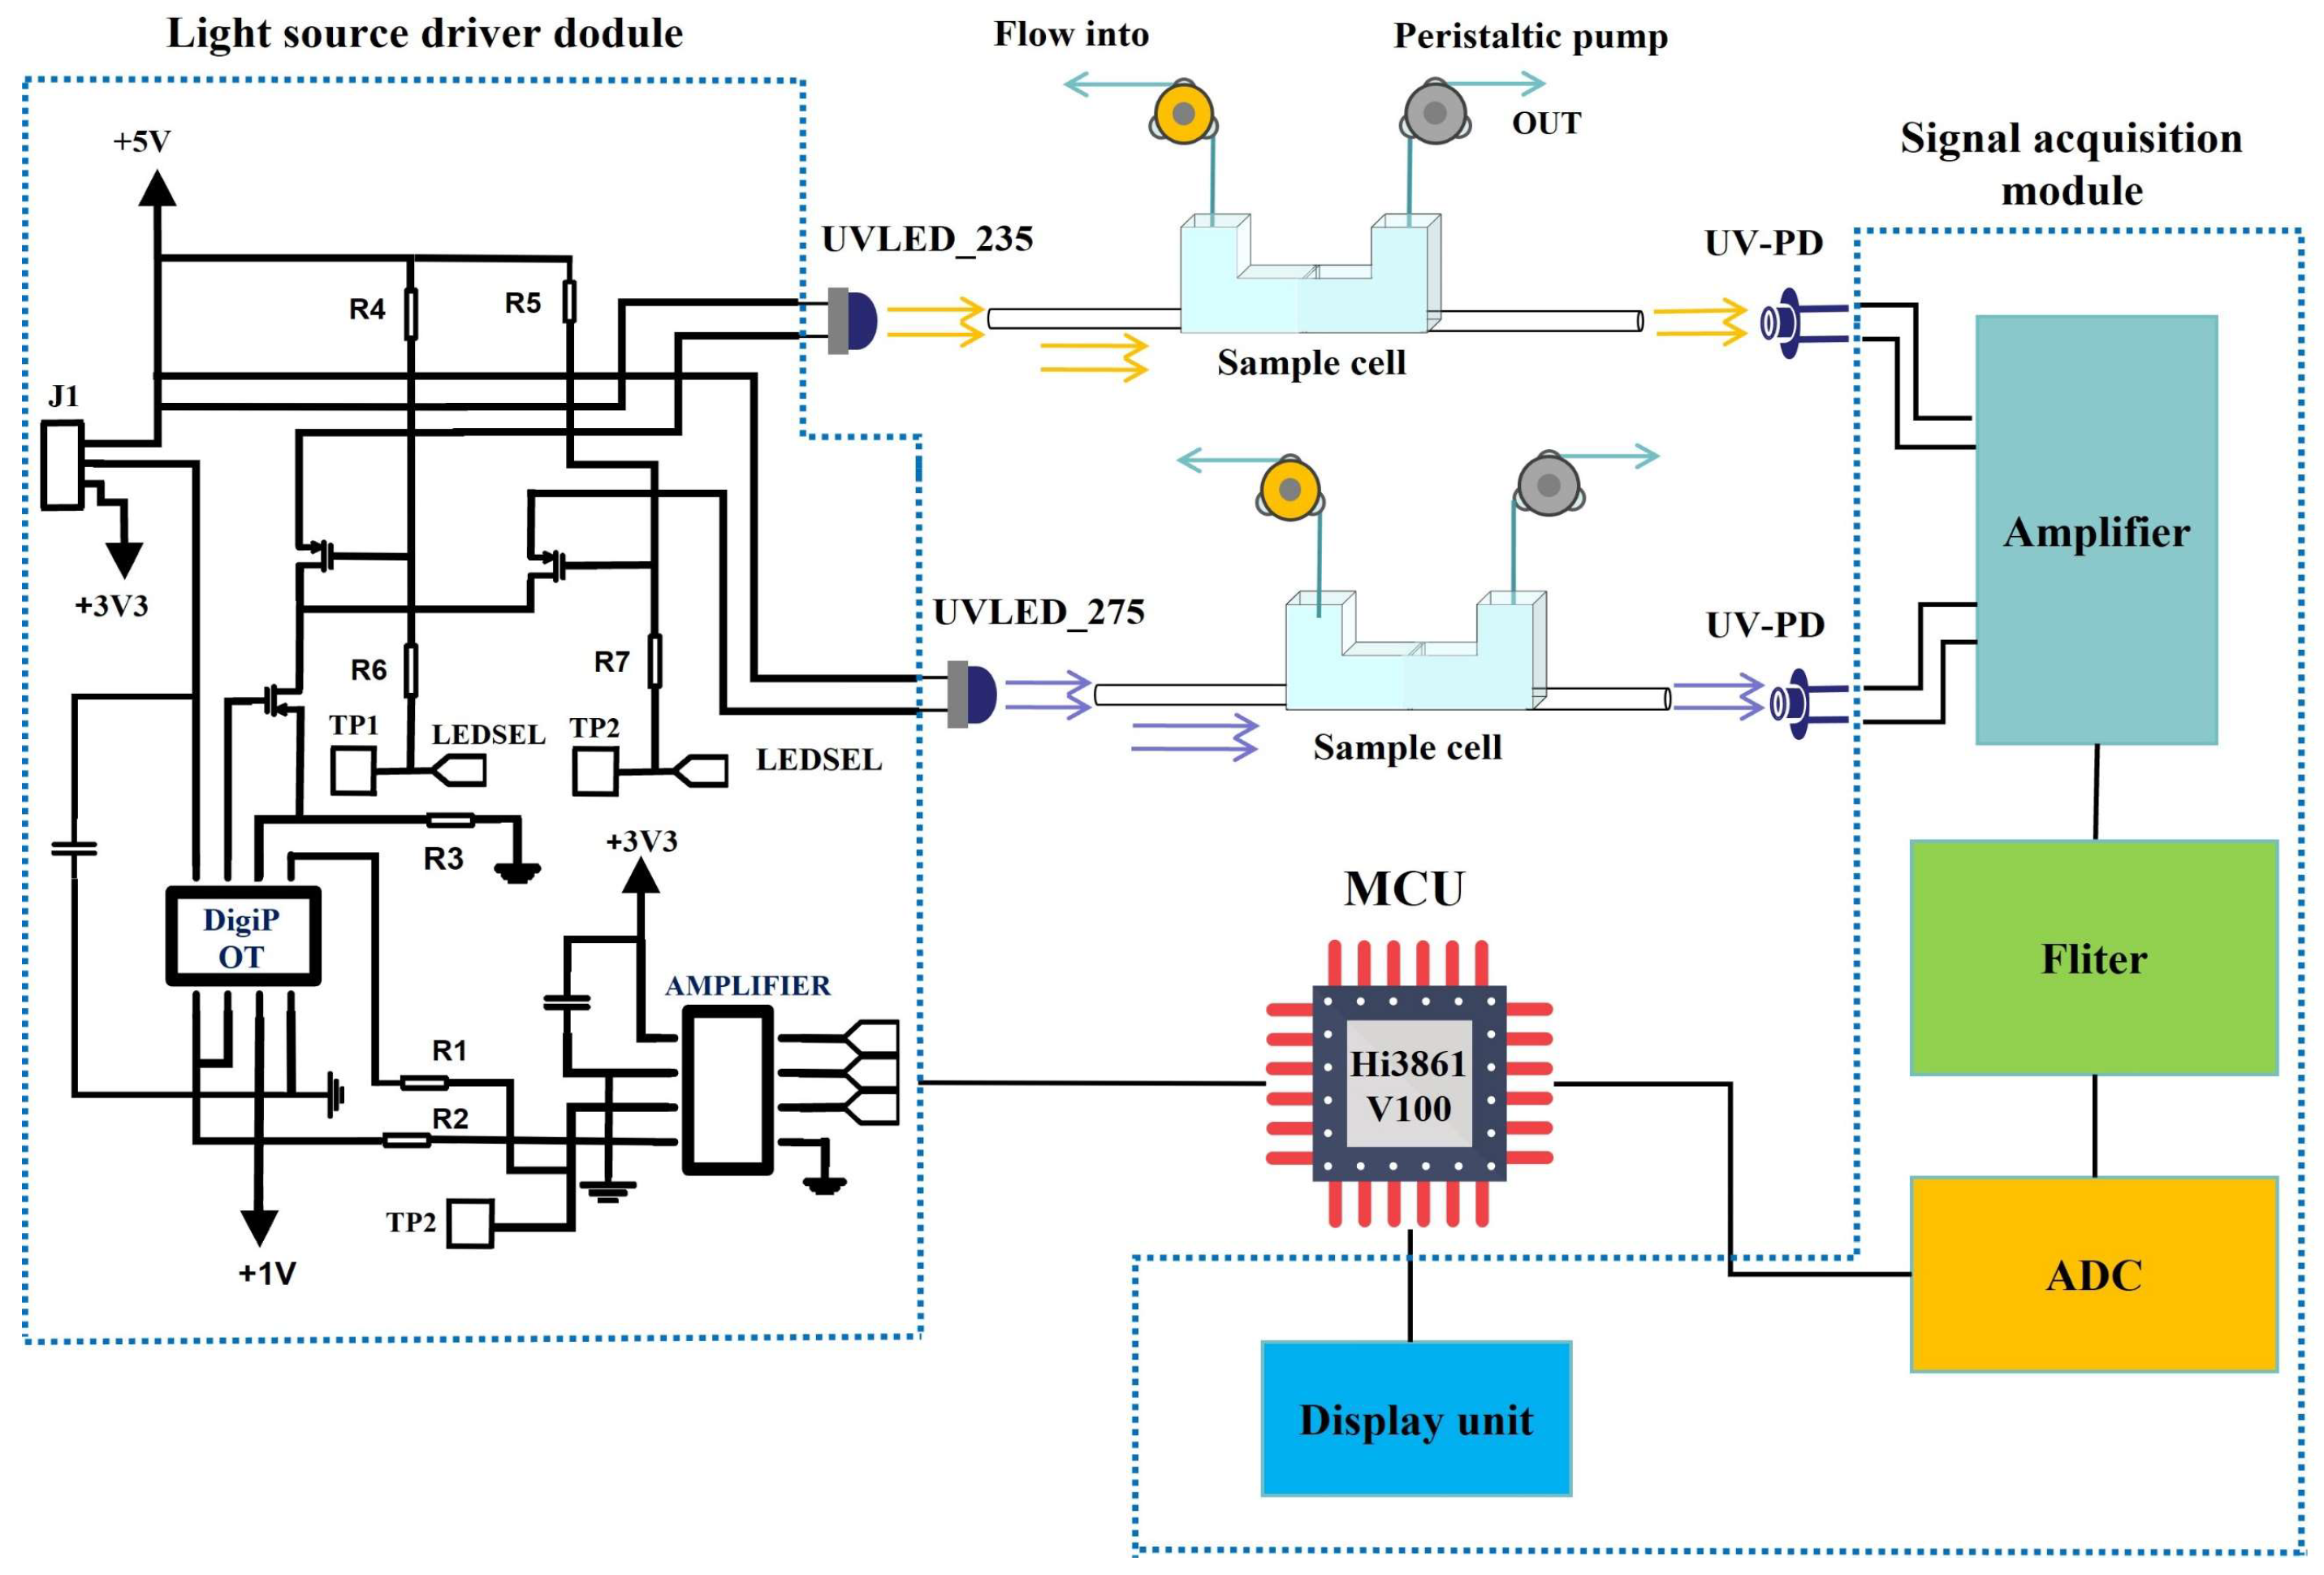
2.4. NO3−-N Measurement System Using Dual-Ultraviolet Wavelength Absorption
2.5. Statistical Analysis
3. Results
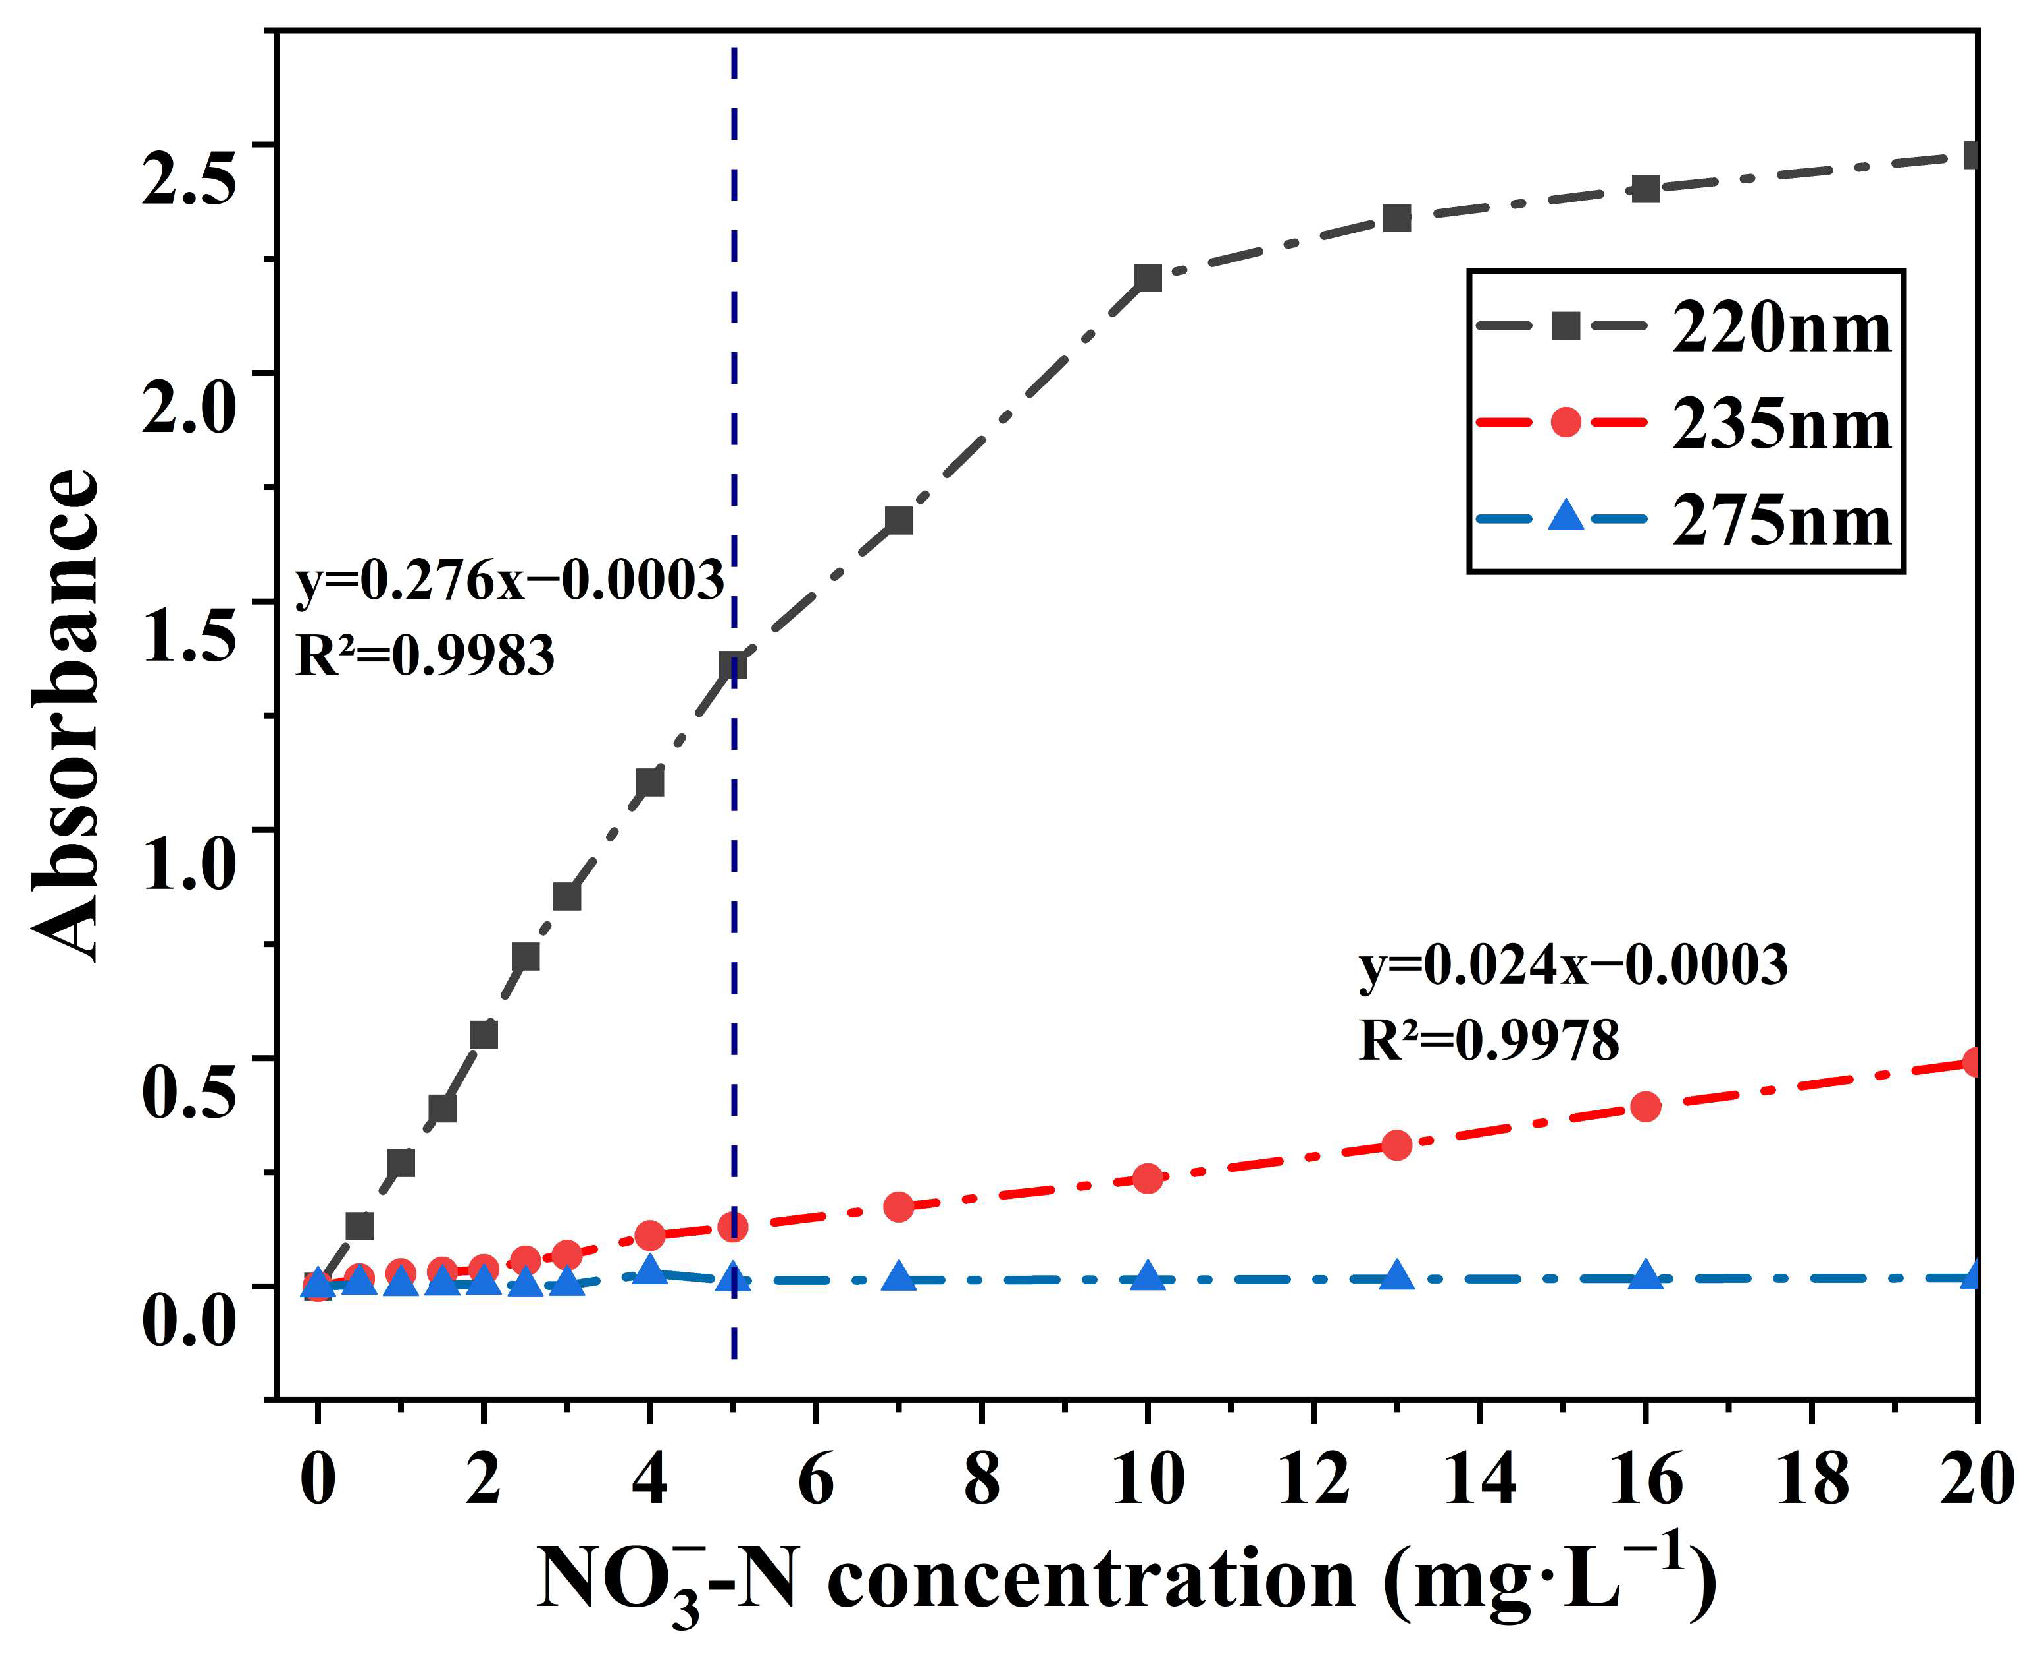
3.1. Absorbance of NO3−-N Solutions at 220 nm,235 nm, and 275 nm
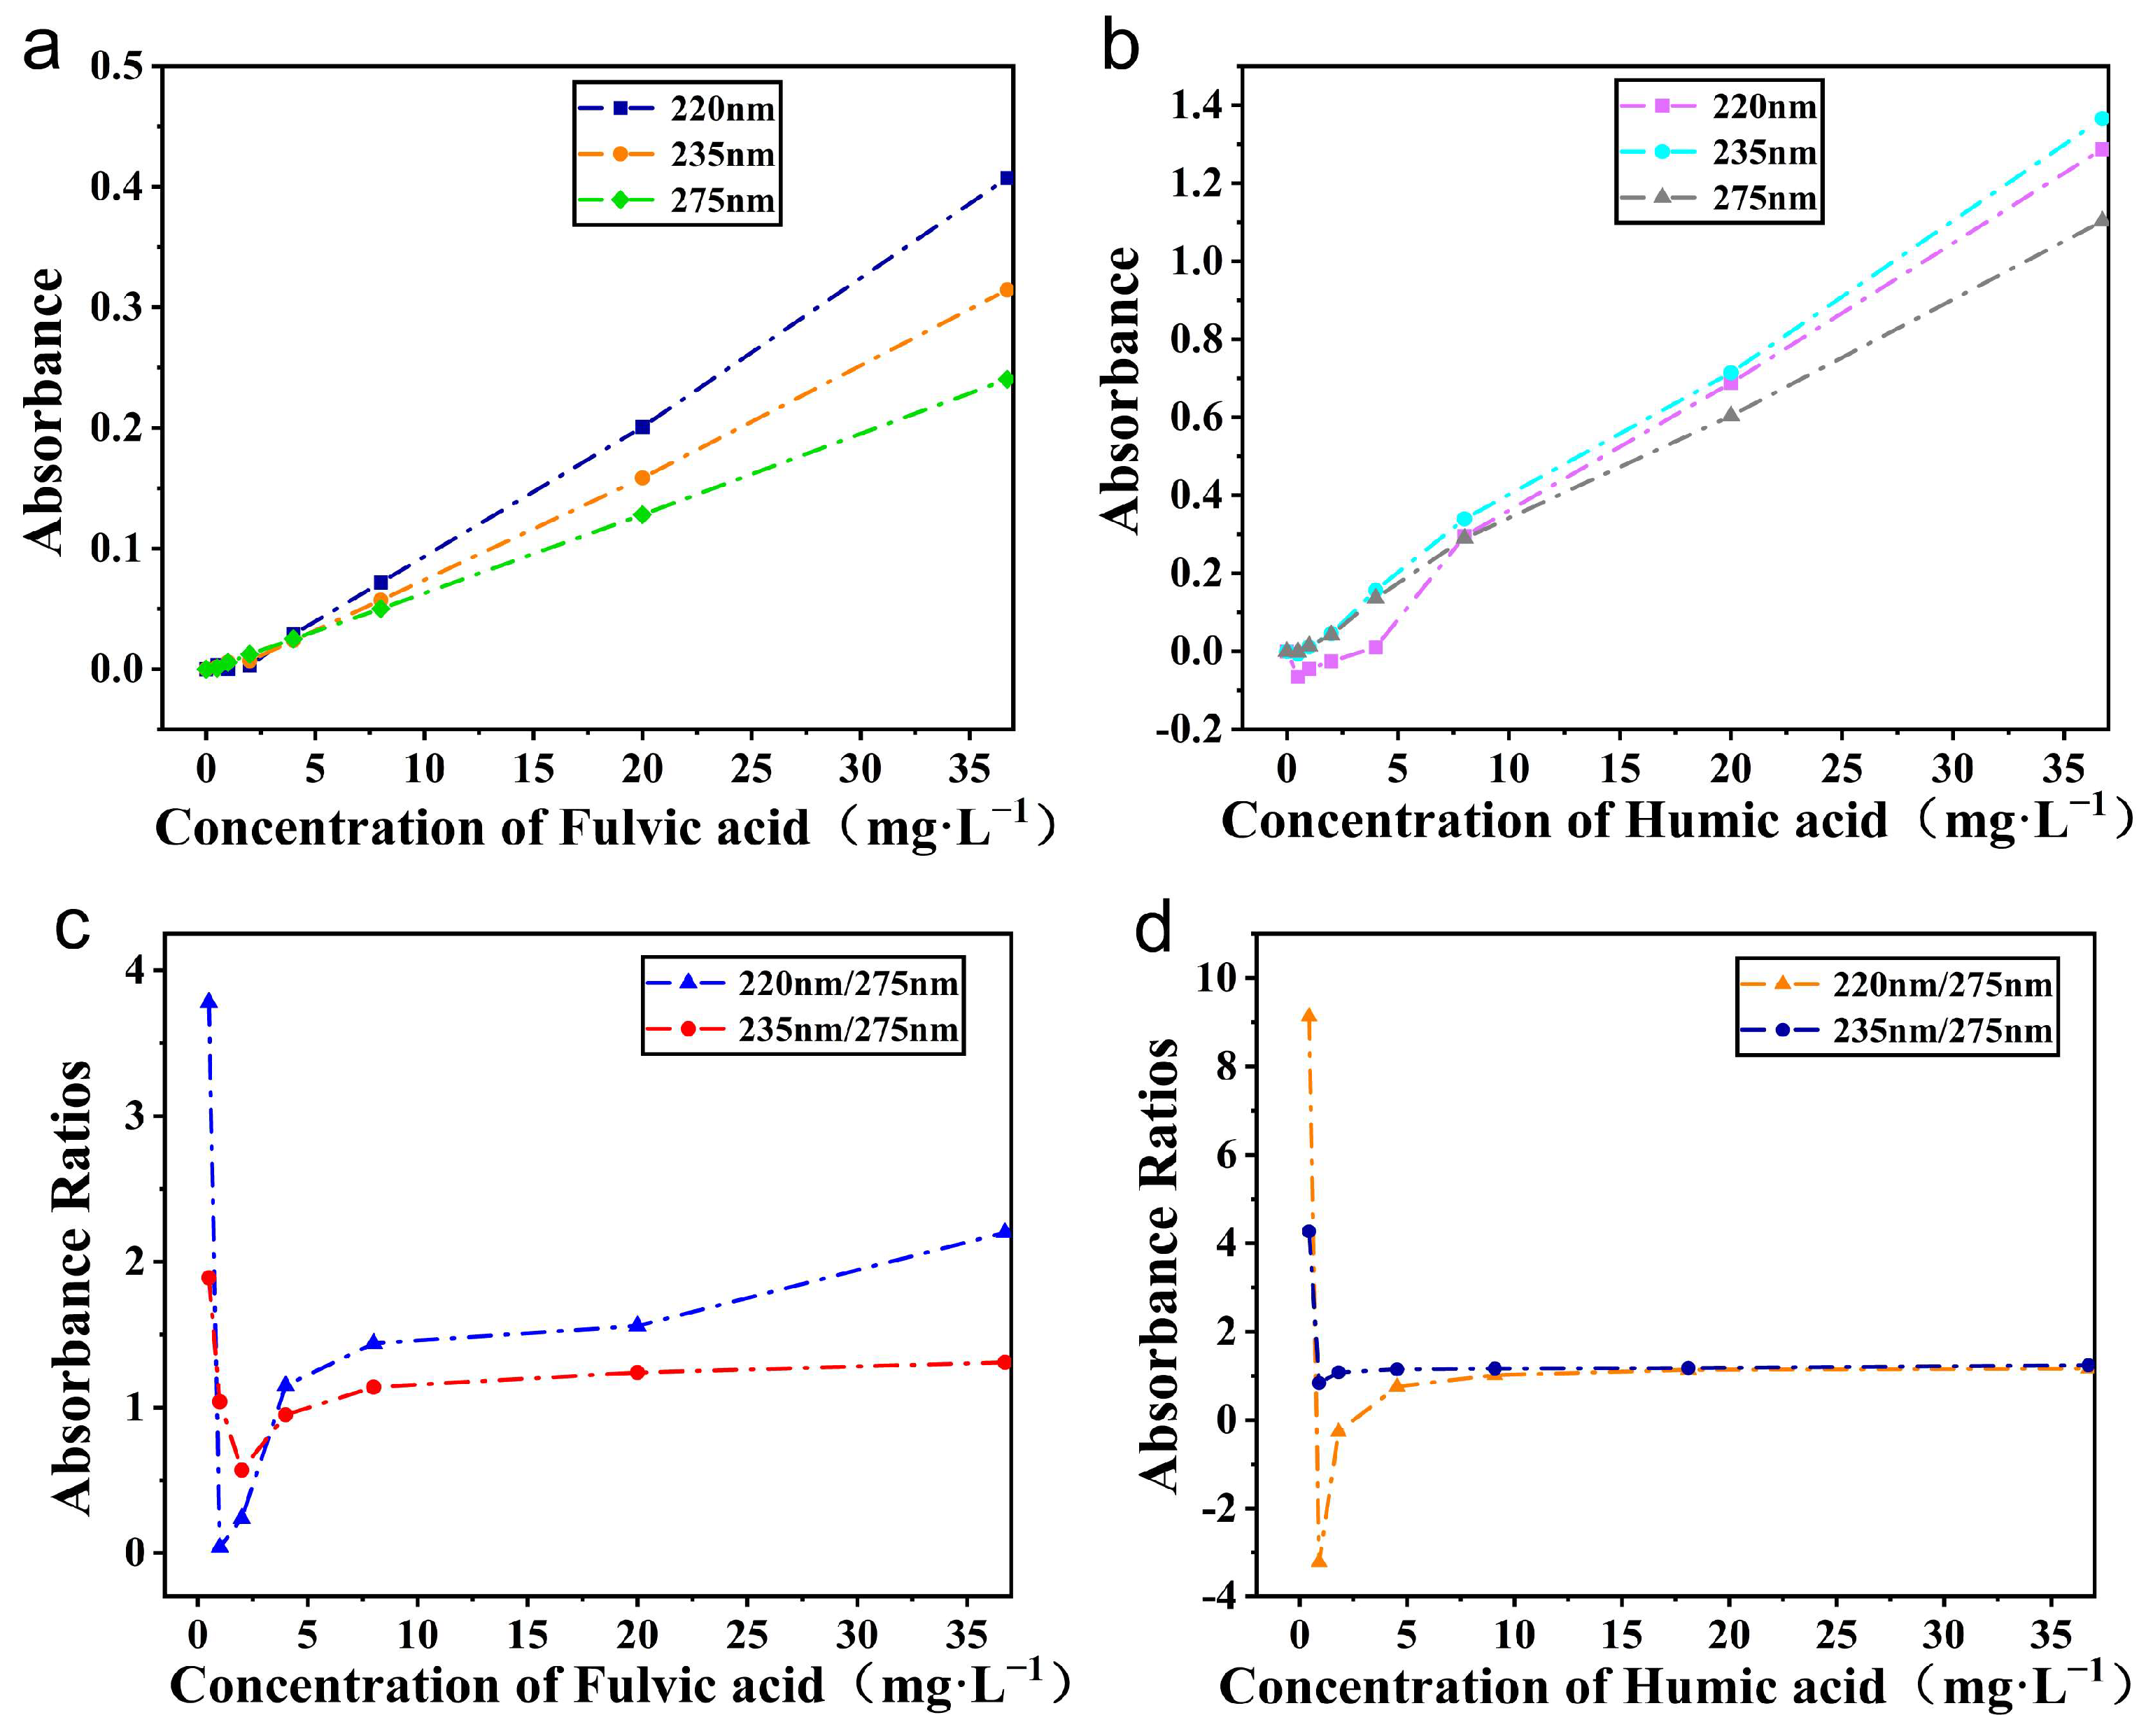
3.2. Analysis of Calibration Coefficients on Samples with Organic Matter
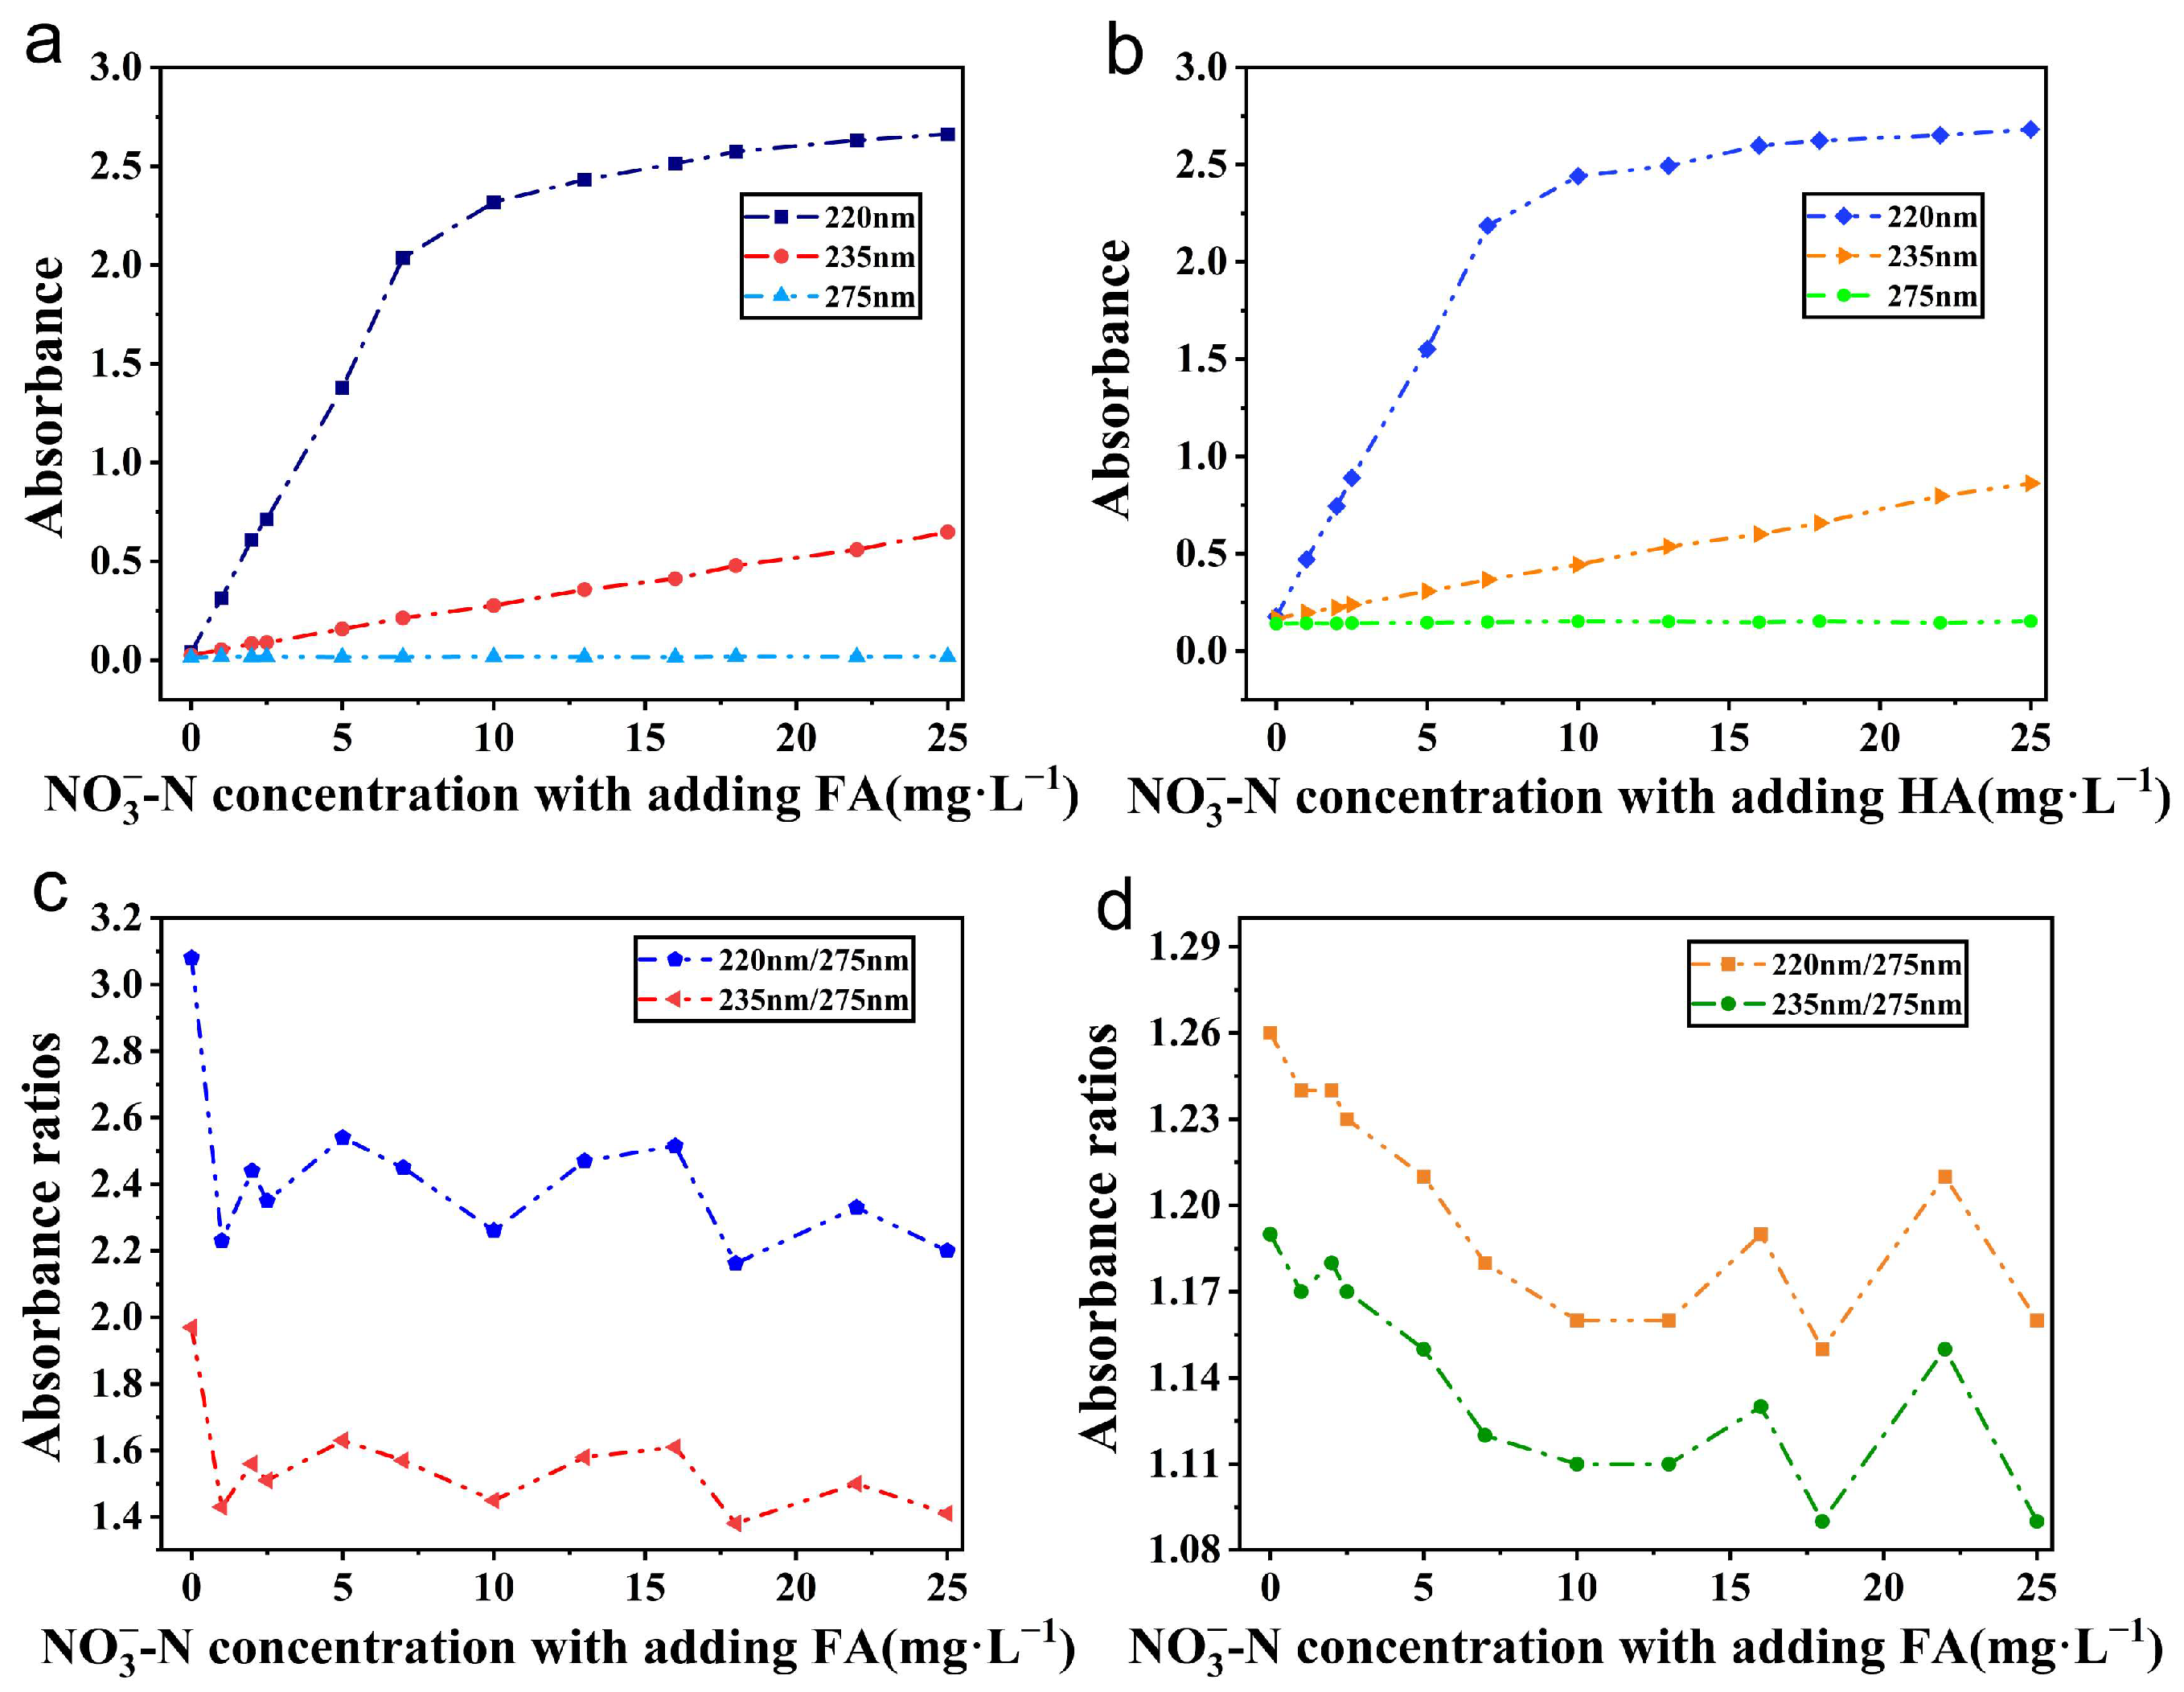
3.3. Experiment and Analysis of NO3−-N in the Samples with Adding Organic Matters
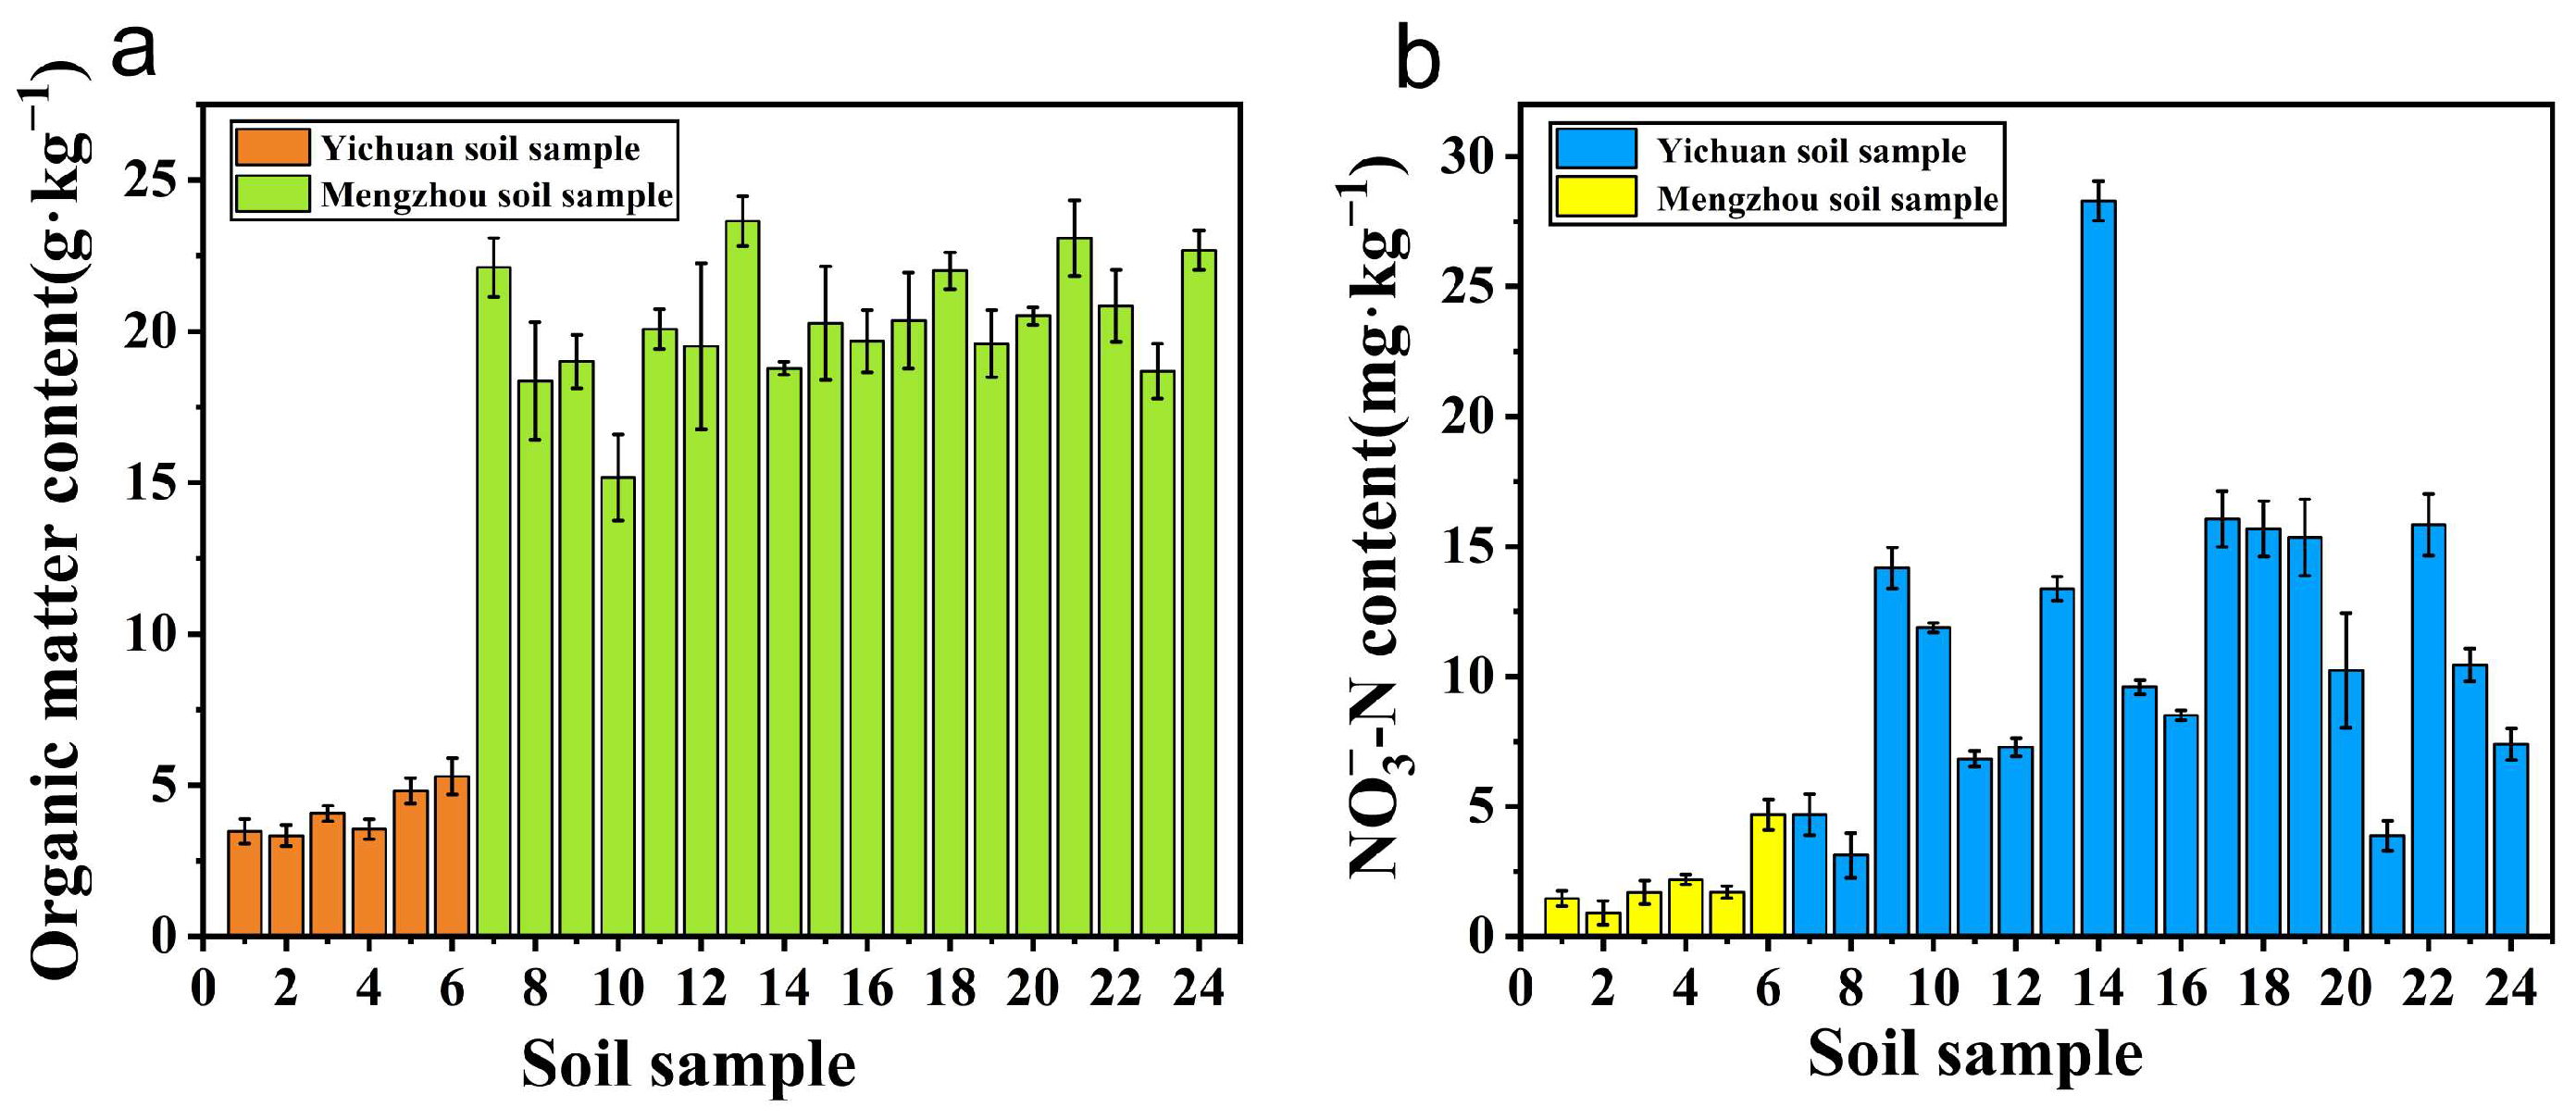
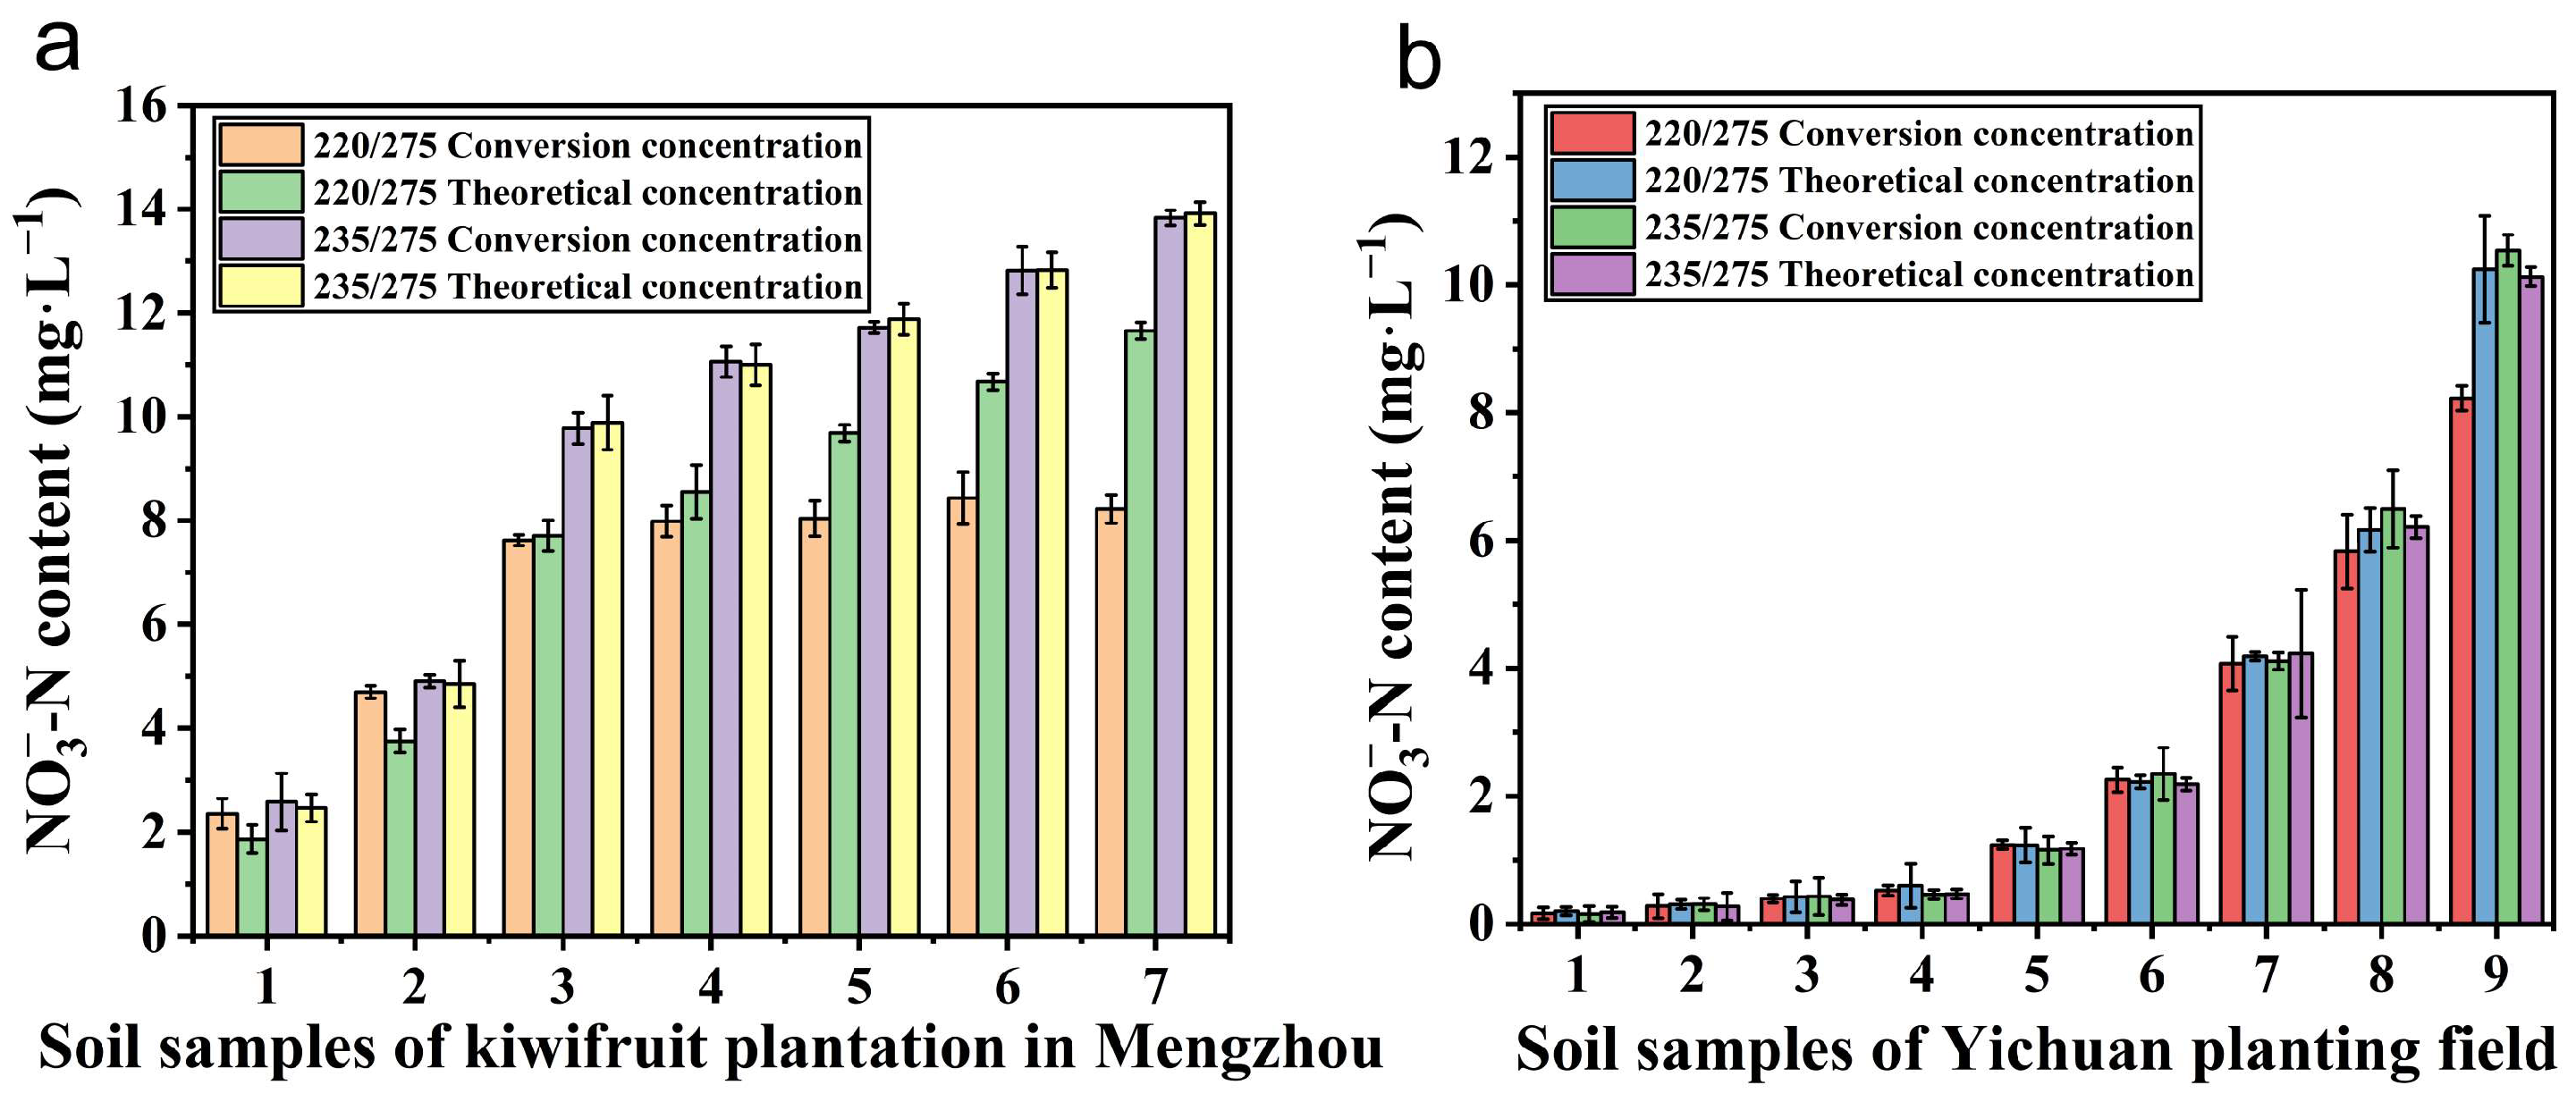
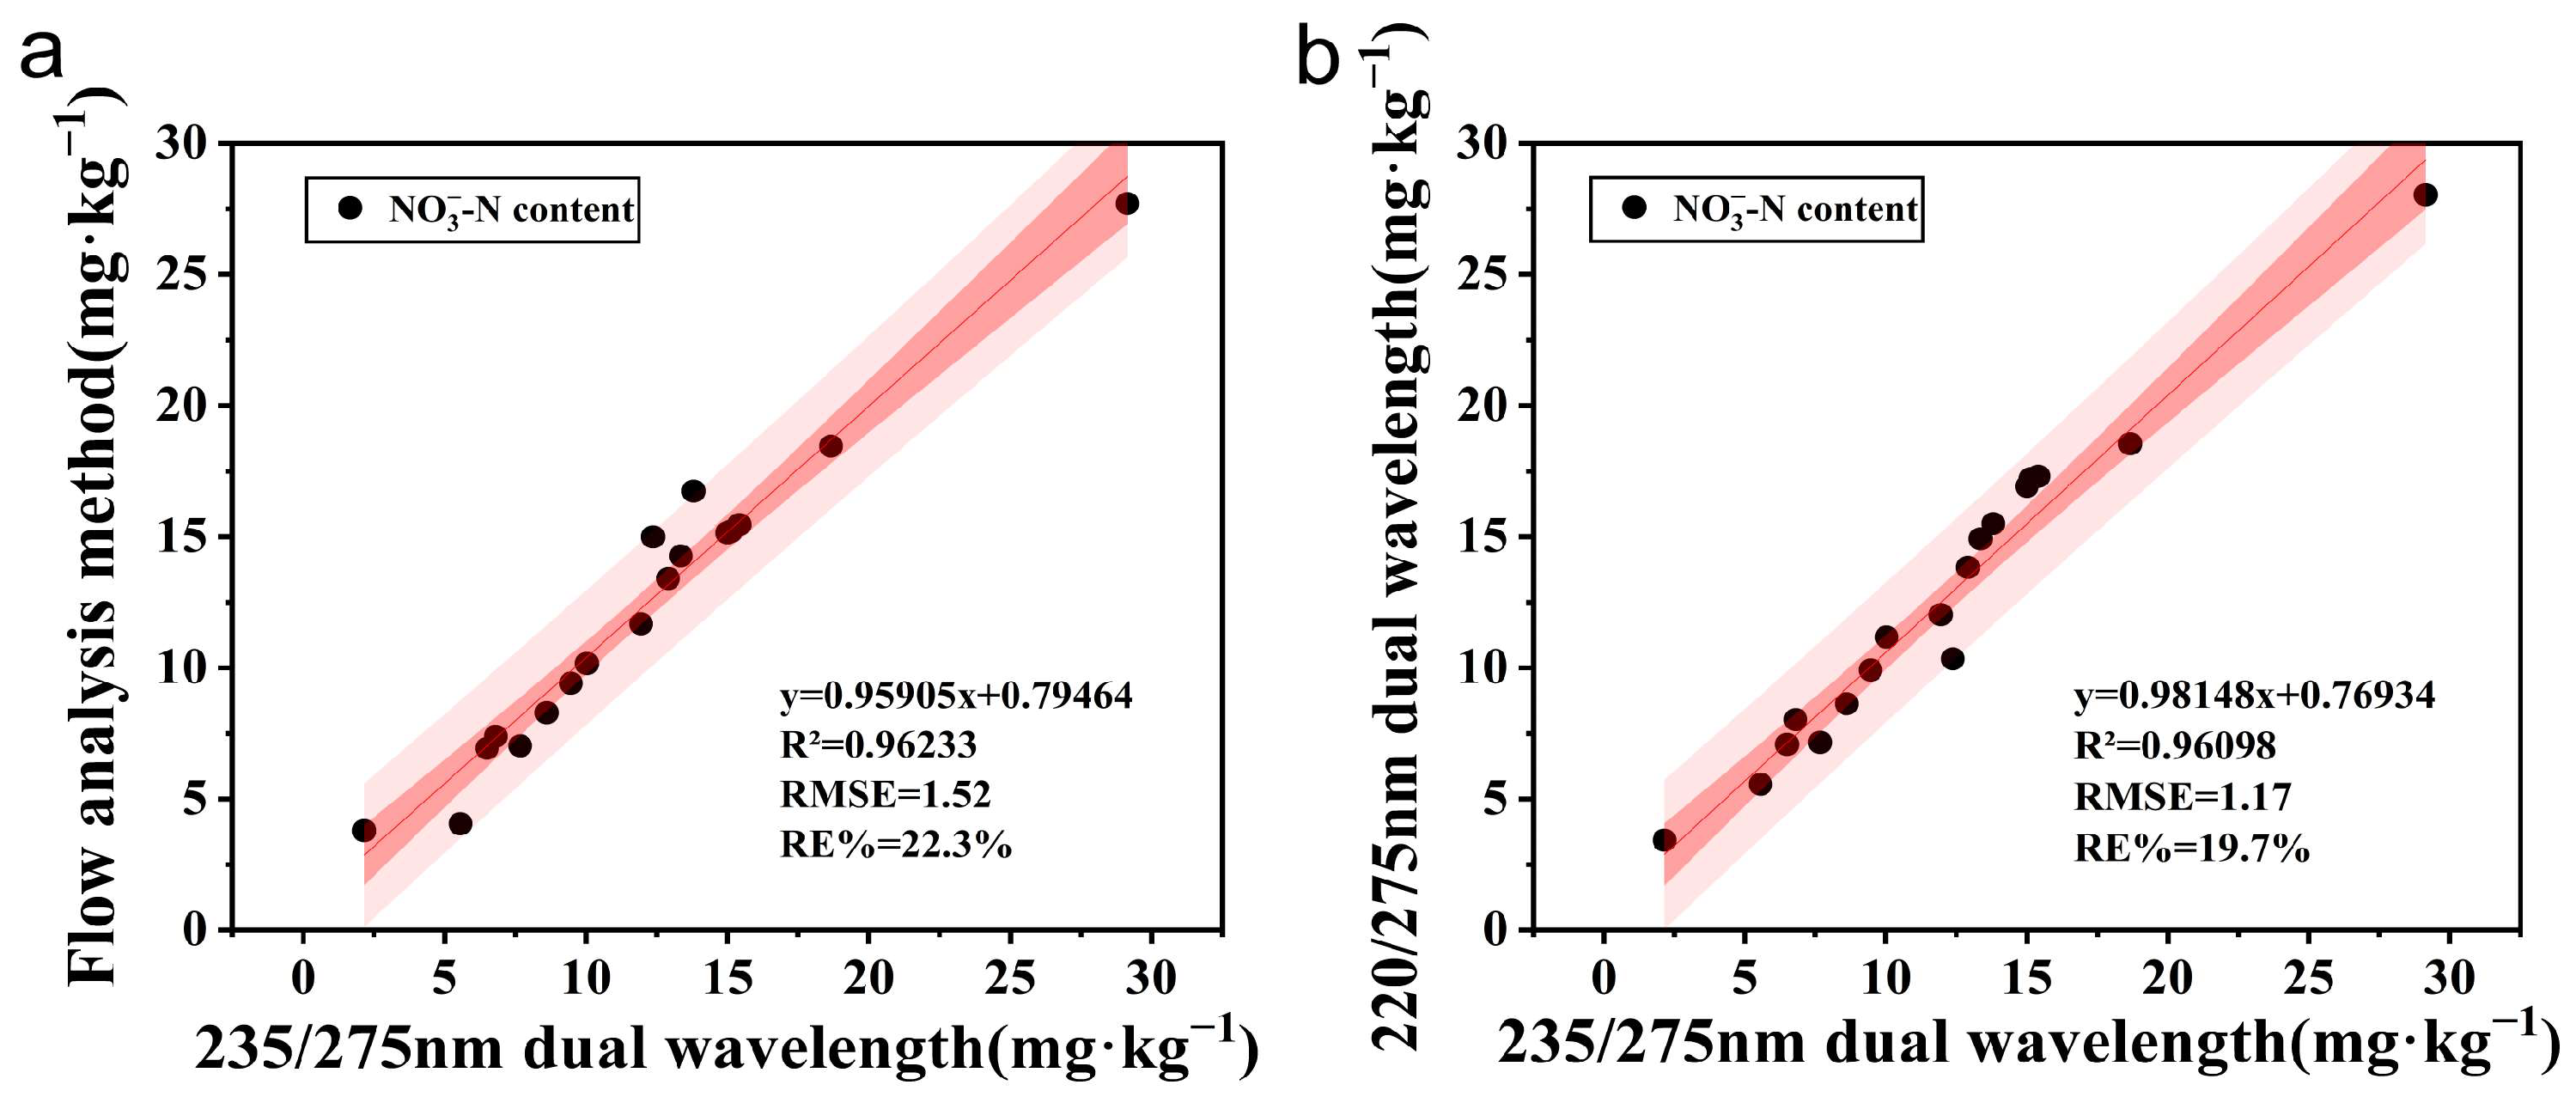
3.4. Experiments for Actual Soil Samples
4. Discussion
4.1. Influence of Different Concentrations of NO3−-N on Its Dual-Wavelength Determination
4.2. The Influence of Different Organic Matter on Its Dual-Wavelength Calibration Coefficient
4.3. Influence of NO3−-N Determination in Actual Soil and Applicability of Wavelength
5. Conclusions
Author Contributions
Funding
Institutional Review Board Statement
Data Availability Statement
Acknowledgments
Conflicts of Interest
References
- Nuruzzaman, M.; Bahar, M.M.; Naidu, R. Diffuse soil pollution from agriculture: Impacts and remediation. Sci. Total Environ. 2025, 962, 178398. [Google Scholar] [CrossRef] [PubMed]
- AbuQamar, S.F.; El-Saadony, M.T.; Saad, A.M.; Desoky, E.-S.M.; Elrys, A.S.; El-Mageed, T.A.A.; Semida, W.M.; Abdelkhalik, A.; Mosa, W.F.A.; Al Kafaas, S.S.; et al. Halotolerant plant growth-promoting rhizobacteria improve soil fertility and plant salinity tolerance for sustainable—A review. Plant Stress 2024, 12, 100482. [Google Scholar] [CrossRef]
- Dey, S.; Haripavan, N.; Basha, S.R.; Babu, G.V. Removal of ammonia and nitrates from contaminated water by using solid waste bio-adsorbents. Curr. Res. Chem. Biol. 2021, 1, 100005. [Google Scholar] [CrossRef]
- Bouselsal, B.; Satouh, A.; Egbueri, J.C.; Hashim, M.A.; Arafat, A.A.; Paramasivam, P.; Alzaed, A.; Hussein, E.E. Groundwater for drinking and sustainable agriculture and public health hazards of nitrate: Developmental and sustainability implications for an arid aquifer system. Results Eng. 2025, 25, 104160. [Google Scholar] [CrossRef]
- Wei, Q.; Wei, Q.; Xu, J.; Liu, Y.; Wang, D.; Chen, S.; Qian, W.; He, M.; Chen, P.; Zhou, X.; et al. Nitrogen losses from soil as affected by water and fertilizer management under drip irrigation: Development, hotspots and future perspectives. Agric. Water Manag. 2024, 296, 108791. [Google Scholar] [CrossRef]
- Zhao, S.; Wang, J.; Feng, S.; Xiao, Z.; Chen, C. Effects of ecohydrological interfaces on migrations and transformations of pollutants: A critical review. Sci. Total Environ. 2022, 804, 150140. [Google Scholar] [CrossRef]
- Li, W.; Siddique, M.S.; Liu, M.; Graham, N.; Yu, W. The migration and microbiological degradation of dissolved organic matter in riparian soils. Water Res. 2022, 224, 119080. [Google Scholar] [CrossRef]
- Harjung, A.; Schweichhart, J.; Rasch, G.; Griebler, C. Large-scale study on groundwater dissolved organic matter reveals a strong heterogeneity and a complex microbial footprint. Sci. Total Environ. 2023, 854, 158542. [Google Scholar] [CrossRef]
- Singh, P.; Singh, M.K.; Beg, Y.R.; Nishad, G.R. A review on spectroscopic methods for determination of nitrite and nitrate in environmental samples. Talanta 2019, 191, 364–381. [Google Scholar] [CrossRef]
- Ding, H.; Gao, H.; Zhu, M.; Yu, M.; Sun, Y.; Zheng, M.; Su, J.; Xi, B. Spectral and molecular insights into the characteristics of dissolved organic matter in nitrate-contaminated groundwater. Environ. Pollut. 2024, 355, 124202. [Google Scholar] [CrossRef]
- Yeshno, E.; Dahan, O.; Bernstain, S.; Arnon, S. A novel analytical approach for the simultaneous measurement of nitrate and dissolved organic carbon in soil water. Hydrol. Earth Syst. Sci. 2021, 25, 2159–2168. [Google Scholar] [CrossRef]
- Feng, X.; Wang, X.; Wei, Z.; Wu, M.; Ma, X.; Yan, X.; Shan, J. Depth weakens effects of long-term fertilization on dissolved organic matter chemodiversity in paddy soils. Sci. Total Environ. 2025, 959, 178237. [Google Scholar] [CrossRef] [PubMed]
- Yeshno, E.; Arnon, S.; Dahan, O. Real-time monitoring of nitrate in soils as a key for optimization of agricultural productivity and prevention of groundwater pollution. Hydrol. Earth Syst. Sci. 2019, 23, 3997–4010. [Google Scholar] [CrossRef]
- Sinfield, J.V.; Fagerman, D.; Colic, O. Evaluation of sensing technologies for on-the-go detection of macro-nutrients in cultivated soils. Comput. Electron. Agric. 2010, 70, 1–18. [Google Scholar] [CrossRef]
- Lin, K.; Pei, J.; Li, P.; Ma, J.; Li, Q.; Yuan, D. Simultaneous determination of total dissolved nitrogen and total dissolved phosphorus in natural waters with an on-line UV and thermal digestion. Talanta 2018, 185, 419–426. [Google Scholar] [CrossRef]
- Vullaganti, N.; Ram, B.G.; Sun, X. Precision agriculture technologies for soil site-specific nutrient management: A comprehensive review. Artif. Intell. Agric. 2025, 15, 147–161. [Google Scholar] [CrossRef]
- Medel-Jiménez, F.; Krexner, T.; Gronauer, A.; Kral, I. Life cycle assessment of four different precision agriculture technologies and comparison with a conventional scheme. J. Clean. Prod. 2024, 434, 140198. [Google Scholar] [CrossRef]
- Chen, R.; Chen, X.; Li, H.; Wang, J.; Guo, X. Evaluating soil water and nitrogen transport, nitrate leaching and soil nitrogen concentration uniformity under sprinkler irrigation and fertigation using numerical simulation. J. Hydrol. 2025, 647, 132345. [Google Scholar] [CrossRef]
- Bogarin Cantero, B.C.; Zhang, Y.; Davidson, P.C. Electrolysis of HTL-AP for nutrient recovery by converting cyclic nitrogen to nitrate-N fertilizer. Environ. Pollut. 2024, 363, 125069. [Google Scholar] [CrossRef]
- Kganyago, M.; Adjorlolo, C.; Mhangara, P.; Tsoeleng, L. Optical remote sensing of crop biophysical and biochemical parameters: An overview of advances in sensor technologies and machine learning algorithms for precision agriculture. Comput. Electron. Agric. 2024, 218, 108730. [Google Scholar] [CrossRef]
- Raabe, J.M.; Kurtay, G.; Fontenot, A.; Greene, S.; Martignette, A.J.; Milbrandt, E.C.; Roberts, B.J.; Stauffer, B.A. Operation and integration of a commercially available nitrate sensor in Gulf of Mexico estuarine monitoring programs. Environ. Technol. Innov. 2024, 35, 103676. [Google Scholar] [CrossRef]
- Zhuang, Y.; Wen, W.; Ruan, S.; Zhuang, F.; Xia, B.; Li, S.; Liu, H.; Du, Y.; Zhang, L. Real-time measurement of total nitrogen for agricultural runoff based on multiparameter sensors and intelligent algorithms. Water Res. 2022, 210, 117992. [Google Scholar] [CrossRef]
- Venkatesh, J.; Partheeban, P.; Baskaran, A.; Krishnan, D.; Sridhar, M. Wireless sensor network technology and geospatial technology for groundwater quality monitoring. J. Ind. Inf. Integr. 2024, 38, 100569. [Google Scholar] [CrossRef]
- Pal, A.; Dubey, S.K.; Goel, S.; Kalita, P.K. Portable sensors in precision agriculture: Assessing advances and challenges in soil nutrient determination. TrAC Trends Anal. Chem. 2024, 180, 117981. [Google Scholar] [CrossRef]
- Ravikumar, S.; Vellingiri, G.; Sellaperumal, P.; Pandian, K.; Sivasankar, A.; Sangchul, H. Real-time nitrogen monitoring and management to augment N use efficiency and ecosystem sustainability—A review. J. Hazard. Mater. Adv. 2024, 16, 100466. [Google Scholar] [CrossRef]
- Causse, J.; Thomas, O.; Jung, A.V.; Thomas, M.F. Direct DOC and nitrate determination in water using dual pathlength and second derivative UV spectrophotometry. Water Res. 2017, 108, 312–319. [Google Scholar] [CrossRef] [PubMed]
- Liang, H.; Lv, H.; Batchelor, W.D.; Lian, X.; Wang, Z.; Lin, S.; Hu, K. Simulating nitrate and DON leaching to optimize water and N management practices for greenhouse vegetable production systems. Agric. Water Manag. 2020, 241, 106377. [Google Scholar] [CrossRef]
- Fu, Y.; Li, W.; Li, H.; Huang, M. High-precision and on-line measurement of dissolved organic matter in Electro-Fenton process based on dual wavelength analysis with combination of fluorescence emission and ultraviolet absorption spectroscopy. Anal. Chim. Acta 2021, 1181, 338904. [Google Scholar] [CrossRef]
- Arai, R.; Sakai, T.; Nishida, Y.; Inada, M. In situ temperature-compensated ultraviolet spectrophotometry to estimate nitrate and chloride concentrations in estuarine seawater with different salinity and composition. J. Environ. Manag. 2023, 344, 118689. [Google Scholar] [CrossRef]
- Chu, W.; Yuan, L.; Huang, R.; Huang, D.; Zhuang, Y.; Ma, W.; Tian, M. Determination of glycyrrhizic acid as sweeteners by dual-wavelength overlapping resonance Rayleigh scattering. Microchem. J. 2024, 202, 110748. [Google Scholar] [CrossRef]
- Miao, J.; Li, F.; Zhang, J.; Wei, B.; Ji, Y.; Yang, H. Optimization of Correction Factor of Soil Nitrate Nitrogen by Ultraviolet Spectrophotometry. Acta Agric. Boreali-Sin. 2019, 34, 204–212. [Google Scholar] [CrossRef]
- Kafle, B.P. Chapter 5—Application of UV–VIS spectrophotometry for chemical analysis. In Chemical Analysis and Material Characterization by Spectrophotometry; Elsevier: Amsterdam, The Netherlands, 2020; pp. 79–145. [Google Scholar] [CrossRef]
- Hu, H.; Tang, B.; Wan, H.; Sun, H.; Zhou, S.; Dai, J.; Chen, C.; Liu, S.; Guo, L.J. Boosted ultraviolet electroluminescence of InGaN/AlGaN quantum structures grown on high-index contrast patterned sapphire with silica array. Nano Energy 2020, 69, 104427. [Google Scholar] [CrossRef]
- Mukunda, D.C.; Joshi, V.K.; Mahato, K.K. Light emitting diodes (LEDs) in fluorescence-based analytical applications: A review. Appl. Spectrosc. Rev. 2022, 57, 1–38. [Google Scholar] [CrossRef]
- Natarajan, K.; Dave, S.; Bajaj, H.C.; Tayade, R.J. Enhanced photocatalytic degradation of nitrobenzene using MWCNT/β-ZnMoO4 composites under UV light emitting diodes (LEDs). Mater. Today Chem. 2020, 17, 100331. [Google Scholar] [CrossRef]
- Han, Y.-Z.; Tian, Y.-C.; Ji, W.-X.; Li, W.-B.; Xue, X.-F.; Dong, Y.-Q.; Guan, C.-Y.; Zhou, D.; Li, W.-T.; Lu, H.; et al. Development and application of the UVC LED-based spectrophotometer for high frequency online monitoring of nitrate concentration in municipal wastewater. Sens. Actuators B Chem. 2024, 403, 135178. [Google Scholar] [CrossRef]
- Li, Y.; Dvořák, M.; Nesterenko, P.N.; Nuchtavorn, N.; Macka, M. High power deep UV-LEDs for analytical optical instrumentation. Sens. Actuators B Chem. 2018, 255, 1238–1243. [Google Scholar] [CrossRef]
- Hamel, P.; Ding, N.; Cherqui, F.; Zhu, Q.; Walcker, N.; Bertrand-Krajewski, J.-L.; Champrasert, P.; Fletcher, T.D.; McCarthy, D.T.; Navratil, O.; et al. Low-cost monitoring systems for urban water management: Lessons from the field. Water Res. X 2024, 22, 100212. [Google Scholar] [CrossRef]
- Dong, Q.-y.; Wen, H.-t.; Wang, P.; Song, C.; Lai, S.-y.; Yang, Z.-j.; Zhao, Y.-y.; Yan, M.-j. Health risk assessment of heavy metals in soils and crops in a mining area (Au-Ag-Cu-trona-oil et al.) of the Nanyang Basin, Henan Province, China. China Geol. 2023, 6, 567–579. [Google Scholar] [CrossRef]
- Ran, S.; He, T.; Zhou, X.; Yin, D. Effects of fulvic acid and humic acid from different sources on Hg methylation in soil and accumulation in rice. J. Environ. Sci. 2022, 119, 93–105. [Google Scholar] [CrossRef]
- Varma, K.; Jha, P.K.; Mukherjee, S.; Singhal, A.; Kumar, M. Provenances, preponderances, and distribution of humic acids and organic pollutants in hydro-geosphere: The co-existence, interaction and isotopic biomarkers in the riverine ecosystem. J. Environ. Manag. 2022, 313, 114996. [Google Scholar] [CrossRef]
- Bagherifam, S.; Brown, T.C.; Bagherifam, S.; Baglieri, A. Sequential extraction of labile and recalcitrant fractions of soil organic matter: A case study focusing on antimony (Sb) in humic acids, fulvic acids and humin fractions of long-term aged contaminated soils. Environ. Pollut. 2023, 327, 121610. [Google Scholar] [CrossRef] [PubMed]
- Kou, B.; Hui, K.; Miao, F.; He, Y.; Qu, C.; Yuan, Y.; Tan, W. Differential responses of the properties of soil humic acid and fulvic acid to nitrogen addition in the North China Plain. Environ. Res. 2022, 214, 113980. [Google Scholar] [CrossRef] [PubMed]
- Frisch, M.; Trucks, G.; Schlegel, H.B.; Scuseria, G.E.; Robb, M.; Cheeseman, J.R.; Scalmani, G.; Barone, V.; Petersson, G.A.; Nakatsuji, H.; et al. Gaussian 16 Revision A.03; Gaussian: Wallingford, CT, USA, 2016. [Google Scholar]
- Lu, T.; Chen, F.W. Multiwfn: A multifunctional wavefunction analyzer. J. Comput. Chem. 2012, 33, 580–592. [Google Scholar] [CrossRef]
- Humphrey, W.; Dalke, A.; Schulten, K. VMD: Visual molecular dynamics. J. Mol. Graph. 1996, 14, 33–38. [Google Scholar] [CrossRef]
- Wenzel, T.J. Douglas A. Skoog, Donald M. West, F. James Holler, and Stanley R. Crouch: Fundamentals of analytical chemistry, 9th ed., international ed. Anal. Bioanal. Chem. 2013, 405, 7903–7904. [Google Scholar] [CrossRef]
- Cai, M.H.; Tian, Y.C.; Li, A.M.; Li, Y.; Han, Y.Z.; Ji, W.X.; Zhou, Q.; Li, J.; Li, W.T. Unraveling the evolution of dissolved organic matter in full-scale A/A/O wastewater treatment process using size exclusion chromatography with PARAFAC and nonnegative matrix factorization analysis. Water Res. 2023, 235, 119879. [Google Scholar] [CrossRef] [PubMed]
- Silva, M.F.; Bermejo de Lima, L.; de Camargo, C.; Telles Benatti, C. Usability of simplified UV–Vis spectrophotometric methods for the determination of nitrate in the presence of organic matter and chloride as interfering factors. Water Pract. Technol. 2024, 19, 1061–1070. [Google Scholar] [CrossRef]
- Huebsch, M.; Grimmeisen, F.; Zemann, M.; Fenton, O.; Richards, K.G.; Jordan, P.; Sawarieh, A.; Blum, P.; Goldscheider, N. Technical Note: Field experiences using UV/VIS sensors for high-resolution monitoring of nitrate in groundwater. Hydrol. Earth Syst. Sci. 2015, 19, 1589–1598. [Google Scholar] [CrossRef]
- Li, Y.; Nesterenko, P.N.; Paull, B.; Stanley, R.; Macka, M. Performance of a New 235 nm UV-LED-Based On-Capillary Photometric Detector. Anal. Chem. 2016, 88, 12116–12121. [Google Scholar] [CrossRef]
- Wang, F.-X.; Chen, Y.; Liang, Y.-M.; Yang, M.; Kang, C. Interference-free quantitation of aromatic amino acids in two complex systems by three-way calibration with ultraviolet–visible spectrophotometer: Exploration of trilinear decomposition of spectrum-pH data. Spectrochim. Acta Part A Mol. Biomol. Spectrosc. 2023, 290, 122293. [Google Scholar] [CrossRef]
- Qiang, L.; Ancheng, L.; Chisheng, Y.; Kaiying, C.; Hamid, Y.; Zhiwei, L.; Yunlong, W.; Wenchen, Y. Insights into the role of endogenous humic acid on antibiotics bioadsorption process in wastewater: Mechanisms and potential implications. J. Water Process Eng. 2024, 64, 105606. [Google Scholar] [CrossRef]
- Mörschbächer, A.P.; Dullius, A.; Dullius, C.H.; Bandt, C.R.; Kuhn, D.; Brietzke, D.T.; Malmann Kuffel, F.J.; Etgeton, H.P.; Altmayer, T.; Gonçalves, T.E.; et al. Validation of an analytical method for the quantitative determination of selenium in bacterial biomass by ultraviolet–visible spectrophotometry. Food Chem. 2018, 255, 182–186. [Google Scholar] [CrossRef] [PubMed]
- Uusheimo, S.; Tulonen, T.; Arvola, L.; Arola, H.; Linjama, J.; Huttula, T. Organic carbon causes interference with nitrate and nitrite measurements by UV/Vis spectrometers: The importance of local calibration. Environ. Monit. Assess. 2017, 189, 357. [Google Scholar] [CrossRef] [PubMed]
- GB/T 32737-2016; Determination of Nitrate Nitrogen in Soil—Ultraviolet Spectrophotometry Method. Standardization Administration of China (SAC): Beijing, China, 2016.
- Dong, J.; Tang, J.; Wu, G.; Xin, Y.; Li, R.; Li, Y. Effective correction of dissolved organic carbon interference in nitrate detection using ultraviolet spectroscopy combined with the equivalent concentration offset method. RSC Adv. 2024, 14, 5370–5379. [Google Scholar] [CrossRef]
- Magdoff, F.; van Es, H. Amount of Organic Matter in Soils. Building Soils for Better Crops, 4th ed.; SARE Outreach: College Park, MD, USA, 2021; p. 410. [Google Scholar]
- Tian, S.; Yao, S.; Zhu, S.; Li, P.; Zhang, T.; Su, X.; Huang, R.; Yin, Y.; Lv, J.; Jiang, T.; et al. Evaluating soil dissolved organic matter as a proxy for soil organic matter properties across diverse ecosystems. Soil Biol. Biochem. 2025, 204, 109752. [Google Scholar] [CrossRef]
- Mitrakas, M.; Tsitouridou, R.; Keramidas, V. Interference of Humic Substances in the Spectrophotometric Determination of Bromate by Phenothiazines in Natural Waters. Int. J. Environ. Anal. Chem. 2000, 78, 343–351. [Google Scholar] [CrossRef]
- Edwards, A.C.; Hooda, P.S.; Cook, Y. Determination of Nitrate in Water Containing Dissolved Organic Carbon by Ultraviolet Spectroscopy. Int. J. Environ. Anal. Chem. 2001, 80, 49–59. [Google Scholar] [CrossRef]
- Moo, Y.C.; Matjafri, M.Z.; Lim, H.S.; Tan, C.H. New development of optical fibre sensor for determination of nitrate and nitrite in water. Optik 2016, 127, 1312–1319. [Google Scholar] [CrossRef]
- Lal, K.; Jaywant, S.A.; Arif, K.M. Electrochemical and Optical Sensors for Real-Time Detection of Nitrate in Water. Sensors 2023, 23, 7099. [Google Scholar] [CrossRef]
- De Notaris, C.; Rasmussen, J.; Sørensen, P.; Olesen, J.E. Nitrogen leaching: A crop rotation perspective on the effect of N surplus, field management and use of catch crops. Agric. Ecosyst. Environ. 2018, 255, 1–11. [Google Scholar] [CrossRef]
- Cui, J.; Zhang, X.; Reis, S.; Wang, C.; Wang, S.; He, P.; Chen, H.; van Grinsven, H.J.M.; Gu, B. Nitrogen cycles in global croplands altered by elevated CO2. Nat. Sustain. 2023, 6, 1166–1176. [Google Scholar] [CrossRef]
- Wen, T.; Yu, G.-H.; Hong, W.-D.; Yuan, J.; Niu, G.-Q.; Xie, P.-H.; Sun, F.-S.; Guo, L.-D.; Kuzyakov, Y.; Shen, Q.-R. Root exudate chemistry affects soil carbon mobilization via microbial community reassembly. Fundam. Res. 2022, 2, 697–707. [Google Scholar] [CrossRef] [PubMed]
- Kareem, A.; Farooqi, Z.U.R.; Kalsom, A.; Mohy-Ud-Din, W.; Hussain, M.M.; Raza, M.; Khursheed, M.M. Organic Farming for Sustainable Soil Use, Management, Food Production and Climate Change Mitigation. In Sustainable Agriculture: Technical Progressions and Transitions; Bandh, S.A., Ed.; Springer International Publishing: Cham, Switzerland, 2022; pp. 39–59. [Google Scholar]
- Li, X.; Zhu, W.; Xu, F.; Du, J.; Tian, X.; Shi, J.; Wei, G. Organic amendments affect soil organic carbon sequestration and fractions in fields with long-term contrasting nitrogen applications. Agric. Ecosyst. Environ. 2021, 322, 107643. [Google Scholar] [CrossRef]
Disclaimer/Publisher’s Note: The statements, opinions and data contained in all publications are solely those of the individual author(s) and contributor(s) and not of MDPI and/or the editor(s). MDPI and/or the editor(s) disclaim responsibility for any injury to people or property resulting from any ideas, methods, instructions or products referred to in the content. |
© 2025 by the authors. Licensee MDPI, Basel, Switzerland. This article is an open access article distributed under the terms and conditions of the Creative Commons Attribution (CC BY) license (https://creativecommons.org/licenses/by/4.0/).
Share and Cite
Zang, Y.; Chen, J.; Awais, M.; Abdulraheem, M.I.; Yusuff, M.A.; Geng, K.; Chen, Y.; Xiong, Y.; Li, L.; Zhang, Y.; et al. Nitrate Nitrogen Quantification via Ultraviolet Absorbance: A Case Study in Agricultural and Horticultural Regions in Central China. Agriculture 2025, 15, 1131. https://doi.org/10.3390/agriculture15111131
Zang Y, Chen J, Awais M, Abdulraheem MI, Yusuff MA, Geng K, Chen Y, Xiong Y, Li L, Zhang Y, et al. Nitrate Nitrogen Quantification via Ultraviolet Absorbance: A Case Study in Agricultural and Horticultural Regions in Central China. Agriculture. 2025; 15(11):1131. https://doi.org/10.3390/agriculture15111131
Chicago/Turabian StyleZang, Yiheng, Jing Chen, Muhammad Awais, Mukhtar Iderawumi Abdulraheem, Moshood Abiodun Yusuff, Kuan Geng, Yongqi Chen, Yani Xiong, Linze Li, Yanyan Zhang, and et al. 2025. "Nitrate Nitrogen Quantification via Ultraviolet Absorbance: A Case Study in Agricultural and Horticultural Regions in Central China" Agriculture 15, no. 11: 1131. https://doi.org/10.3390/agriculture15111131
APA StyleZang, Y., Chen, J., Awais, M., Abdulraheem, M. I., Yusuff, M. A., Geng, K., Chen, Y., Xiong, Y., Li, L., Zhang, Y., Raghavan, V., Hu, J., Wu, J., & Zhao, G. (2025). Nitrate Nitrogen Quantification via Ultraviolet Absorbance: A Case Study in Agricultural and Horticultural Regions in Central China. Agriculture, 15(11), 1131. https://doi.org/10.3390/agriculture15111131