Abstract
As a dominant ecological stress factor of climate change, soil drought has become a key challenge restricting food security. Based on soil moisture data, this paper uses the cumulative anomaly method, coefficient of variation, Sen + Mann–Kendall trend analysis, and center of gravity shift model to study the spatiotemporal changes in soil drought in Hebei Province from 2001 to 2020 and uses the optimal parameter geographic detector model to analyze the key factors affecting soil drought. The results show the following: (1) over the past 20 years, soil drought in Hebei Province has shown a trend of “first intensifying and then easing”, experiencing two turning points, and its spatial distribution showed significant agglomeration characteristics. (2) Soil moisture showed single-peak seasonal fluctuation, with severe drought from January to May, peak soil moisture from June to August, soil moisture balance from September to October, and soil moisture deficit intensified in winter. (3) Soil moisture stability showed spatial differentiation, being high in the northeast and low in the southwest. Soil drought in about 70% of the region has improved, and the center of gravity of drought-prone areas has moved to the southwest. (4) NDVI and altitude are the main drivers of soil drought spatial differentiation, and the multi-factor interaction shows a nonlinear enhancement effect. Among them, the parameter thresholds such as NDVI > 0.512 and altitude −32~16 m have a significant inhibitory effect on soil drought. This study can make a contribution to improving water resource management and increasing agricultural productivity in the region.
1. Introduction
Soil drought, a prominent ecological stressor originating from climate change, is a key challenge to food security and ecosystem stability in arid and semi-arid regions [1]. Hebei Province, a typical area for soil water cycle research on China’s North China Plain, has an average annual precipitation of less than 600 mm, unevenly distributed in time and space [2]. Combined with intense human activities, it has become a sensitive area for soil moisture imbalances under global climate change [3,4,5,6]. In the past decade, extreme soil drought events (e.g., the 2014 drought caused soil moisture in the plow layer to drop below the wilting coefficient for 98 days) have highlighted the scientific urgency of clarifying the evolution of regional soil moisture spatial and temporal heterogeneity [7,8,9]. However, traditional drought indices (e.g., Standardized Precipitation Index, Palmer Drought Severity Index) are insufficient in characterizing root zone soil moisture dynamics, making it difficult to accurately describe the physical processes of soil drought and vegetation responses, which limits the effectiveness of ecological risk warning systems [10,11]. Current monitoring methods are undergoing a paradigm shift from meteorological drought indices to the integration of multi-dimensional indicators of coupled water and heat processes in the soil–atmosphere continuum [12,13,14,15]. Nevertheless, satellite remote sensing technologies (e.g., MODIS ET, SMAP) are limited by kilometer-level spatial resolution and cannot capture the drastic variations in soil water storage at the farmland scale [16,17]. As a core parameter of energy exchange at the land–atmosphere interface and ecological process regulation, soil moisture dynamics not only drive surface evapotranspiration and precipitation redistribution [18,19] but are also a key hub for decoding the mechanisms of triple stress from climate change, human activities, and ecosystems. Although downscaling techniques (random forest, deep learning) have significantly improved the spatial resolution of soil moisture data [20], in highly artificial regions like Northern China, irrigation-induced non-natural soil moisture fluctuations and scarce ground verification data [21,22,23] have raised doubts about the reliability of existing inversion models. Current research on soil drought-driving mechanisms has significant scale fragmentation: time series analyses often use linear trend methods to identify periodic characteristics [24,25], while spatial analysis relies on geostatistical methods to depict static distribution patterns [26], making it difficult to explain the dynamic phenomenon of “spatial shifts in soil drought hotspots with climate change” [27]. Traditional univariate MK trend analysis can identify soil moisture variation trends but has significant limitations in handling complex nonlinear changes and multi-factor interactions. It struggles to accurately detect abrupt changes and quantify multi-factor interactions [28]. Although the geographical detector model can quantify the explanatory power of environmental factors based on soil moisture spatial differentiation [29,30,31,32,33],existing research has overly focused on natural factors (precipitation, temperature) and neglected the directed regulation of human activities, such as the land surface temperature and vegetation cover changes, based on soil water storage [34]. This has made it difficult for policymakers to distinguish the contributions of climate change and agricultural management to the evolution of soil drought, and this knowledge gap seriously restricts the formulation of sustainable water-management strategies for the North China Plain. The parameter-optimized geographical detector can more accurately identify key driving factors and more objectively quantify the explanatory power of each factor. This avoids the bias from unreasonable parameters in traditional models and thus more accurately reveals the driving mechanisms of soil drought [35].
This study builds a multi-method framework to analyze the soil drought “process—pattern—mechanism” across provincial scales. The coefficient of variation method identifies key years of soil moisture threshold breakthroughs, showing a climate–policy regulatory lag. Integrating Sen + Mann–Kendall trend analysis overcomes traditional linear regression’s spatial non-stationarity, accurately quantifying soil–water–storage spatiotemporal trends (α = 0.05). A gravity–center migration model depicts the shifting trajectory of soil drought cores. An optimal–parameter geographical detector quantifies factors like meteorology, NDVI, and land–area GDP in explaining drought-related spatial differentiation, pinpointing the main drivers. The ecological vulnerability evolution of North China’s dry-farming area under climate and human–activity stress is revealed. Spatially realistic decision-making support is given for optimizing zoned control strategies in Hebei’s Drought-Resistance Plan (2021–2035).
2. Data and Methodology
2.1. Overview of the Study Area
Hebei Province (36°05′ N–42°40′ N) is a typical research target area for soil drought processes in the North China Plain (Figure 1), showing stepped landform differentiation: the northwestern Bashang Plateau (chestnut soil, saturated hydraulic conductivity > 50 cm/d) is dominated by water infiltration [36]; the central piedmont alluvial fan (brown soil, clay layer bulk density 1.45–1.55 g/cm3) relies on capillary water recharge [37]; the southeastern alluvial plain (tidal soil, hydraulic conductivity heterogeneity of 3 orders of magnitude) is regulated by groundwater interactions. The region has a significant warming and drying trend in the past 30 years (temperature +0.34 °C/10 a, precipitation −8.2%), driving the effective water storage of the cultivated layer of soil to decrease at a rate of 1.5 mm/a (p < 0.01). The frequency of breaking through the soil moisture threshold has increased: the annual occurrence rate of field water-holding capacity (18–24%) in the brown soil area being lower than the stress threshold (θ < 12%) has increased by 42%, and the humidity in the root zone (30–100 cm) in the tidal soil area has been lower than the wilting coefficient (θ = 9%) for 67 days/year. High-intensity agricultural activities have exacerbated the water imbalance, the evapotranspiration deficit rate of the winter wheat–summer corn rotation system has reached 35–50%, and groundwater over-exploitation (annual average decrease of 0.8 m) has formed a 71,000 km2 composite funnel area. Remote sensing inversion reveals the spatial polarization of soil drought: the humidity at a depth of 20 cm in the brown soil belt in front of the mountain has decreased by 0.27%/a (R2 = 0.81), and the surface moisture retention period of the sandy soil on the dam has shortened by 1.2 days/a [38]. This area focuses on characterizing the cascading effects of climate change–groundwater flow field distortion–soil structure degradation, providing a natural experimental field for analyzing the soil drought mechanism in the context of the Anthropocene.
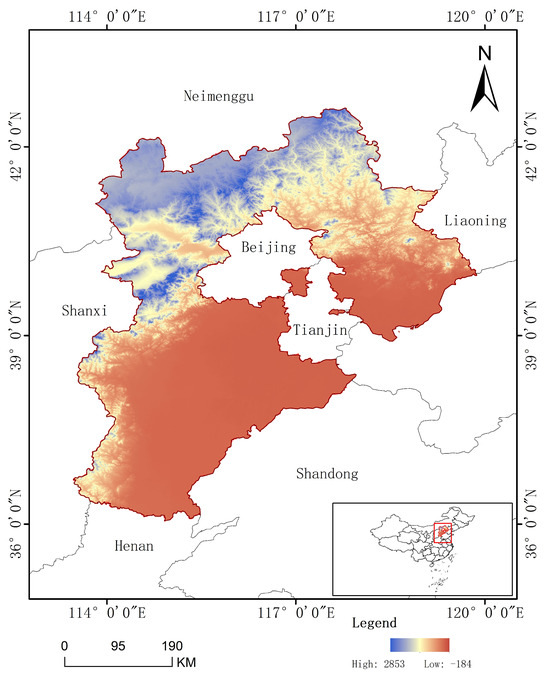
Figure 1.
Location and elevation map of the study area.
2.2. Data
Soil moisture data originate from the National Tibetan Plateau Data Center [39], which is based on the ESA-CCI active and passive fusion products for secondary research and development, and integrates ERA5 reanalysis data to build a 25 km benchmark dataset, based on ISMN measured data combined with multi-source optical remote sensing. With a temporal resolution of 1 day, the monthly and annual data are derived through pixel-based statistics.
The actual evapotranspiration data were acquired from the Google Earth Engine website by downloading and synthetically processing the ERA5-Land dataset [40].
The driving factors selected in this study are as follows (Table 1). Most of the data in the table have been clipped. The sampling tool in ArcGIS 10.8 was used. Then, the relevant data were linked into a table for a corresponding spatial heterogeneity analysis.

Table 1.
Data sources and spatial resolutions for the driving force analysis.
The difference between the actual evapotranspiration and potential evapotranspiration is as follows. Actual evapotranspiration is the sum of water that evaporates from the earth’s surface and transpires from plants in real natural conditions [44]. Potential evapotranspiration is the evapotranspiration capacity of a region when water is sufficient. It indicates the maximum evapotranspiration in ideal conditions and is also called reference evapotranspiration [45].
2.3. Methodology
2.3.1. Cumulative Anomaly
Anomaly refers to the difference between a specific value in a sequence and the mean of that sequence, which can be positive or negative. In drought applications, it is mainly used to determine whether the soil moisture (SM) data of certain days or years within a year or across years is higher or lower than the average of the dataset. Its characteristic is a mean of zero, and it can be directly used as a drought forecasting value, offering a more intuitive approach. Among numerous drought indices, the cumulative anomaly method demonstrates unique advantages. Compared to the Standardized Precipitation Index (SPI), Standardized Precipitation Evapotranspiration Index (SPEI), and others, it is more straightforward in terms of data requirements, eliminating the need for complex probability distribution fitting and other cumbersome steps. In identifying soil moisture thresholds, the cumulative anomaly method holds significant advantages. Soil moisture is influenced by a combination of meteorological factors, including precipitation. Through the cumulative anomaly analysis of precipitation and other elements, it can keenly capture the cumulative effects of the changing meteorological conditions on soil moisture. According to Equations (1) and (2), for the SM time series, the cumulative anomaly at a specific time t is represented as follows:
where represents the SM of the i-th year, and denotes the average SM over multiple years. The cumulative anomaly values for “n” time points were calculated and plotted as a cumulative anomaly curve for trend analysis.
2.3.2. Coefficient of Variation
The coefficient of variation (CV), also known as the standard deviation rate, is a statistical measure used to quantify the degree of variation among observations in a dataset [46,47,48]. When comparing variation across datasets with consistent units and means, the standard deviation suffices for a direct comparison [49]. When units or means differ, the standard deviation is not suitable for comparing variation; instead, the ratio of standard deviation to the mean should be used for the comparison [50,51]. This study employs the coefficient of variation method to assess the spatial stability of SM and evaluate drought stability in Hebei Province from 2001 to 2020. According to Equation (3), the calculation of the coefficient of variation is as follows:
where represents the coefficient of variation of SM from 2001 to 2020, represents the standard deviation of SM during the same period, and stands for the mean value of SM from 2001 to 2020. Generally speaking, a larger value of indicates greater instability in drought conditions from 2001 to 2020, whereas a smaller value suggests more stable drought conditions.
2.3.3. Natural Breakpoint Method
The natural breaks method classifies data by their distribution. It partitions data into relatively homogeneous groups via difference-based calculations. Unlike equal-interval or proportional-interval methods, it relies on inherent data characteristics, not preset intervals or ratios.
In order to more intuitively reveal the changes in drought in Hebei Province, this paper selects “natural break points” to divide CV into 4 levels, namely very stable (CV ≤ 0.05), stable (0.05 < CV ≤ 0.09), unstable (0.09 < CV ≤ 0.14), and very unstable (CV > 0.14). The natural break method identifies classification intervals based on inherent data groupings, effectively clustering similar values and maximizing inter-category differences, using the reclassify tool with the natural breaks method in ArcGIS 10.8.
2.3.4. Center of Gravity Migration Model
The center of gravity transfer model analyzes spatial changes in factors in regional development by examining their agglomeration and diffusion, revealing dynamic shifts in their centers [52]. The movement of the center of gravity of the factor objectively reflects the spatial agglomeration and displacement laws of the various factors of regional development [53]. Among them, the population center of gravity transfer model, the economic center of gravity transfer model, the land use transfer center of gravity model [54], and the production center of gravity transfer model [55] are currently commonly used analytical methods in geography. The center of gravity of drought-prone areas was proposed in the context of the center of gravity theory, which is used to describe the spatial position and changes of the center of gravity in the process of drought-prone areas. Before calculating the center of gravity of drought-prone areas, the spatial distribution map of SM from 2001 to 2020 was used to screen out the raster data of drought-prone areas (mild drought and above areas), and then, the center of gravity coordinates of drought-prone areas were calculated according to the latitude and longitude of the raster data of drought-prone areas. According to Equations (4) and (5), the calculation of the soil drought centroid is as follows:
where n is the total number of drought-prone grids; , , and are the longitude, latitude, and SM value of the i-th grid.
2.3.5. Sen + Mann–Kendall Trend Analysis
The Sen + Mann–Kendall method combines Sen trend estimation and the Mann–Kendall significance test [56,57,58], which can effectively test the significance of trend changes, reduce noise interference, and improve the accuracy of test results. No autocorrelation tests were performed in this paper.
The Sen slope estimation method is a non-parametric statistical trend analysis calculation method [59,60], which is insensitive to measurement errors and outlier data, can avoid the influence of missing or abnormal data in time series data, and has high calculation efficiency. According to Equation (6), the calculation formula of the Sen’s slope estimation method is as follows:
where B is the SM change trend; Median() is the median function; , are the SM values of the i-th and j-th time series, respectively; and i, j are the number of time series. When > 0, it means that SM is on an upward trend; when < 0, it means that SM is on a downward trend. The Mann–Kendall test, a non-parametric trend analysis method, assesses time series significance without requiring normal distribution assumptions and demonstrates robustness to missing data and outliers. This characteristic makes it particularly suitable for combination with Sen’s slope estimator in hydrological and environmental trend studies. The test statistic is calculated as follows according to Equation (7):
where is the sign function, which is calculated as follows according to Equation (8):
The trend test is performed using the test statistic Z, which is calculated as follows according to Equation (9):
In the formula, variance V(s) = n (n − 1) (2n + 5)/18; n is the number of data in the sequence. A bilateral trend test was used for the data, and the significance level was set at 0.05. When Z > 1.96, the SM change trend was significant, and when Z < 1.96, the SM change trend was not significant.
2.3.6. Geographic Detector Model Based on Optimal Parameters
The Optimal Parameters-based Geographical Detector (OPGD) model, an extension of the geographic detector model with added parameters like ecological, risk, interaction, and factor detection, explores explanatory variables’ spatial heterogeneity, offering a novel spatial statistical method for intrinsic driving forces [10,61,62,63]. The advantage of this method is that it can discover both qualitative and quantitative data [64] and the interaction between explanatory variables [64]. Parameter optimization identifies spatial data’s scale-partition effects, enhancing the research quality and accuracy. OPGD has been applied in fields including geological disasters, ecosystems, disease, and rural settlements [65,66,67].
Factor detection indicates the impact of driving factors on vegetation change; a higher value means stronger explanatory power [68,69]. Interaction detection assesses whether the interaction between two driving factors enhances, weakens, or independently affects FVC [70]. Risk detection checks the suitability of driving factor classification intervals for vegetation growth. Ecological detection determines the importance of driving factors for the vegetation spatial distribution [71,72]. Parameter optimization refers to the optimization of the scale and segmentation of spatial data, which is an important part of using OPGD to study the heterogeneity of spatial data. Since the geographical characteristics of geographic data at different spatial scales may vary significantly, the optimization of geographic data parameters is a prerequisite for conducting spatial variability research [73]. Scaling optimization compares the changes in the q values of explanatory variables at different spatial scales; when the q values of most explanatory variables reach the maximum value, the spatial scale is optimal. Segmentation optimization is based on the use of different discrete methods to segment continuous variables. Optimal segmentation occurs when the continuous variable’s q value peaks, determined by the discrete method–interruption count combination. Figure 2 illustrates the principle of the geographic detector:
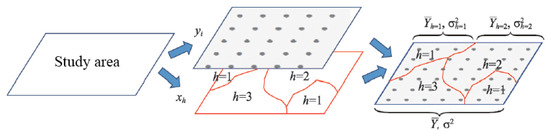
Figure 2.
The principle of the geographical detector.
The optimal parameter geographical detector utilizes the “GD” package in R 4.2.1 to discretize continuous factors, with the classification levels of explanatory variables set between 3 and 7 categories [66]. The q values of each continuous variable are calculated under different classification methods (equal intervals, natural intervals, and quantile intervals), and the parameter combination with the highest q value is identified as the optimal discretization combination for the independent variable. For spatial scale data not at a 1 km resolution, it is reclassified to 1 km, and all sampling data are at a 1 km resolution. The results indicate that the optimal discretization parameter combination for elevation is quantile breakpoints with 6 intervals, while for the slope, temperature, and population density, it is quantile breakpoints with 7 intervals. For the aspect, NDVI, and PET, it is natural breakpoints with 7 intervals. For the LST, precipitation, and soil type, it is equal intervals with 7 intervals. For GDP per unit area, it is natural breakpoints with 6 intervals. For river density, it is natural breakpoints with 5 intervals (see Appendix A, Figure A1). Therefore, there may be significant differences in the combination of discretization methods and the number of breakpoints among different explanatory variables (see Appendix A, Figure A2).
2.4. Classification of Drought Levels
Based on the gradient difference in the soil moisture content, this study constructed a five-level drought classification standard: soil moisture content (unit: ‰) < 150 is extremely severe drought, 150–175 is severe drought, 175–200 is moderate drought, 200–225 is mild drought, and >225 is no drought. This classification system clearly defines the drought intensity through quantitative thresholds, providing a scientific benchmark for dynamic drought monitoring, risk warning, and adaptive management. Table 2 shows the classification of soil moisture and drought grades.
Table 2.
Drought classification standards.
3. Results
3.1. Interannual Spatial and Temporal Variation Characteristics of Soil Drought in Hebei Province
3.1.1. Interannual Temporal Variation Characteristics of Soil Drought
This study analyzed drought conditions in Hebei Province from 2001 to 2020. For each year, it calculated the average soil moisture, anomalies, cumulative anomalies, and major climatic influencing factors, presenting the results in a figure. Over the 20-year period, the annual average soil moisture in Hebei fluctuated between 166.77‰ and 191.79‰, with a long-term average of 176.46‰ and a slight upward trend. In contrast, the drought-affected area exhibited a marked decline, averaging 877.58 thousand hectares annually, which indicates a progressive enhancement in the region’s drought-resistance capacity. The interannual variation in soil moisture is shown in Figure 3:
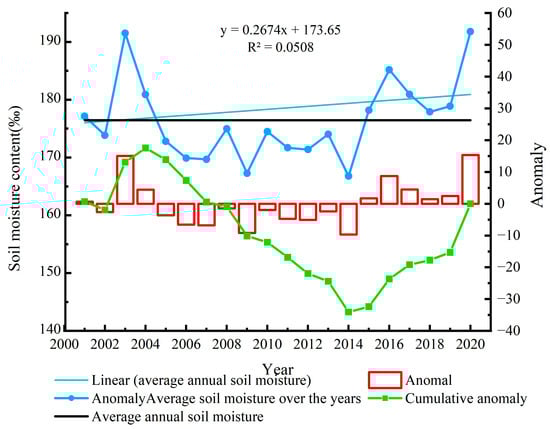
Figure 3.
Interannual variation and cumulative anomalies of SM from 2001 to 2020.
Between 2001 and 2004, soil moisture in Hebei fluctuated greatly, spanning from 173.85‰ to 191.50‰, and the drought-affected area peaked at 2390 thousand hectares in 2001. In 2001, precipitation was only 357.57 mm, 24% below the long-term average. Meanwhile, the temperature was 0.15 °C above the mean, causing the actual evapotranspiration to plunge to 317.85 mm, pushing the drought to an extreme. In 2003, the drought lessened considerably, mainly due to a sharp precipitation increase to 514.46 mm and a temperature drop to 9.68 °C, the lowest in 20 years. Consequently, the ratio of actual to potential evapotranspiration rose to 0.89, soil moisture anomaly increased to +15.04, and the drought-affected area fell by 61% from the 2001 peak.
From 2005 to 2014, soil moisture continued to run at a low level, ranging from 166.77‰ to 185.18‰, and the affected area showed a bimodal feature, reaching 1544 thousand hectares and 1028 thousand hectares in 2009 and 2014, respectively. From 2005 to 2007, the average annual precipitation decreased, while the temperature rose, causing the ratio of actual evapotranspiration to potential evapotranspiration to drop to 0.81, and the cumulative anomaly of soil moisture changed from +13.09 to −34.09. In 2012, precipitation rebounded to 525 mm, potential evapotranspiration dropped to 1043 mm, and actual evapotranspiration increased significantly. This change prompted the soil moisture to rebound in 2013, and the drought area dropped to 250 thousand hectares, the second lowest level in history.
From 2015 to 2020, the drought situation eased during this period. Soil moisture increased steadily, and the average annual affected area decreased by 65% compared with the previous period. Around 2016, soil moisture and the affected area simultaneously reached a significant turning point. In 2016, precipitation surged by 144 mm, and actual evapotranspiration increased significantly. The synergistic effect of the two pushed the soil moisture from a deficit to a surplus, and the drought area decreased by 80.5% compared with 2015. In addition, potential evapotranspiration fluctuated and declined after 2017, further suppressing the dissipation of surface water and strengthening the trend of drought relief. By 2020, the ratio of actual evapotranspiration to potential evapotranspiration rose to 0.91, and the affected area hit a record low of only 19,300 hectares. Figure 4 shows the inter-annual variations in factors influencing drought. Figure 5 presents the drought-affected area.
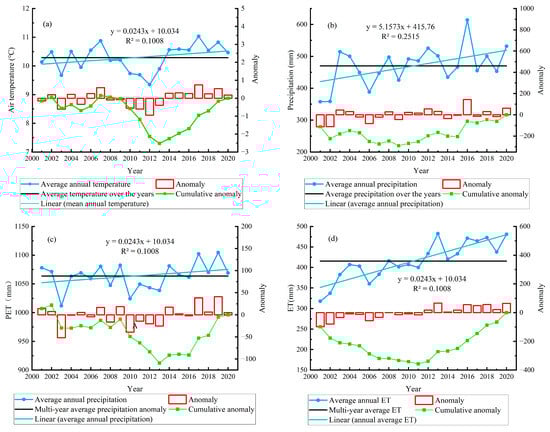
Figure 4.
Inter-annual variations and cumulative departures of the growing-season average temperature (a), PET precipitation (b), PET (c), and ET (d) from 2001 to 2020.
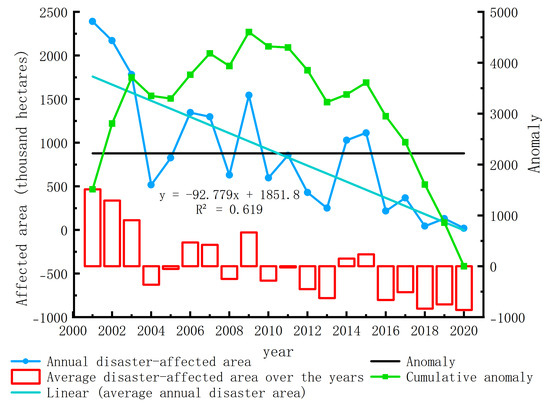
Figure 5.
The inter-annual variation and cumulative departure of drought-affected areas from 2001 to 2020.
3.1.2. Interannual Spatial Variation Characteristics of Soil Drought
Based on the evolution law of drought in Hebei Province revealed in Section 3.1.1, this study selected two climate mutation nodes, 2004–2005 (wet-dry transition) and 2014–2015 (dry-wet re-transition), for a comparative analysis. According to the drought-level classification system, the study period was divided into three stages: initial (2001–2004), transition (2005–2014), and re-transition (2015–2020), and the spatiotemporal variation characteristics of soil moisture (SM) in each stage were systematically diagnosed.
In the initial stage, with precipitation of 437.0 mm and a temperature of 10.2 °C, the average SM was 180.84‰, which was a mild drought overall. Spatial differentiation shows a significant terrain gradient: the Taihang Mountain forest area (6.8%) remains drought-free due to vegetation evapotranspiration regulation; the Chengde mountainous area and the central Hebei agricultural belt (21.82%) are slightly droughty due to irrigation replenishment; the Zhangbei Plateau (33.88%) and the urban circle (23.85%) are affected by the underlying surface to form a moderate–extreme drought gradient zone.
In the transition stage, precipitation increased to 472.82 mm, but with the temperature rising to 10.9 °C, the SM mean dropped to 171.30‰, and the system drought intensified. The drought-free core area shrank to 1.73%, and the extreme drought area in the plain expanded to 17.24%, revealing the amplification effect of climate mutation on ecologically vulnerable areas.
In the transition phase, precipitation jumped to 511.78 mm, driving the SM mean back to 182.14‰, and the system returned to light–moderate drought. The Taihang Mountain forest area restored the drought-free area to 7% through vegetation hydrological regulation, and the drought level in the southern Hebei Plain dropped by 1–2 levels, but the coast of the Bohai Bay maintained moderate drought due to the interaction between the sea and land, highlighting the spatial heterogeneity of the regional water balance mechanism. The proportion of mild drought in this phase increased to 23.74%.
In order to reveal the spatial differentiation of drought conditions in the past 20 years, this study processed the SM data in the study area for many years and drew a spatial distribution map of the SM multi-year mean (Figure 6). The analysis results show that the SM multi-year mean in the study area ranges from 5.38‰ to 274.82‰, showing significant spatial heterogeneity, specifically manifested as a gradient distribution pattern of high in the east and low in the west and high in the north and low in the south.
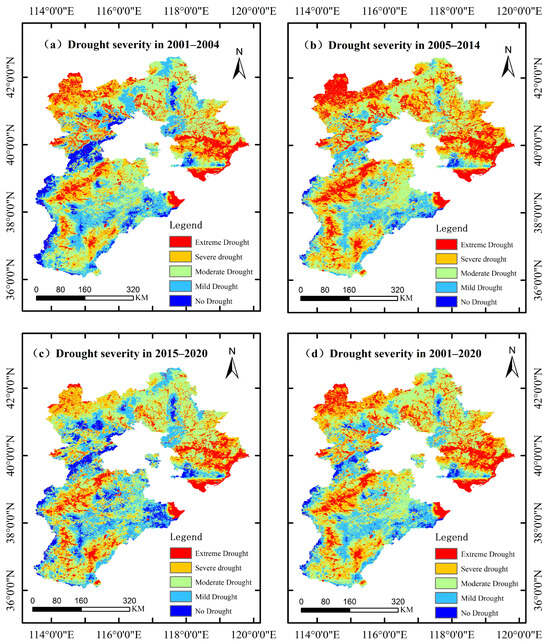
Figure 6.
Distribution map of drought levels at different stages. (a) 2001–2004, (b) 2004–2014, (c) 2015–2020, (d) 2001–2020.
Combining the drought level distribution in Figure 6 and Figure 7, it can be seen that different drought level areas have obvious spatial agglomeration characteristics: extremely severe drought areas (accounting for 15.25%) are mainly distributed in Zhangbei Plateau, Tangshan and Qinhuangdao urban areas, and Baoding urban areas; severe drought areas (accounting for 27.99%) are distributed in a ring shape outside the extremely severe drought areas; moderate (34.12%) and mild drought areas (19.72%) are concentrated and distributed in the Baoding-Cangzhou-Hengshui agricultural belt and Chengde City; drought-free areas (accounting for 2.91%) are distributed in patches in the Taihang Mountains, the southern hilly area of Zhangjiakou, and the coastal area of Cangzhou.
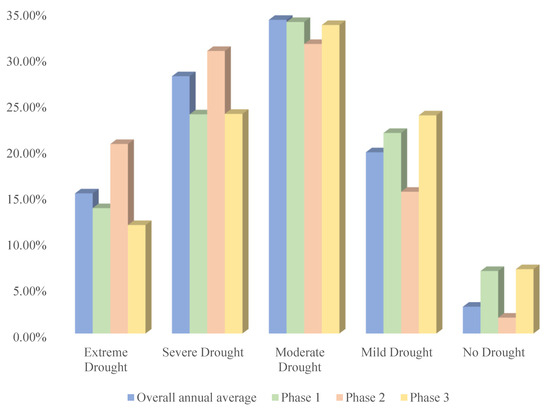
Figure 7.
The percentage of each drought level in different periods. (Phase 1: 2001–2004; Phase 2: 2005–2014; Phase 1: 2014–2020.)
3.2. Intra-Annual Temporal and Spatial Variation in Soil Drought in Hebei Province
3.2.1. Annual Spatial Variation Characteristics of Soil Drought Characteristics of Intra-Year Temporal Variation of Soil Drought
On a monthly scale, analyzing the dynamic characteristics of SM (soil moisture), combined with the multi-year mean time series of SM and cumulative anomaly analysis (Figure 8), reveals that the water cycle in the study area shows a typical unimodal seasonal variation. The annual evolution can be divided into three stages. From January to May, the water consumption period, the mean SM remains low, with severe drought, and SM ranges at 155–163. Driven by the East Asian summer monsoon from June to August, the water surplus period arrives, with the SM peak (208.06‰) in August, reversing the drought. From September to December, in the re-consumption period, SM drops to 167.07‰. The decline of autumn–winter precipitation and surface freezing worsen the water deficit. The cumulative anomaly curve defines the three-stage transitions. In May, the anomaly inflection point indicates the drought–wet transition, and in November, the anomaly growth nears zero, showing the wet–drought shift. This confirms the East Asian summer monsoon’s control over the regional hydrological processes.
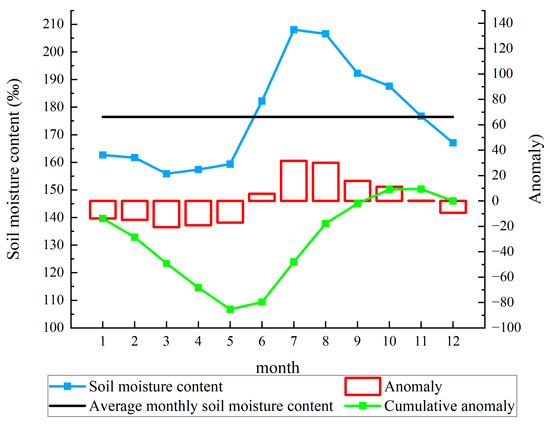
Figure 8.
Changes in and cumulative anomalies of monthly mean SM in Hebei Province over the years.
3.2.2. Annual Spatial Variation Characteristics of Soil Drought
Based on the meteorological season division standard, this study analyzed the driving mechanism of drought evolution under different climate scenarios (Figure 9). The results show that although the spatial pattern of soil moisture and the annual average distribution are inherited, the coupling of multiple factors, such as seasonal water and heat configuration, vegetation physiological needs, and human disturbance has led to the significant strengthening of drought differentiation characteristics.
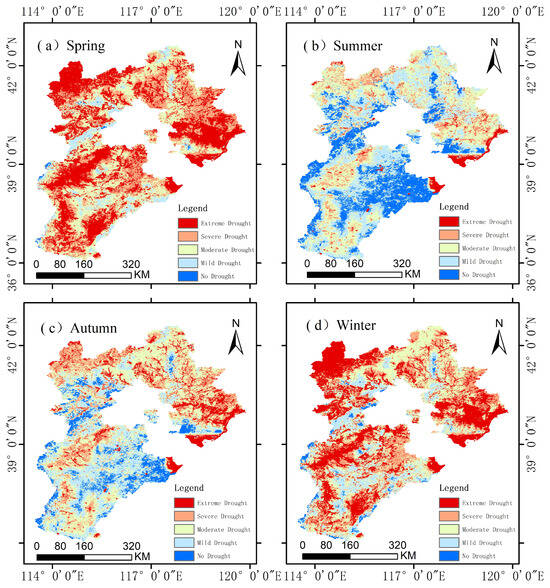
Figure 9.
Spatial distribution of SM and drought impact extent in Hebei Province during four periods from 2001 to 2020. (a) Spring, (b) Summer, (c) Autumn, (d) Winter.
In spring (March–May), the extreme drought dominated, and the water and heat misalignment caused the formation of a drought core area in the northwest plateau–northeastern mountains, while the southeastern plain of Hebei maintained mild drought through irrigation replenishment. In summer (June–August), the monsoon precipitation-high temperature coupling drove the southeastern plain of Hebei to form a moist core, but the densely urbanized area produced drought islands due to the variation in the underlying surface properties. In autumn (September–November), the synergistic effect of water and heat attenuation reduced the entire region to mild drought, and the northern plateau and coastal cold vortex area formed a high-incidence drought zone. In winter (December–February), the apparent drought level and ecological effect were asymmetric: the frozen soil moisture storage in the northern plateau alleviated the actual deficit, while the central and southern plains buffered the water demand pressure due to soil freezing, revealing the assessment bias of traditional drought indicators in the cold period.
Based on the analysis of the area composition of drought levels at the seasonal scale (Figure 10), the evolution of drought in Hebei Province shows significant temporal heterogeneity: spring (March–May) is the extreme drought period, with extremely severe drought (37.42%) and severe drought (32.78%) dominating the spatial pattern, and drought-free areas accounting for only 0.32%; the humid period driven by monsoon precipitation in summer (June–August) expands the drought-free area to 21.20%, and moderate–mild drought accounts for a total of 62.51%; autumn (September–November) shows transitional characteristics, with the proportion of extremely severe/severe droughts dropping to 32.54%; the drought in winter (December–February) intensifies again, with extremely severe drought (32.34%) and spring forming a seasonal drought double peak. This drought rhythm dominated by seasonal oscillations in water and heat configuration confirms the modulation effect of the advance and retreat of the East Asian monsoon on the regional water balance.
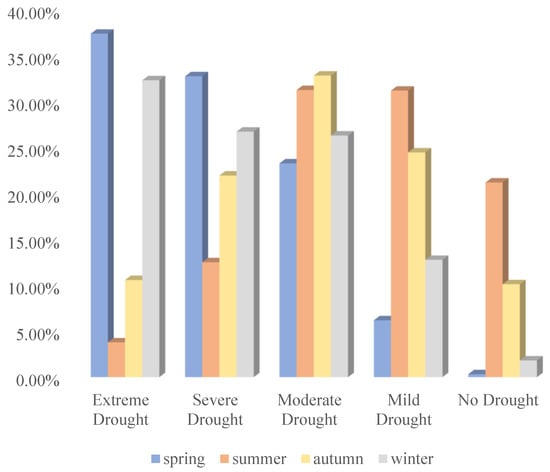
Figure 10.
Percentage of area affected by different drought impact levels in each season in Hebei Province from 2001 to 2020.
3.3. Analysis of the Spatiotemporal Variation Characteristics of Soil Drought
3.3.1. Stability of Soil Drought Changes
The stability of drought changes in Hebei Province was calculated, and the spatial coefficient of variation (CV) was analyzed (Figure 11). The results showed that the CV value of the study area was between 0 and 0.4, with a mean of 0.07721, and was generally stable (CV ≤ 0.09). The spatial differentiation characteristics are manifested as a decreasing stability gradient from southwest to northeast: in the southwestern Hebei Plain (accounting for 65.38%), the CV value is concentrated in the range of 0.05–0.09 due to the perfect irrigation system and low interannual precipitation variability, and the drought fluctuations are controllable; the stability in the northeast and special geomorphic areas is significantly reduced, among which Tangshan City, Qinhuangdao City, and parts of Chengde City (21.12%) have a CV ≤ 0.05, which may benefit from intensive water resource management, while Zhangjiakou City, Langfang City, and the southern edge of the province (10.14%) are affected by the monsoon edge effect and the alluvial fan terrain in front of the Taihang Mountains, and the CV rises to 0.09–0.14, and the instability of the drought is prominent; in scattered areas of Chengde City (3.35%), the CV exceeds the threshold of 0.14 due to the heterogeneity of groundwater storage in the karst landform or extreme climate disturbances, showing significant mutation characteristics. The study showed that the natural geographical pattern and human regulatory effects have a synergistic effect on drought stability, and dynamic monitoring and adaptive strategies need to be strengthened in high-variability areas.
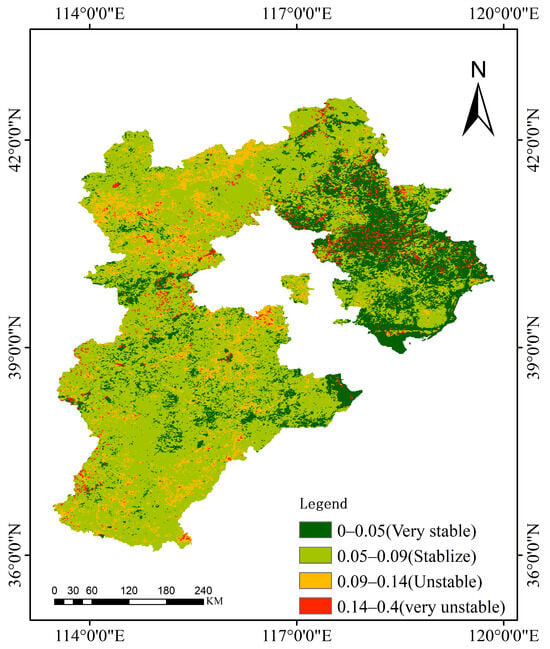
Figure 11.
Stability map of soil drought changes in Hebei Province from 2001 to 2020.
3.3.2. Trend Analysis of Soil Drought Changes
The trend estimation of Sen was combined with the Mann–Kendall significance test to obtain the trend and significance of change in Hebei Province. The SM change rate in the study area was divided into five levels (significant improvement, slight improvement, basically unchanged, slight deterioration, and significant deterioration), and its spatial differentiation pattern is shown in Figure 12.
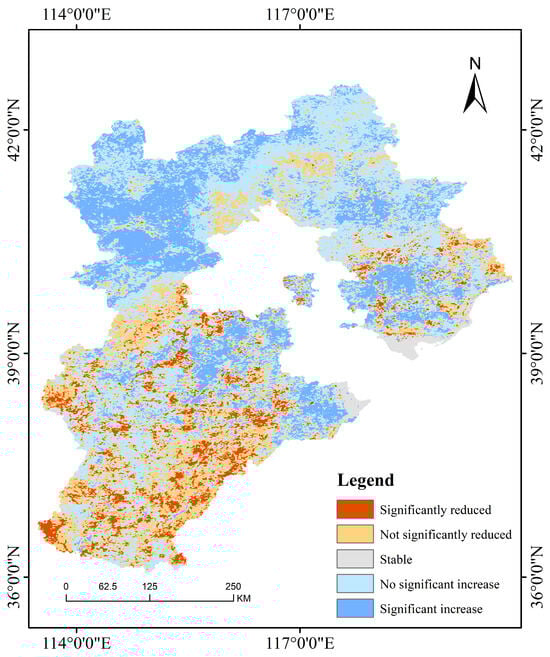
Figure 12.
Spatial distribution of soil drought changes in Hebei Province from 2001 to 2020.
A spatial heterogeneity analysis shows that the evolution of drought conditions presents significant regional differentiation characteristics. From the perspective of the proportion of grade area, the drought improvement area (including significant and slight improvement) accounts for 65.24% of the total area, of which the slightly improved area (42.01%) is mainly concentrated in the entire Chengde and the southern part of Zhangjiakou, while the significantly improved area (23.24%) is mainly concentrated in Zhangjiakou and extends to Cangzhou, Tangshan, and other places. The stable area accounts for 4.57%, which is concentrated in coastal areas such as Cangzhou and Tangshan. This phenomenon may be related to the regulatory effect of the marine climate on soil moisture. It is worth noting that the deteriorated areas accounted for 30.19% in total, of which the significantly deteriorated areas accounted for 7.55%, and the slightly deteriorated areas (22.64%) were mainly distributed in patches in the southern part of Hebei Province. The hierarchical spatial pattern revealed that although the phenomenon of local drought intensification still exists, about 2/3 of the province showed a trend of drought relief to varying degrees, especially in the northern Hebei Plateau and Yanshan Hilly Area, which showed significant improvement, indicating that the overall drought evolution in Hebei Province has tended to be benign over the past 20 years.
3.3.3. Analysis of the Change in Gravity Center in Drought-Prone Areas
Using soil moisture as weight, the SM gravity center distribution of drought-prone areas in Hebei Province in 20 years was calculated, and the spatial distribution map of gravity center was drawn (Figure 13). It can be seen from the figure that the location of the gravity center of drought-prone areas is not randomly distributed but concentrated in a fixed range. It is geographically distributed between Langfang City and Beijing City, within 40°51′33′′ N~41°23′18′′ N, 110°40′49′′ E~112°37′32′′ E. The gravity center transfer trajectory can reveal the overall drought transfer trend well. In order to quantitatively analyze the direction trend and aggregation degree of the gravity center, the first-level standard deviation ellipse was calculated based on the latitude and longitude of the gravity center of drought-prone areas in 20 years. The results showed that the direction of the first-order standard deviation ellipse was 21.85° northeast, indicating that the center of gravity of the drought-prone area was distributed in the northeast–southwest direction as a whole. The major axis of the first-order standard deviation ellipse was in the northeast–southwest direction, and the minor axis was in the northwest–southeast direction. The major axis was about 5.14 times the minor axis, indicating that the discreteness of the center of gravity of the drought-prone area in the southwest–northeast direction was greater than that in the northwest–southeast direction; that is, the fluctuation characteristics of drought in the southwest–northeast direction were more significant than those in the northwest–southeast direction, which was consistent with the results of the coefficient of variation and trend analysis.
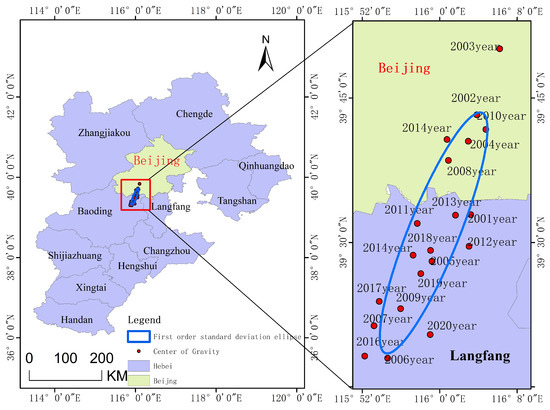
Figure 13.
Centroid variation of drought-prone areas in Hebei Province from 2001 to 2020.
3.4. Analysis of Influencing Factors of Spatial Variation of Soil Moisture in Hebei Province Based on OPGD Model
3.4.1. Factor Detector Analysis
According to the factor detector, the determination of different influencing factors on the spatial variation of drought in Hebei Province from 2001 to 2000 was explored, and the results are shown in Figure 14: NDVI > altitude > LST > precipitation > soil type > PET > temperature > slope > GDP per capita > population density. The determination q value of NDVI is the largest, which is 0.233, and its explanatory power is above 20%, indicating that vegetation type is the dominant influencing factor affecting the spatial variation of drought in Hebei Province; secondly, the determination q values of altitude and LST are relatively large, which are 0.1268 and 0.0961, respectively, indicating that they are important influencing factors affecting the spatial variation of drought in Hebei Province; for precipitation, soil type, PET, temperature, and slope, their explanatory powers are all above 0.05, indicating that they are secondary influencing factors affecting the spatial variation of drought in Hebei Province; for GDP per capita and population density, their explanatory powers are all below 0.05, and the influencing factors are very small. River density and slope aspect did not pass the significance test (p > 0.05), indicating that their single factors had little impact on the spatial variation of drought in Hebei Province, and the spatial variation of drought in Hebei Province was basically not affected by the river density and slope aspect.
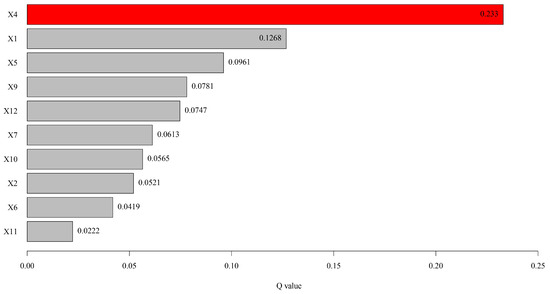
Figure 14.
Assessing the impact of single factors on SM using the OPGD model. (Red: Maximum value; Grey: Other values.)
3.4.2. Interaction Detection Analysis
In order to understand the effect of the interaction between any two driving forces on soil moisture changes, the interaction between any two factors was obtained based on the five interactions of the interaction detector (Figure 15). The results show that the interaction between any two driving forces is mainly manifested as double factor enhancement and nonlinear enhancement, while independent effects do not appear in the interaction. A further analysis shows that the explanatory power q value of the double factor interaction is significantly higher than the q value of the single factor effect, and nonlinear enhancement dominates the interaction. Among them, the interaction between the normalized difference vegetation index (NDVI) and other factors is the most significant, and its explanatory power q value exceeds 0.2. Among all the interaction combinations, the interaction between NDVI and altitude is the strongest (q = 42.07%), followed by the interaction between NDVI and the annual mean temperature (q = 33.3%), NDVI and soil type (q = 31.13%), and land use type and potential evapotranspiration (PET) (q = 30.42%). In conclusion, the interactions between driving factors significantly enhance the ability to explain the spatiotemporal variations in drought in Hebei Province, indicating that multi-factor synergistic effects are crucial in drought research.
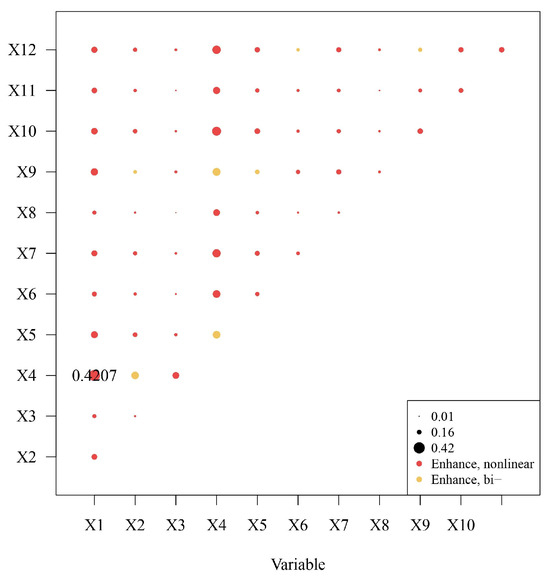
Figure 15.
Interactions between the two explanatory variables and their interactive statistic.
3.4.3. Risk Detection Analysis
The driver classification levels showed a significant nonlinear response relationship with SM. The higher the factor classification value, the better the soil moisture-retention capacity of the ecological unit. Specifically, factors like elevation, LST, PET, river density, and population density had significant negative driving effects. In their low-value ranges (elevation −32–16 m, LST 5–8.14 °C, PET 5880–8340 mm, population density 0.226–8.66 people/km2), the SM content surpassed 175‰, and with high vegetation coverage (NDVI > 0.512), this indicates that in low-elevation cold and wet areas, the hydrological cycle curbed the surface evaporation and transpiration. Also, moderate population density lessened land development disturbances, preserving soil hydrological regulation. For more details, see Appendix A, Figure A3.
Factors such as the slope, temperature, NDVI, and precipitation show significant positive driving effects. When the slope is >21.7°, the redistribution effect of topography on precipitation is enhanced, prompting surface runoff to converge to the foot of the slope. The canopy interception and root retention effect of the high vegetation coverage area with NDVI > 0.512, as well as the water input guarantee of annual precipitation > 625 mm, jointly construct the positive accumulation mechanism of SM. It is worth noting that the dual-factor coupling effect of a temperature of 13.6–13.9 °C, average GDP per square kilometer (946,000–1.75 million yuan/km2), and soil type (semi-hydromorphic soil, hydromorphic soil, saline–alkali soil, coded 7.86–9.57) is significant. The high annual average temperature and high economic intensity areas may have optimized the water regulation capacity through the construction of water conservancy facilities and the population pressure is also within a reasonable range. The hydromorphic soil has a physical water retention advantage due to its high clay content and water-holding porosity.
The vegetation risk change matrix further quantified the spatial differentiation significance of driving factors. The q-value statistics of NDVI and elevation reached 0.42 and 0.38 (p < 0.01), respectively, confirming their dominant regulatory role in the vegetation–soil system. The q-values of the slope, per capita GDP, and precipitation were between 0.25 and 0.31, showing moderate-strength driving characteristics. The q-values of meteorological factors like LST, PET, and population density were all below 0.15, indicating a weak correlation and spatial heterogeneity. Notably, the aspect and river density failed the significance test (q < 0.05), possibly due to the limited micro-topographic undulation in plains and the substitution effect of artificial irrigation systems for natural river networks. The research reveals the threshold response laws of SM maintenance in arid regions across multiple scales, offering a quantitative basis for the integrated management of water and soil resources in ecologically fragile areas. For more details, see Appendix A, Figure A4.
3.4.4. Ecological Detection and Analysis
The ecological detector was used to compare the classification of different influencing factors and determine whether there were significant differences in their impact on the spatial distribution of drought. It aimed to identify which factors showed more control over regional drought variation. The results presented statistical significance tests for each pair of influencing factors, marked as “Y” for significant differences and “N” for no significant differences. Notably, interactions between all types of factors were statistically significant. For more details, see Appendix A, Figure A5.
4. Discussion
This study reveals the spatiotemporal evolution of soil drought in Hebei Province from 2001 to 2020 and its driving mechanism, providing a scientific basis for understanding the regional hydrological and ecological response under the dual stress of climate change and human activities. The following discussion focuses on four aspects: spatio-temporal differentiation analysis of soil drought, mechanisms of influencing factors, management implications, and research limitations.
4.1. Spatio-Temporal Differentiation Analysis of Soil Drought
This study achieved the first full-chain analysis of soil drought “process-pattern-mechanism” at the provincial scale by integrating the coefficient of variation, Sen + Mann–Kendall trend analysis and OPGD model. The study found that soil drought in Hebei Province showed a trend of “first intensification and then relief”, and there were two key climate turning points in 2004–2005 and 2014–2015. This result is partially consistent with the report of local moisture recovery under the background of overall warming and drying of the North China Plain [2], but the climate mutation nodes and spatial differentiation characteristics found in this study (such as the agglomeration of extremely large drought areas to urbanized areas) reveal the reshaping effect of high-intensity human activities on drought hotspots. In addition, the “unimodal seasonal fluctuation” model proposed in the study is consistent with the soil moisture dynamics driven by concentrated precipitation in the East Asian monsoon region [15] but further clarifies the reinforcing effect of winter surface freezing on the water deficit, making up for the shortcomings of traditional meteorological drought indices in the cold period assessment [21].
4.2. Nonlinear Driving Mechanism of Multi-Factor Interaction
The results of the OPGD model indicate that NDVI and elevation are the main factors controlling the spatial differentiation of soil drought (with q values of 0.233 and 0.127 respectively), which is consistent with the theory that vegetation cover regulates soil moisture through transpiration and that terrain affects it via water redistribution [74]. However, this study further reveals the nonlinear enhancement effects of multi-factor interactions, especially the synergistic effects of NDVI with elevation and temperature (with the highest q value reaching 42.07%), suggesting that the drought resistance of ecological restoration measures (such as increasing NDVI) in low-elevation areas may be restricted by climate warming. In high elevation areas, factors such as cold climate and short growing seasons may limit vegetation growth, but once certain conditions (such as improved soil fertility and suitable light conditions) are met, vegetation growth may increase rapidly, leading to a quick rise in NDVI. This complex ecological process may be one of the reasons for the nonlinear enhancement effects in the interactions. The coupling effects of human activity factors (such as GDP per unit area) and natural factors (such as the interaction between GDP and soil type) highlight the duality of socioeconomic interventions on the water balance: areas with high economic intensity may improve irrigation efficiency through water conservancy facilities, but may also increase the heterogeneity of the underlying surface due to land development (such as the “dry island” phenomenon in urban areas).
4.3. Implications for Regional Ecological Management
The parameter thresholds proposed in this study (such as NDVI > 0.512, altitude −32~16 m) provide a quantitative basis for zoning drought-resistance strategies. For example, extremely drought-prone areas, such as the Zhangbei Plateau, need to give priority to vegetation restoration and water-saving irrigation, while mildly drought-prone areas in the southern Hebei Plain can reduce evapotranspiration deficits by optimizing crop-rotation systems. The phenomenon of drought center shifting southwestward reveals the dual effects of human activities: On one hand, the urban cluster expansion in southwestern regions driven by the Beijing-Tianjin-Hebei Coordinated Development Strategy has led to increased impervious surfaces and excessive groundwater extraction, creating an “anthropogenic dry island”. On the other hand, the spatial imbalance in inter-basin water-transfer projects (e.g., the central route of the South-to-North Water Diversion Project prioritizing northern water supply) has altered the regional hydrological balance, exacerbating water resource competition in the southwestern plains peripheral to the project’s coverage area. The study also showed that although the drought situation in 65% of the province has improved, 30% of the deteriorated areas (concentrated in the south and the Tangshan-Qinhuangdao urban belt) still need targeted monitoring, especially in the climate background of increased precipitation variability [75]. Relevant authorities should proactively strengthen efforts to expand vegetation coverage.
4.4. Research Limitations and Future Directions
The study has the following limitations: (1) the 1 km spatial resolution of soil moisture data may underestimate the microtopography effects on farm scales. Future work could combine drone remote sensing or high-resolution satellites (e.g., PlanetScope) to improve the accuracy. (2) The model excludes key human factors like the irrigation intensity, possibly overestimating natural drivers’ contributions. (3) The OPGD model’s static analysis cannot capture the time-lag effects of driving factors. Subsequent studies could introduce panel data or machine learning for dynamic multi-scale interaction simulation. Moreover, the coupling process of groundwater–soil moisture in Hebei Province and the nonlinear responses to extreme climate events need further research to support regional sustainable development.
This study provides a scientific basis for soil drought monitoring and adaptive management in Hebei Province. At the same time, the proposed multi-method collaborative framework can provide a reference for ecohydrological research in similar semi-arid areas around the world.
5. Conclusions
This study uses the soil moisture dataset of Hebei from 2001 to 2020, uses Sen + Mann–Kendall trend analysis and the coefficient of variation to study the trend and stability of soil drought, and uses the OPGD model to explore the spatial data scale optimization and partitioning effect to reveal the driving factors of soil moisture. Then, the spatiotemporal changes in soil drought in Hebei are analyzed. The main conclusions are as follows:
(1) The interannual drought monitoring results of SM in Hebei Province in 20 years show that the drought is generally mild drought, and the drought shows a trend of first intensifying and then easing; 2004–2005 was the turning point from wet to dry in Hebei Province, and 2014–2015 was the turning point from dry to wet in Hebei Province. Different drought levels have obvious spatial agglomeration characteristics: extreme drought areas (accounting for 15.25%) are mainly distributed in Zhangbei Plateau, Tangshan and Qinhuangdao urban areas, and Baoding urban areas; severe drought areas (accounting for 27.99%) are distributed in a ring shape outside the extreme drought areas; moderate (34.12%) and mild drought areas (19.72%) are concentrated and distributed in the Baoding-Cangzhou-Hengshui agricultural belt and Chengde City; drought-free areas (accounting for 2.91%) are distributed in patches in the Taihang Mountains, the southern hilly area of Zhangjiakou, and the coastal area of Cangzhou. This spatial differentiation feature is significantly correlated with environmental factors, such as the regional topography, land use type, and sea–land location.
(2) The soil moisture dynamics in the study area display significant seasonal variations, following a unimodal fluctuation pattern within a year. From January to May, the average SM remains low, indicating severe drought. During this period, although the potential evapotranspiration (PET) is low, the precipitation is significantly below the climatological average, and the SM stays within the range of 155–163, showing severe insufficiency of soil moisture recharge. The turning point occurs in mid-June. With the advancement of the East Asian summer monsoon, July and August enter the concentrated precipitation period. In August, the average SM reaches 208.06. At this time, the actual evapotranspiration increases, but the precipitation recharge significantly exceeds the water consumption, causing the average SM to reach its annual peak, and the drought level shifts to non-drought. From September to the end of October, the temperature difference between day and night increases, leading to a decrease in PET, and the water consumption for crop transpiration reduces, bringing the water balance into equilibrium and creating a short-term drought-relief period. Entering the autumn and winter seasons (November–December), with the sharp reduction in precipitation and the overlapping process of surface freezing, SM continues to decline. SM rebounds to above 167.07, indicating that soil moisture once again enters a deficit state.
(3) An analysis of the drought stability, change rate, and center of gravity of drought-prone areas in Hebei Province shows that the stability of drought conditions gradually decreases from northeast to southwest. The drought conditions in Zhangjiakou, Chengde, Qinhuangdao, Tangshan, and most coastal areas of Cangzhou are mainly improved; the interannual changes in urban drought conditions in southern Hebei, Tangshan, and Qinhuangdao are worsening, and the area with worsening drought conditions accounts for only 30.19% of the total area, indicating that the overall trend of drought conditions in Hebei Province has improved in the past 20 years, and the drought conditions in most areas have been alleviated to varying degrees. In the past 20 years, the center of gravity of the drought-prone areas in Hebei Province has a clear trend of moving southward, a slight trend of moving westward, and generally moving southwestward.
(4) Among the factors affecting the spatial variation of drought in Hebei Province, NDVI and altitude are the dominant factors affecting the spatial variation of drought; LST and precipitation are important factors affecting the spatial variation of drought; soil type, PET, temperature, and slope are secondary factors affecting the spatial variation of drought; GDP per capita and population density have little effect on the spatial variation of drought; the spatial variation of drought is basically not affected by the road distance and slope. Nonlinear enhancement relationship. The interactions between all types of factors are significant, and each indicator factor has its appropriate range. Within this range, drought is not likely to occur. NDVI > 0.512, altitude −32~16 m, LST5–8.14 °C, PET 5880–8340 mm, population density 0.226–8.66 people/km2. Slope > 21.7°, annual precipitation > 625 mm, GDP per capita 9.46–17.5 billion yuan, soil type hydromorphic soil, temperature 13.6–13.9 °C. In the future, we will focus on areas where NDVI has decreased and combine the results of driving factor detection to propose suggestions and countermeasures for protecting the ecological environment according to local conditions. This study used the OPGD model to detect the driving factors of vegetation change, revealing the relative importance of factors affecting soil moisture changes and enriching the understanding of drought changes in Hebei. The research results will help enhance the understanding of drought changes in the region, provide a theoretical basis for drought monitoring, and promote the sustainable development of Hebei Province.
Author Contributions
B.Z.: Writing-original draft, Methodology. B.W.: Writing-review and editing, Visualization. X.Z.: Writing-review and editing, Funding acquisition, Conceptualization. S.Z.: Methodology. G.S.: Writing-review and editing, Project administration, Conceptualization. S.A.: Methodology. Z.L.: Investigation. All authors have read and agreed to the published version of the manuscript.
Funding
This research was funded by National key R & D project grant number 2022YFB3903005.
Data Availability Statement
The raw data supporting the conclusions of this article will be made available by the authors on request.
Acknowledgments
We would like to thank the National Tibetan Plateau Data Center, Google Earth Engine, Geospatial Data Cloud website, and the Chinese Academy of Sciences Tripolar Earth Big Data Platform for providing data support.
Conflicts of Interest
The authors declare that they have no known competing financial interests or personal relationships that could have appeared to influence the work reported in this paper.
Appendix A
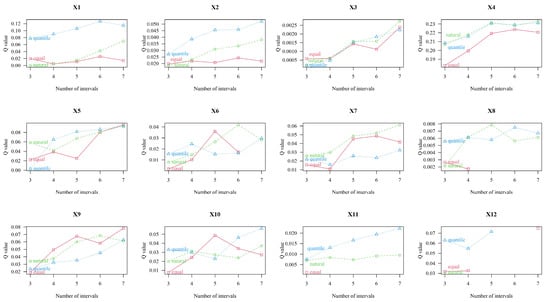
Figure A1.
The statistical results of q-values for different discretization methods and category numbers.
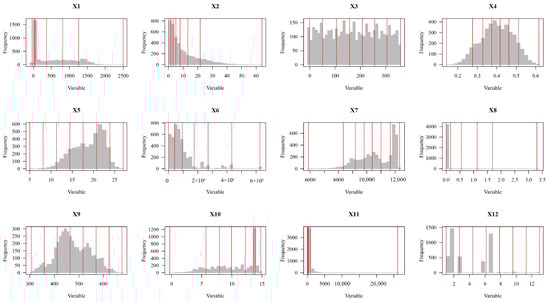
Figure A2.
Segmentation results of explanatory variables based on the OPGD model.
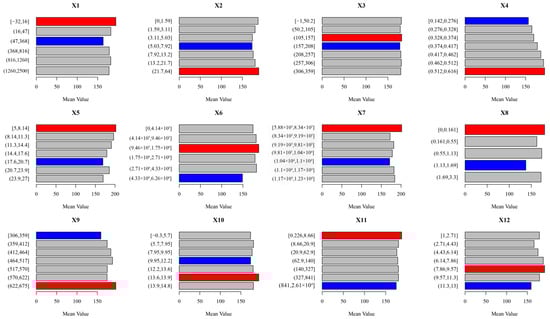
Figure A3.
Risk detection maps of different driving factors. (Red: highest value, Blue: lowest value, Grey: other values).
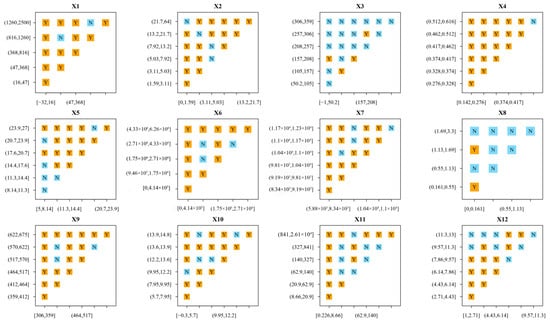
Figure A4.
Risk matrices for different driving factors.
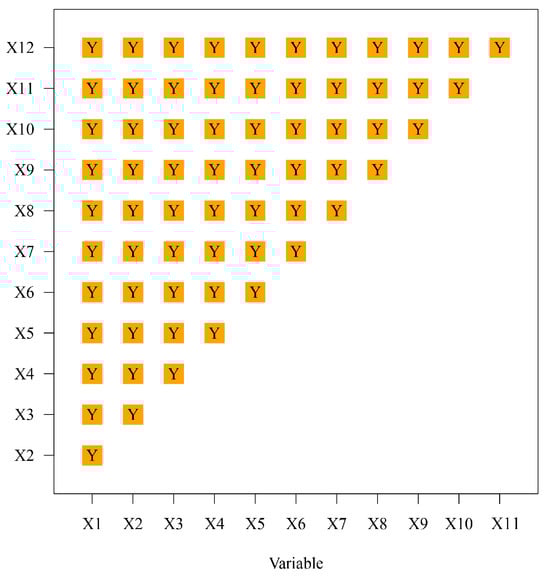
Figure A5.
Significance test for differences in SM values among different influencing factors (confidence level 95%).
References
- Mishra, A.K.; Singh, V.P. A review of drought concepts. J. Hydrol. 2010, 391, 202–216. [Google Scholar] [CrossRef]
- Wang, L.; Jia, B.; Xie, Z.; Wang, B.; Liu, S.; Li, R.; Liu, B.; Wang, Y.; Chen, S. Impact of groundwater extraction on hydrological process over the Beijing-Tianjin-Hebei region, China. J. Hydrol. 2022, 609, 127689. [Google Scholar] [CrossRef]
- Bayat, B.; Nasseri, M.; Zahraie, B. Identification of long-term annual pattern of meteorological drought based on spatiotemporal methods: Evaluation of different geostatistical approaches. Nat. Hazards 2015, 76, 515–541. [Google Scholar] [CrossRef]
- Fuquan, T.; Ting, M.; Jingya, T.; Qian, Y.; Junlei, X.; Chao, Z.; Cong, W. Space-time dynamics and potential drivers of soil moisture and soil nutrients variation in a coal mining area of semi-arid, China. Ecol. Indic. 2023, 157, 111242. [Google Scholar]
- Mengistu, A.G.; Woyessa, Y.E.; van Rensburg, L.D.; Tesfuhuney, W.A. Analysis of the spatio-temporal variability of soil water dynamics in an arid catchment in South Africa. Geoderma Reg. 2021, 25, e00395. [Google Scholar] [CrossRef]
- Wen, B.; Liu, F. The evolution and configuration mechanism of spatial correlation network in China’s innovation ecosystem. Environ. Technol. Innov. 2025, 38, 104157. [Google Scholar] [CrossRef]
- Huang, X.; Wang, Y.; Wang, X.; Chen, J.; Ma, J.; Liang, E.; Wang, X. Exploring the natural-socioeconomic driving and response mechanisms of ecosystem services interactions to optimize ecosystem management: A case study in the Yarlung Zangbo River Basin. Sci. Total Environ. 2024, 957, 177842. [Google Scholar] [CrossRef]
- Maimaitituersun, A.; Yang, H.; Aobuliaisan, N.; Maimaitiaili, K.; Chenyu, O. Assessing subtle changes in arid land river basin ecological quality: A study utilizing the PIE engine platform and RSEI. Ecol. Indic. 2025, 170, 113035. [Google Scholar] [CrossRef]
- Olthof, I.; Rainville, T. Dynamic surface water maps of Canada from 1984 to 2019 Landsat satellite imagery. Remote Sens. Environ. 2022, 279, 113121. [Google Scholar] [CrossRef]
- Bo, Y.; Liqiang, Y.; Longling, Z.; Jiqiong, L. Analysis on variation characteristics of the minimum flow at Datong Station under the influence of the Three Gorges Reservoir. IOP Conf. Ser. Earth Environ. Sci. 2021, 787, 012065. [Google Scholar] [CrossRef]
- Ghasempour, R.; Aalami, M.T.; Saghebian, S.M.; Kirca, V.S.O. Analysis of spatiotemporal variations of drought and soil salinity via integrated multiscale and remote sensing-based techniques (Case study: Urmia Lake basin). Ecol. Inform. 2024, 81, 102560. [Google Scholar] [CrossRef]
- Guo, J.; Fan, Y.; Li, Y.; Bi, Y.; Wang, S.; Hu, Y.; Zhang, L.; Song, W. Topography Dominates the Spatial and Temporal Variability of Soil Bulk Density in Typical Arid Zones. Sustainability 2024, 16, 9670. [Google Scholar] [CrossRef]
- Han, Z.; Huang, Q.; Huang, S.; Leng, G.; Bai, Q.; Liang, H.; Wang, L.; Zhao, J.; Fang, W. Spatial-temporal dynamics of agricultural drought in the Loess Plateau under a changing environment: Characteristics and potential influencing factors. Agric. Water Manag. 2021, 244, 106540. [Google Scholar] [CrossRef]
- Hassan, F.; Ruhollah, T.; Ali, H.A.M.; Mojtaba, Z.; Brandon, H.; Thomas, S. Spatiotemporal Assessment of Soil Organic Carbon Change Using Machine-Learning in Arid Regions. Agronomy 2022, 12, 628. [Google Scholar] [CrossRef]
- Seneviratne, S.I.; Corti, T.; Davin, E.L.; Hirschi, M.; Jaeger, E.B.; Lehner, I.; Orlowsky, B.; Teuling, A.J. Investigating soil moisture–climate interactions in a changing climate: A review. Earth-Sci. Rev. 2010, 99, 125–161. [Google Scholar] [CrossRef]
- Thi, N.Q.; Govind, A.; Ha, T.V. Spatial and temporal variability of soil moisture active and passive (SMAP) droughts and their impacts on vegetation in the Central Highlands of Vietnam. Environ. Monit. Assess. 2025, 197, 203. [Google Scholar] [CrossRef]
- Brown, R.W.; Chadwick, D.R.; Zang, H.; Jones, D.L. Use of metabolomics to quantify changes in soil microbial function in response to fertiliser nitrogen supply and extreme drought. Soil. Biol. Biochem. 2021, 160, 108351. [Google Scholar] [CrossRef]
- Shuai, W.; Qianlai, Z.; Mingyi, Z.; Xinxin, J.; Na, Y.; Ting, Y. Temporal and spatial changes in soil organic carbon and soil inorganic carbon stocks in the semi-arid area of northeast China. Ecol. Indic. 2023, 146, 109776. [Google Scholar] [CrossRef]
- Suh, C.N.; Tsheko, R. Spatial and temporal variation of soil properties and soil organic carbon in semi-arid areas of Sub-Sahara Africa. Geoderma Reg. 2024, 36, e00770. [Google Scholar] [CrossRef]
- Xuting, Y.; Xiao, B.; Wanqiang, Y.; Pengfei, L.; Jinfei, H.; Li, K. Spatioemporal dynamics and driving forces of soil organic carbon changes in an arid coal mining area of China investigated based on remote sensing techniques. Ecol. Indic. 2024, 158, 111453. [Google Scholar] [CrossRef]
- Liu, Q.; Zhang, J.; Zhang, H.; Yao, F.; Bai, Y.; Zhang, S.; Meng, X.; Liu, Q. Evaluating the performance of eight drought indices for capturing soil moisture dynamics in various vegetation regions over China. Sci. Total Environ. 2021, 789, 147803. [Google Scholar] [CrossRef] [PubMed]
- Liu, Y.; Pan, Z.; Zhuang, Q.; Miralles, D.G.; Teuling, A.J.; Zhang, T.; An, P.; Dong, Z.; Zhang, J.; He, D.; et al. Agriculture intensifies soil moisture decline in Northern China. Sci. Rep. 2015, 5, 11261. [Google Scholar] [CrossRef]
- Sayidjakhon, K.; Fadong, L.; Rashid, K.; Qiuying, Z.; Yunfeng, Q.; Sarvar, O.; Peng, Y.; Peifang, L.; Hubert, H.; Chao, T.; et al. Evaluation of the perennial spatio-temporal changes in the groundwater level and mineralization, and soil salinity in irrigated lands of arid zone: As an example of Syrdarya Province, Uzbekistan. Agric. Water Manag. 2022, 263, 107444. [Google Scholar] [CrossRef]
- Zeng, T.; Li, Y.; Ma, L.; Kong, L.; Zhang, J.; Abuduwaili, J. Unveiling Latent interaction mechanisms influencing the spatial pattern of soil salinity in arid Oases: Insights from integrated modeling. Catena 2025, 250, 108769. [Google Scholar] [CrossRef]
- Zhao, Y.; Wang, Y.; Zhou, J.; Qi, L.; Zhang, P. Spatiotemporal variation and controlling factors of dried soil layers in a semi-humid catchment and relevant land use management implications. Catena 2024, 240, 107973. [Google Scholar] [CrossRef]
- Zhang, T.; Quan, W.; Tian, J.; Li, J.; Feng, P. Spatial and temporal variations of ecosystem water use efficiency and its response to soil moisture drought in a water-limited watershed of northern China. J. Environ. Manag. 2024, 355, 120251. [Google Scholar] [CrossRef] [PubMed]
- Jiao, K.; Gao, J.; Wu, S. Climatic determinants impacting the distribution of greenness in China: Regional differentiation and spatial variability. Int. J. Biometeorol. 2019, 63, 523–533. [Google Scholar] [CrossRef]
- Mohseni, F.; Jamali, S.; Ghorbanian, A.; Mokhtarzade, M. Global soil moisture trend analysis using microwave remote sensing data and an automated polynomial-based algorithm. Glob. Planet. Change 2023, 231, 104310. [Google Scholar] [CrossRef]
- Irina, O.; Anisoara, I.; George, B.; Denis, M.; ClaudiuValeriu, A.; Argentina, N.; Vasile, C.; Stefan, N. Assessment of Soil Moisture Anomaly Sensitivity to Detect Drought Spatio-Temporal Variability in Romania. Sensors 2021, 21, 8371. [Google Scholar] [CrossRef]
- Kapkwang, C.C.; Onyando, J.O.; Kundu, P.M.; Hoedjes, J. Evaluation of Spatio-Temporal Soil Moisture Variability in Semi-Arid Rangeland Ecosystem, Maasai Mara National Reserve, Kenya. J. Eng. Res. Rep. 2021, 20, 64–90. [Google Scholar] [CrossRef]
- Lakkappa, R.N.; Koluru, N.R.; Bheemsain, R.K.D.; Umapathi, S.; Kasareddy, B.; Verappa, R.H.; Vijay, B.W.; Rangappa, U.M. Spatio-Temporal Variability of Soil Properties and Nutrient Uptake for Sustainable Intensification of Rainfed Pigeon Pea (Cajanus cajana) in Semi-Arid Tropics of India. Sustainability 2023, 15, 3998. [Google Scholar] [CrossRef]
- Li, L.; Dong, X.; Sheng, Y.; Zhang, P.; Zhang, S.; Zhu, Z. Temporal and Spatial Changes in Soil Organic Carbon in a Semi-Arid Area of Aohan County, Chifeng City, China. Water 2023, 15, 3253. [Google Scholar] [CrossRef]
- Li, S.; Zhu, P.; Song, N.; Li, C.; Wang, J. Regional Soil Moisture Estimation Leveraging Multi-Source Data Fusion and Automated Machine Learning. Remote Sens. 2025, 17, 837. [Google Scholar] [CrossRef]
- Zongyu, L.; Zhilin, S.; Lixia, S.; Jing, L.; Wenhua, X.; Haiyang, D.; Haolei, Z. Hydrological variation and hydro-sediment interrelation of the Luozha River in the Lancang River Basin. Water Supply 2022, 22, 4839–4851. [Google Scholar] [CrossRef]
- Wang, J.; Xu, C. Geographic detectors: Principles and prospects. Acta Geogr. Sin. 2017, 72, 116–134. [Google Scholar] [CrossRef]
- Yang, S.; Chu, D.; Tian, D. A Preliminary Study on the Occurrence and Classification of Lignite Calcareous Soil in the Baishan Plateau of Hebei Province. J. Hebei Agric. Univ. 1987, 5–11. [Google Scholar]
- Zhang, X.; Zhao, X.; Li, B.; Wang, C. Soil texture classification of the Hebei Plain based on regional soil elemental geochemistry. Quat. Res. 2017, 37, 25–35. [Google Scholar] [CrossRef]
- Xie, Z.; Li, C.; Cai, J.; Wang, S. Bibliometric analysis and visualization of the relationship between climate change and soil moisture from 1988 to 2023. J. Arid. Meteorol. 2024, 42, 953–964. [Google Scholar] [CrossRef]
- Zheng Chaolei, J.I.A.L.Z.T. Global daily surface soil moisture dataset at 1-km resolution (2000–2020). Sci. Data 2023, 10, 139. [Google Scholar] [CrossRef]
- Zhao, S.; Huang, Y.; Liu, Z.; Liu, T.; Tang, X. Estimation of Actual Evapotranspiration and Water Stress in Typical Irrigation Areas in Xinjiang, Northwest China. Remote Sens. 2024, 16, 2676. [Google Scholar] [CrossRef]
- Peng, S. 1-km Monthly Potential Evapotranspiration Dataset for China (1901–2023). 2024. Available online: https://loess.geodata.cn/data/datadetails.html?dataguid=34595274939620&docid=74 (accessed on 2 March 2025).
- Peng, S. 1-km Monthly Mean Temperature Dataset for China (1901–2023). 2024. Available online: https://data.tpdc.ac.cn/en/data/71ab4677-b66c-4fd1-a004-b2a541c4d5bf/ (accessed on 2 March 2025).
- Peng, S. High-Spatial-Resolution Monthly Precipitation Dataset Over China During 1901–2017. Available online: https://zenodo.org/records/3114194 (accessed on 2 March 2025).
- Rijtema, P.E. An Analysis of Actual Evapotranspiration; Wageningen University and Research: Gelderland, The Netherlands, 1965. [Google Scholar]
- Milly, P.C.; Dunne, K.A. Potential evapotranspiration and continental drying. Nat. Clim. Chang. 2016, 6, 946–949. [Google Scholar] [CrossRef]
- Fu, H.; Xv, W.; Yang, F.; Jiang, L.; Shi, Y. Deep learning-based study of strength variance coefficient for large diameter thin-walled structures. Thin-Walled Struct. 2025, 211, 113059. [Google Scholar] [CrossRef]
- Wang, X.; Song, X.; Wang, Y.; Wang, X.; Gao, H. Understanding the Grain Production Growth Pathways Transition and Its Implications for Sustainable Grain Production in China. Land. Degrad. Dev. 2025, 36, 1993–2009. [Google Scholar] [CrossRef]
- Zhong, Y.W.; Li, J.B. Runoff Variation Trend of Three Diversions in Recent 60 Years and the Analysis of Influencing Factors. Adv. Mater. Res. 2014, 3248, 3032–3035. [Google Scholar] [CrossRef]
- Zhu, X.; Li, H. Activity clustering for anomaly detection. Int. J. Intell. Inf. Database Syst. 2013, 7, 441–453. [Google Scholar] [CrossRef]
- Weixiong, W.; Ronghui, L.; Jinhua, S. Assessment of Regional Spatiotemporal Variations in Drought from the Perspective of Soil Moisture in Guangxi, China. Water 2022, 14, 289. [Google Scholar] [CrossRef]
- Xie, J.; Xu, Y.-P.; Wang, Y.; Gu, H.; Wang, F.; Pan, S. Influences of climatic variability and human activities on terrestrial water storage variations across the Yellow River basin in the recent decade. J. Hydrol. 2019, 579, 124218. [Google Scholar] [CrossRef]
- Yu, R.; Wu, Y.; Wei, J.; Yao, L.; Chu, Z.; Wang, C.; Ma, S.; Zhang, Z. Study on the Response of Habitat Quality to Land Use Change in the Middle and Lower Reaches of the Yangtze River Based on the InVEST-GWR Model. Pol. J. Environ. Stud. 2024. [Google Scholar] [CrossRef] [PubMed]
- Yi, X.; Luo, J.; Wang, P.; Guo, X.; Deng, Y.; Du, T.; Wang, H.; Jiao, C.; Yuan, G.; Shao, M. Spatial and Temporal Variations in Soil Moisture for a Tamarisk Stand under Groundwater Control in a Hyper-Arid Region. Water 2023, 15, 3403. [Google Scholar] [CrossRef]
- De Rosa, M.; Knudsen, M.T.; Hermansen, J.E. A comparison of Land Use Change models: Challenges and future developments. J. Clean. Prod. 2016, 113, 183–193. [Google Scholar] [CrossRef]
- Wang, W.; Liu, A.; Xu, X. The Spatio-Temporal Evolution and Sustainable Development Strategy of Huizhou’s Traditional Villages in the Xin’an River Basin. Land. 2025, 14, 102. [Google Scholar] [CrossRef]
- Gocic, M.; Trajkovic, S. Analysis of changes in meteorological variables using Mann-Kendall and Sen’s slope estimator statistical tests in Serbia. Glob. Planet. Change 2013, 100, 172–182. [Google Scholar] [CrossRef]
- Hamed, K.H. Trend detection in hydrologic data: The Mann–Kendall trend test under the scaling hypothesis. J. Hydrol. 2008, 349, 350–363. [Google Scholar] [CrossRef]
- Hamed, K.H.; Rao, A.R. A modified Mann-Kendall trend test for autocorrelated data. J. Hydrol. 1998, 204, 182–196. [Google Scholar] [CrossRef]
- Hussain, M.; Mahmud, I. pyMannKendall: A python package for non parametric Mann Kendall family of trend tests. J. Open Source Softw. 2019, 4, 1556. [Google Scholar] [CrossRef]
- McLeod, A.I. Kendall rank correlation and Mann-Kendall trend test. R. Package Kendall 2005, 602, 1–10. [Google Scholar]
- Cen, Q.; Zhou, X.; Qiu, H. Exploration of urban neighborhood blue-green space quality patterns and influencing factors in waterfront cities based on MGWR and OPGD models. Urban. Clim. 2024, 55, 101942. [Google Scholar] [CrossRef]
- Chen, Z.; Feng, H.; Liu, X.; Wang, H.; Hao, C. Analysis of the Influence of Driving Factors on Vegetation Changes Based on the Optimal-Parameter-Based Geographical Detector Model in the Yima Mining Area. Forests 2024, 15, 1573. [Google Scholar] [CrossRef]
- Dan-dan, L.; Yong-liang, L. Expansion and Quantitative Attribution of China’s Built-up Areas Based on Parameter Optimal Geodetector. J. Hebei Univ. Water Resour. Electr. Eng. 2023, 33, 33–39. [Google Scholar] [CrossRef]
- Liu, Z.; Haochuan, L.; Haiyan, S.; Wang, Y. Analysis of soil organic matter influencing factors in the Huangshui River Basin by using the optimal parameter-based geographical detector model. Geocarto Int. 2023, 38, 2246935. [Google Scholar] [CrossRef]
- Ni, C.; Mao, F.; Du, H.; Li, X.; Xu, Y.; Huang, Z. Spatiotemporal Evolution and Influencing Factors of Forest Carbon Storage Based on BIOME-BGC Model and Geographical Detector in Eight Basins of Zhejiang Province in China. Forests 2025, 16, 316. [Google Scholar] [CrossRef]
- Song, Y.; Jinfeng, W.; Yong, G.; Xu, C. An optimal parameters-based geographical detector model enhances geographic characteristics of explanatory variables for spatial heterogeneity analysis: Cases with different types of spatial data. GIScience Remote Sens. 2020, 57, 593–610. [Google Scholar] [CrossRef]
- Zhao, X.; Tan, S.; Li, Y.; Wu, H.; Wu, R. Quantitative analysis of fractional vegetation cover in southern Sichuan urban agglomeration using optimal parameter geographic detector model, China. Ecol. Indic. 2024, 158, 111529. [Google Scholar] [CrossRef]
- Wang, D.; Zhang, L.; Yu, H.; Zhong, Q.; Zhang, G.; Chen, X.; Zhang, Q. Attributing spatially stratified heterogeneity in biodiversity of urban–rural interlaced zones based on the OPGD model. Ecol. Inform. 2024, 83, 102789. [Google Scholar] [CrossRef]
- Zhang, Z.; Yin, H.; Zhao, Y.; Wang, S.; Han, J.; Yu, B.; Xue, J. Spatial Heterogeneity and Driving Factors of Soil Moisture in Alpine Desert Using the Geographical Detector Method. Water 2021, 13, 2652. [Google Scholar] [CrossRef]
- Xie, Y.; Zhu, S.; Wu, P.; Li, X.; Wei, X. Identifying driving factors and their interacting effects on accumulation of heavy metals in cultivated soils based on optimal parameter geographic detector model. J. Geochem. Explor. 2024, 266, 107573. [Google Scholar] [CrossRef]
- Yang, W.; Zhan, X.; Liu, D.; Zhu, H. Spatial distribution characteristics and influencing factors of milk tea stores in Wuhan based on sDNA and OPGD models. PLoS ONE 2025, 20, e0319075. [Google Scholar] [CrossRef]
- Zhang, M.; Kafy, A.-A.; Ren, B.; Zhang, Y.; Tan, S.; Li, J. Application of the Optimal Parameter Geographic Detector Model in the Identification of Influencing Factors of Ecological Quality in Guangzhou, China. Land 2022, 11, 1303. [Google Scholar] [CrossRef]
- Wang, W.; Hu, Y.; Song, R.; Guo, Z. Analysis of the Spatiotemporal Heterogeneity of Various Landscape Processes and Their Driving Factors Based on the OPGD Model for the Jiaozhou Bay Coast Zone, China. Land 2022, 11, 7. [Google Scholar] [CrossRef]
- Zhang, H.; Chang, J.; Zhang, L.; Wang, Y.; Li, Y.; Wang, X. NDVI dynamic changes and their relationship with meteorological factors and soil moisture. Environ. Earth Sci. 2018, 77, 582. [Google Scholar] [CrossRef]
- Yang, L.; Sun, G.; Zhi, L.; Zhao, J. Negative soil moisture-precipitation feedback in dry and wet regions. Sci. Rep. 2018, 8, 4026. [Google Scholar] [CrossRef] [PubMed]
Disclaimer/Publisher’s Note: The statements, opinions and data contained in all publications are solely those of the individual author(s) and contributor(s) and not of MDPI and/or the editor(s). MDPI and/or the editor(s) disclaim responsibility for any injury to people or property resulting from any ideas, methods, instructions or products referred to in the content. |
© 2025 by the authors. Licensee MDPI, Basel, Switzerland. This article is an open access article distributed under the terms and conditions of the Creative Commons Attribution (CC BY) license (https://creativecommons.org/licenses/by/4.0/).