Article

Organic–Inorganic Fertilization Sustains Crop Yields While Mitigating N2O and NO Emissions in Subtropical Wheat–Maize Systems

by
Yan Liu
1,
Lei Hu
1,2,
Shihang Zhang
1,2,
Zhisheng Yao
2,3,
Minghua Zhou
1 and
Bo Zhu
1,*
1
Key Laboratory of Mountain Surface Processes and Ecological Regulation, Institute of Mountain Hazards and Environment, Chinese Academy of Sciences, Chengdu 610213, China
2
University of Chinese Academy of Sciences, Beijing 100049, China
3
State Key Laboratory of Atmospheric Boundary Layer Physics and Atmospheric Chemistry, Institute of Atmospheric Physics, Chinese Academy of Sciences, Beijing 100193, China
*
Author to whom correspondence should be addressed.
Agriculture 2025, 15(10), 1108; https://doi.org/10.3390/agriculture15101108
Submission received: 28 March 2025 / Revised: 9 May 2025 / Accepted: 14 May 2025 / Published: 21 May 2025

Abstract

:
Balancing food security with fertilizer-driven climate impacts remains critical in intensive agriculture. While organic–inorganic substitution enhances soil fertility, its effects on nitrous oxide (N2O) and nitric oxide (NO) emissions remain uncertain. This study evaluated N2O/NO emissions, crop yields, and agronomic parameters in a subtropical wheat–maize rotation under four fertilization regimes: inorganic-only (NPK), manure-only (OM), and partial substitution with crop residues (CRNPK, 15%) or manure (OMNPK, 30%), all applied at 280 kg N ha−1 yr−1. Emissions aligned with the dual Arrhenius–Michaelis–Menten kinetics and revised “hole-in-the-pipe” model. Annual direct emission factors (EFd) for N2O and NO were 1.01% and 0.11%, respectively, with combined emissions (1.12%) exponentially correlated to soil nitrogen surplus (p < 0.01). CRNPK and OMNPK reduced annual N2O+NO emissions by 15–154% and enhanced NUE by 10–45% compared with OM, though OMNPK emitted 1.7–2.0 times more N2O/NO than CRNPK. Sole OM underperformed in yield, while partial substitution—particularly with crop residues—optimized productivity while minimizing environmental risks. By integrating emission modeling and agronomic performance, this study establishes CRNPK as a novel strategy for subtropical cereal systems, reconciling high yields with low greenhouse gas emissions.

Graphical Abstract

1. Introduction

Intensive agriculture in subtropical regions faces a critical dilemma. Escalating demand for staple crops (e.g., wheat and maize) necessitates high fertilizer inputs, yet excessive nitrogen (N) use drives unsustainable emissions of nitrous oxide (N2O) and nitric oxide (NO)—potent greenhouse gases that threaten global climate targets [1,2]. China, the world’s largest wheat–maize producer, exemplifies this challenge, with fertilized croplands contributing 20% of global agricultural N2O emissions [3]. While partial substitution of inorganic fertilizers with organic amendments (e.g., crop residues, manure) is promoted to enhance soil health, its effects on N2O/NO emissions remain inconsistent and poorly quantified in humid subtropical systems [4,5]. For instance, manure substitution may lower N2O emissions in temperate zones but increase them in tropics due to divergent microbial responses to soil redox dynamics [6,7]. This gap hinders the design of region-specific climate-smart practices, underscoring the need for mechanistic insights into how organic substitutions interact with subtropical conditions to regulate emissions without compromising yields. This study’s focus on microbial mechanisms of N2O/NO emissions in subtropical agroecosystems bridges the gap in existing models’ applicability to humid climates.
Soil N2O/NO emissions are governed by nitrification and denitrification, processes sensitive to redox potential (Eh), carbon availability, and microbial community structure [8]. Organic amendments alter these drivers; crop residues (high C:N) may immobilize N temporarily, whereas manure (low C:N) accelerates mineralization, posing contrasting risks for N losses [9]. Recent advances emphasize that microbial community structure and redox-driven metabolic shifts are central to N2O/NO dynamics. For example, optimized organic–inorganic fertilization (e.g., 30% crop residue substitution) enhances nosZ gene abundance while stabilizing soil redox potential, achieving a 20–45% reduction in yield-scaled N2Oemissions [10,11]. These insights align with global efforts to reconcile agricultural productivity with climate resilience.
Organic amendments are widely advocated to enhance soil carbon sequestration and fertility, particularly in Asia’s intensive agroecosystems [12,13,14]. However, their environmental impacts remain context-dependent. While partial substitution of inorganic fertilizers with organic sources (e.g., crop residues, manure) can synchronize nutrient release with crop demand, it may also alter microbial activity and nitrogen dynamics, variably affecting N2O/NO emissions [15,16,17,18]. This variability is amplified in subtropical climates, where fluctuating Eh governs microbial processes. For instance, manure’s rapid mineralization under aerobic conditions elevates NH4+ availability, stimulating nitrification-derived NO emissions, while crop residues (high C:N ratio) may transiently immobilize N, suppressing nitrification but promoting denitrification under waterlogged conditions [10]. Recent advances highlight Eh as a critical regulator of microbial community structure—low Eh enriches nosZ-harboring denitrifiers, reducing N2O/N2 ratios, whereas high Eh favors ammonia oxidizers (AOB), exacerbating NO fluxes [10]. In China, the world’s largest wheat–maize producer, fertilized croplands emit 0.26 Tg N2O-N yr−1 and 0.20 Tg NO-N yr−1 [19,20], underscoring the urgency of optimizing organic substitution strategies to reconcile food security with emission mitigation in redox-sensitive subtropical systems. Reassessing the balance between crop yields and soil N2O and NO emissions is necessary in the context of food security and climate change. Meanwhile, using the IPCC default values for estimation would lead to overestimation of NO and N2O+NO emissions from regional croplands. This study can provide partial data support for estimating trace gas emissions from regional croplands.
Long-term application of organic fertilizers such as manures in general, can directly increase soil organic carbon content and indirectly promote soil carbon sequestration, but it does not ensure stable crop yields [21]. Additionally, the application of organic amendments can improve soil conditions such as soil structure, carbon and nitrogen content, and microbial activity, which are conducive to soil gaseous nitrogen loss [22,23]. However, there is compelling evidence that partially substituting inorganic fertilizers with organic amendments (such as crop residues and manure) has great potential in controlling environmental issues caused by fertilization while ensuring crop yields [24,25,26]. Currently, crop nitrogen fertilizer use efficiency, soil nitrogen surplus, and yield-scaled nitrogen gas emissions are commonly used indicators for assessing the effects of increased crop production, nitrogen fertilizer fate, and environmental impact [25,27]. Therefore, it is necessary to comprehensively evaluate the impact of organic amendments and their partial substitution of inorganic fertilizers on crop yields and environmental impacts, using multiple indicators.
Based on the above requirements, this study monitored the fluxes of N2O and NO and crop yields in a subtropical winter wheat–summer maize cropping system under different fertilization regimes throughout the year. We also calculated key agronomic parameters such as crop NUE, soil nitrogen surplus, and yield-scaled nitrogen gas emissions and analyzed their intrinsic relationships. We hypothesized that partial substitution of inorganic fertilizers with organic amendments would mitigate N2O and NO emissions in subtropical wheat–maize systems by enhancing nitrogen use efficiency (NUE) and reducing nitrogen surplus, without compromising yields. To test this, we aimed to (a) quantify the effects of contrasting organic substitution regimes (crop residue and manure) on direct emission factors (EFd) and yield-scaled N2O+NO emissions; (b) uncover the mechanisms driving emission dynamics, with a focus on the interplay between soil factors, microbial processes, and nitrogen surplus; (c) evaluate the optimal substitution for balancing productivity and environmental outcomes in subtropical climates. By integrating a dual Arrhenius–Michaelis–Menten kinetics and revised “hole-in-the-pipe” model with field-scale flux measurements, this study addresses a critical gap in predicting emission responses to organic management in humid, redox-variable environments—a key step toward climate-smart intensification.

2. Materials and Methods

2.1. Field Site and Experimental Design

The field experiment was conducted at the Yanting Agro-Ecological Research Station (31°16′ N, 105°28′ E), part of the Chinese Ecosystem Research Network (CERN) in Southwest China. This site is situated at an altitude of 400–600 m and is characterized by a subtropical climate. From 2001 to 2016, the long-term average air temperature was recorded at 17.3 °C (meteorological data are summarized in Table S1 and Figure S1), with an annual precipitation of 826 mm. Notably, approximately 70% of the rainfall occurs between May and September. The experimental soil at this location is classified as Eutric Regosol according to FAO taxonomy, or as Entisols according to USDA taxonomy [28,29], commonly referred to as “purple soil” due to a distinctive purple color and rapid soil formation process [28]. The topsoil (0–20 cm) is composed of 35% sand, 59% silt, and 6% clay. The average soil bulk density and pH (1:2.5, water/soil) were found to be approximately 1.34 g cm−3 and 8.3, respectively. Additionally, the average total nitrogen (N) content and organic carbon (C) content in the soil were around 0.81 g N kg−1 and 8.75 g C kg−1, respectively (details in Table S2). Further details about the site description can be found in Zhou et al. [24] and Zhu et al. [26].
This region is predominantly hilly, with gradients ranging from 5% to 30%. Rain-fed agriculture is the primary practice, and the most common cropping system is a winter wheat–summer maize rotation. The experiment followed a completely randomized block design with three replicates per treatment. Each plot measured 8 × 4 m2, and treatments were allocated to account for slope variations (6% gradient). The regimes included (1) CK (no fertilizer); (2) NPK (inorganic NPK fertilizer only); (3) OM (pig manure only); (4) CRNPK (15% crop residue + 85% inorganic NPK fertilizer; moderate crop residue incorporation (10–20%) optimizes soil carbon sequestration while avoiding excessive carbon-to-nitrogen (C/N) ratios that could immobilize nitrogen and reduce crop yields in subtropical systems [11]; and (5) OMNPK (30% pig manure + 70% inorganic NPK fertilizer; pig manure has a lower C/N ratio and faster nutrient mineralization, allowing a higher substitution rate (30%) to enhance soil fertility without overloading the system with labile carbon, which could stimulate denitrification-derived N2O emissions [10]. These ratios reflect regional agricultural practices in subtropical China, where partial organic substitution is prioritized to mitigate soil acidification and nutrient leaching from intensive inorganic fertilization [30] (Table 1). In the NPK regime, ammonium bicarbonate was applied at rates of 130 kg N ha−1 during the wheat season and 150 kg N ha−1 during the maize season. The nitrogen required for the OM regime was entirely sourced from fresh swine manure obtained from the same pig farm for both the wheat and maize seasons. The pig manure had an average nitrogen content of approximately 4.8 g kg−1 and a C–N ratio of 16. In the CRNPK regime, crop residue supplied 15% of the nitrogen rate, while synthetic NPK provided the remaining 85%. In the OMNPK regime, pig manure contributed 30% of the nitrogen rate, with synthetic NPK supplying the remaining 70%. Crop residue, characterized by a C–N ratio of 59–65:1 and a nitrogen content of approximately 6.4–8.8 g N kg−1, was cut into short sections (5 cm in length) and applied to the CRNPK plots before planting the crops. This study utilized identical quantities of fertilizers, specifically 280 kg N ha−1 y−1, with 130 kg N ha−1 during the wheat season and 150 kg N ha−1 during the maize season [30,31]. Calcium superphosphate, equivalent to 90 kg P2O5 ha−1, and potassium chloride, equivalent to 36 kg K2O ha−1, were used as basal fertilizers in the NPK, CRNPK, and OMNPK regimes. The basal fertilizers were manually applied on the day of crop planting as a one-time application. Wheat (Triticum aestivum L. cv. Chuanmai 44) and maize (Zea mays L. cv. Huashi 99) were planted at densities of 200 plants m−2 (row spacing: 15 cm) and 4 plants m−2 (plant and row spacing: 25 × 50 cm2), respectively. Planting and harvesting dates were 3 November 2015–23 May 2016 (wheat) and 30 May–25 September 2016 (maize).

2.2. Measurement of N2O and NO Fluxes

Nitrogen flux monitoring was conducted in large-scale, free-drainage lysimeter plots established in 2001. These lysimeters were specifically designed to enable simultaneous quantification of multiple nitrogen (N) loss pathways (e.g., gaseous emissions, leaching) and crop productivity metrics under field-realistic conditions, as detailed in Zhu et al. [26]. Soil N2O and NO fluxes were measured synchronously in situ from November 2015 to September 2016. Three static chambers per treatment (15 total chambers) were deployed, spatially distributed using a grid system to account for slope-induced variability. Gas sampling followed a static chamber protocol [32,33], with chambers (0.5 × 0.5 × 0.5 m3) positioned on permanently installed stainless-steel bases. Each chamber was equipped with a circulating fan to ensure gas uniformity, and the exterior was insulated to minimize temperature fluctuations that could affect gas concentration within the chamber. Gases sampling for N2O and NO was conducted daily for the first week following fertilizer application, then every other day for the second week, and subsequently twice weekly. Samples were collected between 9:00 a.m. and 11:00 a.m. local standard time. Specifically, five gas samples were sequentially collected from each chamber’s headspace using five 50 mL polypropylene syringes at 0, 7, 14, 21, and 28 min after sealing the chamber for N2O analysis. Additionally, gas from the headspace of each chamber was extracted using a suction pump at 0 and 28 min after sealing and then transferred into two 5 L aluminum foil bags (Dalian Chemical Industry Research and Design Institute) for NO measurement. A thermometer placed inside the chambers was used to monitor the temperature throughout the sampling duration.
N2O and NO concentrations were analyzed within 24 h after gas collection using a gas chromatograph (Agilent 6890, Agilent Technologies, Santa Clara, CA, USA) and NOX analyzer (Model 42i, Thermo Environmental Instruments Inc., Franklin, MA, USA), respectively. The GC-ECD (gas chromatograph-electron capture detector) and NOX analyzer were calibrated every 1 h with certified standard gases (N2O: 350 ppb; NO: 200 ppb), achieving detection limits of 0.5 ppb (N2O) and 2 ppb (NO). N2O and NO fluxes were calculated by analyzing the linear or nonlinear variations in gas concentrations in the chamber headspace over time [34]. These flux values were adjusted based on the measured air temperature and barometric pressure.

2.3. Auxiliary Data

Three soil samples (0–20 cm) were extracted from each sampling site concurrently with gas collection using a soil auger. After removing debris such as gravel and roots, the samples were thoroughly mixed. The concentrations of soil ammonium (NH4+), nitrate (NO3), and dissolved organic carbon (DOC) were measured using a continuous flow analyzer (model AA3, SEAL, Autoanalyzer3, Norderstedt, Germany) after rinsing the fresh soil with 2 M KCl solution and deionized water, respectively. A weather station at the experimental farm recorded daily rainfall and air temperature. Soil temperature at a depth of 5 cm was measured using a portable thermometer (JM624, Shanghai Automation Instrumentation Company, Shanghai, China) The soil volumetric water content (0–6 cm) was determined with a portable frequency domain reflectance moisture sensor (MPKit-100, Beijing, China). Soil water-filled pore space (WFPS) was calculated using the following formula:
WFPS =   100   soil   volumetric   water   content   1     ( soil   bulk   density / 2.65 ) ,
where the assumed soil particle density was 2.65 g cm−3.
After the wheat and maize reached maturity, aboveground biomass and crop yields were quantified in three randomly selected sample plots (1 m2) within each field. The crop yields for each section (grain and straw) were determined by drying at 105 °C for 30 min, followed by drying at 60 °C until a constant weight was achieved.

2.4. Calculations and Statistical Analysis

The aboveground N uptake (kg N ha−1) was calculated by multiplying the biomass of grain and straw by their respective N content [35]. The N surplus (kg N ha−1) was determined by subtracting the N inputs—comprising fertilizer N, N deposition, and biological N fixation—from the aboveground N uptake at harvest. Data on N deposition were sourced from Song et al. [36], who reported values of 9.0 kg N ha−1 for winter wheat (from October to May) and 14.1 kg N ha−1 for summer maize (from June to September) in southwest China. The biological N fixation for both wheat and maize were estimated at 5 kg N ha−1 [19]. The NUE (%) was calculated by subtracting the aboveground N uptake in the control plots from that in the fertilized plots, followed by dividing the result by the amount of fertilizer N applied. Seasonal and annual cumulative N2O and NO emissions were determined using linear interpolation between measurement dates. Seasonal and annual emissions factors for N2O, NO, and N2O+NO (EFd, %) were computed by dividing the total gas emissions from fertilized and control regimes by the amount of N applied. Yield-scaled emissions of N2O, NO, and N2O+NO (g N Mg−1 grain) were calculated by dividing total gas emissions by the grain yields of maize and wheat.
All data processing was conducted using Microsoft Excel 2021 (Microsoft Corporation, Redmond, WA, USA), and results are typically presented as means [standard error]. Data normality (Shapiro-Wilk test) and homogeneity of variance (Levene’s test) were verified prior to One-way analysis of variance (ANOVA). Significant differences (p < 0.05) among treatments were assessed via Tukey’s HSD post-hoc test. All statistical analyses were performed using IBM SPSS Statistics 19 (IBM Corp., Armonk, NY, USA). Unless explicitly specified, a significance threshold of p < 0.05 was used for all statistical tests. Figures were generated using SigmaPlot 14.0 (Systat Software Inc., San Jose, CA, USA).
The relationship between gas fluxes and environmental factors was analyzed using the dual Arrhenius–Michaelis–Menten kinetics model and a revised “hole-in-the-pipe” model. The dual Arrhenius–Michaelis–Menten kinetics model added explicit equations (e.g., Equation (1) in Table 2) and defined parameters (e.g., A, k1, k2, B, C) with units and derivation methods; soil NH4+, NO3, temperature, and moisture were integrated into the model. The revised “hole-in-the-pipe” model clarified modifications to the original framework (e.g., inclusion of WFPS and temperature) and explained how model performance was evaluated against field data (Equation (2) in Table 2, Figure S2). Structural equation models (SEMs) were constructed to demonstrate the direct and indirect effects of soil factors on N2O, NO, and N2O+NO emissions, as well as to assess the proportional contributions of each factor. SEM adjustments used specified variables (e.g., Ts, WFPS, NH4+, NO3, DOC), path coefficient interpretation, and criteria for model acceptance. SEM procedures followed established protocols common in agronomic studies, with model fit assessed using χ2/df < 2, RMSEA < 0.05, CFI > 0.95.

3. Results

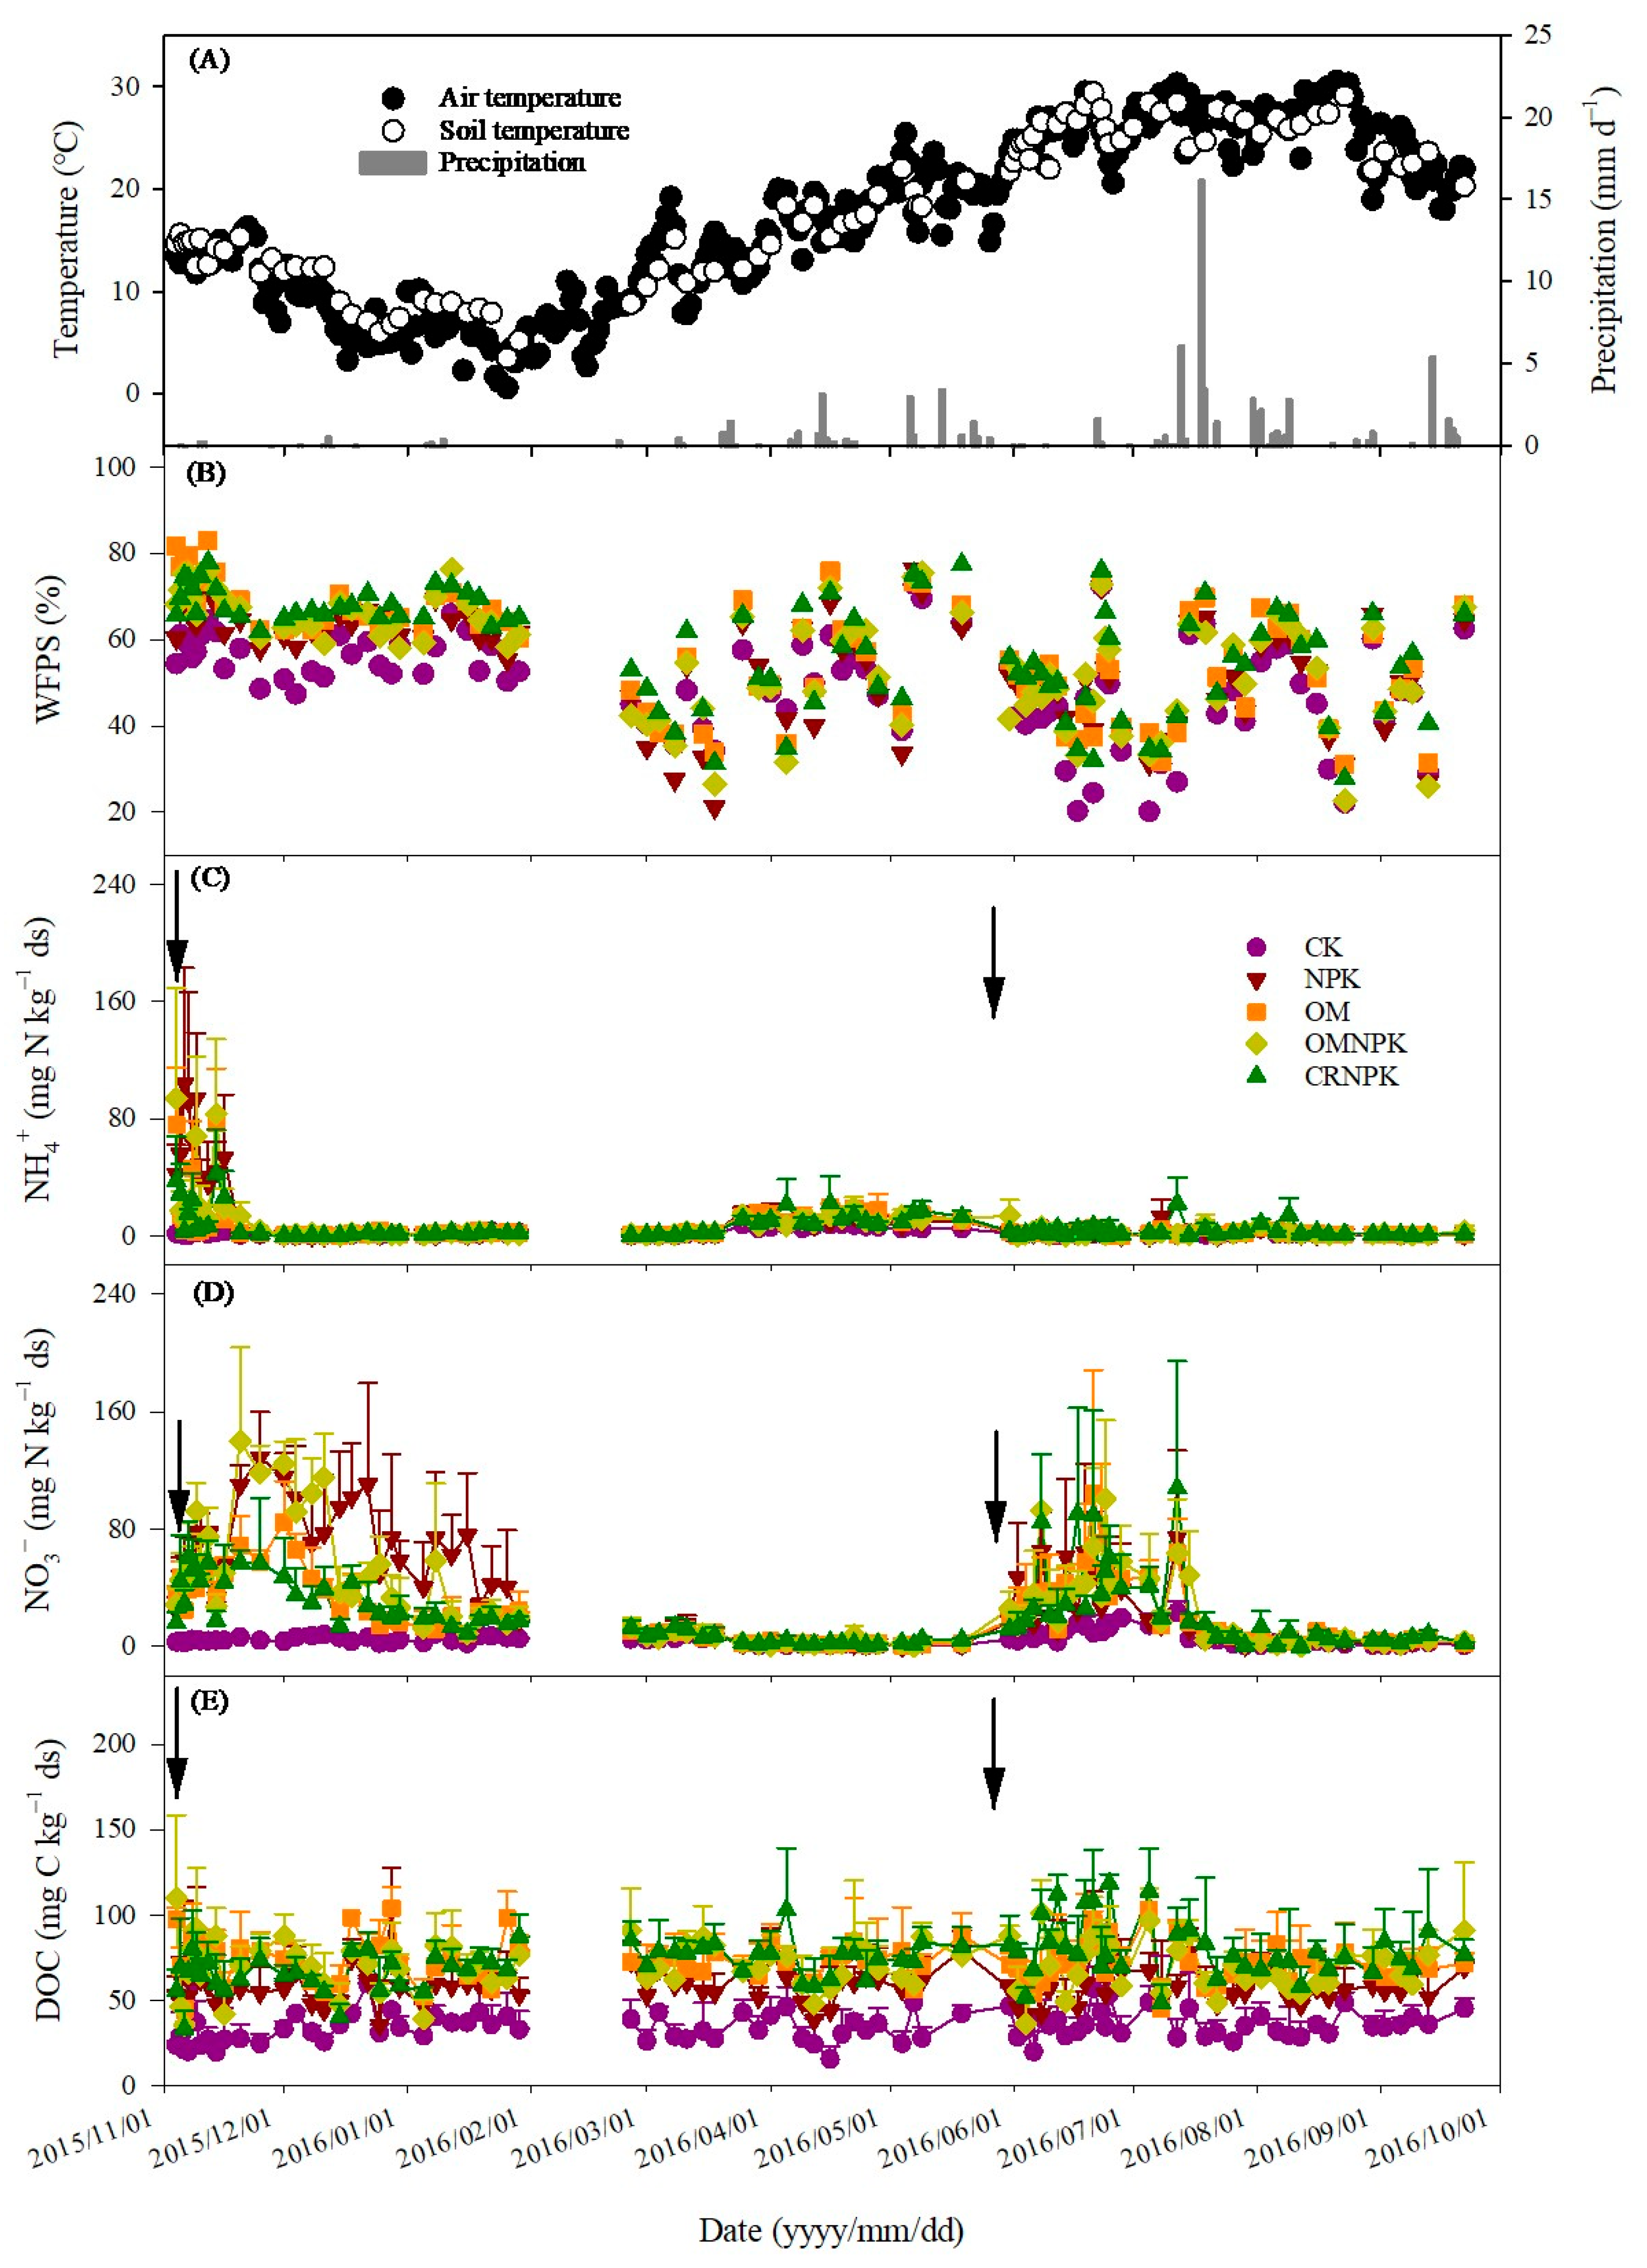
3.1. Environmental Factors

Seasonal air and soil (5 cm depth) temperatures averaged 16.9 °C and 18.2 °C, respectively, with minima in January and maxima in June–August 2016 (Figure 1A). Soil moisture (WFPS: 20–83%) and inorganic nitrogen concentrations (NH4+-N: 0.00–104.0 mg kg−1; NO3-N: 0.00–140.2 mg kg−1) fluctuated in response to fertilization and rainfall events (arrows in Figure 1B–D). Dissolved organic carbon (DOC) was significantly higher in organic-amended treatments (OM, OMNPK, CRNPK: 15.72–118.4 mg C kg−1) than in NPK (p < 0.05; Figure 1E), suggesting enhanced carbon availability under organic inputs.

3.2. Crop Yields and Nitrogen Use Efficiency (NUE)

Crop yields and NUE varied significantly across treatments (Table 3). CRNPK (crop residue substitution) outperformed other regimes, achieving the highest annual yield (13.3 Mg ha−1) and NUE (66–77%), while OM exhibited the lowest yield (10.0 Mg ha−1) and NUE (49%). Notably, partial substitution (CRNPK, OMNPK) reduced annual N surplus by 15–54% compared with OM (p < 0.01), highlighting their efficiency in balancing nitrogen retention and productivity.

3.3. N2O Flux Dynamics

N2O emissions peaked following fertilization and rainfall (16.2 mm), with OM exhibiting the highest fluxes (mean: 172.4 μg N m−2 h−1) and NPK the lowest (26.6 μg N m−2 h−1; Figure 2A). Cumulative N2O emissions ranged from 0.18–2.76 kg N ha−1 (wheat) and 0.22–3.75 kg N ha−1 (maize), exponentially linked to soil N surplus (R2 = 0.65, p < 0.01, Table 4, Figure 3). Direct N2O emission factors ( EF d N 2 O ) were highest in OM (2.18%) and lowest in NPK (0.29%), inversely correlating with NUE (R2 = 0.58, p < 0.01, Table 4, Figure 3). Yield-scaled N2O emissions (123–709 g N Mg−1 grain, Table 5) were highest in the OM treatment, mirroring this trend, negatively correlating with NUE (R2 = 0.54; Figure 3).

3.4. NO Flux Dynamics

NO fluxes were an order of magnitude lower than N2O (mean: 5.32 vs. 66.88 μg N m−2 h−1), peaking following fertilization (Figure 2A,B). OM produced the highest NO emissions (12.26 μg N m−2 h−1), significantly exceeding CRNPK (3.02 μg N m−2 h−1; p < 0.05). Consequently, the seasonal patterns of N2O+NO fluxes (mean: 72.20 μg N m−2 h−1, Figure 2C) closely resembled to those of N2O fluxes. Cumulative NO emissions (0.02–0.66 kg N ha−1 yr−1) and EF d NO (0.08–0.23%) followed similar exponential relationships with N surplus (R2 = 0.73, Figure 3) and NUE (R2 = 0.82; Figure 3). Yield-scaled NO emissions (6–50 g N Mg−1 grain) were 1.9–3.6 times higher in OM than other treatments (p < 0.05, Table 5).

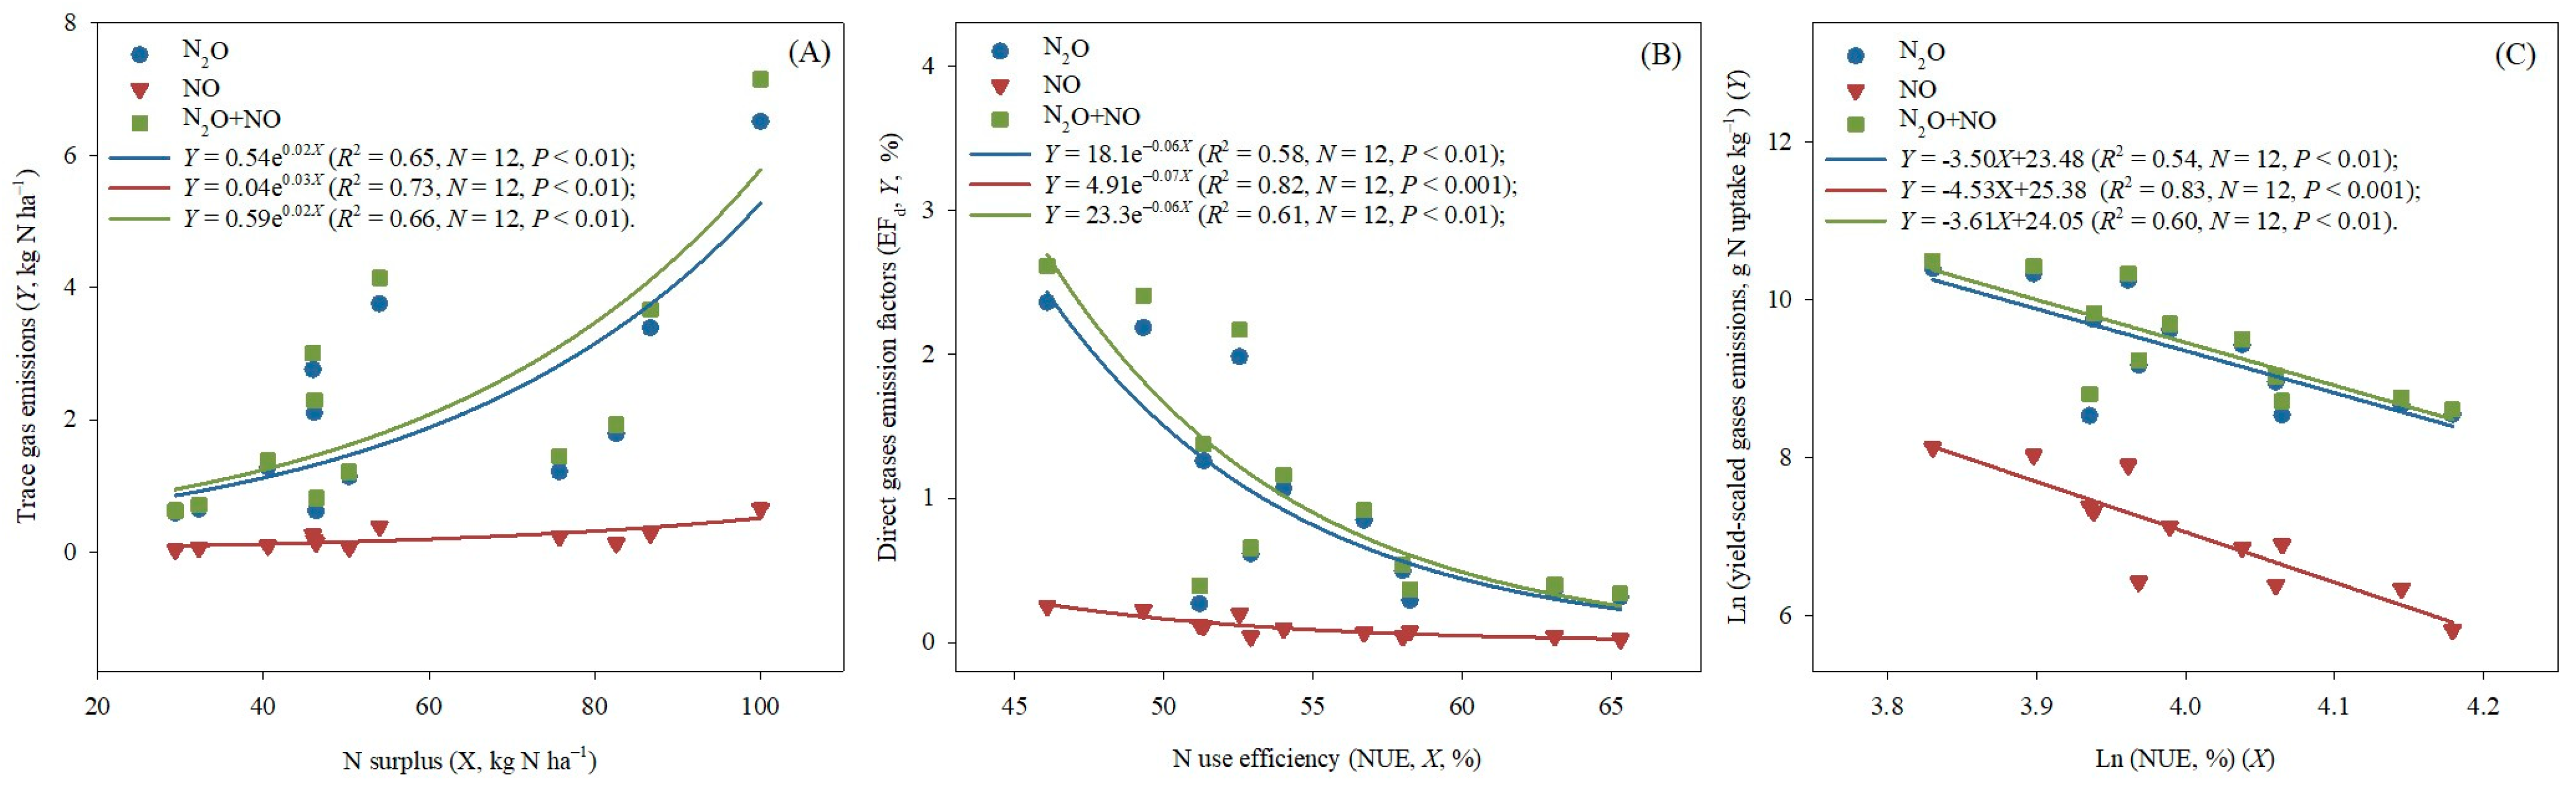
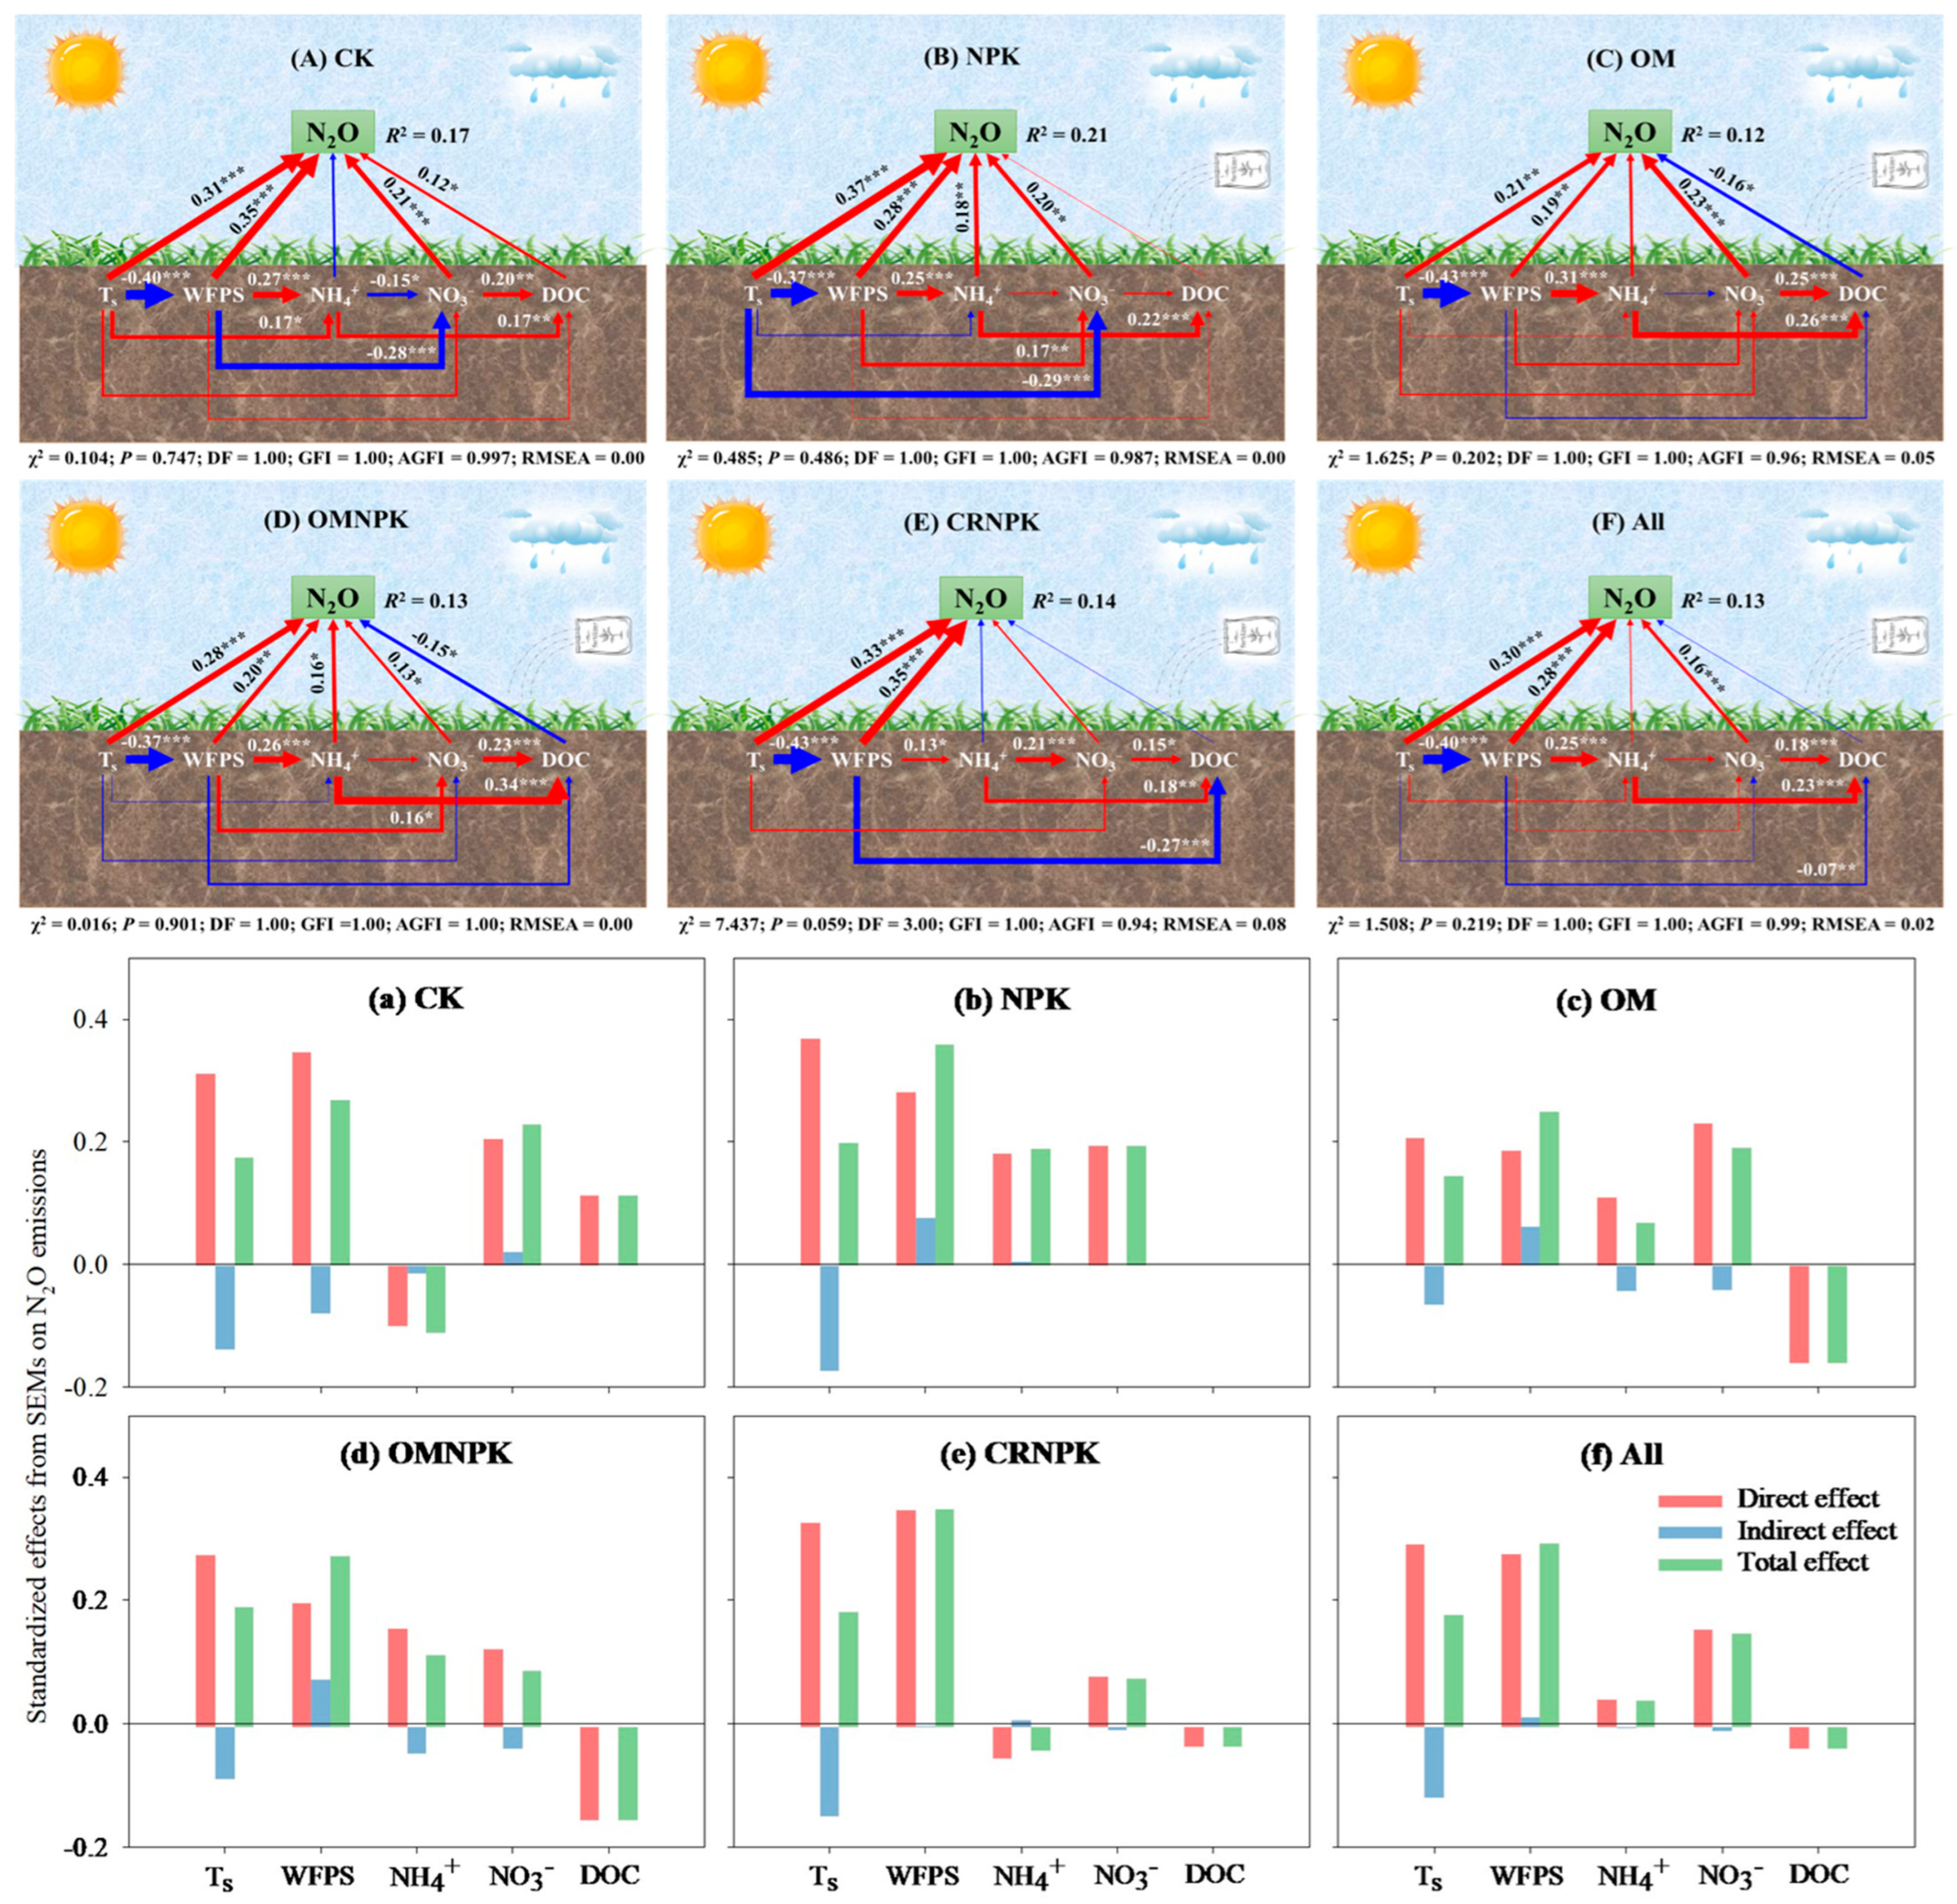
3.5. Soil Drivers of N2O and NO Emissions

To evaluate the influence of soil temperature (Ts), soil moisture (WFPS), and N substrates (NH4+ and NO3) on variations in N2O, NO, and N2O+NO fluxes, we employed the dual Arrhenius–Michaelis–Menten kinetics model based on enzymatic microbial processes (Equation (1) in Table 2). The results indicated that the combined effects of soil environmental factors could explain the variations in soil N2O+NO, and N2O+NO fluxes by 29–96%, 5–31%, and 28–95%, respectively (p < 0.01). The CRNPK had the highest explanatory power for gas emissions (N2O, NO, and N2O+NO were 96%, 34%, and 95%, respectively, p < 0.01, Table 2).
Prior studies have established a functional relationship between N2O+NO fluxes and soil NH4++NO3 contents using the “hole-in-the-pipe” concept [37,38,39]. The results of this study indicate that changes in soil nitrogen substrate (NH4++NO3) concentrations can explain the variations in N2O+NO fluxes by 32%, 40%, and 28% in the wheat season, maize season, and annually, respectively (Figure S2). A revised “hole-in-the-pipe” model, as shown in Equation (2) in Table 2, incorporated Ts and WFPS improved predictions of N2O+NO fluxes (explanatory power: 44% vs. 28% original; Figure S2).
To further elucidate the effects of soil environmental factors (Ts, WFPS, NH4+, and NO3) on N2O, NO, and N2O+NO fluxes, we developed SEMs to describe the direct and indirect effects of each soil factor on nitrogenous gas emissions. The SEM results indicated strong connections among soil environmental factors, explaining the variations in N2O, NO, and N2O+NO fluxes by 12–21%, 2–10%, and 13–22%, respectively (Figure 4, Figure 5 and Figure S3). Structural equation models (SEMs) further identified Ts (path coefficient: 0.30) and WFPS (0.28) as direct drivers of N2O, while NH4+ and NO3 dominated NO fluxes (0.38; Figure 4 and Figure 5). Organic amendments (OM, CRNPK, and OMNPK regimes) suppressed emissions via DOC-mediated pathways (p < 0.05), aligning with the revised “hole-in-the-pipe” model, which integrated soil moisture and temperature to improve predictive accuracy (explanatory power: 44% vs. 28%; Figure S2). The impact of soil environmental factors on N2O+NO emissions (Figure S3) was similar to that on N2O emissions.

4. Discussion

4.1. Crop Yields and NUE

Partial substitution of inorganic fertilizers with organic amendments enhanced crop yields and NUE in this subtropical wheat–maize system, aligning with global trends in sustainable intensification [40,41]. This is mainly because the addition of organic amendments on top of inorganic fertilizers provides additional nutrients for microbial growth and activity and reduces the mineralization of soil organic carbon, thereby increasing crop yields [42]. CRNPK (15% residue substitution) outperformed OMNPK (30% manure substitution), increasing yields by 24–27% (p < 0.05; Table 3), primarily due to higher NUE (66–77%) and reduced N surplus (15.5–23.9 kg N ha−1). The superior performance of residue substitution likely stems from its higher C–N ratio (59–65 vs. 16 for manure), which temporarily immobilizes N, stimulating microbial activity and synchronizing N release with crop demand [43,44,45]. In contrast, manure’s rapid mineralization under fluctuating redox conditions elevated NH4+ availability, promoting nitrification-derived NO emissions (Figure 5).
While long-term organic fertilization enhances SOC [21], our 12-year trial revealed yield instability under sole manure application (OM), consistent with findings in arid systems [46]. Yield stability depended on the relative contribution of soil fertility and fertilizer to yield. When organic fertilizer was used as a replacement nutrient for inorganic fertilizer, it will increase the contribution of fertilizer to yield and thus increase yield stability [21]. Although the use of organic fertilizer usually increases the SOC pool, its effect on yield trends has not been consistent, as reflected in long-term trials [47,48]. In this long-term experiment, total nitrogen application was the same for OM, NPK, OMNPK, and CRNPK treatments. The crop yield was the lowest in OM treatment, while NPK treatment increased the crop yields by 10–21% compared to OM treatment (Table 3), indicating that the nutrient use efficiency of inorganic fertilizers is higher than that of organic fertilizers in this soil. As Yan et al. [21] also confirmed, the contribution of chemical fertilizers to yield was greater than that of organic fertilizers. This underscores the importance of balancing organic and inorganic inputs. Excessive organic substitution (e.g., >30% manure) risks N losses via leaching and volatilization, particularly in subtropical climates with monsoonal rainfall. Future studies should quantify the threshold substitution ratios that maximize SOC sequestration without compromising yield stability across diverse pedoclimatic zones.

4.2. N2O and NO Emissions

The majority of studies concur with the “hole-in-the-pipe” model [37], which posits that N2O and NO emissions are predominantly influenced by the availability of nitrogen substrates for microbial processes. However, the revised ‘hole-in-the-pipe’ model underscores that soil redox potential (Eh), interacting with temperature, moisture, and nitrogen substrates, governs microbial N transformations. For instance, low Eh under waterlogged conditions (WFPS > 60%) promotes denitrification, while high Eh in aerated soils enhances nitrification (Figure 4). These dynamics explain the observed emission peaks following heavy rainfall (Figure 1A), where reduced Eh intensified denitrification-derived N2O fluxes. Furthermore, the revised “hole-in-the-pipe” model exhibits an increased explanatory power, with a value of 1.6 times higher than that of the original model. Moreover, the dual Arrhenius–Michaelis–Menten kinetics model has been utilized in prior studies to elucidate fluxes of CO2, N2O, and N2 observed in situ or in the laboratory [49,50]. In this study, we expanded the application of the dual Arrhenius–Michaelis–Menten kinetics model to N2O and NO emissions under different fertilization regimes in a wheat–maize rotation system (Table 2, Equation (1)). The findings of this study indicate a significant correlation between N2O and NO emissions and soil temperature, moisture, and nitrogen substrate availability. The dual kinetics model and SEMs reveal that redox potential (Eh) indirectly modulates N2O/NO emissions by shaping microbial community structure. For example, low Eh suppresses nosZ-harboring denitrifiers, increasing N2O/N2 ratios. Conversely, high Eh enriches ammonia oxidizers (AOB), elevating NO fluxes. For N2O emissions, the three main controlling factors are soil moisture, temperature, and NO3 content (Figure 4f). The impact of WFPS on N2O in this study is positive (Figure 4), and a heavy rainfall event in the maize season contributed to a high emission peak period for N2O (Figure 1A and Figure 2A). The positive correlation between WFPS and N2O emissions (Figure 4) reflects redox-driven microbial activity. Heavy rainfall during the maize season reduced soil Eh, triggering denitrification hotspots. Similar patterns have been observed in rice paddies, where episodic flooding increased N2O fluxes by 40–60% [51]. Additionally, the temperature coefficient of N2O is lower than that of NO (0.050 vs. 0.094, Table 2, Equation (1)). Furthermore, denitrification, as an anaerobic process, is less sensitive to temperature compared to nitrification [52,53]. Concurrently, NO3 as a substrate for denitrification exerts a greater influence on N2O emissions than NH4+ (Figure 4f). In summary, the denitrification process of soil microorganisms is the primary origin of N2O in this study. For NO emissions, NH4+, NO3, and temperature as the primary controlling factors (Figure 5f). With the exception of the CRNPK treatment, NH4+, as a substrate for nitrification, exerts the most significant influence on NO emissions (Figure 5). The relatively high temperature coefficient of NO (Table 2, Equation (1)) corresponds to the strong dependence of nitrification on temperature [39]. Furthermore, the minimal impact of WFPS and DOC on NO (Figure 5) once again substantiates that nitrification may be the primary pathway for NO emissions. This study further demonstrates the efficacy of the revised “hole-in-the-pipe” model and the dual kinetics model in elucidating N2O and NO emissions observed in agricultural fields from a mechanistic perspective. However, further validation is necessary through experiments conducted under varying conditions.
Compared with the OM treatment, the OMNPK and CRNPK treatments significantly reduced N2O and NO emissions by 0.8–4.3 times (Table 4, p < 0.05). This is mainly because a higher nitrogen surplus leads to higher N2O and NO emissions (Table 3, Figure 3). Previous studies have also shown that more mineral nitrogen is conducive to the production of N2O and NO [6,54]. For various organic amendments substitution regimes, the emissions of N2O and NO in the OMNPK treatment were 1.7–2.0 times than those of the CRNPK treatment. Additionally, the CRNPK and OMNPK treatments significantly reduced the annual cumulative emissions of N2O+NO compared to the OM treatment (p < 0.05). This discrepancy may be because the C–N ratio of manure (16:1) is less than the perfect balance diet of 24:1 required by soil microorganisms, resulting in excess nitrogen being left in the soil. The low C–N ratio of manure (16:1) probably depleted the labile carbon, limiting electron donors for complete denitrification (N2O → N2). This imbalance, combined with elevated NH4+ from mineralization, intensified nitrification under fluctuating Eh, as has been shown in vegetable systems [46]. Optimizing C–N ratios (e.g., residue incorporation) can stabilize Eh and reduce N losses. The N surplus with the OM treatment was 1.1–3.0 times that with the OMNPK and CRNPK treatments, further verifying the above viewpoint (Table 3 and Figure 3). NO emissions in the CRNPK plot were the lowest among all fertilization treatments, and the NO emissions in the CRNPK plot were 70% less than those in the NPK plot (Table 4). This phenomenon may be attributed to the higher DOC content observed in the CRNPK treatment as compared to the NPK treatment (mean: 74 mg N kg vs. 59 mg N kg, Figure 1E), prompting the CRNPK plot to be more prone to denitrification rather than nitrification. It is well established that NO primarily originates from nitrification, and the multivariate nonlinear model and structural equation model employed in this study further substantiate this assertion. Critically, organic substitution does not universally reduce emissions; while CRNPK lowered annual N2O+NO emissions by 15–154% versus OM (p < 0.05), OMNPK’s higher labile N content intensified nitrification under aerobic conditions (Figure 4). This aligns with tropical studies where manure increased NO fluxes by 30–50% [9], highlighting the context-dependency of organic fertilization benefits. Our dual Arrhenius–Michaelis–Menten model further identified temperature (Q10-N2O: 0.050 vs. Q10-NO: 0.094) and NO3 as key drivers, emphasizing the dominance of denitrification in N2O production (Figure 4f). Notably, single-year flux data may underestimate interannual variability, particularly in monsoon-driven systems. Additionally, SEMs explained only 12–22% of emission variance, suggesting that unmeasured factors (e.g., microbial gene abundance) require future exploration.
During the wheat–maize rotation cycle, the average annual EFd values for N2O in the NPK, OM, CRNPK, and OMNPK plots were 0.29%, 2.18%, 0.50%, and 1.07%, respectively. The estimated annual EFd values for N2O in this study were within the range of EFd for Chinese croplands (0.20–2.80%, [55]). The average annual EFd value for N2O across the four treatments was 1.01%, consistent with the average value of 1.05% for Chinese dryland soils [50] and the default coefficient of 1.0% for global dryland soils according to the IPCC [56]. The average annual EFd value for NO in this study’s wheat–maize rotation was 0.11%, within the range of EFd for Chinese croplands (0.04–0.67%, [57]). However, it was significantly lower than the global average for fertilized soils (1.16%, [58]) and the default values of 0.7% [56] and 1.1% [59] for dryland soils. Furthermore, the mean annual EFd value for N2O+NO in the wheat–maize system was 1.12%, much lower than the estimated value of 2.58% for global fertilized dryland soils by Liu et al. [58]. Generally, EFd for N2O and NO is related to local climate, soil conditions, and field management practices [22,60]. The relatively low EFd values for NO and N2O+NO in this study may be attributable to the relatively high pH value and low SOC content of the soil, as previous studies have indicated a significant negative correlation between direct emission factors of trace gases and pH value [22,61].

4.3. A Promising Strategy to Mitigate N2O and NO Emissions While Maintaining Crop Yields

Currently, facing the significant challenges of ensuring food production and mitigating climate change risk, focusing on yield-scaled trace gas emissions is more important than focusing solely on trace gas emissions [62,63,64]. At the same time, focusing on the total yield-scaled emissions of N2O+NO is more conducive to addressing the food security and environmental issues faced by current intensive agricultural production systems than focusing solely on yield-scaled N2O emissions. Yield-scaled N2O+NO emissions—a critical metric for climate-smart agriculture—were 1.5–5.7 times lower under CRNPK than OM (p < 0.05; Table 5). This reduction stems from CRNPK’s dual capacity to enhance NUE (66–77%) and stabilize Eh via residue-induced C sequestration, suppressing denitrification hotspots [14,65]. By contrast, manure’s low C:N ratio exacerbated N surplus (54.0 kg N ha−1 in OM), driving exponential emission increases (R2 = 0.55; Figure 3A).
Meanwhile, crop NUE and soil nitrogen surplus are also commonly used as effective indicators for assessing crop yields, nitrogen fertilizer fate, and environmental impact [25,27]. In this study, we found that the emissions of N2O, NO, and N2O+NO were extremely significantly positively correlated with soil nitrogen surplus (p < 0.01, Figure 3A), while the EFd and yield-scaled emissions of N2O, NO, and N2O+NO were negatively correlated with crop NUE (p < 0.01, Figure 3B,C). Similarly, Yao et al. [65] found a negative correlation between the EFd of N2O+NO and crop NUE in a wheat-based cropping system on the North China Plain.
Integration of optimized organic–inorganic fertilization and intercropping strategies as demonstrated in this study not only minimizes nitrogen losses but also offers scalable solutions for diverse agroecosystems. For instance, substituting 20–30% of inorganic N with organic amendments (e.g., crop residues or manure) mitigates soil N surplus and promotes microbial communities that favor complete denitrification (e.g., nosZ-harboring bacteria), as evidenced in subtropical rice–wheat rotations and vegetable systems [10,66]. Crucially, the observed reductions in N leaching (15–45%) and emissions (17–40%) across studies underscore the universality of balancing organic inputs and crop functional diversity to stabilize soil redox conditions and N cycling [51]. Such strategies are adaptable to varying climates—from humid tropics to temperate zones—by tailoring organic substitution ratios and intercrop species to local soil and hydrological constraints.
While the CRNPK strategy demonstrates clear advantages in subtropical wheat–maize systems, its broader applicability requires careful consideration of uncontrolled factors. This study focused on a fixed nitrogen inputs (280 kg N ha−1 yr−1), limiting extrapolation to soils with contrasting textures (e.g., clayey Vertisols) or redox dynamics (e.g., waterlogged paddies). Furthermore, interannual climate variability—particularly monsoon intensity—was not captured in this single-year trial. Extreme rainfall events could amplify denitrification-driven N2O fluxes, while droughts might elevate NO emissions via nitrification, underscoring the need for multi-year validations across diverse agroecological zones. In addition, the study’s models, though improved, explain only 12–44% of emission variability, suggesting unmeasured drivers such as microbial gene abundance (e.g., nosZ, amoA) or dissolved oxygen dynamics. SEMs attributed 12–22% of N2O/NO variance to measured soil factors (Figure 4 and Figure 5), leaving room for integrating microbial genomics into future frameworks. Notably, the long-term sustainability of CRNPK remains uncertain. While residue substitution enhanced short-term SOC and NUE, its capacity to sustain yield stability and SOC accumulation over decades—particularly under climate change—requires validation through trials >15 years. To scale CRNPK’s benefits, interdisciplinary efforts are needed. First, substitution thresholds (e.g., 15–30% residue) should be validated across soil types and cropping systems. Second, research should explore co-ordination with precision irrigation or nitrification inhibitors to further optimize NUE. Finally, real-time Eh sensors and remote sensing should be integrated in order to refine emission inventories and support adaptive management in redox-variable environments.

5. Conclusions

The above results indicate that reducing nitrogen surplus and improving crop NUE may be an effective means for reducing the negative environmental impact of intensive agriculture. The OM had the highest soil nitrogen surplus and the lowest crop NUE, while partial substitution of inorganic fertilizers with organic amendments reduced soil nitrogen surplus (annual: 15–154%) and increased crop NUE (annual: 10–45%). Crop residue substitution had lower nitrogen surplus and higher crop NUE than manure substitution. Partial substitution of inorganic fertilizers with organic amendments, especially crop residues, represents a promising management strategy for achieving sustainable intensification in subtropical wheat–maize systems. This approach not only supports food security but also contributes to climate change mitigation by reducing N-trace gas emissions.

Supplementary Materials

The following supporting information can be downloaded at https://www.mdpi.com/article/10.3390/agriculture15101108/s1, Figure S1: Seasonal dynamics of soil temperatures (5 cm) for the winter wheat-summer maize cropping system under different treatments; Figure S2: Relationships between nitrous oxide plus nitric oxide (N2O+NO) fluxes and soil ammonium plus nitrate (NH4++NO3) contents under different treatments across the winter wheat, summer maize and annual scale; Figure S3: Structural equation models (SEMs) evaluating the direct, indirect, and total effects on nitrous oxide plus nitric oxide (N2O+NO) fluxes; Table S1: Summary of meteorological parameters from 2015 to 2016; Table S2: Soil physic-chemical characteristic in the field experiment (0–20 cm).

Author Contributions

Conceptualization and methodology, Y.L., L.H., Z.Y. and B.Z.; software and validation, Y.L. and S.Z.; formal analysis and investigation, Y.L., Z.Y. and B.Z.; resources, M.Z. and B.Z.; data curation, B.Z.; writing—original draft preparation, Y.L.; writing—review and editing, Y.L., Z.Y. and B.Z.; supervision, project administration and funding acquisition, M.Z. and B.Z. All authors have read and agreed to the published version of the manuscript.

Funding

This research was funded by the National Natural Science Foundation of China (U20A20107).

Institutional Review Board Statement

Not applicable.

Data Availability Statement

Data are contained within the article. The original contributions presented in this study are included in the article. Further inquiries can be directed to the corresponding author.

Acknowledgments

We sincerely thank the staff of the Yanting Agro-Ecological Station of Purple Soil for their great contributions to the field measurements.

Conflicts of Interest

The authors declare no conflict of interest.

References

  1. IPCC. Climate Change 2021: The Physical Science Basis; Cambridge University Press: Cambridge, UK, 2021; Available online: https://www.ipcc.ch/report/ar6/wg1/ (accessed on 26 June 2022).
  2. Zhang, X.; Davidson, E.A.; Mauzerall, D.L.; Searchinger, T.D.; Dumas, P.; Shen, Y. Managing nitrogen for sustainable development. Nature 2015, 528, 51–59. [Google Scholar] [CrossRef]
  3. Lassaletta, L.; Billen, G.; Garnier, J.; Bouwman, L.; Velazquez, E.; Mueller, N.D.; Gerber, J.S. Nitrogen use in the global food system: Past trends and future trajectories of agronomic performance, pollution, trade, and dietary demand. Environ. Res. Lett. 2016, 11, 095007. [Google Scholar] [CrossRef]
  4. Davidson, E.A. The contribution of manure and fertilizer nitrogen to atmospheric nitrous oxide since 1860. Nat. Geosci. 2009, 2, 659–662. [Google Scholar] [CrossRef]
  5. IPCC. Climate Change 2013: The Physical Science Basis; Stocker, T.F., Qin, D., Plattner, G.K., Tignor, M.M.B., Allen, S.K., Boschung, J., Nauels, A., Xia, Y., Bex, V., Midgley, P.M., Eds.; Cambridge University Press: Cambridge, UK, 2013; p. 1535. [Google Scholar]
  6. Bouwman, A.F.; Boumans, L.J.M.; Batjes, N.H. Emissions of N2O and NO from fertilized fields: Summary of available measurement data. Glob. Biogeochem. Cycles 2002, 16, 1058. [Google Scholar] [CrossRef]
  7. Yao, Z.; Zhou, Z.; Zheng, X.; Xie, B.; Liu, C.; Butterbach-Bahl, K.; Zhu, J. Effects of tillage during the nonwaterlogged period on nitrous oxide and nitric oxide emissions in typical Chinese rice–wheat rotation ecosystems. J. Geophys. Res. Biogeosci. 2010, 115, G00H12. [Google Scholar] [CrossRef]
  8. Fracetto, F.J.C.; Fracetto, G.G.M.; Bertini, S.C.B.; Cerri, C.C.; Feigl, B.J.; Siqueira Neto, M. Effect of agricultural management on N2O emissions in the Brazilian sugarcane yield. Soil Biol. Biochem. 2017, 109, 205–213. [Google Scholar] [CrossRef]
  9. Foltz, M.E.; Zilles, J.L.; Koloutsou-Vakakis, S. Prediction of N2O emissions under different field management practices and climate conditions. Sci. Total Environ. 2019, 646, 872–879. [Google Scholar] [CrossRef] [PubMed]
  10. Hei, Z.; Chen, Y.; Zhang, F.; de Vries, W. Full substitution of chemical fertilizer by organic manure decreases soil N2O emissions driven by ammonia oxidizers and gross nitrogen transformations. Glob. Change Biol. 2023, 30, e16957. [Google Scholar] [CrossRef]
  11. Sun, C.; Zheng, H.; He, S.; Zhao, Q.; Liu, Y.; Liu, H. Partial substitution of chemical fertilizer by organic fertilizer increases yield, quality and nitrogen utilization of Dioscorea polystachya. PLoS ONE 2024, 19, e0301108. [Google Scholar] [CrossRef]
  12. Lal, R. Soil carbon sequestration impacts on global climate change and food security. Science 2004, 304, 1623–1627. [Google Scholar] [CrossRef]
  13. Nyamadzawo, G.; Wuta, M.; Nyamangara, J.; Smith, J.L.; Rees, R.M. Nitrous oxide and methane emissions from cultivated seasonal wetland (dambo) soils with inorganic, organic and integrated nutrient management. Nutr. Cycl. Agroecosyst. 2014, 100, 161–175. [Google Scholar] [CrossRef]
  14. Yuan, J.; Sha, Z.; Hassani, D.; Zhao, Z.; Cao, L. Assessing environmental impacts of organic and inorganic fertilizer on daily and seasonal Greenhouse gases effluxes in rice field. Atmos. Environ. 2017, 155, 119–128. [Google Scholar] [CrossRef]
  15. Zhao, Z.; Yue, Y.; Sha, Z.; Li, C.; Deng, J.; Zhang, H.; Gao, M.; Cao, L. Assessing impacts of alternative fertilizer management practices on both nitrogen loading and greenhouse gas emissions in rice cultivation. Atmos. Environ. 2015, 119, 393–401. [Google Scholar] [CrossRef]
  16. Graham, R.F.; Wortman, S.E.; Pittelkow, C.M. Comparison of organic and integrated nutrient management strategies for reducing soil N2O emissions. Sustainability 2017, 9, 510. [Google Scholar] [CrossRef]
  17. Abalos, D.; Sanz-Cobena, A.; Garcia-Torres, L.; van Groenigen, J.W.; Vallejo, A. Role of maize stover incorporation on nitrogen oxide emissions in a non-irrigated Mediterranean barley field. Plant Soil 2013, 364, 357–371. [Google Scholar] [CrossRef]
  18. Yao, Z.; Wang, Y.; Wang, R.; Wang, X.; Wang, Y.; Zheng, X.; Liu, C.; Zhu, B.; Zhou, M.; Liu, Y.; et al. Long-term straw return to a wheat-maize system results in topsoil organic C saturation and increased yields while no stimulating or reducing yield-scaled N2O and NO emissions. Agric. For. Meteorol. 2024, 349, 109937. [Google Scholar] [CrossRef]
  19. Bouwman, L.; Goldewijk, K.K.; Van Der Hoek, K.W.; Beusen, A.H.W.; Van Vuuren, D.P.; Willems, J.; Rufino, M.C.; Stehfest, E. Exploring global changes in nitrogen and phosphorus cycles in agriculture induced by livestock production over the 1900–2050 period. Proc. Natl. Acad. Sci. USA 2013, 110, 20882–20887. [Google Scholar] [CrossRef]
  20. Ma, R.; Yu, K.; Xiao, S.; Liu, S.; Ciais, P.; Zou, J. Data-driven estimates of fertilizer induced soil NH3, NO and N2O emissions from croplands in China and their climate change impacts. Glob. Change Biol. 2022, 28, 1008–1022. [Google Scholar] [CrossRef]
  21. Yan, X.; Gong, W. The role of chemical and organic fertilizers on yield, yield variability and carbon sequestration- results of a 19-year experiment. Plant Soil 2010, 331, 471–480. [Google Scholar] [CrossRef]
  22. Wang, Y.; Yao, Z.; Zheng, X.; Subramaniam, L.; Butterbach-Bahl, K. A synthesis of nitric oxide emissions across global fertilized croplands from crop-specific emission factors. Glob. Change Biol. 2022, 28, 4395–4408. [Google Scholar] [CrossRef]
  23. Cheng, Y.; Xie, W.; Huang, R.; Yan, X.; Wang, S. Extremely high N2O but unexpectedly low NO emissions from a highly organic and chemical fertilized peach orchard system in China. Agric. Ecosyst. Environ. 2017, 246, 202–209. [Google Scholar] [CrossRef]
  24. Zhou, M.; Butterbach-Bahl, K. Assessment of nitrate leaching loss on a yield-scaled basis from maize and wheat cropping systems. Plant Soil 2014, 374, 977–991. [Google Scholar] [CrossRef]
  25. Yao, Z.; Yan, G.; Zheng, X.; Wang, R.; Liu, C.; Butterbach-Bahl, K. Straw return reduces yield-scaled N2O plus NO emissions from annual winter wheat-based cropping systems in the North China Plain. Sci. Total Environ. 2017, 590–591, 174–185. [Google Scholar] [CrossRef] [PubMed]
  26. Zhu, B.; Yao, Z.; Hu, D.; Bar, H. Effects of substitution of mineral nitrogen with organic amendments on nitrogen loss from sloping cropland of purple soil. Front. Agric. Sci. Eng. 2022, 9, 396–406. [Google Scholar] [CrossRef]
  27. Brentrup, F.; Lammel, J. Nitrogen use efficiency, nitrogen balance, and nitrogen productivity–A combined indicator system to evaluate nitrogen use in crop production systems. In Proceedings of the International Nitrogen Initiative Conference: Solutions to Improve Nitrogen Use Efficiency for the World, Melbourne, Australia, 4–8 December 2016. [Google Scholar] [CrossRef]
  28. Zhu, B.; Wang, T.; You, X.; Gao, M.R. Nutrient release from weathering of purplish rocks in the Sichuan Basin, China. Pedosphere 2008, 18, 257–264. [Google Scholar] [CrossRef]
  29. Zhou, M.; Zhu, B.; Brüggemann, N.; Dannenmann, M.; Wang, Y.; Butterbach-Bahl, K. Sustaining crop productivity while reducing environmental nitrogen losses in the subtropical wheat-maize cropping systems: A comprehensive case study of nitrogen cycling and balance. Agric. Ecosyst. Environ. 2016, 231, 1–14. [Google Scholar] [CrossRef]
  30. Zhang, F.; Chen, Y.; Li, J.; Wang, L. Sustainable agricultural practices in subtropical China: Balancing productivity and environmental impacts. Nat. Food 2022, 3, 197–206. [Google Scholar] [CrossRef]
  31. Liu, Z.; Wang, B.; Li, Z.; Zhao, C.; Qian, R.; Huang, F.; Zhang, P.; Li, H.; Jia, Z. Ameliorating C and N balance without loss of productivity by applying mulching measures in rainfed areas. Agric. Ecosyst. Environ. 2023, 343, 108267. [Google Scholar] [CrossRef]
  32. Zheng, X.; Mei, B.; Wang, Y.; Xie, B.; Wang, Y.; Dong, H.; Xu, H.; Chen, G.; Cai, Z.; Yue, J. Quantification of N2O fluxes from soil-plant systems may be biased by the applied gas chromatograph methodology. Plant Soil 2008, 311, 211–234. [Google Scholar] [CrossRef]
  33. Yao, Z.; Zheng, X.; Xie, B.; Mei, B.; Wang, R.; Butterbach-Bahl, K.; Zhu, J.G.; Yin, R. Tillage and crop residue management significantly affects N-trace gas emissions during the non-rice season of a subtropical rice–wheat rotation. Soil Biol. Biochem. 2009, 41, 2131–2140. [Google Scholar] [CrossRef]
  34. Kroon, P.S.; Hensen, A.; van den Bulk, W.C.M.; Jongejan, P.A.C.; Vermeulen, A.T. The importance of reducing the systematic error due to non-linearity in N2O flux measurements by static chambers. Nutr. Cycl. Agroecosyst. 2008, 82, 175–186. [Google Scholar] [CrossRef]
  35. Gu, B.J.; Ju, X.T.; Chang, J.; Ge, Y.; Vitousek, P.M. Integrated reactive nitrogen budgets and future trends in China. Proc. Natl. Acad. Sci. USA 2015, 112, 8792–8797. [Google Scholar] [CrossRef] [PubMed]
  36. Song, L.; Kuang, F.; Skiba, U.; Zhu, B.; Liu, X.; Levy, P.; Dore, A.; Fowler, D. Bulk deposition of organic and inorganic nitrogen in southwest China from 2008 to 2013. Environ. Pollut. 2017, 227, 157–166. [Google Scholar] [CrossRef]
  37. Firestone, M.; Davidson, E. Microbiological Basis of NO and N2O Production and Consumption in Soils. In Exchange of Trace Gases Between Terrestrial Ecosystems and the Atmosphere; Andreae, M.O., Schimel, D.S., Eds.; John Willey and Sons: New York, NY, USA, 1989; pp. 7–21. [Google Scholar]
  38. Davidson, E.A.; Verchot, L.V. Testing the hole-in-the-pipe model of nitric and nitrous oxide emissions from soils using the TRAGNET database. Glob. Biogeochem. Cycles 2000, 14, 1035–1043. [Google Scholar] [CrossRef]
  39. Yan, G.; Yao, Z.; Zheng, X.; Liu, C. Characteristics of annual nitrous and nitric oxide emissions from major cereal crops in the North China Plain under alternative fertilizer management. Agric. Ecosyst. Environ. 2015, 207, 67–78. [Google Scholar] [CrossRef]
  40. Miao, Y.; Stewart, B.A.; Zhang, F. Long-term experiments for sustainable nutrient management in China. A review. Agron. Sustain. Dev. 2011, 31, 397–414. [Google Scholar] [CrossRef]
  41. Zhao, Y.; Zhang, Y.; Du, H.; Wang, Y.; Zhang, L.; Shi, X. Carbon sequestration and soil microbes in purple paddy soil as affected by long-term fertilization. Toxicol. Environ. Chem. 2015, 97, 464–476. [Google Scholar] [CrossRef]
  42. Abdalla, K.; Sun, Y.; Zarebanadkouki, M.; Gaiser, T.; Seidel, S.; Pausch, J. Long-term continuous farmyard manure application increases soil carbon when combined with mineral fertilizers due to lower priming effects. Geoderma 2022, 428, 116216. [Google Scholar] [CrossRef]
  43. Amanullah, H. Influence of organic and inorganic nitrogen on grain yield and yield components of hybrid rice in Northwestern Pakistan. Rice Sci. 2016, 23, 326–333. [Google Scholar] [CrossRef]
  44. Zhang, M.; Yao, Y.; Tian, Y.; Ceng, K.; Zhao, M.; Zhao, M.; Yin, B. Increasing yield and N use efficiency with organic fertilizer in Chinese intensive rice cropping systems. Field Crops Res. 2018, 227, 102–109. [Google Scholar] [CrossRef]
  45. Cai, A.; Xu, M.; Wang, B.; Zhang, W.; Liang, G.; Hou, E.; Luo, Y. Manure acts as a better fertilizer for increasing crop yields than synthetic fertilizer does by improving soil fertility. Soil Till. Res. 2019, 189, 168–175. [Google Scholar] [CrossRef]
  46. Silva, A.; Oliveira, B.; Santos, C.; Pereira, D.; Costa, E.; Ferreira, F.; Rodrigues, G.; Martins, H.; Almeida, I.; Carvalho, J.; et al. Synergistic effects of molybdenum and plant growth-promoting rhizobacteria on sugarcane performance. J. Soil Sci. Plant Nutr. 2025, 25, 512–525. [Google Scholar] [CrossRef]
  47. Dawe, D.; Dobermann, A.; Ladha, J.K.; Yadav, R.L.; Bao, L.; Gupta, R.K.; Lal, P.; Panaullah, G.; Sariam, O.; Singh, Y.; et al. Do organic amendments improve yield trends and profitability in intensive rice systems? Field Crops Res. 2003, 83, 191–213. [Google Scholar] [CrossRef]
  48. Bi, L.; Zhang, B.; Liu, G.; Li, Z.; Liu, Y.; Ye, C.S.; Yu, X.; Lai, T.; Zhang, J.; Yin, J.; et al. Long-term effects of organic amendments on the rice yields for double rice cropping systems in subtropical China. Agric. Ecosyst. Environ. 2009, 129, 534–541. [Google Scholar] [CrossRef]
  49. Davidson, E.A.; Samanta, S.; Caramori, S.S.; Savage, K. The dual Arrhenius and Michaelis–Menten (DAMM) kinetics model for decomposition of soil organic matter at hourly to seasonal time scale. Glob. Change Biol. 2012, 18, 371–384. [Google Scholar] [CrossRef]
  50. Wang, R.; Pan, Z.; Zheng, X.; Ju, X.; Yao, Z.; Butterbach-Bahl, K.; Zhang, C.; Wei, H.; Huang, B. Using field-measured soil N2O fluxes and laboratory scale parameterization of N2O/(N2O+N2) ratios to quantify field-scale soil N2 emissions. Soil Biol. Biochem. 2020, 148, 107904. [Google Scholar] [CrossRef]
  51. Pan, Z.; He, P.; Fan, D.; Jiang, R.; Song, D.; Song, L.; Zhou, W.; He, W. Global impact of enhanced-efficiency fertilizers on vegetable productivity and reactive nitrogen losses. Sci. Total Environ. 2024, 918, 170632. [Google Scholar] [CrossRef]
  52. Skiba, U.; Smith, K.A.; Fowler, D. Nitrification and denitrification as sources of nitric-oxide and nitrous-oxide in a sandy loam soil. Soil Biol. Biochem. 1993, 25, 1527–1536. [Google Scholar] [CrossRef]
  53. Conrad, R. Microbiological and biochemical background of production and consumption of NO and N2O in soil. In Trace Gas Exchange in Forest Ecosystems; Tree Physiology; Gasche, R., Papen, H., Rennenberg, H., Eds.; Springer: Dordrecht, The Netherlands, 2002; Volume 3, pp. 3–33. [Google Scholar] [CrossRef]
  54. Grant, R.F.; Pattey, E.; Goddard, T.W.; Kryzanowski, L.M.; Puurveen, H. Modeling the effects of fertilizer application rate on nitrous oxide emissions. Soil Sci. Soc. Am. J. 2006, 70, 235–248. [Google Scholar] [CrossRef]
  55. Zheng, X.; Han, S.; Huang, Y.; Wang, Y.; Wang, M. Re-quantifying the emission factors based on field measurements and estimating the direct N2O emission from Chinese croplands. Glob. Biogeochem. Cycles 2004, 18, GB2018. [Google Scholar] [CrossRef]
  56. IPCC. 2006 IPCC Guidelines for National Greenhouse Gas Inventories; Eggleston, H.S., Buendia, L., Miwa, K., Ngara, T., Tanabe, K., Eds.; Institute for Global Environmental Strategies: Hayama, Japan, 2006; Volume 4. [Google Scholar]
  57. Huang, Y.; Li, D. Soil nitric oxide emissions from terrestrial ecosystems in China: A synthesis of modeling and measurements. Sci. Rep. 2014, 4, 7406. [Google Scholar] [CrossRef] [PubMed]
  58. Liu, S.; Lin, F.; Wu, S.; Ji, C.; Sun, Y.; Jin, Y.; Li, S.; Li, Z.; Zou, J. A meta-analysis of fertilizer-induced soil NO and combined NO+N2O emissions. Glob. Change Biol. 2017, 23, 2520–2532. [Google Scholar] [CrossRef]
  59. IPCC. 2019 Refinement to the 2006 IPCC Guidelines for National Greenhouse Gas Inventories; IPCC: Geneva, Switzerland, 2019; Volume 4, Available online: https://www.ipcc.ch/report/2019-refinement-to-the-2006-ipcc-guidelines/ (accessed on 26 June 2022).
  60. Dobbie, K.E.; Smith, K.A. Nitrous oxide emission factors for agricultural soils in Great Britain: The impact of soil water-filled pore space and other controlling variables. Glob. Change Biol. 2003, 9, 204–218. [Google Scholar] [CrossRef]
  61. Weslien, P.; Kasimir Klemedtsson, Å.; Borjesson, G.; Klemedtsson, L. Strong pH influence on N2O and CH4 fluxes from forested organic soils. Eur. J. Agron. 2009, 60, 311–320. [Google Scholar] [CrossRef]
  62. Van Groenigen, J.W.; Velthof, G.L.; Oenema, O.; Van Groenigen, K.J.; Van Kessel, C. Towards an agronomic assessment of N2O emissions: A case study for arable crops. Eur. J. Soil Sci. 2010, 61, 903–913. [Google Scholar] [CrossRef]
  63. Zhou, M.; Zhu, B.; Brüggemann, N.; Bergmann, J.; Wang, Y.; Butterbach-Bahl, K. N2O and CH4 Emissions, and NO3⁻ Leaching on a Crop-Yield Basis from a Subtropical Rain-fed Wheat–Maize Rotation in Response to Different Types of Nitrogen Fertilizer. Ecosystems 2014, 17, 286–301. [Google Scholar] [CrossRef]
  64. Baral, K.R.; Labouriau, R.; Olesen, J.E.; Petersen, S.O. Nitrous oxide emissions and nitrogen use efficiency of manure and digestates applied to spring barley. Agric. Ecosyst. Environ. 2017, 239, 188–198. [Google Scholar] [CrossRef]
  65. Yao, Z.; Yan, G.; Zheng, X.; Wang, R.; Liu, C.; Butterbach-Bahl, K. Reducing N2O and NO emissions while sustaining crop productivity in a Chinese vegetable-cereal double cropping system. Environ. Pollut. 2017, 231, 929–941. [Google Scholar] [CrossRef]
  66. Yu, Y.; Feng, Y.; Yu, Y.; Xue, L.; Yang, L.; Zhong, L.; Delgado-Baquerizo, M.; He, S. Closing the gap between climate regulation and food security with nano iron oxides. Nat. Sustain. 2024, 7, 758–765. [Google Scholar] [CrossRef]
Figure 1. Seasonal dynamics of (A) air and soil (5 cm) temperatures, daily precipitation, (B) topsoil (0–20 cm) water content expressed as water-filled pore space (WFPS), (C) topsoil (0–20 cm) ammonium (NH4+), (D) nitrate (NO3), and (E) dissolved organic carbon (DOC) concentrations for the winter wheat–summer maize cropping system under different treatments. The thin vertical bars in panels (CE) indicate standard errors of 3 spatial replicates. Definitions of the treatment codes are given in Table 1. The legends in panel (C) also apply to panels (D,E). The downward arrows indicate the time of fertilization.
Agriculture 15 01108 g001
Figure 2. Seasonal variations of (A) nitrous oxide (N2O) fluxes, (B) nitric oxide (NO) fluxes, and (C) N2O plus NO (N2O+NO) fluxes from the winter wheat–summer maize cropping system under different treatments. The vertical bars indicate standard errors of 3 spatial replicates. For definitions of the treatment codes, refer to Table 1. The legends in panel (A) also apply to other panels. The downward arrows denote the time of fertilization.
Agriculture 15 01108 g002
Figure 3. Relationships (A) between N-trace gas (N2O, NO and N2O+NO) emissions and the N surplus, (B) between direct gas (N2O, NO and N2O+NO) emission factors and N use efficiency (NUE), and (C) between yield-scaled nitrogenous gas (N2O, NO and N2O+NO) emissions and NUE across all the treatments on seasonal and annual scales. Definitions of the different fertilizer treatments, refer to the footnotes to Table 1.
Agriculture 15 01108 g003
Figure 4. Structural equation models (SEMs) evaluating the direct, indirect, and total effects on nitrous oxide (N2O) emissions. SEMs for N2O in CK (A), NPK (B), OM (C), OMNPK (D), CRNPK (E) and All (F) treatments. Standardized total effects (direct plus indirect effects) derived from the SEMs on N2O emissions in CK (a), NPK (b), OM (c), OMNPK (d), CRNPK (e), and all (f) treatments. Red and blue lines indicate positive and negative relationships, respectively. Definitions of the different treatments are referred to the footnotes of Table 1. The legends in panel (f) also apply for panels (ae). Line thickness represents the magnitude of the path coefficient, and numbers adjacent to arrows are standardized path coefficients * p < 0.05, ** p < 0.01, *** p < 0.001.
Agriculture 15 01108 g004
Figure 5. Structural equation models (SEMs) evaluating the direct, indirect, and total effects on nitric oxide (NO) emissions. SEMs for NO in CK (A), NPK (B), OM (C), CRNPK (D), OMNPK (E), and all (F) treatments. Standardized total effects (direct plus indirect effects) derived from the SEMs on NO emissions in CK (a), NPK (b), OM (c), OMNPK (d), CRNPK (e) and All (f) treatments. Red and blue lines indicate positive and negative relationships, respectively. Definitions of the different treatments are referred to the footnotes of Table 1. The legends in panel (f) also apply for panels (ae). Line thickness represents the magnitude of the path coefficient, and numbers adjacent to arrows are standardized path coefficients. * p < 0.05, ** p < 0.01, *** p < 0.001.
Agriculture 15 01108 g005
Table 1. Treatments and managements of fertilization regimes of winter wheat–summer maize agroecosystems.
CropSowing and Harvesting DateFertilization DateN Fertilizer Types and Rates (kg N ha−1) 1
CKNPKOMOMNPKCRNPK
Winter wheat3 November 2015, 23 May 20163 November 20150AB (130)OM (130)AB (91) + OM (39)AB (110) + MR (20)
Summer maize30 May, 25 September 201630 May 20160AB (150)OM (150)AB (105) + OM (45)AB (127) + WR (23)
Annual total N rate 2 0280
1 CK, no chemical and manure N fertilization; NPK, synthetic nitrogen (Ammonium bicarbonate (AB)), phosphorus and potassium fertilizer; OM, pig manure alone; CRNPK, maize residue (MR) or wheat residue (WR) supply 15% of N rate with synthetic NPK (85% of N rate); OMNPK: pig manure supply 30% of N rate with synthetic NPK (70% of N rate). 2 The annual total N rate in each treatment, except CK, was the same in the winter wheat (130 kg N ha−1) and summer maize (150 kg N ha−1).
Table 2. Multivariate regressions between nitrous oxide (N2O) plus/or nitric oxide (NO) fluxes and soil factors including soil ammonium (NH4+), nitrate (NO3), moisture (W, % water-filled pore space), and temperature (Ts).
Code 1Equations 3NR2p
F = A [ NH 4 + ] k 1 + [ NH 4 + ] · [ NO 3 ] k 2 + [ NO 3 ] · e BW e C T s (1)
Ak1k2BC
N2O
CK0.5270.2236.8810.0530.050880.49<0.01
NPK0.0770.99959.260.0870.131880.83<0.01
OM0.1240.12540.880.0430.125880.55<0.01
OMNPK0.0670.5458.3860.0480.119880.43<0.01
CRNPK9.1 × 10−119.57085.890.3380.263880.96<0.01
All 20.1450.67835.430.0870.1094400.29<0.01
NO
CK0.12409.7780.0180.070880.17<0.01
NPK4.6601.1576.30600.034880.05<0.05
OM6.9900.38024.080.0210.016880.16<0.01
CRNPK42.490.925165.400880.31<0.01
All 24.0700.72619.630.0160.0304400.11<0.01
N2O+NO
CK0.6230.1927.5900.0510.051880.49<0.01
NPK0.1301.06042.570.0800.123880.80<0.01
OM12.64031.750.0410.063880.30<0.01
OMNPK0.0101.83430.900.1170.147880.35<0.01
CRNPK3.3 × 10−108.12085.560.3250.249880.95<0.01
All 20.2570.60634.120.0810.1034400.28<0.01
Code 1Equations 3NR2p
Ln N 2 O + NO = A Ln ( [ NH 4 + ] + [ NO 3 ] ) + BW + C T s + D (2)
ABCD
CK0.2980.0440.065−2.610 880.14<0.01
NPK0.9440.0060.090−2.770 880.47<0.01
OM1.0800.0560.119−5.470 880.51<0.01
OMNPK0.8650.0320.101−3.440 880.49<0.01
CRNPK1.0000.0550.134−6.451 880.51<0.01
All 20.8350.0420.099−4.100 4400.44<0.01
1 For definitions of the different treatments, refer to the footnotes to Table 1. 2 All involves all data of the different fertilizations. 3 F denotes the fluxes of N2O, NO, and N2O+NO (μg N m−2 h−1); NH4+ and NO3 denote the contents of ammonium (mg N kg−1 dry soil (ds)) and nitrate (mg N kg−1 ds) in the topsoil (0–20 cm) layer, respectively; W denotes soil (0–20 cm) moisture expressed as water-filled pore space (in %WFPS); Ts denotes soil (5 cm) temperature in Celsius (°C), respectively. A, k1, k2, B, and C estimated parameters shown as means; A is the indicator of maximum fluxes and determined by the enzymatic reaction; B and C are the pre-exponential factors of soil moisture and temperature and determined by the enzymatic reac-tion; k1 and k2 denote half saturation constants for the soil NH4+ and NO3 concentrations (mg N kg−1 ds); N denotes number of observations; R2 and p denote determination coefficients and probabilities (significance level) of the respective equation.
Table 3. Crop yield (Mg ha−1), biomass (Mg ha−1), N uptake (kg N ha−1), N surplus (kg N ha−1), and nitrogen use efficiency (NUE, %) under different fertilization regimes during winter wheat–summer maize rotation.
CKNPKOMOMNPKCRNPK
Winter wheat 1
Crop yield1.02 [0.21] c4.71 [0.44] ab3.89 [0.55] b4.17 [0.51] ab5.28 [0.85] a
Biomass3.01 [0.62] c9.48 [0.07] ab8.47 [0.62] b8.78 [1.08] b10.7 [1.07] a
N uptake29.7 [6.2] c115 [6.5] ab98 [10.9] b103 [12.7] ab129 [17.4] a
N surplus 29.4 [6.5] a46.0 [10.9] a40.5 [12.7] a15.5 [17.4] a
NUE 65 [5] a53 [8] a57 [10] a76 [13] a
Summer maize 1
Crop yield2.14 [0.17] b6.77 [0.45] a6.14 [1.41] a6.43 [1.24] a7.98 [1.85] a
Biomass4.69 [0.25] b11.0 [0.93] a10.5 [2.00] a11.6 [1.58] a13.2 [2.60] a
N uptake46.0 [2.9] b123 [1.0] a115 [23.8] a123 [20.2] a145 [28.1] a
N surplus 46.4 [1.0] a54.0 [23.8] a46.1 [20.2] a23.9 [28.1] a
NUE 51 [1] a46 [16] a51 [13] a66 [19] a
Annual 1
Crop yield3.16 [0.39] b11.5 [0.90] a10.0 [1.96] a10.6 [1.75] a13.3 [2.71] a
Biomass7.70 [0.87] b20.4 [1.00] a19.0 [2.62] a20.4 [2.65] a23.9 [3.67] a
N uptake76 [9.1] b237 [7.5] a213 [34.6] a226 [32.8] a274 [45.5] a
N surplus 75.7 [7.5] a100 [34.6] a86.7 [32.8] a39.3 [45.5] a
NUE 58 [3] a49 [12] a54 [12] a71 [16] a
The data shown are means [standard errors] (n = 3). For definitions of the treatment codes, refer to Table 1. 1 Different letters within the same row indicate significant differences between treatments at the p < 0.05 level.
Table 4. Seasonal and annual cumulative emissions of nitrous oxide (N2O), nitric oxide (NO), and N2O plus NO (N2O+NO) (kg N ha−1), and their direct emission factors of applied nitrogen ( EF d N 2 O , EF d NO and EF d N 2 O + NO , in %) under different fertilization regimes during the winter wheat–summer maize rotation.
CKNPKOMOMNPKCRNPK
Winter wheat 1
N2O0.18 [0.03] d0.59 [0.09] c2.76 [0.21] a1.28 [0.02] b0.65 [0.09] c
EF d N 2 O 0.32 [0.07] c1.98 [0.16] a0.85 [0.01] b0.36 [0.07] c
NO0.01 [0.00] d0.04 [0.01] c0.27 [0.04] a0.10 [0.01] b0.06 [0.02] bc
EF d NO 0.02 [0.01] c0.20 [0.03] a0.07 [0.01] b0.04 [0.01] bc
N2O+NO0.19 [0.03] d0.63 [0.08] c3.01 [0.24] a1.38 [0.03] b0.71 [0.11] c
EF d N 2 O + NO 0.34 [0.06] c2.17 [0.19] a0.92 [0.02] b0.40 [0.08] c
Summer maize 1
N2O0.22 [0.04] b0.62 [0.10] b3.75 [1.82] a2.11 [0.26] b1.14 [0.09] b
EF d N 2 O 0.27 [0.07] b2.36 [1.21] a1.26 [0.17] ab0.62 [0.06] b
NO0.01 [0.00] b0.20 [0.09] ab0.39 [0.23] a0.19 [0.10] ab0.07 [0.02] b
EF d NO 0.12 [0.06] a0.25 [0.15] a0.12 [0.07] a0.04 [0.01] a
N2O+NO0.23 [0.04] c0.82 [0.18] bc4.15 [1.67] a2.29 [0.34] b1.21 [0.11] bc
EF d N 2 O + NO 0.39 [0.12] b2.61 [1.12] a1.38 [0.22] b0.66 [0.07] b
Annual 1
N2O0.40 [0.02] c1.21 [0.13] c6.51 [2.01] a3.39 [0.27] b1.79 [0.12] bc
EF d N 2 O 0.29 [0.05] b2.18 [0.72] a1.07 [0.10] b0.50 [0.04] b
NO0.02 [0.00] b0.24 [0.10] b0.66 [0.19] a0.28 [0.11] b0.14 [0.03] b
EF d NO 0.08 [0.03] b0.23 [0.07] a0.09 [0.04] b0.04 [0.01] b
N2O+NO0.42 [0.02] c1.45 [0.17] c7.15 [1.89] a3.67 [0.36] b1.93 [0.14] c
EF d N 2 O + NO 0.37 [0.06] b2.41 [0.68] a1.16 [0.13] b0.54 [0.05] b
The data shown are means [standard errors] (n = 3). For definitions of the treatment codes, refer to Table 1. 1 Different letters within the same row indicates significant differences between treatments at the p < 0.05 level.
Table 5. Seasonal and annual yield-scaled N2O and NO emissions (g N Mg−1 grain) under different fertilization regimes in winter wheat–summer maize.
CKNPKOMOMNPKCRNPK
Winter wheat 1
N2O178 [29] c125 [19] c709 [53] a308 [4] b123 [17] c
NO8 [4] c8 [2] c68 [10] a24 [2] b12 [3] c
N2O+NO186 [28] c134 [17] c773 [62] a332 [6] b135 [20] c
Summer maize 1
N2O101 [18] b92 [15] b470 [227] a327 [40] ab186 [15] b
NO5 [2] b29 [13] ab49 [29] a29 [16] ab12 [3] ab
N2O+NO107 [19] c121 [26] c519 [210] a356 [52] ab198 [18] bc
Annual 1
N2O128 [6] c106 [12] c491 [152] a320 [26] b178 [12] c
NO6 [1] b21 [8] b50 [14] a27 [10] b14 [3] b
N2O+NO132 [7] c126 [15] c539 [143] a347 [34] b192 [14] c
The data shown are means [standard errors] (n = 3). For definitions of the treatment codes, refer to Table 1. 1 Different letters within the same row indicate significant differences between treatments at the p < 0.05 level.
Disclaimer/Publisher’s Note: The statements, opinions and data contained in all publications are solely those of the individual author(s) and contributor(s) and not of MDPI and/or the editor(s). MDPI and/or the editor(s) disclaim responsibility for any injury to people or property resulting from any ideas, methods, instructions or products referred to in the content.

