Article

Enhancing Genomic Prediction Accuracy in Beef Cattle Using WMGBLUP and SNP Pre-Selection

by
Huqiong Zhao
1,2,
Xueyuan Xie
1,2,
Haoran Ma
2,
Peinuo Zhou
3,
Boran Xu
4,
Yuanqing Zhang
1,
Lingyang Xu
2,
Huijiang Gao
2,
Junya Li
2,
Zezhao Wang
2,* and
Xiaoyan Niu
1,*
1
College of Animal Science, Shanxi Agricultural University, Jinzhong 030801, China
2
State Key Laboratory of Animal Biotech Breeding, Institute of Animal Science, Chinese Academy of Agricultural Sciences, Beijing 100193, China
3
Inner Mongolia Autonomous Region Agriculture and Animal Husbandry Technology Extension Center, Hohhot 010020, China
4
Tongliao Agriculture and Animal Husbandry Development Center, Tongliao 028000, China
*
Authors to whom correspondence should be addressed.
Agriculture 2025, 15(10), 1094; https://doi.org/10.3390/agriculture15101094
Submission received: 4 April 2025 / Revised: 12 May 2025 / Accepted: 16 May 2025 / Published: 19 May 2025
(This article belongs to the Section Farm Animal Production)

Abstract

:
Genomic selection (GS) plays a crucial role in livestock breeding. However, its implementation in Chinese beef cattle breeding is constrained by a limited reference population and incomplete data records. To address these challenges, this study aimed to identify more effective models for multi-population genomic selection. We simulated five different beef cattle populations and selected three populations with varying levels of kinship to investigate the impact of population relationships on genomic prediction. Utilizing results from a genome-wide association study (GWAS), we preselected different proportions of single nucleotide polymorphism (SNP). Subsequently, we employed three models—genomic best linear unbiased prediction (GBLUP), multi-genomic best linear unbiased prediction (MGBLUP), and weighted multi-genomic best linear unbiased prediction (WMGBLUP)—for within-population and multi-population genomic prediction. Our results showed that increasing the size of the training set improved within-population prediction accuracy. Furthermore, both MGBLUP and WMGBLUP outperformed GBLUP in terms of prediction accuracy for both within-population and multi-population analyses. Among the models evaluated, the WMGBLUP model, which utilized the top 5% of preselected SNPs based on GWAS findings, demonstrated superior performance, yielding an improvement of up to 11.1% in within-population prediction and 16.5% in multi-population prediction. In summary, both WMGBLUP and MGBLUP models exhibit enhanced efficacy in improving genomic prediction accuracy, and the incorporation of GWAS results can further optimize their performance.

1. Introduction

Genomic selection (GS) has emerged as a pivotal methodology and a focal point of research for enhancing animal genetics, primarily due to its ability to enable early selection and reduce the generation interval [1,2]. Initially implemented in dairy cattle breeding in 2008, GS technology has undergone significant advancements across various agricultural sectors, including both plant [3] and animal breeding, with particular emphasis on dairy cattle [4]. A substantial body of research demonstrates that predictions derived from a reference population comprising individuals from multiple populations or breeds are more accurate compared to those based on a single-population reference group [5,6]. In the context of beef cattle, the limited size of the reference population, the diversity of breeds, and incomplete records of pedigree and phenotypic data [7] considerably hinder the efficacy of genomic predictions within single breeds, thereby restricting the full realization of the benefits associated with genomic selection. Consequently, multi-population genomic selection has emerged as a significant trend in beef cattle breeding [8,9].
However, multi-population genomic prediction for beef cattle faces several challenges. When genetic relatedness among populations is low, gains in prediction accuracy are limited [10,11,12]. Additionally, in smaller populations, the precision of genomic prediction is similarly limited [13,14]. Although theoretical frameworks suggest that data from large populations can be used to estimate the genomic estimated breeding values (GEBV) of individuals in small populations, empirical evidence inconsistent improvements in prediction accuracy in prediction accuracy [10,15,16], and in some instances can even result in negative accuracy [13,17].
In statistical models, the genomic best linear unbiased prediction (GBLUP) model is widely used in genomic selection due to its computational efficiency and ease of implementation [18,19]. However, this model assumes that all single nucleotide polymorphisms (SNPs) contribute equally to the overall genetic variance, treating all SNPs as equally influential. However, this assumption oversimplifies the complex genetic architecture of traits, highlighting the need for improved methods [20]. Genome-wide association studies (GWAS) are critical in identifying genetic variations linked to specific traits. Studies have shown that using preselected markers or known QTLs can boost the accuracy of genomic selection across populations [21,22,23]. However, it is important to note that preselected markers or known QTL only explain part of the total genetic variance associated with traits.
We proposed that a model that can integrate all available markers, construct distinct genomic relationship matrices, and assign different weights to markers based on their varying effects on traits could enhance the accuracy of genomic predictions within and across populations. This model uses p-values from GWAS results as weighting factors. The objective of this study is to evaluate a weighted multi-population multi-G matrix model (WMGBLUP), determine the optimal proportion of preselected SNPs from GWAS, and assess the effects of kinship between populations, reference population size, and population composition ratio on genomic prediction accuracy. This research compares the GBLUP model, the multi-G matrix model with GWAS preselected SNPs (MGBLUP), and the weighted multi-G matrix model (WMGBLUP) for genomic prediction in these simulated populations.

2. Materials and Methods

2.1. Simulation

In this study, five distinct beef cattle populations (designated as populations A to E) were simulated using the QMSim v2.0 software [24]. During the initial 1000 generations of the historical population, the population size was systematically reduced from 10,000 individuals in the first generation to 1000 individuals in the 1000th generation to establish linkage disequilibrium (LD). Subsequently, from the 1001st to the 2000th generation, the population size progressively expanded from 1000 to 8000 individuals.
To establish the foundational populations, we randomly selected 100 bulls and 120 cows from the final generation of the historical population. These individuals were allowed to mate randomly over the course of 30 successive generations. Throughout this period, the culling rates for both sires and dams were maintained at 0.2. Each cow produced a single offspring per reproductive cycle, and an exponential growth rate of 0.2 was sustained. The simulation process is depicted in Figure 1.
Subsequently, we selected parameters aligned with real-world production and genetic evaluation systems to simulate the population structure utilizing the final generation of the foundational population. A simulation spanning six generations was executed, applying selection to the five populations based on high estimated breeding values (EBVs) for a single trait using best linear unbiased prediction (BLUP) with age-based culling. Various mating designs and replacement rates for bulls and cows were implemented. The initial number of animals differed across the five populations, leading to variations in population sizes. Specific parameters are detailed in Table 1.
The genomic data were simulated based on the actual chromosome length and number in cattle [25]. Specifically, a genome consisting of 29 chromosomal pairs with an aggregate length of 2319 centimorgans (cM) was modeled. The marker density for each beef cattle was established at 50,000, including a total of 500 QTL. SNP and QTL were selected from segregating loci in the final generation of the historical population, with a minor allele frequency (MAF) exceeding 0.1, and were randomly distributed across the genome. The recurrent mutation rate for both SNP and QTL was set at 2.5 × 10 5 . Additive allele effects were drawn from a gamma distribution with a shape parameter of 0.4.
The simulation examined a trait characterized by a heritability coefficient of 0.3, with the genetic variance explained by QTL also set at 0.3 and the phenotypic variance standardized to 1. The true breeding value (TBV) for each individual was determined by aggregating the additive effects of all QTL. The phenotype of each individual was subsequently calculated as the sum of their TBV and a stochastic residual component.

2.2. Population Grouping and Combination Strategy

The POPCORN v1.0 software [26] was employed to calculate the genetic correlations across different generations for the five populations (A to E). Based on these results, we selected three populations with differing levels of genetic relatedness for subsequent genomic prediction analyses: specifically, populations A, B, and E. From the sixth generation of each, we randomly sampled 800 individuals to form the test sets for their respective populations within the GS group. Next, 4000 individuals were randomly selected from the remaining members of populations A, B, and E to create the GS group training sets. Finally, 3200 individuals were selected from the remaining individuals in each population, excluding those in the test and training sets of the GS group, to constitute the GWAS group. For each population combination, the GS group test set remained the fixed test set for the corresponding population. To evaluate how population composition affects multi-population genomic prediction, we created various mixed-group configurations in the training sets of both the GS and GWAS groups, as detailed in Table 2.

2.3. GWAS Model

In the GWAS group, first, principal component analysis (PCA) was conducted using PLINK v1.9 software. Subsequently, the significance (p-value) of PCA was assessed through the twstats method implemented in EIGENSTRAT v6.1.4 software. Principal components exhibiting a p-value of less than 0.05 were deemed significant and were incorporated as covariates into the GWAS model. The analysis was performed using the mixed linear model (MLM) [27], as facilitated by GCTA v1.93.0 software, and the model is represented as follows:
y = X a + Z β + W g + e
where y is the vector of simulated trait phenotypic values; a is the vector of SNP effects; X is an m × n matrix, where m is the number of samples and n is the number of SNPs, and the genotypes AA, Aa, and aa are encoded as 0, 1, and 2, respectively; β is the vector of fixed effects with principal components as covariates; Z is the association matrix of β ; g is the vector of random effects, which follows the distribution g ~ N ( 0 , G σ a 2 ) , where G is the additive genetic relationship matrix constructed from SNPs, and σ a 2 is the genetic variance explained by all SNP loci; W is the association matrix of g ; and e is the vector of random residuals, which follows the distribution e ~ N ( 0 , I σ e 2 ) , where I is the relationship matrix, and σ e 2 is the residual variance.

2.4. GBLUP Model

The GBLUP model [13] was used to predict genomic breeding values for the combination of reference population and validation population. The model was
y = X b + Z u + e
where y was a vector of phenotypes; b was a vector of fixed effects; u was a vector of additive genetic effects for an individual, with u ~ N 0 , G σ a 2 , where the G matrix was the genomic relationships among the combination population; X and Z were the correlation matrices of fixed effects and random effects, respectively; and e was a vector of residuals with e ~ N ( 0 , I σ e 2 ) . In addition, σ a 2 and σ e 2 were the genomic variance and the residual variance, respectively.
The construction of the G matrix is the core of the GBLUP method. Among them, the method proposed by VanRaden [13] is the most widely used. The genomic relationship matrix ( G matrix) is constructed using all the single nucleotide polymorphisms (SNPs) in the GP group, and the formula is as follows:
G = M M 2 i = 1 m p i ( 1 p i )
where M is an m × n matrix, where m is the number of markers and n is the number of genotyped individuals; M is the transpose of the matrix M ; and p i is the minor allele frequency of the i t h locus.

2.5. MGBLUP Model and WMGBLUP Model

In the MGBLUP model and the WMGBLUP model, the GWAS group is used to construct two weighted kinship matrices, g 1 and g 2 , for the top group and the rem group screened from the GP group, respectively. The formulas are as follows:
g = w k G = M M w k 2 i = 1 m p i ( 1 p i )
In the WMGBLUP model, w k is the p-value of the k t h locus in the GWAS results, and the calculation formula is as follows:
w k = P = l o g ( p k )
where p k is the p-value of the k t h locus in the GWAS results. In the MGBLUP model, w k is always 1. Currently, in both the MGBLUP model and the WMGBLUP model, G m is used to replace the G matrix in the GBLUP model:
G m = g 1 + g 2
where g 1 is constructed from the SNPs of the top group, and g 2 is constructed from the SNPs of the rem group. R v4.3.3 software is used to construct the G matrix and g matrix, and the DMUAI program of the DMU v6.5.2 software is used to estimate the genomic estimated breeding values (GEBVs).

2.6. Evaluation of Prediction Ability

The Pearson correlation coefficient between the true breeding values (TBV) in the simulated data and the calculated genomic estimated breeding values (GEBV) is used for model evaluation. The calculation formula is as follows:
r = c o r G E B V , T B V = C o v ( G E B V , T B V ) V a r ( G E B V ) V a r ( T B V )
where TBV represents the true values of the simulated data, which are obtained by accumulating the effects of quantitative trait loci (QTLs); C o v ( G E B V , T B V ) is the covariance between GEBV and TBV; and V a r ( G E B V ) and V a r ( T B V ) are the variances of GEBV and TBV, respectively.
In each model, the accuracy is calculated for the fixed validation set. The sampling and calculation process is repeated 20 times, and finally, the meaning of the results is taken as the prediction accuracy of the model.

3. Results

3.1. Results of Population Simulation

We simulated five distinct beef cattle populations (A to E), each evolving over six generations, with their sizes outlined in Table S1. As shown in Figure S1, the density distribution of all SNPs across the 29 autosomes in the simulated beef cattle population is illustrated in Figure S1. The regions with a higher density are mainly concentrated on the longer chromosomes (such as Chr1, Chr2, and Chr3), while the SNP density on the shorter chromosomes (such as Chr28 and Chr29) is relatively low. The simulated QTLs account for the additive genetic variance, and the variance they explain matches the trait heritability. Genomic data from the final generation of the historical population served as the foundation for initializing the current population simulations (A to E).

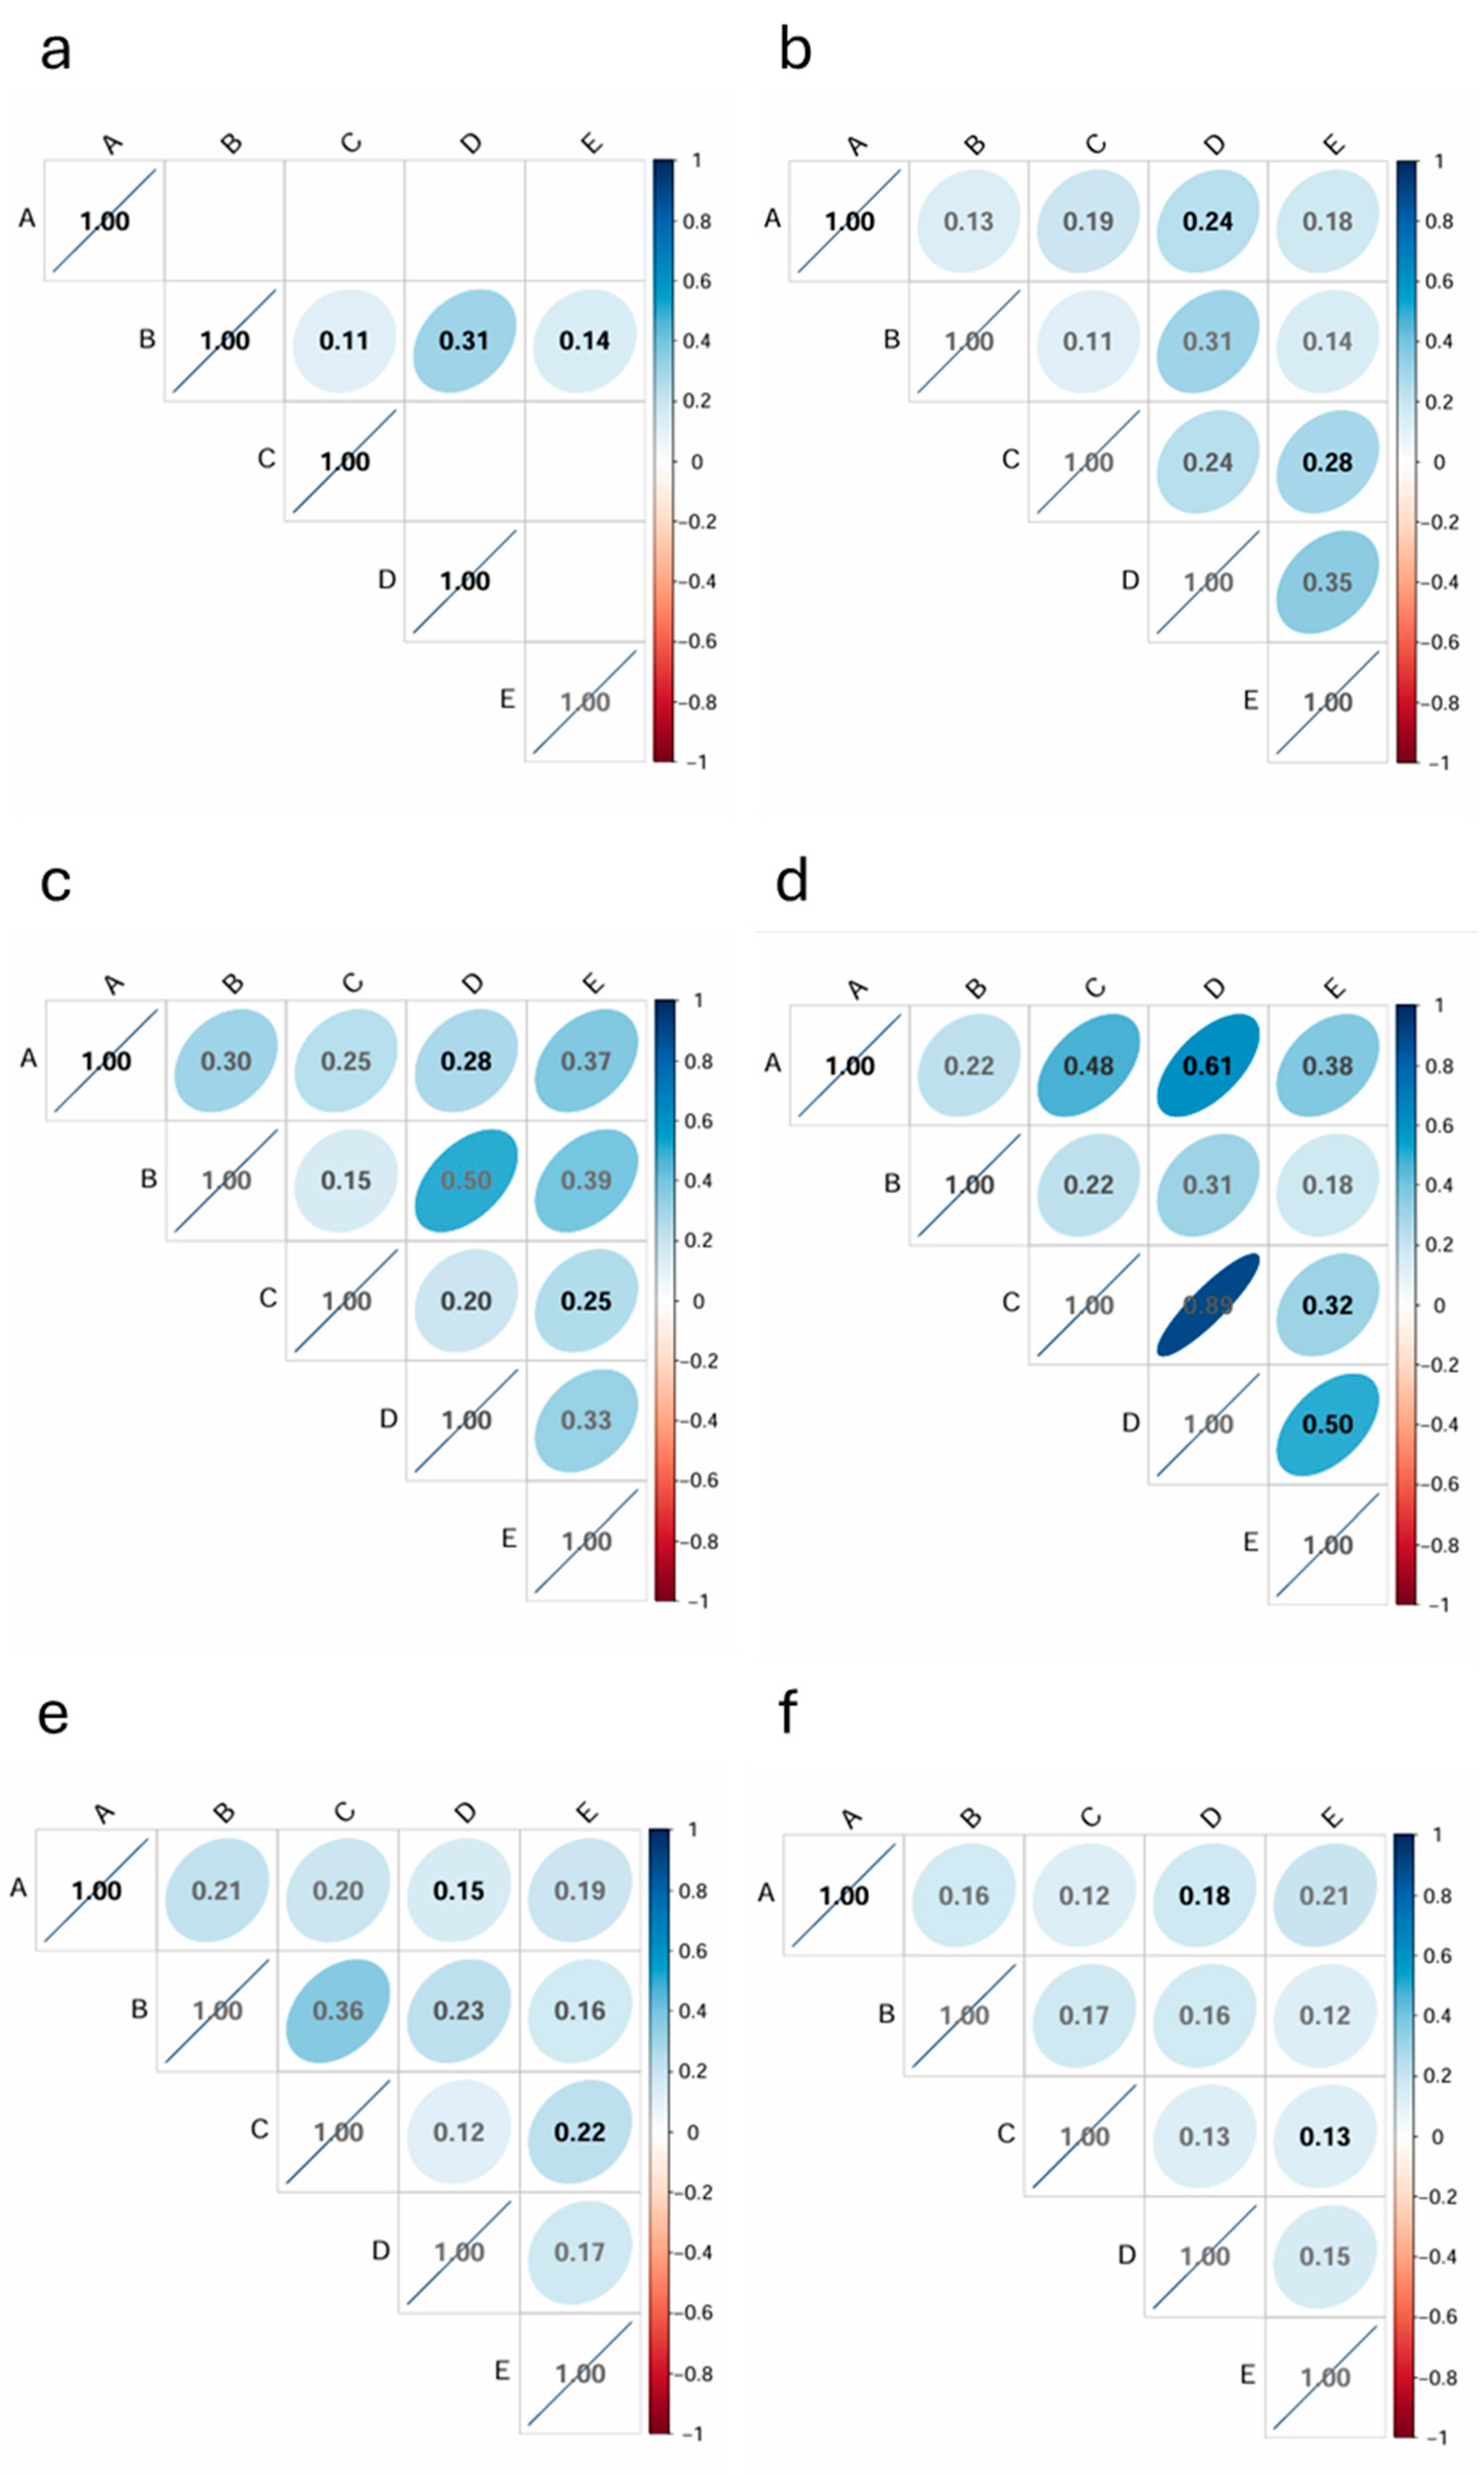
3.2. Genetic Correlation Between Populations

The results of the genetic correlations among the five beef cattle populations in each generation are shown in Figure 2. The closer the genetic correlation value is to 1, the closer the genetic relationship between the populations.
In generation G1, the genetic correlations remained generally low. For example, the correlation coefficient between population B and population C was merely 0.31, indicating relatively weak genetic connections among the populations at this stage. By generation G2, although correlations had undergone some changes, they remained relatively low overall. In generation G3, a notable increase in genetic correlations was observed between certain populations. For instance, the correlation coefficient between population A and population E rose to 0.37, indicating a closer genetic relationship between these populations. In generation G4, genetic correlations across populations increased significantly. For example, the correlation coefficient between population A and population C reached 0.61, reflecting a relatively strong genetic connection between these two populations in this generation. However, by generation G5, genetic associations among the populations decreased, with overall values tending towards an average level. No significantly high correlation values were observed, indicating a reduction in the strength of genetic associations. In generation G6, the genetic correlation coefficient between population A and population E was determined to be 0.21, whereas the genetic correlation coefficient between population A and Population B was 0.16. This suggests a closer genetic relationship between population A and population E.

3.3. Genomic Prediction Accuracy

3.3.1. The Results of Genomic Prediction for Population A

The accuracy outcomes of within-population genomic prediction for population A are presented in Table 3. In the context of within-population genomic prediction for population A, as the size of the training set increases, the accuracy of the GBLUP model, along with the WMGBLUP and MGBLUP models employing different preselected SNP ratios, generally increases.
The accuracy of the WMGBLUP and MGBLUP models, when utilizing various preselected SNP ratios, outperforms the GBLUP model. As the preselected SNP ratio increases from 5% to 25%, the accuracy of the WMGBLUP and MGBLUP models tends to decrease gradually. For instance, with the 1000A training set, the prediction accuracy of the WMGBLUP model decreases from 0.278 to 0.262, while the MGBLUP model‘s accuracy diminishes from 0.275 to 0.255. In the 4000A training set, the prediction accuracy of the WMGBLUP model initially declines from 0.520 to 0.455 before increasing to 0.473, whereas the MGBLUP model‘s accuracy consistently decreases from 0.510 to 0.446. Notably, when the preselected SNP ratio is 5%, the WMGBLUP model demonstrates the most significant improvement in prediction accuracy compared to the GBLUP model, achieving a maximum improvement of 0.104 in the 3000A training set.
The accuracy results of multi-population genomic prediction for population A are presented in Table 4. This analysis was conducted using training sets of identical size but varying in population composition.
For 3:1 population ratios, such as 3000A_1000B and 3000A_1000E, the prediction accuracy improved by 0.02 to 0.063 when adding population B. In contrast, the increase in prediction accuracy associated with the addition of population E ranges from 0.049 to 0.064. Consistently, population E combinations outperformed population B by 0.01 to 0.032. Conversely, when the ratio of the combined reference population is 1:1, with the exception of the GBLUP model and the MGBLUP model at a preselected SNP ratio of 25%, AE combinations outperformed AB combinations, with a difference ranging from 0.001 to 0.028. Furthermore, when the training set size is fixed at 4000A, multi-population training led to lower accuracy than single-population training, as shown in Table 4.
In the context of multi-population genomic prediction, the WMGBLUP and MGBLUP models outperform the GBLUP model at different preselected SNP ratios. Notably, WMGBLUP achieves the highest accuracy with the top 5% preselected SNPs, except in the 2000A_2000B training set, where MGBLUP surpasses it at the same ratio. In this particular set, the MGBLUP model surpasses the WMGBLUP model in prediction accuracy at the same SNP ratio. For other preselected SNP ratios, the WMGBLUP model consistently outperforms the MGBLUP model. Furthermore, when employing the 3000A_1000B training set, the WMGBLUP model improves prediction accuracy by 0.043 to 0.147, while the MGBLUP model shows an enhancement ranging from 0.032 to 0.124, relative to the GBLUP model, across different preselected SNP ratios. When utilizing a training set of 3000A_1000E, the predictive accuracy of the WMGBLUP model exhibits an enhancement ranging from 0.036 to 0.116, while the MGBLUP model demonstrates an improvement between 0.031 and 0.098. With a training set of 2000A_2000B, the WMGBLUP model’s predictive accuracy increases from 0.028 to 0.073, and the MGBLUP model’s accuracy improves by 0.025 to 0.081. Furthermore, when the training set comprises 2000A_2000E, the WMGBLUP model’s predictive accuracy is augmented by 0.050 to 0.120, whereas the MGBLUP model shows an enhancement ranging from 0.041 to 0.119.

3.3.2. The Results of Genomic Prediction for Population B

Table 5 presents the accuracy outcomes for within-population and multi-population genomic prediction for population B. In within-population genomic prediction, accuracy for the GBLUP, WMGBLUP, and MGBLUP models increases as the training set size grows. For example, the GBLUP model’s accuracy increases from 0.207 with the 1000B training set to 0.423 with the 4000B training set. When using the top 5% preselected SNPs from GWAS, WMGBLUP accuracy jumps from 0.250 to 0.534, while MGBLUP increases from 0.237 to 0.509. Generally, WMGBLUP and MGBLUP outperform GBLUP. However, as the proportion of preselected SNPs increases from 5% to 25%, both WMGBLUP and MGBLUP accuracy decline. In the largest 4000B training set, WMGBLUP drops from 0.534 to 0.511, and MGBLUP falls from 0.509 to 0.452. Notably, with the top 5% preselected SNPs, the WMGBLUP model demonstrates a significant improvement over GBLUP, with a 0.111 increase in the 4000B set.
In the context of multi-population genomic prediction, the utilization of training sets of equivalent size but different population compositions yields varying prediction accuracies when compared to within-population prediction. For example, all models showed lower accuracy in the 3000A_1000B training set compared to within-population predictions. By contrast, in the 2000A_2000B training set, some models exhibit an increase in accuracy. For instance, with the top 5% preselected SNPs, WMGBLUP accuracy rose from 0.253 in 3000A_1000B to 0.432 in 2000A_2000B. Generally, the accuracies of the WMGBLUP and MGBLUP models surpass those of the GBLUP model. Notably, when the preselected SNPs ratio is 5%, the WMGBLUP model has the highest accuracy. Compared with the GBLUP model, in the 3000A_1000B training set, the accuracy of the WMGBLUP model improves by 0.044 to 0.143, while that of the MGBLUP model ranges from 0.018 to 0.085. In the 2000A_2000B training set, the accuracy enhancement for the WMGBLUP model ranges from 0.142 to 0.171, whereas the MGBLUP model exhibits an improvement ranging from 0.124 to 0.166.

3.3.3. The Results of Genomic Prediction for Population E

The accuracy results of within-population and multi-population genomic prediction for population E are presented in Table 6. In the context of within-population genomic prediction for population E, as the training set size increases, accuracy generally increases. For instance, the accuracy of the GBLUP model increases from 0.254 with the 1000E training set to 0.429 with the 4000E training set. When the preselected SNPs comprise the top 5%, the accuracy of the WMGBLUP model increases from 0.287 to 0.537, and that of the MGBLUP model increases from 0.271 to 0.525. In most cases, the accuracies of the WMGBLUP and MGBLUP models are higher than that of the GBLUP model. As the preselected SNP ratio increases from 5% to 25%, the accuracies of both the WMGBLUP and MGBLUP models tend to decrease. When the preselected SNPs ratio is 5%, WMGBLUP outperformed GBLUP significantly, achieving a 0.108 increase observed in the 4000E training set.
In the 3000A_1000E and 2000A_2000E training sets, prediction accuracies differ from single-population results. The 3000A_1000E set yields lower accuracy across all models, while some models improve in the 2000A_2000E set. For example, with the top 5% preselected SNPs, WMGBLUP accuracy increases from 0.285 in 3000A_1000E to 0.438 in 2000A_2000E. Both WMGBLUP and MGBLUP consistently outperform GBLUP, with WMGBLUP achieving peak accuracy at the 5% SNP ratio. Compared to GBLUP, WMGBLUP improves accuracy by 0.065 to 0.155 in the 3000A_1000E set and 0.104 to 0.164 in the 2000A_2000E set, while MGBLUP improves by 0.032 to 0.132 and 0.043 to 0.114, respectively.

4. Discussion

4.1. The Influence of Training Set Size and Population Composition on Prediction Accuracy

The establishment of a reference population is a fundamental task and a critical step in the implementation of GS technology in livestock breeding. This process substantially influences the accuracy of GEBV [28].
In the context of within-population genomic prediction for populations A, B, and E, an increase in training set size (e.g., from 1000 to 4000) generally leads to enhanced prediction accuracies for the GBLUP, WMGBLUP, and MGBLUP models. Specifically, in population A, the accuracy of the GBLUP model increases from 0.246 in 1000 to 0.420 in 4000. Similarly, in population B, the accuracy rises from 0.207 in the 1000B training set to 0.423 in the 4000B training set, while in population E, it improves from 0.254 in the 1000E training set to 0.429 in the 4000E training set. These findings suggest that a larger training dataset can enhance the accuracy of genomic prediction across all populations. However, when comparing the three populations at equivalent training set sizes, the degree of accuracy improvement differs. For instance, at a training set size of 4000, the enhancement in prediction accuracy for certain models in population B diverges from that observed in populations A and E, potentially reflecting the distinct genetic characteristics unique to each population.
In multi-population genomic prediction, the composition of training sets, even when maintained at a constant size, significantly influences prediction accuracy. For instance, when population A is combined with population B or E in different ratios, the resulting prediction accuracies differ. Notably, in certain scenarios, the accuracy of predictions for population A combined with population E surpasses that of combining with population B, which is consistent with the result of Figure 2 of this study that the genetic relationship between population A and E is closer than that between A and B. Furthermore, Wientjes et al. [29] found that the closer the genetic distance between the validation population and the reference population, the higher the accuracy of genomic prediction. In this study, the accuracy of multi-population genomic predictions for populations B and E was observed to vary with the inclusion of population A. Specifically, an excessive number of individuals from population A, coupled with a disproportionately high representation, resulted in a decrease in prediction accuracy. This finding aligns with the results reported by van den Berg et al. [30]. Consequently, it is imperative to meticulously balance the proportions of each population when constructing a multi-population reference set to optimize predictive performance.

4.2. Influence of the Preselected SNP Proportion on Prediction Accuracy

In within-population genomic prediction, increasing the preselected SNP proportion from 5% to 25% generally reduces prediction accuracies of the WMGBLUP and MGBLUP models across populations A, B, and E. For instance, in population A with the 1000A training set, the accuracy of the WMGBLUP model drops from 0.278 to 0.262, and that of the MGBLUP model decreases from 0.275 to 0.255. In population B with the 1000B training set, the WMGBLUP model’s accuracy decreases from 0.250 to 0.241, and the MGBLUP model’s accuracy drops from 0.237 to 0.215. Similarly, in population E with the 1000E training set, the WMGBLUP model’s accuracy reduces from 0.287 to 0.275, and the MGBLUP model’s accuracy falls from 0.271 to 0.259. These results suggest that a higher preselected SNP proportion may introduce factors detrimental to prediction accuracy.
In this study, we conducted single-breed and multi-breed GWAS analyses on traits with a simulated heritability of 0.3. The use of significant principal components as covariates effectively mitigated the impact of population structure [31]. Previous research has indicated that, when preselecting SNP for GWAS, the accuracy of genomic prediction initially increases and subsequently decreases as the proportion of top preselected SNPs rises. The optimal prediction accuracy is typically achieved when 5% of the top SNPs are utilized [32]. In our analysis, we varied the proportion of SNP preselected through GWAS from the top 5% to 25%. Our findings demonstrate that the WMGBLUP model achieves the highest prediction accuracy when 5% of the top SNPs are preselected in both within-population and multi-population genomic predictions. This underscores the critical importance of selecting an appropriate preselection proportion to enhance prediction performance.

4.3. The Influence of the Weighted Multiple G Matrix Model on Accuracy

In this study, the genomic prediction accuracies for populations A, B, and E using the WMGBLUP and MGBLUP models, which incorporate multiple genomic relationship matrices, were significantly superior to those obtained with the GBLUP model. Raymond et al. [33] elucidated the benefits of employing a multiple genomic relationship matrix, highlighting the strategy of preselecting SNP with potential causal effects based on prior knowledge to construct one G matrix while using the remaining unselected SNP to construct another G matrix. This methodology allows the model to capitalize on the reduced number of independent chromosomal segments ( M e ) derived from the preselected SNP.
In the research on weighting factors, Su et al. [34] performed genomic prediction involving 5221 Holstein bulls that had undergone progeny testing. In the construction of the G matrix, they utilized five weighting factors: the posterior variance of SNP effects in the Bayesian model, the square of SNP effects, [ l o g 10 P ] of SNP effects in the t-test, the square of SNP effects in GWAS results, and [ l o g 10 P ] of SNP effects in the t-test, as the weights of the G matrix for genomic prediction. The results indicated that the posterior variance estimated by the Bayesian model served as the most effective weighting factor; however, this approach was associated with a substantial computational burden. Conversely, employing [ l o g 10 P ] from GWAS results as the weighting factor proved to be a more advantageous alternative. Furthermore, the TABLUP model developed by Zhang et al. employed genomic prediction utilizing a trait-specific relationship matrix. This model incorporated marker weights estimated by either Bayes B or RRBLUP [35] or the frequency of candidate loci occurrences for various traits as identified in GWAS results [36]. The GFBLUP, proposed by Edwards et al. [37], introduced additional genomic effects by considering the collective influence of markers within specific genomic features, such as genes, biological pathways, and gene annotations. Meanwhile, the GWABLUP method, proposed by Meuwissen et al. [38], performed GWAS analysis within the training population to calculate the likelihood ratio, subsequently using the posterior probability of SNP to differentially weight the G matrix.
Consequently, in constructing the model, our study not only incorporated the preselected SNPs weighted by [ l o g 10 P ] ] derived from the GWAS results but also utilized the remaining SNP to account for the remaining genetic variation. The findings indicated that the MGBLUP model, which employed two G matrices, and the WMGBLUP model, which utilized [ l o g 10 P ] as the SNP weight, generally exhibited higher prediction accuracies compared to the GBLUP model. This outcome aligns with the predictive results of the study by Raymond et al. [39].

4.4. Importance and Limitations of the Simulation

In the realm of contemporary beef cattle breeding, simulation technology “is of great importance. It enables efficient and cost-effective evaluation of genomic selection methods and provides a basis for translating new approaches into empirical applications. For instance, Steyn et al. [40] utilized the QMSim software to simulate five beef cattle breeds, elucidating the effects of shared and non-shared SNP impacts on multi-breed genomic evaluation. Similarly, Esrafili et al. [41] simulated multi-breed beef cattle populations, demonstrating that comprehensive genotyping enhances the predictive accuracy of genomic selection. This research provides critical insights for the practical application of genomic selection in beef cattle breeding. Building upon these studies, the present research extends the scope of investigation by exploring how inter-population kinship, reference population size, composition, and preselected SNP ratios affect genomic prediction accuracy. This study provides both scientific evidence and practical guidance for critical aspects of breeding practices. While this study simulates only a single trait with a heritability of 0.3 and a phenotypic variance of 1.0, this trait is significantly associated with numerous economically important traits in beef cattle production.
Nonetheless, this study’s simulation has several limitations. First, it does not account for environmental factors or gene-environmental interactions. The analysis was restricted to additive genetic effects, overlooking the roles of dominance and epistasis. Additionally, fixed genetic parameters were employed, which may not accurately reflect real-world conditions. Consequently, it is imperative to verify the results using empirical datasets. Such validation is essential to evaluate the models’ accuracy in practical applications, account for the effects of actual population structures and genetic diversity, and ultimately provide robust evidence to inform beef cattle breeding decisions. This approach is crucial for fostering the sustainable development of the beef cattle industry.

5. Conclusions

This study analyzed three beef cattle populations with varying relatedness using simulated multi-population data. SNPs with the smallest p-values from the top 5–25% of the GWAS group were preselected for the GP group, and the accuracies of within-population and multi-population genomic predictions were compared with weighted and unweighted p-values. The MGBLUP and WMGBLUP models outperformed the GBLUP model, with the WMGBLUP model using the top 5% SNPs achieving the highest accuracy. Additionally, the size and proportion of each population in the multi-population reference set significantly affected prediction accuracy, as seen in the lower accuracy for populations B and E due to an imbalance caused by an excess of individuals from population A. This study serves as a significant reference point for future research in the field of real beef cattle breeding.

Supplementary Materials

The following supporting information can be downloaded at https://www.mdpi.com/article/10.3390/agriculture15101094/s1, Figure S1: SNP density distribution chart; Table S1: Population numbers in each generation for populations A to E.

Author Contributions

H.Z., X.X., H.M., P.Z., B.X., Y.Z., L.X., H.G., J.L., Z.W. and X.N. conceived and designed the experiments; H.Z. analyzed the data; H.Z. and Z.W. wrote and revised the manuscript. All authors have read and agreed to the published version of the manuscript.

Funding

This study was supported by the National Natural Science Foundation of China (32102505).

Institutional Review Board Statement

All animals were treated following the guidelines for experimental animals established by the Council of China. This study involving the use of tissue samples was approved by the ethics committee of the Science Research Department of the Institute of Animal Science, Chinese Academy of Agricultural Sciences, under IAS2020-48.

Informed Consent Statement

Not applicable.

Data Availability Statement

The datasets used and analyzed during this study are available from the corresponding author on academic request.

Conflicts of Interest

The authors declare no conflicts of interest.

References

  1. Meuwissen, T.H.; Hayes, B.J.; Goddard, M.E. Prediction of total genetic value using genome-wide dense marker maps. Genetics 2001, 157, 1819–1829. [Google Scholar] [CrossRef]
  2. Yin, L.; Ma, Y.; Xiang, T.; Zhu, M.; Yu, M.; Li, X.; Liu, X.; Zhao, S. The Progress and Prospect of Genomic Selection Models. Acta Vet. Zootech. Sin. 2019, 50, 233–242. [Google Scholar]
  3. Mcgowan, M.; Wang, J.; Dong, H.; Liu, X.; Zhang, Z. Ideas in Genomic Selection with the Potential to Transform Plant Molecular Breeding: A Review. Preprints 2021, 273–319. [Google Scholar]
  4. Sun, D.; Zhang, S.; Zhang, Q.; Li, J.; Zhang, G.; Liu, C.; Zheng, W. Application Progress on Genomic Selection Technology for Dairy Cattle in China. Acta Vet. Zootech. Sin. 2023, 54, 4028–4039. [Google Scholar]
  5. Hozé, C.; Fritz, S.; Phocas, F.; Boichard, D.; Ducrocq, V.; Croiseau, P. Efficiency of multi-breed genomic selection for dairy cattle breeds with different sizes of reference population. J. Dairy. Sci. 2014, 97, 3918–3929. [Google Scholar] [CrossRef]
  6. Toosi, A.; Fernando, R.L.; Dekkers, J.C. Genomic selection in admixed and crossbred populations. J. Anim. Sci. 2010, 88, 32–46. [Google Scholar] [CrossRef]
  7. Ibtisham, F.; Zhang, L.; Xiao, M.; An, L.; Ramzan, M.B.; Nawab, A.; Zhao, Y.; Li, G.; Xu, Y. Genomic selection and its application in animal breeding. Thai J. Vet. Med. 2017, 47, 301–310. [Google Scholar] [CrossRef]
  8. Meuwissen, T.; Hayes, B.; Goddard, M. Genomic selection: A paradigm shift in animal breeding. Anim. Front. 2016, 6, 6–14. [Google Scholar] [CrossRef]
  9. Misztal, I.; Steyn, Y.; Lourenco, D.A.L. Genomic evaluation with multibreed and crossbred data. JDS Commun. 2022, 3, 156–159. [Google Scholar] [CrossRef]
  10. Hayes, B.J.; Bowman, P.J.; Chamberlain, A.C.; Verbyla, K.; Goddard, M.E. Accuracy of genomic breeding values in multi-breed dairy cattle populations. Genet. Sel. Evol. 2009, 41, 51. [Google Scholar] [CrossRef]
  11. Pryce, J.E.; Gredler, B.; Bolormaa, S.; Bowman, P.J.; Egger-Danner, C.; Fuerst, C.; Emmerling, R.; Sölkner, J.; Goddard, M.E.; Hayes, B.J. Short communication: Genomic selection using a multi-breed, across-country reference population. J. Dairy. Sci. 2011, 94, 2625–2630. [Google Scholar] [CrossRef]
  12. Erbe, M.; Hayes, B.J.; Matukumalli, L.K.; Goswami, S.; Bowman, P.J.; Reich, C.M.; Mason, B.A.; Goddard, M.E. Improving accuracy of genomic predictions within and between dairy cattle breeds with imputed high-density single nucleotide polymorphism panels. J. Dairy. Sci. 2012, 95, 4114–4129. [Google Scholar] [CrossRef]
  13. VanRaden, P.M. Efficient methods to compute genomic predictions. J. Dairy. Sci. 2008, 91, 4414–4423. [Google Scholar] [CrossRef]
  14. Goddard, M. Genomic selection: Prediction of accuracy and maximisation of long term response. Genetica 2009, 136, 245–257. [Google Scholar] [CrossRef]
  15. Calus, M.P.; Huang, H.; Vereijken, A.; Visscher, J.; Ten Napel, J.; Windig, J.J. Genomic prediction based on data from three layer lines: A comparison between linear methods. Genet. Sel. Evol. 2014, 46, 57. [Google Scholar] [CrossRef]
  16. Kachman, S.D.; Spangler, M.L.; Bennett, G.L.; Hanford, K.J.; Kuehn, L.A.; Snelling, W.M.; Thallman, R.M.; Saatchi, M.; Garrick, D.J.; Schnabel, R.D.; et al. Comparison of molecular breeding values based on within- and across-breed training in beef cattle. Genet. Sel. Evol. 2013, 45, 30. [Google Scholar] [CrossRef]
  17. Legarra, A.; Aguilar, I.; Misztal, I. A relationship matrix including full pedigree and genomic information. J. Dairy. Sci. 2009, 92, 4656–4663. [Google Scholar] [CrossRef]
  18. Lourenco, D.A.; Tsuruta, S.; Fragomeni, B.O.; Masuda, Y.; Aguilar, I.; Legarra, A.; Bertrand, J.K.; Amen, T.S.; Wang, L.; Moser, D.W.; et al. Genetic evaluation using single-step genomic best linear unbiased predictor in American Angus. J. Anim. Sci. 2015, 93, 2653–2662. [Google Scholar] [CrossRef]
  19. Song, H.; Ye, S.; Jiang, Y.; Zhang, Z.; Zhang, Q.; Ding, X. Using imputation-based whole-genome sequencing data to improve the accuracy of genomic prediction for combined populations in pigs. Genet. Sel. Evol. 2019, 51, 58. [Google Scholar] [CrossRef]
  20. Goddard, M.E.; Kemper, K.E.; MacLeod, I.M.; Chamberlain, A.J.; Hayes, B.J. Genetics of complex traits: Prediction of phenotype, identification of causal polymorphisms and genetic architecture. Proc. Biol. Sci. 2016, 283, 1835. [Google Scholar] [CrossRef]
  21. Veerkamp, R.F.; Bouwman, A.C.; Schrooten, C.; Calus, M.P. Genomic prediction using preselected DNA variants from a GWAS with whole-genome sequence data in Holstein-Friesian cattle. Genet. Sel. Evol. 2016, 48, 95. [Google Scholar] [CrossRef]
  22. van den Berg, I.; Boichard, D.; Lund, M.S. Sequence variants selected from a multi-breed GWAS can improve the reliability of genomic predictions in dairy cattle. Genet. Sel. Evol. 2016, 48, 83. [Google Scholar] [CrossRef]
  23. Du, Y.; Huang, C.; Wang, Y.; Li, S.; Wen, J.; Chen, Z.; Zhao, G.; Zheng, M. Genomic Selection for RFI in Broiler Combining GWAS Prior Marker Information. Acta Vet. Zootech. Sin. 2022, 53, 3403–3411. [Google Scholar]
  24. Sargolzaei, M.; Schenkel, F.S. QMSim: A large-scale genome simulator for livestock. Bioinformatics 2009, 25, 680–681. [Google Scholar] [CrossRef]
  25. Snelling, W.M.; Chiu, R.; Schein, J.E.; Hobbs, M.; Abbey, C.A.; Adelson, D.L.; Aerts, J.; Bennett, G.L.; Bosdet, I.E.; Boussaha, M.; et al. A physical map of the bovine genome. Genome Biol. 2007, 8, R165. [Google Scholar] [CrossRef]
  26. Brown, B.C.; Ye, C.J.; Price, A.L.; Zaitlen, N. Transethnic Genetic-Correlation Estimates from Summary Statistics. Am. J. Hum. Genet. 2016, 99, 76–88. [Google Scholar] [CrossRef]
  27. Yu, J.; Pressoir, G.; Briggs, W.H.; Vroh Bi, I.; Yamasaki, M.; Doebley, J.F.; McMullen, M.D.; Gaut, B.S.; Nielsen, D.M.; Holland, J.B.; et al. A unified mixed-model method for association mapping that accounts for multiple levels of relatedness. Nat. Genet. 2006, 38, 203–208. [Google Scholar] [CrossRef]
  28. Yin, C.; Zhou, P.; Wang, Y.; Yin, Z.; Liu, Y. Using genomic selection to improve the accuracy of genomic prediction for multi-populations in pigs. Animal 2024, 18, 101062. [Google Scholar] [CrossRef]
  29. Wientjes, Y.C.; Calus, M.P.; Goddard, M.E.; Hayes, B.J. Impact of QTL properties on the accuracy of multi-breed genomic prediction. Genet. Sel. Evol. 2015, 47, 42. [Google Scholar] [CrossRef] [PubMed]
  30. van den Berg, I.; MacLeod, I.M.; Reich, C.M.; Breen, E.J.; Pryce, J.E. Optimizing genomic prediction for Australian Red dairy cattle. J. Dairy. Sci. 2020, 103, 6276–6298. [Google Scholar] [CrossRef] [PubMed]
  31. Zhao, H.; Mitra, N.; Kanetsky, P.A.; Nathanson, K.L.; Rebbeck, T.R. A practical approach to adjusting for population stratification in genome-wide association studies: Principal components and propensity scores (PCAPS). Stat. Appl. Genet. Mol. Biol. 2018, 17, 6. [Google Scholar] [CrossRef]
  32. Wei, C.; Chang, C.; Zhang, W.; Ren, D.; Cai, X.; Zhou, T.; Shi, S.; Wu, X.; Si, J.; Yuan, X.; et al. Preselecting Variants from Large-Scale Genome-Wide Association Study Meta-Analyses Increases the Genomic Prediction Accuracy of Growth and Carcass Traits in Large White Pigs. Animals 2023, 13, 3746. [Google Scholar] [CrossRef]
  33. Raymond, B.; Wientjes, Y.C.J.; Bouwman, A.C.; Schrooten, C.; Veerkamp, R.F. A deterministic equation to predict the accuracy of multi-population genomic prediction with multiple genomic relationship matrices. Genet. Sel. Evol. 2020, 52, 21. [Google Scholar] [CrossRef]
  34. Su, G.; Christensen, O.F.; Janss, L.; Lund, M.S. Comparison of genomic predictions using genomic relationship matrices built with different weighting factors to account for locus-specific variances. J. Dairy. Sci. 2014, 97, 6547–6559. [Google Scholar] [CrossRef]
  35. Zhang, Z.; Liu, J.; Ding, X.; Bijma, P.; de Koning, D.J.; Zhang, Q. Best linear unbiased prediction of genomic breeding values using a trait-specific marker-derived relationship matrix. PLoS ONE 2010, 5, e12648. [Google Scholar] [CrossRef]
  36. Zhang, Z.; Ober, U.; Erbe, M.; Zhang, H.; Gao, N.; He, J.; Li, J.; Simianer, H. Improving the accuracy of whole genome prediction for complex traits using the results of genome wide association studies. PLoS ONE 2014, 9, e93017. [Google Scholar] [CrossRef]
  37. Edwards, S.M.; Sørensen, I.F.; Sarup, P.; Mackay, T.F.; Sørensen, P. Genomic Prediction for Quantitative Traits Is Improved by Mapping Variants to Gene Ontology Categories in Drosophila melanogaster. Genetics 2016, 203, 1871–1883. [Google Scholar] [CrossRef]
  38. Meuwissen, T.; Eikje, L.S.; Gjuvsland, A.B. GWABLUP: Genome-wide association assisted best linear unbiased prediction of genetic values. Genet. Sel. Evol. 2024, 56, 17. [Google Scholar] [CrossRef]
  39. Raymond, B.; Bouwman, A.C.; Wientjes, Y.C.J.; Schrooten, C.; Houwing-Duistermaat, J.; Veerkamp, R.F. Genomic prediction for numerically small breeds, using models with pre-selected and differentially weighted markers. Genet. Sel. Evol. 2018, 50, 49. [Google Scholar] [CrossRef]
  40. Steyn, Y.; Lourenco, D.A.L.; Misztal, I. Genomic predictions in purebreds with a multibreed genomic relationship matrix. J. Anim. Sci. 2019, 97, 4418–4427. [Google Scholar] [CrossRef] [PubMed]
  41. Esrafili Taze Kand Mohammaddiyeh, M.; Rafat, S.A.; Shodja, J.; Javanmard, A.; Esfandyari, H. Selective genotyping to implement genomic selection in beef cattle breeding. Front. Genet. 2023, 14, 1083106. [Google Scholar] [CrossRef] [PubMed]
Figure 1. Simulated Data Flow Diagram. Historically, a population comprising 10,000 animals engaged in random mating over the course of 1000 generations, ultimately diminishing to a population size of 1000 individuals by the 2000th generation. Subsequently, random mating was implemented over 30 generations was conducted to augment the foundational population across five distinct groups. Following this period, selective breeding was conducted after six generations, leading to variations in both population sizes and the number of animals exhibiting selected genotypes.
Agriculture 15 01094 g001
Figure 2. The genetic correlation values among groups A to E were analyzed across six generations. (a) The genetic correlation values between groups A to E for the first generation; (b) The genetic correlation values between groups A to E for the second generation; (c) The genetic correlation values between groups A to E for the third generation; (d) The genetic correlation values between groups A to E for the fourth generation; (e) The genetic correlation values between groups A to E for the fifth generation; (f) The genetic correlation values between groups A to E for the sixth generation.
Agriculture 15 01094 g002
Table 1. Summary of parameters used to simulate the five different populations for the evaluation.
ParametersABCDE
Initial males6050505060
Initial females28002600300024002500
Sire replacement0.500.500.600.500.60
Sire growth rate0.070.060.10.070.11
Dam replacement0.300.300.300.300.30
Dam growth rate0.10.10.130.10.13
Number of offspring per dam1
Mating designRandom
Table 2. Group combination methods and the number of individuals in each group.
GWAS GroupTraining Set of the GP
Group
Test Set of the GP
Group
800A 11000A800A
1600A2000A
2400A3000A
3200A4000A
2400A_800B 23000A_1000B
2400A_800E3000A_1000E
1600A_1600B2000A_2000B
1600A_1600E2000A_2000E
800B1000B800B
1600B2000B
3200B4000B
2400A_800B3000A_1000B
1600A_1600B2000A_2000B
800E1000E800E
1600E2000E
3200E4000E
1600A_1600E2000A_2000E
2400A_800E3000A_1000E
1 800A represents 800 individuals from population A. 2 2400A_800B represents a combined reference population composed of 2400 individuals from population A and 800 individuals from population B. The rest can be deduced by analogy.
Table 3. The accuracy of within-population genomic prediction for population A.
Preselected SNPModelTraining Set of GP Group
1000A2000A3000A4000A
-GBLUP0.246 (0.008) 10.320 (0.008)0.346 (0.007)0.420 (0.005)
top5% 2WMGBLUP0.278 (0.008)0.406 (0.011)0.450 (0.008)0.520 (0.005)
MGBLUP0.275 (0.009)0.389 (0.010)0.432 (0.009)0.510 (0.005)
top10%WMGBLUP0.269 (0.008)0.377 (0.010)0.428 (0.007)0.497 (0.004)
MGBLUP0.268 (0.009)0.365 (0.009)0.414 (0.012)0.485 (0.004)
top15%WMGBLUP0.263 (0.008)0.360 (0.009)0.403 (0.008)0.478 (0.004)
MGBLUP0.262 (0.009)0.353 (0.009)0.394 (0.006)0.467 (0.005)
top20%WMGBLUP0.267 (0.009)0.348 (0.009)0.391 (0.008)0.455 (0.006)
MGBLUP0.258 (0.008)0.344 (0.009)0.383 (0.013)0.454 (0.005)
top25%WMGBLUP0.262 (0.008)0.346 (0.008)0.385 (0.008)0.473 (0.004)
MGBLUP0.255 (0.008)0.338 (0.008)0.368 (0.005)0.446 (0.005)
1 Standard error of estimates are given between parentheses. 2 The top5%–top25% represents the proportion of SNP with the smallest p-values selected according to the results of GWAS.
Table 4. The accuracy of multi-population genomic prediction for population A.
Preselected SNPModelTraining Set of GP Group
3000A_1000B3000A_1000E2000A_2000B2000A_2000E
-GBLUP0.366 (0.008) 0.398 (0.009)0.360 (0.006)0.341 (0.010)
top5%WMGBLUP0.513 (0.008)0.514 (0.006)0.433 (0.007)0.461 (0.006)
MGBLUP0.490 (0.008)0.496 (0.007)0.441 (0.007)0.460 (0.006)
top10%WMGBLUP0.478 (0.008)0.479 (0.007)0.423 (0.007)0.441 (0.007)
MGBLUP0.449 (0.008)0.470 (0.008)0.422 (0.007)0.431 (0.007)
top15%WMGBLUP0.448 (0.008)0.460 (0.008)0.409 (0.008)0.422 (0.008)
MGBLUP0.424 (0.008)0.452 (0.008)0.406 (0.008)0.411 (0.008)
top20%WMGBLUP0.426 (0.008)0.447 (0.008)0.397 (0.008)0.406 (0.008)
MGBLUP0.409 (0.008)0.440 (0.008)0.394 (0.008)0.395 (0.008)
top25%WMGBLUP0.409 (0.008)0.434 (0.008)0.388 (0.008)0.391 (0.009)
MGBLUP0.398 (0.008)0.429 (0.009)0.385 (0.008)0.382 (0.009)
Table 5. The accuracy of within-population and multi-population genomic prediction for population B.
Preselected SNPModelTraining Set of GP Group
1000B2000B4000B3000A_1000B2000A_2000B
-GBLUP0.207 (0.013)0.309 (0.007)0.423 (0.007)0.109 (0.010)0.293 (0.013)
top5%WMGBLUP0.250 (0.012)0.375 (0.006)0.534 (0.006)0.253 (0.009)0.432 (0.008)
MGBLUP0.237 (0.013)0.352 (0.008)0.509 (0.007)0.227 (0.010)0.417 (0.010)
top10%WMGBLUP0.249 (0.011)0.347 (0.011)0.518 (0.006)0.224 (0.010)0.414 (0.009)
MGBLUP0.229 (0.013)0.333 (0.006)0.487 (0.007)0.190 (0.010)0.387 (0.011)
top15%WMGBLUP0.247 (0.010)0.344 (0.007)0.506 (0.006)0.202 (0.010)0.392 (0.011)
MGBLUP0.222 (0.013)0.323 (0.004)0.473 (0.007)0.169 (0.010)0.362 (0.012)
top20%WMGBLUP0.245 (0.012)0.322 (0.008)0.520 (0.006)0.184 (0.011)0.377 (0.011)
MGBLUP0.218 (0.013)0.314 (0.011)0.461 (0.007)0.154 (0.010)0.346 (0.012)
top25%WMGBLUP0.241 (0.012)0.312 (0.009)0.511 (0.006)0.171 (0.011)0.364 (0.011)
MGBLUP0.215 (0.013)0.311 (0.007)0.452 (0.007)0.142 (0.010)0.333 (0.012)
Table 6. The accuracy of within-population and multi-population genomic prediction for population E.
Preselected SNPModelTraining Set of GP Group
1000E2000E4000E3000A_1000E2000A_2000E
-GBLUP0.254 (0.010)0.321 (0.015)0.429 (0.007)0.120 (0.012)0.334 (0.012)
top5%WMGBLUP0.287 (0.009)0.389 (0.012)0.537 (0.007)0.285 (0.011)0.438 (0.010)
MGBLUP0.271 (0.009)0.381 (0.012)0.525 (0.006)0.252 (0.013)0.430 (0.011)
top10%WMGBLUP0.285 (0.009)0.356 (0.005)0.523 (0.006)0.255 (0.012)0.428 (0.010)
MGBLUP0.266 (0.009)0.350 (0.009)0.504 (0.006)0.213 (0.013)0.408 (0.011)
top15%WMGBLUP0.280 (0.009)0.351 (0.006)0.510 (0.006)0.230 (0.012)0.414 (0.010)
MGBLUP0.263 (0.009)0.349 (0.011)0.488 (0.006)0.188 (0.013)0.391 (0.011)
top20%WMGBLUP0.277 (0.009)0.349 (0.013)0.501 (0.006)0.211 (0.012)0.401 (0.009)
MGBLUP0.261 (0.009)0.342 (0.006)0.476 (0.006)0.171 (0.013)0.377 (0.011)
top25%WMGBLUP0.275 (0.009)0.344 (0.007)0.498 (0.006)0.196 (0.011)0.392 (0.010)
MGBLUP0.259 (0.009)0.324 (0.012)0.466 (0.007)0.159 (0.013)0.348 (0.012)
Disclaimer/Publisher’s Note: The statements, opinions and data contained in all publications are solely those of the individual author(s) and contributor(s) and not of MDPI and/or the editor(s). MDPI and/or the editor(s) disclaim responsibility for any injury to people or property resulting from any ideas, methods, instructions or products referred to in the content.

