Article

Short-Term Effects of Wood Biochar on Soil Fertility, Heterotrophic Respiration and Organic Matter Composition

1
DAFE—Department of Agricultural, Forest, Food and Environmental Sciences, University of Basilicata, 10, Viale dell’Ateneo Lucano, 85100 Potenza, Italy
2
Dipartimento di Farmacia (DIFARMA), Università degli Studi di Salerno, Via Giovanni Paolo II 132, 84084 Fisciano, Italy
3
Maniola Remote Sensing, s.r.l., 84015 Nocera, Italy
4
Dipartimento di Agraria, Università di Napoli Federico II, Piazza Carlo di Borbone 1, 80055 Portici, Italy
5
CERMANU—Centro Interdipartimentale sulla Risonanza Magnetica Nucleare per l’Ambiente, l’Agro-Alimentare ed i Nuovi Materiali, Piazza Carlo di Borbone 1, 80055 Portici, Italy
*
Author to whom correspondence should be addressed.
Agriculture 2025, 15(10), 1091; https://doi.org/10.3390/agriculture15101091
Submission received: 30 March 2025 / Revised: 10 May 2025 / Accepted: 13 May 2025 / Published: 19 May 2025
(This article belongs to the Section Agricultural Soils)

Abstract

:
Biochar may represent a sustainable and eco-friendly strategy to recycle agroforestry wastes, sequester carbon and improve soil health. With the aim of proving these benefits in a real scenario, we treated several soil parcels with 0 (CTRL), 1 (LOW) and 3 (HIGH) kg/m2 of wood biochar, in open-field trials. The heterotrophic soil respiration (SR) was monitored continuously for two months via a Closed Dynamic Chamber (CDC) associated with an innovative pilot system, and the most important soil chemical parameters were measured 9 and 54 days after biochar application. Biochar induced an immediate dose-dependent increase in organic matter content and CEC (up to 41.6% and 36.8% more than CTRL, respectively), which tended to slightly and gradually decrease after 54 days. In all cases, biochar induced a more pronounced SR, although the most enhanced microbial response was detected for the LOW parcel (19.3% higher than CTRL). Fennels were grown in treated soils and only LOW microplots gave a significantly better response (weight and size). Finally, NMR, FT-IR and Pyr-GC/MS analyses of LOW SOM extracts revealed a relevant impact on the composition, which was accompanied by a higher content of carbohydrates, indole-based compounds and FAME species correlating with enhanced microbial activity. Our findings demonstrate that the proper biochar dose improves soil fertility by creating an environment favorable to plants and promoting microbial activity.

Graphical Abstract

1. Introduction

Serious and worrying environmental issues affect modern farming, including the intensive exploitation of soils resulting in a decline of their fertility and the widespread decrease in organic matter in agricultural soils [1], features associated with serious impacts on plant production, soil biodiversity and microbial quality. These dramatic conditions are worsened by the effects of climatic change and unsustainable soil management, which are detrimental for soil ecosystem services. Therefore, it is necessary to find useful, effective and innovative solutions to these problems, to make soil more resilient and to improve its quality and health. The recycling of waste biomass may produce new materials useful for soil and plants, and represent an eco-friendly and sustainable strategy to manage forestry and agrofood wastes [2]. In fact, the proper recycling of biomass can produce new products for soil, capable of ameliorating its resilience and fertility, improving crop responses and serving as a slow releaser of important nutrients such as N, P and S [3]. Such a strategy would enhance the value of organic waste and, at the same time, decrease the demand for fertilizers and biostimulants, thus reducing costs in the management of agrosystems. Moreover, it would be perfectly in line with circular economy principles and sustainable development models [4]. Biochar has recently attracted a large amount of interest because it not only exhibits most of the above-mentioned properties, but also exhibits the potential to improve soil physical, chemical and microbiological quality [5]. Biochar results from the pyrolysis of organic material which consists of high thermochemical decomposition, carried out in the absence of oxygen and at temperatures ranging between 300 and 450 °C [6]. Solid biochar, which represents the solid phase resulting from this process, is a dark black solid fraction, rich in carbon and polyaromatic compounds [7]. Its composition can change drastically depending on factors such as the type of processed biomass, the pyrolysis temperature, the steepness of the heating gradient and the duration of pyrolysis [6]. During the biocharring process, the large amount of thermal energy supplied to the biomass cleaves chemical bonds in complex and polymeric organic molecules (i.e., cellulose, hemicellulose, lignin, tannins), altering their compositional characteristics and promoting their rearrangement into new bonds, especially via radical reactions [5]. One of the predominant syntheses that occurs during pyrolysis leads to the neoformation of complex molecules mostly characterized by their polyphenolic and hydrophobic nature [8]. Typically, the solid material resulting from this process exhibits up to 70% carbon content which, due to its recalcitrant nature, is only slowly degraded by soil microorganisms. For this reason, the biochar is considered an eco-friendly strategy to sequester carbon and limit the emissions of the greenhouse gas CO2, with important environmental implications.
To date, an increasing body of research has proven biochar’s effectiveness in increasing crop productivity and soil quality [9,10,11,12,13]. For example, Asai and coworkers [14] examined the effect of biochar, obtained from residues of teck wood (Tectona grandis L.) and rosewood, on both the physical properties of soil and the yields of mountain rice grains (Oryza sativa L.). They demonstrated an increase in soil productivity, although the effects were strongly dependent on the type of soil and biochar, as well as on the climatic conditions and the application rate [15]. Haefel and coworkers [16] tested the effects of rice biochar on both soil characteristics and rice crop growth, and reported an increase in total soil organic carbon and nitrogen and in available P and K, as well as demonstrating a soil type-dependent persistence in soil. It has been demonstrated that biochar also benefits tomatoes and lettuce by improving seed germination, root elongation, and biomass accumulation, and promotes enhanced soil fertility and microbial activity [17]. It has been also demonstrated that biochar can suppress phytopathogenic fungi, such as Sclerotinia sclerotiorum, by inhibiting hyphal growth [18]. Some studies have reported increased CO2 emissions due to more pronounced microbial biomass and enzymatic activity elicited by biochar [19,20]. However, it has been proved that biochar’s effects and the extent of its action are strictly dependent on factors such as feedstock type, pyrolysis conditions, and, ultimately, soil properties [21,22].
Another important aspect is represented by the impact which biochar may have on soil organic matter composition [23]. Due to the complex and heterogeneous nature of soil organic matter, such an investigation may be conducted via a preliminary extraction followed by the use of advanced and powerful analytical techniques, including Pyrolysis Gas Chromatography-Mass Spectrometry (Pyr-GC/MS) [24,25], 13C CPMAS NMR [26,27] and FT-IR spectroscopy [28,29]. However, a full understanding of biochar’s properties and effects on soil, direct or indirect, is still lacking. In fact, studies concerning the effects of biochar application on soil, with particular regard to open field trials and advanced evaluation of biochar’s effects on soil organic matter composition, are still relatively limited and sometimes discordant.
Therefore, in this work we investigated the short-term effects of application of high-quality wood biochar on soil, supplied at different doses. The impact on soil quality and health was assessed by comparing time points before and 9 and 54 days after biochar administration, as well as by examining, in a continuous and innovative way, the soil’s heterotrophic respiration through a pilot system based on an automated CDC (Closed Dynamic Chamber). Then, biochar’s effects on crop productivity was estimated by assessing the relevant production parameters of fennels grown in treated soils. Finally, to delve into the impact of biochar on soil organic matter composition, the latter was extracted and evaluated in detail through a combination of advanced techniques, such as solid-state CPMAS-NMR, FTIR and Pyr-GC/MS.

2. Materials and Methods

2.1. Biochar

The biochar (Nera Biochar srl., Settimo Vittone, Italy) was obtained by the thermic treatment of PEFC (Program for Endorsement of Forest Certification schemes) certified wood. This biochar was produced in a modern production plant, capable of separating and removing most polycyclic aromatic hydrocarbons and guaranteeing a PHA content lower than 0.5 mg/kg. Briefly, it was produced by treating the wood at 650 °C, with a residence time of 1 h and a heating rate of 20 °C/min. According to the manufacturer’s datasheet, the contents of heavy metals, such as Zn, Cu, Pb, Hg, Cd, CrVI, Ni, As, were below the required limits for agricultural applications. The main properties, including chemical and physical parameters as well as nutrient and heavy metals content, are reported in Supporting Figure S1 (information provided by the provider Nera Biochar).

2.2. Experimental Field and Microplot Preparation

The biochar-based open field experiments were carried out at the “Luigi Cerrato” farm, situated in Sarno (Salerno, Italy; latitude 14.6159011; longitude 40.7976669; altitude of 46 m a.s.l.). The farm’s soil exhibited a sandy-loam texture, a depth ≥ 2 m and was slightly calcareous (≈60 g/kg of CaCO3 equivalents). Nine squared soil microplots (1 m2 each) were delimited within a total area of 20 m2, according to a 3 × 3 randomized block design and considering a distance of 50 cm among each block.
The studied microplots were treated without (0 kg/m2; CTRL) and with biochar, at the doses of 1 (LOW) and 3 (HIGH, as recommended by the provider for sandy-loam textured soils) kg/m2. The solid fragments of biochar were homogeneously distributed on the surface of treated soils and then physically incorporated within a depth of 20 cm (Supporting Figure S2a). In order to standardize the process, the soil particles were physically mixed, within 20 cm of depth, also in the CTRL microplots.
One soil respiration chamber (described in detail below) was installed in each CTRL, LOW and HIGH microplot (Supporting Figure S2b; three total respiration chambers). The chambers were considered operative only once (i) the system was physically stable and resistant to wind, (ii) temperature and humidity sensors provided stable responses and (iii) the data logger and photovoltaic panel responded to testing. The experiment with the respiration chambers lasted from October 2020 to December 2020. During this period, weeds were removed regularly (two times per week) from each microplot to minimize the autotrophic respiration. Grass removal was performed gently, to avoid compressing macropores and altering soil aeration. Throughout this period, the soil did not receive irrigation water. Weather data concerning the whole experimental period (October 2020 and March 2021) are shown in Supporting Figure S3.

2.3. Soil Sampling and Characterization

A periodic sampling of soil was conducted for each of the nine microplots, at a depth in the range of 15–25 cm. For each microplot, four soil aliquots were collected and homogenized to take into account possible site-specific inhomogeneities.
Soil samples were collected immediately before biochar treatment (samples A, collected on 9 October 2020), and 9 days after (samples B, collected on 19 October 2020) and 54 days after (samples C, collected on 2 December 2020) biochar application. Samples were air-dried, at room temperature, sieved at 2 mm and stored until subsequent analysis.

2.4. Soil Chemical Analysis

Texture, total carbonates, salinity, pH, cation exchange capacity (CEC) and total organic matter (SOM) of the analyzed microplots were tested in triplicate, according to the official methods for soil analysis [30] and taking into account the variations proposed by the official revision of the Italian Soil Science Society. Briefly, the texture and the total carbonates were assessed by the Andreasen’s pipette and Dietrich–Fruhling calcimeter methods, respectively. The soil pH and salinity tests were conducted by putting 4 g of soil in contact with 20 mL of either an aqueous solution of CaCl2 [0.01 M] or ultra-pure water (dilution 1:5, w:v), respectively. The detection was conducted using a HANNA INSTRUMENT HI5221 detector (Levanchimica, Bari, Italy), equipped with probes suitable for measuring pH and electrical conductivity (in μS cm−1). Total organic carbon (Corg) was measured by the Walkley–Black wet oxidation method. Briefly, 1 g of soil underwent oxidation by potassium dichromate (1 N) and concentrated H2SO4 (98%; Avantor, Milan, Italy) solutions. After 30 min, the reaction was stopped by adding 200 mL of cold water. The quantification of organic carbon was done by redox titration with a solution of ammonium iron (II) sulfate hexahydrate [0.5 M], by using ferroin as a redox indicator. The cation exchange capacity (CEC) was calculated by conducting the assay based on soil mono-saturation with a barium chloride solution at pH 8.2. Briefly, after mono-saturation of soil (2 g) with barium chloride (0.41 M; Avantor, Milan, Italy), a defined quantity of a magnesium sulphate solution was added to the Ba-saturated sample, thus leading to complete Ba/Mg exchange. The excess magnesium in solution was determined by complexometric titration by using Black Eriochrome T as a complexometric indicator (mixed with NaCl in the 3:1 W:W proportion), and ethylenediaminetetraacetic acid (2.5 cmol/L; Avantor, Milan, Italy) as titration solution. Soil analyses were conducted individually for each microplot (three replicates per microplot). The results shown are the average of the results achieved for each treatment (three measures per three field-replicates per thesis).

2.5. Carbon Mote System for Measuring Soil Respiration

The Carbon Mote device was manufactured by the company Maniola Smart Sensing s.r.l. (Nocera, Italy) and included a Closed Dynamic Chamber (CDC) intended to measure the carbon dioxide fluxes released by the soil. Briefly, the system was equipped with a self-powered system based on a photovoltaic panel to enable open-field evaluations for long periods in the absence of cabled energy sources (Supporting Figure S4a). In addition, it was coupled to sensors to continuously monitor parameters such as soil and air temperature, air humidity and atmospheric pressure.
In detail, the carbon mote device consisted of (i) a galvanized steel pole anchored to the ground and equipped with a solar panel (25 Wp, 12 V, 1.39 A), (ii) a device transmitting data to a central unit and allowing the control of peripheral devices, (iii) an external power supply, linked to solar panel/battery and controlling the node without power supply, (iv) a module with an IRGA analyzer for CO2 detection, equipped with an additional sampling pump, and (v) a dome-shaped chamber lid (Supporting Figure S4b; hole diameter of 28 cm, area of 615.7 cm2; chamber volume 5747 cm3). The latter was driven by a motor which, during the measurement phase, is lowered onto the hole-collar, thus sealing the accumulation chamber. The air accumulated in the chamber is then transferred to the IRGA analyzer, passing through a physical filter (to retain dust particles larger than 150 mm) and a chemical filter (based on soda lime and DRIERITE).
The CO2 flux acquisition process consisted of 2 min-long accumulations/detections which were conducted daily (daytime, within the hours 13.00–15.00) for 54 days. The flux was calculated for each measure, according to the following Formula (1):
F C O 2   ppm / s = F e n d F b e g . t i n
where tin indicates the time interval (s) where the CO2 development follows a linear evolution (generally lower than 90 s), while Fbeg. and Fend are the CO2 contents revealed immediately after the beginning of the IR detection (10 s after lid closure) and at the end of the linear CO2 evolution (indicating the CO2 saturation of the chamber), respectively. The soil respiration values (SR) were calculated by applying the following Formula (2) [31].
S R   g   CO 2   m 2   h 1 = V   F C O 2 G   S   T + 273.15
where V is the volume of the storage chamber (5747 cm3), FCO2 is dCO2/dt (expressed in ppm/h and obtained multiplying FCO2 by 3600), G is the universal gas constant (8.31 J mol−1 K−1), S represents the area of the collar of the accumulation chamber (615.7 cm2), and T is the measured soil temperature (°C).

2.6. Effects of Biochar on Soil Fertility

On March 2021, fennels were transplanted into all of the studied microplots (three field replicates per treatment) to evaluate possible induced effects on soil fertility. We used the Preludio variety (F1 hybrids; Vivai le Georgiche, Brescia, Italy) because it is a high-quality spring-type fennel, characterized by good productive characteristics, a uniform size with a round section and a relatively small diameter of the taproot. It is an early cycle cultivar, the transplanting of which occurs between the end of March and the beginning of April, and which is usually harvested from May to June. Before transplantation, the soil was prepared in order to minimize compaction. After transplantation (which took place 5 months after the addition of biochar), constant and regular irrigation was applied through a drip system. The planting pattern consisted of single rows, with an average density of nine plants/m2, with a simple pattern of 20 cm (intra-row) × 35 cm (inter-row). Fennels were harvested manually at the end of May 2021, before the beginning of sprout elongation. At harvest, the number of regularly developed fennels per parcel (27 per thesis) was evaluated, including their weight, axial diameter and length of the epigeal part. The results were expressed as averages and standard deviations per microplot and elaborated by ANOVA test. The differences in ANOVA results were considered significant at a p value of at least <0.05 for both Tukey and Benjamini–Hochberg tests (α confidence level of 0.05). All the statistical analyses were performed using XLSTAT Software (v. 2016, Addinsoft, Paris, France).

2.7. Extraction of Soil Organic Matter

The SOM was extracted from CTRL and LOW microplots 54 days following the application of biochar. For each thesis, the samples resulting from the three field replicates were merged and homogenized. The extraction was performed by placing 100 g of 2 mm sieved and dried soil in contact with 1 L of an aqueous solution containing NaOH (1 M; Avantor, Milan, Italy) and sodium pyrophosphate (0.1 M). The extraction process was carried out for 16 h on a rocking shaker, set at 150 rpm. Then, the supernatant was separated from the pellet through a 20 min centrifugation at 6000 rpm. The pellets underwent a second extraction which was performed for 2 h. The supernatant was again isolated by centrifugation and added to the first aliquot. The extract was filtered through a sterile gauze, to remove coarse and low-density organic material, then adjusted to pH 7, dialyzed against Milli-Q water (3500 kDa membranes; Levanchimica, Bari, Italy), frozen, and freeze-dried using an Edwards MODULYO 5289 freeze dryer.

2.8. FT-IR and CPMAS NMR Spectroscopies

The molecular composition of biochar and soil extracts was characterized in the solid state by Fourier Transform Infrared (FT-IR) and Cross Polarization Magic Angle Spinning Nuclear Magnetic Resonance (CPMAS NMR) spectroscopies.
FTIR analysis was carried out via the ATR (Attenuated Total Reflection) technique on solid and dried samples, sieved at 0.5 mm. The analyses were conducted in duplicate on the PERKIN ELMER Frontier instrument, by setting 64 scans, a wavelength range between 4000 and 600 cm−1, and a resolution of 4 cm−1. For each acquisitions set, a background spectrum was examined. Spectra were converted in absorptive mode. A baseline correction was conducted for each spectrum in order to make them suitable for direct and reliable comparison. All spectra were processed using Spectragryph software (v. 1.2.16.1; F. Menges; Oberstdorf; Germany).
13C CPMAS NMR spectroscopy was conducted on a 300 MHz Bruker Avance wide-bore magnet (Bruker Biospin, Rheinstetten, Germany), equipped with a CPMAS probe, at 25 °C and at the 13C and 1H frequencies of 75.47 and 300.13 MHz, respectively. Finely powdered solid samples (60–80 mg), sieved at 0.5 mm, were loaded into 4 mm zirconia rotors, sealed with KelF caps, and spun at a rate of 10,000 ± 1 Hz. 13C NMR spectra were obtained through the CPMAS experiment which included 1814 time domain points, a spectral width of 300 ppm (22,727.3 Hz), a recycle delay of 5 s, eight dummy scans, and 8000 scans. High-power proton decoupling was applied by the TPPM15 (time proportional phase modulation) decoupling sequence. Free induction decays (FIDs) were processed by Bruker Tospin (v 4.0.1; Bruker Biospin, Rheinstetten, Germany) software. Spectra underwent Fourier transformation by using a two-fold zero-filling and applying an exponential filter function of 400 Hz, before phase and baseline correction. 13C CPMAS NMR spectra were separated into the following resonance intervals, the areas of which were then integrated and reported as absolute values per 100 mg of sample: alkyl-C (0–45 ppm); methoxyl-C and N-alkyl-C (45–60 ppm); O-alkyl-C (60–110 ppm); aryl-C (110–145 ppm); phenol-C (145–160 ppm); carboxyl-C (190–160 ppm); quinone-C and ketone-C (230–190 ppm). The hydrophobicity index (3), the lignin ratio (4) and the Alk/O-Alk ratio (5) were calculated by considering specific 13C NMR intervals and according to the following equations:
HB = 0 45 + 45 61 + 110 145 + 145 160 61 90 + 97 110 + 160 190
LIGNIN   RATIO = 45 60 145 160
ALK / O-ALK   RATIO = 0 45 61 90 + 97 110

2.9. Thermochemiolysis Followed by Gas Chromatography and Mass Spectrometry (Pyr-GC/MS)

Aiming to simplify the complex and heterogeneous nature of SOM and enable its analysis, the studied organic extracts underwent a preliminary thermochemiolysis inducing a depolymerization of large molecules and natural biopolymers, accompanied by a methylation of terminal hydroxyl and carboxyl groups. The procedure was applied according to the method of Verrillo et al. [32]. Briefly, the SOM extracts (500 mg) were placed into a quartz container and wetted with 1 mL of a tetramethylammonium hydroxide (TMAH) (25% in methanol). After two hours, the sample was introduced into a Pyrex tubular reactor (50 cm long × 3.5 cm i.d.), and heated at 400 °C in a furnace (Barnstead Thermolyne 21100; American Laboratory Trading; East Lime, CT, USA) for 30 min. During pyrolysis, the volatile components, including the ones deriving from depolymerization and derivatization, were transported by a helium flow (20 mL/min) and entrapped in two dichloromethane solutions, arranged in series and kept in an ice bath to maintain the temperature low, thus promoting compound solubilization. The dichloromethane solutions were combined and roto-evaporated to dryness. The residue was dissolved in 1 mL of dichloromethane and transferred to a glass vial prior to GC–MS analysis. The latter was performed using a Perkin Elmer Autosystem XL Gas Chromatograph, equipped with an RTX-5MS WCOT capillary column (Restek, 30 m × 0.25 mm; film thickness, 0.25 mm) and coupled, through a heated transfer line (250 °C), to a PE Turbomass-Gold quadrupole mass spectrometer. The chromatographic separation was achieved with the following temperature program: 60 °C (1 min isothermal), rate 7 °C min−1 to 320 °C (10 min isothermal). Helium was used as carrier gas at 1.90 mL min−1, the injector temperature was 250 °C, and the split-injection mode had a 30 mL min−1 of split flow. Mass spectra were obtained in EI mode (70 eV) by scanning in the range 45–650 m/z, with a cycle time of 0.2 s. The identification of mass spectra of the eluted compounds was carried out by comparing the results with those of standard compounds, exploiting the mass spectra library NIST 05 (https://www.nist.gov; accessed on June 2024) with the support of the pertinent literature. The areas of signals detected in the pyrograms were integrated, grouped according to the specific compound class, and added up. The molecule categories dictating this grouping were the following: nitrogen-containing compounds, fatty acid methyl esters (FAME), branched FAME and hydroxyacids, unsaturated and branched FAME, aromatic compounds, N-containing aromatic compounds (including a subgroup referring to indole structures) and lignin moieties (including three subgroups discriminating P, G and S units). The respective cumulative integrations were reported both in absolute and in normalized (as % of the integration of the total chromatogram) forms.

3. Results and Discussion

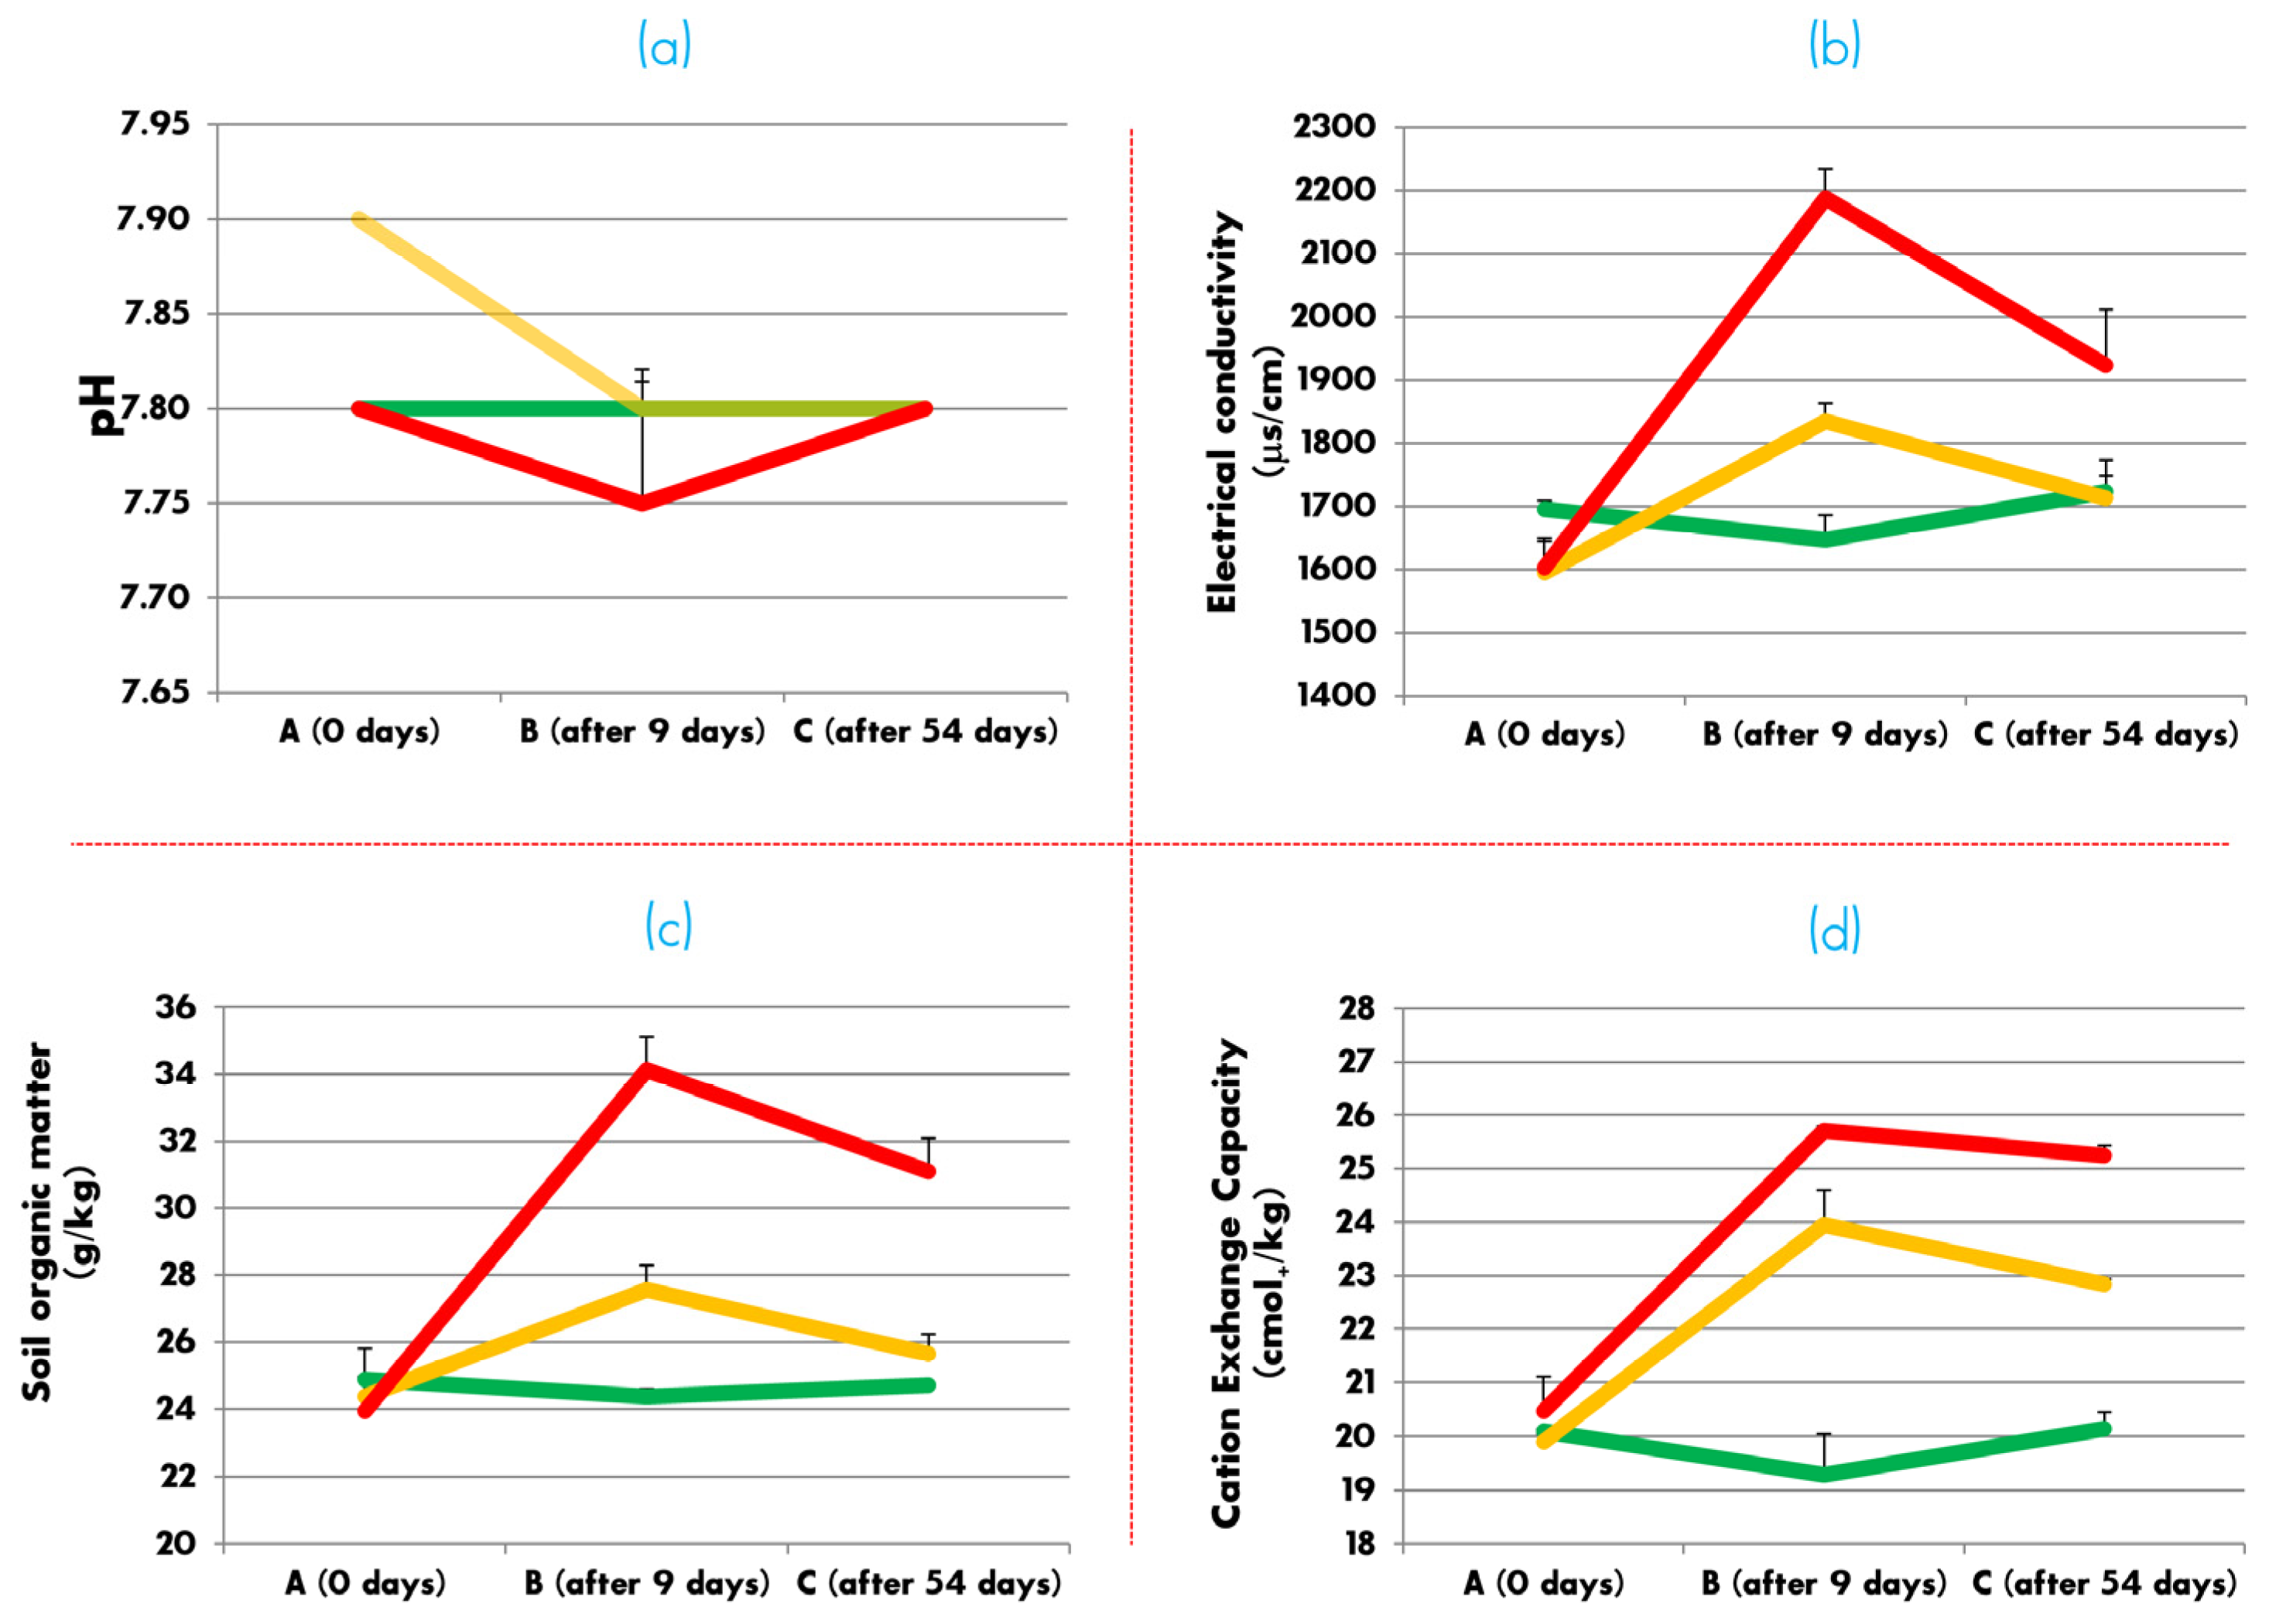
3.1. Soil Chemical Analyses

Important parameters related to soil quality and fertility were evaluated for microplots treated without (CTRL) or with a high-quality wood biochar, supplied at relatively low (LOW, 1 kg/m2) and high (HIGH, 3 kg/m2; as recommended by the provider) doses. Evaluations were carried out before (A) and 9 (B) and 54 (C) days after biochar application. pH is a determinant factor for soil health and fertility, affecting both the solubility and bioavailability of several nutrients, and capable of influencing the activity and the survival of edaphic microorganisms and vegetable species. Due to its nature, biochar is generally characterized by a pH ranging from slightly alkaline to strongly alkaline, depending on the type of processed biomass and the conditions adopted in the production process [33,34]. Therefore, its administration in soil is expected to result in slight alkalization. The biochar used in this study had a pH of 8.4, while the soil exhibited a pH of 7.8, thus reflecting its appreciable limestone content (≈60 g/kg CaCO3; soil classified as slightly calcareous). Biochar incorporation did not significantly change the soil pH, which invariably proved to be 7.8 ± 0.1 for each microplot, in both phases B and C (Figure 1a). In disagreement with previous conclusions [35,36], the investigated biochar, even when used at relatively high doses (3 kg/m2), did not alter the soil pH, probably because of an efficient soil buffer effect. On the other hand, salinity also represents a problem in terms of soil quality, since it may have detrimental and harmful effects when it reaches excessive and unsustainable levels. In fact, high salinity impacts the bioavailability of water, limits the performance and survival of most plants and soil microorganisms, and may correlate with soil sodicity. Prior to treatment, the soil of all studied microplots was classified as non-saline, exhibiting an average electrical conductivity (EC) of 1688.3 ± 37.9 µs/cm. However, the results observed in phase B (9 days after biochar application) revealed that biochar application was accompanied by the release of a significant amount of salts, which caused a general increase in EC (Figure 1b). In fact, the EC values for LOW and HIGH microplots were 1835 and 2187.5 µs/cm, respectively, while a value of 1650 µs/cm was detected in the CTRL microplot. This means that, although the soil EC never exceeded the minimum salinity threshold (4000 µs/cm), it increased by 11.2 and 32.6% more than that of the CTRL over the two subsequent time points, respectively. Such an outcome confirms previous works which state that the use of biochar can involve a salinization risk, especially when applied cyclically in clayey soils and in areas subject to low annual rainfall [33]. In phase C (54 days after treatment), a significant lowering of the electrical conductivity for both LOW and HIGH microplots was recorded, as a consequence of salt leaching promoted by rainfall, although the HIGH microplots still retained a higher content of salt than the other two microplot types.
The amount of soil organic matter is another important soil health indicator, as it can play an active role in chemical, biological and physical fertility. Figure 1c reports the SOM contents in the studied microplots, before and after biochar application. Before the treatment, the soil already exhibited a satisfactory organic carbon content corresponding to 24.65 g/kg. As expected [37,38], our results confirmed that the application of an exogenous organic product led to an increase in SOM, which occurred in direct correlation to the dose. This was recorded as 27.18 and 33.64 g/kg, respectively, for LOW and HIGH, which was respectively 10.27 and 36.4% higher than the CTRL microplots. After 54 days, a slow and gradual decrease in organic matter was observed. Given the soil’s good hydraulic properties resulting from its loamy-sandy texture, this trend was mostly due to factors such as the leaching of soluble components, the physical translocation of the polymeric and low-soluble fractions, and microbial decomposition. Interestingly, microbial mineralization, although stimulated and enhanced by the biochar [39], involved mainly labile and semi-labile organic moieties already present in the studied soil, rather than the biochar itself. In fact, we expect that the biochar cannot serve as a direct source of labile carbon, due to its renowned recalcitrant nature [5]. Conversely, a discrete body of the literature agrees that many types of biochar are capable of favoring soil microorganisms by providing co-location of carbon and nutrients and providing a porous architecture which acts as an ideal micro-environment and physical protection for their growth [39]. Therefore, we must assume that the SOM fraction detected in LOW and HIGH microplots, and exceeding that of CTRL, was due to a more abundant microbial biomass elicited by the biochar.
The stabilized organic matter is rich in terminal functional groups capable of developing pH-dependent charges, such as carboxyls, phenolic hydroxyls and amines. Therefore, the incorporation of exogenous organic matter into the soil is expected to increase the net amount of electrical charges and, consequently, increase the soil cation exchangeable capacity (CEC). The latter is pivotal in determining the soil’s ability to retain nutrients in their ionic form, and make them bioavailable for plants and microorganisms through reversible desorption processes. Before biochar treatment, the soil exhibited an acceptable CEC value, corresponding to 19.84 ± 0.48 cmol+/kg. In line with previous results [40,41], biochar application led to an increase in CEC which was directly proportional to the dose. In fact, while the CEC value did not change for the CTRL microplots, it reached an average of 23.95 and 25.71 cmol+/kg (20.35% and 25.53% more than the respective controls in phase A) for LOW and HIGH microplots, respectively (Figure 1d). These significant increases were directly ascribed to the phenolic and carboxylic terminal groups of biochar developing negative charges in neutral/alkaline conditions. After 54 days of experimentation, there was a progressive decrease in CEC for both LOW and HIGH. However, in all treated microplots, CEC remained significantly higher than the CTRL, thus guaranteeing a medium-term contribution ascribable to the recalcitrant organic moieties of biochar. It is important to emphasize that biochar may represent an especially advantageous solution for managing sandy soils, which cannot adequately retain either cationic nutrients or water, being typically characterized by fast organic mineralization and low content of charge-rich materials, such as clays and SOM.

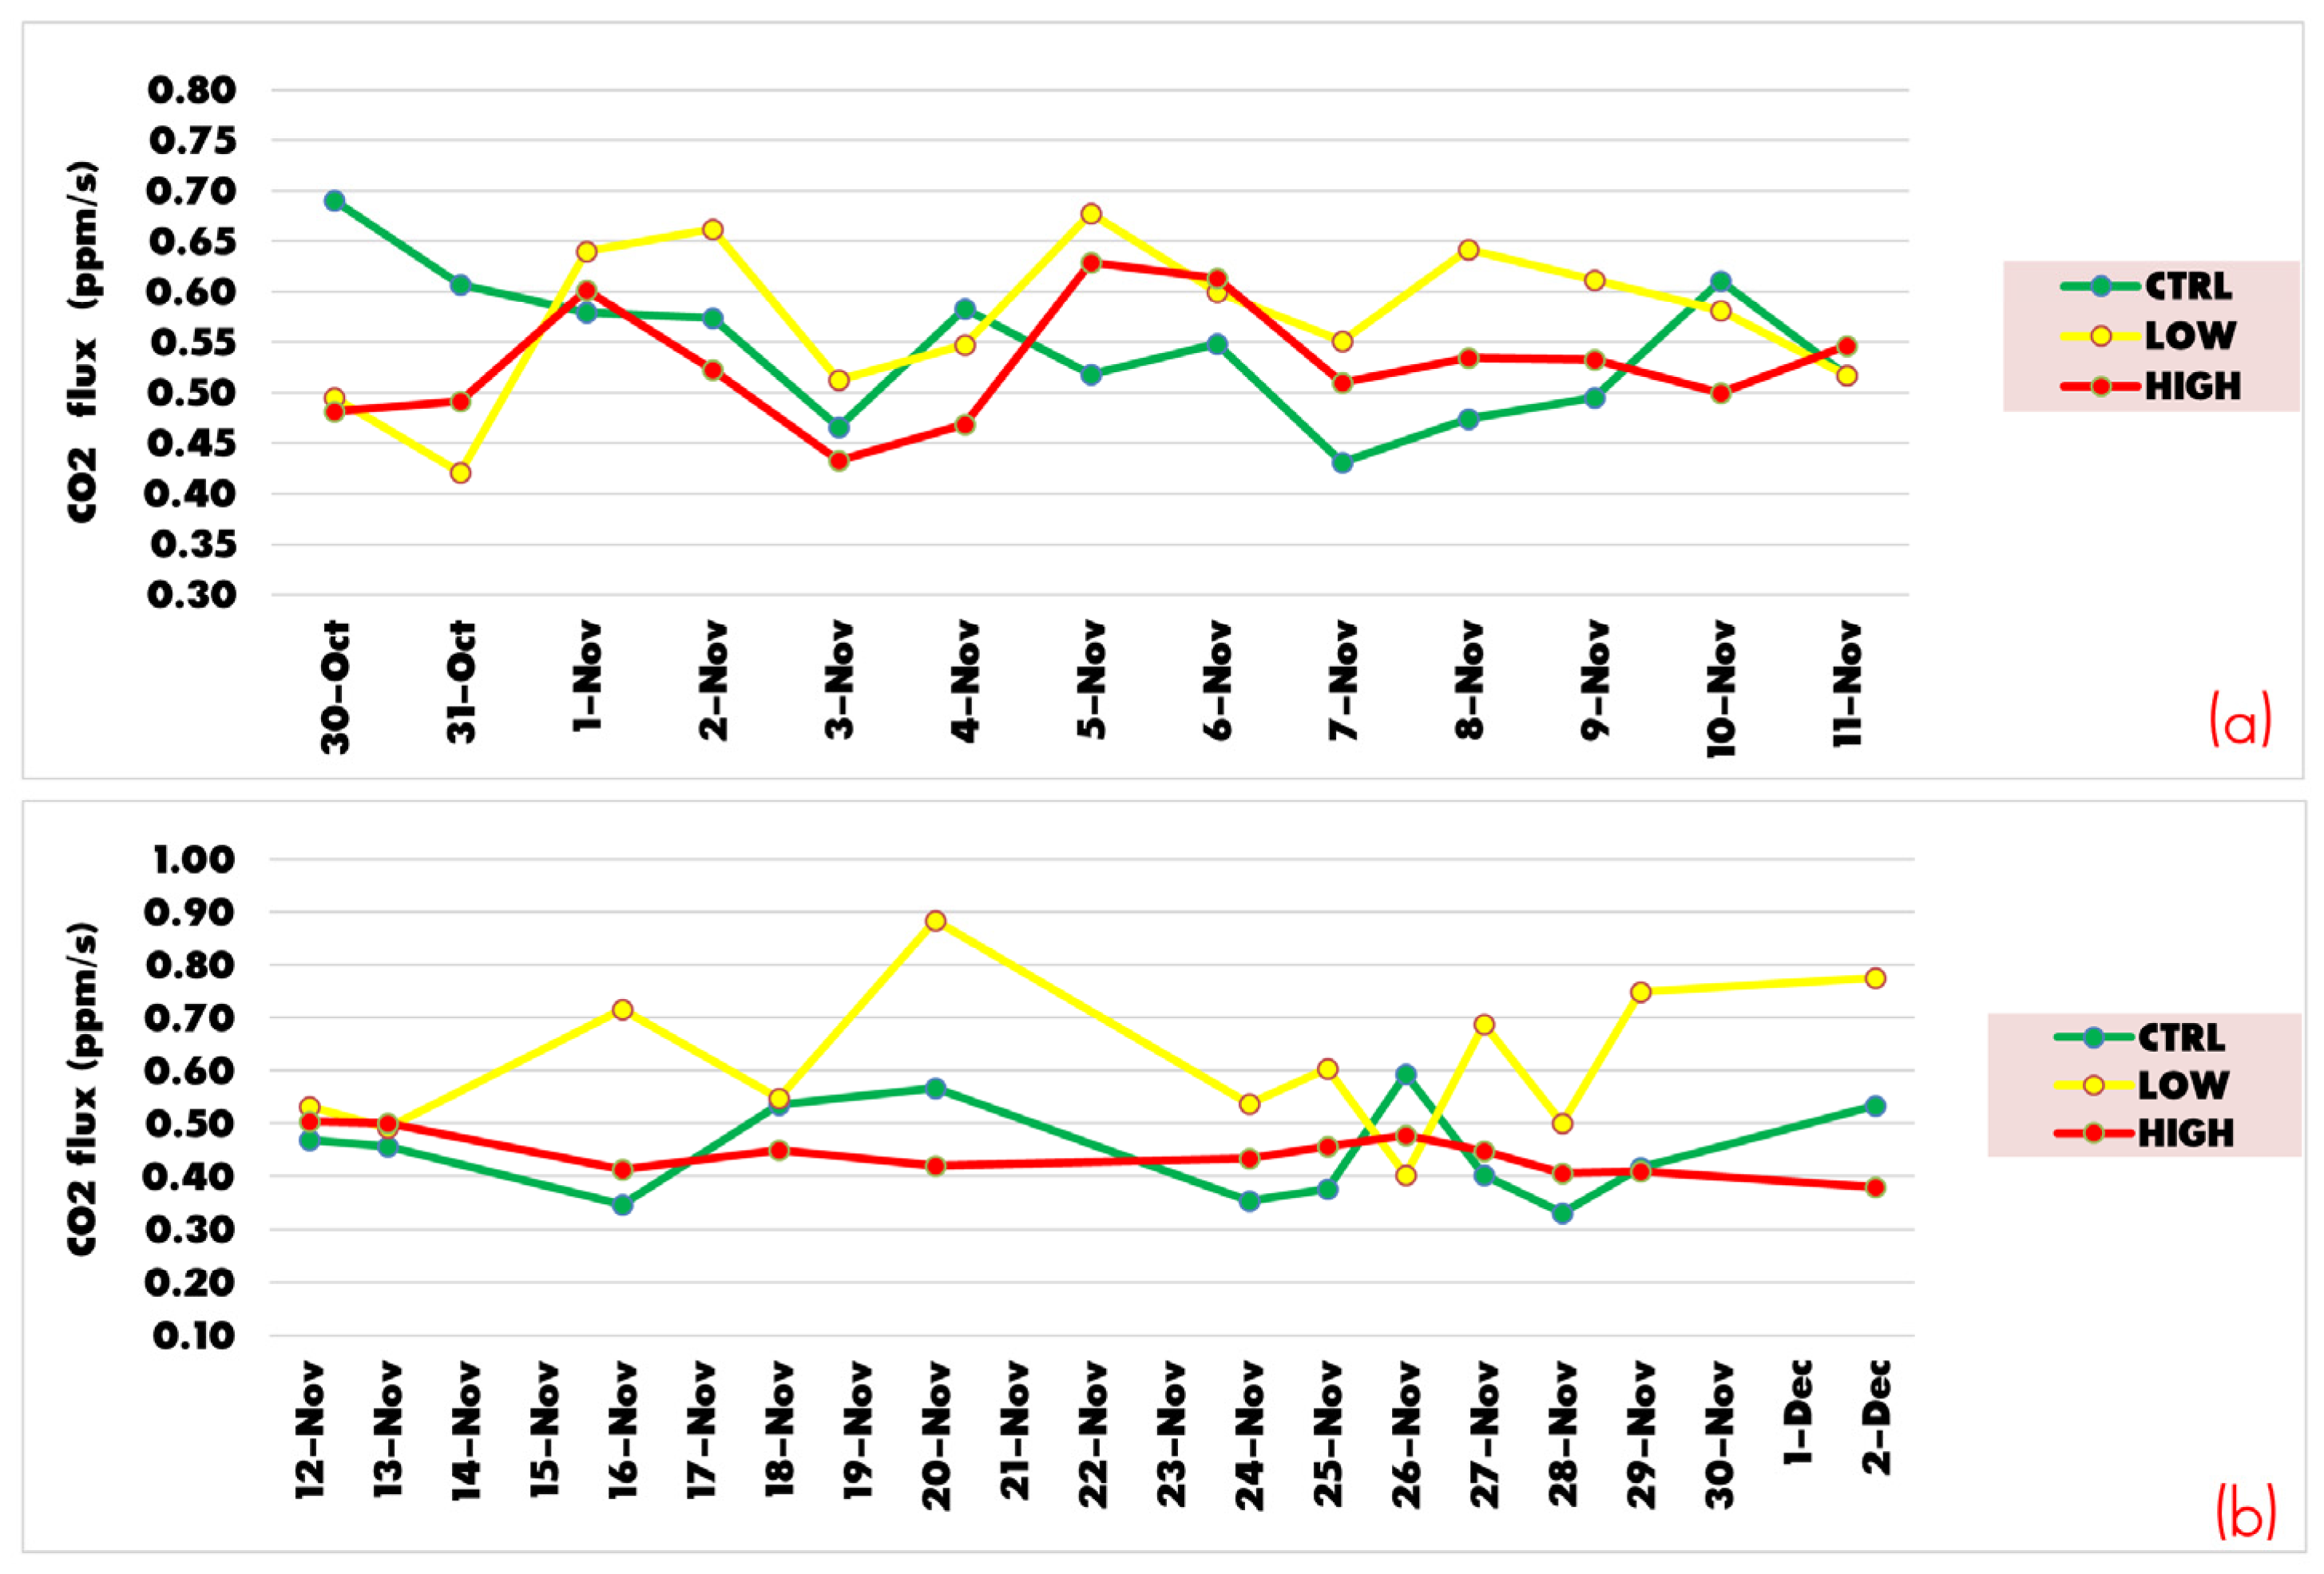
3.2. Soil Heterotrophic Respiration

Carbon mote chambers were exploited to identify a possible impact exerted on soil heterotrophic respiration by the incorporation of the biochar under consideration. One respiration chamber was permanently installed per thesis (one representative microplot per treatment) to continuously monitor the carbon dioxide flux during the period October–December 2020. It is important to underline that, during this period, (i) spontaneous herbaceous species were periodically and gently removed from the microplot surfaces to minimize the contribution of autotrophic respiration; (ii) the measurements of installed and independent chambers were conducted almost simultaneously, to facilitate data standardization; (iii) only the measurements of CO2 flows recorded from 13.00 to 15.00, during the afternoon, were considered. The latter choice was adopted to focus on CO2 fluxes in the interval exhibiting the most intense respiration rate, as a result of the combination of soil temperature, solar radiation and exposure [42,43].
The carbon flux data (FCO2, in ppm/s) acquired by the three respiration chambers in the period 30 October–2 December 2020 are shown in Figure 2. The fact that the minimum values of FCO2 proved relatively low (around 0.43 ppm/s or 1.548 ppm/h) was expected, due to the average daily temperatures which ranged between 10 and 18 °C, in line with typical Italian temperatures recorded in late autumn. During the first set of measurements (Figure 2a), the FCO2 values in CTRL ranged between 0.43 and 0.69 ppm/s, in LOW they were between 0.42 and 0.68 ppm/s, and in HIGH they were between 0.43 and 0.63 ppm/s. Interestingly, immediately after the biochar administration (30–31 November), we observed a significantly lower emission than the control (up to 31.1% less; Figure 2a). This behavior was presumably attributed to an initial biochar-induced perturbation in the soil’s equilibrium, which implied an alteration in the soil’s chemical properties and implicated the microbial component. However, from the 2nd of November onward, the LOW microplot exhibited a pronounced FCO2 which, in most cases, was even higher than that of the CTRL microplot. The initial inhibition in HIGH lasted until the 4th of November, after which the FCO2 values were almost constantly higher than CTRL, except for the 10th of November. During the second set of measurements, from the 12 November to the 2 December (Figure 2b), the FCO2 values in CTRL ranged between 0.35 and 0.59 ppm/s, in LOW between 0.4 and 0.88 ppm/s, and in HIGH between 0.38 and 0.50 ppm/s. It is important to note that the flow tended to be higher in the case of the LOW microplot (up to 0.37 ppm/s more than CTRL), while in the case of HIGH, the values continued to be similar or slightly lower than CTRL. During this period, the LOW microplot not only exhibited the highest average carbon dioxide emission, but also the absolute highest values—in many cases, higher than 0.7 ppm/s, up to 0.88 ppm/s on the 20 November.
Supporting Table S1 shows the soil respiration values which were calculated accounting for FCO2 (converted in ppm/h), the soil temperature and the physical characteristics of the respiration chamber. The examined microplots remained bare during the experimentation with the carbon mote systems, since we periodically removed each emerging herbaceous species. Therefore, we assumed that the carbon dioxide fluxes detected originated mostly from the soil’s heterotrophic respiration and, thus, by the activity of edaphic microorganisms. The measured respiration data ranged from 4.7 to 12.4 g CO2 m−2 h−1. As can be seen, the values were proportional to the flux data shown in Figure 2 and, consequently, they confirmed the same trends already discussed above. However, the average respiration values for both measurements sets indicated that there were no significant differences between CTRL and HIGH (average values were 6.93 ± 0.13 gCO2 m−2 h−1), while the LOW microplot showed a significantly higher value, corresponding to 8.4 gCO2 m−2 h−1 (Supporting Table S1). Moreover, it is important to underline that, from 24 November to the end of the experimentation, the soil temperature reached values below 13 °C during the early afternoon, which was expected to slow down microbial activity. Interestingly, while the average SR decreased for CTRL and HIGH microplots, in the case of the LOW microplots it remained relatively higher, especially from 27 November onward.
The data on soil heterotrophic respiration revealed that, at least in the short term, biochar-based treatment influenced the soil’s respiration rate, with relevant and positive effects only in the case of the 1 kg/m2 dose. Such a response was ascribed to greater and more efficient microbial activity and, therefore, to greater biological fertility of the soil, which is crucial for many fundamental processes, including the recycling of nutrients and plant production. From the literature, it seems that this improvement can be attributed to several reasons, including (i) the biochar-induced promotion of a favorable environment, making available a number of nutrients through desorption processes [44]; (ii) the microporous structure of biochar acting as a refuge for microorganisms and protecting them from predators (i.e., microarthropods) [45]; (iii) the fact that it promotes the bacterial rather than the fungal community [46]. Conversely, the dose of 3 kg/m2 did not significantly affect the microbial activity, or even slightly inhibited it, as compared to CTRL. Such inhibitory action may be simply explained by the presence, in the biochar, of elements and/or compounds which, at relatively high concentrations, can affect the soil microbiota [47]. Another factor contributing to lower microbial activity in the HIGH microplot is the non-negligible saline content induced by the administration of 3 kg/m2 of biochar (Figure 1). The fact that salinity can be increased with massive biochar applications has already been described in the literature [36,48].

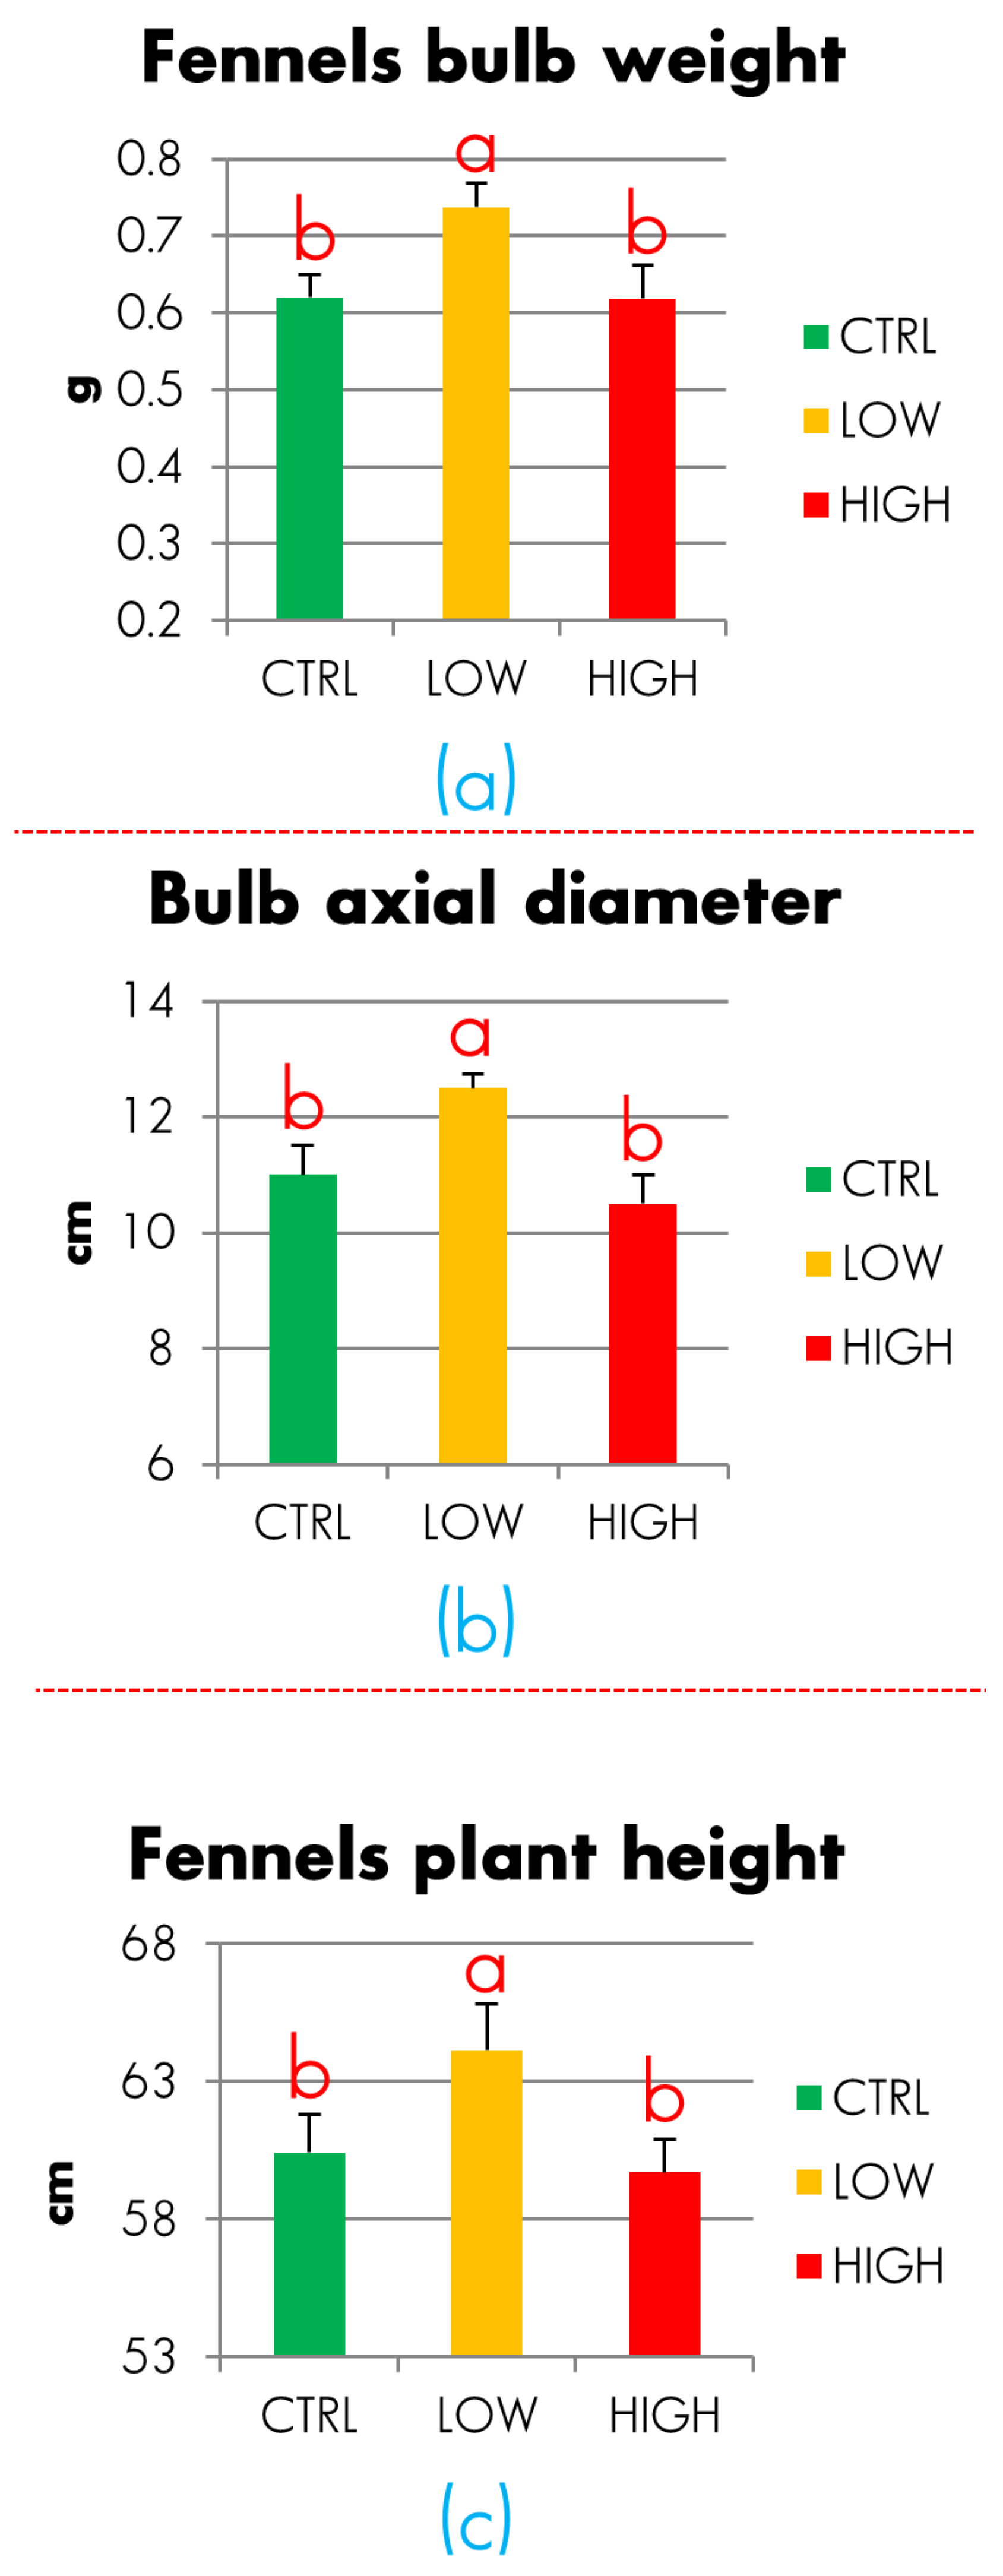
3.3. Fennel Experimentation

The fennel variety Prelude F1 was grown in soils treated either without or with different doses of biochar, according to a 3 × 3 randomized block design. In order to assess possible positive effects induced on the fennel plants by the presence of biochar, we evaluated important crop productivity parameters, such as bulb weight, axial diameter and plant length (Figure 3). The fennels from LOW soils showed a significantly better response than for samples from both CTRL and HIGH soils, which, conversely, did not differ from each other (Figure 3). In fact, the fennels produced on LOW soils exhibited values of weight, diameter and maximum plant height of 0.74 g, 12.5 and 64.1 cm, respectively, which were significantly higher (ANOVA test, p < 0.005) than those of CTRL and HIGH. The fact that the best response was observed for fennels grown on LOW microplots suggests that the fennels benefited from more fertile soil conditions, which resulted in slightly higher productivity than the control, without resorting to the application of mineral fertilizers. This improvement indicated that the applied dose of biochar was very suitable and efficient for the soil under consideration. In fact, it may have favored fennel plants through a greater abundance of bioavailable nutrients and water, the potential release of compounds with biostimulant activity, and the promotion of beneficial microorganisms. Interestingly, the advantages observed in terms of fennel productivity were completely in line with the data on the soil’s heterotrophic respiration, which exhibited a significantly higher trend for the LOW microplot during most of the experimental period (Figure 2). As SR is related to soil biological fertility, we can conclude that there is a strong correlation between crop productivity and microbial activity. Finally, our outcomes proved that, although soil chemical parameters such as CEC and soil organic matter content may serve as reliable markers of soil fertility, they are not sufficient to predict the productive response of a soil. In fact, despite the higher values of CEC and SOM detected in the HIGH microplots, the best results, in terms of fennel productivity and SR, were observed in LOW. This finding underlines the importance of considering a combination of analytical approaches to both objectively evaluate the real effects of exogenous organic matter on soil and develop reliable forecasting models.

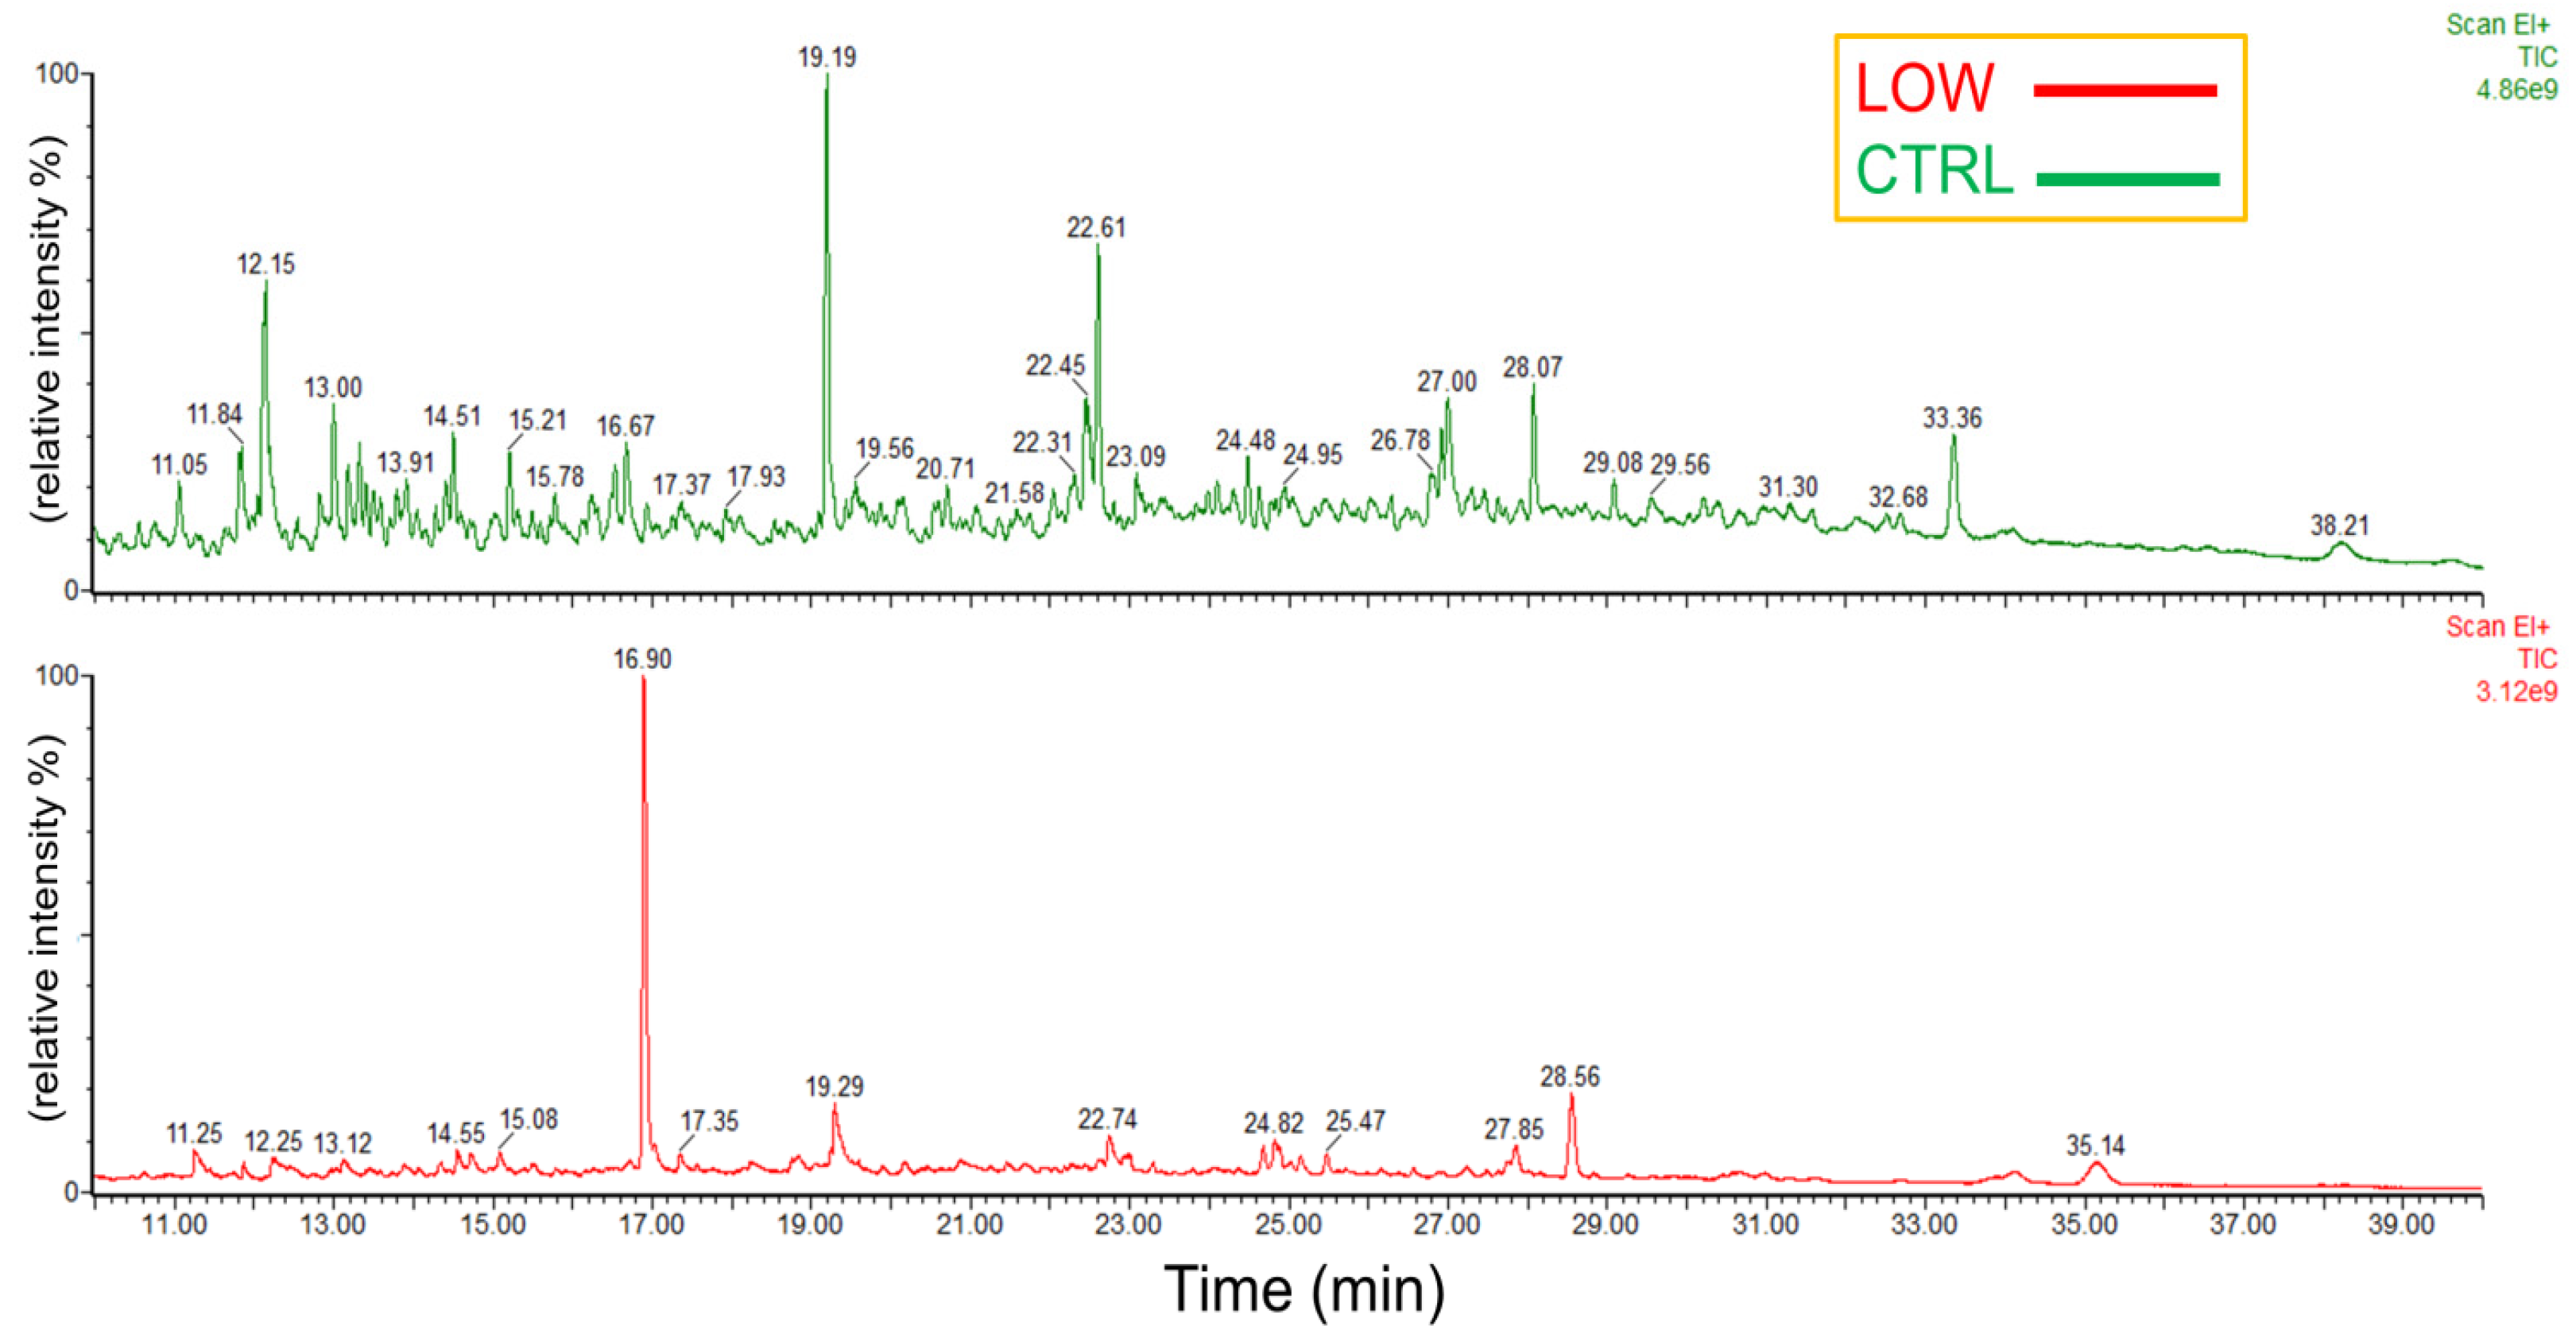
3.4. Characterization of Biochar and SOM Extracts

The 13C CPMAS NMR spectrum (a) and the GC-MS pyrogram (b) of the biochar under consideration are shown in Supporting Figure S5. In line with the relevant literature, the carbon spectrum was dominated by a single, intense and broadened signal in the aromatic region (110–160 ppm), arising from the overlapping of aromatic and polyaromatic moieties composing the biochar. This evidence demonstrates the prevalently polyphenolic nature of this product, and explains most of its typical recalcitrant nature, making it a good strategy for carbon sequestration. Only minor and very weak components were appreciated at 20 ppm and in the range 50–70 ppm, and these were mostly attributed to alkyl and O-alkyl moieties (Supporting Figure S5a). The GC-MS pyrogram of biochar is shown in Supporting Figure S5b. Despite its indisputable power, the combination of thermochemiolysis with GC-MS fails in detecting low-volatile molecules and compounds which cannot be derivatized, such as polycondensed aromatic compounds. Therefore, and unlike what was revealed by the 13C CPMAS NMR spectrum of raw biochar, the Pyr/GC-MS pyrogram only detected a few peaks, representing a small part of the biochar’s components. However, a very intense peak was detected at 16.86 min, which was assigned to a lignan derivative, based on the literature [49] and on the prominent and diagnostic mass signal at 190 m/z (Supporting Figure S5c). The pyrogram also exhibited a few more peaks, including two peaks assigned to unsaturated compounds (1-Nonadecene and 1-Eicosene at 24.63 and 29.76 min, respectively) and two fatty acid methyl esters (tetradecanoic acid, 10,13-dimethyl-, methyl ester and heptadecanoic acid, 16-methyl, methyl ester at 28.052 and 33.17 min, respectively).
The compositional quality of organic matter in soil may provide a quantity of detailed information, useful for better understanding the mechanisms triggered in soil by the application of exogenous organic material, like wood biochar. Therefore, we compared the organic matter of LOW microplots with that of CTRL microplots (both isolated 54 days after the biochar application). Our choice was based on the fact that the dose of 1 kg/m2 (LOW) resulted in the most effective treatment in enhancing SR and microbial activity. The ATR FT-IR (a) and 13C CPMAS NMR (b) spectra of CTRL (green) and LOW (red) extracts are shown in Figure 4. The band at 3251 cm−1 was attributed to O–H stretching, N–H stretching, and hydrogen-bonded O-H, including hydration water. The adsorption bands at 1634 and 1594 cm−1 were assigned to aromatic C=C skeletal vibrations. The spectral region from 1220 to 1000 cm−1 referred mostly to C–O stretching, including the signals of carboxyls, where the sub-range 1130–1000 cm−1 was attributed to polysaccharides and alcohols. Finally, the region between 930 and 900 cm−1 was ascribed to O–H bending of carboxyls and C–H bending in alkenes [50,51]. By comparing the spectra, a single but relevant difference emerged in the spectral region 1200–1000 cm−1 which was significantly more intense for the LOW extract. This was ascribed to a more abundant carbohydrate content in LOW microplots, which not only agrees well with the SOM results (Figure 1c), but also suggests the presence of a larger microbial biomass as well as indicating greater soil heterotrophic respiration (Figure 2).
Figure 4b shows the 13C CPMAS-NMR spectra of LOW and CTRL extracts along with a table with NMR integrations and the most relevant NMR-based indexes (Figure 4c). The carbon spectral region in the range 0–45 ppm is dominated by peaks of (CH2)n and CH3 alkyl groups, mostly attributable to lipid compounds of plant origin, such as waxes and aliphatic polyesters. The region 45–60 ppm is characterized by CH3O- groups, ascribable to aromatic methoxyls in syringyl and guaiacylic lignin units, as well as by C–N carbons in oligo- and poly-peptides. The region 60–110 ppm is assigned to the hydroxy-alkyl groups, prevalently represented by oligo- and poly-saccharides. Regarding this region, the most intense signal at around 70 ppm corresponds to the overlapping of C2, C3 and C5 carbons in pyranosidic structures of cellulose and hemicellulose, and those at around 65 and 80 ppm are assigned to C6 and C4 carbons, respectively, while signals in the range 100–105 ppm correspond to anomeric carbons. The region 110–160 ppm is dominated by unsaturated alkyl groups and aromatic compounds (attributable largely to lignin moieties), whereas the sub-interval 145–160 ppm is generally assigned to quaternary aromatic carbons. In the region 160–190 ppm, carbonyls in carboxyl and ester groups resonate, mostly attributable to lignin biopolymers or lipids, whereas the region between 195 and 230 ppm is characterized by carbonyls in ketone groups (Figure 4b).
The spectral comparison indicated a relatively larger abundance of carbohydrates in the LOW sample, thus confirming the results observed via FT-IR spectroscopy (Figure 4). Moreover, the relatively sharper signal in the peak at 80 ppm suggests a certain abundance of fast-moving compounds, such as mono- and oligo-saccharides, which represent most of the soil’s labile carbon. The spectrum of the LOW extract also exhibits more intense peaks in both alkyl and carboxyl regions, attributable to lipids and to fatty acids, as well as a relevant ketone peak, partially arising from oxidized phenols and lignols. Although the LOW extract contained more carbohydrates and labile carbon than CTRL, the hydrophobic index (HI) was very similar to that of CTRL. This was due to the higher content of lipids in LOW which not only implied a higher Alk/O-Alk index as compared to CTRL, but also compensated for the carbohydrate abundance by conferring a certain hydrophobicity to LOW SOM. This response is partially explainable by the enhanced microbial biomass development in LOW (Figure 2). The lignin ratio (LR) index is indicative of the lignin content and reveals whether the peak resonating at 56 ppm is attributable to either G- and S-lignin units or to proteins and peptides. Typically, it is assumed that when the LR is higher than 2.5, the peptides are relatively abundant, thus providing a significant contribution to the intensity of the peak at 56 ppm, and vice versa. Therefore, although the content in proteins and peptides was estimated to be relatively high in both the extracts, the CTRL extract exhibited a slightly higher value.
The Pyr-GC/MS pyrograms of CTRL and LOW extracts are shown in Figure 5. Most of the signals were assigned on the basis of the NIST mass library, mass fragmentation pathways and comparison with standard compounds. The identification of signals and the most important information (compound class, compound name, molecular weight and dominant mass signals) are reported in Supporting Table S2. Unlike FT-IR and CPMAS NMR spectroscopies, which can provide a very powerful macroscopic vision of the main compound classes comprising the examined material, with the Pyr/GC-MS technique it is possible to go deeper into the molecular composition, identifying and quantifying single compounds.
Except for a few compounds, which were detected in only one type of extract, most signals were identified in both CTRL and LOW extracts. However, the concentration of some compounds changed greatly from one extract to another (Figure 5). The peak at 16.9 min in the LOW extract corresponded to the lignan derivative already detected in the biochar, as confirmed by its mass spectrum [49] (Supporting Figure S5). Since this compound was totally absent in the CTRL sample, we concluded that it may serve as a reliable marker to trace the supply of this specific biochar in soil.
The most intense signals detected in both CTRL and LOW were assigned to benzoic acid, 3,4 dimethoxy-, methyl ester (Lignin G unit) at minute 19.29, to benzoic acid, 3,4,5 trimethoxy-, methyl ester (Lignin S unit) at minute 22.74, and to tetradecanoic acid, 10,13 dimethyl, methyl ester at minute 28.7. Other intense peaks detected in CTRL were the 2 propenoic acid, 2-(3,4 dimethoxyphenl)-, methyl ester (Lignin G unit) at minute 27, and the 9-octadecenoic acid, methyl ester at minute 33.36. Conversely, a relevant and intense peak revealed in the LOW spectrum was that of heptadecanoic acid, 16 methyl, methyl ester, at minute 35.14.
All the signals detected in the pyrograms were integrated, grouped according to the specific compound class, and added up (Table 1). Interestingly, the CTRL extract contained a larger amount of lignin moieties than the LOW extract (26.31% vs. 16.47%), with the G units being the most abundant lignols in both cases. From a quantitative point of view, G units were followed by S units, while p units were relatively low in CTRL and almost negligible in LOW. Also, the N-compounds were slightly more abundant in CTRL than for LOW (3.62 vs. 1.64%). Such an outcome well agrees with the larger LR achieved by elaborating the NMR spectrum of CTRL (Figure 4b,c). In fact, part of the N-compounds detected by Pyr GC/MS in CTRL are of peptidic nature and may have contributed to increasing the NMR signal at 56 ppm. The CTRL extract also exhibited a larger amount of aromatic compounds containing nitrogen (13.41% vs. 10.52%). However, it is important to underline that many of the N-aromatic molecules detected in LOW exhibited an indole-like structure (4.46 times more abundant than in CTRL), where part of them are expected to serve as biostimulants providing phytohormonal activity [52] (Table 1). This could explain part of the benefits observed for both heterotrophic respiration and fennel productivity under LOW treatment. On the other hand, the LOW microplots were characterized by a three-times higher content of aromatic moieties, presumably deriving from partial biochar depolymerization. Finally, all FAME types were more abundant in the LOW extract, as already observed in the NMR spectra. The fact that branched FAME, hydroxyacid FAME and unsaturated branched FAME were more abundant in the LOW extract is important, since most of these compounds have a microbial origin. This outcome indicates a more enhanced microbial activity in microplots treated with the lowest dose of biochar, which well agrees with the most pronounced heterotrophic respiration (Figure 2; Supporting Table S1). It also suggests that part of the higher SOM content in LOW compared to CTRL could, in part, be attributed to the microbial biomass.
Importantly, PyrGC-MS results also permitted us to conclude that the better response observed for fennels production (Figure 3) was not only due to higher CEC and SOM than CTRL, but also to both the optimal presence of indole-structured compounds, with potential phytohormonal action, and to microorganisms promoting plant growth, favoring SOM mineralization and the availability of nutrients. On the other hand, the fact that HIGH treatment, although it increased SOM and CEC to a level even higher than in LOW (Figure 1), did not produce a response different to CTRL in terms of SR and crop productivity, indicates that the dose of 1 kg m2 (LOW) is the optimal one and the best compromise to increase chemical fertility and create the proper conditions to promote microbial activity, improve plant production and ameliorate soil health.

4. Conclusions

Our results permitted us to confirm, through open field trials, that wood biochar, when applied to soil at the proper dose (1 kg/m2), serves as an efficient fertilizer to improve soil quality and health, in addition to performing efficient carbon sequestration. Our findings indicate that both tested biochar doses improved important chemical fertility parameters (SOM and CEC), the highest values appearing in the case of HIGH treatment. This notwithstanding, it was the LOW treatment which produced the best results in terms of soil respiration and fennel production. In particular, SR, which was monitored daily through a Closed Dynamic Chamber (CDC) associated with an innovative pilot system, revealed that the lower biochar dose elicited the most pronounced heterotrophic activity. We demonstrated, via NMR and Pyr/GC-MS techniques, that the lower dose correlated mostly with more enhanced microbial activity, since we detected a relevant presence of diagnostic FAME biomarkers in the SOM. Importantly, the proposed combination of advanced analytical techniques was useful for providing important information on SOM composition, including the facts that LOW SOM was characterized by (i) a greater abundance of SOM and labile carbon, (ii) a higher content of indole-structured compounds with potential phytohormonal activity, (iii) a more pronounced microbial biomass, presumably contributing to the promotion of soil biological fertility. Our findings demonstrated that the proper biochar dose improves soil fertility and creates an environment favorable to microbial activity, ultimately determining further benefits in plants. However, it is important to conduct more experiments in the future, to better optimize the application rate of the studied biochar, evaluate the biochar’s effects in the medium and long term, and estimate the frequency with which the biochar application should be repeated. In conclusion, this study, albeit limited to a short experimental period, confirms that biochar, when administered in well-calibrated and not excessive doses, represents a sustainable and eco-friendly strategy for recycling forestry and lignin-rich wastes, promoting carbon sequestration, improving soil health and productivity and potentiating the ecosystem services offered by soil.

Supplementary Materials

The following supporting information can be downloaded at: https://www.mdpi.com/article/10.3390/agriculture15101091/s1, Figure S1: Description of the main properties of the studied biochar, including chemical and physical parameters as well as nutrient and heavy metals contents (information provided by the provider Nera Biochar); Figure S2: (a) Soil microplots (1 m2 each) selected for the evaluation of soil respiration, before the biochar-based treatment. (b) Soil microplots after the biochar treatment (0, 1 and 3 kg/m2, identified with the labels CTRL, LOW and HIGH, respectively) and equipped with the permanent installation of the Carbon mote system; Figure S3: Weather data concerning the whole experimental period (October 2020 and March 2021) and including theprecipitations (mm/d), the minimum and maximum temperatures (°C) and the solar radiation (kW/h); Figure S4: (a) Schematic representation of the complete Carbon Mote system; upper (b) and lateral (c) representation of the plate composed by a hole-collar, delimiting the examined soil area, and equipped with a module containing both the IRGA analyzer and the motor to control the chamber opening.; Figure S5: (a) 13C CPMAS NMR spectrum of raw and pulverized biochar, in the solid-state; (b) GC chromatogram of biochar (pyrolysed at 400 °C and derivitized, via thermochemiolysis driven by tetramethylammonium hydroxide) and (c) the mass spectrum of the signal eluted at 16.86 min. Table S1: Soil respiration values (SR in gCO2 m−2 h−1) calculated accounting for soil temperature (°C), the flow of carbon dioxide released in the unit of time (FCO2 in ppm h−1), the universal gas constant (8.31 J mol−1 K−1), the chamber volume (5747 cm3) and the soil area examined by the chamber (615.7 cm2); Table S2: List of compounds identified in the GC-MS pyrograms of CTRL and LOW soil extracts, including compound class, compound name, molecular weight, the most intense and diagnostic signals and the retention time interval. The labels N, FAME, G, P, and S correspond to Nitrogen-based, Fatty Acids Methyl Esters, p-hydroxyphenyl, guaiacyl and syringyl monomeric lignin units, respectively, whereas the symbol >> indicates that the specific mass signal is predominant in the mass spectrum).

Author Contributions

Conceptualization, P.M.; Methodology, R.C. and R.B.; Validation, C.L. and M.C.; Formal analysis, R.C., R.B., S.C. and M.V.; Investigation, R.C. and P.M.; Resources, M.C., R.S. and P.M.; Writing—original draft, R.C. and R.B.; Writing—review & editing, P.M.; Supervision, C.L., M.C., M.V. and R.S.; Funding acquisition, P.M. All authors have read and agreed to the published version of the manuscript.

Funding

The research was conducted in the context of the Project PNRR AGRITECH and was funded by European Union Next-Generation EU (PIANO NAZIONALE DI RIPRESA E RESILIENZA (PNRR)—MISSIONE 4 COMPONENTE 2, INVESTIMENTO 1.4—D.D. 1032 17/06/2022, CN00000022).

Institutional Review Board Statement

Not applicable.

Data Availability Statement

The original contributions presented in this study are included in the article/Supplementary Material. Further inquiries can be directed to the corresponding author.

Acknowledgments

P.M. and R.B. gratefully acknowledge Luigi Cerrato, who allowed us to conduct field tests in his farm, as well as Raffaele Casilli, who provided his kind support and supervision during the setup and use of the carbon mote system.

Conflicts of Interest

Authors Carmine Lia and Michele Compitiello were employed by the company Maniola Remote Sensing, s.r.l. The remaining authors declare that the research was conducted in the absence of any commercial or financial relationships that could be construed as a potential conflict of interest.

References

  1. Obalum, S.; Chibuike, G.; Peth, S.; Oyang, Y. Soil organic matter as sole indicator of soil degradation. Environ. Monit. Assess. 2017, 189, 176. [Google Scholar] [CrossRef] [PubMed]
  2. Bento, L.R.; Spaccini, R.; Cangemi, S.; Mazzei, P.; De Freitas, B.B.; de Sousa, A.E.O.; Moreira, A.B.; Ferreira, O.P.; Piccolo, A.; Bisinoti, M.C. Hydrochar obtained with by-products from the sugarcane industry: Molecular features and effects of extracts on maize seed germination. J. Environ. Manag. 2021, 281, 111878. [Google Scholar] [CrossRef] [PubMed]
  3. Kambo, H.S.; Dutta, A. A comparative review of biochar and hydrochar in terms of production, physico-chemical properties and applications. Renew. Sustain. Energy Rev. 2015, 45, 359–378. [Google Scholar] [CrossRef]
  4. Maczak, D.; Lejcuś, K.; Kulczycki, G.; Misiewicz, J. Towards circular economy: Sustainable soil additives from natural waste fibres to improve water retention and soil fertility. Sci. Total Environ. 2022, 844, 157169. [Google Scholar] [CrossRef]
  5. Yaashikaa, P.R.; Senthil Kumar, P.; Varjani, S.; Saravanan, A. A critical review on the biochar production techniques, characterization, stability and applications for circular bioeconomy. Biotechnol. Rep. 2020, 28, e00570. [Google Scholar] [CrossRef] [PubMed]
  6. Cantrell, K.B.; Hunt, P.G.; Uchimiya, M.; Novak, J.M.; Ro, K.S. Impact of pyrolysis temperature and manure source on physicochemical characteristics of biochar. Bioresour. Technol. 2012, 107, 419–428. [Google Scholar] [CrossRef]
  7. Mohan, D.; Pittman, C.; Steele, P. Pyrolysis of wood/biomass for biooil: A critical review. Energy Fuels 2006, 20, 848–889. [Google Scholar] [CrossRef]
  8. Tomczyk, A.; Sokołowska, Z.; Boguta, P. Biochar physicochemical properties: Pyrolysis temperature and feedstock kind effects. Rev. Environ. Sci. Biotechnol. 2020, 19, 191–215. [Google Scholar] [CrossRef]
  9. Zhang, A.F.; Bian, R.J.; Pan, G.X.; Cui, L.Q.; Hussain, Q.; Li, L.Q.; Zheng, J.W.; Zheng, J.F.; Zhang, X.H.; Han, X.J.; et al. Effects of biochar amendment on soil quality, crop yield and greenhouse gas emission in a chinese rice paddy: A field study of 2 consecutive rice growing cycles. Field Crops Res. 2012, 127, 153–160. [Google Scholar] [CrossRef]
  10. Alkharabsheh, H.M.; Seleiman, M.F.; Battaglia, M.L.; Shami, A.; Jalal, R.S.; Bushra, A.A.; Almutairi, K.F.; Al-Saif, A.M. Biochar and its broad impacts in soil quality and fertility, nutrient leaching and crop productivity: A review. Agronomy 2021, 11, 993. [Google Scholar] [CrossRef]
  11. Diatta, A.A.; Fike, J.H.; Battaglia, M.L.; Galbraith, J.M.; Baig, M.B. Effects of biochar on soil fertility and crop productivity in arid regions: A review. Arab. J. Geosci. 2020, 13, 595. [Google Scholar] [CrossRef]
  12. Amoah-Antwi, C.; Kwiatkowska-Malina, J.; Thornton, S.F.; Fenton, O.; Malina, G.; Szara, E. Restoration of soil quality using biochar and brown coal waste: A review. Sci. Total Environ. 2020, 722, 137852. [Google Scholar] [CrossRef]
  13. Xu, H.; Cai, A.; Wu, D.; Liang, G.; Xiao, J.; Xu, M.; Colinet, G.; Zhang, W. Effects of biochar application on crop productivity, soil carbon sequestration, and global warming potential controlled by biochar C:N ratio and soil pH: A global meta-analysis. Soil Tillage Res. 2021, 213, 105125. [Google Scholar] [CrossRef]
  14. Asai, H.; Samson, B.K.; Stephan, H.M.; Songyikhangsuthor, K.; Hommaa, K.; Kiyono, Y.; Inoue, Y.; Shiraiwa, T.; Horie, T. Biochar amendment techniques for upland rice production in Northern Laos 1. Soil physical properties, leaf SPAD and grain yield. Field Crops Res. 2009, 111, 81–84. [Google Scholar] [CrossRef]
  15. Blackwell, P.; Riethuller, G.; Collins, M. Biochar application to soil. In Biochar for Environmental Management; Lehmann, J., Joseph, S., Eds.; Earthscan: London, UK, 2009; pp. 207–227. [Google Scholar]
  16. Haefele, S.M.; Konboonc, Y.; Wongboon, W.; Amarante, S.; Maarifat, S.S.; Pfeiffer, E.M.; Knoblauch, C. Effects and fate of biochar from rice residues in rice based systems. Field Crops Res. 2011, 121, 430–440. [Google Scholar] [CrossRef]
  17. Parlavecchia, M.; Gattullo, R.; Perri, G.; Loffredo, E. Modulatory effects of biochar, hydrochar and vermicompost on the growth of horticultural plants and phytopathogenic fungi. In Proceedings of the VI International Symposium on Applications of Modelling as an Innovative Technology in the Horticultural Supply Chain Model-IT, Molfetta, Italy, 2–12 June 2019; Volume 1311, pp. 541–548. [Google Scholar]
  18. Agarwal, H.; Kashyap, V.H.; Mishra, A.; Bordoloi, S.; Singh, P.K.; Joshi, N.C. Biochar-based fertilizers and their applications in plant growth promotion and protection. 3 Biotech 2022, 12, 136. [Google Scholar] [CrossRef] [PubMed]
  19. Vannini, A.; Tarasconi, D.; Pietropoli, F.; Forte, T.A.G.W.; Grillo, F.; Carbognani, M.; Petraglia, A. Effects of Wood-Derived Biochar on Soil Respiration of a European Beech Forest Under Current Climate and Simulated Climate Change. Forests 2025, 16, 474. [Google Scholar] [CrossRef]
  20. Wang, Q.; Yuan, J.; Yang, X.; Han, X.; Lan, Y.; Cao, D.; Sun, Q.; Cui, X.; Meng, J.; Chen, W. Responses of soil respiration and C sequestration efficiency to biochar amendment in maize field of Northeast China. Soil Tillage Res. 2022, 223, 105442. [Google Scholar] [CrossRef]
  21. Zhang, R.; Qu, Z.; Liu, L.; Yang, W.; Wang, L.; Li, J.; Zhang, D. Soil respiration and organic carbon response to biochar and their influencing factors. Atmosphere 2022, 13, 2038. [Google Scholar] [CrossRef]
  22. Ojeda, G.; Gil, J.M.; Mattana, S.; Bachmann, J.; Quenea, K.; Sobral, A.J. Biochar ageing effects on soil respiration, biochar wettability and gaseous CO2 adsorption. Mitig. Adapt. Strateg. Glob. Change 2024, 29, 11. [Google Scholar] [CrossRef]
  23. Feng, Z.; Fan, Z.; Song, H.; Li, K.; Lu, H.; Liu, Y.; Cheng, F. Biochar induced changes of soil dissolved organic matter: The release and adsorption of dissolved organic matter by biochar and soil. Sci. Total Environ. 2021, 783, 147091. [Google Scholar] [CrossRef] [PubMed]
  24. Rombolà, A.G.; Torri, C.; Vassura, I.; Venturini, E.; Reggiani, R.; Fabbri, D. Effect of biochar amendment on organic matter and dissolved organic matter composition of agricultural soils from a two-year field experiment. Sci. Total Environ. 2022, 812, 151422. [Google Scholar] [CrossRef] [PubMed]
  25. Rombolà, A.G.; Greggio, N.; Fabbri, D.; Facchin, A.; Torri, C.; Pulcher, R.; Carlini, C.; Balugani, E.; Marazza, D.; Zannoni, D.; et al. Changes of labile, stable and water-soluble fractions of biochar after two years in a vineyard soil. Environ. Sci. Adv. 2023, 2, 1587–1599. [Google Scholar] [CrossRef]
  26. El-Naggar, A.; Zhou, R.; Tang, R.; Hur, J.; Cai, Y.; Chang, S.X. Rice husk and its biochar have contrasting effects on water-soluble organic matter and the microbial community in a bamboo forest soil. Land 2022, 11, 2265. [Google Scholar] [CrossRef]
  27. Bi, Y.; Kuzyakov, Y.; Cai, S.; Zhao, X. Accumulation of organic compounds in paddy soils after biochar application is controlled by iron hydroxides. Sci. Total Environ. 2021, 764, 144300. [Google Scholar] [CrossRef]
  28. Pospíšilová, L.; Horáková, E.; Fišera, M.; Jerzykiewicz, M.; Menšík, L. Effect of selected organic materials on soil humic acids chemical properties. Environ. Res. 2020, 187, 109663. [Google Scholar] [CrossRef] [PubMed]
  29. Liu, X.; Dou, S.; Zheng, S. Effects of Corn Straw and Biochar Returning to Fields Every Other Year on the Structure of Soil Humic Acid. Sustainability 2022, 14, 15946. [Google Scholar] [CrossRef]
  30. DM of Ministry of Agricultural and Forestry Policies. Official Methods of Soil Chemical Analyses; Serie Generale; Gazzetta Ufficiale: Rome, Italy, 1999; p. 248.
  31. Lardo, E.; Palese, A.M.; Nuzzo, V.; Xiloyannis, C.; Celano, G. Variability of total soil. respiration in a Mediterranean vineyard. Soil Res. 2015, 53, 531–541. [Google Scholar] [CrossRef]
  32. Verrillo, M.; Salzano, M.; Cozzolino, V.; Spaccini, R.; Piccolo, A. Bioactivity and antimicrobial properties of chemically characterized compost teas from different green composts. Waste Manag. 2021, 120, 98–107. [Google Scholar] [CrossRef]
  33. Lee, X.; Yang, F.; Xing, Y.; Huang, Y.; Xu, L.; Liu, Z.; Holtzman, R.; Kan, I.; Li, Y.; Zhang, L.; et al. Use of biochar to manage soil salts and water: Effects and mechanisms. Catena 2022, 211, 106018. [Google Scholar] [CrossRef]
  34. Lu, H.L.; Li, K.W.; Nkoh Nkoh, J.; Shi, Y.X.X.; He, X.; Hong, Z.N.; Xu, R.K. Effects of the increases in soil pH and pH buffering capacity induced by crop residue biochars on available Cd contents in acidic paddy soils. Chemosphere 2022, 301, 134674. [Google Scholar] [CrossRef]
  35. Yu, H.; Zou, W.; Chen, J.; Chen, H.; Yu, Z.; Huang, J.; Tamg, H.; Wei, X.; Gao, B. Biochar amendment improves crop production in problem soils: A review. J. Environ. Manag. 2019, 232, 8–21. [Google Scholar] [CrossRef] [PubMed]
  36. Shah, T.; Shah, S.; Shah, Z. Soil respiration, pH and EC as influenced by biochar. Soil Environ. 2017, 36, 77–83. [Google Scholar] [CrossRef]
  37. Liu, X.; Zhang, A.; Ji, C.; Joseph, S.; Bian, R.; Li, L.; Pan, G.; Paz Ferreiro, J. Biochar’s effect on crop productivity and the dependence on experimental conditions a meta analysis of literature data. Plant Soil 2013, 373, 583–594. [Google Scholar] [CrossRef]
  38. Ding, X.; Li, G.; Zhao, X.; Lin, Q.; Wang, C. Biochar application significantly increases soil organic carbon under conservation tillage: An 11-year field experiment. Biochar 2023, 5, 28. [Google Scholar] [CrossRef]
  39. Bolan, S.; Sharma, S.; Mukherjee, S.; Kumar, M.; Rao, C.S.; Nataraj, K.C.; Singh, G.; Vinu, A.; Bhowmik, A.; Sharma, H.; et al. Biochar modulating soil biological health: A review. Sci. Total Environ. 2024, 914, 169585. [Google Scholar] [CrossRef] [PubMed]
  40. Domingues, R.R.; Sánchez-Monedero, M.A.; Spokas, K.A.; Melo, L.C.A.; Trugilho, P.F.; Valenciano, M.N.; Silva, C.A. Enhancing Cation Exchange Capacity of Weathered Soils Using Biochar: Feedstock, Pyrolysis Conditions and Addition Rate. Agronomy 2020, 10, 824. [Google Scholar] [CrossRef]
  41. Omara, P.; Singh, H.; Singh, K.; Sharma, L.; Otim, F.; Obia, A. Short-term effect of field application of biochar on cation exchange capacity, pH, and electrical conductivity of sandy and clay loam temperate soils. Technol. Agron. 2023, 3, 16. [Google Scholar] [CrossRef]
  42. Wu, H.; Guo, Z.; Peng, C. Land use induced changes of organic carbon storage in soils of China. Glob. Change Biol. 2003, 9, 305–315. [Google Scholar] [CrossRef]
  43. Zhang, L.; Chen, Y.; Li, W.; Zhao, R. Seasonal variation of soil respiration under different land use/land cover in arid region. Sci. China Ser. D Earth Sci. 2007, 50, 76–85. [Google Scholar] [CrossRef]
  44. El Naggar, A.; El Naggar, A.H.; Shaheen, S.M.; Sarkar, B.; Chang, S.X.; Tsang, D.C.W.; Rinklebe, J. Biochar composition dependent impacts on soil nutrient release, carbon mineralization, and potential environmental risk: A review. J. Environ. Manag. 2019, 241, 458–467. [Google Scholar] [CrossRef] [PubMed]
  45. Li, T.; Jiao, Y.; Liu, T.; Gu, H.; Li, Z.; Wang, S.; Liu, J. Effects of biochar addition on soil fauna communities—A meta-analysis. Soil Use Manag. 2024, 40, e13096. [Google Scholar] [CrossRef]
  46. Jeffery, S.; Bezemer, T.M.; Cornelissen, G.; Kuyper, T.W.; Lehmann, J.; Mommer, L.; Sohi, S.H.; van de Voorde, T.F.J.; Wardle, D.A.; van Groenigen, J.W. The way forward in biochar research: Targeting trade-offs between the potential wins. GCB Bioenergy 2015, 7, 1–13. [Google Scholar] [CrossRef]
  47. Jeffery, S.; Abalos, D.; Prodana, M.; Bastos, A.C.; van Groenigen, J.W.; Hungate, B.A.; Verheijen, F. Biochar boosts tropical but not temperate crop yields. Environ. Res. Lett. 2017, 12, 5. [Google Scholar] [CrossRef]
  48. Karabay, U.; Toptas, A.; Yanik, J.; Aktas, L. Does Biochar Alleviate Salt Stress Impact on Growth of Salt-Sensitive Crop Common Bean. Commun. Soil Sci. Plant Anal. 2021, 52, 456–469. [Google Scholar] [CrossRef]
  49. Zhang, L.; Li, J.; Hu, L.; Wang, Y.; Wu, Z.; Meng, Y.; Liang, Z.; Yang, L.; Wei, G.; Huang, Y. Identification of lignans and quality assessment in Dendrobium officinale under different cultivation modes. Rap. Commun. Mass Spec. 2023, 37, e9541. [Google Scholar] [CrossRef]
  50. Machado, W.; Franchini, J.C.; Guimaraes, M.D.F.; Filho, J.T. Spectroscopic characterization of humic and fulvic acids in oil aggregates, Brasil. Heliyon 2020, 6, e04078. [Google Scholar] [CrossRef]
  51. Li, L.; Ma, L.; Yanan, L.; Wang, Y.; Sun, S. Spectroscopic analysis of the effects of alkaline extractants on humic acids isolated from herbaceous peat. Spectroscopy 2024, 39, 20. [Google Scholar] [CrossRef]
  52. Sun, P.; Huang, Y.; Yang, X.; Liao, A.; Wu, J. The role of indole derivative in the growth of plants: A review. Front. Plant Sci. 2023, 16, 1120613. [Google Scholar] [CrossRef]
Figure 1. Soil pH (a), electrical conductivity (b) (μs cm−1), organic matter (c) (g kg−1) and cation exchangeable capacity (d) (cmol+ kg−1) of microplots CTRL (green), LOW (yellow) and HIGH (red), measured before (A), 9 (B) and 54 (C) days after treatment with biochar. The results refer to the mean values and include standard deviation bars.
Agriculture 15 01091 g001
Figure 2. Carbon dioxide flux (ppm/s) released from soil and detected by the carbon mote system in the periods (a) 30 October–11 November and (b) 12 November–2 December from CTRL, LOW and HIGH microplots.
Agriculture 15 01091 g002
Figure 3. Bulb weight (a), diameter (b), maximal length of the epigeal portion (c) of fennel Prelude F1 grown on three microplots—CTRL (0 kg m2), LOW (1 kg m2) and HIGH (3 kg m2)—under the biochar-based treatment. The results are expressed as mean and standard deviation and the association of different letters on the histograms indicate that the differences are significant (Tukey and Benjamini–Hochberg test p < 0.05).
Agriculture 15 01091 g003
Figure 4. ATR FT-IR (a) and 13C CPMAS NMR (b) spectra of CTRL (green) and LOW (red) extracts isolated from microplot soils 54 days after the beginning of the experiment; the box (c) reports the NMR integrations (absolute and normalized) and the most relevant NMR-based indexes.
Agriculture 15 01091 g004
Figure 5. GC chromatogram of CTRL (green) and LOW (red) extracts isolated from microplot soils 54 days after the beginning of the biochar-based experimentation. Samples were pyrolyzed at 400 °C and derivatized via thermochemiolysis driven by tetramethylammonium hydroxide.
Agriculture 15 01091 g005
Table 1. Integration (absolute and normalized % values) of GC-MS pyrograms of soil organic matter extracted from biochar-treated (LOW, 1 kg m2) and untreated soils. (N, FAME, G, P, and S labels correspond to Nitrogen-based, Fatty Acid Methyl Esters, p-hydroxyphenyl, guaiacyl and syringyl monomeric lignin units, respectively).
C-CTRLC-LOWC-CTRL (%)C-LOW (%)
N-compounds94,314,23113,212,7143.621.64
Fame10,168,751.318,439,959.50.392.28
Branched fame and Hydroxyacids228,126,38093,427,032.628.7511.57
Unsaturated branched fame047,709,9870.005.91
Aromatic233,967,191.2212,946,751.58.9826.37
N-Aromatic349,283,10284,987,775.7513.4110.52
Lignin-G400,985,72283,730,246.7515.3910.37
Lignin-P28,572,68801.100.00
Lignin-S255,884,05449,253,888.59.826.10
Total Lignin685,442,464132,984,135.326.3116.47
Disclaimer/Publisher’s Note: The statements, opinions and data contained in all publications are solely those of the individual author(s) and contributor(s) and not of MDPI and/or the editor(s). MDPI and/or the editor(s) disclaim responsibility for any injury to people or property resulting from any ideas, methods, instructions or products referred to in the content.

