Article

Three Decades of Tillage Driven Topsoil Displacement and Soil Erosion Attenuation on Loess Plateau Slope Farmlands

1
Key Laboratory of Geological Hazards and Geotechnical Engineering Defense in Sandy and Drought Regions at Universities of Inner Mongolia Autonomous Region, Inner Mongolia University of Technology, Hohhot 010051, China
2
Inner Mongolia Engineering Research Center of Geological Technology and Geotechnical Engineering, Inner Mongolia University of Technology, Hohhot 010051, China
3
College of Civil Engineering, Inner Mongolia University of Technology, Hohhot 010051, China
4
Inner Mongolia Engineering Corporation Limited of Water Resources and Hydropower, Hohhot 010051, China
*
Author to whom correspondence should be addressed.
Agriculture 2025, 15(10), 1084; https://doi.org/10.3390/agriculture15101084
Submission received: 1 April 2025 / Revised: 6 May 2025 / Accepted: 15 May 2025 / Published: 17 May 2025
(This article belongs to the Section Agricultural Soils)

Abstract

:
The slope lands of the Loess Plateau represent a critical region impacted by soil erosion, which directly contributes to the globally recognized high sediment concentration in the Yellow River. However, the extent to which sloped farmland contributes to soil loss remains scientifically contentious. In this study, farmland with an initial slope gradient of 20° was selected for the experiment, and three decades of field monitoring data (1990s–2020s) and the Universal Soil Loss Equation (USLE) model were used for comparative calculation. The data indicated that the model-predicted soil loss rate in sloped farmland from the 1990s to the 2020s was calculated to be 62.48 t·ha−1·yr−1. Field-measured values averaged 45.67 t·ha−1·yr−1, whereas the current value is approximately 15.00 t·ha−1·yr−1. Anthropogenic disturbances, including tillage, manual weeding, and ovine grazing, mean that the topsoil of slope farmland has undergone cumulative displacement of 450~870 cm in 30 years, which is resulting in progressive slope gradient reduction from 20° to 5°. The soil erosion rates exhibited exponential decay characteristics, and finally gradually reached the level of flat farmland. When using the USLE model, the evolving slope gradient must be incorporated, rather than the slope angle extracted by DEM. Therefore, the key finding of this study is that the primary sources of soil loss in the Loess Plateau are non-agricultural slopes and gullies. Conversely, soil erosion on slope farmlands does not constitute a critical problem requiring urgent intervention. This finding should attract the attention of the local agricultural sector.

1. Introduction

In China’s Loess Plateau region, severe soil erosion coupled with limited vegetation growth has resulted in land resources depletion and ecological degradation. The “Grain for Green” program implemented on the Loess Plateau since 1998 has substantially mitigated erosion in the region [1]. The most severe erosion rates, occurring on slopping lands, can exceed 2000 t·km−2·yr−1 in this region.
Multiple methodologies exist for soil erosion quantification, principally categorized as physical models and empirical approaches [2]. Soil erosion is a complex process that encompasses three interrelated components: soil detachment, sediment transport, and sediment deposition. These processes form the basis of physical erosion models such as Kinematic Runoff and Erosion Model 2 (KINEROS2) [3], Water Erosion Prediction Project for paddy fields (WEPP) [4,5], European Soil Erosion Model (EUROSEM) [6], and Landslide Impact Severity Evaluation Model (LISEM) [7]. These process-based models require extensive parameterization due to their mechanistic representation of erosion dynamics. Consequently, reliable calibration of these models necessitates comprehensive sediment yield measurements from monitored watersheds. However, such observational data are often unavailable in ungauged watersheds and resource-constrained regions [8]. In contrast, empirical models like USLE [2,9], MMF [10], and RUSLE [11] establish relationships between soil loss magnitudes and physical factors that are easier to calculate. The PESERA and EPM models have been predominantly applied in Europe and have the potential to be used in the Himalayas [8]. The RUSLE has become the most extensively applied empirical model worldwide, particularly for soil erosion assessment and conservation planning [2].
Extensive studies have established vegetation restoration as an effective approach for sediment yield reduction and erosion control. This efficacy principally stems from vegetation-induced biophysical mechanisms that enhance soil erodibility. Key mechanisms encompass root network reinforcement and rhizospheric exudate release [12]. Additionally, alterations in vegetation cover impact the connectivity of slope runoff and sediment, thereby enhancing sediment deposition [13]. Thus, it is imperative to optimize the land use patterns on hillslopes to achieve optimal utilization of land resources and effectively manage soil erosion.
Runoff-driven erosion exerts direct mechanical forces on slope soil particles. These particles undergo a continuous process of destruction, erosion, transportation, and deposition, facilitated by the movement of runoff and sediment [14]. These geomorphic processes not only drive spatiotemporal heterogeneity in soil physicochemical properties across different spatial scales but also initiate erosion processes concurrent in the surface microtopography [1]. The erosion-driven spatial reorganization of soil architecture reshapes microtopography dynamics. Microtopographic indices (e.g., roughness, incision depth, elevation variance) exert critical controls on hydrological processes, including runoff generation, surface permeation, runoff convergence, flow regulation, and sediment discharge. These factors ultimately impact the amount of soil loss from the slope [1,15].
Previous studies utilizing nuclear tracer methodologies have effectively identified sediment provenance within various watersheds [16]. Nevertheless, the spatiotemporal redistribution mechanisms of erosion-deposition dynamics across hillslope gradients remain insufficiently characterized. Decoupling the individual and synergistic effects of controlling factors on these geomorphic signatures is critical for advancing mechanistic understanding of slope erosion processes. Selective mechanisms are responsible for the transportation of soil particles of varying sizes on undulating slopes [17]. Furthermore, soil organic matter modulates susceptibility through modification of pore architecture and aggregate cohesion [14]. Consequently, it is imperative to further the investigation of novel erosion-deposition patterns that emerge under the influence of multiple factors.
Land use practices such as tillage and vegetation restoration directly modify slope geometry and soil stability. The “Grain for Green” program has reduced regional erosion by enhancing vegetation cover, yet slope farmlands remain critical due to anthropogenic microtopographic alterations. Traditional farming practices induce cumulative soil displacement, gradually flattening slopes and decoupling erosion rates from static DEM-derived slope values. This underscores the necessity of integrating land use-driven terrain evolution into erosion modeling frameworks [18].
While prior studies emphasized vegetation restoration and gully erosion, the role of anthropogenic terrain modification in slope farmland systems remains underexplored. Our long-term monitoring reveals that tillage-driven slope flattening from 20° to 5° reduces erosion rates exponentially (62.48 to 15.00 t·ha−1·yr−1). This dynamic is absent in static DEM-based models [19].
The USLE model was prioritized for its empirical robustness in data-scarce regions and direct integration of land use parameters ( C , P factors). While process-based models offer mechanistic insights, their reliance on high-resolution hydrological data limits applicability in ungauged watersheds. By recalibrating USLE with field-measured slope gradients, we bridge the gap between static DEM inputs and dynamic terrain evolution [20].
In this study, the investigation focuses on a representative slope agricultural system in the northwest Loess Plateau’s erosional hotspot region. Originally characterized by a 20° incline three decades ago, the study site now exhibits a gentler 5° gradient through progressive geomorphic evolution. We integrated the USLE model with in-situ monitoring to quantify erosion rates, enabling comparative analysis of model predictions and empirical observations. This study specifically evaluates how traditional tillage, manual weeding, and free-range grazing practices modulate slope morphology. We also concurrently assessed indigenous cropping systems’ impacts on soil moisture. This study aims to determine whether slope farmland plays a crucial role in soil loss within the Loess Plateau.

2. Materials and Methods

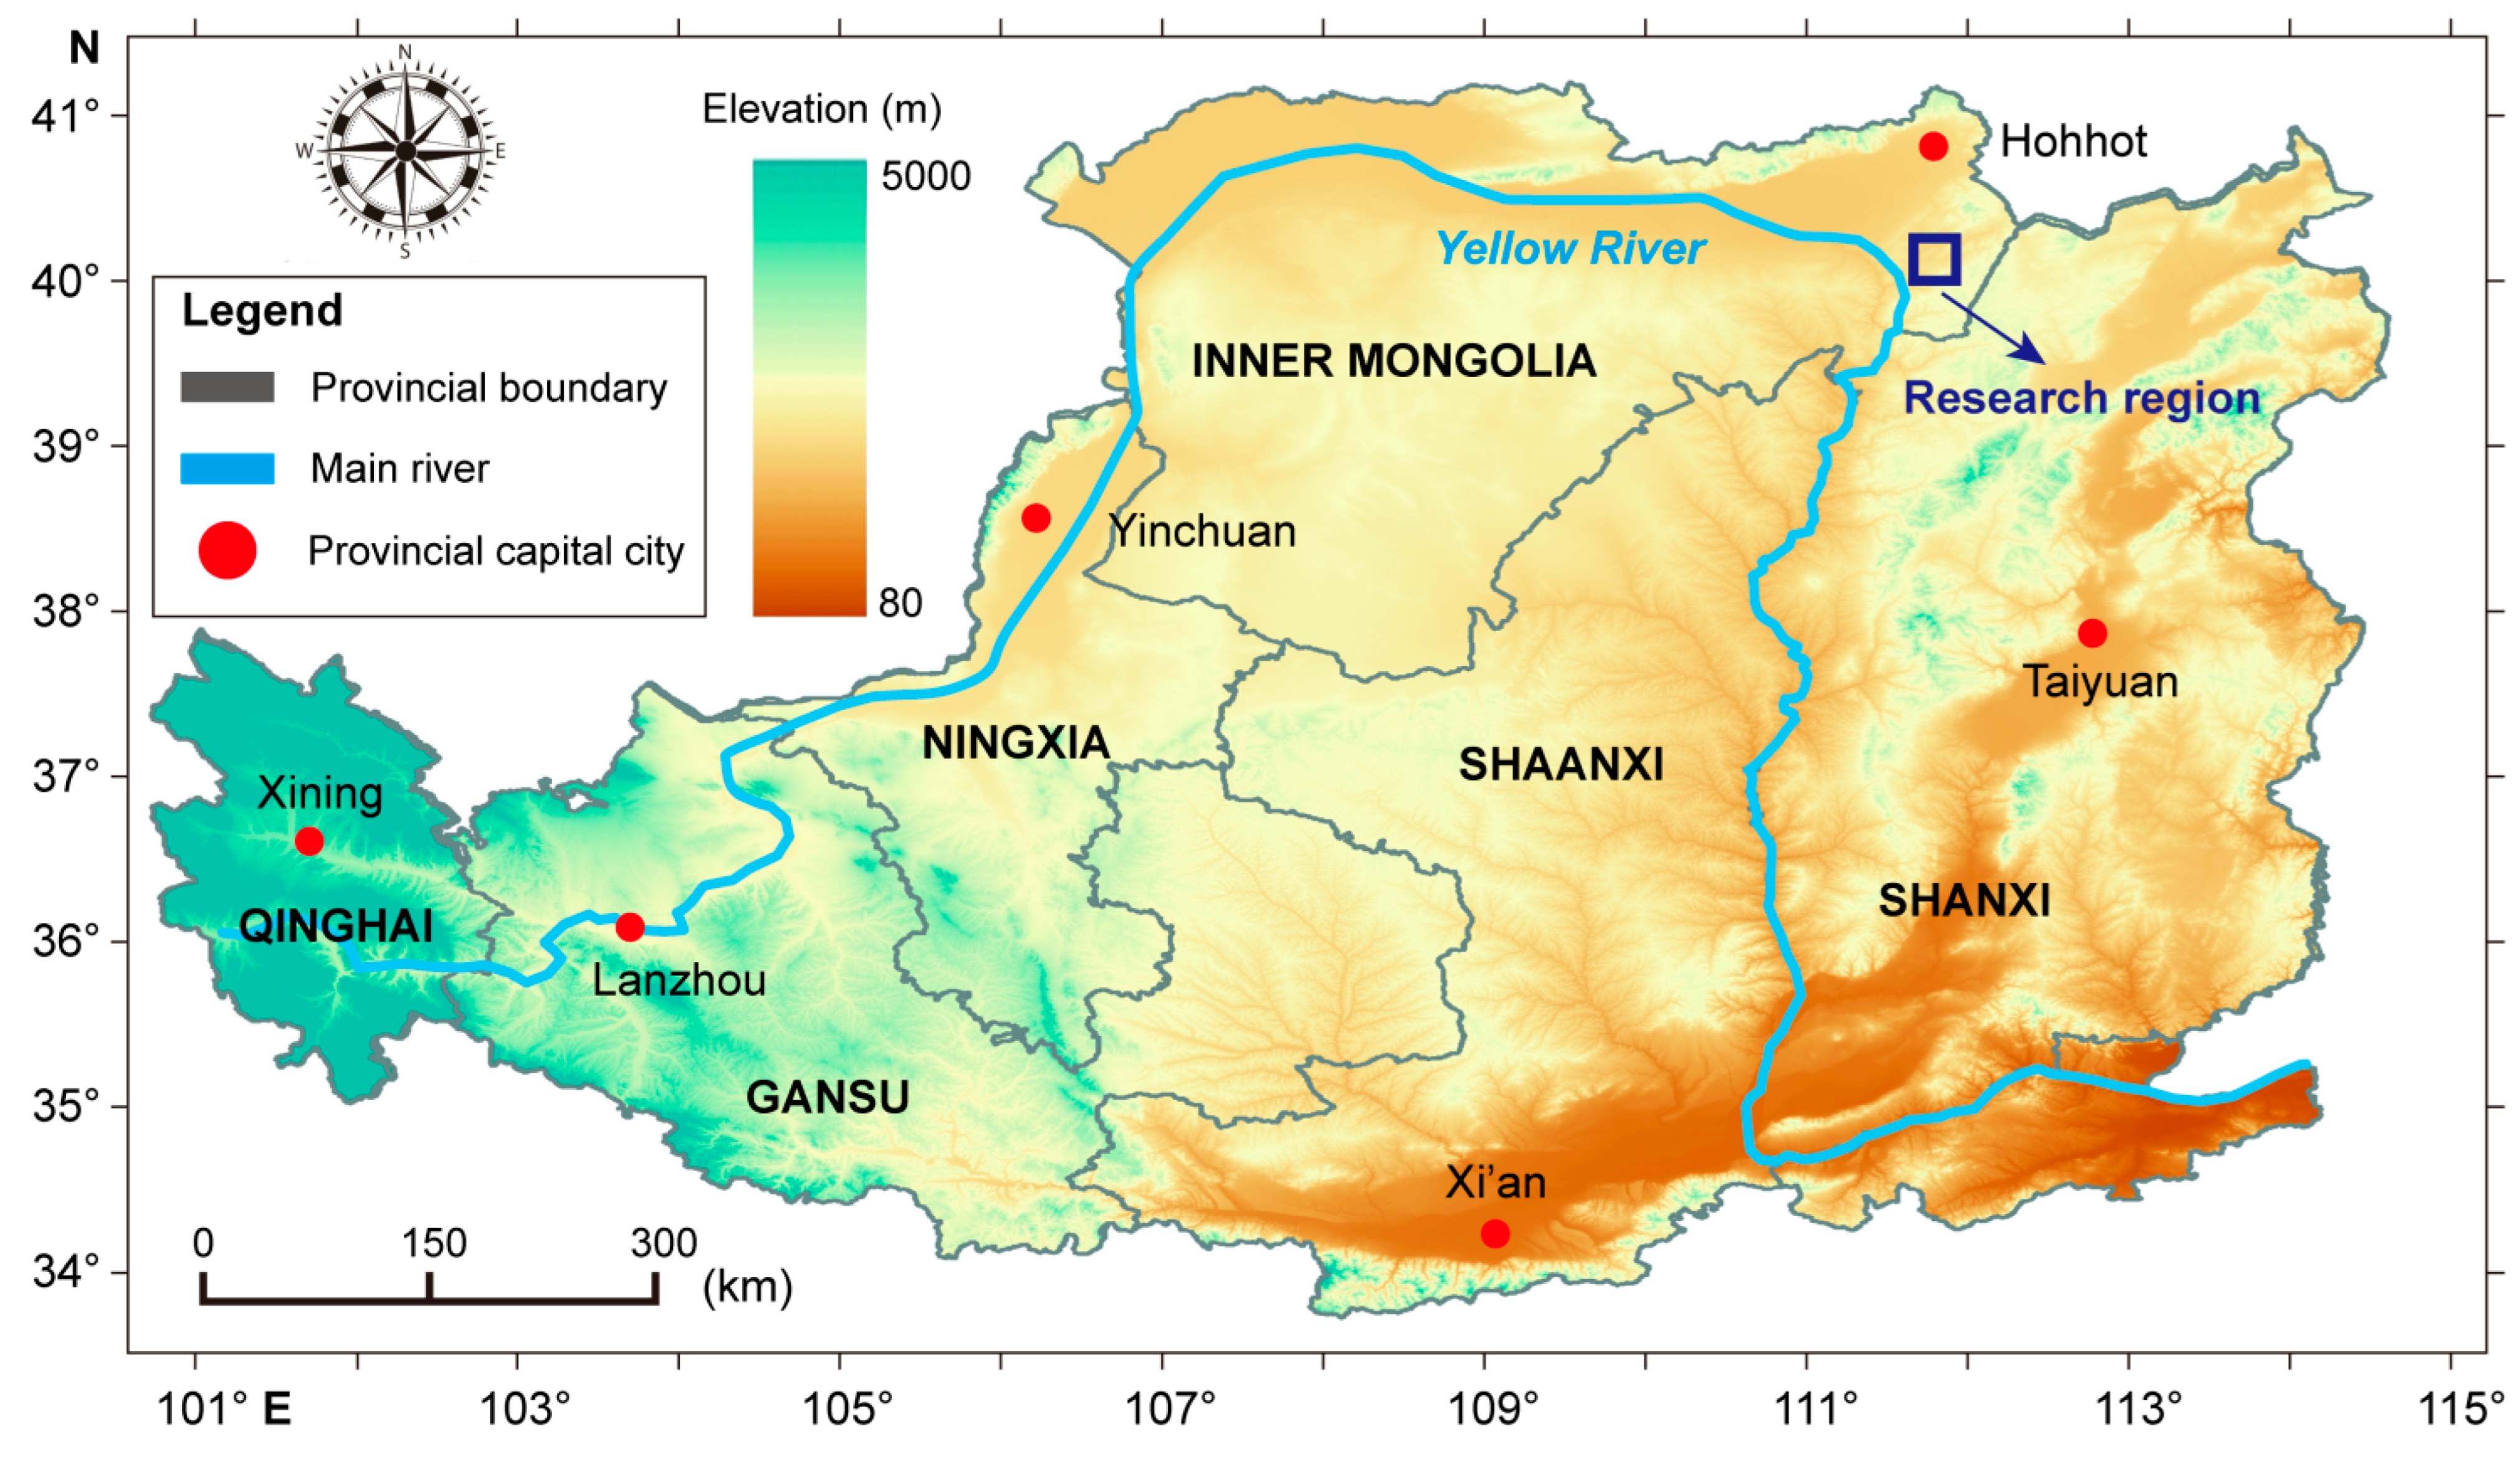
2.1. Geographic Setting

The Loess Plateau is located in the upper and middle sections of the Yellow River Basin in northwestern China (Figure 1). With a total area of 620,000 km2 (accounting for 6.5% of China’s terrestrial territory), it represents the world’s largest loess deposit. The plateau is geographically bounded by the Yinshan Mountain (north), Qinling Mountain (south), Wushaoling-Riyue Mountain (west), and Taihang Mountain (east) [21]. The region’s topography exhibits significant diversity, encompassing plateaus, basins, hills, and gullies, with elevation gradients spanning 80–5000 m. The continental monsoon climate exhibits strong spatial heterogeneity (semiarid and subhumid), with mean annual temperature of 4.3 °C in the northwestern area and 14.3 °C in the southeastern area [22]. Precipitation gradients follow similar spatial patterns, with mean annual precipitation increasing from 150 mm in the northwest to 750 mm in the southeast, predominantly delivered as high-intensity rainstorms between June and September [22]. The Quaternary loess-paleosol sequence, characterized by metastable structure and high vertical joint density, creates unique stratigraphic architecture with exceptional erodibility. The thickness of these layers’ averages approximately 100 m, with the dominant soil types being typical loess and clayey loess [21].
The vegetation of the region undergoes a transition from arid desert to steppe, and ultimately to broad-leaved deciduous forest as one moves from the northwest to the southeast. Traditional rainfed agriculture focuses on drought-tolerant cultivars: wheat, maize, millet, sorghum, soybean, and buckwheat.
The Loess Plateau’s agricultural landscape has undergone profound transformations over the past three decades, shaped by ecological policies and adaptive land management strategies. Initially dominated by extensive dryland farming characterized by steep slopes (~20°), traditional tillage, and minimal vegetation cover, the region became a global hotspot for soil erosion.
The implementation of China’s Grain for Green Program has driven significant land-use transformations on the Loess Plateau over the past three decades. Marginal croplands on steep slopes (>15°) were systematically converted to forest and grassland, reducing erosion risks by 40~70% in these areas [23]. Concurrently, slope farmlands on gentler terrain (<10°) were preserved for food security, prompting innovations in conservation tillage and slope stabilization technologies [16]. Traditional moldboard plowing, which caused annual soil displacement of 10~20 cm, was partially replaced by reduced tillage and no-till systems in maize and millet fields. To enhance soil structure, manual hoeing frequency increased to 2~3 times·yr−1, indirectly altering microtopography through repeated soil displacement [20].
Agricultural adaptations were further optimized through drought-resistant crop selection and agroforestry systems. The fibrous root networks of these crops stabilized slopes and reduced runoff connectivity, while intercropping enhanced soil organic carbon sequestration [16]. Livestock grazing was restricted to designated zones via rotational fencing, minimizing trampling-induced soil compaction [24,25]. Concurrently, terraces and check dams were incrementally adopted in gullies to intercept runoff and trap sediments, though natural slope evolution dominated the study area [23]. Combined with climatic shifts, these policy-driven and agronomic interventions facilitated a geomorphic transition: slope farmlands evolved from erosion-prone slopes (~20°) to stabilized terraces (~5°) over 30 years. This synergy between tillage practices, vegetation recovery, and engineering measures underscores the pivotal role of adaptive land management in mitigating erosion risks [26].
The Loess Plateau stands as a global erosion hotspot, where a confluence of predisposing factors drives extreme loess mobilization. Key drivers include monsoon-driven summer storms, terrain gradients, sparse vegetation cover, and loess erodible characteristics. Consequently, a substantial portion of the displaced loess is transported into the Yellow River, reaching 2800 t km−2 yr−1 in source areas [27]. The pervasive soil erosion observed in the Loess Plateau has profoundly influenced both the ecological integrity of the Yellow River and the regional ecosystem of the plateau itself. Our study focuses on a representative sandy loess area within the northeastern erosional belt of the Loess Plateau, situated in Qingshuihe County, Hohhot City, which is part of the Inner Mongolia Autonomous Region, China.

2.2. Universal Soil Loss Equation (USLE)

The USLE model provides a standardized methodology for estimating long-term rill erosion rates under various fields at hillslope to small watershed scales. The RUSLE incorporates improved parameterization of slope steepness factors and accounts for depositional effects through sediment delivery ratios in complex terrain. The fundamental soil loss prediction equation of the USLE model is as follows:
A = R × K × L × S × C × P
where A represents the average annual soil loss (t·ha−1·yr−1), R denotes the rainfall and runoff factor, also known as the rainfall erosivity factor (MJ·mm·ha−1·h−1·yr−1), K stands for the soil erodibility factor (t·ha·h·ha−1·MJ−1·mm−1), L signifies the slope length factor (dimensionless), S indicates the slope steepness factor (dimensionless), C represents the cover and management factor (dimensionless), and P represents the support practice factor (dimensionless).

2.2.1. Rainfall Erosivity Factor (R)

The rainfall erosivity factor serves as an indicator of the potential effects of variations in weather and precipitation on soil erosion, when all other variables are held constant. This parameter forms the fundamental of erosion quantification frameworks in process-based modeling systems. The USLE requires high-temporal-resolution precipitation records for calculation. In data-scarce regions, simplified parameterizations have been developed using coarser temporal resolutions. These alternatives are predicated on the temporal resolution and accessibility of rainfall data, adapting to the specific limitations encountered in data availability within these areas. These empirical equations hold potential applicability for regions with analogous climates that lack comprehensive long-term rainfall data. Several studies have successfully generated rainfall erosivity maps that encompass expansive countries and regions, underlining the adaptability of these equations in diverse environmental contexts. Panagos et al. [28] utilized pluviographic records from 63 countries to develop a global R factor map at 30 arcsecond spatial resolution using spatial interpolation. Naipal et al. [19] extensively explored the use of the USLE on the global scale (30 arcsecond) to formulate rainfall erosivity equations. Despite their coarse resolution, the global datasets provide potential approximations for rainfall erosivity assessment in ungauged regions. For this study, we adopted the formula validated for the Loess Plateau [29].
While our study adopted the Loess Plateau-specific formula from Li et al. [29], we acknowledge the global applicability challenges of R factor equations [9]. Their meta-analysis demonstrates that regionally calibrated R factor formulas improve accuracy compared to unvalidated imports from dissimilar climates. This aligns with our caution against indiscriminate equation selection.
R = i = 1 i = 12 1.792 P i 1.15527
where R represents the annual rainfall erosivity factor and P i denotes the monthly rainfall (mm). We processed 14-year (2010–2023) monthly precipitation data from the Loess Plateau to compute R value through temporal averaging. Spatial distribution of erosivity was mapped via ordinary Kriging interpolation.
A prevalent issue identified in the examination of USLE studies in this sector was the indiscriminate use of equations sourced from disparate nations and regions without adequate rationale for their selection, and with little regard for their applicability. These discrepancies highlight the importance of understanding the regional applicability of rainfall erosivity equations. Existing studies frequently overlook parametric uncertainty analysis from a uniform input dataset and encourage prospective USLE users to undertake analogous sensitivity analyses in their respective regions.

2.2.2. Soil Erodibility Factor (K)

The K factor quantifies the soil’s susceptibility to detachment and subsequent movement induced by the mechanical impact of raindrops and the shearing force of surface runoff. Higher K values suggest greater vulnerability to erosion [29]. This pedological index reflects how soil properties affect soil erosion in upland regions during storms events. The variable K is significantly influenced by several soil properties, such as texture, organic matter content, soil structure, and permeability. Chen et al. [30] integrated parameters such as textural details, organic matter content, soil structural data, and profile permeability into a mathematical model to calculate the K factor within the USLE model.
K = 0.2 + 0.3 e x p 0.0256 × s a × 1 s i 100 × s i c l + s i 0.3 × 1 0.25 c a c a + e x p 3.72 2.95 c a × 1 0.7 s n s n + e x p 22.9 s n 5.51
where s a , s i , and c l are the volume percentages of sand, silt, and clay, respectively, and c a is the weight percentage of organic carbon; s n = 1 s a / 100 .
Zhou et al. [31] presented a set of generalized K factor values pertinent to diverse soil textural classes, such as clay and loam, contingent solely upon the knowledge of soil texture (Table 1). Similar to the validation of the R factor, it is crucial to verify the derived K factor values for the specific site’s soil against previously reported values for comparable sites and soil types.
The K factor calculation was validated against Zhou et al.’s [31] texture-based thresholds (Table 1). To further contextualize our K values (mean: 0.029), we reference Panagos et al. [28], who reported comparable erodibility (0.025~0.035 t·ha·h·ha−1·MJ−1·mm−1) for loamy soils in European agroecosy stems.

2.2.3. Topographic Factor (L × S)

The topographic ( L S ) factor, integrating slope length and slope gradient, quantifies the amplification effect of terrain geometry on erosion potential. Empirical studies demonstrate positive relationships between soil erosion and slope gradient. The characteristics of slope length and slope steepness are frequently utilized as indicators to elucidate the influence of slope angle ( θ ) on soil erosion. To evaluate the vulnerability of soils to erosion across expansive geographical areas, such as in basins, the USLE model can be adapted for application by refining its topographic factor to augment its relevance at the basin scale [29,32]. The calculation of the L factor is as follows:
L = λ / 22.13 m
where λ represents the slope length measured in meters and m is a variable exponent that depends on the steepness of the slope. The value of m is assigned as 0.2 for slopes with an inclination of less than 1%, 0.3 for inclinations less than 3%, 0.4 for inclinations below 5%, and 0.5 for inclinations exceeding 5%.
The slope-dependent exponent m in Equation (4) follows the USLE-RUSLE convention. Recent work by Wang et al. [33] confirms that this parameterization effectively captures slope-length amplification effects in loess regions, supporting our ( L S ) factor derivation.
The S is restricted to slopes that are less than 18%, as this is the maximum limit specified in the USLE. For slopes steeper ( θ ) than 18%, we utilized different equations, including the one proposed by Li et al. [29]. The specific equations can be found as follows:
S = 10.8 sin θ + 0.03 θ < 9 % 16.8 sin θ 0.50 9 % < θ < 18 % 21.9 sin θ 0.96 θ > 18 %

2.2.4. Cover and Management Factor (C)

The cover and management ( C ) factor, dimensionless and ranging 0~1, represents the ratio of soil erosion from a field under given management and vegetation conditions to that of a field under standard conditions. This factor plays a crucial role in erosion processes and is readily amenable to human interventions aimed at mitigating erosion [20]. The factor estimation requires methodological adaptation based on spatial scale, vegetation phenology, and high-resolution remote sensing imagery. In small-scale areas, it is more practicable to determine the cover management C factors through fieldwork. If past USLE investigations have documented C factors for cover comparable to the study region, those figures can be utilized for the approach based on tables (Table 2).
On a small scale and with a thorough grasp of variations in land cover categorizations, extracting information from existing sources could be the most effective option. However, at regional levels, this approach might prove to be laborious. At larger scales, detailed satellite images might be accessible for assessing normalized difference vegetation index (NDVI), but it is crucial for researchers to consider the image’s acquisition date in comparison to their study timeframe. Furthermore, considerations such as data accuracy and methodologies for addressing challenges associated with cloud cover interference and the integration of images from varied satellite orbits must be duly acknowledged [35].
Beyond Table 2, we incorporated findings from Phinzi and Ngetar [20], who demonstrated that NDVI-based C factor estimation (via Sentinel-2 imagery) yields <15% deviation from field measurements in semi-arid croplands. This reinforces our hybrid field/remote sensing approach.

2.2.5. Support Practice Factor (P)

The support practice factor ( P ), a dimensionless coefficient ranging from 0 (complete protection) to 1 (no conservation measures), quantifies erosion mitigation efficiency through implemented conservation strategies. The P factor quantifies the influence of management techniques on soil erosion control by modifying flow dynamics. This is achieved through methods such as contouring, strip cropping, or terracing. The effectiveness of the conservation method in reducing soil erosion exhibits an inverse relationship with the P factor [24]. The P factor values can be sourced from the literature; a lack of observed support practices results in a P factor of 1.0. Although often overlooked, several studies have proposed potential P factor values for various tillage methods, terracing, contouring, and strip cropping (Table 3).
Through the application of these P factors at appropriate scales and with a comprehensive understanding of agricultural practices, it is possible to achieve a more precise estimation of soil loss. The integration of the P factor into USLE applications is essential, given the substantial influence that specific management practices can exert on diminishing soil erosion when contrasted with conventional tillage techniques. The P factor is instrumental in investigations that assess various management practices for a specific site, as it can elucidate the most efficacious approaches for soil conservation.

2.3. On-Site Data Estimation

The study area encompasses Batugou village, a 9 km2 watershed of loess hill-gully systems in the northeastern Loess Plateau. The whole landform of the village is characterized by small loess hills, which are cut by large erosion gullies, and a small amount of bedrock is exposed at the bottom of the gully (Figure 2). The bedrock layer is sandstone, and the upper part is covered with a loess layer greater than 20 m. Most of the exposed sections of the loess layer belong to Q4 loess and a small amount of Q3 loess. Groundwater is extremely scarce, the buried depth is larger than 30 m, and only the bedrock layer at the bottom of the ditch has spring water exposed.
The agricultural land in the village is characterized by dry farming practices, with the soil exhibiting a notably high sand content, and the soil fertility is considered to be moderate. The total cultivated area is about 1.1 km2, the area of forest and grassland is about 6 km2, and the area of slope farmland is 0.8 km2 (Figure 2). Thirty years ago, the soil erosion on farmland was quite severe, but now the problem of soil erosion has been gradually alleviated. This study selected a slope farmland with a slope close to 20 degrees, and the initial contour line in the 1990s was determined according to the on-site soil layer marker. Combined with the contour line of the existing slope farmland, the mean soil loss over the past 30 years was determined.

3. Results

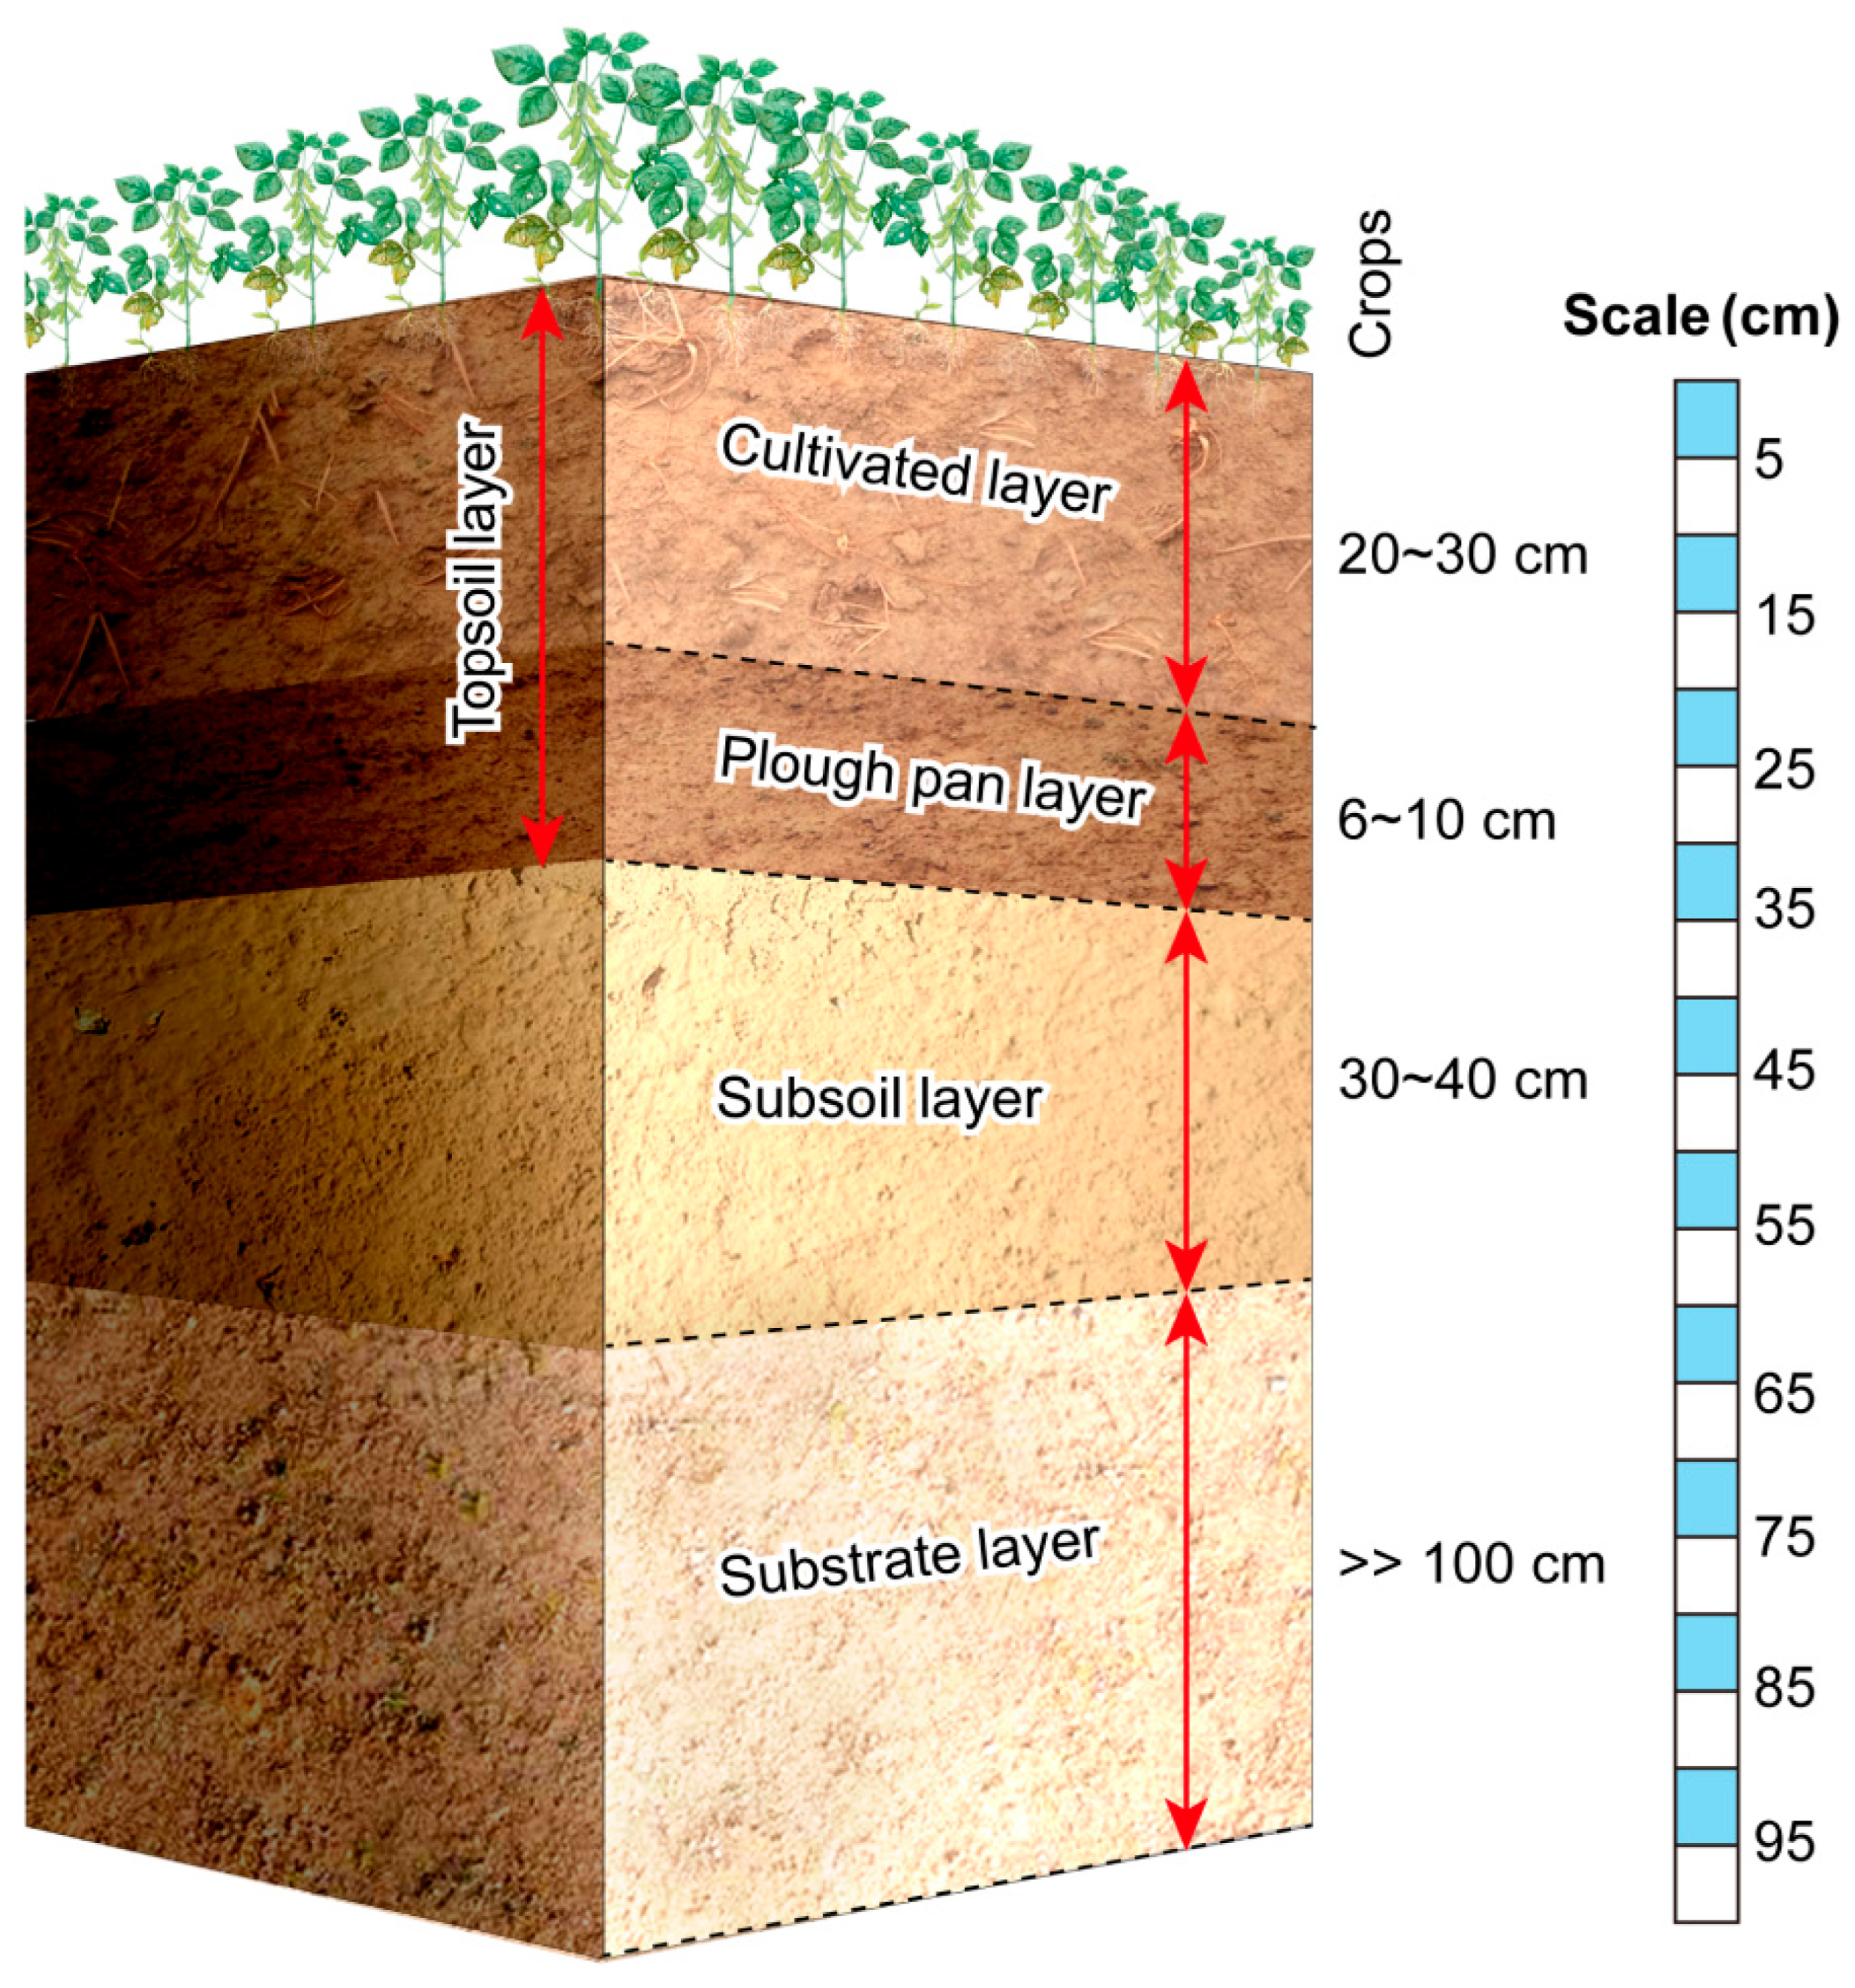
3.1. Physical Indicators of Cultivated Soil

Soils with similar particle composition are classified into the same texture category, which generally reflects the fundamental characteristics of the soil. Consequently, particle composition is often one of the initial factors considered when identifying soil and elucidating its fertility characteristics [36]. In the study area, the soil is commonly referred to as yellow loamy soil, characterized by a sand content exceeding 60%, porosity greater than 40%, and organic matter content surpassing 5% (Table 4).
The soil profile in the study area consists of four distinct layers: the cultivated layer, the plough pan layer, the subsoil layer, and the substrate layer. The cultivated layer and plough pan layer are collectively referred to as the topsoil layer (Figure 3). In semi-arid region, the plough pan layer is not significant; its soil bulk density is approximately 1.42 g·cm−3, which is higher than that of the cultivated layer, and its thickness is about 6~10 cm. In comparison to the subsoil, the clay content in the cultivated layer decreases while the sand content increases, a characteristic feature of yellow loamy soil. The surface soil structure is predominantly granular, exhibiting both granular and massive forms, with minimal soil compaction.
The structure of yellow loamy soil consists of a combination of soil aggregates of varying sizes, forms, and properties. Aggregates with a diameter greater than 0.25 mm are classified as large aggregates, while those smaller than 0.25 mm are classified as micro aggregates. Organic matter plays an essential role in the formation of these aggregates, with the majority being large-sized aggregates. Water-stable aggregates are indicative of the soil’s capacity to retain water and nutrients, particularly the quantity of aggregates exceeding 0.25 mm in diameter. Notably, the number of aggregates in the surface layer is significantly higher than in other soil layers, primarily due to the tillage practices applied to the surface layer. Conversely, the heart soil layer experiences minimal disturbance, resulting in a micro aggregate proportion of less than 0.25 mm that exceeds 70%. This condition may contribute to soil erosion, which is closely associated with the properties of loessial soil.
Furthermore, the parent material of yellow loamy soil is characterized by a high calcium oxide content, rendering the overall soil profile weakly alkaline. The total nitrogen and available phosphorus contents are low. Consequently, enhancing soil organic matter and appropriately increasing nitrogen fertilizer application are crucial strategies for improving soil fertility in yellow loamy soil.
The soil physicochemical properties of the study area (Batugou Village) were characterized through a systematic sampling of the cultivated layer (0~20 cm depth) across five representative locations within a 100 m × 100 m grid. This sampling strategy balanced spatial coverage with practical feasibility, considering the study area’s homogeneous sandy loess composition (Table 4) and long-term agricultural uniformity. Five replicate soil samples were collected during the post-harvest period (October) to minimize disturbance from tillage and ensure stable moisture conditions. The 100 m × 100 m grid ensured spatial representativeness while accounting for microtopographic variations caused by 30 years of tillage-induced slope gradient reduction from 20° to 5°. The study area exhibits minimal spatial variability in soil texture (66.2% sand, 30.5% silt, 3.3% clay) and organic matter content (10.6 g·kg−1), as verified by consistent bulk density (1.35 g·cm−3) and porosity (46.2%) measurements (Table 4). Progressive slope flattening and stable land management practices (e.g., uniform tillage, restricted grazing) further reduced erosion-driven heterogeneity in topsoil properties. Replicate samples confirmed negligible intra-grid variability, with mean values aligning with dominant regional soil characteristics. These results support the use of spatially averaged parameters in USLE modeling while acknowledging potential microscale deviations in active gully systems.

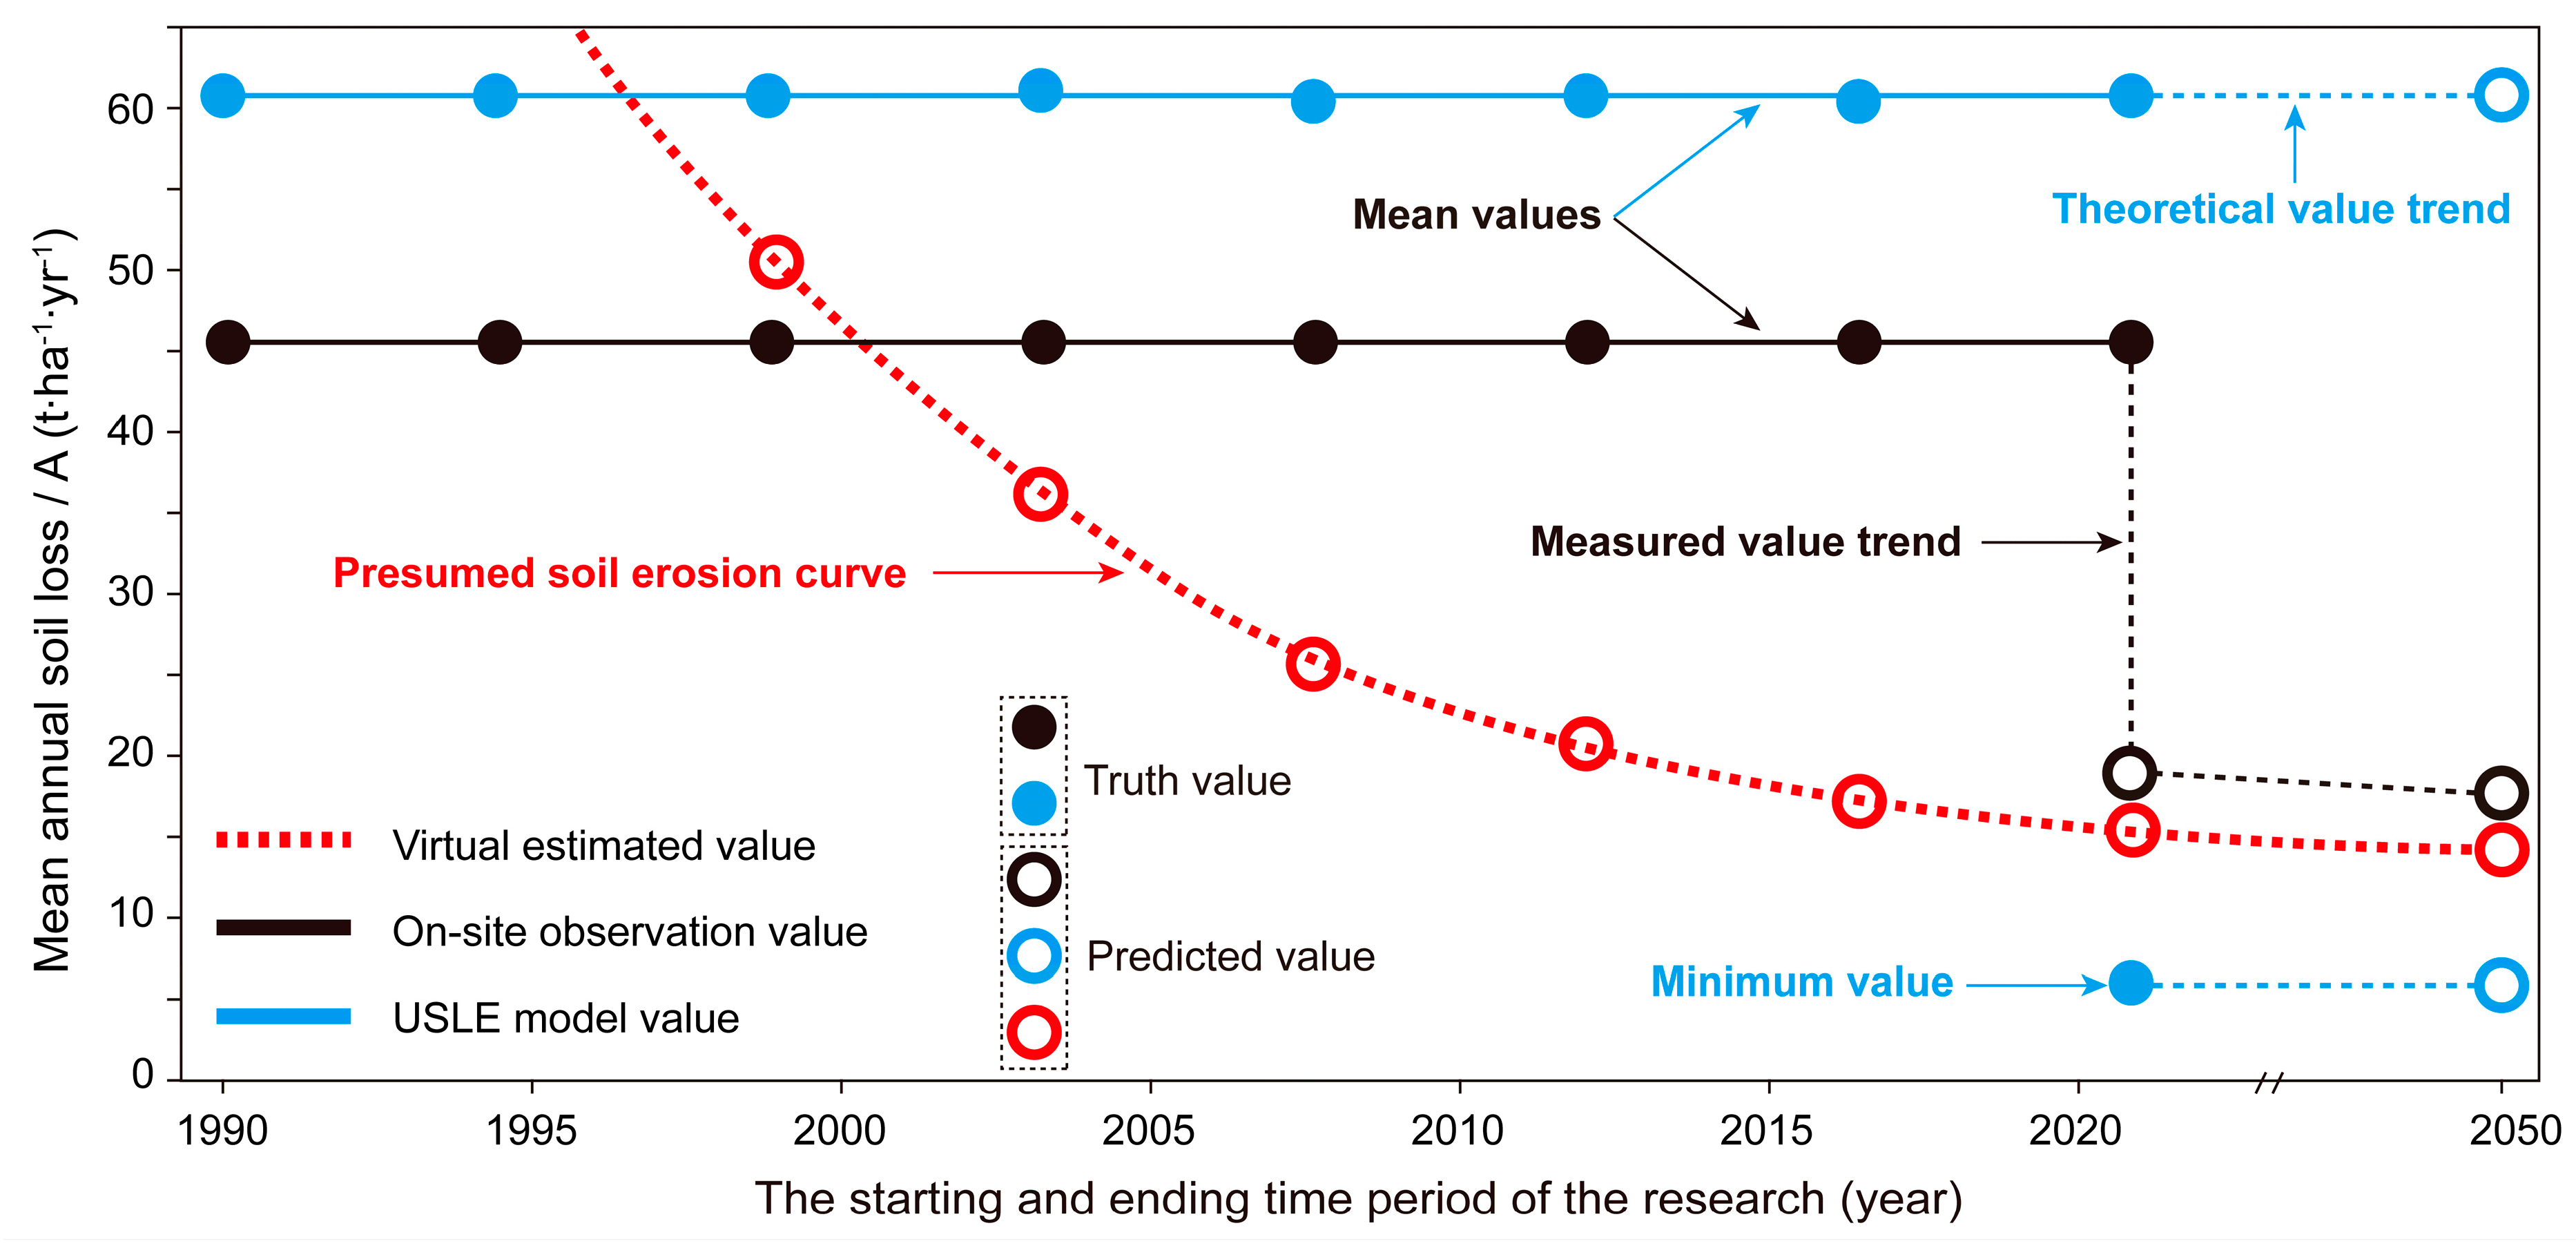
3.2. Soil Loss in Cultivated Land

The USLE model, which incorporates six input parameters, was used to predict soil loss in the sloped farmland of Batugou village. Input parameter calculations included meteorological, soil, vegetation, and slope data (Table 5). Analysis of the USLE model revealed high R factor values in the study area, with an average of 523.74 MJ·mm·ha−1·h−1·yr−1 derived from total point rainfall within the watershed. Similarly, the K value, primarily influenced by soil physical attributes, exhibited elevated values in mountainous watersheds [25,31], averaging 0.029 in this study. The L and S factor values measured across the study area were 6.00 and 6.53, respectively, while the C factor was determined to be 0.30. The P value for dry farmland was recorded at 0.35. Upon analyzing the USLE model, the study area demonstrated a mean annual soil loss of 62.48 t·ha−1·yr−1, indicating a significant erosion risk concern.
In the 1990s, the slope angle of the farmland in the study area was approximately 20°, and the original cultivation method was adopted (Figure 4). The cultivated land consisted primarily of typical yellow loamy soil (Figure 3), with each slope farmland measuring about 10 m in width and 200~300 m in length. Field ridges separated the slope farmlands, with an initial height of less than 30 cm. Due to the large slope angle and low organic matter content, soil loss intensity was significant, resulting in a calculated value of 62.48 t·ha−1·yr−1 according to the USLE model.
By the 2020s, the topographic and geomorphological characteristics of the study area had undergone substantial changes. Over the past 30 years, there has been no manual intervention in the terrace reconstruction project, and only traditional farming methods have been utilized. Despite the cultivated land area remaining constant, the slope angle of the sloping farmland decreased from 20° to 5°, leading to a reduction in the calculated value of the USLE model to 6.50 t·ha−1·yr−1. The average height of each field ridge changed by 0.4~0.6 m, indicating clear signs of slope top erosion and slope bottom accumulation. Through geometric calculation, the average soil loss intensity of slope land over the past 30 years was an average 45.67 t·ha−1·yr−1.
The measured average values are lower than the USLE model predictions (Figure 5). It is predicted that the model’s predicted value will remain at 62.48 t·ha−1·yr−1 by 2050, as the slope angle value derived from large-scale DEM remains at 20°. However, when examining small-scale slope farmland, the actual slope angle is 5°, leading to a model prediction of only 6.5 t·ha−1·yr−1. The soil loss in slope farmland is non-linear and should not be averaged. Therefore, based on both the measured and calculated values from the USLE model, this study presents the soil loss curve for slope farmland. The characteristics of this curve clearly indicate that soil loss in slope farmland has gradually decreased over the past 30 years, with predictions suggesting it will stabilize at approximately 15.0 t·ha−1·yr−1 in the future. During the 1990s, with a slope angle of 20°, the soil loss intensity exceeded 62.48 t·ha−1·yr−1 (maximum calculated value). In the 2020s, with a slope angle of 5°, the soil loss intensity is expected to be less than 45.67 t·ha−1·yr−1 (measured value) but greater than 6.5 t·ha−1·yr−1 (minimum calculated value). Moving forward, it is anticipated that the slope will remain unchanged, resulting in a relatively stable soil loss intensity.

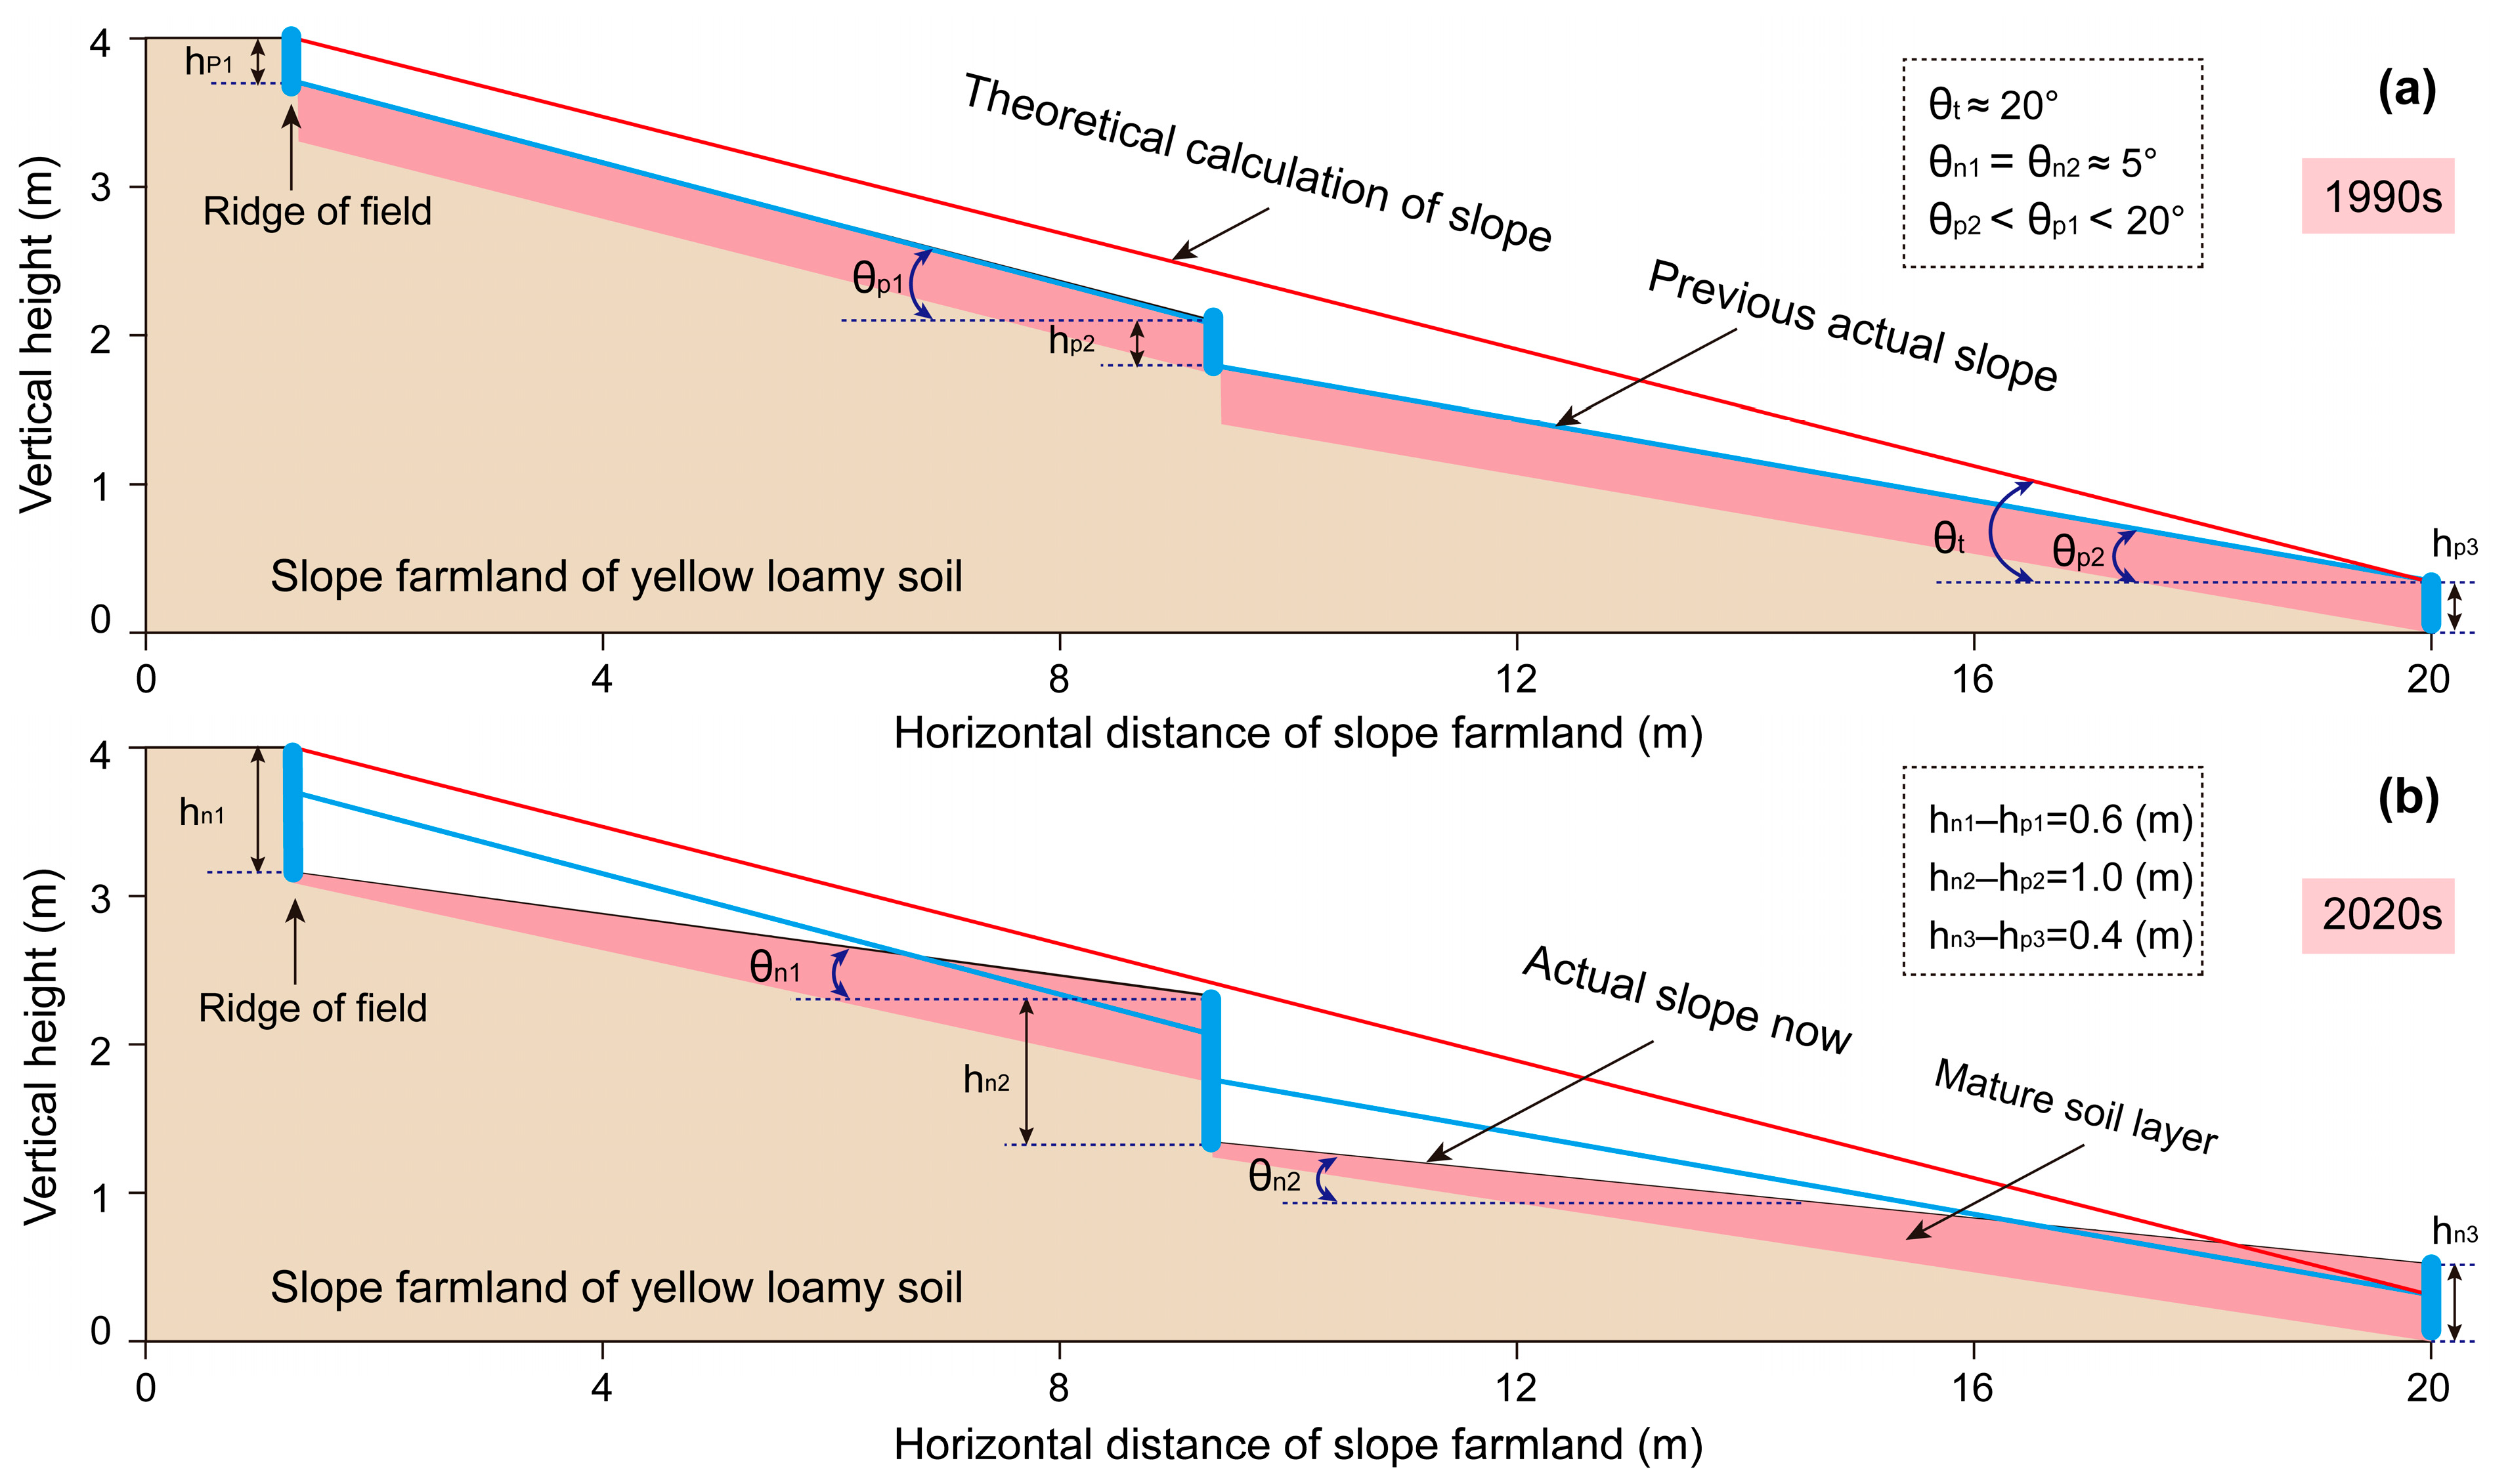
3.3. Leveling Mechanism in Cultivated Land

From the 1990s to the 2020s, the slope angle of farmland was reduced from 20° to 5°, achieved solely through natural cultivation practices without any engineering interventions. Based on field surveys and measured data, three primary factors contributing to this slope reduction have been identified: traditional ploughing, traditional hoeing, and livestock trampling (Figure 6).
The progressive reduction in slope gradients from 20° to 5° over 30 years was driven by 3 primary anthropogenic processes: traditional ploughing, manual hoeing, and livestock trampling. Quantitative displacement rates were derived through longitudinal terrain deformation analysis and field-validated microtopographic markers. Ploughing operations, conducted annually with moldboard implements, induced 10~20 cm·yr−1 of horizontal soil movement, calculated from slope gradient reduction and bulk density constraints, with cumulative displacement totaling 300~600 cm over three decades (aligned with post-harvest soil ridge accretion of 0.4~0.6 m). Manual hoeing (2~3 passes·yr−1) generated 2~4 cm·yr−1 of lateral transport, inferred from microtopographic furrow development, accumulating to 60~120 cm by 2020. Livestock trampling and rooting, constrained by spatial grazing intensity maps, contributed 3~5 cm·yr−1 of redistribution, totaling 90~150 cm over the study period. These values were cross-validated against USLE-predicted soil loss (45.67 t·ha−1·yr−1) and sediment connectivity metrics (Figure 5), confirming consistency with geomorphic theory.
The purpose of traditional ploughing is to loosen the soil. This process facilitates the exchange of soil from the bottom of the plough with that from the plough layer. However, during this operation, the soil also experiences horizontal movement, with each plough contributing to a soil displacement of approximately 10~20 cm·yr−1. In flat cultivated areas, the direction of ploughing alternates annually, resulting in a net horizontal movement of soil approaching 0 cm. Conversely, on slope farmland, the ploughing direction remains constant, leading to continuous accumulation of soil movement, which over 30 years results in a total displacement of 300~600 cm.
Traditional hoeing also aims to loosen the soil to enhance water retention. This process directly causes horizontal soil movement, with hoeing conducted 2~3 times per year. The horizontal displacement of soil due to hoeing is about 2~4 cm·yr−1, accumulating to a total of 60~120 cm over 30 years.
In remote villages, livestock, such as sheep, commonly traverse fields. From October of one year to May of the following year, sheep roam freely, which causes passive movement of the surface soil on slopes. Additionally, sheep dig into the soil to access plant roots, further contributing to soil displacement. The horizontal movement of soil attributed to livestock activities is estimated at 3~5 cm·yr−1, resulting in a cumulative displacement of 90~150 cm over a 30-year period.

4. Discussion

4.1. Erosion Mitigation Characteristics of Indigenous Flora

The average frequency of local crop planting in the study area over the past 30 years is illustrated in Figure 7. The crops include corn, broomcorn millet, sunflower, soybean, and sorghum. It is evident that the roots of native plants primarily consist of fibrous roots, which confer significant advantages for natural soil and water conservation. In the loessial soil farmland areas characterized by steep slopes, the root systems encapsulate the soil, forming a substantial root-soil complex that exhibits notable anti-erosion properties. The protective function of plants on slopes is performed by both the above-ground and below-ground components. The above-ground plant canopy intercepts rainfall and reduces wind speed, thereby providing protective benefits to the slope. Additionally, plant roots on the slope significantly enhance soil erosion resistance. The soil’s anti-scourability and anti-erodibility are closely related to root diameter; roots with smaller diameters can more effectively navigate through soil pores and entangle soil particles, thereby increasing the soil’s to capacity to withstand external disturbances.
The stability of soil structure can be enhanced by plant roots through physical entanglement and chemical secretions. Roots have the ability to improve soil structural stability and enhance soil nutrient levels, thus increasing soil resistance to erosion [12]. These findings may vary depending on the type of soil due to variations in interactions between soil and roots. Roots play a significant role in altering soil properties, particularly affecting soil enzymes like saccharase and catalase [29]. The connection between plant roots and soil erosion resistance is noteworthy. Physical entanglement of roots is a major factor, contributing to 77.7–82.0% of the overall enhancement of soil erosion resistance [12]. With an increase in root density, the impact of physical entanglement of roots also increases significantly. Within this total percentage, the relative contributions of net-linking and soil-root bonding functions to soil erosion resistance are on average 71% and 29%, respectively. Therefore, the density of root surface area can be considered a key indicator for predicting changes in soil erosion resistance in loamy soils in areas prone to flow-induced erosion.

4.2. Dam Effect of Hoeing Methods

Topography serves as a primary controlling factor in regulating the spatial distribution of organic carbon and its fractions across slope landscapes, consequently governing soil erosion processes and sedimentation patterns [18]. The development of erosion-deposition patterns is predominantly controlled by key topographic parameters, including slope gradient, surface roughness, and relief amplitude. Spatial heterogeneity in topographic features and their compositional characteristics fundamentally alters slope runoff convergence mechanisms and erosion dynamics, leading to significant modifications in sediment production rates and particle size distributions [31]. The spatial patterns of topography features and particle size distributions provide insights into long-term sediment transport dynamics and create essential boundary conditions for subsequent sediment transport and deposition processes. Topography represents a dominant control on sediment production within watershed systems during erosive rainfall events, while simultaneously determining the spatial patterns of erosion-deposition processes across slopes. Improvements in soil physicochemical properties can enhance erosion resilience capacity and promote the development of distinct slope erosion patterns.
Topography factors demonstrate stronger control over erosion processes compared to soil physicochemical characteristics (Figure 8). Key topographic parameters directly regulate fundamental hydrological processes encompassing slope runoff generation, infiltration dynamics, flow accumulation, and sediment production. These parameters exhibit dual functionality, potentially reducing or intensifying slope soil loss rates depending on their spatial configuration and magnitude [15,37]. The integrated processes of surface flow generation and convergence represent the primary mechanism underlying microtopographic evolution across slope surface. Consequently, slope surface hydrology, sediment production, and microtopographic evolution are fundamentally interconnected through complex feedback mechanisms. Hoeing practices improve soil erosion resistance through enhanced interactions among controlling factors, resulting in more effective mitigation of soil erosion processes.

4.3. Water Storage Effect of Straw Returning

Straw incorporation was predominantly concentrated within the 10~20 cm soil layer, stimulating root system development throughout the 0~60 cm soil profile and significantly improving crops’ rooting characteristics. Straw incorporation practices exhibit significant improvements in key soil physical properties, including bulk density reduction, porosity enhancement, and field capacity optimization. Following straw incorporation, measurable changes were observed, with soil bulk density decreasing by 2.5–9.2%, total porosity increasing by 4.1–8.9%, and field capacity increasing by 6.5–14.7% (http://sc.iga.ac.cn/en/article/doi/10.11689/j.issn.2095-2961.2020.03.008 accessed on 12 March 2025). Straw incorporation resulted in a substantial increase in macroaggregates (>0.25 mm) content, accompanied by enhanced mechanical stability, improved water retention capacity, and significantly strengthened soil erosion resistance.
Under erosion conditions, soil organic carbon loss occurs predominantly through two distinct pathways: dissolved organic carbon transport through surface runoff and particulate organic carbon redistribution via sediment transport. Extensive research indicates that sediment-associated transport constitutes the primary mechanism for soil organic carbon depletion during erosion processes [31]. Clay-sized particles and labile organic carbon fractions exhibit greater mobility under hydraulic erosion conditions, leading to progressive sediment enrichment along the transport pathway. This enrichment phenomenon demonstrates a positive correlation with transport distance from the erosion source and organic carbon gradients (Figure 9). During aggregate breakdown and transport processes, soil aggregates experience sequential disruption, dispersion, and fragmentation, thereby exposing previously protected organic carbon and significantly altering the labile organic carbon pool. Soil organic carbon functions as an essential binding agent in aggregate formation and stabilization, playing a pivotal role in maintaining soil structural integrity [38].

5. Conclusions

This study investigates the long-term (1990s~2020s) soil loss dynamics in slope farmland systems and their associated mechanical processes in remote villages across the Loess Plateau. A comprehensive comparison was conducted between 30-year field measurements and USLE model predictions to assess model performance. The main findings are summarized as follows:
(1) Model predictions and field measurements yielded soil loss rates of 62.48 t·ha−1·yr−1 and 45.67 t·ha−1·yr−1, respectively, indicating a consistent overestimation by the USLE model. This discrepancy primarily results from the persistent use of DEM-derived slope angles in model calculations, while field observations reveal a progressive slope gradient reduction over the study period. The USLE model is suitable for calculating the soil loss of ordinary slope land, and its value is too large when calculating the soil loss of slope farmland.
(2) Over the 30-year study period, slope gradients in farmland systems exhibited a natural reduction process, decreasing from 20° to 5° through progressive terrain modification. This gradient reduction is primarily driven by intensive anthropogenic activities, including tillage operations, manual hoeing, and grazing practices. These activities induce substantial soil displacement (15~29 cm·yr−1), which transports the soil from the top to the bottom of the slope.
(3) Currently, soil erosion within the Loess Plateau remains severe, with the majority of sediment originating predominantly from steep slopes terrain and gully systems. However, slope farmland, as a kind of slope land, is no longer an important source of sediment. The slope farmland in the Loess Plateau has had the terrace effect, the cultivated land tends to be gentle, and the soil loss is basically reduced.
In the past 30 years, slope farming in remote villages has maintained traditional farming practices. In the 1990s, slope farmland was an important source of soil loss in the Loess Plateau. However, in the 2020s, slope farmland was no longer the main source of soil loss in the Loess Plateau. Notably, without engineering interventions, slope farmland areas have naturally evolved into terrace-like formations over three decades, representing a unique geomorphological transformation.

Author Contributions

S.L.: Conceptualization, data curation, funding acquisition, investigation, methodology, visualization, writing—original draft; B.Z.: Data curation, investigation, visualization; H.W.: Visualization, writing—review and editing. R.L.: Data curation, visualization. P.W.: Data curation, visualization. All authors have read and agreed to the published version of the manuscript.

Funding

The primary funding for this study came via a grant from Science and Technology Plan Project of Inner Mongolia Autonomous Region (Grant number: 2023YFHH0004). Additional support was provided by the Talent Project of Inner Mongolia Autonomous Region (Grant number: DC2300001439). We thank Batugou village for providing us with the test site. Thank you to the local villagers for providing support for on-site investigation and measurement.

Institutional Review Board Statement

Not applicable.

Data Availability Statement

Data will be made available on request.

Conflicts of Interest

The authors declare that they have no known competing financial interests or personal relationships that could have appeared to influence the work reported in this study.

References

  1. Tang, B.; Jiao, J.; Zhang, Y.; Chen, Y.; Wang, N.; Bai, L. The Magnitude of soil erosion on hillslopes with different land use patterns under an extreme rainstorm on the Northern Loess Plateau, China. Soil Tillage Res. 2020, 204, 104716. [Google Scholar] [CrossRef]
  2. Chen, W.; Huang, Y.; Lebar, K.; Bezak, N. A systematic review of the incorrect use of an empirical equation for the estimation of the rainfall erosivity around the globe. Earth-Sci. Rev. 2023, 238, 104339. [Google Scholar] [CrossRef]
  3. Smith, R.; Goodrich, D.; Quinton, J. Dynamic, distributed simulation of watershed erosion: The Kineros2 and Eurosem Models. J. Soil Water Conserv. 1995, 50, 517–520. [Google Scholar] [CrossRef]
  4. Flanagan, D.; Ascough, J.; Nearing, M.; Laflen, J. The water erosion prediction project (WEPP) model. In Landscape Erosion and Evolution Modelling; Harmon, R., Doe, W., Eds.; Springer: New York, NY, USA, 2001; pp. 145–199. [Google Scholar]
  5. Kohrell, G.; Mulla, D.; Gelder, B. Calibration and validation of hillslope runoff and soil loss outputs from the Water Erosion Prediction Project model in Minnesota agricultural watersheds. J. Am. Water Resour. Assoc. 2023, 59, 1529–1548. [Google Scholar] [CrossRef]
  6. Morgan, R.; Quinton, J.; Smith, R.; Govers, G.; Poesen, J.; Auerswald, K.; Chisci, G.; Torri, D.; Styczen, M. The European soil erosion model (EUROSEM): A process-based approach for predicting soil loss from fields and small catchments. Earth Surf. Process. Landf. 1998, 23, 527–544. [Google Scholar] [CrossRef]
  7. De Roo, A.; Offermans, R.; Cremers, N. LISEM: A single-event, physically based hydrological and soil erosion model for drainage basins. II: Sensitivity analysis, validation and application. Hydrol. Process. 1996, 10, 1119–1126. [Google Scholar] [CrossRef]
  8. Pandey, S.; Kumar, P.; Zlatic, M.; Nautiyal, R.; Panwar, V. Recent advances in assessment of soil erosion vulnerability in a watershed. Int. Soil Water Conserv. Res. 2021, 9, 305–318. [Google Scholar] [CrossRef]
  9. Benavidez, R.; Jackson, B.; Maxwell, D.; Norton, K. A review of the (Revised) Universal Soil Loss Equation ((R)USLE): With a view to increasing its global applicability and improving soil loss estimates. Hydrol. Earth Syst. Sci. 2018, 22, 6059–6086. [Google Scholar] [CrossRef]
  10. Morgan, R. A Simple Approach to Soil Loss Prediction: A revised Morgan-Morgan-Finney model. CATENA 2001, 44, 305–322. [Google Scholar] [CrossRef]
  11. Rakhimova, M.; Zulpykharov, K.; Assylbekova, A.; Zhengissova, N.; Taukebayev, O. Using the revised universal soil loss equation and global climate models (CMIP6) to predict potential soil brosion associated with climate change in the Talas District. Kazakhstan. Sustainability 2024, 16, 574. [Google Scholar] [CrossRef]
  12. Li, Q.; Liu, G.; Zhang, Z.; Tuo, D.; Bai, R.; Qiao, F. Relative contribution of root physical enlacing and biochemistrical exudates to soil erosion resistance in the Loess soil. CATENA 2017, 153, 61–65. [Google Scholar] [CrossRef]
  13. Zhao, G.; Gao, P.; Tian, P.; Sun, W.; Hu, J.; Mu, X. Assessing sediment connectivity and soil erosion by water in a representative catchment on the Loess Plateau, China. CATENA 2020, 185, 104284. [Google Scholar] [CrossRef]
  14. Zhang, Y.; Li, P.; Liu, X.; Xiao, L.; Shi, P.; Zhao, B. Effects of farmland conversion on the stoichiometry of carbon, nitrogen, and phosphorus in soil aggregates on the Loess Plateau of China. Geoderma 2019, 351, 188–196. [Google Scholar] [CrossRef]
  15. Morbidelli, R.; Saltalippi, C.; Flammini, A.; Cifrodelli, M.; Corradini, C.; Govindaraju, R. Infiltration on sloping surfaces: Laboratory experimental evidence and implications for infiltration modeling. J. Hydrol. 2015, 523, 79–85. [Google Scholar] [CrossRef]
  16. Zhang, Y.; Li, P.; Liu, X.; Xiao, L. Changes in soil aggregate fractions, stability, and associated organic carbon and nitrogen in different land use types in the Loess Plateau, China. Sustainability 2022, 14, 3963. [Google Scholar] [CrossRef]
  17. Gaspar, L.; Quijano, L.; Lizaga, I.; Navas, A. Effects of land use on soil organic and inorganic C and N at 137Cs traced erosional and depositional sites in mountain agroecosystems. CATENA 2019, 181, 104058. [Google Scholar] [CrossRef]
  18. Dalzell, B.; Fissore, C.; Nater, E. Topography and land use impact erosion and soil organic carbon burial over decadal timescales. CATENA 2022, 218, 106578. [Google Scholar] [CrossRef]
  19. Naipal, V.; Reick, C.; Pongratz, J.; Van Oost, K. Improving the global applicability of the RUSLE model—Adjustment of the topographical and rainfall erosivity factors. Geosci. Model Dev. 2015, 8, 2893–2913. [Google Scholar] [CrossRef]
  20. Phinzi, K.; Ngetar, N. The Assessment of water-borne erosion at catchment level using GIS-Based RUSLE and remote Sensing: A review. Int. Soil Water Conserv. Res. 2019, 7, 27–46. [Google Scholar] [CrossRef]
  21. Li, S.; Li, C.; Yao, D.; Liu, C.; Zhang, Y. Multiscale nonlinear analysis of failure mechanism of loess-mudstone landslide. CATENA 2022, 213, 106188. [Google Scholar] [CrossRef]
  22. Sun, W.; Shao, Q.; Liu, J. Soil erosion and its response to the changes of precipitation and vegetation cover on the Loess Plateau. J. Geogr. Sci. 2013, 23, 1091–1106. [Google Scholar] [CrossRef]
  23. Zhao, G.; Mu, X.; Jiao, J.; An, Z.; Klik, A.; Wang, F.; Jiao, F.; Yue, X.; Gao, P.; Sun, W. Evidence and causes of spatiotemporal changes in runoff and sediment yield on the chinese loess plateau. Land Degrad. Dev. 2017, 28, 579–590. [Google Scholar] [CrossRef]
  24. Bagherzadeh, A. Estimation of soil losses by USLE model using GIS at Mashhad plain, Northeast of Iran. Arab. J. Geosci. 2014, 7, 211–220. [Google Scholar] [CrossRef]
  25. Das, S.; Deb, P.; Bora, P.; Katre, P. Comparison of RUSLE and MMF soil loss models and evaluation of catchment scale best management Practices for a Mountainous Watershed in India. Sustainability 2020, 13, 232. [Google Scholar] [CrossRef]
  26. Qu, L.; Liu, Y.; Li, Y.; Wang, J.; Yang, F.; Wang, Y. Sustainable use of gully agricultural land and water resources for sustainable development goals: A case study in the loess plateau of China. Land Degrad. Dev. 2023, 34, 4935–4949. [Google Scholar] [CrossRef]
  27. Yan, R.; Zhang, X.; Yan, S.; Chen, H. Estimating soil erosion response to land use/cover change in a catchment of the Loess Plateau, China. Int. Soil Water Conserv. Res. 2018, 6, 13–22. [Google Scholar] [CrossRef]
  28. Panagos, P.; Borrelli, P.; Meusburger, K.; Yu, B.; Klik, A.; Lim, K.; Yang, J.; Ni, J.; Miao, C.; Chattopadhyay, N.; et al. Global rainfall erosivity assessment based on high-temporal resolution rainfall records. Sci. Rep. 2017, 7, 4175. [Google Scholar] [CrossRef]
  29. Li, L.; Wang, Y.; Liu, C. Effects of land use changes on soil erosion in a fast developing area. Int. J. Environ. Sci. Technol. 2014, 11, 1549–1562. [Google Scholar] [CrossRef]
  30. Chen, L.; Qian, X.; Shi, Y. Critical area ldentification of potential soil loss in a typical watershed of the three gorges reservoir region. Water Resour. Manag. 2011, 25, 3445–3463. [Google Scholar] [CrossRef]
  31. Zhou, S.; Li, P.; Zhang, Y.; Zhang, N.; Cao, Y. Formation of new erosion-deposition patterns after farmland conversion: The major role of topography. CATENA 2023, 231, 107349. [Google Scholar] [CrossRef]
  32. Ozsoy, G.; Aksoy, E.; Dirim, M.; Tumsavas, Z. Determination of soil erosion risk in the Mustafakemalpasa river basin, Turkey, using the revised universal soil loss equation, geographic information system, and remote sensing. Environ. Manag. 2012, 50, 679–694. [Google Scholar] [CrossRef] [PubMed]
  33. Wang, C.; Fu, X.; Wang, B.; Gong, Z.; Zhang, G.; Wang, X. Modeling feedback processes between soil detachment and sediment transport along hillslopes on the Loess Plateau of China. Sci. Total Environ. 2023, 901, 166032. [Google Scholar] [CrossRef] [PubMed]
  34. Morgan, R. Soil Erosion and Conservation; Cranfield University, National Soil Resources Institute: Cranfield, UK, 2005. [Google Scholar]
  35. Kulikov, M.; Schickhoff, U.; Borchardt, P. Spatial and seasonal dynamics of soil loss ratio in mountain rangelands of south-western Kyrgyzstan. J. Mt. Sci. 2016, 13, 316–329. [Google Scholar] [CrossRef]
  36. Liu, M.; Li, P.; Liu, M.; Wang, J.; Chang, Q. The trend of soil organic carbon fractions related to thesuccessions of different vegetation types on the tableland of the loess plateau of China. J. Soils Sediments 2020, 21, 203–214. [Google Scholar] [CrossRef]
  37. Luo, J.; Zheng, Z.; Li, T.; He, S.; Zhang, X.; Huang, H.; Wang, Y. Quantifying the contributions of soil surface microtopography and sediment concentration to rill erosion. Sci. Total Environ. 2021, 752, 141886. [Google Scholar] [CrossRef]
  38. Sadeghi, S.; Harchegani, M.; Asadi, H. Variability of particle size distributions of upward/downward splashed materials in different rainfall intensities and slopes. Geoderma 2017, 290, 100–106. [Google Scholar] [CrossRef]
Figure 1. Map of the research region in the Batugou Village, Qingshuihe County, Hohhot City, Inner Mongolia Autonomous Region, China.
Agriculture 15 01084 g001
Figure 2. Spatial distribution of soil loss monitoring sites in slope farmland systems. (a) Geomorphological features and cultivated land distribution patterns in slope farmland; (b) Cross-sectional Topographic profile across the slope farmland study area. The area surrounded by the purple line is slope farmland, the area surrounded by the dark blue line is woodland, the light blue line represents the stream, and the red rectangle represents our experimental area, the red five-pointed star represents the village.
Agriculture 15 01084 g002
Figure 3. The soil profile characteristics of slope farmland systems in the study area are characterized by typical yellow loamy soil with distinct horizon differentiation.
Agriculture 15 01084 g003
Figure 4. Morphological evolution of typical sloping farmland profiles under traditional farming practices over a 30-year period. (a) Cross-sectional geometry of representative slope farmland in the initial period (1990s), showing characteristic steep gradients; (b) Modified cross-sectional profile after three decades of agricultural activities (2020s), demonstrating significant flattening.
Agriculture 15 01084 g004
Figure 5. Comparison of theoretical calculation, measured, and predicted soil erosion rates in slope farmland systems under long-term period.
Agriculture 15 01084 g005
Figure 6. Schematic illustration of the mechanical processes governing slope gradient reduction in slope farmland (excluding rainfall-induced erosion effects). (a) Cross-sectional representation of initial slope farmland morphology; (b) Cross-sectional representation of slope farmland morphology following 30-year terrain modification.
Agriculture 15 01084 g006
Figure 7. The local crops with highest frequency planting over the past three decades. (af) illustrate the relative planting frequency of major local crops in descending order (maize, foxtail millet, sunflower, soybean, broomcorn millet, and sorghum).
Agriculture 15 01084 g007
Figure 8. Traditional hoeing practices have significantly modified the microtopography of slope farmland systems, resulting in the development of distinctive serrated microrelief patterns.
Agriculture 15 01084 g008
Figure 9. Spatial distribution patterns of soil properties along the slope gradient and associated dynamics of water and organic matter transport in slope farmland systems.
Agriculture 15 01084 g009
Table 1. The K factor values derived from Zhou et al. [31] for different soil textures classes across the Loess Plateau region.
NO.Province K Factor (t·ha·h·ha−1·MJ−1·mm−1)
Mean ValueMaximum ValueMinimum Value
1Shanxi0.0400.0450.010
2Shaanxi0.0360.0450.010
3Henan0.0370.0450.021
4Inner Mongolia0.0290.0450.012
5Ningxia0.0350.0450.010
6Gansu0.0390.0450.010
7Qinghai0.0370.0450.010
Table 2. Representative examples illustrating the crop management factor ( C factor) values and their applications as documented by Morgan [34].
CropNo.Management C Factor
Maize, Sorghum, Millet1High productivity; conventional tillage0.20~0.55
2Low productivity; conventional tillage0.50~0.90
3High productivity; chisel ploughing into residue0.12~0.20
4Low productivity; chisel ploughing into residue0.30~0.45
5High productivity; no or minimum tillage0.02~0.10
Table 3. Different types of agricultural management practices for P factors.
No.Land Type P Factor
1Cultivated land0.35
2Shrubs0.75
3Forest land0.80
4Grassland0.90
5Bare land1.00
Table 4. Fundamental physicochemical properties of yellow loamy soils present in the study area.
Soil Bulk Density
(g/cm3)
Moisture Content
(%)
Porosity
(%)
Matter Content
(g/kg)
PHParticle Size Composition of Yellow Loamy Soil
Sand
(0.02~2 mm)
Silt
(0.002~0.02 mm)
Clay
(<0.002 mm)
1.3512.3046.2010.608.1066.2030.503.30
Table 5. Input parameters of the USLE model and the observed data.
Index A Factor R Factor K Factor L Factor S Factor C Factor P
Calculated value (20°)62.48523.740.0296.006.530.300.35
Calculated value (5°)6.50523.740.0294.200.970.300.35
Measured value (average value)45.67------
Disclaimer/Publisher’s Note: The statements, opinions and data contained in all publications are solely those of the individual author(s) and contributor(s) and not of MDPI and/or the editor(s). MDPI and/or the editor(s) disclaim responsibility for any injury to people or property resulting from any ideas, methods, instructions or products referred to in the content.

