Article

Exploiting Chestnut Biochar as a Functional and Circular Ingredient in Weaned Piglet Diets

1
Department of Veterinary Medicine and Animal Sciences—DIVAS, University of Milano, 26900 Lodi, Italy
2
Department of Biosciences, University of Milano, 20133 Milano, Italy
3
Department of Agricultural and Environmental Sciences-Production Landscape and Agroenergy, University of Milano, 20133 Milano, Italy
*
Author to whom correspondence should be addressed.
Agriculture 2025, 15(10), 1082; https://doi.org/10.3390/agriculture15101082 (registering DOI)
Submission received: 26 March 2025 / Revised: 11 May 2025 / Accepted: 15 May 2025 / Published: 17 May 2025
(This article belongs to the Section Farm Animal Production)

Abstract

:
Background: Achieving sustainable development in accordance with Agenda 2030 (Sustainable Development Goals 12, 13, and 17) has challenged the livestock sector and especially swine farming. Strategies focused on reducing the environmental impact and improving feed efficiency have therefore been explored. Due to its beneficial properties, the application of biochar represents an interesting solution. This study therefore evaluates the effects of biochar supplementation on growth performance and health parameters in weaned piglets. Methods: A total of 223 piglets were divided into two experimental groups: the control (CTRL) group and the treatment (TRT group). The experiment involved two dietary treatments: the CTRL group was fed a standard diet, while the TRT group was fed the same diet supplemented with 1% chestnut biochar. Weekly measurements included body weight, feed intake, and fecal scores. Fecal samples were collected for microbiological analysis and evaluation of digestibility. Results: No significant differences were observed between the groups in terms of the principal zootechnical parameters. The TRT group showed lower E. coli counts in feces at 14 days and a significant decrease in diarrhea frequency at 28 days (32.14% CTRL vs. 3.23% TRT; p = 0.009). Protein digestibility was higher in the TRT group (79.5 ± 1.74%) compared to the CTRL group (75.0 ± 2.05%; p = 0.004). Additionally, the TRT group had significantly lower levels of derivates of reactive oxygen metabolites than the CTRL group (293.44 ± 59.28 vs. 553.98 ± 61.59 Carratelli units p ≤ 0.001). Conclusions: The inclusion of 1% biochar in the diets of post-weaning piglets can improve the health status of the animals. Biochar could thus be used as a valuable functional ingredient within an innovative nutritional strategy aimed at the management of gastrointestinal problems during the weaning period.

1. Introduction

The livestock sector is essential for global food security and livelihood support. The focus has recently shifted from fostering sustainable production per se to increasing the contribution of the zootechnical sector in order to achieve the Sustainable Development Goals (SDGs) of the UN 2030 Agenda for Sustainable Development [1,2]. Within this framework, the swine industry is faced with critical challenges, including reducing antibiotic use, improving animal welfare, and adopting environmentally friendly practices, which align with the broader goal of minimizing environmental impacts and optimizing resource efficiency in agricultural systems [3,4,5]. In this context, biochar, a vegetable charcoal, has gained increasing interest. It is a carbon-rich material, produced via biomass pyrolysis at temperatures between 360 °C and 1000 °C at low oxygen levels. Biochar has unique characteristics that make it an interesting candidate for integration within sustainable agro-zootechnical practices [6].
Biochar is known for its high porosity, which depends on the feedstock used and the conditions of the pyrolysis process, thus providing high adsorptive capacities and making it an effective material for various applications [7]. In the environmental sector, biochar improves soil fertility and biodiversity and increases the number of beneficial microbial communities [8]. Other effects, such as carbon sequestration, improved resource efficiency, and its connection to renewable energy, including soil remediation, make biochar an emerging agricultural product [9,10].
Biochar also has the potential for incorporation within livestock feeding systems, thus promoting animal health and improving nutrient use [11]. The mechanisms underlying these benefits are linked to the material’s adsorption properties, which help detoxify mycotoxins in feed, regulate plant-produced toxins, bind pollutants, and increase beneficial microbial populations in the animals’ gastrointestinal tract [12,13].
However, the current literature indicates that more research is needed to assess the effectiveness of biochar in animal production, as existing studies are limited or show conflicting results. While oral charcoal has been recognized for centuries as a potent adsorbent for treating acute poisoning and enteric disorders in both humans and animals, its use as a functional dietary ingredient—administered daily at lower doses compared to therapeutic treatments—remains largely unexplored [14]. Although biochar has been included in the European Catalogue of Feed Materials since 2011, and it is recognized as a permissible feed ingredient under the category of “vegetal carbon” [15], its full effects on animal health have still not been explored. The main aim of this study was thus to evaluate the effects of the inclusion of chestnut biochar, following its chemical and morphological characterization, in weaned piglet diets. The weaning phase is a critical period marked by increased antibiotic use and challenges to gut health and performance.
Biochar thus provides a key opportunity to explore alternative solutions that promote health, improve diet efficiency, and improve sustainability in livestock production [16]. After characterizing its chemical and morphological properties, the aim was to assess the impact of chestnut biochar included in the diets of weaned piglets on growth performance, intestinal health, and diet digestibility. The results could thus have potential implications for reducing the reliance on antibiotics and improving the environmental sustainability of production systems.

2. Materials and Methods

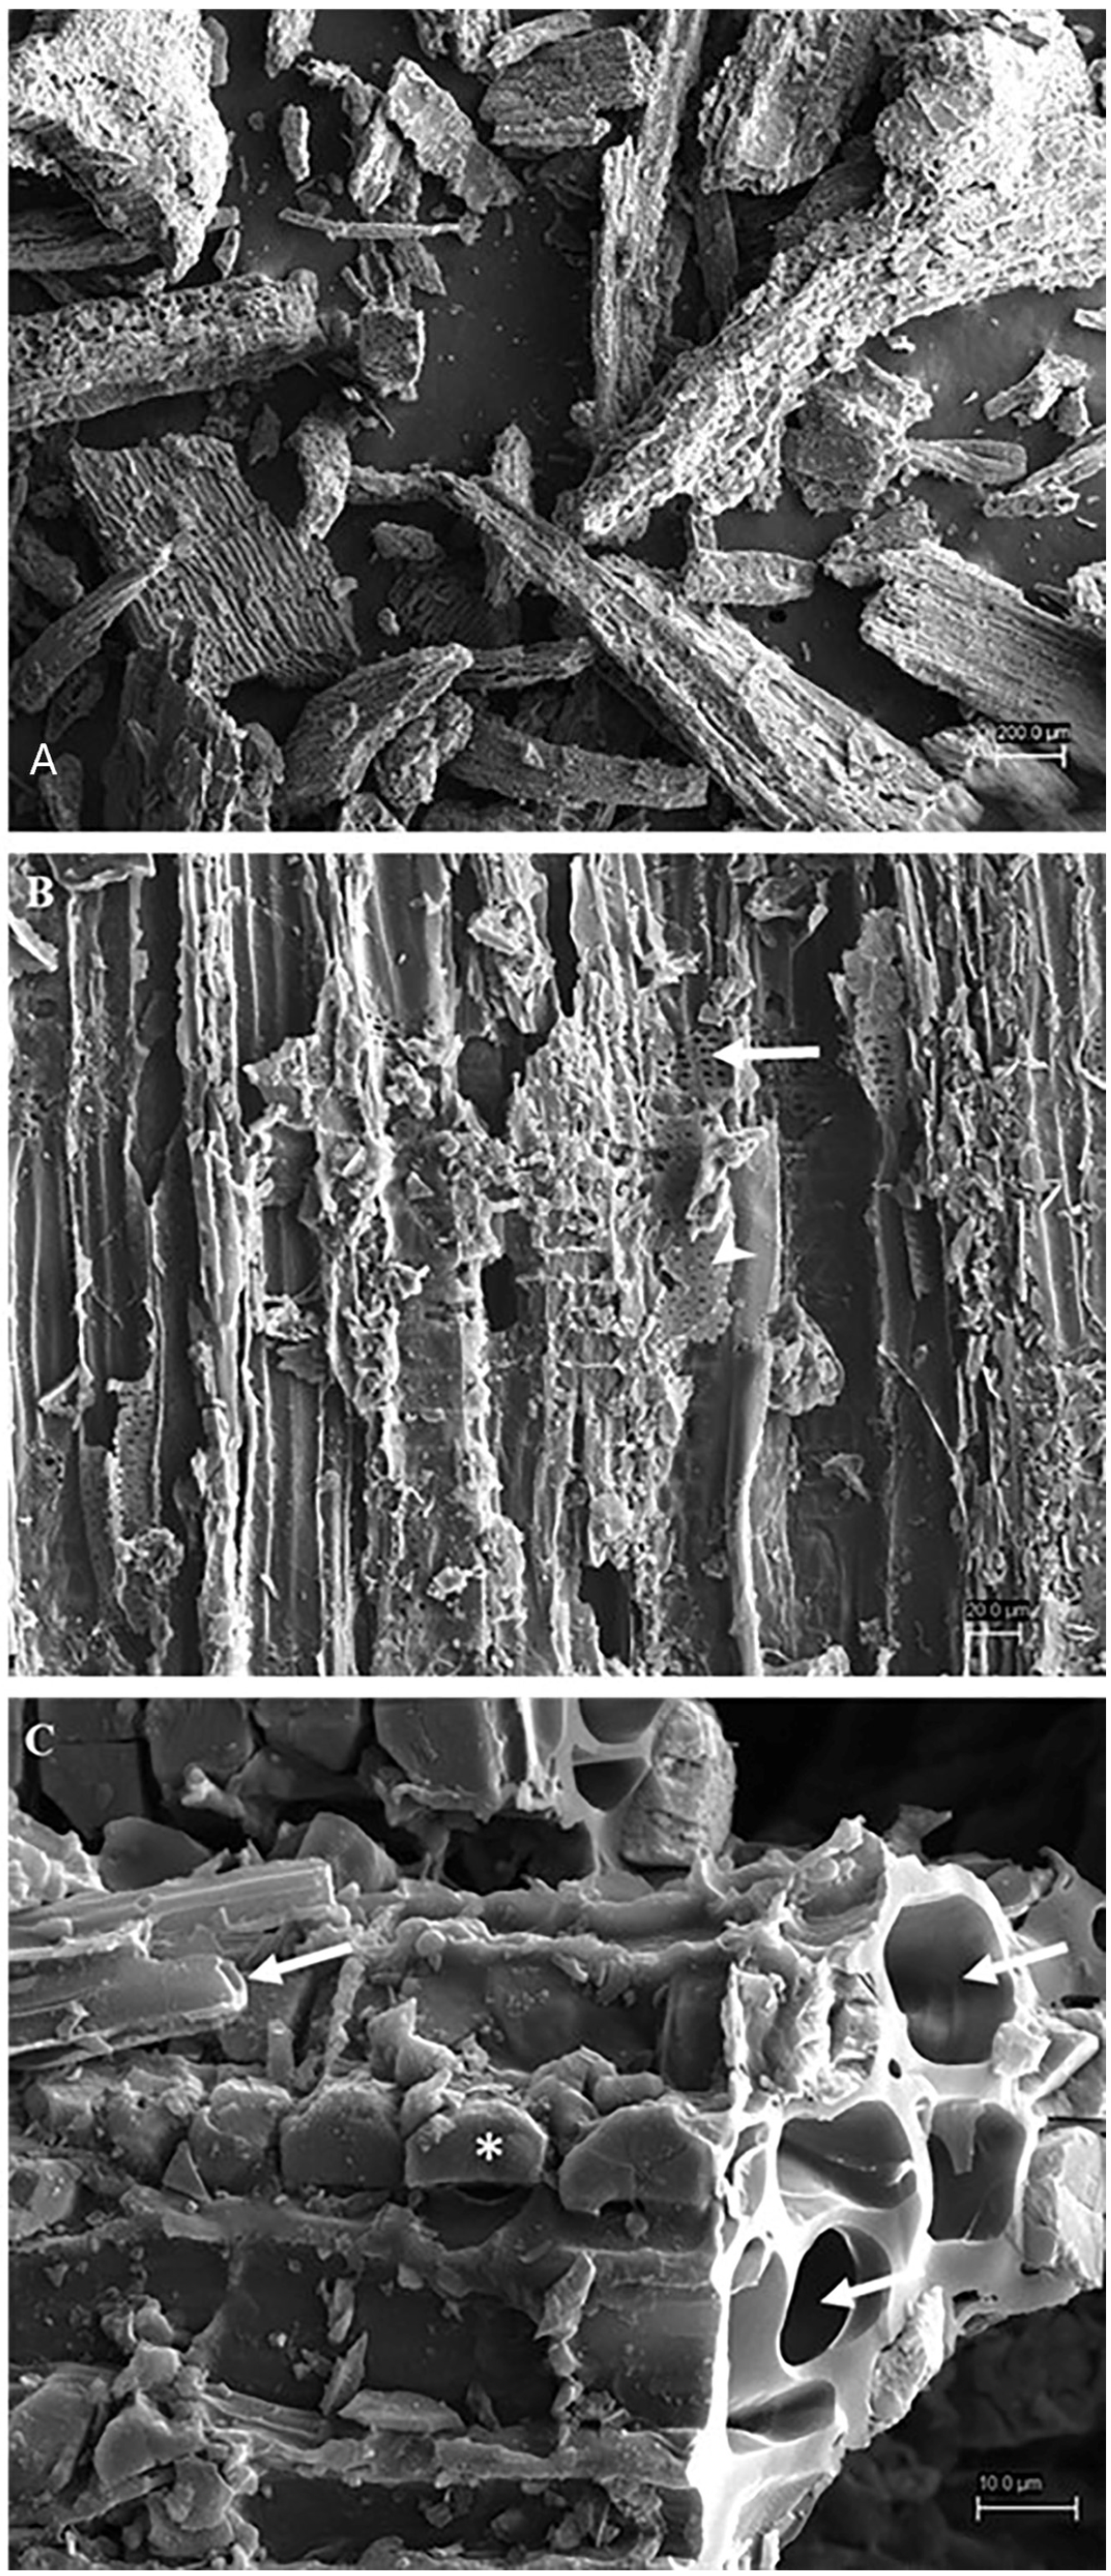
2.1. Chemical and Electron Microscopy Characterization of Chestnut Biochar

Chestnut biochar samples (NeraBiochar, Torino, Italy) were analyzed by standard procedures following the “Official Methods of Analysis” of AOAC International [17]. Specifically, dry matter (DM) was determined by drying samples in a forced-air oven at 65 °C for twenty-four hours (AOAC method 930.15). Ash content was measured by incinerating the samples in a muffle furnace at 550 °C for three hours (method 942.05). Crude fiber (CF) was analyzed using the filter bag method (AOCS method Ba 6a-05). Crude protein (CP) content was determined by the Kjeldahl method (AOAC method 2001.11), and ether extract (EE) was quantified using ether extraction with a Soxhlet apparatus (AOAC method 2003.05). All analyses were conducted in triplicate.
The mineral content was measured by ICP-MS analysis (BRUKER Aurora-M90 ICP-MS; Bruker, Billerica, MA, USA) [18]. Briefly, the mineral composition of the samples was calculated using calibration curves for the following elements: Na, Mg, Al, K, Ca, Cr, Mn, Fe, Co, Ni, Cu, Zn, As, Se, Mo, Cd, Pb, and P. To check the nebulization performance, an aliquot of 2 mg/L of a standard solution (72Ge, 89Y, 159Tb) was added to the samples up to a final concentration of 20 µg/L. To reduce polyatomic interferences, a collision–reaction interface was used with a H2 flow rate of 80 mL/min through the skimmer cone.
Morphological analysis was performed using a field emission scanning electron microscope (FE-SEM Sigma Zeiss, Zeiss, Oberkochen, Germany). Biochar samples were directly placed on the stub, sputtered with carbon, and observed at 8 kV and a 5 mm working distance.
The pH was determined with a pH meter (Thermo Fisher Scientific, Waltham, MA, USA) in a biochar:water solution ratio of 1:10.

2.2. Animal Housing and Experimental Design

The experimental design was given ethical approval by the Animal Welfare Organization of the University of Milan (OPBA authorization no. 5_2024) in accordance with Italian regulations (D.lgs 26/2014) and European regulations (Dir. EU 63/2010). In this study, a total of 223 weaned piglets (Italian Landrace x Italian Large White, age 28 ± 2 days) were identified individually by ear tags and housed in the same environmental conditions in a 15-pen room (temperature 26–28 °C, 55–60% relative humidity) on a commercial farm (Brescia, Italy) for 28 days of the trial after a 7-day adaptation period, during which the piglets were fed with basal diet used for the trial. The animals (average body weight: 9.42 ± 1.29 kg) were divided into two experimental groups using stratified randomization (balanced per weight and sex between groups and pens): the control group (CTRL; n = 107, 7 pens, 13–15 pigs/pen) was fed a completely balanced diet, and the treatment group (TRT; n = 116, 8 pens, 13–15 pigs/pen) was fed the same diet as the CTRL group supplemented with 1% biochar. Both diets (Table 1) were formulated using Brill® Formulation Software v.1.36.17 to meet the nutritional requirements of piglets according to NRC (2012) guidelines for all nutrients, except for crude protein, which was intentionally reduced in line with current nutritional strategies aimed at improving gut health and reducing environmental nitrogen emission [19]. The diets were produced and provided by Famavit S.p.A. (Brescia, Italy) in pellet form. The experimental diets were isonitrogenous and nutritionally equivalent in energy content. The experimental diets had a balanced composition, and biochar supplementation did not affect the nutrient content of the feed. Chemical analysis of the diets confirmed that their composition met the calculated values for protein and energy content. No differences were observed in any of the parameters evaluated of the CTRL and TRT diets (Table 1).

2.3. Sample Collection

Individual fecal samples (four samples per pen) were collected from the rectal ampulla on days 0 (d0), 14 (d14), and 28 (d28) for microbiological analysis and for nutrient digestibility on d0 and d28. Fecal samples were maintained at 4 °C from the moment of collection until their arrival at the laboratory, where they were then frozen at −20 °C until further processing.
At time points d0 and d28, blood samples were collected from the jugular vein of four randomly selected piglets per pen, using vacuum tubes without anticoagulants. The samples were stored at 4 °C from the time of collection until arrival at the laboratory, where they were centrifuged at 3000 × g for fifteen minutes, and the serum was collected and frozen at −80 °C until the immunoenzymatic assays were carried out. The feed and the fecal samples were subjected to analysis for the principal nutritional content, namely dry matter (DM), crude protein (CP), crude fiber (CF), ether extract (EE), and ash, as previously described. The organic matter (OM) was calculated as the 100-ash content.

2.4. Zootechnical Performance and Diarrhea Frequency

The body weight of each animal was measured weekly (days 0, 7, 14, 21, and 28). Feed consumption was monitored weekly for each pen (experimental unit for feed intake) by measuring the residual feed in each tray. The average daily gain (ADG), average daily feed intake (ADFI), and feed conversion ratio (FCR) were then calculated, maintaining the pen as the experimental unit. Regarding the collection of fecal samples for microbiological analysis, sampling was performed on 4 animals per pen, for a total of 28 animals for the CTRL group and 32 animals for the TRT group. The fecal consistency was evaluated individually by fecal scoring using a four-level scale (score 0–3) according to Rossi et al. (2014) [20]. The scoring system for the feces was as follows: 0 = firm and well-formed; 1 = soft and formed; 2 = mild diarrhea with fluid; 3 = severe diarrhea with watery and projectile feces. A fecal score of 0 or 1 was considered physiological, while a score of 2 or 3 was classified as pathological and indicated the presence of diarrhea. The frequency of diarrhea was calculated as the percentage of animals with signs of diarrhea divided by the total number of observations during the considered period (diarrhea frequency = No of feces with scores 2 and 3/total number of observations; moderate diarrhea frequency = No of feces with score 2/total number of observations; severe diarrhea frequency = No of feces with score 3/total number of observations).

2.5. Microbiological Analysis of Fecal Samples and pH Determination

One gram of each fecal sample was homogenized with 9 mL of sterile physiological solution and centrifuged (1500× g for 5 min at room temperature) to collect the supernatant. Samples were progressively diluted to 10−10 and then plated in three replicates in Petri dishes on selective media to detect total, lactic acid, and coliform bacteria. Plate count agar (PCA, Liofilchem, Teramo, Italy) was used for the enumeration of total bacteria, with an incubation time of 72 h at 30 °C. De Man, Rogosa, and Sharpe agar (MRSA, Liofilchem, Teramo, Italy) was used as the selective medium for the enumeration of lactic acid bacteria with an incubation time of 72 h at 30 °C under microaerophilic conditions. Violet red bile lactose agar (VRBLA, Liofilchem, Teramo, Italy) was used as the selective medium for the enumeration of coliform bacteria for 24 h at 35 °C. The pH was determined by a pH meter (Thermo Fisher Scientific, Waltham, MA, USA) at a dilution of 1:1 in a physiological solution.

2.6. Apparent Total Tract Digestibility of Principal Nutrients

Apparent total tract digestibility (ATTD) was calculated using acid-insoluble ash (AIA) methods [21]. Briefly, acid-insoluble ash contents in diets and feces were determined gravimetrically after drying, ashing, boiling the ashes in hydrochloric acid (HCl, 3N for 15 min), filtering (Whatman 41, Cytiva, Pall Corporation, New York, NY, USA) and washing the hot hydrolysate, and re-ashing. The apparent total digestibilities of the protein, fiber, and fat were calculated according to the following equation:
A T T D   o f   n u t r i e n t s   % = 100 A I A d i e t × N u t r i e n t f e c e s A I A f e c e s × N u t r i e n t s d i e t s × 100

2.7. Mineral Content of Feces

The macro- and micromineral content of feces was measured by ICP-MS analysis (BRUKER Aurora-M90 ICP-MS, Bruker, Billerica, MA, USA), as previously described in Section 2.1.

2.8. Evaluation of Antioxidant Barrier in Serum Samples

Serum samples from days 0 and 28 were analyzed by derivatives of reactive oxygen metabolites (d-ROMs) tests (Diacron Srl, Grosseto, Italy), as a marker of oxidative stress in the animal, according to the manufacturer’s guidelines. The absorbance was measured at 546 nm (V630, UV–Vis, Jasco GmbH, Pfungstadt, Germany), and results were calculated using a standard curve and expressed in Carratelli units (UCARR), where one UCARR corresponds to 0.8 mg/L of hydrogen peroxide. To assess the balance between oxidative damage and the blood antioxidant barrier, the serum samples were also analyzed by the OXY-adsorbent test (Diacron Srl, Grosseto, Italy) following the manufacturer’s guidelines. The absorbance was measured at 546 nm (V630, UV–Vis, Jasco GmBH, Pfungstadt, Germany). The OXY-adsorbent test indicates the ability of serum to neutralize free radicals, and the results were calculated as μmol HClO/mL which represents the equivalent capacity to neutralize a specific oxidant (hypochlorous acid) using a standard curve.

2.9. Statistical Analysis

The statistical analysis was performed using GraphPad (Version 9.0). An individual pig was used as the experimental unit for the evaluation of body weight and ADG and serum and microbiological parameters, while pen was considered as the experimental unit for ADFI and FCR. Data were preliminarily tested for normal distribution using the Shapiro–Wilk test. A mixed model including the effect of time (considered as fixed factor), treatment, and their interaction (treatment x time) was used to analyze the results. Post hoc comparisons were then performed using Tukey’s test. To evaluate the incidence of diarrhea, data were transformed into a dichotomous variable for each category (presence/absence of diarrhea; presence/absence of moderate diarrhea; presence/absence of severe diarrhea) and therefore the chi-squared test was used to consider the effect of the diet. The covariate matrix of the fecal mineral content and of the data related to serum oxidative status and antioxidant barrier was used for the MIXED procedure of SAS software (Version 29.01.0) to correct for the initial variability. The treatment effect was also evaluated to highlight differences between groups at day 28. Differences between means or medians were considered statistically different when p ≤ 0.05.

3. Results

3.1. Characterization of Chestnut Biochar Using Chemical and Electron Microscopy

Analysis of the biochar showed a DM content of 59.83 ± 0.94% (Table 2). The ash content was evaluated using ICP-MS. The results highlighted a variety of profiles of both macro- and microminerals, including important nutrients (such as Mg, K, and Ca) as well as traces of contaminants such as heavy metals. The biochar pH was alkaline (pH = 8.25 ± 0.32).
Scanning electron microscopy (SEM) is commonly used to assess the physical morphology of solid substances. SEM micrographs revealed that this biochar showed porosity due to the original tubular structures in the plant cell materials (Figure 1). The biochar samples presented only large fragments of plant material, not less than 100 µm for their minor axis, which were mainly formed of wood samples (Figure 1A). High magnification showed xylem vessels and fibers and large surfaces as the samples were large in dimension and essentially formed by empty tubes (Figure 1C arrows). Vessels showed larger pits at the ray/vessel junction or smaller pits along the vessel longitudinal wall (Figure 1B arrow and arrowhead, respectively). Radial parenchyma appeared to be formed by well-preserved cells (Figure 1, asterisk). The cytological characters were consistent with those of Castanea sativa wood, in particular the presence and distribution of pits and simple perforation in the tracheids (Figure 1A,B). Fragments of different wood types were very occasionally observed, which belonged to gymnosperm plants. In fact, fiber tracheids with a homogeneous diameter (Figure S1C–F) and areolate pits in longitudinal cell walls were observed (Figure S1D,F arrows). Vessels presented different pits in the ray–vessel intersections: pits were taxodioid as in Picea (Figure S1F; arrowhead) or large cupressoids (Figure S1D; arrowhead). In the vessels with cupressoid pits, spiral thickening of the cell walls was also observed, which suggested that the fragment belonged to the genus Taxus (Figure S1C,D).

3.2. Growth Performance

The feed intake in the pens and individual body weight showed a consistent increase throughout the trial in both groups. Both groups exhibited similar BWs at different sampling time points and comparable ADG throughout the entire trial period. Additionally, no statistically significant differences were observed for ADFI or FCR during the 28 days of the trial (Table 3).

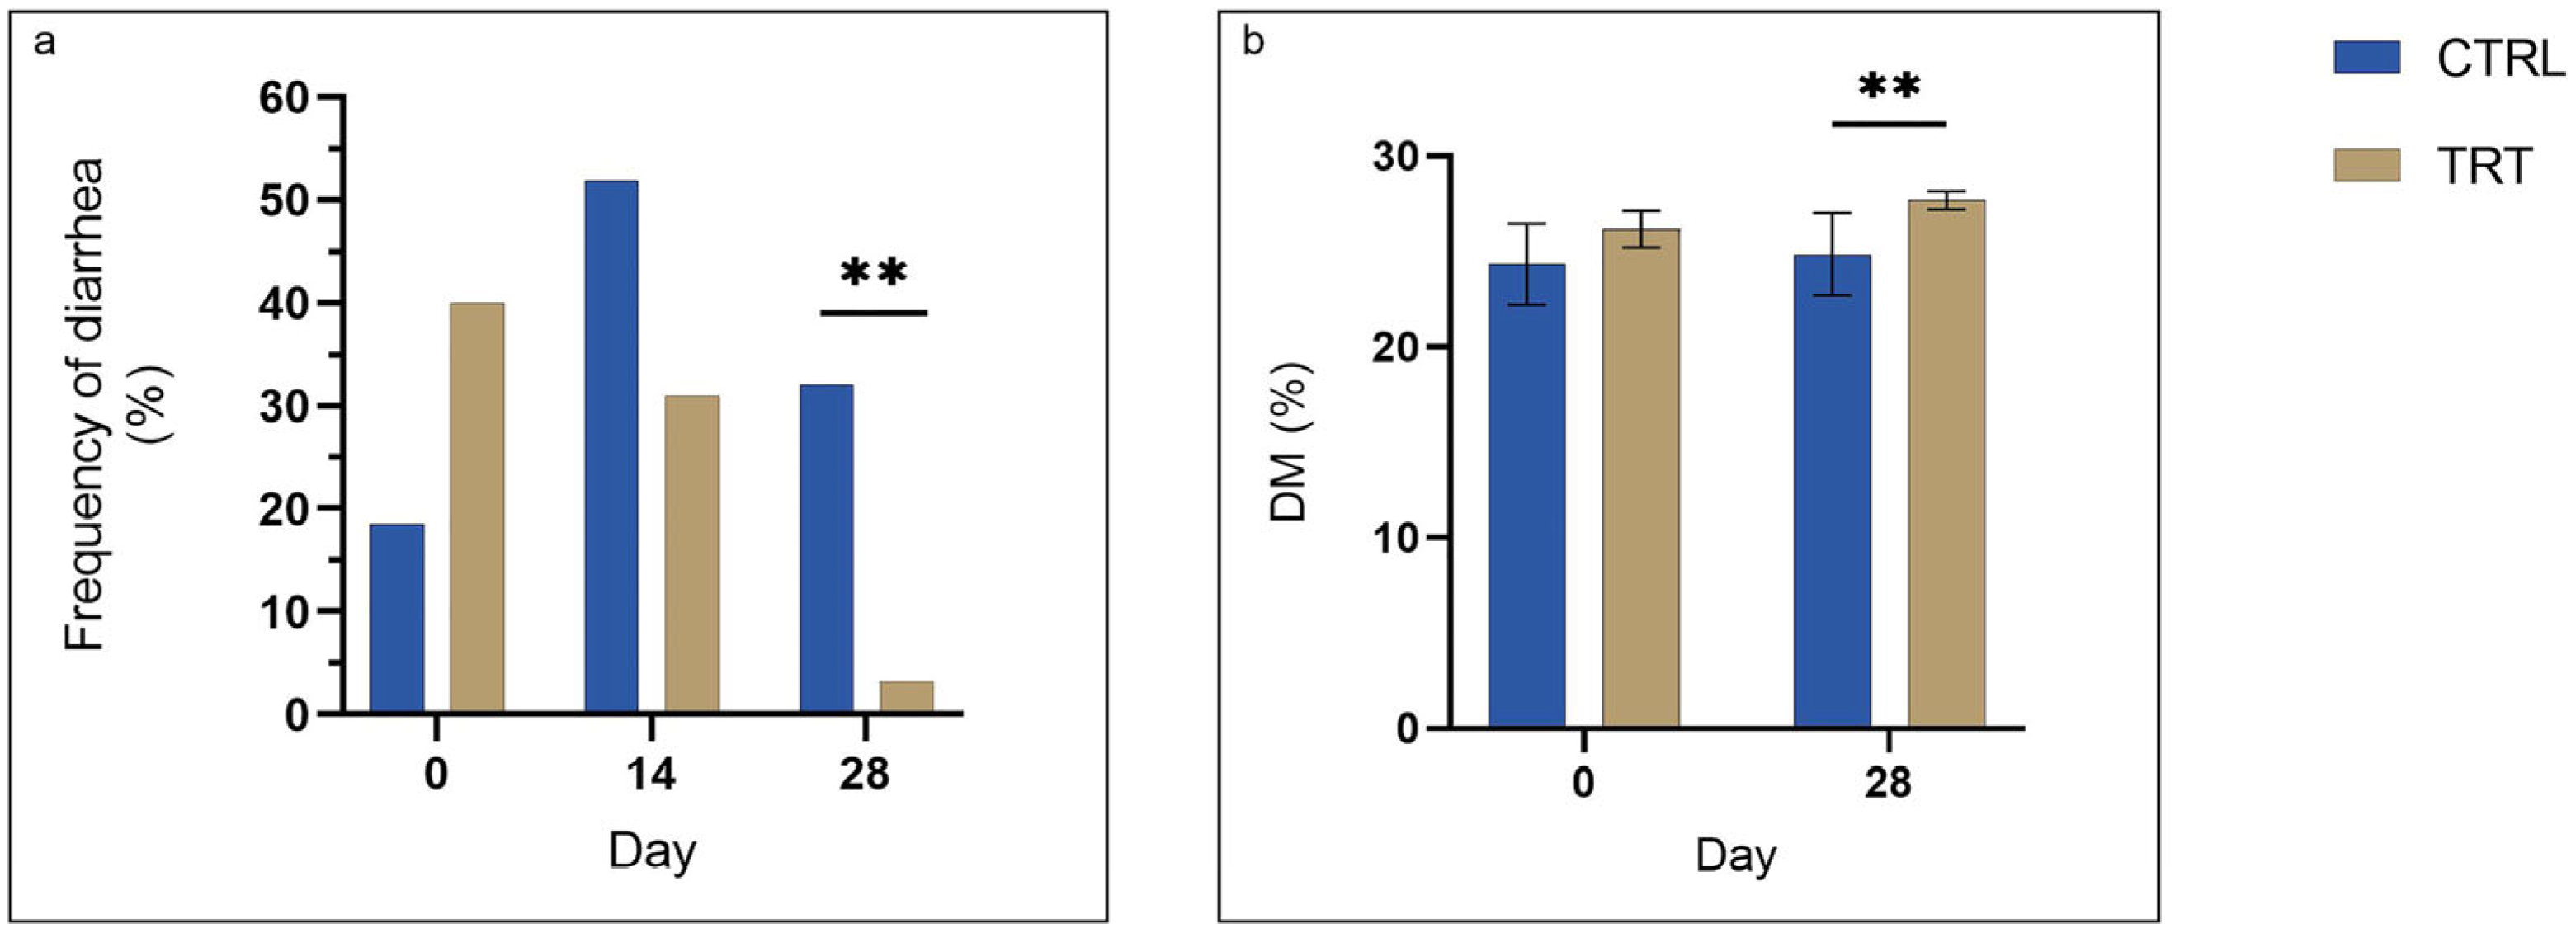
3.3. Diarrhea Frequency and Fecal Consistency

The treatment group showed a significantly lower frequency of diarrhea on day 28 (p = 0.009) despite no differences being observed at the previous time points (Figure 2a). However, the fecal dry matter content in the treatment group was significantly higher than in the control group on day 28 (p = 0.0114) (Figure 2b).

3.4. Microbiological Analysis of Fecal Samples

The total bacterial count did not significantly differ from the total bacterial count throughout the study. On day 14 (d14), although the interaction effect showed only a tendency toward significance (p = 0.079), the number of coliforms in the TRT group was significantly lower than in the CTRL group after the post hoc comparisons (p = 0.030). The number of LAB was significantly higher than in the CTRL group at day 14 (p = 0.0366) (Table 4). The increased number of LAB on day 14 and the decrease in coliform bacteria were reflected in the LAB/Enterobacteriaceae ratio which was higher than 2.

3.5. Nutrient Digestibility and Fecal Mineral Content

The digestibility of organic matter (OM) demonstrated an overall increase at day 28 in both experimental groups (Table 5, p = 0.03). It is worth noting that there was an increase in CP digestibility during the trial in the TRT group compared to the CTRL group (p = 0.005). In addition, the mineral content in feces at day 28 (d28) was evaluated, which showed that the mineral excretion did not change significantly between the two experimental groups, following supplementation with biochar (Table 6).

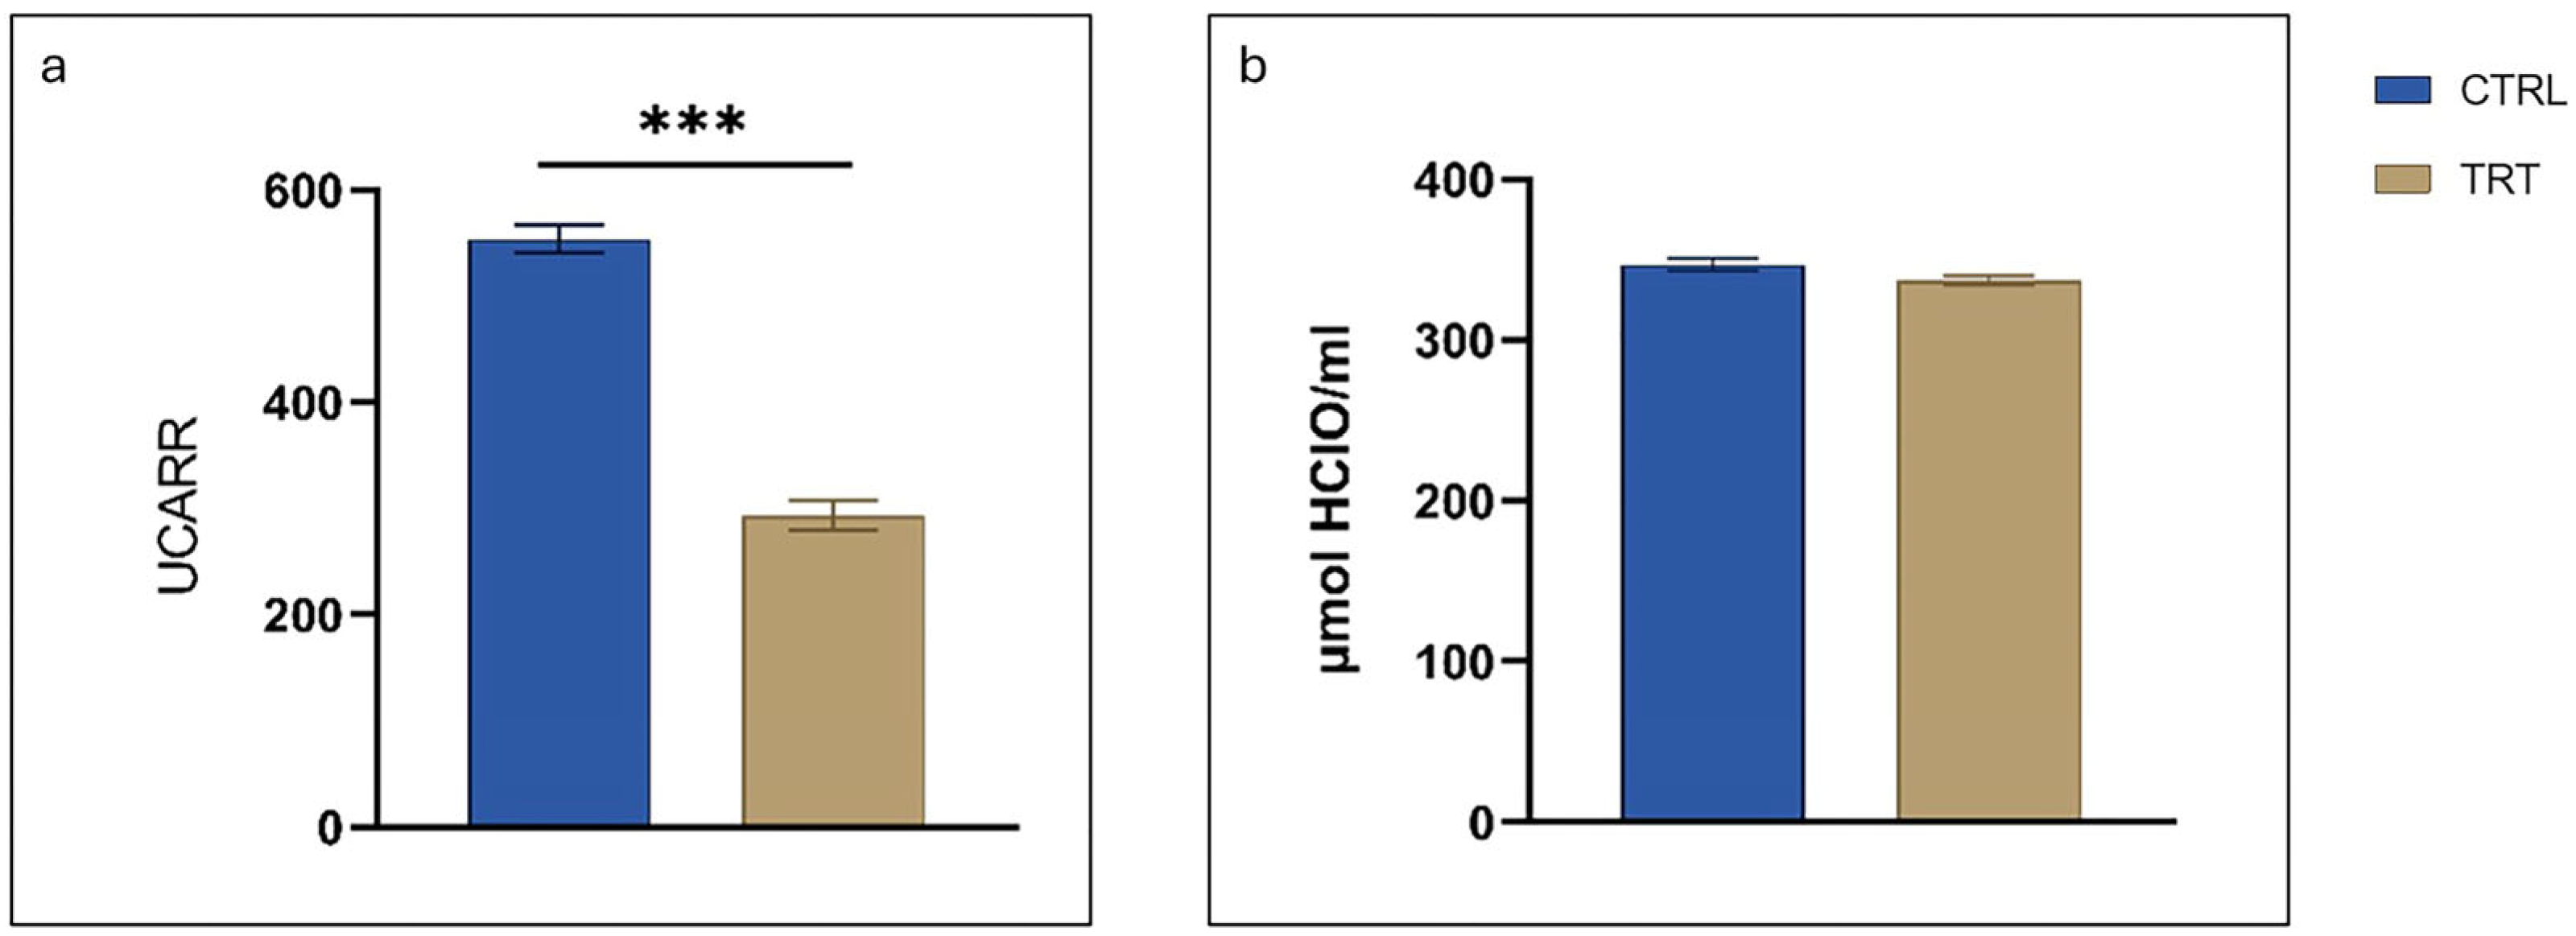
3.6. Serum Oxidative Status and Antioxidant Barrier

The treated group presented a significantly lower level of d-ROMs in serum at the end of the trial (d28) compared with the CTRL group (293.44 ± 59.28 and 553.98 ± 61.59 UCARR, respectively) (Figure 3a). In contrast, the OXY-adsorbent test showed no statistically significant differences between the groups at day 28 (d28) (346.91 ± 18.14 and 336.98 ± 15.74 µmol HClO/mL for the CTRL and TRT groups, respectively) (Figure 3b).

4. Discussion

Biochar has been used in a variety of applications and has gained attention as an innovative and versatile material [22]. This growing interest can be attributed to its alignment with key global priorities, such as the promotion of renewable energy, sustainable agricultural practices, and the circular economy [23,24]. Biochar is a byproduct of pyrolysis, which not only produces biochar but also generates renewable energy in the form of bio-oil and syngas. By exploiting agricultural and forestry residues, biochar contributes to waste reduction and resource efficiency, making it an ideal candidate for integration within sustainable production systems [25].
In animal nutrition, biochar has been included in the register of EU feed materials since 2024, and its potential remains largely underexplored, particularly in terms of its functional properties. This gap in research provides a significant opportunity to better understand and leverage its benefits in improving animal performance and health. In the present study, the potential of chestnut-derived biochar as a feed ingredient for weaned piglets was assessed. The evaluation focused on the weaning phase, which is recognized as the most critical period in swine production when piglets are exposed to numerous stressors, including dietary changes, separation from the sow, and environmental challenges. These factors often increase susceptibility to enteric disorders, which has been well-documented during this phase [26]. Additionally, the weaning period is characterized by a very high use of antibiotics, which are used to mitigate these health challenges. By investigating the application of chestnut biochar during this vulnerable period, the aim was to evaluate its potential to support piglet health and performance.
Given the recognized heterogeneity of commercially available biochars due to the variations in feedstock types, pyrolysis conditions, and processing methods [13], a detailed chemical and morphological characterization was initially carried out, which focused on its use in the diet of weaned piglets.
The composition of principal nutrients, determined according to official methods, revealed a moisture content of approximately 41%. This characteristic, which is related to the high hygroscopicity of the biochar, reduces the risk of heating and spontaneous combustion during storage, transport, and the mixing processes involved in feed production [27]. The high crude fiber value (49.09 ± 0.53% as fed) indicates that a substantial portion of the chestnut wood composition of biochar is derived from lignocellulosic material. This is unsurprising since biochar is typically made from plant materials that are rich in cellulose, hemicellulose, and lignin. This high fiber content may contribute to the biochar’s porous structure and surface area, which are characteristic features. In addition, given its lignocellulosic origin, the chestnut wood biochar may retain its adsorptive potential even in vivo, which makes it a promising functional ingredient for animal feed. This high fiber content also supports the presence of a significant amount of recalcitrant carbon, which has been estimated to be between 19.64% and 24.54%, thus reinforcing the biochar’s potential for long-term carbon sequestration [28]. The low content of proteins and ether extracts (not detectable) in biochar can be explained by the carbonization process. During pyrolysis (carbonization), the high temperatures to which the material is subjected lead to the decomposition of volatile organic compounds such as proteins and lipids. These compounds are converted into gases and other stable substances, while carbon remains in the final product and thus contributes to the adsorptive properties of the biochar [29]. At the same time the biochar showed a relatively low ash content of 4.55 ± 0.02% on an as fed basis, which is consistent with biochar produced from plant-based biomass. This suggests that the biochar has a relatively high carbon content, with a small proportion of mineral residues, such as trace elements or inorganic compounds.
Among the various nutritional components, the ash content is an important factor to consider when formulating animal feed. Although the ash content represents a small percentage of the total biochar (4.55 ± 0.02% as fed), it represents the mineral composition, which is crucial for understanding its potential use in animal nutrition. Biochar is allowed as an ingredient in animal feed without specific limitations [15]. However, some minerals need to be carefully considered in the feed formulation, as certain elements may be contaminants if their levels exceed the established limits [30].
The biochar used in this study was characterized by a relatively high content of potassium (K), calcium (Ca), and magnesium (Mg), which helps to supplement the animal diet and meet nutritional requirements. The mineral composition of biochar is closely linked to the nature of the original organic material (biomass), as minerals from the soil accumulate in plant tissues and become concentrated during pyrolysis. In fact, chestnut wood, which was used in this study, is rich in potassium, calcium, magnesium, and traces of elements such as iron and manganese [31].
Although biochar can retain useful nutrients, there is also a risk that it may bind to other essential nutrients, thus reducing their absorption by the animal. This phenomenon is particularly important for minerals and vitamins, which could be adsorbed by biochar and thus be made less available for assimilation. It is therefore critical to balance its supplementation to prevent adverse effects on nutrient bioavailability.
While essential minerals can be beneficial, heavy metals such as arsenic, lead, and cadmium may also be present in trace amounts [32]. However, the biochar used in this study was in line with the relevant safety regulations, with heavy metal levels remaining below the threshold limits established for feed ingredients [30]. This ensures that biochar not only meets nutritional needs but also minimizes the risk of contamination. The biochar used in this study was thus shown to have the appropriate qualitative and safety characteristics for animal consumption, as it is authorized for use in animal feed. SEM analysis confirmed the morphological characteristics of the biochar, providing evidence of the degradation of organic material during pyrolysis. The presence of large fragments of plant material, predominantly Castanea sativa wood, highlighted the biomass origin. Detailed observations revealed well-preserved xylem vessels and fibers, along with radial parenchyma cells, which are consistent with the structural features typical of chestnut wood. The vessels and fibers improve the porosity (i.e., the lumen of wood elements) by providing greater adsorption surface. The observation of traces of gymnosperm wood fragments is consistent with the harvesting of chestnut material in the forest and suggests that SEM analyses of biochar could be a useful method for better characterizing the commercial product.
Chestnut biomass is particularly interesting for biochar production not only because its high lignocellulosic content ensures excellent pyrolytic efficiency but also because it results in a highly porous residual product [33]. This porosity is closely linked to its adsorptive potential, which could be a significant advantage in addressing the adsorption of gastrointestinal toxins in animal feed as reported by Osman et al. [34]. Additionally, the use of chestnut wood aligns perfectly with global sustainability requirements. In fact, the production of biochar from chestnut wood not only mitigates the risk of uncontrolled combustion, which would otherwise release CO2 into the atmosphere, but also promotes sustainable forest management, thereby preserving the landscape, maintaining biodiversity, and counteracting the effects of neglect [35]. Finally, the use of chestnut wood as a biomass for biochar production provides clear safety benefits for its application in animal feed. These include a reduced risk of high levels of anthropogenic contaminants and agricultural treatments for pathogen control, such as copper sulfate, which is also permitted in organic farming [36]. It also ensures a steady supply of raw material with consistent characteristics, thus meeting the stringent requirements of the feed industry.
In livestock the weaning phase is a crucial but challenging period, when the immune system develops and there may be gastrointestinal disturbances. This thus makes it an ideal context for testing the impact of biochar, as including it in the diet has been hypothesized to improve gut health, support immune function, and potentially reduce the need for antibiotics through its adsorptive properties [37,38,39]. Since the inclusion level of supplements in animal feed can significantly influence various aspects of animal performance, health, and product quality, the formulation of the diet needs critical attention as all the requirements for the physiological status of the animal need to be covered [40]. Based on previous studies where the inclusion range was from 0.5 to 2%, an inclusion rate of 1% was therefore selected for the present study [41,42]. This is because, although there are no legislative limits, we assumed that a larger volume takes up gastric volume space by subtracting nutrients, which for a growing piglet is critical. However, the analysis results of the chemical composition of the experimental diets confirmed that the inclusion of biochar did not affect the composition, thus meeting the nutritional requirements for weaned piglets (National Research Council, 2012), which guarantees that diet formulas are complete and balanced [19]. Our study revealed that the addition of 1% biochar to the diet did not affect animal growth or feed intake and thus that this dose did not affect the palatability of the diet, with both the control and treatment groups showing similar growth performance throughout the 28-day trial period. To better understand the effect on growth performance, a further long-term study is needed [43]. Our results are also in line with those of Schubert et al., who also found no effects on growth performance when biochar was included in the diet of growing pigs. Schubert et al. investigated two different biochars at a 2% inclusion level in compound feed and observed no significant effects on feed intake, weight gain, or feed conversion ratio [42]. In contrast, Chu et al. found that supplementation with 0.3% and 0.6% bamboo charcoal for 42 days led to significant improvements in average daily gain (ADG) and feed efficiency [41].
The data showed that, over time (d0 vs. d28) there was a general increase in the digestibility of the diet and its components, which is consistent with the progressive maturation of the digestive system in piglets [44,45]. However, at 28 days, the protein digestibility in the treated group was significantly higher than the control group. This is particularly interesting since proteins are a key nutritional factor in the formulation of the diet for weaned piglets, and in fact the protein content can influence their growth and health status. Our finding that chestnut-derived biochar improves protein digestibility also needs highlighting because, in recent years, there has been a growing trend in the swine industry to reduce dietary protein levels, driven by the need for more sustainable feeding strategies [46]. These results therefore align with the industry’s efforts to optimize protein use while potentially minimizing the environmental impact and reducing the risk of gut disorders associated with high-protein diets. In terms of the environmental impact of animal production, our study showed that the introduction of biochar into the diet does not lead to significant alterations in excreted mineral levels in feces. This highlights how the supplementation of 1% biochar in the feed did not influence the overall composition of minerals in the diet. In fact, while reducing mineral supplementation can decrease fecal excretion, it is crucial to balance this with the nutritional needs of pigs in order to ensure optimal growth and health [47]. The choice of mineral form, and consequently effective dietary strategies, is crucial to optimize mineral absorption and reduce the unnecessary excretion of minerals such as copper, zinc, iron, and manganese which are a significant concern in terms of the environmental impact, particularly when pig manure is used as a fertilizer [48,49]. However, the best protein digestibility was not directly associated with the weight gain. In fact, weight gain is a cumulative process that may take time to show changes in digestibility. The study was conducted over a short period (28 days) and may not capture the long-term benefits of improved nitrogen use.
In the treatment group, a statistically significant reduction in the frequency of diarrhea and a better fecal consistency (TRT showed +11.7% of fecal dry matter) were observed on day 28. This aspect is crucial, as diarrhea is a primary concern in swine farming and the leading cause of both morbidity and antibiotic use in piglets [50]. Reducing antibiotic use in livestock is crucial not only to minimize costs but also to tackle the issue of antibiotic resistance [51,52]. These findings may be linked to the adsorptive capacity of biochar, which can bind to harmful substances and toxins, thus improving gut health. Although studies on the supplementation of biochar in animal feed aimed at reducing diarrhea in swine are very limited, the findings obtained are consistent with those of Schubert et al. These authors observed increases in fecal dry matter of 9.31% and 13.1%, respectively, in groups with 2% inclusion of two different biochars in the diet, compared to the control group [42]. The results obtained show that biochar can be considered as an interesting alternative to antibiotics, and therefore its use in animal husbandry could be of great interest in the fight against antibiotic resistance. From an economic point of view, which is crucial for its practical applicability, the cost of feed grade raw material included in the 1% formulation, ranging from 600 to 900 €/ton, does not significantly affect the formula cost of the finished feed.
The ability of biochar to modulate the gut microbial population is also supported by the microbiological analysis of feces. Specifically, a tendency towards reduction in coliform counts was observed on day 14, alongside a notable increase in lactic acid bacteria (LAB) counts, which resulted in a LAB/coliform ratio exceeding 1.5. Although microbiota analysis could provide a more comprehensive understanding, the LAB/coliform ratio is a practical parameter that reflects the balance between classical bacterial categories which are commonly recognized as beneficial microorganisms and a group that can harbor potentially harmful bacteria. A ratio higher than 1.5 suggests a predominance of LAB, which are known to contribute to gut health by enhancing nutrient absorption, boosting the immune response, and inhibiting the growth of pathogenic microorganisms [53,54]. The reduction in coliforms may also include pathogenic Escherichia coli strains, which are the primary etiological agents of post-weaning diarrhea in piglets, against which biochar has demonstrated a selective immobilization ability [55,56]. In our study, the ratios of beneficial microorganisms (LAB) to potentially pathogenic microorganisms (coliforms) showed a higher presence of LAB in the treated group, thus suggesting a significant impact on the microbial ecosystem.
The improvement in the serum oxidative status correlated to the significant reduction in free radical levels in the treated group was one of the positive effects found in this study of the inclusion of biochar within the feed. This aspect is crucial in animal welfare and health. In fact, the presence of free radicals, besides being an indication of oxidative stress, could be considered as an early marker of inflammation since their level increases before those of the C-reactive protein [57,58,59]. The level of free radicals is strictly related to animal species and age [60]. In finished pigs the physiological value of ROMs is around 500 UCARR. However, during the post-weaning period, this value is lower and comparable to those reported for humans where values lower than 300 UCARR are correlated to a healthy condition, values between 300–320 are indicative of oxidative stress, and levels higher than 320 are indicative of slight oxidative stress [61].
In terms of the post-weaning phase, our study revealed a physiological level of free radicals for the treated group, while the control group showed values slightly suggestive of oxidative stress. It is therefore possible to conclude that the inclusion of the biochar could significantly limit the effects of free radicals, probably due to the scavenging activity. These results have also been confirmed in several in vitro studies which highlight the antioxidant activity of biochar [62,63].
It is also conceivable that biochar reduces ROS levels by modulating the gut microbiome, absorbing toxins/heavy metals, or through anti-inflammatory activity. In terms of the anti-inflammatory pathways, it is known that the interaction between microbiota and oxidative pathways is very complex [64]. Enterobacteriaceae are often associated with dysbiosis, inflammation, and increased oxidative stress [65]. Pathogenic bacteria such as Escherichia coli and Helicobacter pylori can produce ROS and exacerbate oxidative stress [66,67]. On the other hand, a healthy gut microbiota plays a pivotal role in defense against oxidative stress [68].

5. Conclusions

This study evaluated the inclusion of chestnut-derived biochar, which was shown to be an excellent biomass for biochar production for animal feed, due to its safety characteristics and reliable supply. In weaned piglets, a significant improvement was shown in protein digestibility, together with a reduction in the frequency of diarrhea, and a modulation of the gut bacteria, characterized by a registered decrease in coliform counts and an increase in lactic acid bacteria. Additionally, the treatment was associated with a reduction in d-ROMs, which suggests a positive impact on oxidative stress. These findings indicate that chestnut biochar could be considered as a valuable cost-effective dietary ingredient for improving gut health and for reducing the occurrence of diarrhea. This could thus also contribute to reducing the need for antibiotics in weaned piglets, with potential environmental and sustainability benefits.

Supplementary Materials

The following supporting information can be downloaded at: https://www.mdpi.com/article/10.3390/agriculture15101082/s1, Figure S1: Fragment of gymnosperm observed through scanning electron microscopy (SEM).

Author Contributions

Conceptualization, L.R.; methodology, M.S., A.M., M.D., and S.R.; software, E.O.; validation, L.R. and A.M.; formal analysis, S.R., M.S., S.F., M.D., and S.P.; investigation, S.R., E.O., M.S., S.F., B.C., I.F., and M.S.; resources, L.R.; data curation, S.R., S.F., and E.O.; writing—original draft preparation, S.R., M.S., E.O., and S.F.; writing—review and editing, S.R., M.S., S.F., E.O., A.M., and M.D.; visualization, supervision, L.R.; project administration, L.R. All authors have read and agreed to the published version of the manuscript.

Funding

This research received no external funding.

Institutional Review Board Statement

The animal study protocol was approved by the Animal Welfare Organization of University of Milan (OPBA authorization no. 5_2024) in accordance with Italian Regulations (D.lgs 26/2014) and European Regulation (Dir. EU 63/2010).

Data Availability Statement

Dataset available on request from the authors.

Acknowledgments

The authors would like to express their gratitude to Nera Biochar for providing the biochar; to Fa.Ma.Vit. S.p.A. for supplying the feed; to Società Agricola LA GEMMA Srl for providing the animals involved in the trial and the farming facilities where the trial was conducted. Finally, we would like to thank UNITECH NOLIMITS (Nikon Center of Excellence for Plant Biology and Other Life Sciences, University of Milan) for SEM technical support. The authors gratefully acknowledge the University of Milan for its support through the Article Processing Charge (APC) funding initiative.

Conflicts of Interest

The authors declare no conflicts of interest.

References

  1. FAO. World Livestock: Transforming the Livestock Sector Through the Sustainable Development Goals; FAO: Quebec City, QC, Canada, 2019; ISBN 978-92-5-130883-7. [Google Scholar]
  2. UN. General Assembly UN Resolution 70/1: Transforming Our World: The 2030 Agenda for Sustainable Development. Available online: https://sdgs.un.org/2030agenda (accessed on 10 January 2025).
  3. Tretola, M.; Ottoboni, M.; Luciano, A.; Rossi, L.; Baldi, A.; Pinotti, L. Former Food Products Have No Detrimental Effects on Diet Digestibility, Growth Performance and Selected Plasma Variables in Post-Weaning Piglets. Ital. J. Anim. Sci. 2019, 18, 987–996. [Google Scholar] [CrossRef]
  4. Dell’Anno, M.; Reggi, S.; Caprarulo, V.; Hejna, M.; Sgoifo Rossi, C.; Callegari, M.; Baldi, A.; Rossi, L. Evaluation of Tannin Extracts, Leonardite and Tributyrin Supplementation on Diarrhoea Incidence and Gut Microbiota of Weaned Piglets. Animals 2021, 11, 1693. [Google Scholar] [CrossRef]
  5. Frazzini, S.; Reggi, S.; Dell’Anno, M.; Fifi, A.P.; Scaglia, E.; Ferri, I.; Rossi, L. Chemical-Functional Characterization of Ascophyllum nodosum and Phymatolithon calcareum and Dietary Supplementation in Post-Weaning Pigs. Front. Vet. Sci. 2024, 11, 1431091. [Google Scholar] [CrossRef]
  6. Ferraro, G.; Pecori, G.; Rosi, L.; Bettucci, L.; Fratini, E.; Casini, D.; Rizzo, A.M.; Chiaramonti, D. Biochar from Lab-Scale Pyrolysis: Influence of Feedstock and Operational Temperature. Biomass Convers. Biorefin. 2024, 14, 5901–5911. [Google Scholar] [CrossRef]
  7. Yuan, X.; Cao, Y.; Li, J.; Patel, A.K.; Dong, C.-D.; Jin, X.; Gu, C.; Yip, A.C.K.; Tsang, D.C.W.; Ok, Y.S. Recent Advancements and Challenges in Emerging Applications of Biochar-Based Catalysts. Biotechnol. Adv. 2023, 67, 108181. [Google Scholar] [CrossRef] [PubMed]
  8. Verdi, L.; Dalla Marta, A.; Orlandini, S.; Maienza, A.; Baronti, S.; Vaccari, F.P. Evaluation of Biochar Addition to Digestate, Slurry, and Manure for Mitigating Carbon Emissions. Agriculture 2024, 14, 162. [Google Scholar] [CrossRef]
  9. Premchand, P.; Demichelis, F.; Chiaramonti, D.; Bensaid, S.; Fino, D. Study on the Effects of Carbon Dioxide Atmosphere on the Production of Biochar Derived from Slow Pyrolysis of Organic Agro-Urban Waste. Waste Manag. 2023, 172, 308–319. [Google Scholar] [CrossRef] [PubMed]
  10. Shoudho, K.N.; Khan, T.H.; Ara, U.R.; Khan, M.R.; Shawon, Z.B.Z.; Hoque, M.E. Biochar in Global Carbon Cycle: Towards Sustainable Development Goals. Curr. Res. Green Sustain. Chem. 2024, 8, 100409. [Google Scholar] [CrossRef]
  11. Qomariyah, N.; Ella, A.; Nurdin Ahmad, S.; Yusriani, Y.; Miftakhus Sholikin, M.; Rachmanto Prihambodo, T.; Retnani, Y.; Jayanegara, A.; Wina, E.; Permana, I.G. Dietary Biochar as a Feed Additive for Increasing Livestock Performance: A Meta-Analysis of In Vitro and In Vivo Experiment. Czech J. Anim. Sci. 2023, 68, 72–86. [Google Scholar] [CrossRef]
  12. Man, K.Y.; Chow, K.L.; Man, Y.B.; Mo, W.Y.; Wong, M.H. Use of Biochar as Feed Supplements for Animal Farming. Crit. Rev. Environ. Sci. Technol. 2021, 51, 187–217. [Google Scholar] [CrossRef]
  13. Reggi, S.; Frazzini, S.; Torresani, M.C.; Guagliano, M.; Cristiani, C.; Pilu, S.R.; Ghidoli, M.; Rossi, L. Metabolomic Profiling and Functional Characterization of Biochar from Vine Pruning Residues for Applications in Animal Feed. Animals 2024, 14, 3440. [Google Scholar] [CrossRef] [PubMed]
  14. Rashidi, A.; Karuppiah, S.; Ebadi, M.; Shanley, R.; Khoruts, A.; Weisdorf, D.J.; Staley, C. A Dose-Finding Safety and Feasibility Study of Oral Activated Charcoal and Its Effects on the Gut Microbiota in Healthy Volunteers Not Receiving Antibiotics. PLoS ONE 2022, 17, e0269986. [Google Scholar] [CrossRef] [PubMed]
  15. European Commission. Commission Regulation (EU) 2022/1104 of 1 July 2022 Amending Regulation (EU) No 68/2013 on the Catalogue of Feed Materials (Text with EEA Relevance). Off. J. Eur. Union 2022. [Google Scholar]
  16. Dell’Anno, M.; Frazzini, S.; Reggi, S.; Ferri, I.; Scaglia, E.; Schiasselloni, L.; Inglesi, A.; Riva, F.; Verdile, N.; Pasquariello, R.; et al. Evaluation of Dietary Supplementation of Ascophyllum nodosum and Lithothamnium calcareum as Functional Algae in F4+ Escherichia coli Challenged Piglets. Front. Vet. Sci. 2024, 11, 1430347. [Google Scholar] [CrossRef]
  17. AOAC. Official Methods of Analysis, 22nd ed.; Association of Official Analytical Chemists: Washington, DC, USA, 2023. [Google Scholar]
  18. Hejna, M.; Moscatelli, A.; Onelli, E.; Baldi, A.; Pilu, S.; Rossi, L. Evaluation of concentration of heavy metals in animal rearing system. Ital. J. Anim. Sci. 2019, 18, 1372–1384. [Google Scholar] [CrossRef]
  19. National Research Council. Nutrient Requirements of Swine, 11th ed.; National Research Council: Ottawa, ON, Canada, 2020. [Google Scholar]
  20. Rossi, L.; Dell’Orto, V.; Vagni, S.; Sala, V.; Reggi, S.; Baldi, A. Protective Effect of Oral Administration of Transgenic Tobacco Seeds against Verocytotoxic Escherichia coli Strain in Piglets. Vet. Res. Commun. 2014, 38, 39–49. [Google Scholar] [CrossRef]
  21. Dell’Anno, M.; Frazzini, S.; Ferri, I.; Tuberti, S.; Bonaldo, E.; Botti, B.; Grossi, S.; Sgoifo Rossi, C.A.; Rossi, L. Effect of Dietary Supplementation of Chestnut and Quebracho Tannin Supplementation on Neonatal Diarrhoea in Preweaning Calves. Antioxidants 2024, 13, 237. [Google Scholar] [CrossRef] [PubMed]
  22. Kapoor, R.T.; Ahmad, P.; Rafatullah, M. Insights into Biochar Applications: A Sustainable Strategy toward Carbon Neutrality and Circular Economy. In Catalytic Applications of Biochar for Environmental Remediation: Sustainable Strategies Towards a Circular Economy; American Chemical Society: Washington, DC, USA, 2024; pp. 1–30. [Google Scholar]
  23. Puglia, M.; Morselli, N.; Lumi, M.; Santunione, G.; Pedrazzi, S.; Allesina, G. Assessment of Hemp Hurd-Derived Biochar Produced through Different Thermochemical Processes and Evaluation of Its Potential Use as Soil Amendment. Heliyon 2023, 9, e14698. [Google Scholar] [CrossRef]
  24. Ottani, F.; Pedrazzi, S.; Morselli, N.; Puglia, M.; Allesina, G. Seeking the Synergistic Potential of Biochar Integration in Municipal Composting Plants for Techno-Economic and Environmental Leverage. Sustain. Energy Technol. Assess. 2024, 64, 103717. [Google Scholar] [CrossRef]
  25. Mosa, A.; Mansour, M.M.; Soliman, E.; El-Ghamry, A.; El Alfy, M.; El Kenawy, A.M. Biochar as a Soil Amendment for Restraining Greenhouse Gases Emission and Improving Soil Carbon Sink: Current Situation and Ways Forward. Sustainability 2023, 15, 1206. [Google Scholar] [CrossRef]
  26. Dell’Anno, M.; Scaglia, E.; Reggi, S.; Grossi, S.; Sgoifo Rossi, C.A.; Frazzini, S.; Caprarulo, V.; Rossi, L. Evaluation of Tributyrin Supplementation in Milk Replacer on Diarrhoea Occurrence in Preweaning Holstein Calves. Animal 2023, 17, 100791. [Google Scholar] [CrossRef] [PubMed]
  27. Restuccia, F.; Mašek, O.; Hadden, R.M.; Rein, G. Quantifying Self-Heating Ignition of Biochar as a Function of Feedstock and the Pyrolysis Reactor Temperature. Fuel 2019, 236, 201–213. [Google Scholar] [CrossRef]
  28. Yulis Setyawan, H.; Mayang Sabrina Sunyoto, N.; Sugiarto, Y.; Sue stining Dyah Dewanti, B.; Tri Widayanti, V.; Hakim, L.; Kurniawan, S.; Auliya Nugroho, G.b.; Ulandari, D.; Choirun, A.; et al. Characterisation of Biochar from Various Carbon Sources. BIO Web Conf. 2024, 90, 06003. [Google Scholar] [CrossRef]
  29. Amer, M.; Elwardany, A. Biomass Carbonization. In Renewable Energy—Resources, Challenges and Applications; IntechOpen: London, UK, 2020. [Google Scholar]
  30. European Commission. Commission Regulation (EU) No 1275/2013 of 6 December 2013 Amending Annex I to Directive 2002/32/EC of the European Parliament and of the Council as Regards Maximum Levels for Arsenic, Cadmium, Lead, Nitrites, Volatile Mustard Oil and Harmful Botanical Impurities Text with EEA Relevance. Off. J. Eur. Union 2013. [Google Scholar]
  31. Ertop, U.; Şevik, H.; Hendek Ertop, M. Mineral Composition and Heavy Metal Contents of Chestnut Honey Collected From Kastamonu Region. J. Apitherapy Nat. 2023, 6, 73–87. [Google Scholar] [CrossRef]
  32. Hejna, M.; Gottardo, D.; Baldi, A.; Dell’Orto, V.; Cheli, F.; Zaninelli, M.; Rossi, L. Review: Nutritional Ecology of Heavy Metals. Animal 2018, 12, 2156–2170. [Google Scholar] [CrossRef]
  33. Lu, X.; Gu, X. A Review on Lignin Pyrolysis: Pyrolytic Behavior, Mechanism, and Relevant Upgrading for Improving Process Efficiency. Biotechnol. Biofuels Bioprod. 2022, 15, 106. [Google Scholar] [CrossRef]
  34. Osman, A.I.; Fawzy, S.; Farghali, M.; El-Azazy, M.; Elgarahy, A.M.; Fahim, R.A.; Maksoud, M.I.A.A.; Ajlan, A.A.; Yousry, M.; Saleem, Y.; et al. Biochar for Agronomy, Animal Farming, Anaerobic Digestion, Composting, Water Treatment, Soil Remediation, Construction, Energy Storage, and Carbon Sequestration: A Review. Environ. Chem. Lett. 2022, 20, 2385–2485. [Google Scholar] [CrossRef]
  35. Franco, C.R.; Page-Dumroese, D.S.; Archuleta, J. Forest Management and Biochar for Continued Ecosystem Services. J. Soil. Water Conserv. 2022, 77, 60A–64A. [Google Scholar] [CrossRef]
  36. European Commission. Commission Implementing Regulation (EU) 2018/1981 of 13 December 2018 Renewing the Approval of the Active Substances Copper Compounds, as Candidates for Substitution, in Accordance with Regulation (EC) No 1107/2009 of the European Parliament and of the Council Concerning the Placing of Plant Protection Products on the Market, and Amending the Annex to Commission Implementing Regulation (EU) No 540/2011. Off. J. Eur. Union 2018. [Google Scholar]
  37. Graves, C.; Kolar, P.; Shah, S.; Grimes, J.; Sharara, M. Can Biochar Improve the Sustainability of Animal Production? Appl. Sci. 2022, 12, 5042. [Google Scholar] [CrossRef]
  38. Schmidt, H.-P.; Hagemann, N.; Draper, K.; Kammann, C. The Use of Biochar in Animal Feeding. PeerJ 2019, 7, e7373. [Google Scholar] [CrossRef] [PubMed]
  39. Lao, E.J.; Mbega, E.R. Biochar as a Feed Additive For Improving the Performance of Farm Animals. Malays. J. Sustain. Agric. 2020, 4, 86–93. [Google Scholar] [CrossRef]
  40. Komar, A.H.A.-J.; Yaser, K. Del Effect of Different Feed Additives on Growth Performance and Production in Livestock. Int. J. Agric. For. 2019, 9, 16–31. [Google Scholar]
  41. Chu, G.M.; Kim, J.H.; Kim, H.Y.; Ha, J.H.; Jung, M.S.; Song, Y.; Cho, J.H.; Lee, S.J.; Ibrahim, R.I.H.; Lee, S.S.; et al. Effects of Bamboo Charcoal on the Growth Performance, Blood Characteristics and Noxious Gas Emission in Fattening Pigs. J. Appl. Anim. Res. 2013, 41, 48–55. [Google Scholar] [CrossRef]
  42. Schubert, D.C.; Chuppava, B.; Witte, F.; Terjung, N.; Visscher, C. Effect of Two Different Biochars as a Component of Compound Feed on Nutrient Digestibility and Performance Parameters in Growing Pigs. Front. Anim. Sci. 2021, 2, 633958. [Google Scholar] [CrossRef]
  43. Rychen, G.; Aquilina, G.; Azimonti, G.; Bampidis, V.; de Lourdes Bastos, M.; Bories, G.; Chesson, A.; Cocconcelli, P.S.; Flachowsky, G.; Gropp, J.; et al. Guidance on the Assessment of the Safety of Feed Additives for the Target Species. EFSA J. 2017, 15, e05021. [Google Scholar] [CrossRef]
  44. Engelsmann, M.N.; Jensen, L.D.; van der Heide, M.E.; Hedemann, M.S.; Nielsen, T.S.; Nørgaard, J.V. Age-Dependent Development in Protein Digestibility and Intestinal Morphology in Weaned Pigs Fed Different Protein Sources. Animal 2022, 16, 100439. [Google Scholar] [CrossRef]
  45. Lim, M.Y.; Song, E.-J.; Kang, K.S.; Nam, Y.-D. Age-Related Compositional and Functional Changes in Micro-Pig Gut Microbiome. Geroscience 2019, 41, 935–944. [Google Scholar] [CrossRef] [PubMed]
  46. Wang, Y.; Zhou, J.; Wang, G.; Cai, S.; Zeng, X.; Qiao, S. Advances in Low-Protein Diets for Swine. J. Anim. Sci. Biotechnol. 2018, 9, 60. [Google Scholar] [CrossRef]
  47. Pomar, C.; Andretta, I.; Remus, A. Feeding Strategies to Reduce Nutrient Losses and Improve the Sustainability of Growing Pigs. Front. Vet. Sci. 2021, 8, 742220. [Google Scholar] [CrossRef] [PubMed]
  48. Dourmad, J.-Y.; Jondreville, C. Impact of Nutrition on Nitrogen, Phosphorus, Cu and Zn in Pig Manure, and on Emissions of Ammonia and Odours. Livest. Sci. 2007, 112, 192–198. [Google Scholar] [CrossRef]
  49. Lu, L.; Liao, X.; Luo, X. Nutritional Strategies for Reducing Nitrogen, Phosphorus and Trace Mineral Excretions of Livestock and Poultry. J. Integr. Agric. 2017, 16, 2815–2833. [Google Scholar] [CrossRef]
  50. Rossi, L.; Turin, L.; Alborali, G.L.; Demartini, E.; Filipe, J.F.S.; Riva, F.; Riccaboni, P.; Scanziani, E.; Trevisi, P.; Dall’Ara, P.; et al. Translational Approach to Induce and Evaluate Verocytotoxic E. coli O138 Based Disease in Piglets. Animals 2021, 11, 2415. [Google Scholar] [CrossRef] [PubMed]
  51. Bava, R.; Castagna, F.; Lupia, C.; Poerio, G.; Liguori, G.; Lombardi, R.; Naturale, M.D.; Mercuri, C.; Bulotta, R.M.; Britti, D.; et al. Antimicrobial Resistance in Livestock: A Serious Threat to Public Health. Antibiotics 2024, 13, 551. [Google Scholar] [CrossRef]
  52. European Commission. Regulation (EU) 2019/6 of the European Parliament and of the Council of 11 December 2018 on Veterinary Medicinal Products and Repealing Directive 2001/82/EC. Off. J. Eur. Union 2019. [Google Scholar]
  53. Chandrasekaran, P.; Weiskirchen, S.; Weiskirchen, R. Effects of Probiotics on Gut Microbiota: An Overview. Int. J. Mol. Sci. 2024, 25, 6022. [Google Scholar] [CrossRef]
  54. Nordeste, R.; Tessema, A.; Sharma, S.; Kovač, Z.; Wang, C.; Morales, R.; Griffiths, M.W. Molecules Produced by Probiotics Prevent Enteric Colibacillosis in Pigs. BMC Vet. Res. 2017, 13, 335. [Google Scholar] [CrossRef]
  55. Naka, K.; Watarai, S.; Tana; Inoue, K.; Kodama, Y.; Oguma, K.; Yasuda, T.; Kodama, H. Adsorption Effect of Activated Charcoal on Enterohemorrhagic Escherichia coli. J. Vet. Med. Sci. 2001, 63, 281–285. [Google Scholar] [CrossRef]
  56. Aurelie, D.N.; Luciane Marlyse, M.; Samuel, E.J.; Ache Roland, N.; Moïse, N. Modification of The Bacterial Abundance Properties of Water by Immersed Non-Activated Charcoal. Clin. Med. Health Res. J. 2024, 4, 946–954. [Google Scholar] [CrossRef]
  57. Pham-Huy, L.A.; He, H.; Pham-Huy, C. Free Radicals, Antioxidants in Disease and Health. Int. J. Biomed. Sci. 2008, 4, 89–96. [Google Scholar] [CrossRef]
  58. Chaudhary, P.; Janmeda, P.; Docea, A.O.; Yeskaliyeva, B.; Abdull Razis, A.F.; Modu, B.; Calina, D.; Sharifi-Rad, J. Oxidative Stress, Free Radicals and Antioxidants: Potential Crosstalk in the Pathophysiology of Human Diseases. Front. Chem. 2023, 11, 1158198. [Google Scholar] [CrossRef]
  59. Menzel, A.; Samouda, H.; Dohet, F.; Loap, S.; Ellulu, M.S.; Bohn, T. Common and Novel Markers for Measuring Inflammation and Oxidative Stress Ex Vivo in Research and Clinical Practice—Which to Use Regarding Disease Outcomes? Antioxidants 2021, 10, 414. [Google Scholar] [CrossRef] [PubMed]
  60. Buchet, A.; Belloc, C.; Leblanc-Maridor, M.; Merlot, E. Effects of Age and Weaning Conditions on Blood Indicators of Oxidative Status in Pigs. PLoS ONE 2017, 12, e0178487. [Google Scholar] [CrossRef]
  61. Gorni, D. Valutazione Globale Dello Stress Ossidativo; Università Degli Studi di Parma: Parma, Italy, 2017. [Google Scholar]
  62. Lameirão, F.; Pinto, D.; Vieira, E.F.; Peixoto, A.F.; Freire, C.; Sut, S.; Dall’Acqua, S.; Costa, P.; Delerue-Matos, C.; Rodrigues, F. Green-Sustainable Recovery of Phenolic and Antioxidant Compounds from Industrial Chestnut Shells Using Ultrasound-Assisted Extraction: Optimization and Evaluation of Biological Activities In Vitro. Antioxidants 2020, 9, 267. [Google Scholar] [CrossRef]
  63. Reggi, S.; Frazzini, S.; Pedrazzi, S.; Ghidoli, M.; Torresani, M.C.; Puglia, M.; Morselli, N.; Guagliano, M.; Cristiani, C.; Pilu, S.R.; et al. Metabolomic Insights into the Potential of Chestnut Biochar as a Functional Feed Ingredient. Appl. Sci. 2025, 15, 1084. [Google Scholar] [CrossRef]
  64. Kunst, C.; Schmid, S.; Michalski, M.; Tümen, D.; Buttenschön, J.; Müller, M.; Gülow, K. The Influence of Gut Microbiota on Oxidative Stress and the Immune System. Biomedicines 2023, 11, 1388. [Google Scholar] [CrossRef]
  65. Baldelli, V.; Scaldaferri, F.; Putignani, L.; Del Chierico, F. The Role of Enterobacteriaceae in Gut Microbiota Dysbiosis in Inflammatory Bowel Diseases. Microorganisms 2021, 9, 697. [Google Scholar] [CrossRef]
  66. Gomez, S.A.; Abrey-Recalde, M.J.; Panek, C.A.; Ferrarotti, N.F.; Repetto, M.G.; Mejías, M.P.; Fernández, G.C.; Vanzulli, S.; Isturiz, M.A.; Palermo, M.S. The Oxidative Stress Induced in vivo by Shiga Toxin-2 Contributes to the Pathogenicity of Haemolytic Uraemic Syndrome. Clin. Exp. Immunol. 2013, 173, 463–472. [Google Scholar] [CrossRef] [PubMed]
  67. Gobert, A.P.; Wilson, K.T. Polyamine- and NADPH-Dependent Generation of ROS during Helicobacter pylori Infection: A Blessing in Disguise. Free Radic. Biol. Med. 2017, 105, 16–27. [Google Scholar] [CrossRef] [PubMed]
  68. Sun, Y.; Wang, X.; Li, L.; Zhong, C.; Zhang, Y.; Yang, X.; Li, M.; Yang, C. The Role of Gut Microbiota in Intestinal Disease: From an Oxidative Stress Perspective. Front. Microbiol. 2024, 15, 1328324. [Google Scholar] [CrossRef] [PubMed]
Figure 1. Morphological analysis of the biochar used in this experiment. (A) Low magnification (Magnification bar 200 µm); (B) High magnification showing exhibit larger pits at the ray–vessel junctions (arrow) and smaller pits along the longitudinal vessel walls (arrowhead) (Magnification bar 20 µm); (C) High magnification showing the empty tubular structure of xylem vessels (arrow) and radial parenchyma cells (asterisk) (Magnification bar 10 µm).
Agriculture 15 01082 g001
Figure 2. Frequency of diarrhea between the control group (CTRL) and treatment group (TRT) on days 0, 14, and 28 (a). DM (%) between the CTRL and TRT groups on days 0 and 28 (b). The data of % DM are shown as the mean and standard deviation. Asterisks with different superscripts indicate significantly different means; ** p ≤ 0.015.
Agriculture 15 01082 g002
Figure 3. Comparison of the serum oxidative status (a) and antioxidant barrier (b) on day 28 (d28) between the control group (CTRL) and treatment group (TRT). The data are shown as the mean and standard deviation. Asterisks with different superscripts indicate significantly different means; *** p ≤ 0.001.
Agriculture 15 01082 g003
Table 1. Composition of the experimental diets of the control (CTRL) and treatment (TRT) groups.
Ingredients, % as Fed BasisCTRLTRT
Barley21.52521.525
Soft wheat17.10017.100
Soybean meal (47% CP)9.3009.300
Maize8.0008.000
Biscuit meal8.0008.000
Flaked maize7.5007.500
Maize feed5.0005.000
Wheat bran5.0004.000
Soybean concentrate4.0004.000
Beet pulp2.5002.500
Breakfast products2.0002.000
Soybean oil1.8001.800
Whey powder1.5001.500
Fishmeal (72% CP)1.5001.500
Biochar-1.000
l-lysine sulfate0.7900.790
Organic acid mix 10.7500.750
Calcium formate0.6500.650
Monocalcium phosphate0.6000.600
Salt0.5000.500
Vitamin mineral premix 20.4000.400
Medium chain fatty acid 30.3500.350
Sucrose0.3000.300
l-threonine0.2200.220
Natural extract 40.2000.200
Dl-methionine0.1700.170
l-valine0.1300.130
Pellet binder 50.1000.100
l-tryptophan0.0600.060
Flavors0.0450.045
l-isoleucine0.0100.010
Chemical Composition (% as Fed Basis)
Dry matter 691.6 ± 0.7091.4 ± 0.93
Crude protein 615.5 ± 0.2315.4 ± 0.09
Ether extract 64.4 ± 0.184.3 ± 0.28
Crude fiber 63.4 ± 0.073.6 ± 0.14
Ash 65.4 ± 0.085.1 ± 0.19
Calcium (Ca) 70.5990.599
Phosphorus (P) 70.6220.622
Ileal digestible lysine (SID) 71.051.05
Metabolizable energy (ME) 713.475 MJ/kg13.475 MJ/kg
Additives per Kg: 1 Benzoic acid 1250.00 mg, Formic acid 830.00 mg, Fumaric acid 500.00 mg, Lactic acid 920.00 mg, Citric acid 50.00 mg, calcium formate 6000.00; 2 Vitamins, provitamins and substances with similar effect: Vitamin A (Retinyl acetate) 15,000.00 UI, Vitamin D3 (cholecalciferol) 1800.00 UI, Betaine hydrochloride 180.00 mg, Biotin 0.15 mg, Choline chloride 94.50 mg, Folic acid 0.99 mg, Niacin 72.00 mg, Calcium D-pantothenate 13.33 mg, Vitamin B1 (Thiamine mononitrate) 5.10 mg, Vitamin B12 (Cyanocobalamin) 0.06 mg, Vitamin B2 (Riboflavin) 9.90 mg, Vitamin B6 (pyridoxine hydrochloride) 6.00 mg, 3a700 Vitamin E (all-rac-alpha-tocopheryl acetate) 102.00 mg, Vitamin K3 (menadione nicotinamide bisulfite) 2.49 mg, Copper (Copper sulfate-II pentahydrate) 99.60 mg, Iodine (Anhydrous calcium iodate in coated granules) 1.50 mg, Iron (Iron-II sulfate monohydrate) 120.00 mg, Manganese (Manganese oxide-II) 75.00 mg, Selenium (Sodium selenite in coated granules) 0.30 mg, Zinc (Zinc oxide) 99.60 mg; 3 Caprylic acid (C8), Lauric acid (C12), Capric acid (C10) 4 Flavoring Veo Premium (Phodé, Terssac, France), Appetizing Luctarom® (Lucta S.A., Barcelona, Spain); 5 5 Denubond cs pellet (Albitalia Srl, Milan, Italy); 6 The analysis was performed according the “Official Methods of Analysis” of AOAC International and values are presented as fed basis; 7 The calculation was performed with Brill® Formulation Software v.1.36.17 and values are presented as fed basis.
Table 2. Nutrient and mineral content of biochar. The results are expressed as mean ± standard deviation (n = 3).
Nutrient Composition (as Fed Basis)
AnalyteContent (%)
Dry Matter59.8 ± 0.94
Ash4.5 ± 0.02
Crude Fiber49.1 ± 0.53
Crude Protein1.0 ± 0.21
Ether ExtractND
Mineral Composition (as Fed Basis)
MineralContent (g kg−1)MineralContent (mg kg−1)MineralContent (mg kg−1)
Na0.1 ± 0.01Cr2.2 ± 0.53ZnND
Mg1.7± 0.16Mn257.3 ± 26.77As0.9± 0.13
Al0.4 ± 0.08Fe1.4 ± 0.24Se0.02 ± 0.01
P0.5 ± 0.11Co0.6 ± 0.12MoND
K3.6 ± 0.24Ni7.4 ± 0.48Cd0.1 ± 0.02
Ca2.0 ± 0.25Cu11.6 ± 3.59Pb2.7 ± 0.38
ND = not detectable.
Table 3. Growth performance of weaned pigs in control group (CTRL) and treatment group (TRT) during the 28 days of the trial. The results are expressed as mean ± standard deviation.
PeriodGroupp-Values
CTRLTRTTimeTreatmentTreatment × Time
BW (kg) <0.0010.8370.967
d09.4 ± 1.249.5 ± 1.31
d711.5 ± 1.6111.6 ± 1.84
d1414.2 ± 2.2114.1 ± 2.56
d2118.1 ± 2.9018.1 ± 3.54
d2822.0 ± 3.8222.1 ± 4.59
ADG (g/day) <0.0010.7320.4192
d0–d7292.9 ± 24.88304.8 ± 35.68
d7–d14383.9 ± 43.73354.6 ± 32.29
d14–d21564.2 ± 32.40575.3 ± 54.46
d21–d28553.4 ± 63.73575.7 ± 55.42
ADFI (g/day) <0.0010.4350.652
d0–d7440.4 ± 15.86416.8 ± 38.05
d7–d14558.9 ± 39.88527.3 ± 70.93
d14–d21655.7 ± 27.73656.2 ± 40.36
d21–d28881.1 ± 48.06893.7 ± 92.20
<0.0010.5220.217
FCR (g feed/g gain)d0–d71.5 ± 0.101.4 ± 0.13
d7–d141.5 ± 0.131.5 ± 0.24
d14–d211.2 ± 0.111.1 ± 0.10
d21–d281.6 ± 0.211.6 ± 0.15
BW: body weight; ADG: average daily gain; ADFI: average daily feed intake; FCR: feed conversion.
Table 4. Fecal bacterial count of total, lactic acid, and coliform bacteria on days 0, 14, and 28 of the trial periods in control group (CTRL) and treatment group (TRT). Data are expressed as log CFU/g feces ± standard deviation; a,b Different lowercase letters indicate statistically significant differences between groups (p < 0.05).
PeriodGroupp-Value
CTRLTRTTimeTreatmentTime × Treatment
Total bacteria 0.1320.7790.449
d05.5 ± 0.875.7 ± 0.85
d145.5 ± 0.685.3 ± 0.81
d285.9 ± 0.385.7 ± 0.33
Lactic acid bacteria <0.00010.2060.019
d06.2 ± 0.615.9 ± 0.73
d145.4 ± 0.81 a6.0 ± 0.47 b
d285.0 ± 0.514.5 ± 0.48
Coliform bacteria 0.0030.0550.079
d02.6 ± 1.383.4 ± 1.41
d144.0 ± 0.72 a3.0 ± 0.80 b
d284.5 ± 0.704.0 ± 0.74
Lactic acid bacteria/coliform bacteria 0.00030.0680.035
d01.95 ± 0.591.89 ± 0.64
d141.40 ± 0.332.27 ± 1.23
Table 5. Digestibility parameters of the diet during the trial. The data are expressed as mean ± standard deviation; a,b Different lowercase letters indicate statistically significant differences among control group (CTRL) and treatment group (TRT) (p < 0.05).
PeriodDiet (%)p-Value
CTRLTRTTimeTreatmentTreatment × Time
OM
(on DM)
0.030.880.90
d066.4 ± 0.3666.5 ± 0.37
d2872.6 ± 9.6573.4 ± 3.12
CP
(on DM)
<0.0010.0040.005
d072.5 ± 0.6772.5 ± 0.58
d2875.0 ± 2.05 a79.5 ± 1.74 b
EE
(on DM)
0.020.940.15
d071.8 ± 0.8570.4 ± 2.27
d2872.7 ± 1.7774.0 ± 2.44
DM: dry matter; OM: organic matter; CP: crude protein; EE: ether extract.
Table 6. Mineral content, in dry matter, in feces on d28 between control group (CTRL) and treatment group (TRT). The data are covariate for day 0 and expressed as mean ± standard deviation.
Mineral Content
(in Dry Matter)
CTRLTRTp-Value
Na (g kg−1)1.3 ± 0.912.2 ± 0.730.546
Mg (g kg−1)8.2 ± 0.998.9 ± 0.340.407
Al (g kg−1)0.9 ± 0.041.0 ± 0.060.442
P (g kg−1)10.1 ± 0.7910.2 ± 0.810.909
K (g kg−1)8.2 ± 0.998.9 ± 0.340.407
Ca (g kg−1)1.9 ± 0.221.6 ± 0.190.219
Cr (mg kg−1)12.5 ± 0.9215.2 ± 0.7010.187
Mn (mg kg−1)566.0 ± 59.08664.8 ± 29.230.304
Fe (mg kg−1)1.9 ± 0.252.4 ± 0.270.098
Co (mg kg−1)0.9 ± 0.271.4 ± 0.480.543
Ni (mg kg−1)6.6 ± 0.967.2 ± 0.710.444
Cu (mg kg−1)637.7 ± 62.07640.1 ± 44.670.982
Zn (mg kg−1)833.9 ± 20.48770.1 ± 22.020.362
As (mg kg−1)0.7 ± 0.140.4 ± 0.080.122
Se (mg kg−1)0.7 ± 0.061.3 ± 0.060.236
Mo (mg kg−1)4.9 ± 0.766.0 ± 0.350.054
Cd (mg kg−1)0.3 ± 0.140.4 ± 0.080.242
Pb (mg kg−1)1.6 ± 0.391.0 ± 0.820.334
Disclaimer/Publisher’s Note: The statements, opinions and data contained in all publications are solely those of the individual author(s) and contributor(s) and not of MDPI and/or the editor(s). MDPI and/or the editor(s) disclaim responsibility for any injury to people or property resulting from any ideas, methods, instructions or products referred to in the content.

