1. Introduction
Pineapple is one of the four major tropical fruits—alongside banana, mango, and coconut—and is widely favored by consumers. It is also a distinctive and competitive fruit in southern China, playing a significant role in regional economic development and agricultural advancement [
1,
2]. With annual increases in production and labor costs, mechanical harvesting has become a viable solution for reducing harvesting expenses [
3].
Recently, mechanical harvesting has been actively explored by many researchers. For example, Liu et al. [
4,
5,
6] proposed various pineapple harvesting mechanisms, including a multi-flexible fingered roller, a lever-feeding-type roller, and a chain-feeding roller combined with a flexible rod-breaking mechanism, achieving harvesting success rates of 85%, 84%, and 82%, respectively. Their approaches significantly improved harvesting efficiency compared to manual picking. Cross Agricultural Engineering designed a tracked, fully automated pineapple harvester that used a tine-chain rake for taking in pineapple fruits, stems, and leaves [
7]. Kurbah et al. developed a gripper-cutting-type pineapple harvesting mechanism [
8].
Although these methods aimed to minimize fruit and plant damage while maximizing fruit removal, the pineapple is a delicate fruit and is still inevitably injured by mechanical harvesters [
9]. For instance, the mechanical damage rate can exceed 20% [
4,
5,
6]. Detecting and accurately assessing such damage is therefore critical for improving pineapple harvester design and performance. Due to the irregular shapes of mechanical damage, manual measurements using tools such as calipers often lead to substantial errors, sometimes reaching up to 50%.
Quantitatively assessing fruit damage remains challenging. To enhance both accuracy and speed in fruit damage detection, many researchers have proposed machine vision-based solutions. For instance, Zhang et al. [
10] presented a nondestructive method using hyperspectral spectroscopy based on a stacking model to detect slight mechanical damage in apples, achieving a detection accuracy of 96.67%. Chiu et al. [
11] proposed an automated approach that used fluorescence imagery to detect apple bruises. Dubey et al. [
12] introduced a system for recognizing surface defects in apples based on local binary patterns, achieving a detection accuracy of 93.14%. Ahmed et al. [
13] developed a mango fruit lesion segmentation method that outperformed threshold-based, edge-based, texture-based, and color-based segmentation techniques. Nadarajan et al. [
14] also introduced a watershed algorithm-based method for detecting mango defects. Wang et al. [
15] applied a Fisher’s Linear Discriminant Analysis (LDA) to detect orange skin defects and achieved a detection accuracy of 96.70%. Slaughter et al. [
16] employed machine vision with ultraviolet fluorescence to detect orange damage, achieving 87.9% accuracy. Fu et al. [
17] used fluorescence hyperspectral imaging to detect early bruises in pears, achieving 93.33% accuracy 15 min after bruising had occurred. Okere et al. [
18] used Vis-NIR and SWIR hyperspectral imaging to detect pomegranate bruises, achieving an 80–96.7% accuracy range in bruise severity classification.
Research on pineapple fruit detection, particularly damage detection, is still in its infancy. Nonetheless, some researchers have published related results. For example, Chen et al. [
19] developed a golden diamond pineapple surface detection system based on CycleGAN and YOLOv4, achieving an average precision of 84.86%. Li et al. [
20] proposed a pineapple thorn detection method based on feature recognition and spatial localization. By extracting the characteristics of pineapple thorns through image processing and performing coordinate transformations on surface contour features, their method effectively detected and localized thorns. However, it faced challenges when the color difference between the pineapple’s surface and its thorns was small. Other work in this field has primarily focused on fruit object detection or maturity evaluation [
21,
22,
23,
24], but studies specifically addressing pineapple surface damage detection remain scarce and preliminary.
Against this backdrop, the present study proposes a pineapple mechanical damage detection method based on machine vision. The research concentrates on image segmentation algorithms and damage area calculation, aiming to facilitate the accurate and efficient detection of mechanically damaged regions on pineapple fruit surfaces.
2. Materials and Methods
2.1. Structure of the Machine Vision System
An experimental machine vision system was designed and developed to detect mechanical damage in pineapple fruit.
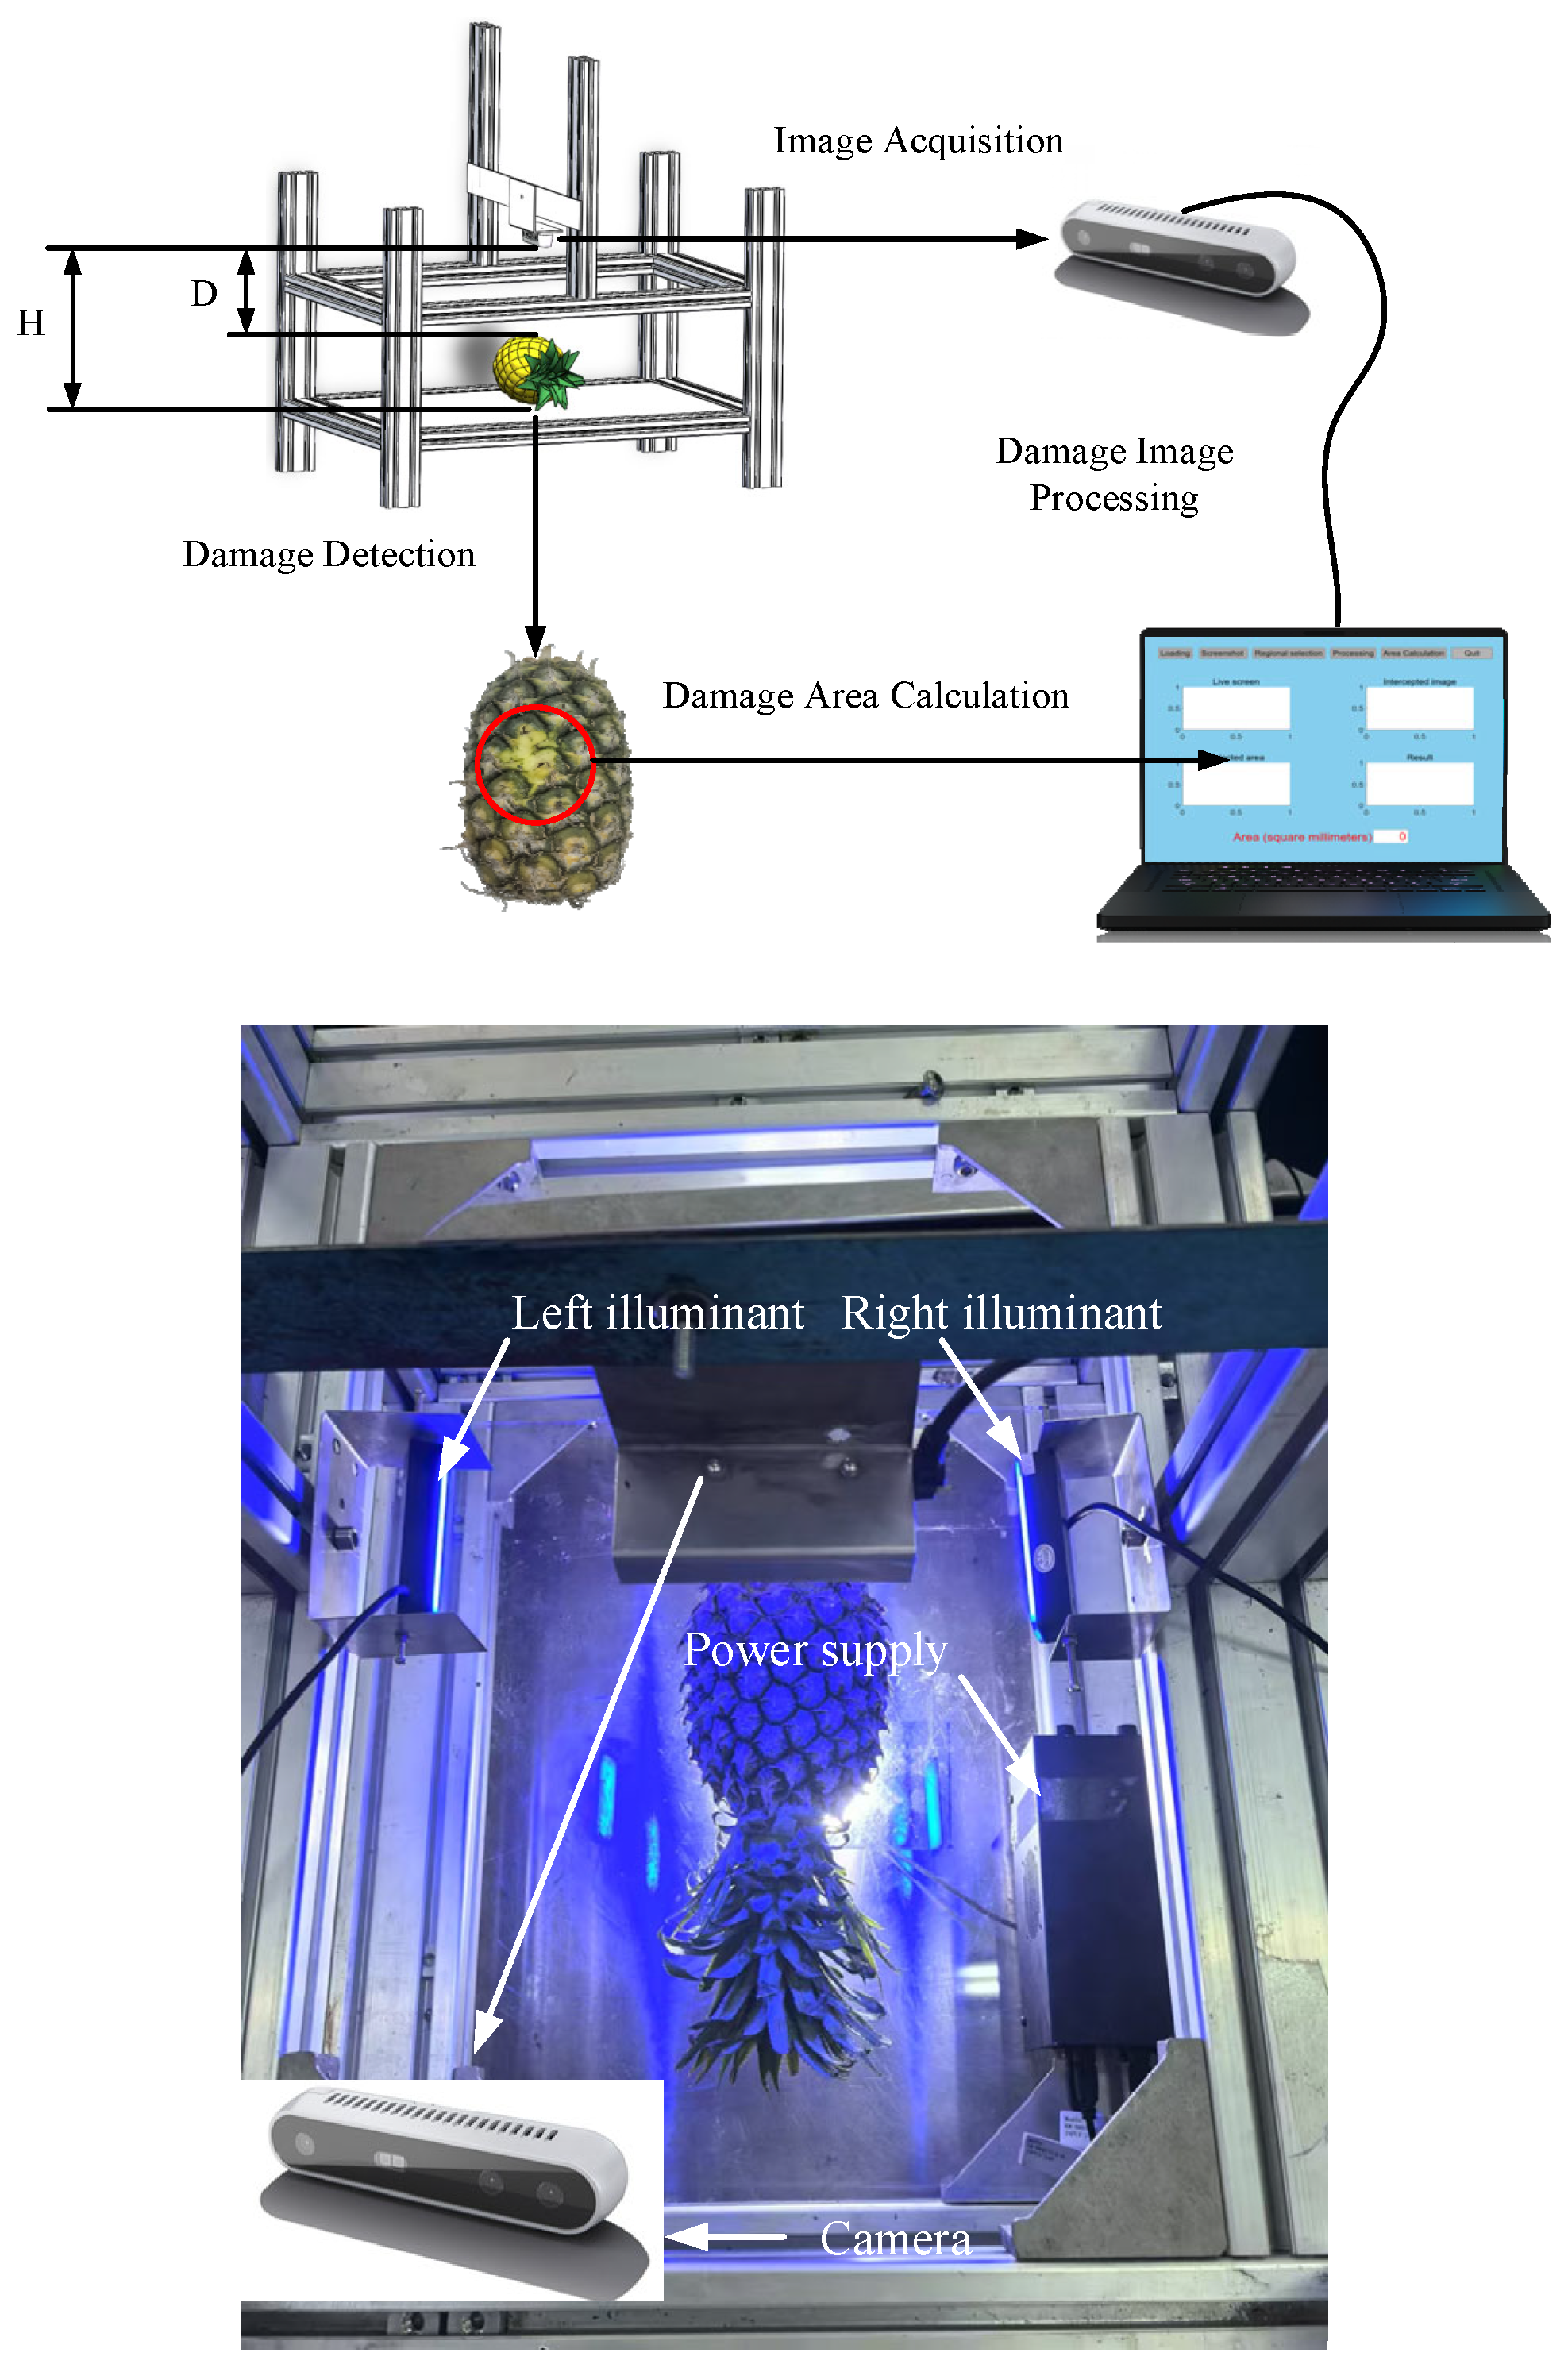
Figure 1 shows the overall structure of the system, which consisted of three main components: a camera, a Tianxuan 4 laptop (ASUS Computer Inc, Made in China Suzhou), and a supporting framework. As shown, the camera was mounted on an L-shaped bracket, which was then fixed to a horizontal plate. This horizontal plate was secured to an aluminum platform, where the injured pineapple fruit was placed. In the image, the distance between the camera and the top surface of the pineapple is denoted as D and the distance between the camera and the platform surface (used to place the fruit) is denoted as H. The camera was oriented perpendicular to the platform to minimize depth-measurement errors associated with lens tilt. To avoid interference from extraneous colors, the platform’s tabletop (which held the fruit) was made of white acrylic. The camera connected to the computer via a USB interface for image-data transmission. The laptop handled image processing and other computational tasks.
2.2. Pineapple Image Acquisition Equipment
The image acquisition device in this experiment was the Intel RealSense D435i depth camera, which comprised a pair of infrared cameras, an infrared laser projector, and an RGB camera. It could capture both color and depth images and output depth measurements in the range of 0.1–10 m.
The working principle of the D435i depth camera was based on triangulation. An infrared laser projector casted a pattern onto the scene, and the left and right infrared cameras captured the reflected infrared light, producing point-cloud data and corresponding grayscale images. By calculating the disparity between these two infrared images, the camera generated a final depth map. Meanwhile, the onboard RGB camera captured color images. Through data alignment, each RGB pixel corresponded to a specific depth value, resulting in a color image that included depth information.
The depth information acquisition was constrained by factors such as the minimum working distance, the field of view and accuracy of the depth sensor, and the density of the projected infrared pattern. Consequently, the distance between the camera and the object was required meet the sensor’s minimum working-distance requirement to ensure sufficient clearance for accurate depth capture. If the object was placed too close, the camera failed to record valid depth measurements, assigning a depth value of zero (and producing black regions in the software).
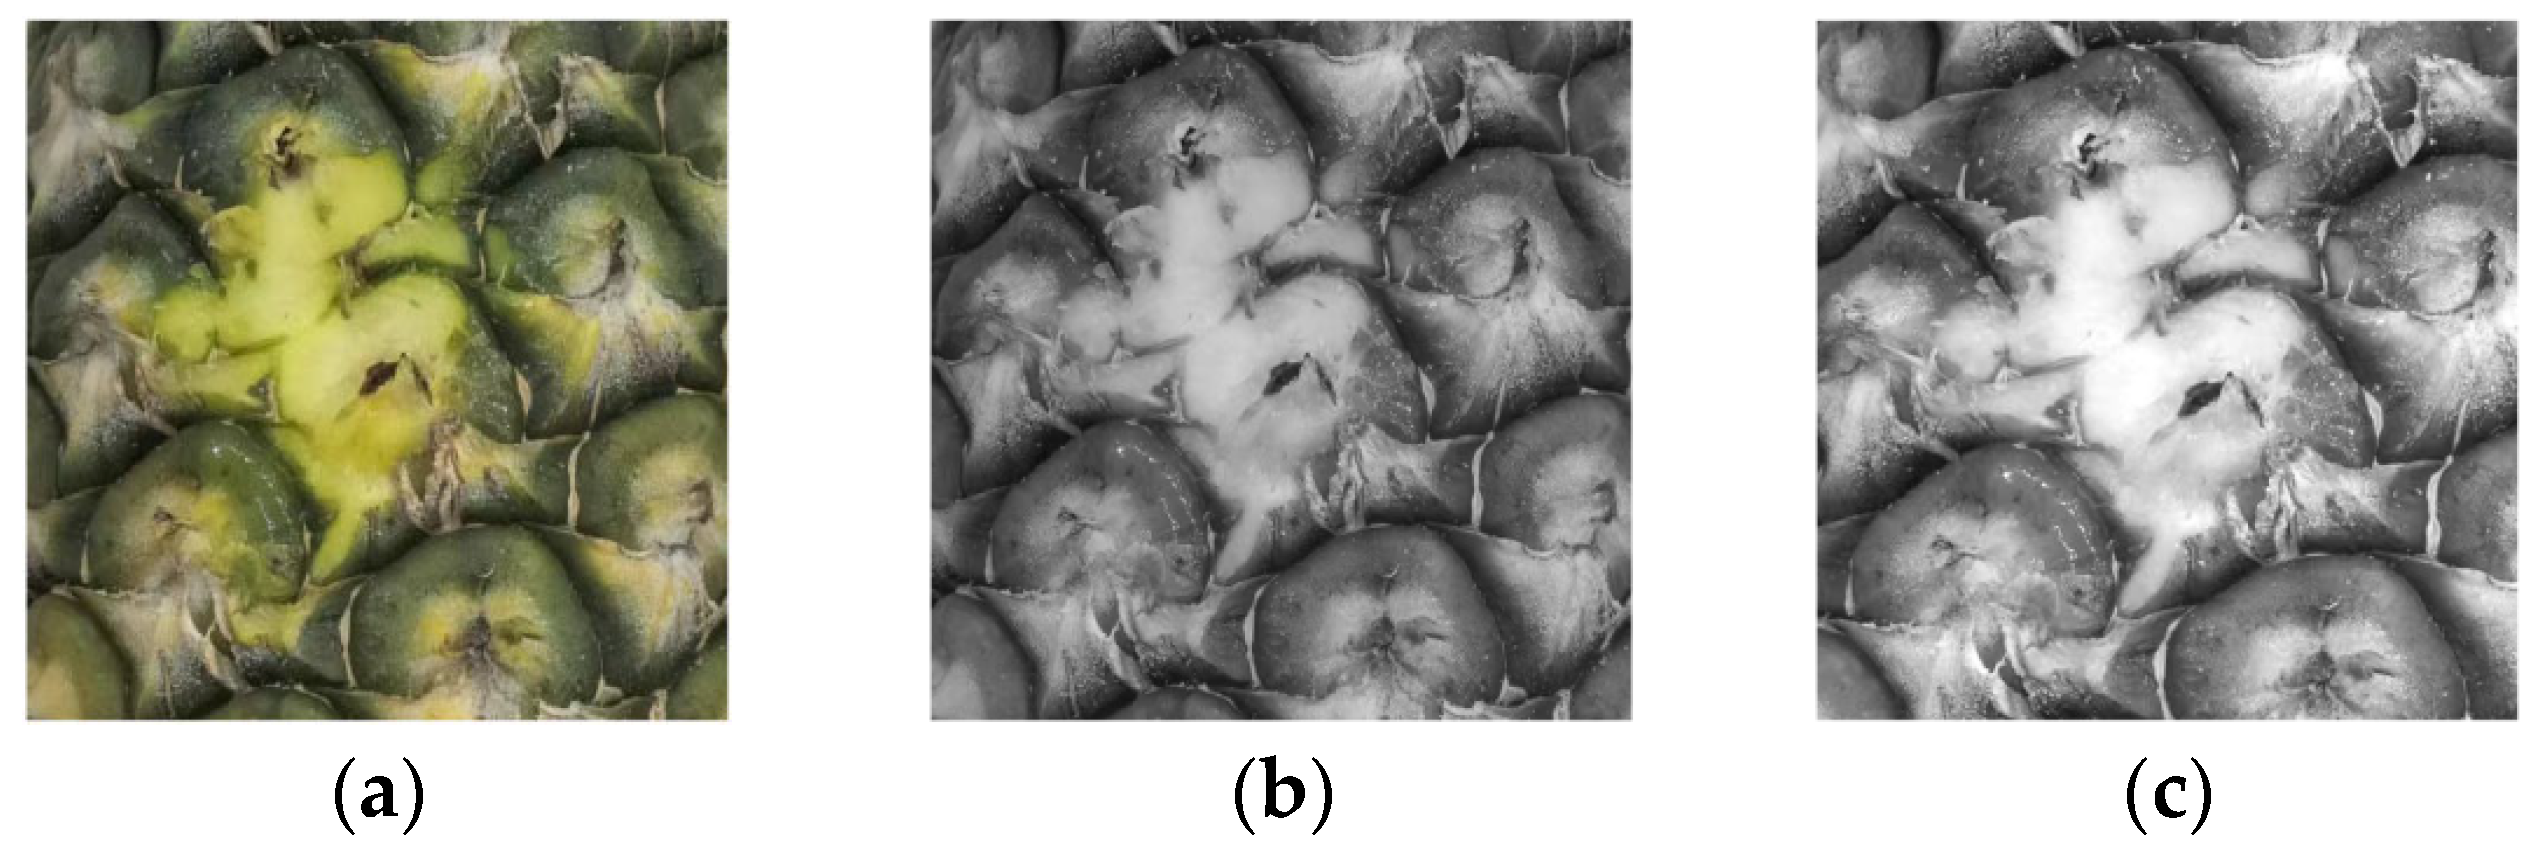
Figure 2a,b shows examples of the depth images captured at valid and invalid distances, respectively, using Intel’s RealSense Viewer software (Intel-RealSense-Calibration-Tool-2.14.2.0).
2.3. Pineapple Detection Workflow
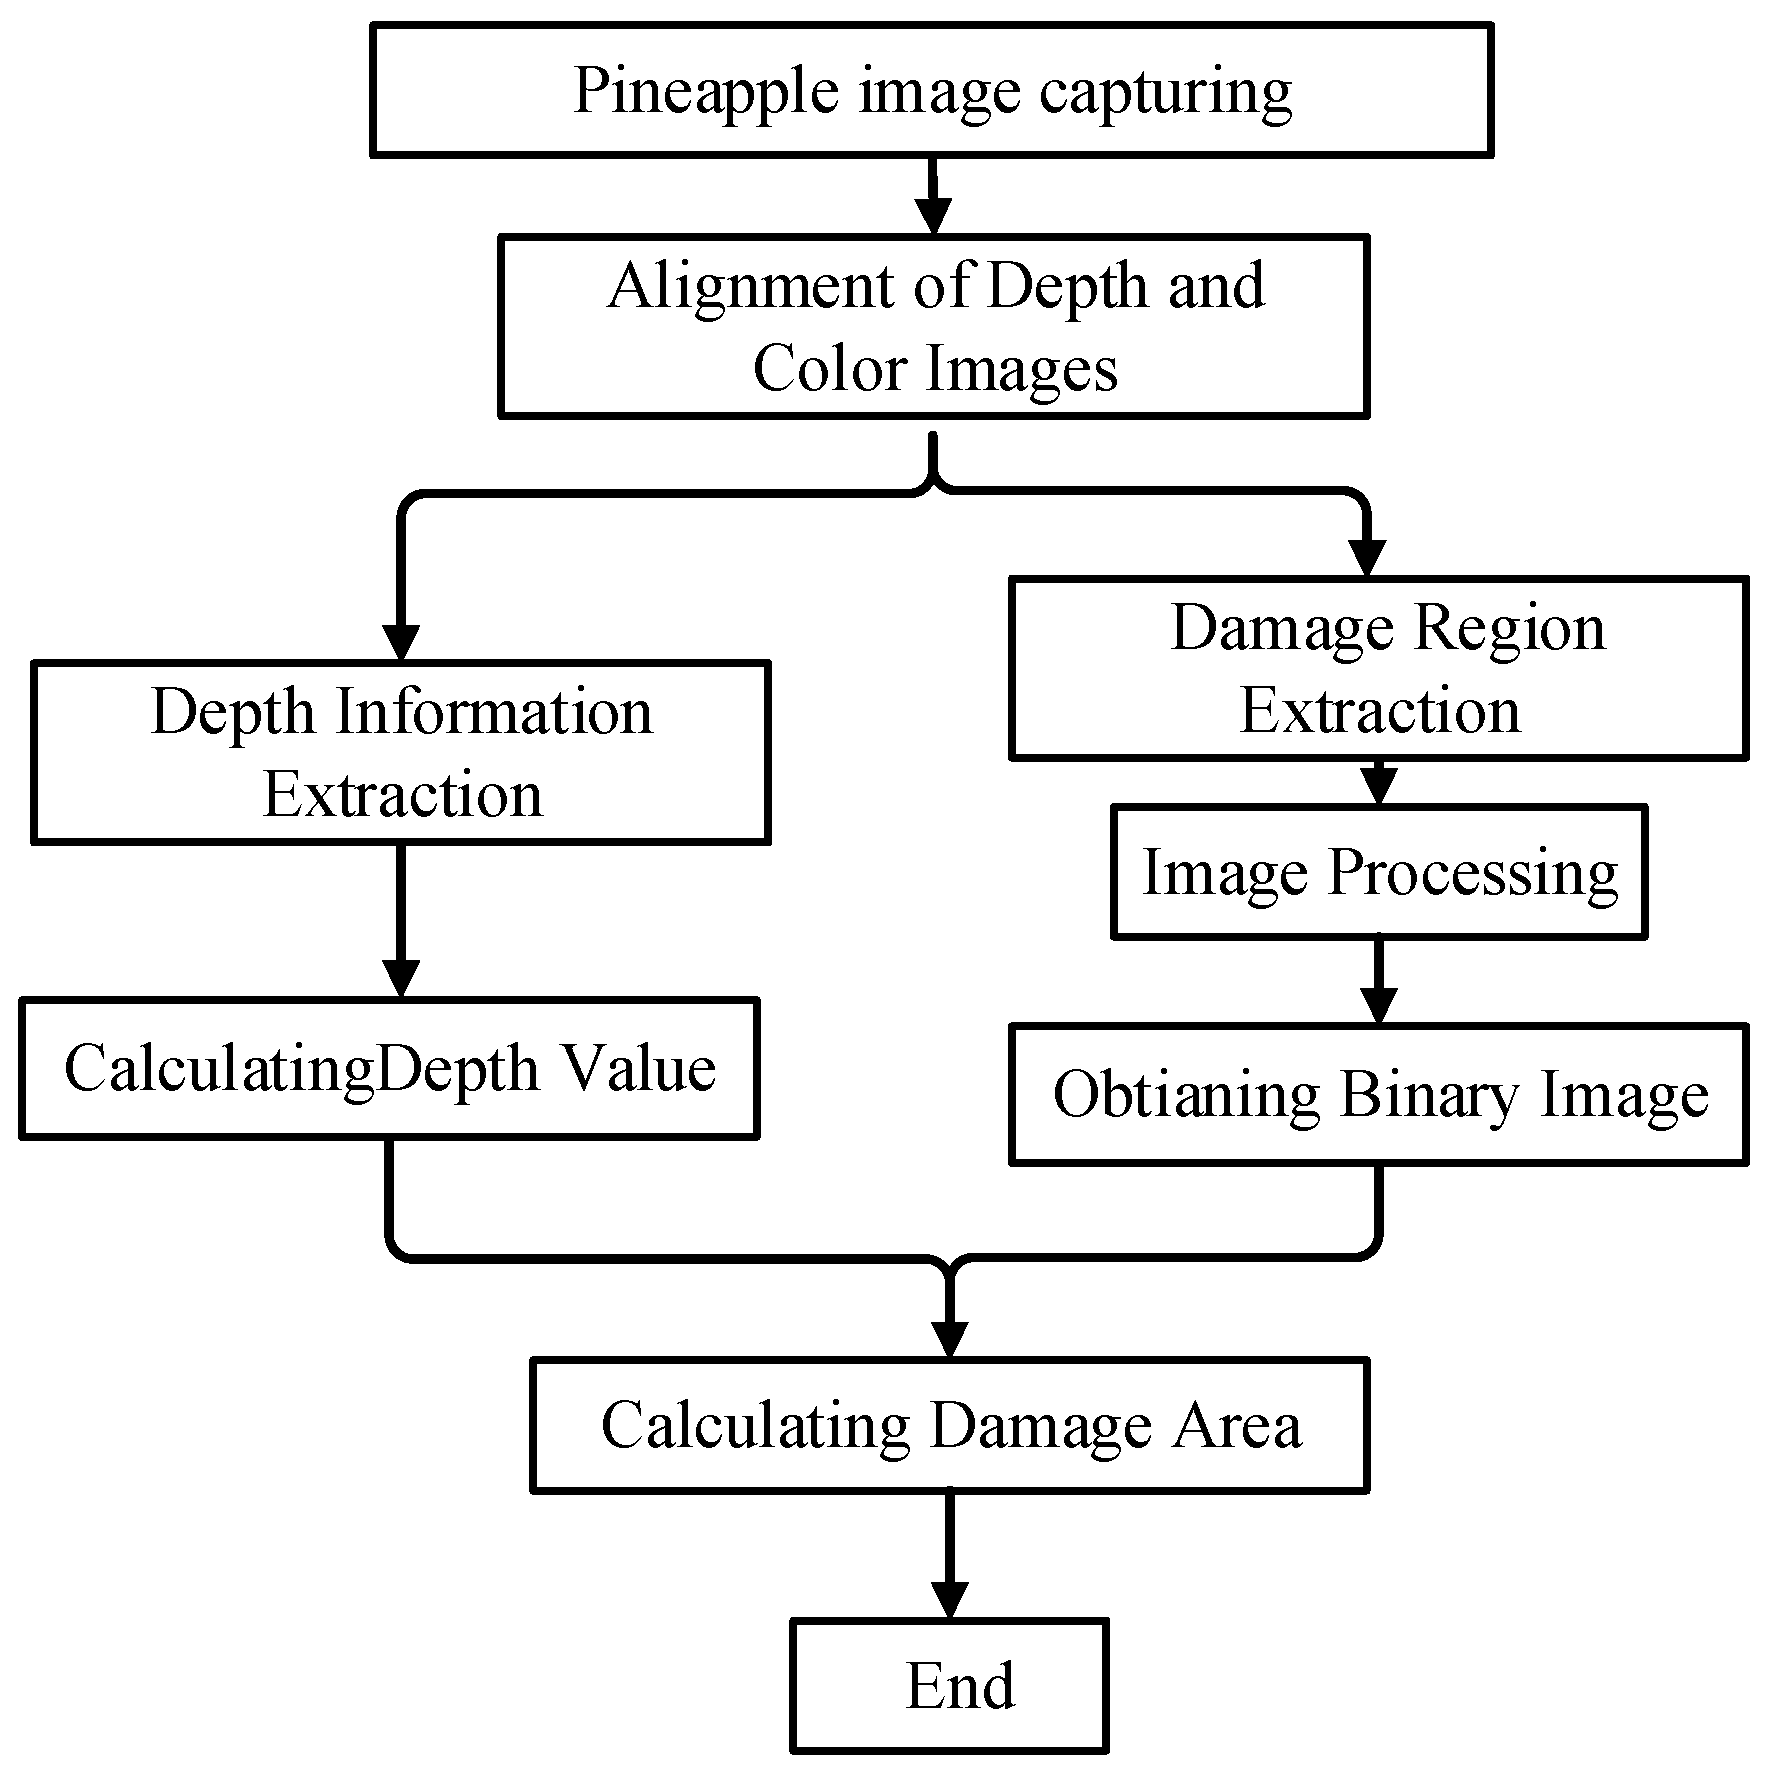
The pineapple detection procedure began with image capture of the pineapple placed on the experimental platform using a D435i depth camera (Intel Corporation, Santa Clara, CA, USA). Next, image-data alignment was performed, and the damage region was extracted and binarized using image-processing algorithms. Depth values were subsequently obtained and, by combining this depth information with the pixel data, the actual surface damage area of the pineapple was calculated.
Figure 3 provides an overview of this workflow, illustrating how the system transitioned from raw image capture to final damage-area computation.
2.4. System Interface Design
MATLAB 2023b software (MathWorks, Inc., Natick, MA, USA) was chosen as the development platform due to its robust image-processing capabilities, providing a wide range of image processing functions and algorithms, which shorten development time. It enables data visualization of image processing results, facilitating quick data analysis and algorithm optimization. In addition, the official Intel RealSense SDK provides tools for calling the depth camera through MATLAB, enabling operations such as data stream alignment, image acquisition, and data collection, which reduces algorithm development time. Therefore, MATLAB was selected as the algorithm development platform, and a visualized experimental software interface was designed.
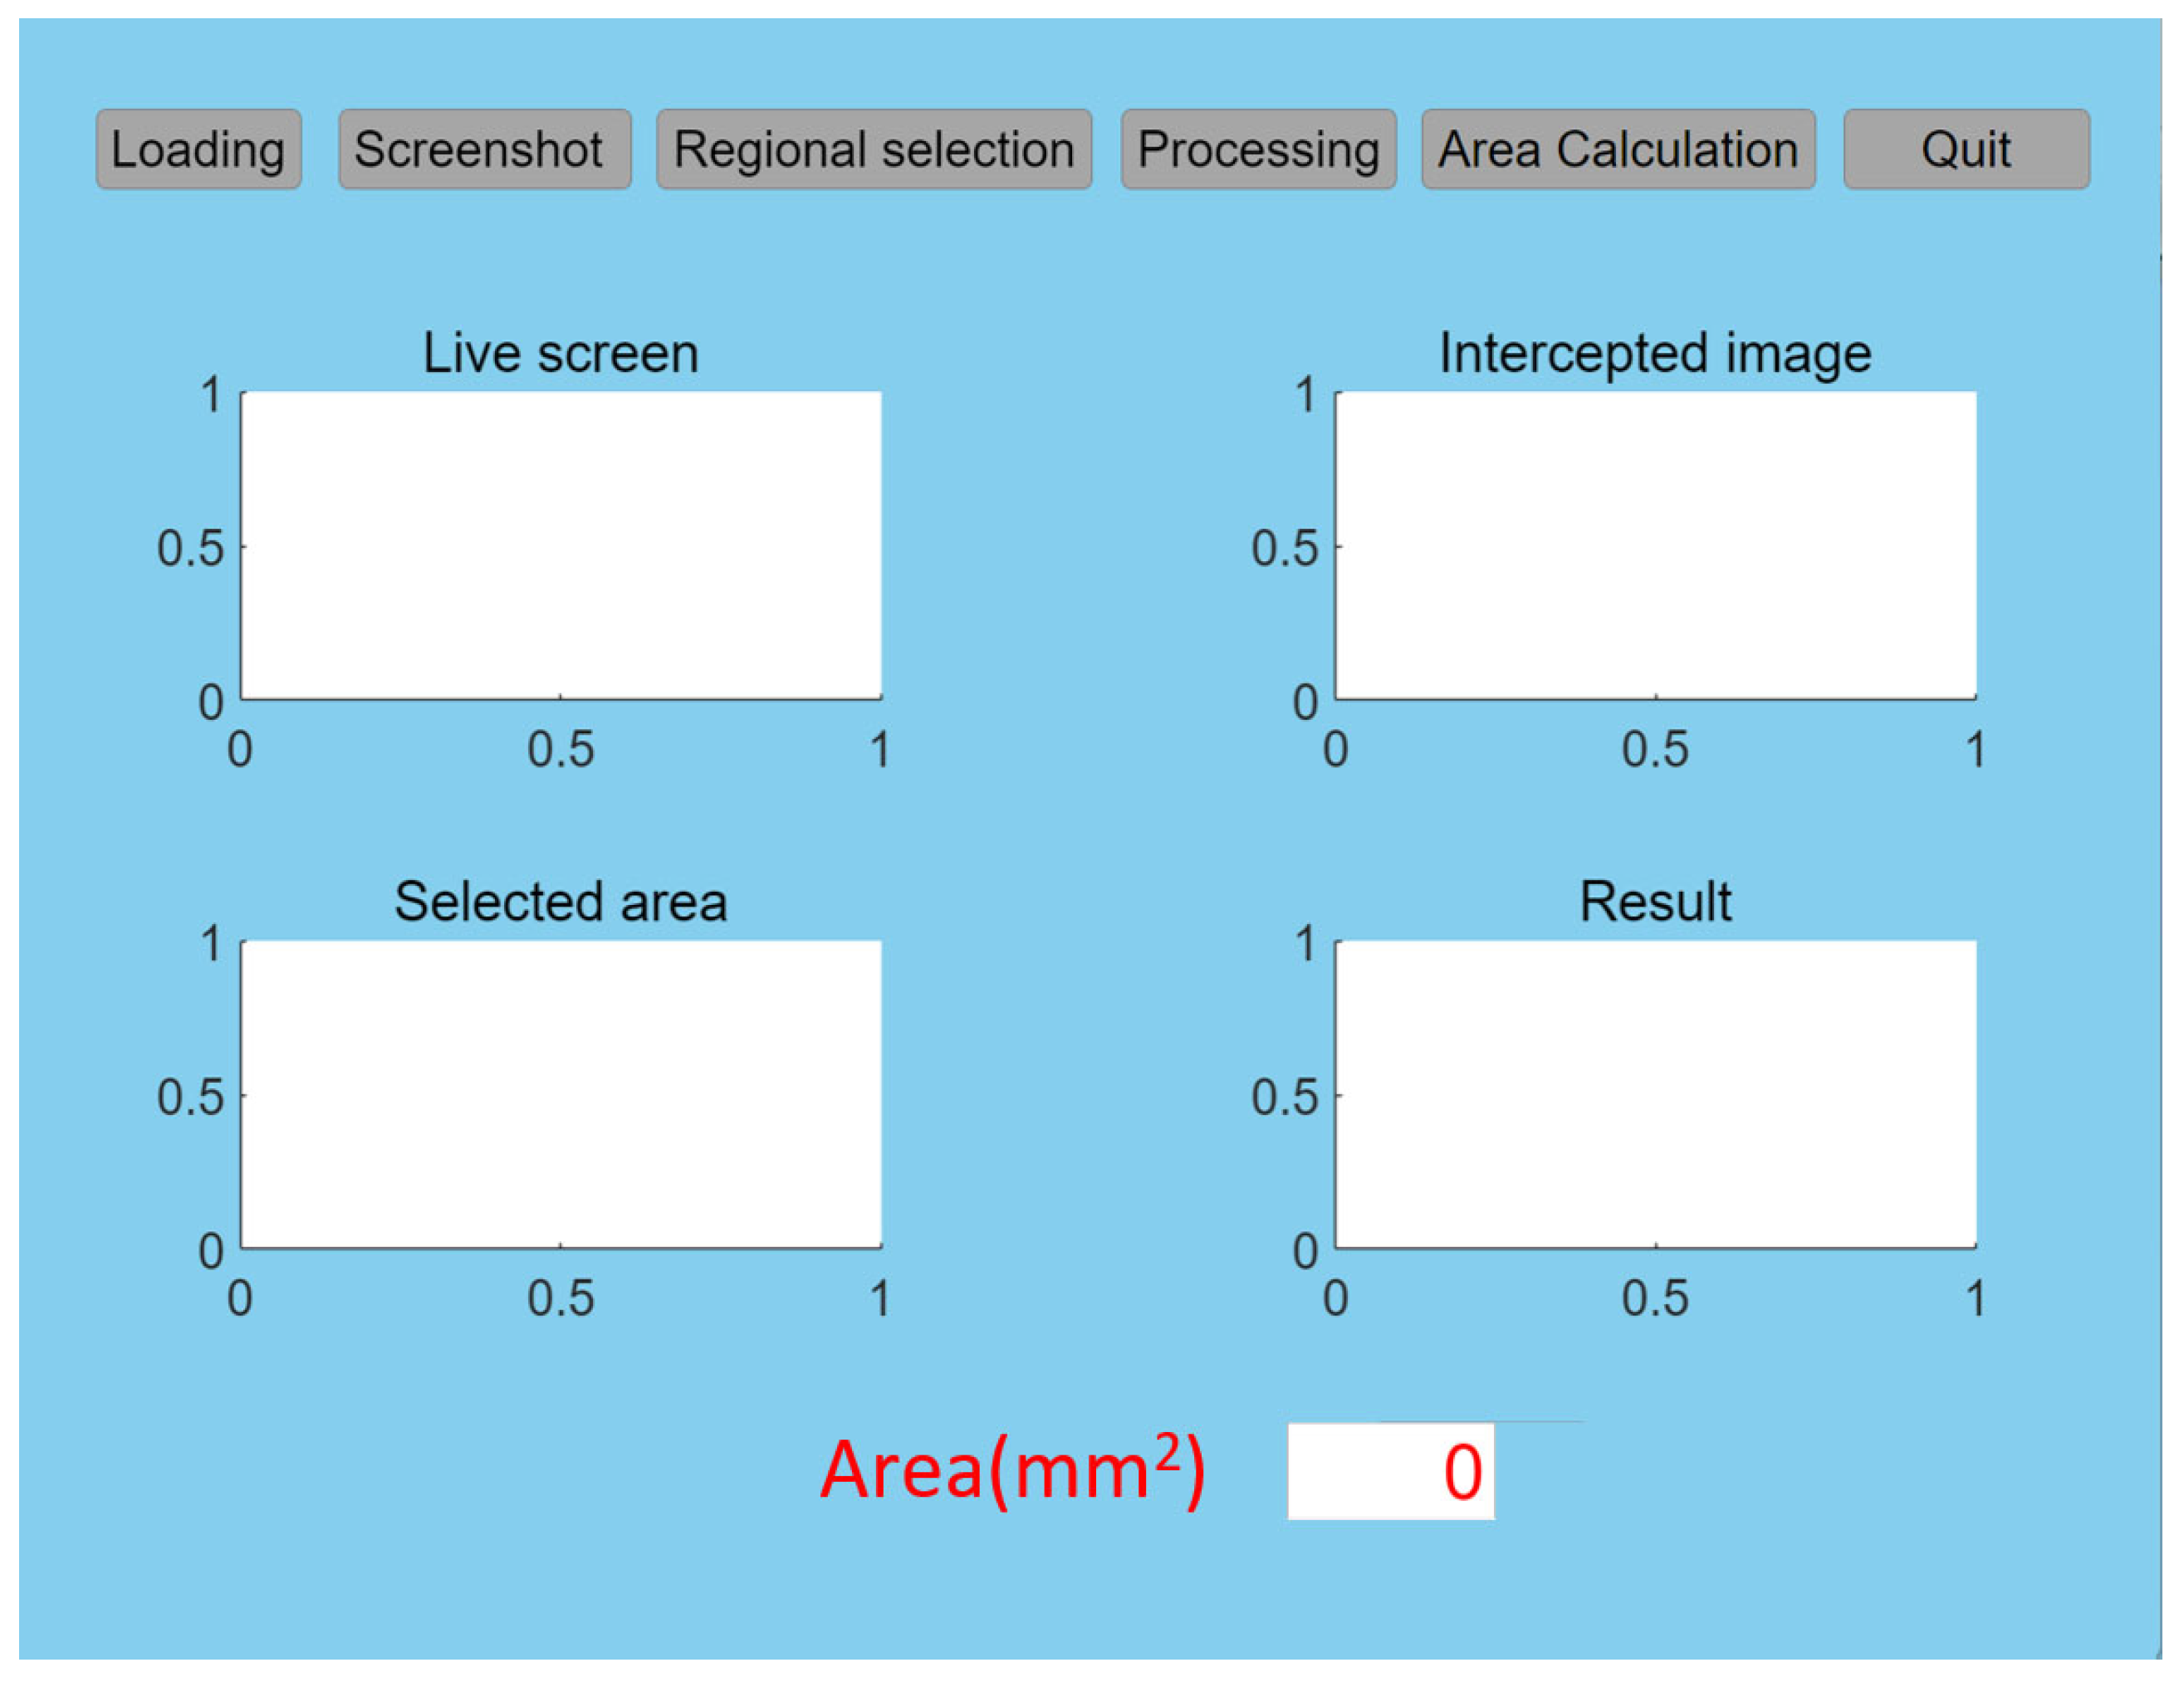
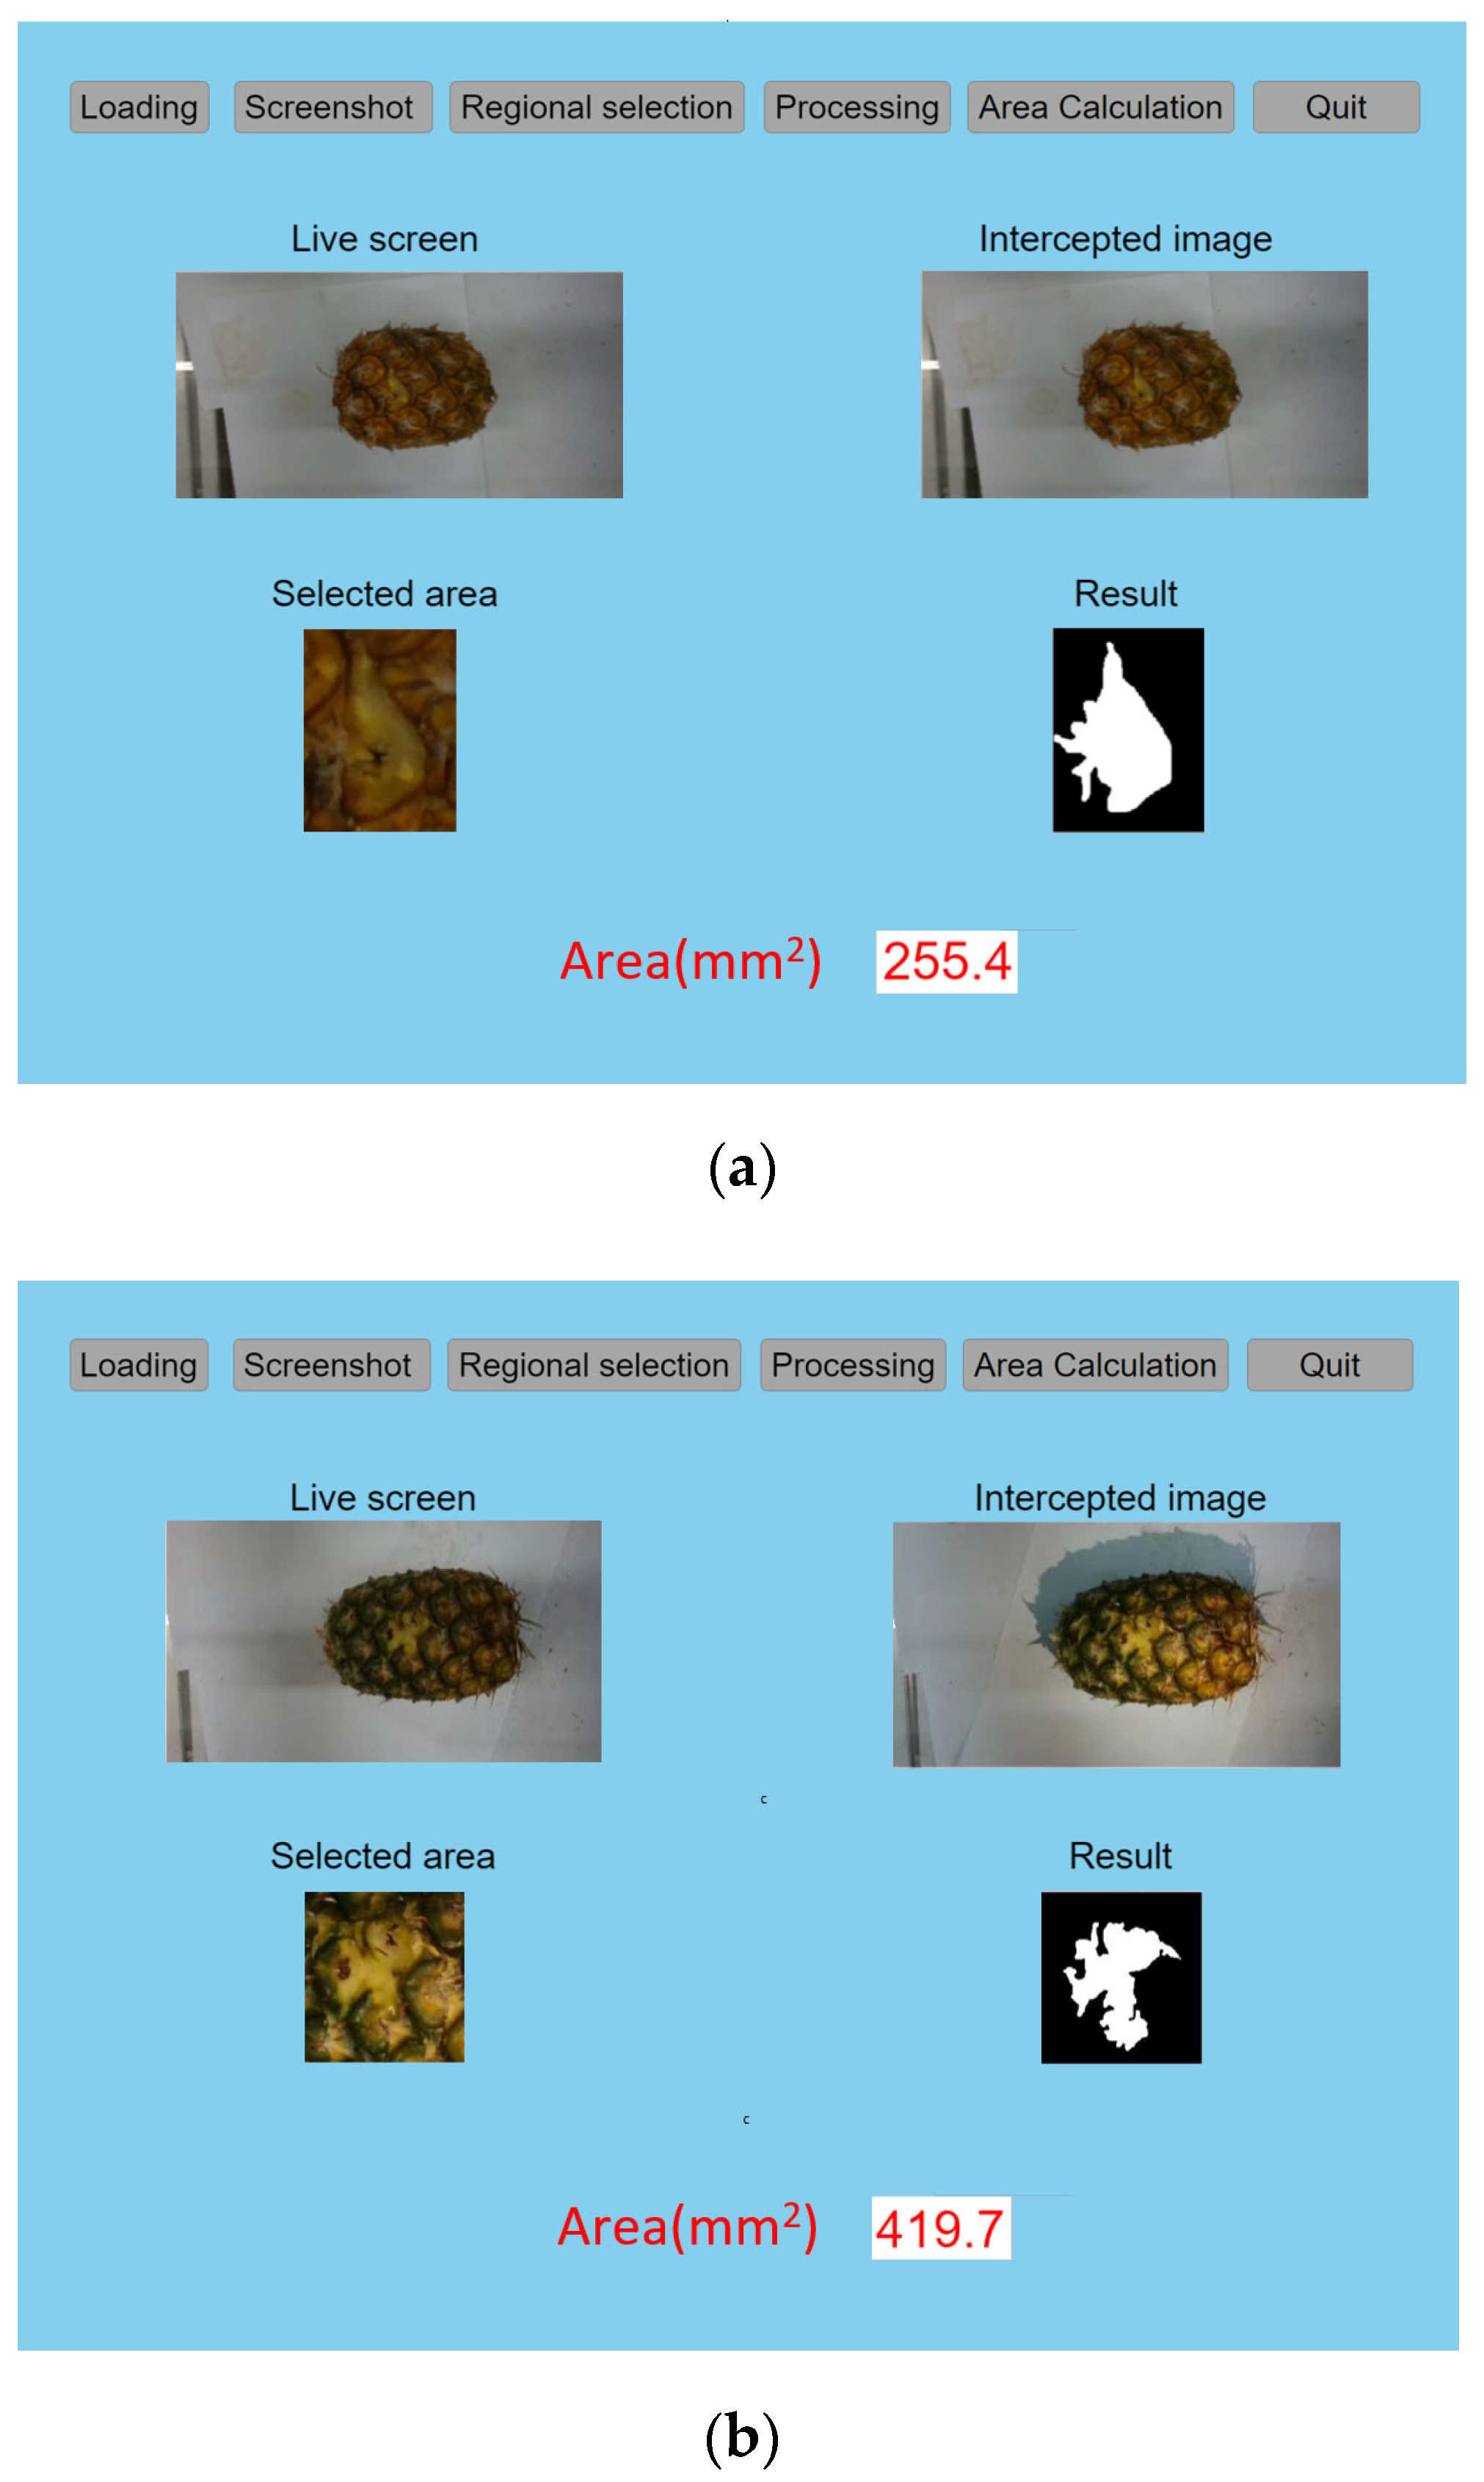
The software interface included five major modules: video loading, image cropping, region selection, image processing, and area measurement. During the experiments, the camera was first activated for real-time image capture, allowing the user to adjust the pineapple’s position immediately. The image was then cropped and displayed on the interface. Because the 1280 × 720 resolution from the depth camera may have been too large for detailed processing of the damaged area, the user selected a region of interest to isolate the pineapple fruit damage area. After region selection, image-processing algorithms generated a binary image of the damaged area, and finally, the system calculated and output the measured damage area.
Figure 4 shows the MATLAB software interface designed to implement these functions.
2.5. Image Processing Algorithms
Image processing applies computer algorithms to modify pixel information and spatial structures within an image, yielding images with specific qualities and features [
25]. The proposed algorithm first preprocessed the acquired pineapple damage images via methods such as grayscale conversion, intensity adjustment, and denoising. The aim was to produce grayscale images with minimal noise, sharp contours, and high contrast in the damaged regions. Lastly, an image segmentation algorithm was used to obtain the damage contours.
2.5.1. Grayscale Processing
Grayscale conversion transforms a color image into shades of gray ranging from 0 (black) to 255 (white), thereby enhancing processing speed and facilitating contrast adjustments to highlight important features [
26]. Four standard approaches exist for converting RGB images to grayscale: (1) using an arbitrary channel; (2) taking the maximum value of the
R,
G, and
B channels; (3) taking their average value; or (4) using a weighted average of the three channels. Here, the weighted-average method was adopted, and its function could be expressed as follows:
Figure 5a,b shows the RGB image of a pineapple’s damaged area and its corresponding grayscale image.
2.5.2. Contrast Enhancement
Since a pineapple’s damage area was identified using color differences, a contrast enhancement algorithm was applied to accentuate the grayscale difference between the damaged and undamaged pixels, thereby improving the recognition rate. A linear grayscale transformation was used to change the grayscale values via a linear function, as described in Equation (2):
where
R represents the original grayscale value,
S represents the transformed grayscale value,
k represents the contrast factor, and
b represents the brightness factor. When
k > 1, the grayscale values increased, resulting in a higher contrast in the image, and when 0 <
k < 1, the contrast decreased. If
k < 0, bright pixels became darker, while dark pixels became brighter. Adjusting the
b value modified the brightness of the grayscale image. In this study,
k was set as 1.25.
Figure 5c shows the result of applying this linear grayscale transformation to
Figure 5b.
2.5.3. Image Denoising
The grayscale-transformed pineapple fruit damage image often contained noise, which diminished clarity and may have interfered with subsequent edge detection. Image denoising therefore enhanced clarity and prepared the image for contour extraction. Denoising is primarily achieved using filtering algorithms [
27]. Here, Gaussian filtering was first used to remove noise, followed by Laplacian filtering to highlight image details and edges.
Gaussian filtering is a linear smoothing technique that applies a Gaussian kernel with circular symmetry, performing a weighted sum of the pixel’s neighborhood. Each pixel’s value is updated by the weighted average of its own value and those of adjacent pixels. To ensure a clear central point, the Gaussian kernel size is generally odd, and in this study, a [3 × 3] kernel was selected for the filtering calculation. The Gaussian filtering operation was as expressed in Equations (3) and (4):
where
f represents the original image,
w denotes the Gaussian filter kernel,
is the filtered image,
K is a constant, and
σ is the standard deviation of the Gaussian distribution.
As the center of the Gaussian kernel moved across the image, a filtered image was produced. While Gaussian filtering effectively removed noise, it also blurred edges. Therefore, after the Gaussian filtering, Laplacian filtering was employed to sharpen the image and enhance details. The Laplacian algorithm computed the Laplacian of the image and added it back to the original image to produce the sharpened result. It can be expressed as follows:
where
represents the Laplacian operator,
and
denote the input and output images, respectively, and
c is the coefficient corresponding to the second-order derivative of the Laplacian kernel.
For discrete images, the first order derivative was expressed as follows:
By applying the Laplacian operator, small details were amplified, and the images were sharpened.
Figure 6a and
Figure 6b show the outcomes of applying Gaussian and Laplacian filtering, respectively, to
Figure 5c.
2.5.4. Image Segmentation
The commonly used image segmentation methods include thresholding, clustering-based segmentation, edge detection, and morphological segmentation [
28]. Thresholding is widely used in fruit recognition and detection as an initial step that binarizes an image, thereby simplifying subsequent feature extraction [
29]. Clustering-based methods group regions with similar grayscale or color values; however, their accuracy often diminishes under complex conditions. Morphological methods operate on a binary image using specific structural elements.
Since more than 30% of a mature pineapple’s surface is yellow and a damaged area often appears in a similar shade of yellow, their color differences can be minimal. Additionally, the damage boundary tends to be highly irregular, making it challenging to capture a complete and continuous contour using a single segmentation technique. Therefore, multiple segmentation methods were combined here to ensure that the extracted damage contours closely matched the actual pineapple damage region and maintained smooth edges.
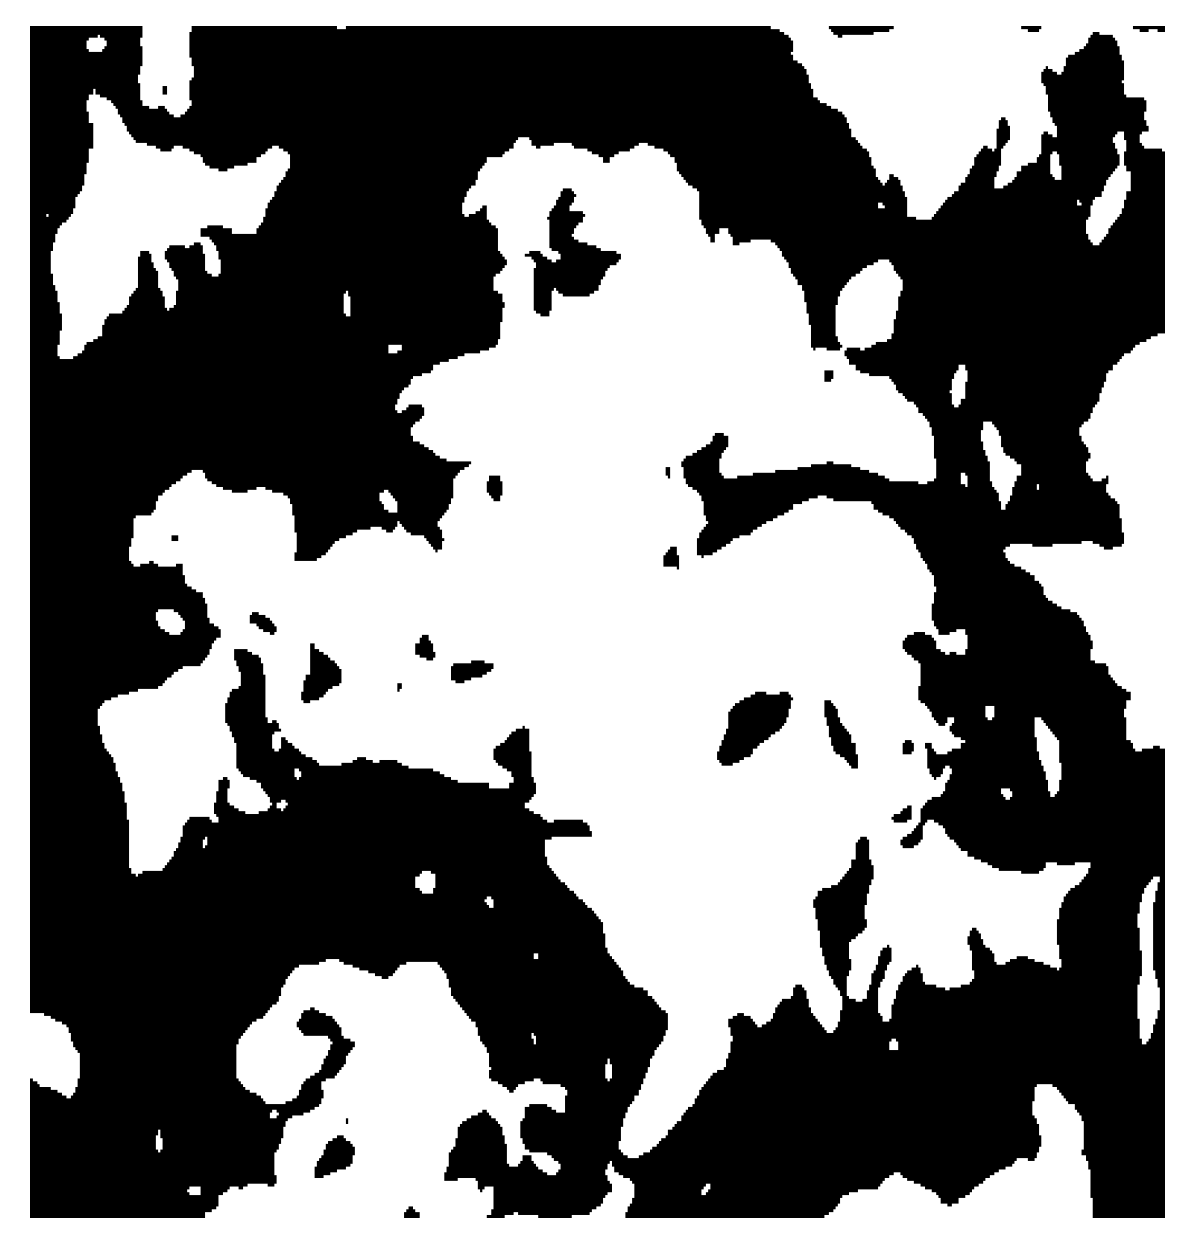
The first step in segmenting a pineapple’s damaged region was to binarize the preprocessed grayscale image using Otsu’s method. This method determines a threshold by maximizing between-class variance and then segments an image to produce a binary result. The binary image corresponding to
Figure 6b is shown in
Figure 7.
- 2.
Morphological Segmentation
After thresholding, scattered noise appeared in the binary image, caused by factors such as the pineapple’s surface texture or light reflections. A morphological algorithm was used to remove these background noise points and smooth the damage contours by applying structural elements to the binary image through intersection and union operations.
An opening operation followed by a closing operation effectively reduced noise in the image backgrounds and yielded smoother damage boundaries [
30,
31]. This procedure can be expressed by Equation (12):
where ∘ represents the opening operation and · represents the closing operation, which are shown in Equations (13) and (14), respectively:
where ⊖ represents the corrosion operation and ⊕ represents the dilation operation, which are shown in Equations (15) and (16), respectively:
where
A represents the set of foreground pixels (targets),
B and
are structural elements,
o is a foreground pixel,
A ⊖
B represents the corrosion of
A by
B, and
A ⊕
B represents the dilation of
A by
B.
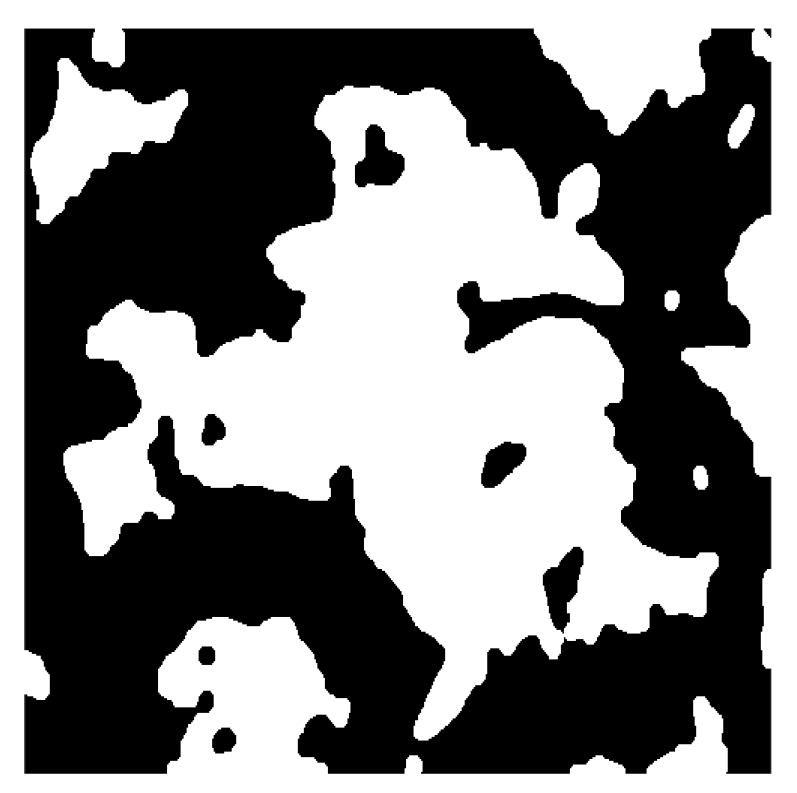
To ensure an accurate damage-region output, the structural element’s radius could not have been too large. In this work, a circular structuring element with a radius of 5 pixels was chosen to effectively remove background noise while preserving the actual damage region. The resulting binary image corresponding to
Figure 7 is shown in
Figure 8.
- 3.
Edge Detection
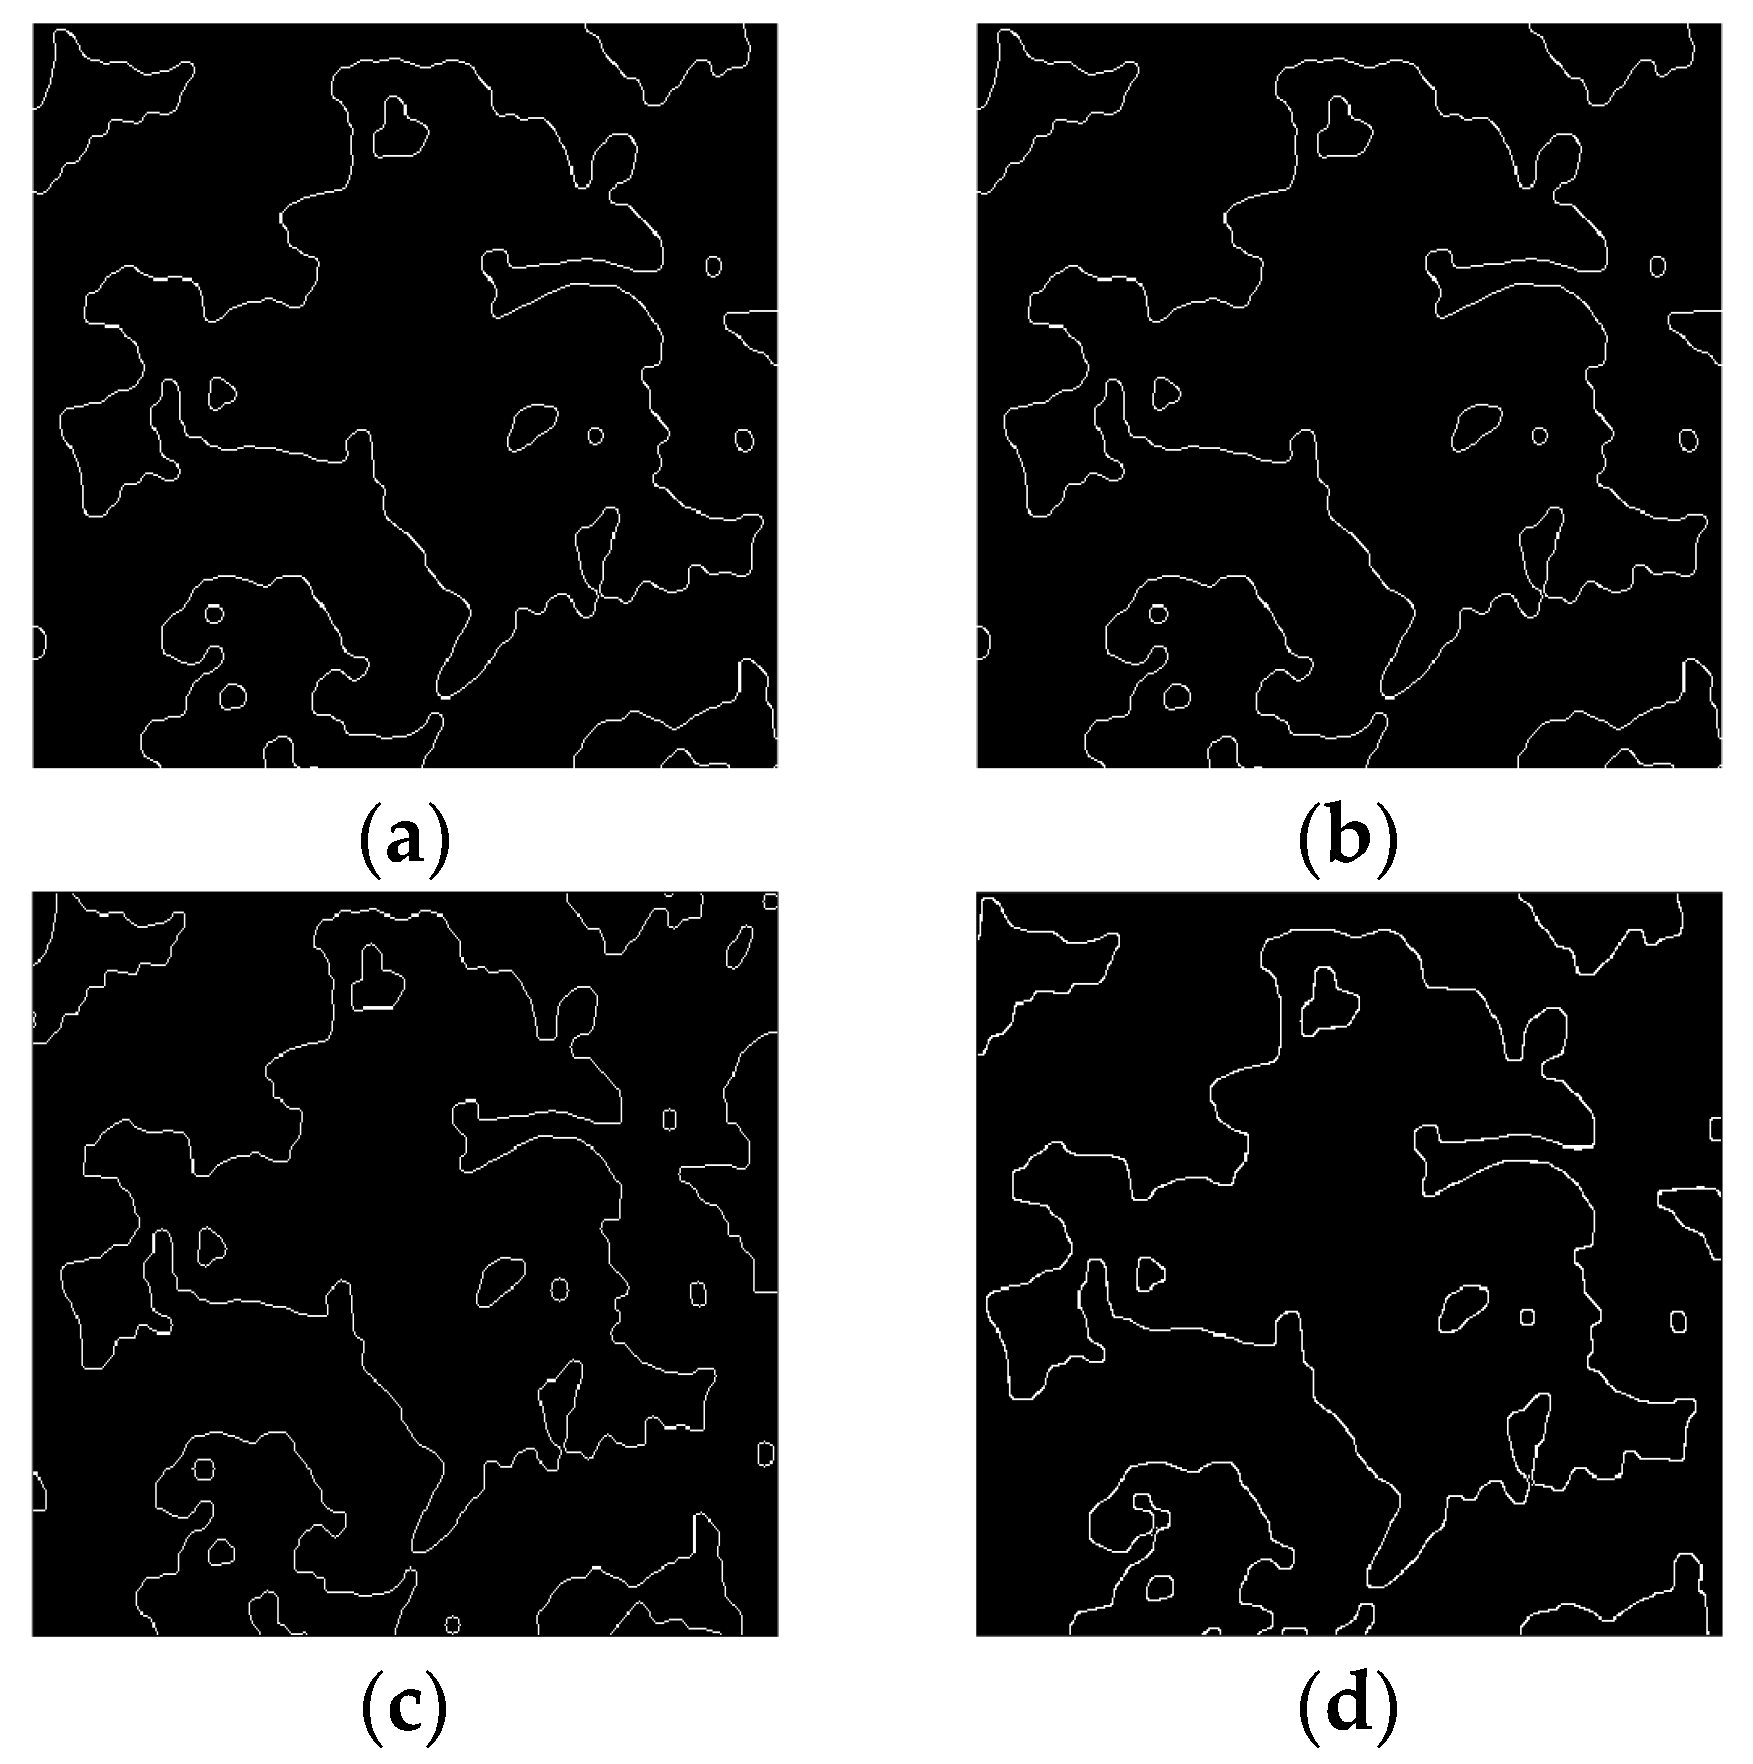
The final step of the image segmentation procedure was edge detection. Besides the Sobel operator, Prewitt, LoG, and Canny operators are commonly used for edge detection.
Figure 9 compares the edge images extracted by these operators, with identical Gaussian standard deviation parameters. The results indicated that the Canny operator provided clearer and smoother closed contours, demonstrating superior edge-recognition performance over the other three operators. Therefore, the Canny operator was selected for edge detection.
2.5.5. Damage Area Filling
To generate a binary image containing only the damage regions, the edge contours obtained through the Canny edge-detection algorithm were filled. This process removed large-scale interference areas that were difficult to eliminate with denoising alone. The filling equation is shown in Equation (17):
where
C represents the structural element and
represents the image when
k = 0,
represents the array with element 0, and when
=
, for
, all contained holes would be filled. Both closed contours and smaller enclosed regions in the pineapple damage image were filled, whereas open regions appeared as open-loop contours. The filling result for the binary image in
Figure 9d is shown in
Figure 10.
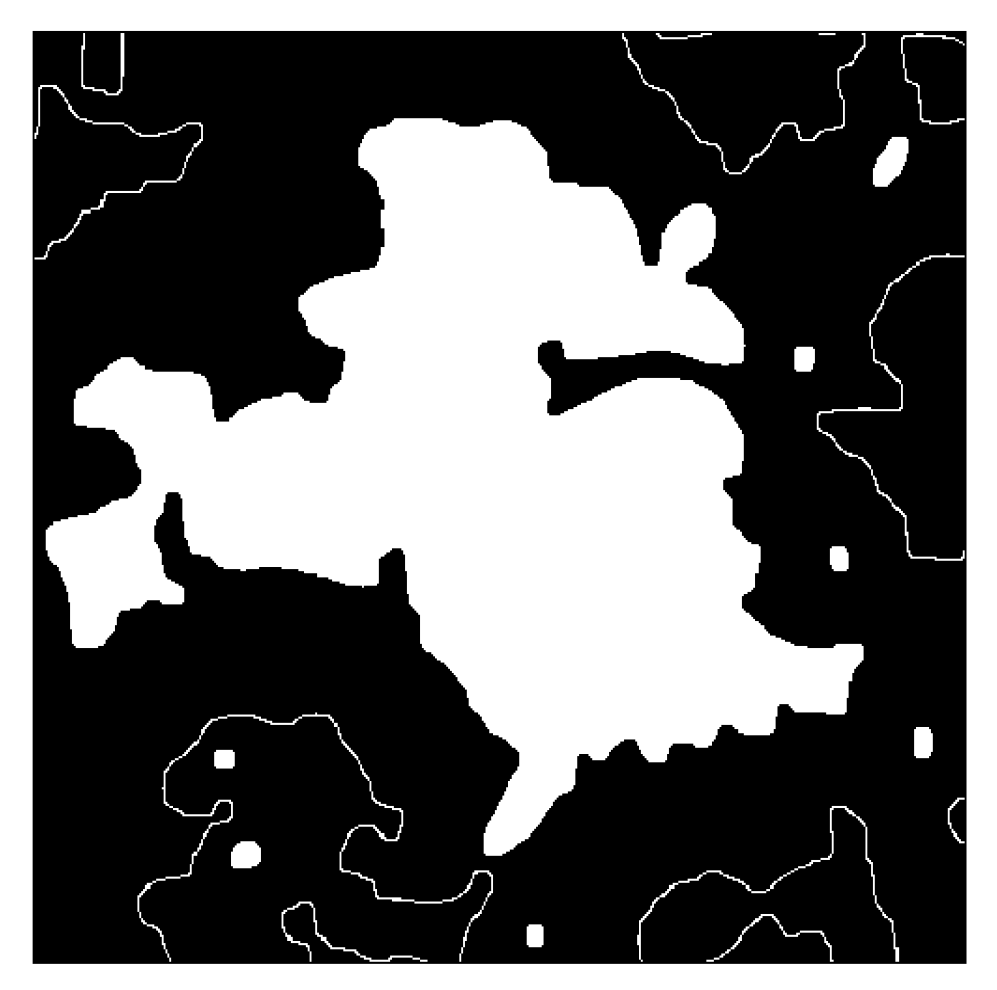
The binary image was composed of the pixel values 0 and 1, where 1 indicated a highlighted (filled) region. By summing all non-zero pixel values, the filled area could be computed relative to the total number of pixels. In this example, the filled region reached 66,233 pixels, with less than 20% of that area being erroneous fills. By removing filled regions above a pixel threshold of 12,000, a background-interference-free binary image was obtained, as shown in
Figure 11. The equation for removing these large, incorrect fills is shown as Equation (18).
A comparison of
Figure 10 and
Figure 11 reveals that smaller filled areas in the background and open-loop contours were removed, thereby producing a complete image of the damage region. Furthermore, a comparison of
Figure 11 with
Figure 5a demonstrates that after a series of image-processing steps, the final damage region closely matched the actual damage. A series of experimental results confirmed that the recognition accuracy exceeded 80%.
2.6. Damage Area Calculation
The pixel area of the pineapple’s damaged region could be obtained by summing all non-zero pixel values in the binary image. However, this pixel area was not equal to the actual damage area and, therefore, needed to be calibrated. An object with a known actual area and recognizable contour features was used as the calibration object. The depth information was acquired from the depth camera, and a specific point on the calibration object alone with a specific point on the pineapple’s damaged surface were selected to obtain their respective depth values. The depth calculation formula was denoted as shown in Equation (19):
where
D represents the depth at a certain pixel,
f represents the focal length of the camera,
B represents the distance between the two infrared cameras,
d represents the parallax, and
f and
B are the intrinsic parameters of the camera.
Since the depth image could be interpreted as a two-dimensional array where each pixel’s value corresponded to a depth measurement, the depth value of any pixel could be extracted based on its coordinates. The depth values
Ds were then calculated using Equation (20):
where
X = [
x] and
Y = [
y],
x and
y represent the selected pixel coordinates in the depth image, and
N represents the currently extracted depth frame parameter.
After obtaining the depth values of both the calibration object and the pineapple’s damaged area, the same image-processing steps were performed on the calibration object to determine its pixel area in the resulting binary image. A proportional relationship existed between the binary image’s pixel area and the real damaged area. This relationship is defined in Equation (21):
where A
1real represents the actual areas of the calibration object and A
1image represents the pixel areas of the calibration object.
Because the depth values of both the pineapple’s damaged surface and the calibration object were known, the pineapple’s actual damaged area could be calculated using Equation (22):
where
A0real denotes the pineapple’s actual damaged area,
A0image represents the pixel area of the damaged region in the pineapple’s binary image, and
D0 and
D1 are the depths of the pineapple’s damaged surface and the calibration object, respectively.
2.7. Camera Calibration
Camera calibration primarily involves comparing a computed area via an image-processing method with the true area of a known reference object, thereby evaluating the deviation. In this study, a spacer with a 33 mm diameter was selected as the reference object, providing a surface area of 855.3 mm2. Image processing yielded a binary image area of 10,542 pixels, and the final calculation accuracy reached 99% when comparing the measured area to the spacer’s actual area.
2.8. Materials
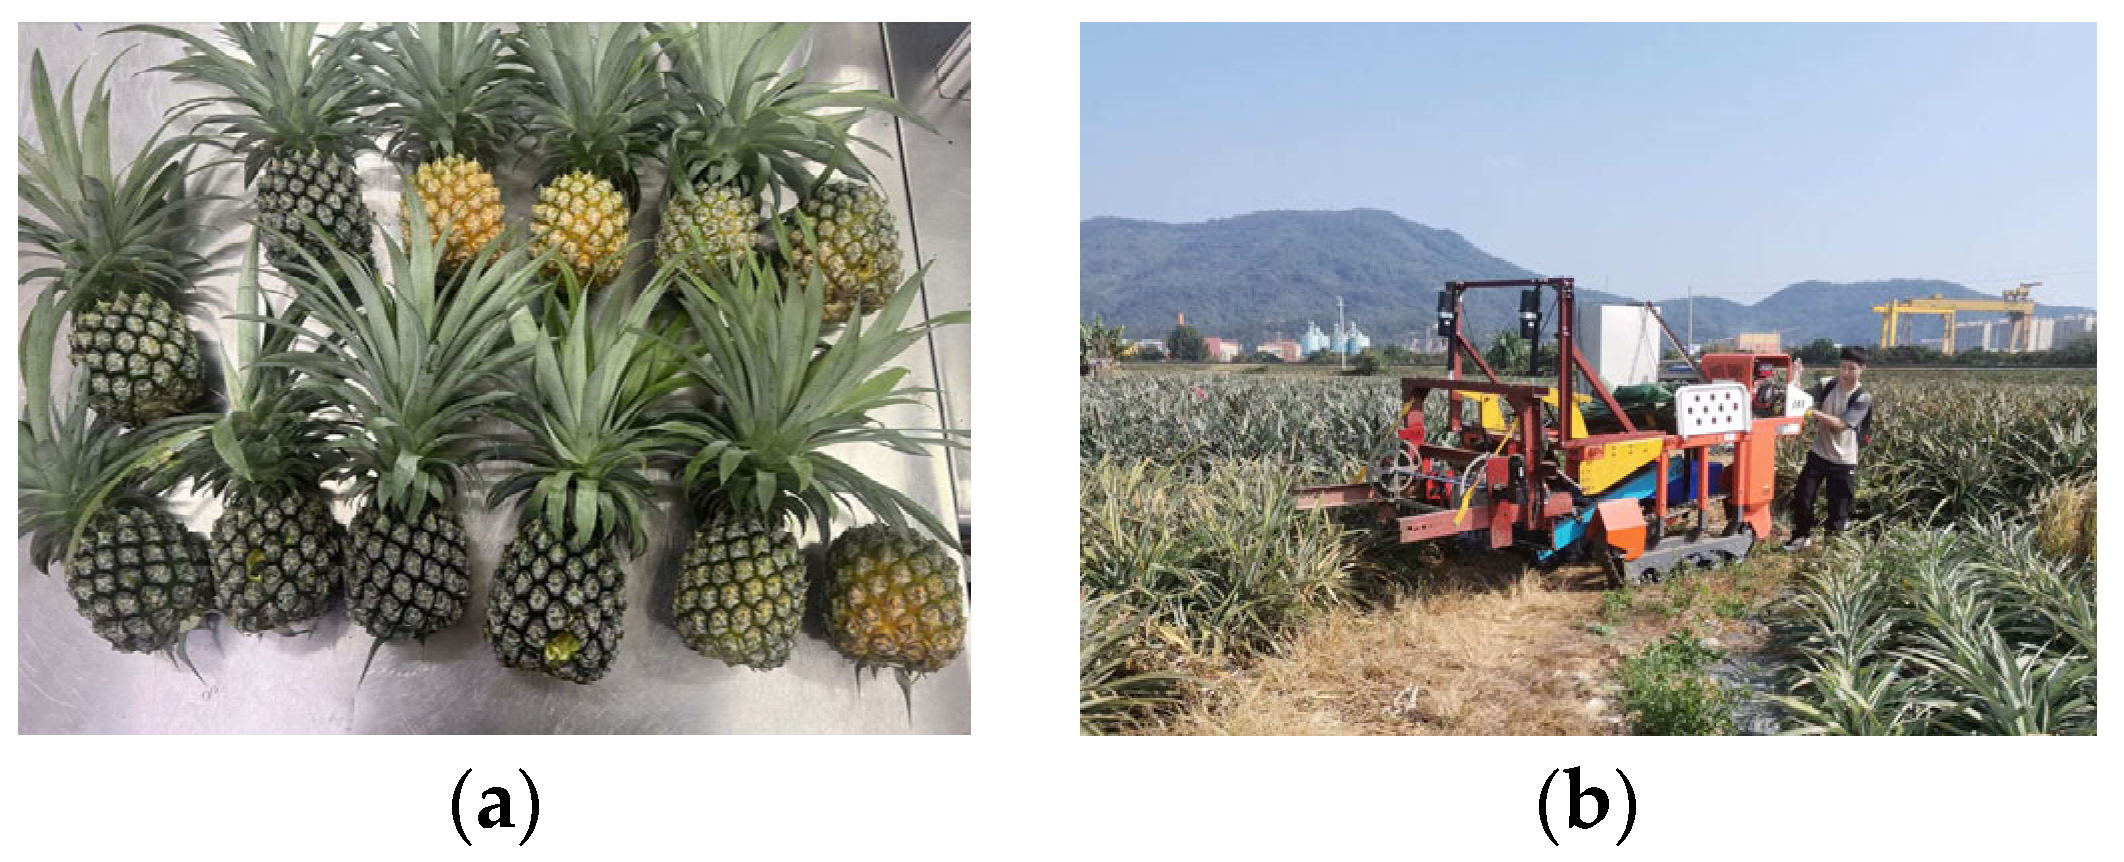
The test samples (
Figure 12b) were mechanically damaged pineapples harvested on 10 January 2024 (
Figure 12a) using a pineapple harvester in Shenwan Town, Zhongshan, Guangdong, China. All tests were conducted at the laboratory of the South China Agricultural University in Guangzhou, China. Immediately after harvesting, the specimens were wrapped in plastic and transported to the laboratory. Each sample was tested within 24 h of harvesting. Ten pineapples with varying degrees of damage and different maturities were randomly selected for the experiments. The maximum horizontal diameter among these samples was 97 mm.
Because the distance between the camera and the object should not have been less than the depth sensor’s minimum working distance, a sufficient distance needed to be maintained to avoid losing depth information due to a low camera angle. Such loss would adversely affect infrared imaging. Consequently, the distance D between the testing platform and the camera was fixed at 270 mm.
4. Conclusions
A machine vision detection method for pineapple fruit mechanical damage was developed to address the low accuracy and slow speed associated with manual detection. Images were captured using a depth camera, and an image-preprocessing algorithm was proposed to obtain the binary damage-contour image. Additionally, an algorithm for computing the area of mechanical damage was implemented.
Verification experiments showed that this method achieved a high detection success rate, whether under low-resolution conditions or normal resolution. The average error between the estimated and actual damaged areas was 5.67%, demonstrating its robust performance. Further detection tests, based on images generated by the proposed image-processing algorithm, revealed that the calculation accuracy for 10 sample areas reached 94.33%. The area-calculation algorithm exhibited high precision. Therefore, the test method presented in this paper can accurately detect the area of pineapple mechanical damage and generate a corresponding damage-contour image. Compared to traditional manual detection, this approach increases detection speed by over 30 times. Consequently, it can provide accurate data for quantitatively assessing pineapple mechanical damage.


