Article

URT-YOLOv11: A Large Receptive Field Algorithm for Detecting Tomato Ripening Under Different Field Conditions

by
Di Mu
1,
Yuping Guou
2,
Wei Wang
3,
Ran Peng
1,†,
Chunjie Guo
2,†,
Francesco Marinello
4,
Yingjie Xie
1 and
Qiang Huang
1,*
1
College of Information Engineering, Sichuan Agricultural University, Yaan 625000, China
2
College of Mechanical and Electrical Engineering, Sichuan Agricultural University, Yaan 625000, China
3
College of Information, SiChuan Finance And Economics Vocational College, Chengdu 610100, China
4
Department of Land, Environment, Agriculture and Forestry, University of Padova, 35020 Legnaro, Italy
*
Author to whom correspondence should be addressed.
These authors contributed equally to this work.
Agriculture 2025, 15(10), 1060; https://doi.org/10.3390/agriculture15101060
Submission received: 25 February 2025 / Revised: 21 April 2025 / Accepted: 25 April 2025 / Published: 14 May 2025
(This article belongs to the Special Issue Innovations in Precision Farming for Sustainable Agriculture)

Abstract

:
This study proposes an improved YOLOv11 model to address the limitations of traditional tomato recognition algorithms in complex agricultural environments, such as lighting changes, occlusion, scale variations, and complex backgrounds. These factors often hinder accurate feature extraction, leading to recognition errors and reduced computational efficiency. To overcome these challenges, the model integrates several architectural enhancements. First, the UniRepLKNet block replaces the C3k2 module in the standard network, improving computational efficiency, expanding the receptive field, and enhancing multi-scale target recognition. Second, the RFCBAMConv module in the neck integrates channel and spatial attention mechanisms, boosting small-object detection and robustness under varying lighting conditions. Finally, the TADDH module optimizes the detection head by balancing classification and regression tasks through task alignment strategies, further improving detection accuracy across different target scales. Ablation experiments confirm the contribution of each module to overall performance improvement. Our experimental results demonstrate that the proposed model exhibits enhanced stability under special conditions, such as similar backgrounds, lighting variations, and object occlusion, while significantly improving both accuracy and computational efficiency. The model achieves an accuracy of 85.4%, recall of 80.3%, and m A P @ 50 of 87.3%. Compared to the baseline YOLOv11, the improved model increases m A P @ 50 by 2.2% while reducing parameters to 2.16 M, making it well-suited for real-time applications in resource-constrained environments. This study provides an efficient and practical solution for intelligent agriculture, enhancing real-time tomato detection and laying a solid foundation for future crop monitoring systems.

1. Introduction

Tomatoes are a globally significant crop, consistently ranking among the top vegetables in terms of production and consumption [1]. Variations in growth stages during cultivation often necessitate that farmers rely on manual observations to grade maturity, estimate yields, and determine harvesting schedules to meet market demands [2]. However, manual methods are labor-intensive, time-consuming, and prone to human error, particularly during large-scale operations. Research shows that inaccuracies in classifying tomato maturity during harvesting and handling can result in substantial post-harvest losses, reducing profitability and impacting food supply chains [3]. These challenges have driven the adoption of automation and robotics in agriculture, offering innovative solutions to improve efficiency and precision in maturity detection, harvesting, and post-harvest handling.
In recent years, extensive studies have been conducted on crop ripeness detection and recognition, particularly for tomatoes, yielding significant results [4,5,6,7]. Traditional methods primarily focus on analyzing visual features such as color, texture, and shape, from which features are extracted and classified using algorithms. For instance, significant region detection with an improved Hough transform method identified unripe tomatoes with 77.6% accuracy under uniform backgrounds but struggled in complex environments [8]. Convexity analysis for locating ripe fruits achieved an accuracy of 85–90% but was less effective with occlusions or irregular shapes [9]. Machine vision-based sorting of cherry tomatoes combined color and shape features but lacked validation in dynamic environments [10].
Beyond color-based detection methods, classification algorithms like support vector machines (SVMs) have also been used for ripeness identification. For example, SVMs have been applied to classify tomato color features, achieving a classification accuracy of 90.8% [11]. A three-stage SVM-based system was also proposed for tomato classification, achieving high accuracy, though the algorithm is computationally complex [12]. Another approach combined the HSV color space with the watershed algorithm for red tomato detection, demonstrating high efficiency under natural light conditions [13]. In addition to traditional image processing, spectral analysis techniques have been applied to tomato ripening detection. A method combining visible/near-infrared spectroscopy with machine vision achieved a classification accuracy of 90.67% using a partial least squares (PLS) model [14]. Another study classified tomatoes into four maturity stages based on hyperspectral imaging and sparse representation models, achieving a high classification accuracy of 98.3% [6]. However, these traditional methods are often insufficient for practical applications, as they lack robustness in complex, dynamic environments, require extensive hyperparameter tuning, and fail to provide the real-time performance required for modern agricultural automation.
With the rapid development of artificial intelligence, deep learning models have become a cornerstone for solving complex agricultural problems, particularly in fruit maturity detection [15]. Object detection methods play a crucial role in agricultural applications, including fruit maturity classification, crop monitoring, and automated harvesting. These methods serve two primary functions: detection and classification, where they not only locate the object within an image but also determine its category [16]. Object detection models are generally divided into two types: one-stage and two-stage models. One-stage models, such as the YOLO [17] series and SSD [18], directly predict both the position and category of the object in a single step. This makes them faster and more suitable for real-time applications. In contrast, two-stage models, such as faster R-CNN [19], generate region proposals first and then classify them, offering higher accuracy but at the cost of slower processing speeds.
Faster R-CNN has been effectively applied to tomato maturity detection, particularly in dense agricultural environments. For example, enhancements integrating feature pyramid networks (FPN) achieved an accuracy of 92.1% and an IoU of 0.85 in detecting tomato maturity [7]. The main advantage of faster R-CNN is its high precision, which makes it particularly suitable for detecting small or occluded objects. However, its computational intensity and slower processing speed limit its use in real-time, large-scale applications, making it less ideal for automated systems that require fast processing.
In recent years, vision transformer (ViT)-based models such as the Swin transformer [20] have achieved impressive accuracy in object detection tasks, particularly excelling in scenarios that require global context understanding, such as detecting fruits in cluttered or occluded environments. However, their reliance on transformer architectures leads to slower inference speeds, higher computational complexity, and greater memory consumption compared to traditional CNN-based models, which significantly limits their deployment on resource-constrained devices commonly used in agricultural automation. Therefore, despite their strong performance in controlled settings, ViT-based models are currently less suitable for real-time, efficient operation in practical agricultural applications.
In response to the challenges of tomato maturity detection, YOLO (you only look once) models have gained prominence due to their speed and efficiency. These models enable real-time processing by predicting both object position and category in a single pass.
An enhanced YOLOv7-based model has demonstrated high accuracy in detecting ripe tomatoes in complex environments, achieving 96.5% accuracy and an mAP@0.5 of 97.3% [21]. While YOLO models offer fast and accurate detection, their performance may be affected by occlusion and small, distant objects, whereas two-stage models like faster R-CNN can perform better.
To address these limitations, an improved YOLOv8 model integrates multi-head self-attention (MHSA) mechanisms, enhancing accuracy while reducing computational costs. This version achieved an accuracy of 91.2% and an mAP@0.5 of 90.4%, making it suitable for resource-constrained deployment [4].
Further improvements include RDE-YOLOv7, a lightweight version optimized for detecting dragon fruits, achieving an mAP@0.5 of 96.9%, significantly reducing computational demands [22]. However, its efficiency comes at the cost of slight accuracy reduction compared to larger models. Similarly, MobileNetV3 has been integrated into YOLOv5, achieving an mAP of 96.9% with improved real-time performance on low-power devices [23], though it may struggle in cluttered environments.
A recent advancement, YOLO-deepSort, integrates target tracking with multi-object detection, enabling continuous monitoring of tomato growth stages. This model achieves 93.1% accuracy for flowers, 96.4% for green tomatoes, and 97.9% for red tomatoes [15]. While providing valuable insights for large-scale agricultural monitoring, its increased computational complexity may limit real-time applications in resource-constrained environments.
Building on this, a recent study introduced the YOLOv8-EA model [24], proposed in 2024, which optimizes multi-stage feature fusion mechanisms to maintain tracking accuracy while significantly reducing computational complexity. By employing a dynamic attention reallocation technique, the model reduced inter-frame feature similarity computation by 42.3% and achieved a real-time processing speed of 128 FPS for tomato growth monitoring. Experimental results showed that the improved system decreased inference time on the NVIDIA Jetson Nano embedded platform from 3.2 s to 1.8 s compared to the original model, with a 37.5% reduction in memory usage, providing a viable solution for resource-constrained environments. However, its processing speed remains insufficient for practical deployment.
Overall, YOLO models, particularly the enhanced versions like YOLOv7 [25], YOLOv8 [26], and YOLOv5 [27], have proven to be effective in tomato maturity detection due to their high accuracy and real-time processing capabilities. Despite some challenges, such as reduced accuracy in cluttered scenes or occlusions, YOLO-based models are increasingly being optimized for practical agricultural applications, offering the potential for scalable solutions in automated harvesting and precision farming.
The YOLO series has now been updated to YOLOv11. Building upon its predecessors, YOLOv11 introduces several new features and improvements, including the C3k2 module, the C2PSA module, and a more lightweight classification detection head. These enhancements have significantly boosted both detection accuracy and speed through iterative advancements. With these updates, YOLOv11 is able to maintain a high detection rate across a wider range of targets at various scales while maintaining its processing speed. As a result, YOLOv11 surpasses previous models in terms of both performance and efficiency, making it a more powerful solution for real-time applications.
On this basis, the proposed method further optimizes the accuracy and real-time processing ability of the YOLO model. By specifically improving the structure and algorithm of the model, this study improves the accuracy of object occlusion, illumination changes, and other complex scenes and overcomes the limitations of the YOLO model in special environments. In addition, this method maintains effective computing speed in different environments and ensures real-time performance and efficiency, thus providing a more practical solution for agricultural automation in harvesting and precision agriculture. These improvements make the model more suitable for practical application in agricultural production and provide higher scalability and adaptability. Our specific contributions are as follows:
(1)
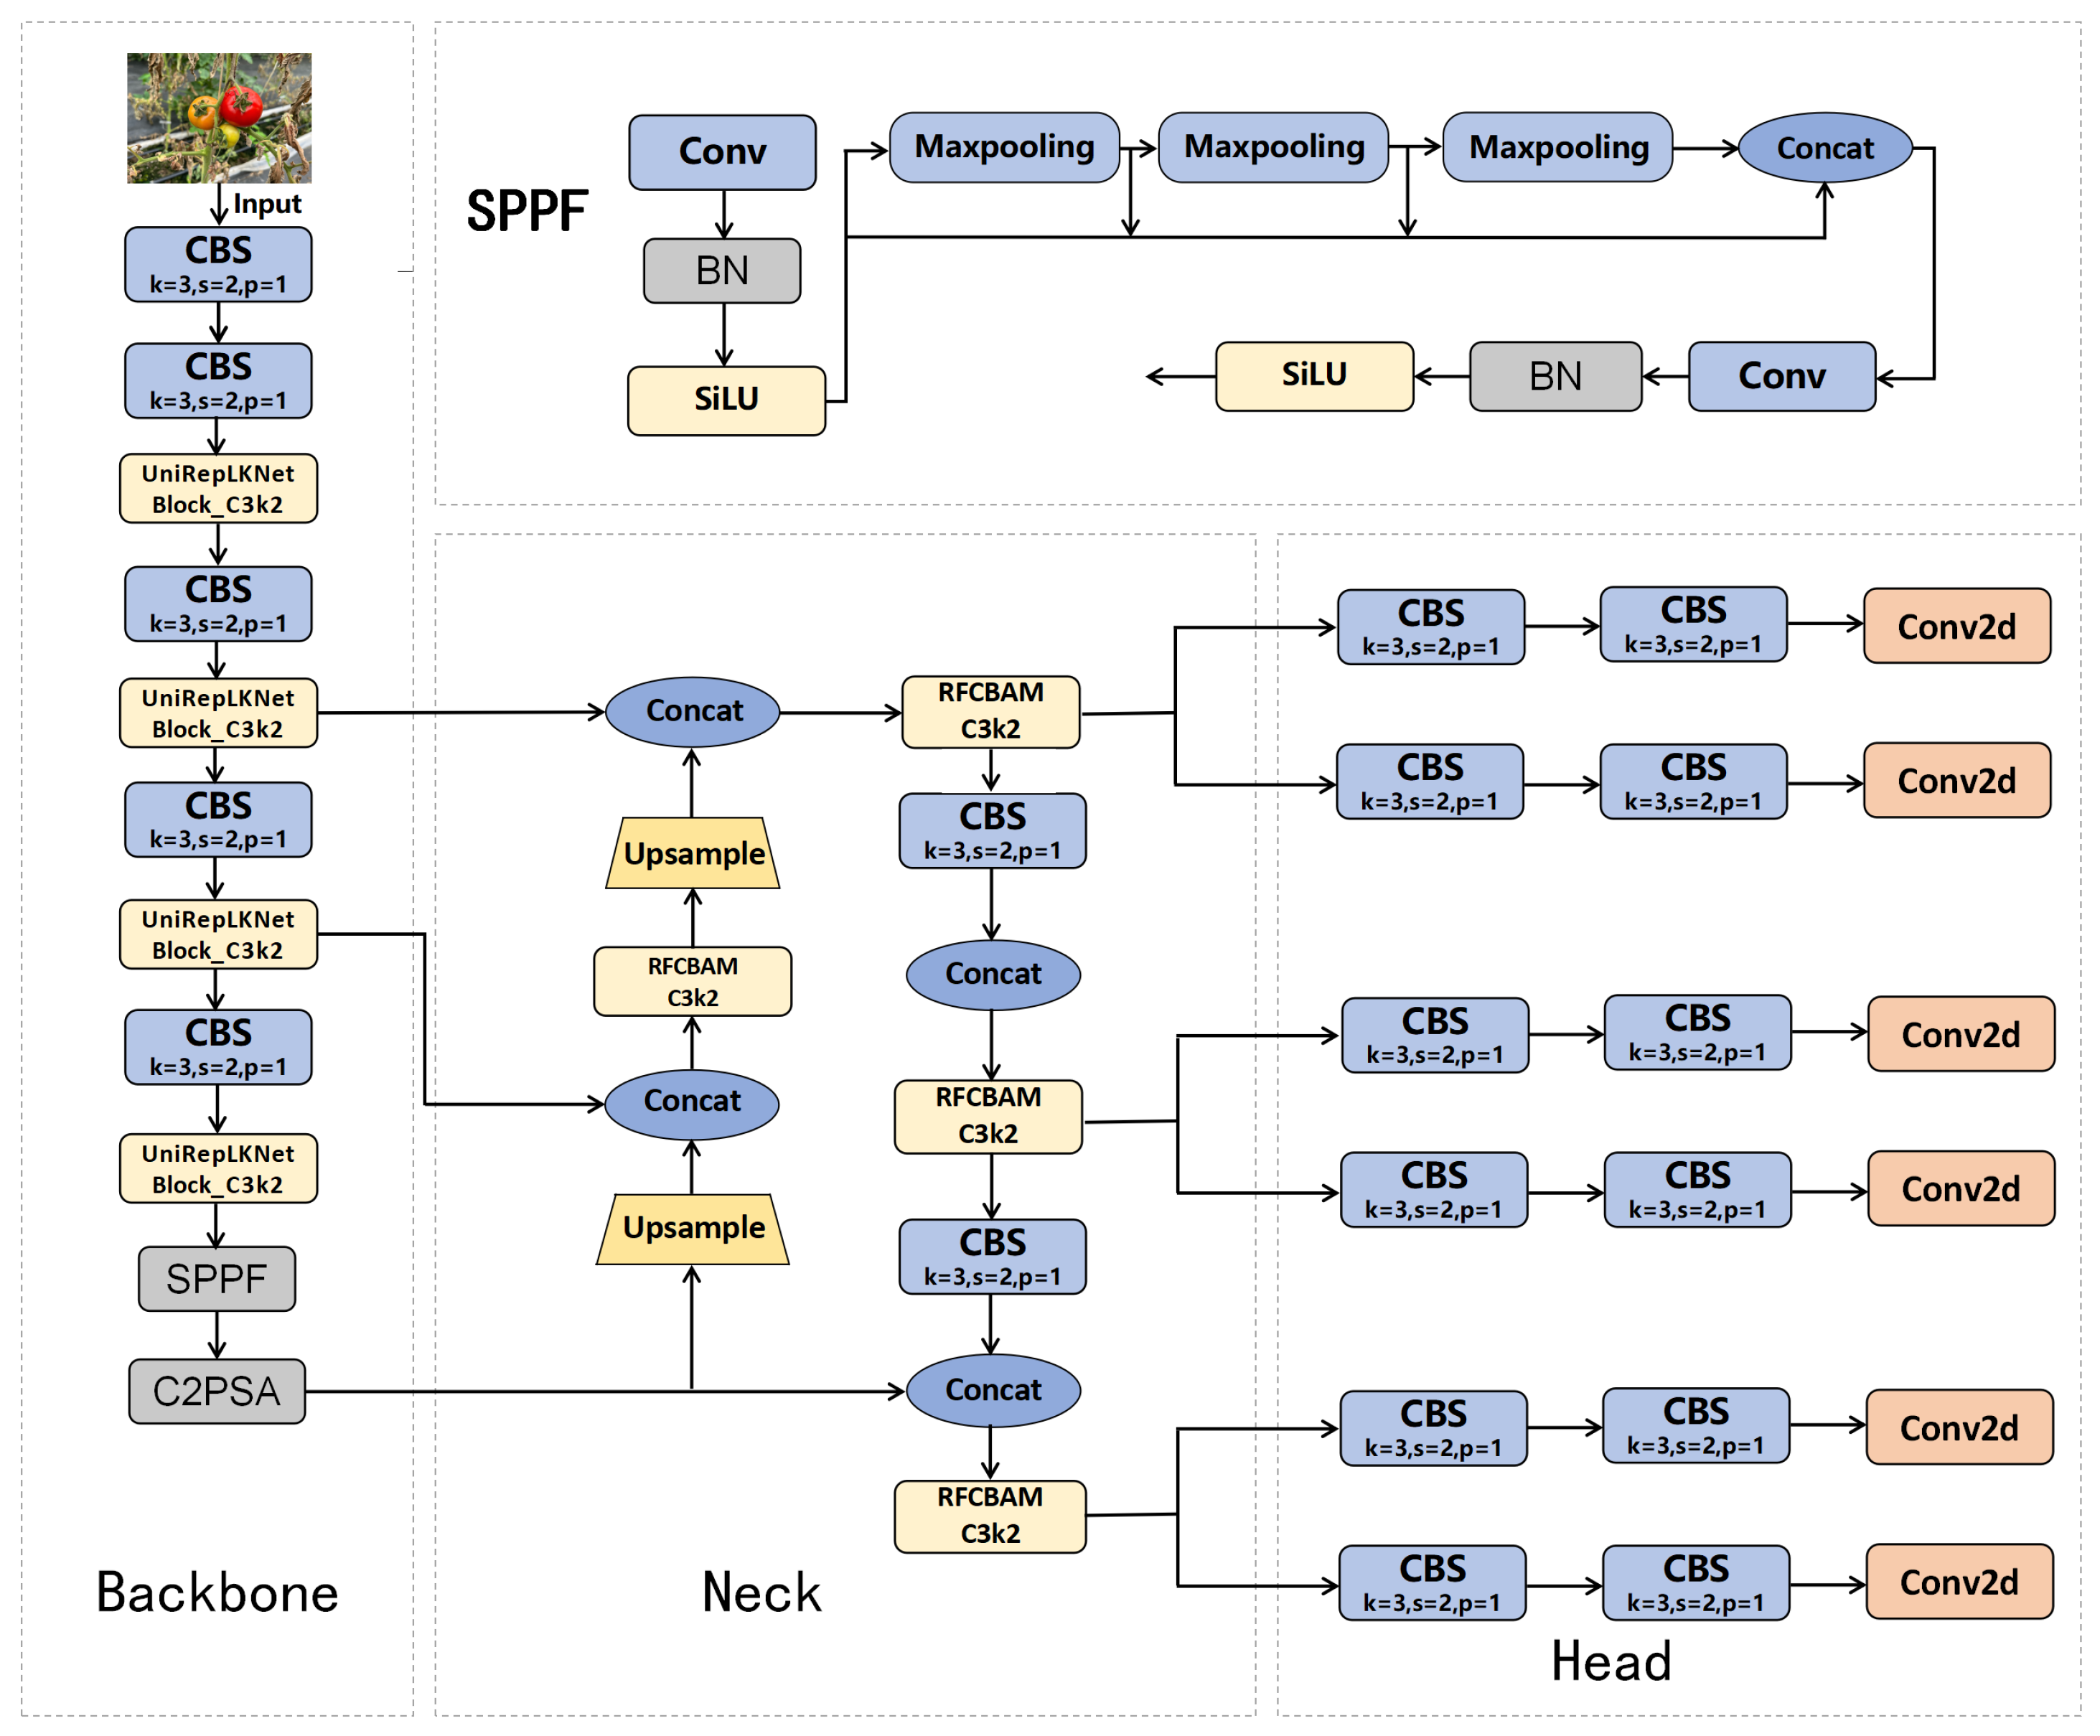
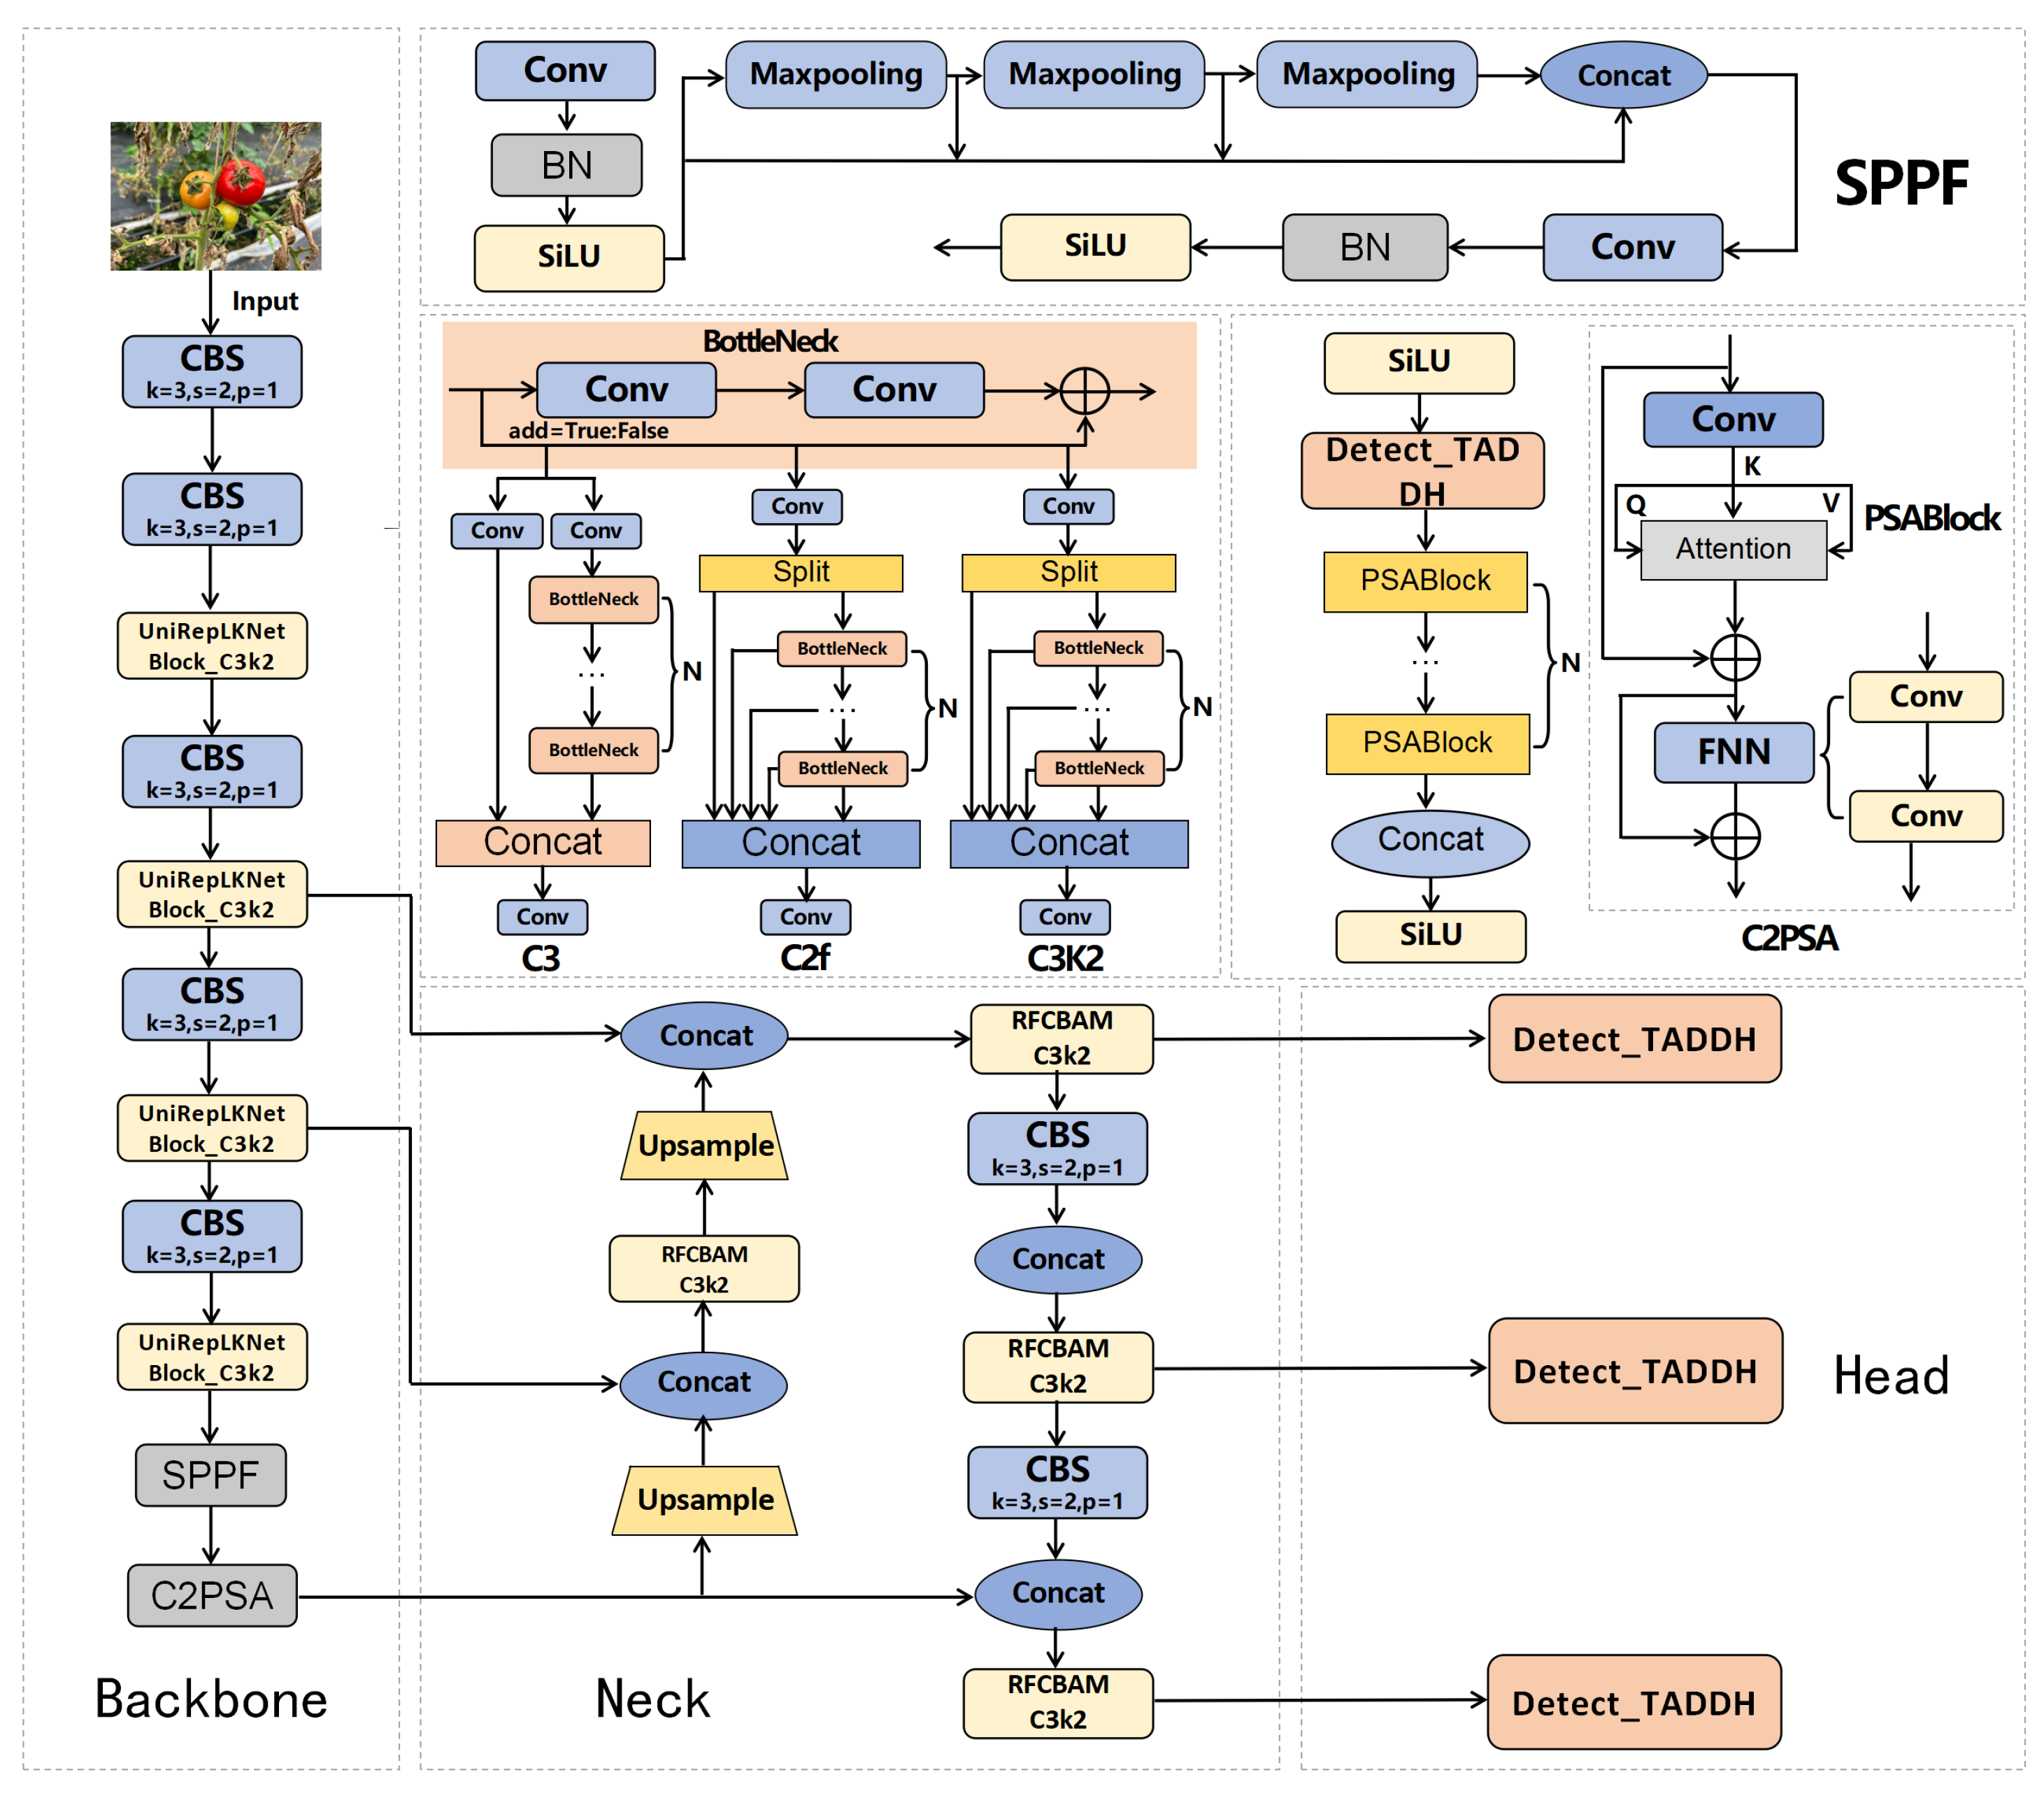
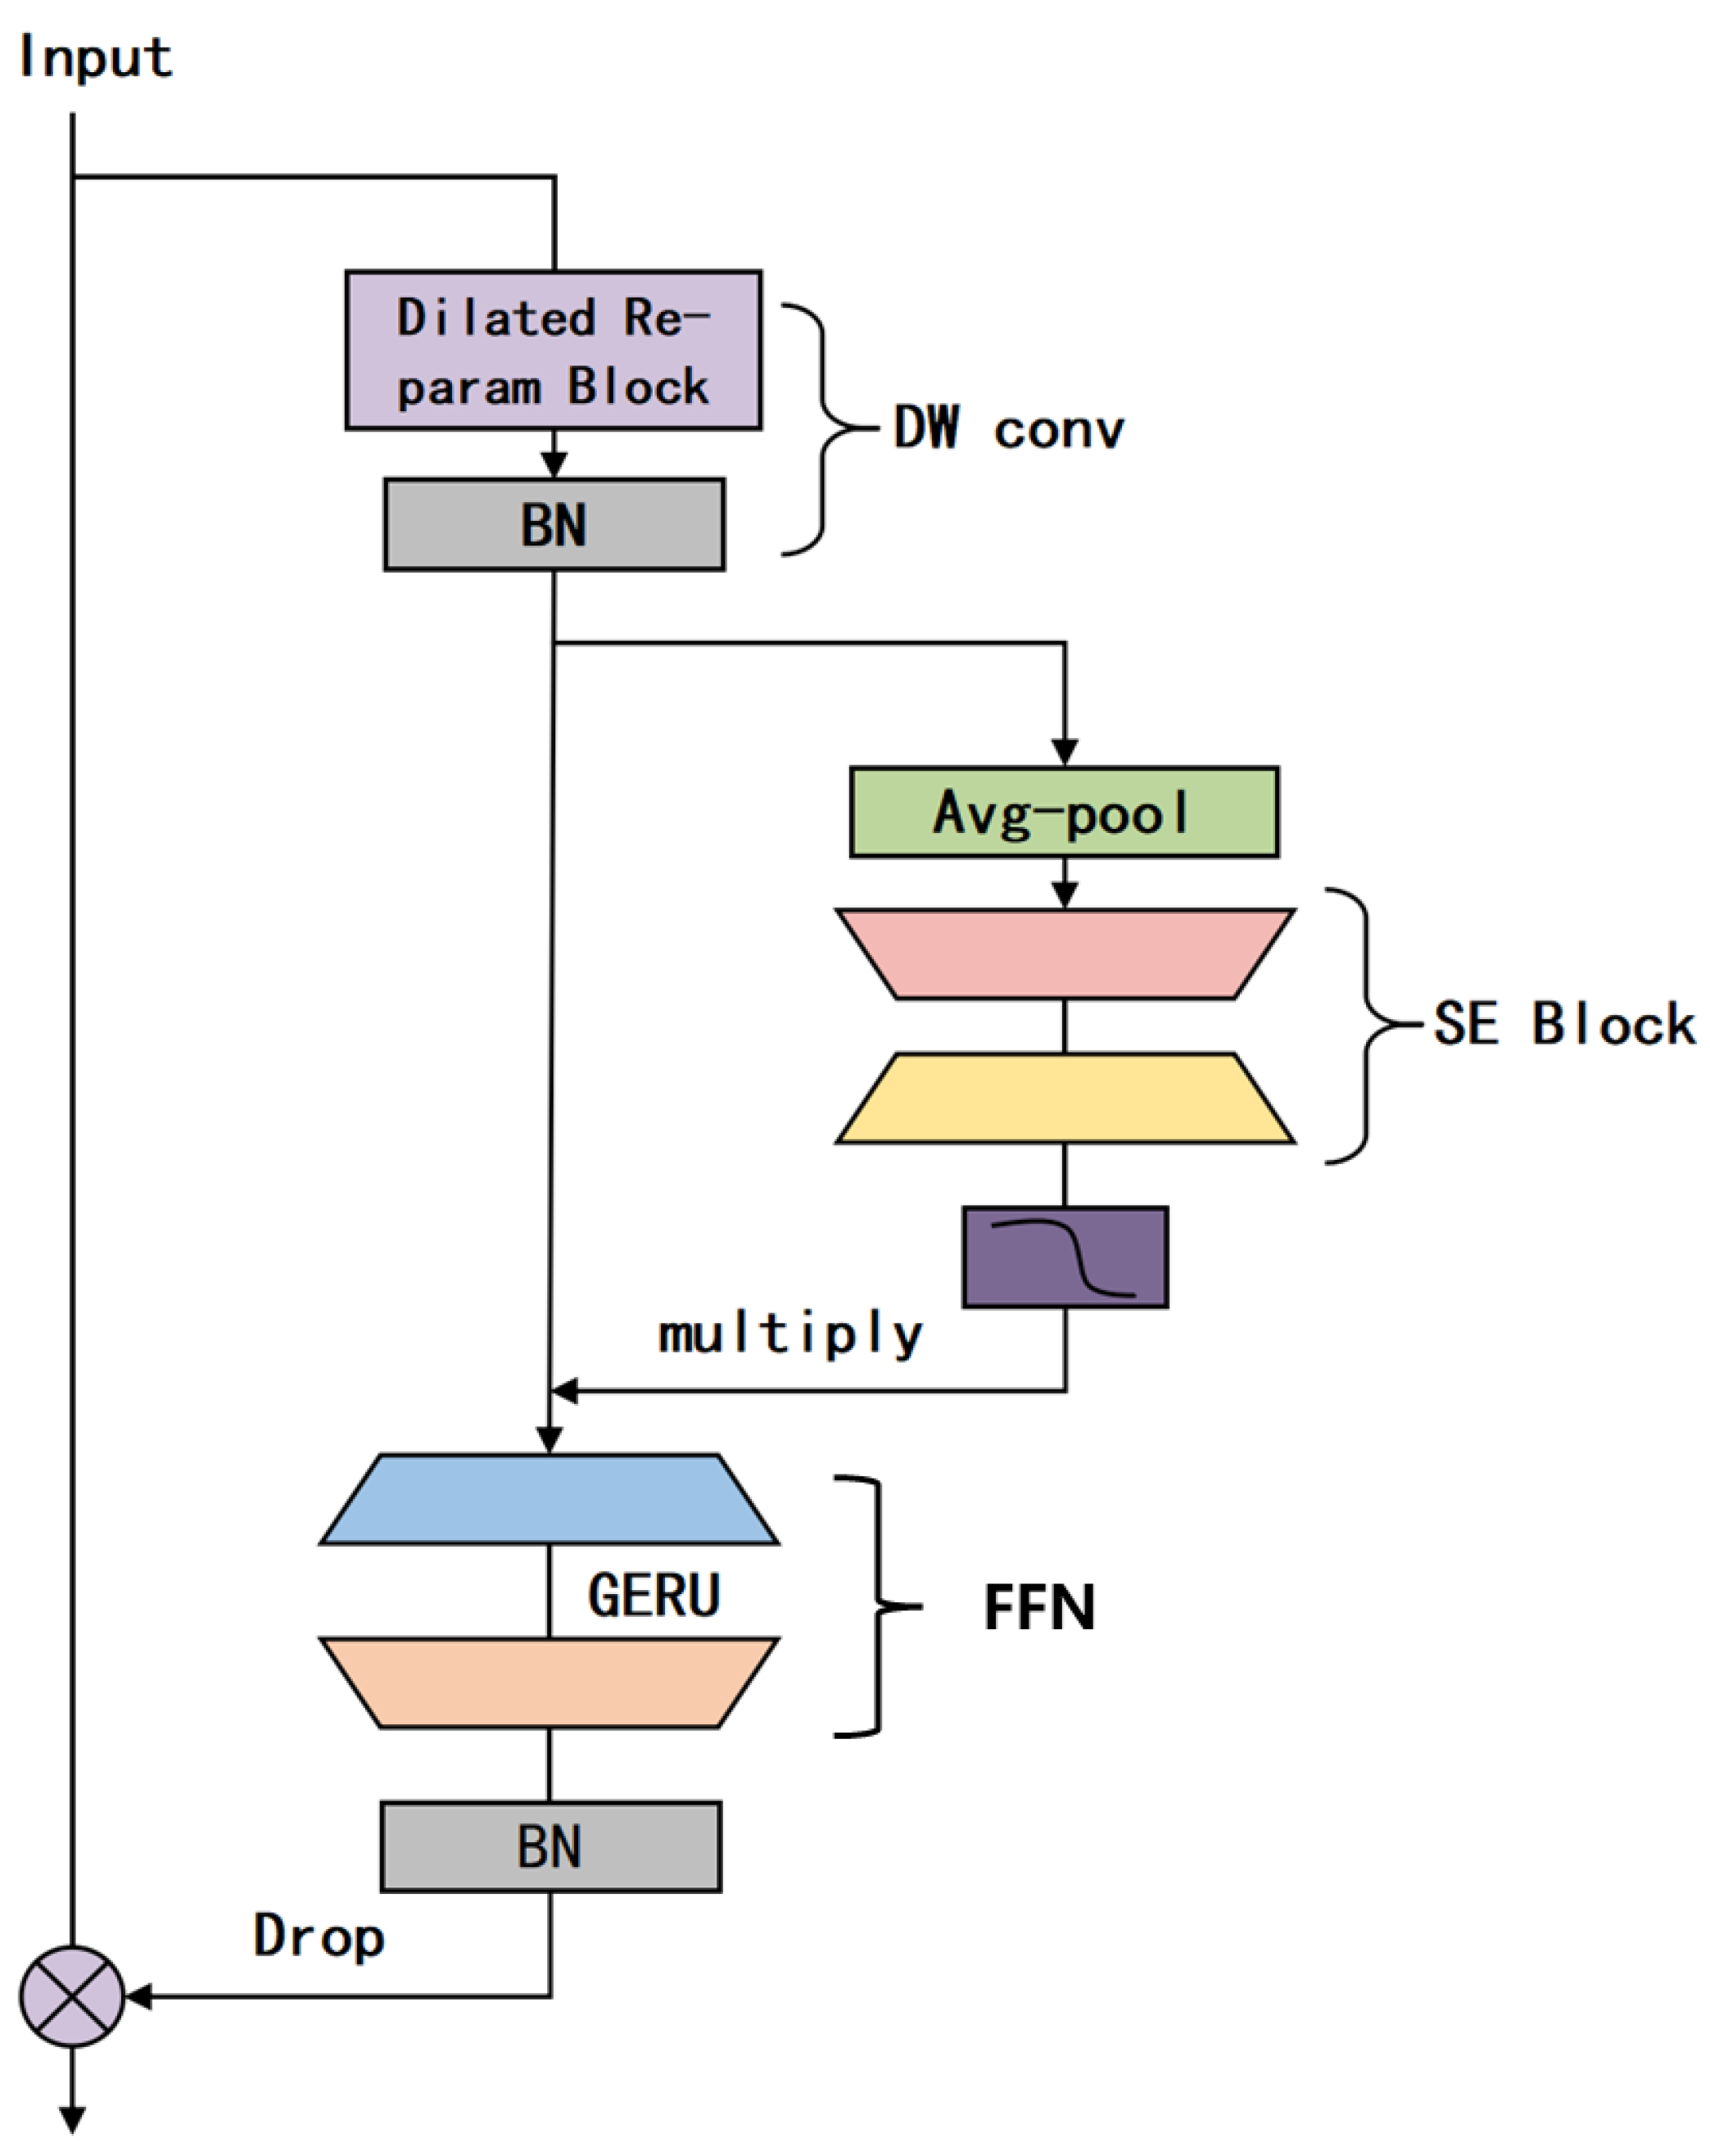
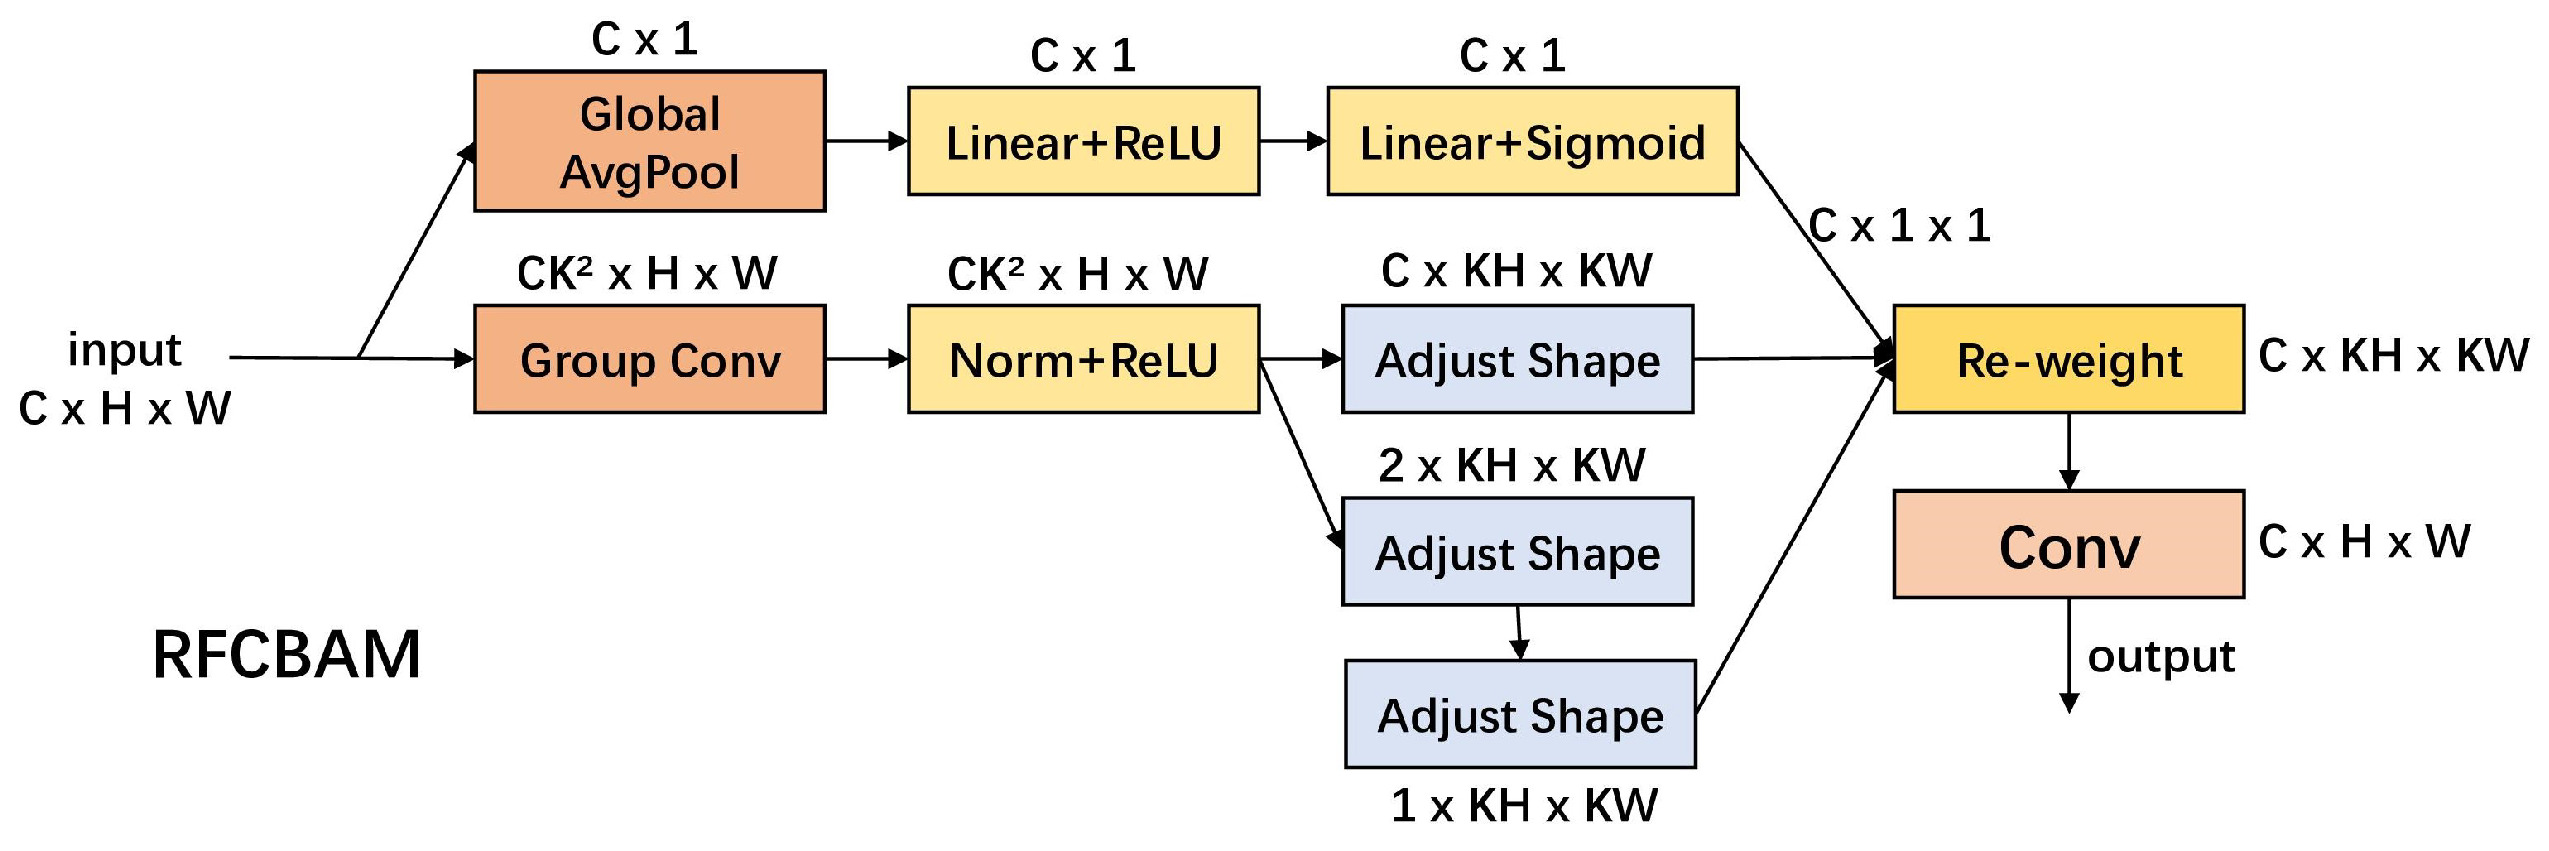
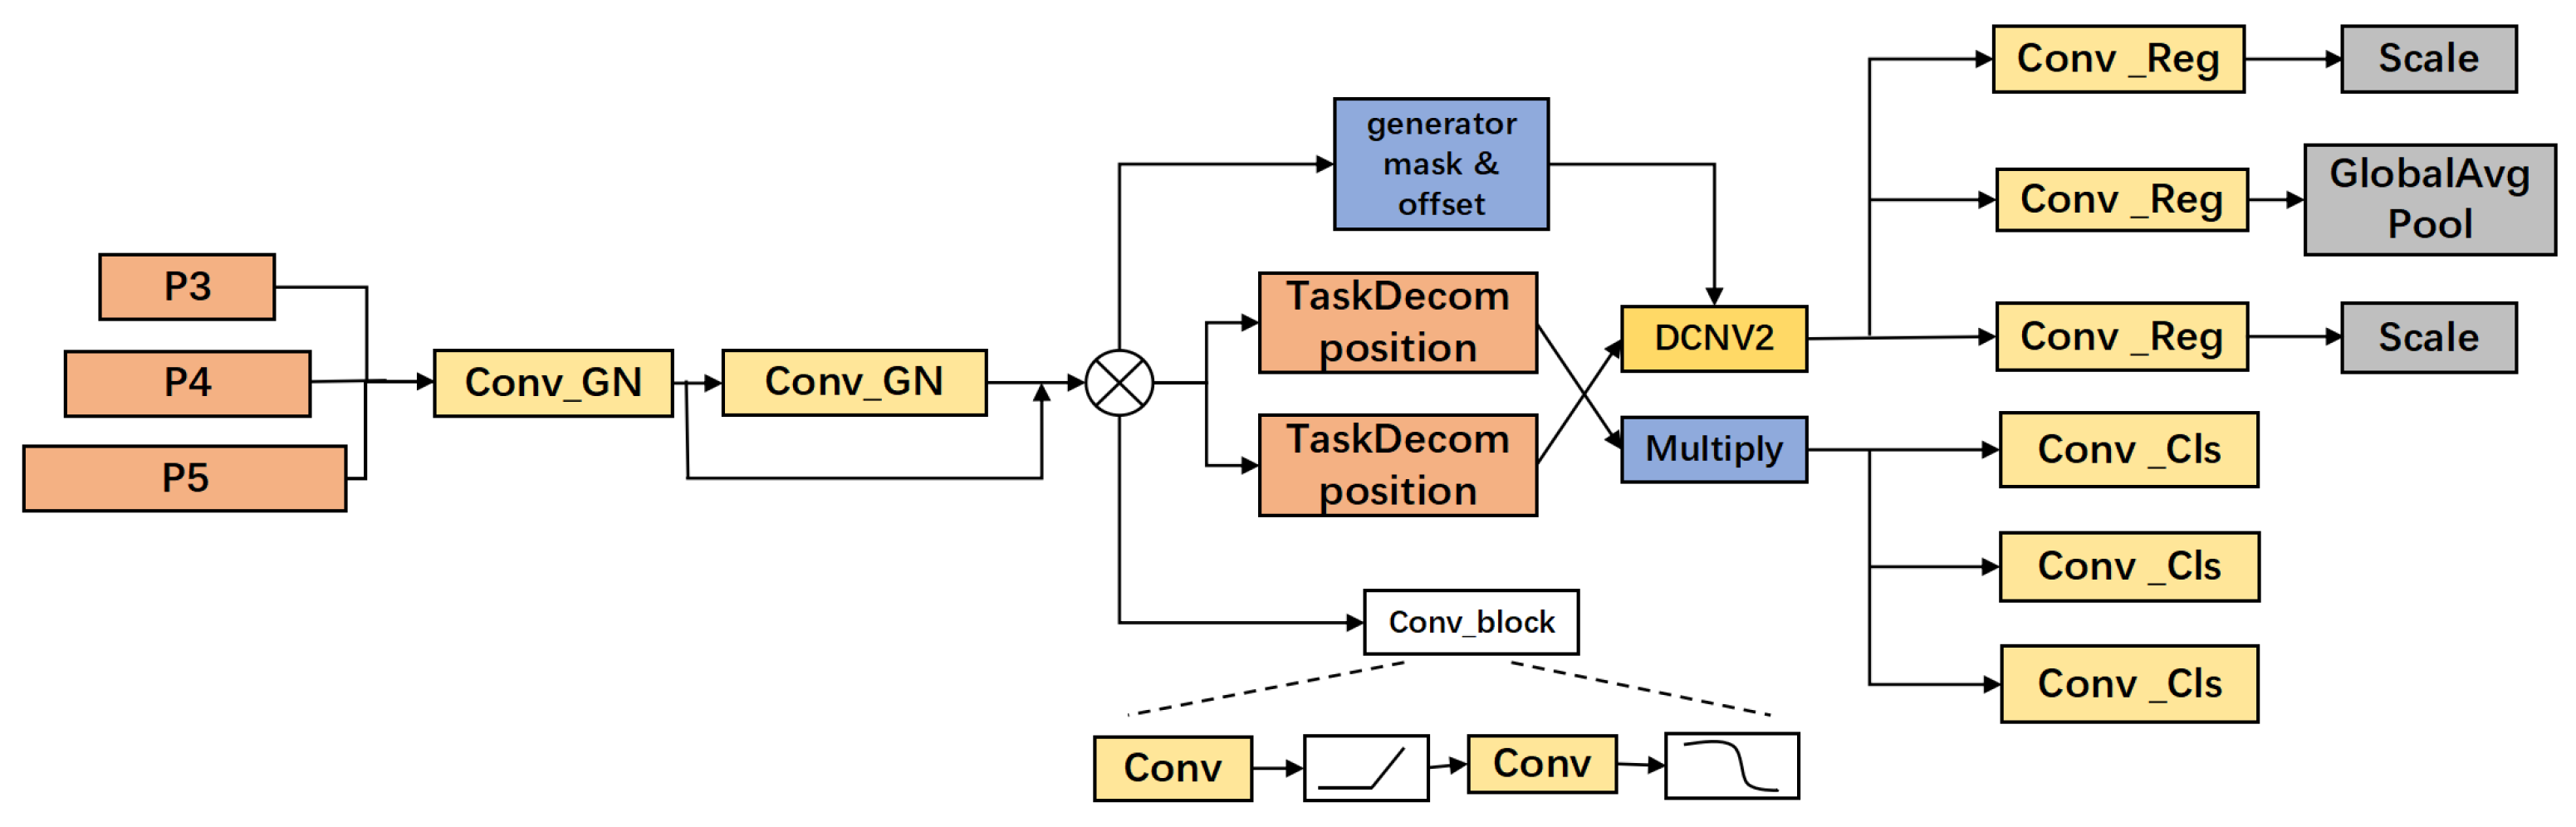
This study proposes an improved YOLOv11 model, URT-YOLOv11, to address the limitations of traditional tomato recognition algorithms in complex agricultural environments. By optimizing its architecture, the model enhances detection performance and computational efficiency. The UniRepLKNet block replaces the original C3K2 module in the backbone, expanding the receptive field and improving recognition across different scales. In the neck, the RFCBAMConv attention module replaces the standard Conv module, integrating channel and spatial attention to enhance small object detection and robustness under varying lighting conditions. The TADDH module optimizes the detection head, balancing classification and regression tasks for greater accuracy and stability. These improvements significantly boost computational efficiency, enhance the model’s ability to recognize tomatoes of different sizes, and increase overall detection accuracy.
(2)
The improved YOLOv11 model demonstrates enhanced performance in complex agricultural environments, especially when dealing with issues such as lighting changes, object occlusion, scale variations, and complex backgrounds. The model shows significant stability and advantages in both accuracy and computational efficiency.
(3)
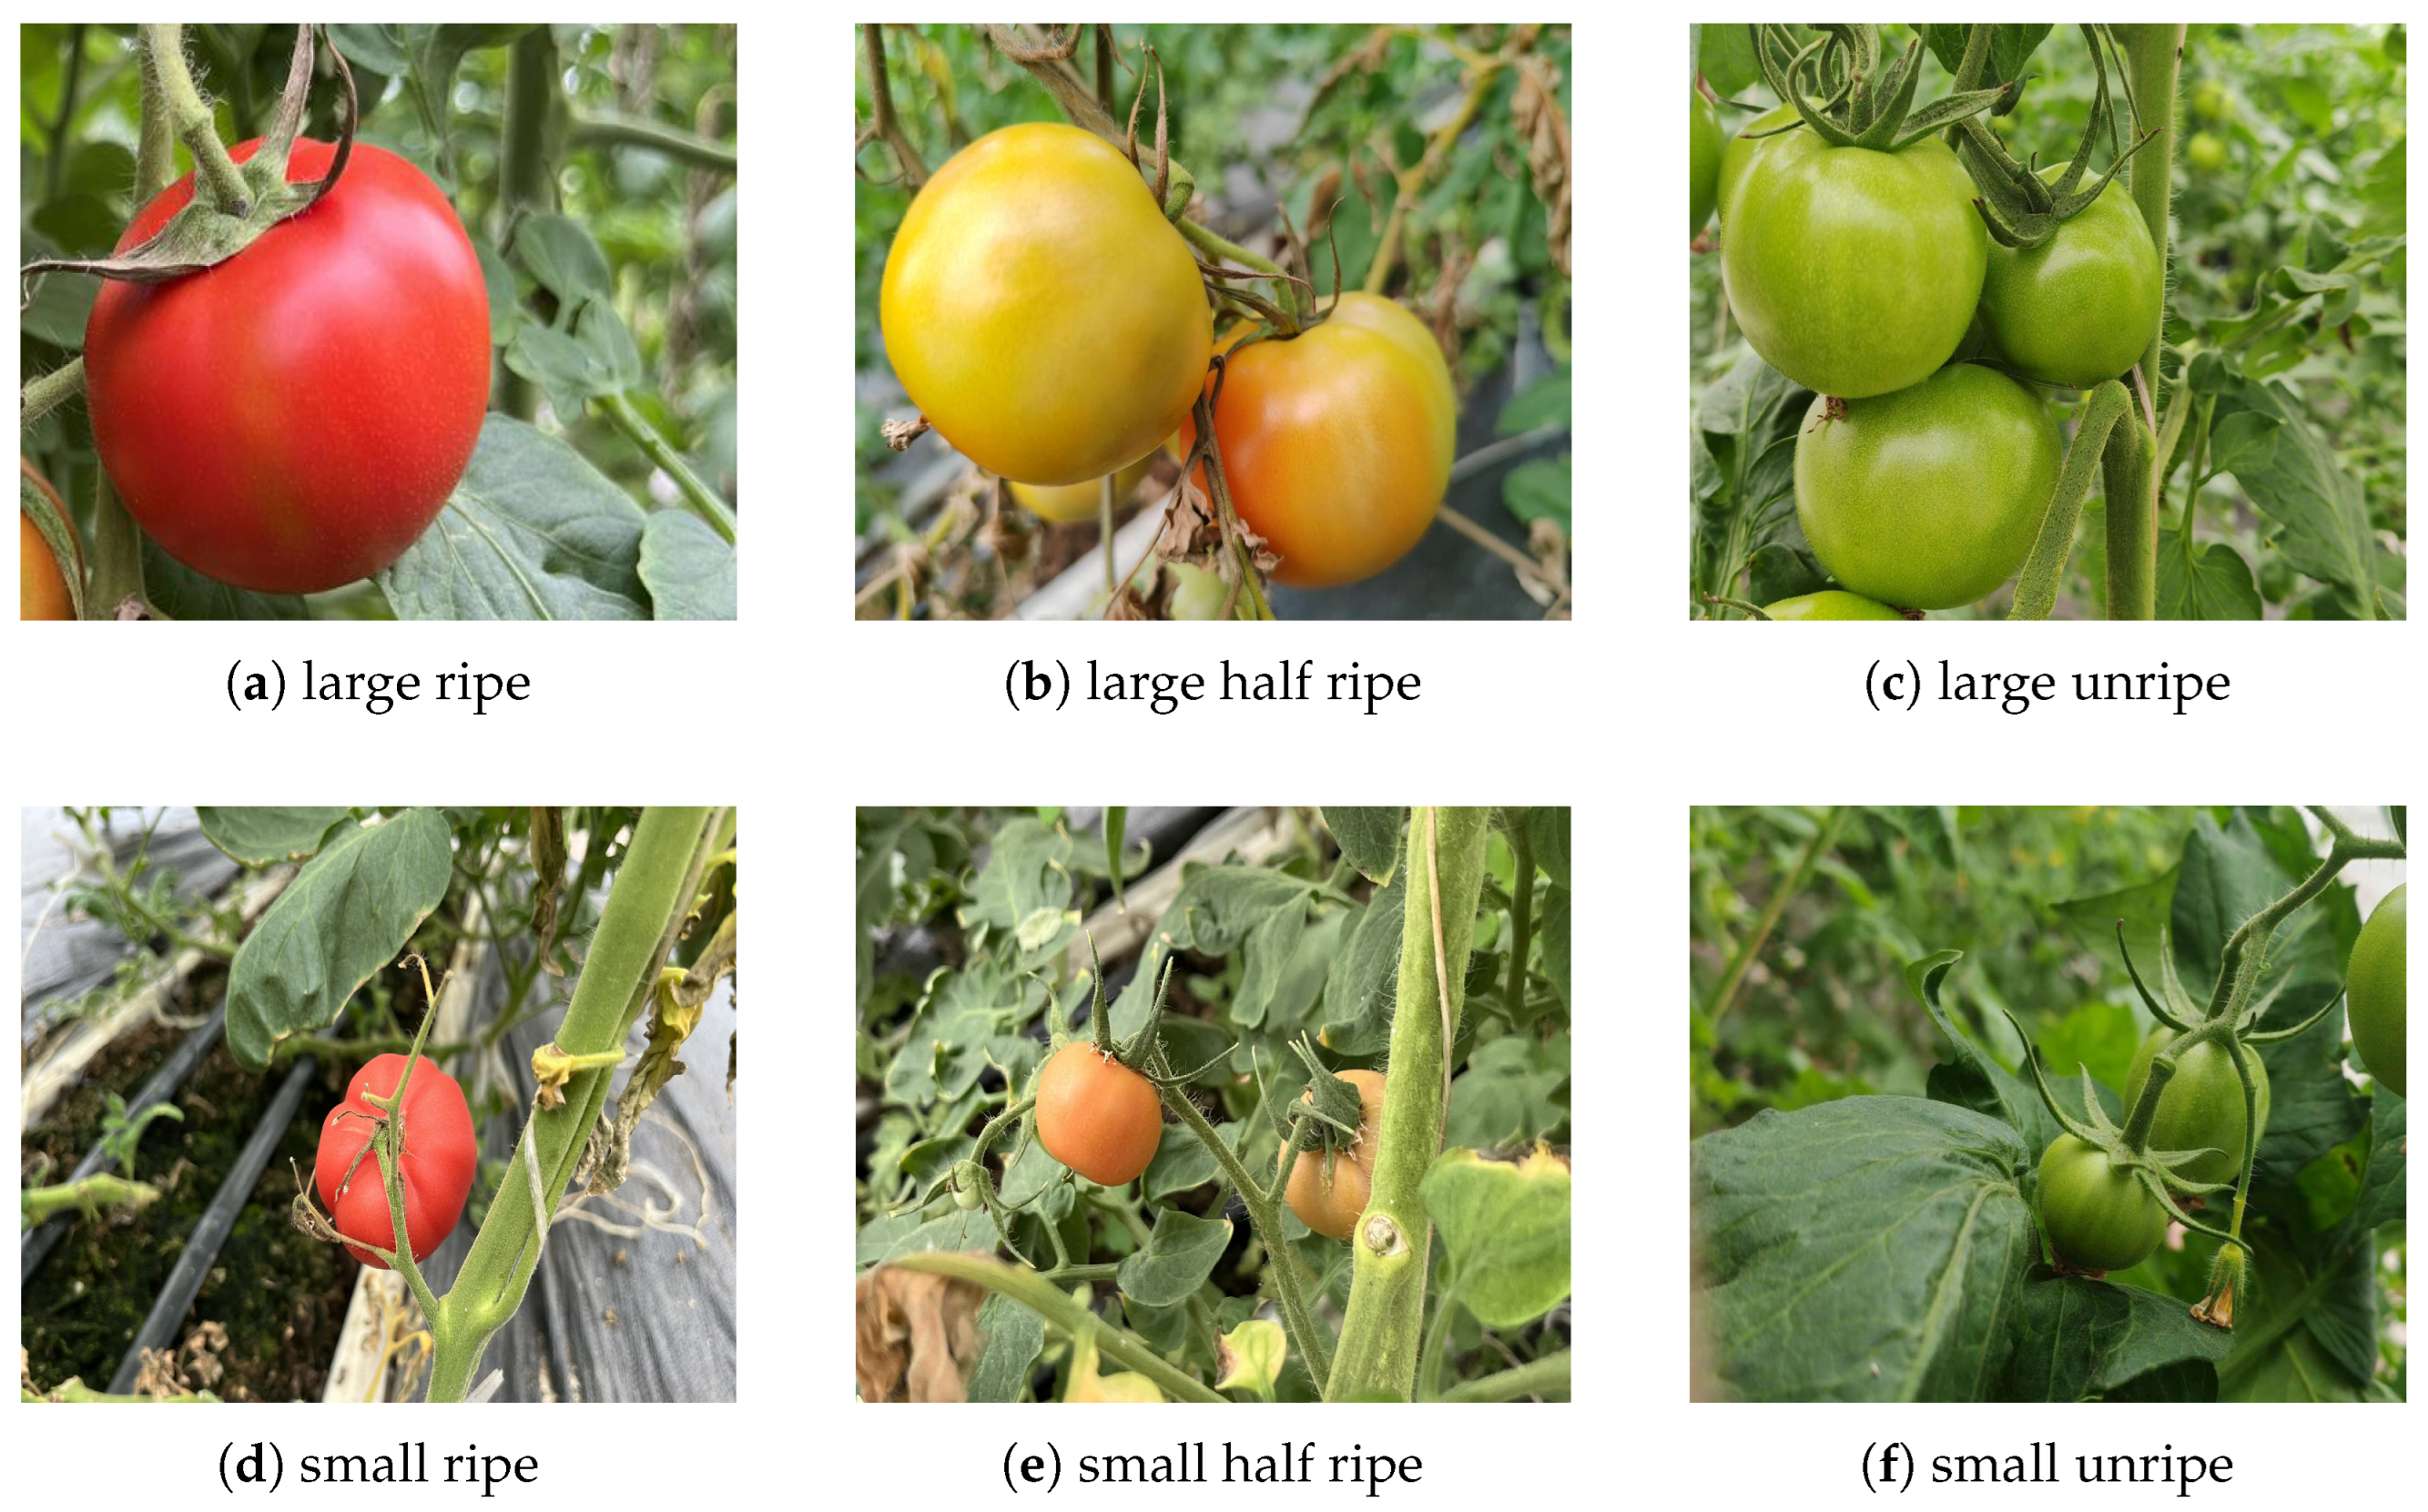
This study provides a tomato dataset designed for specific agricultural environments, containing six categories and 5474 images. The dataset focuses on addressing issues such as lighting changes, object occlusion, scale variations, and complex backgrounds. It includes tomato images under various environmental conditions, offering high diversity and challenge, making it ideal for training and evaluating tomato object detection models. The dataset enhances the robustness and accuracy of models in real-world applications. It provides a challenging benchmark for research in the field of tomato object detection and contributes to advancing crop monitoring technologies in smart agriculture.

2. Materials and Methods

2.1. Data Acquisition

The data required for this study were mainly sourced from the Modern Agricultural Science and Technology Innovation Demonstration Park of the Sichuan Academy of Agricultural Sciences. The research focused on Rexwang 72–541 tomatoes, and the CANON-R50 camera was used as the primary data collection tool to gather data on tomato fruits at different growth stages, covering real-world application scenarios. To improve the model’s generalization and robustness, factors that could affect the model’s performance, such as occlusion, shadows, and lighting, were fully considered during data collection. Special attention was paid to the impact of lighting and occlusion during the data collection process. To simulate the effect of varying light intensities on the model, data were collected at different times of the day, including morning, noon, afternoon, and evening, to enhance the model’s ability to adapt to lighting changes. Furthermore, considering that tomato fruits may be obstructed by leaves, branches, or other fruits in their natural growth, occlusion scenarios were simulated to ensure that the model could handle common real-world interferences, thereby improving its robustness and accuracy. A specific example of data collection is shown in Figure 1.

2.2. Data Preprocessing

2.2.1. Data Annotation

In this study, 5474 tomato image datasets were collected and screened in a real production environment. The whole dataset was divided into a training set, validation set, and test set according to a ratio of 7:2:1.
LabelImg software (1.8.6) was used in this study to annotate the collected image dataset.
Among them, since this study constructed the model from the perspective of tomato ripeness grading, a tomato ripeness grading model was constructed into six types of labels: large ripe (LARGE RIPE), large semi-ripe (LARGE HALF RIPE), large unripe (LARGE UNRIPE), small ripe (SMALL RIPE), small semi-ripe (SMALL HALF RIPE), and small immature (SMALL UNRIPE) were used for flavor dataset labeling. The specific data distribution is shown in the Table 1.
The dataset exhibits a certain degree of class imbalance, particularly between the “large unripe” and “small unripe” categories, which together account for approximately 57% of the total samples, and the “small half-ripe" category, which represents only around 4% of the dataset. This imbalance may lead to biased model performance, where the model tends to favor majority classes while underperforming for minority classes.
To address the class imbalance, we employed oversampling for the minority class (“small half-ripe”) by replicating its training samples until its representation was comparable to the majority classes. This approach exposed the model to a more balanced category distribution during training and improved recognition performance for under-represented classes. To further reduce the risk of overfitting, we combined oversampling with data augmentation, applying various transformations to all classes to enhance dataset diversity and model generalization.

2.2.2. Data Augmentation

In real-world tomato orchards, complex environmental factors introduce various interferences, leading to insufficient dataset scale and diversity, which limits the performance of model training. To address this issue, we employed mosaic augmentation and online data augmentation techniques to expand the dataset.
Mosaic augmentation randomly selects four images from the training set, applies transformations such as rotation and scaling, and then combines them into a single new image. This method not only enriches background diversity but also increases the number of target instances, allowing each training batch to contain more objects. Consequently, it accelerates model training and enhances small object detection performance.
Additionally, online data augmentation dynamically applies various image transformations during training, such as saturation adjustment, brightness adjustment, rotation, and sharpening, further increasing dataset diversity. Although the total number of training samples remains unchanged, the input data varies across training epochs. This technique helps the model adapt to more complex environments, improves generalization ability, speeds up convergence, and enhances robustness against different lighting conditions, angles, and backgrounds.
Examples of augmented images are shown in Figure 2.

2.3. Standard YOLOv11 Model

In this study, the lightweight target detection model YOLOv11s is selected [28]. YOLOv11s is a lightweight structure optimized on the basis of the YOLO algorithm, and its network architecture consists of three parts: the backbone network, the neck network, and the prediction head. The backbone network extracts multi-scale features from RGB images through convolutional operations to provide multi-level semantic information for target detection; the neck network employs a feature pyramid network (FPN) [29] with a path aggregation network (PAN) [30], which fuses the low-level features with the high-level features to enhance the model’s ability to detect targets at different scales; the predictive head uses three sizes of detection layers to classification and generates accurate bounding boxes, which can efficiently handle multiple targets in complex scenes. The specific network structure is shown in Figure 3.
The figure above shows a comparison between different YOLOv11 variants and their architectural components. The first image illustrates the base model, while the subsequent images highlight specific modifications such as C3k2 and C2PSA. These changes aim to enhance the model’s performance and efficiency in various tasks.
In this paper, an improved target detection model is proposed, which is optimally designed by introducing the modules C3k2_UniRepLKNetBlock, C3k2_RFCBAMConv, and Detect_TADDH. Among them, C3k2_UniRepLKNetBlock is designed to enhance the feature expression ability of the model, and the detection accuracy is further improved by fusing long and short path feature extraction; C3k2_RFCBAMConv is combined with the improved attention mechanism to enhance the ability of the network to capture key features; Detect_TADDH is optimally designed to achieve multi-scalar feature classification and bounding box regression. Detect_TADDH is optimized for target classification and bounding box regression, achieving efficient detection of multi-scale targets. The introduction of these innovative modules significantly improves detection performance while keeping the model lightweight, and the relevant details are shown in Figure 4. The network can be used to capture key features with the improved attention mechanism.

2.3.1. C3k2_UniRepLKNetBlock

In this study, we introduce the C3k2_UniRepLKNetBlock module to enhance the feature extraction capability of the model [31]. This lightweight feature extraction unit is designed to improve standard network architectures by leveraging a unified reparameterization strategy (UniRep) [32,33]. During training, the module employs a multi-branch structure with varying kernel sizes (e.g., 7 × 7 and 13 × 13), effectively expanding the receptive field and enhancing multi-scale feature capture. Unlike conventional small kernels (e.g., 3 × 3) [32,34,35,36,37,38], which struggle to achieve a large effective receptive field (ERF), our approach ensures a more comprehensive feature extraction process. Additionally, computational efficiency is significantly improved as the branches collapse into a single equivalent large-kernel convolution during inference. To further optimize parameter efficiency, the module integrates a sparse activation mechanism, utilizing L1 regularization and feature compression techniques to achieve a lightweight model without sacrificing detection performance. The architecture of the module is depicted in Figure 5.
To enhance feature extraction, the proposed module integrates several key components. First, the dilated reparameterization block captures multi-scale spatial information using multiple dilated convolutions, which are later reparameterized into a single equivalent convolution kernel for efficient inference. Depthwise convolution (DW Conv) [35] follows to refine features with minimal overhead.
To improve channel-wise representation, a squeeze-and-excitation (SE) block [39] adaptively recalibrates feature importance. It first applies global average pooling (GAP) to aggregate spatial information, followed by two fully connected layers with ReLU and sigmoid activations to generate attention weights, which rescale the feature maps to highlight informative channels.
Next, a feed-forward network (FFN) processes the recalibrated features. The first linear layer expands the feature dimension, followed by gated exponential rectified unit (GERU) activation for enhanced gradient propagation and stability. A second linear layer restores the original dimension, ensuring both expressiveness and parameter efficiency. Batch normalization (BN) is applied to ensure training stability.
To prevent overfitting, dropout regularization is introduced before the residual connection, which preserves essential information and facilitates gradient flow. This combination of components balances computational efficiency and performance, leveraging both large-scale and fine-grained feature representations.

2.3.2. C3k2_RFCBAMConv

Attention mechanisms have achieved remarkable progress in deep learning, ranging from SE-Net [39], which focuses on channel attention, to CBAM [40], which combines channel and spatial dual attention, and non-local techniques emphasizing global information of feature maps [39]. These methods significantly improve the accuracy and expressiveness of feature extraction. In object detection tasks, where the sizes of objects vary greatly, and uneven illumination is common, the ability to capture both channel and spatial information is crucial. Therefore, the C3k2_RFCBAMConv module was designed to enhance the extraction of channel and spatial features, improving performance in complex scenes.
The C3k2_RFCBAMConv module integrates the core advantages of the residual feature and channel block attention module (RFCBAM). Based on standard convolution, it introduces residual feature blocks and attention mechanisms [41], ensuring a balance between global and local information extraction. The module combines channel attention (CA) and spatial attention (SA) to significantly improve the capture of critical features [42]. The CA and SA formulas are as follows:
Channel attention (CA):
ϕ = Conv 3 ( F ) + Conv 5 ( F ) ,
g = GAP ( ϕ ) ,
δ = Softmax ( g row × g col + g row + g col ) ,
Λ = ϕ × δ .
Spatial attention (SA):
F avg = AvgPool ( Λ ) , F max = MaxPool ( Λ ) ,
Δ = σ ( Conv 1 × 1 ( [ F avg F max ] ) ) ,
F out = Λ × Δ .
The innovation of the C3k2_RFCBAMConv module lies in its dual-path feature extraction and attention fusion mechanisms. By jointly modeling channel and spatial features, it achieves efficient object detection in complex scenarios. Additionally, the residual connection preserves low-level feature details and mitigates gradient vanishing issues in deep networks, further enhancing the learning capacity of the model. The structure of the C3k2_RFCBAMConv module is shown in Figure 6.

2.3.3. Detect_TADDH

In object detection, the prediction head plays a crucial role in balancing classification accuracy and localization precision. To address challenges in complex scenarios, we propose the Detect_TADDH module, which integrates a task-adaptive detection decoding head (TADDH). This module enhances the interaction between classification and regression tasks through a task-aligned optimization strategy inspired by recent multi-task learning advancements [43].
Detect_TADDH processes feature maps from three scales, small ( P 3 / 8 ), medium ( P 4 / 16 ), and large ( P 5 / 32 ), to detect objects of varying sizes. These multi-scale features first pass through a series of group-normalized convolutional layers (Conv_GN), which refine feature representations while reducing computational overhead. The outputs are then summed element-wise to form a shared representation that preserves both local and global semantic information. To further improve task-specific learning, the task decomposition position module separates classification and regression processing. The classification branch focuses on category prediction, while the regression branch enhances localization accuracy. Unlike conventional decoupled heads, our approach retains controlled information sharing while optimizing each task separately.
To refine feature extraction for localization, the regression branch integrates Deformable Convolutional Networks V2 (DCNV2) [44], which dynamically adjusts receptive fields by learning offsets. These offsets are predicted via a generator mask and offset module, ensuring alignment with object boundaries. The transformed features are then combined with task interaction features through element-wise multiplication, enhancing adaptability to complex object structures. Meanwhile, the classification branch directly utilizes task interaction features for dynamic feature selection, ensuring that both tasks leverage shared information effectively.
To balance classification and localization tasks, we introduce task-adaptive multi-task loss formulated as follows:
L total = α · L cls + β · L reg ,
where L cls and L reg denote classification and regression losses, respectively. The weights α and β are dynamically adjusted during training, ensuring the model prioritizes more challenging tasks while maintaining overall performance. To further refine detection outputs, each detection layer employs a refined decoding strategy. Given a feature map F i at scale i, the final detection output is computed as follows:
D i = σ ( Conv 1 × 1 ( F i ) ) × Softmax ( Conv 3 × 3 ( F i ) ) ,
where σ applies the Sigmoid function for bounding box regression, and Softmax generates class probabilities. This ensures efficient and precise predictions with minimal computational cost.
To improve consistency between classification and localization, Detect_TADDH applies a task-specific scaling mechanism in the regression branch. Specifically, regression predictions are normalized through global average pooling (GAP) and re-scaled to match classification outputs. This prevents imbalances between the two tasks and enhances detection stability. Compared to conventional detection heads, Detect_TADDH improves multi-task interaction through task decomposition and DCNV2 while maintaining efficient feature processing via Conv_GN layers. The combination of adaptive loss weighting, refined decoding, and scaling mechanisms results in a detection head that optimally balances accuracy, efficiency, and computational complexity. The specific details are depicted in the following Figure 7.
The Detect_TADDH module achieves an excellent balance of speed and accuracy, making it highly suitable for real-time object detection applications, particularly in scenarios with complex spatial and scale variations.

2.4. Training Equipment and Parameter Setting

In this study, the deep learning model was developed using the PyTorch 1.10.0+cu113 framework on the Ubuntu 20.04.3 LTS operating system and trained on an NVIDIA RTX 4090 GPU. The detailed configuration of the experimental environment is shown in Table 2, and the parameter settings for the training phase are presented in Table 3.
During the hyperparameter selection process, we first referred to best practices from previous YOLO-series models and considered the characteristics of agricultural object detection tasks to establish the initial parameters. We then conducted hyperparameter tuning experiments on a validation set comprising 20% of the total dataset, adjusting key parameters such as learning rate, batch size, and number of training epochs to find the optimal configuration.
To enhance detection performance, we set the input image size to 640 × 640. Image augmentation techniques, including random scaling within a 50% range (50–150% of the original size), were utilized to improve the model’s robustness in detecting objects of varying sizes. Additionally, mosaic augmentation and online data augmentation were applied following the official default parameters, leveraging their ability to improve object detection performance under varied conditions. The number of training epochs was set to 200, and the batch size was set to 16 to balance model convergence and computational efficiency.
Additionally, the initial learning rate was set to 0.01, with a warm-up phase of 3 epochs, where the learning rate gradually increased in the early training stages to ensure stability and proper convergence. This strategy prevents sudden weight oscillations and helps the model reach an optimal state efficiently. We also adopted the SGD optimizer, which is well-suited for large deep learning models. Using the SGD optimizer simplifies the computational process and, when combined with the momentum factor, effectively accelerates convergence. The momentum factor was set to the value of 0.937 in the SGD optimizer to accelerate convergence by smoothing gradient updates, ensuring a faster and more stable training process. For the learning rate adjustment strategy, we employed a cosine annealing scheduler to gradually reduce the learning rate throughout the training process, allowing the model to fine-tune its parameters and improve performance as training progresses.

3. Results

3.1. Training Results of the Proposed Model

The loss and accuracy curves shown in 
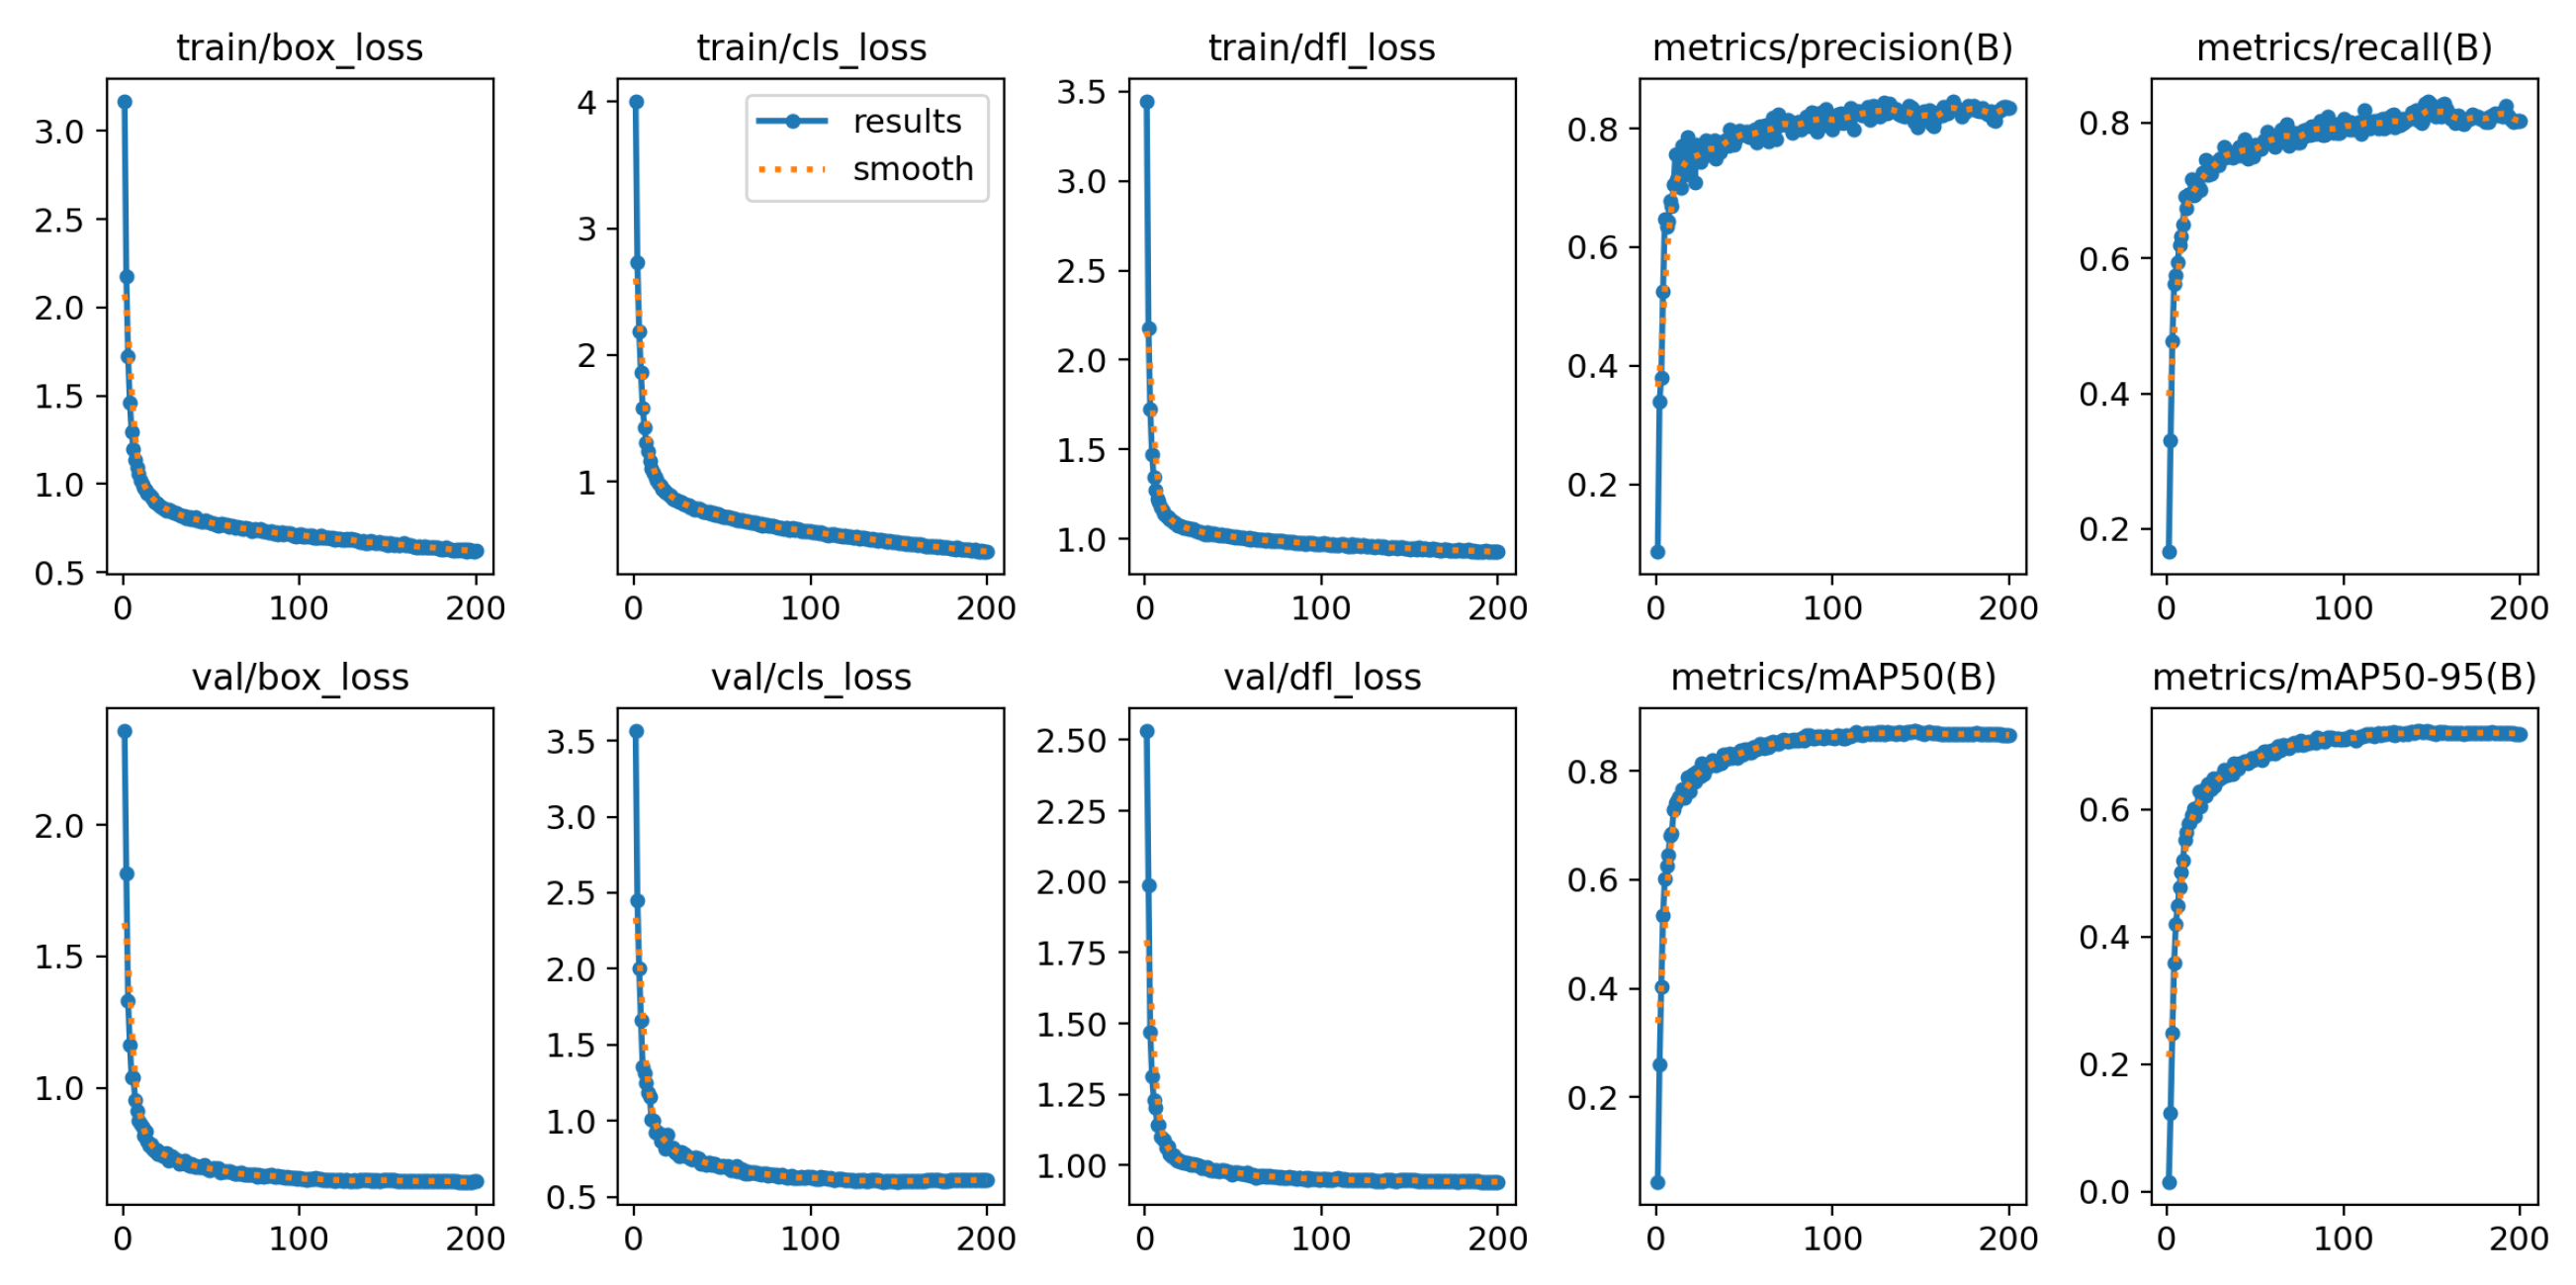
Figure 8 reveal essential details about the training process of the proposed model. In the initial stages of training (early epochs), the loss curve declines rapidly, suggesting that the model is quickly learning from the training data and improving its fit. As the training proceeds, both the training and validation losses gradually plateau, indicating that the model has achieved a better fit to the data. Similarly, the curves for precision, recall, and mAP show a parallel upward trend, eventually stabilizing at a higher level, further confirming the model’s effectiveness. This sequence of results demonstrates that the tomato ripeness detection model has not overfitted during training, with stable index values and excellent convergence. The smoothness of the loss curve shows that the model has successfully fitted the data, and the continued improvement of the validation metrics suggests significant progress on the validation set as well. Thus, the model exhibits strong generalization ability and stability in both the training and validation phases.

3.2. Model Evaluation Metrics

To comprehensively evaluate the performance of the proposed URT-YOLOv11 model, we consider several key evaluation metrics commonly used in object detection tasks. These include precision, recall, F1-score, mAP50, parameters, FPS, GFLOPs, and VRAM (GB). Each metric provides insights into different aspects of the model’s accuracy, efficiency, and computational complexity.
Precision measures the proportion of correctly detected tomatoes among all detected objects. It is calculated as follows:
Precision = T P T P + F P ,
where T P (true positives) are correctly detected tomatoes, and F P (false positives) are incorrect detections (e.g., background misclassified as a tomato). A higher precision indicates that the model produces fewer false positives, which is crucial in applications where misclassification could lead to incorrect assessments of tomato ripeness.
Recall quantifies the model’s ability to detect all actual tomatoes in an image. It is provided by the following:
Recall = T P T P + F N ,
where F N (false negatives) are missed detections (e.g., tomatoes not detected at all). A higher recall indicates that the model successfully detects most tomatoes in the dataset, reducing the likelihood of missing important objects.
The F1-score provides a balanced measure of precision and recall and is computed as follows:
F 1 = 2 × Precision × Recall Precision + Recall .
The F1-score is especially useful when balancing precision and recall is necessary, such as when detecting tomatoes at different ripening stages in complex backgrounds.
Mean average precision (mAP) is a key metric in object detection. mAP50 measures the accuracy of predictions where the intersection over union (IoU) threshold is set to 0.5, meaning a prediction is considered correct if at least 50% of the detected bounding box overlaps with the ground truth.
mAP @ 50 = 1 N i = 1 N A P i .
The total number of learnable parameters in a model impacts its computational complexity and memory footprint. A lower parameter count generally results in a more efficient model suitable for real-time applications.
FPS measures the model’s inference speed by evaluating how many images can be processed per second. A higher FPS is desirable for real-time applications in smart agriculture where timely decisions (e.g., automated tomato harvesting) are necessary.
GFLOPs indicate the number of floating-point calculations the model performs per second. It is an important metric for evaluating computational efficiency, especially for edge devices.
VRAM consumption is a critical factor when deploying models on embedded or GPU-constrained devices. Efficient memory usage ensures the model can run smoothly on real-time agricultural systems.

3.3. Cross-Validation for Stability and Generalization

To further validate the stability and generalization ability of the model, k-fold cross-validation was employed in addition to the standard validation set. This approach divides the dataset into k subsets (folds), where each fold is used as a validation set while the remaining folds are used for training. This process was repeated k = 5 times, each time with a different fold serving as the validation set.
We chose k = 5 to balance computational cost and ensure reliable model performance evaluation across different data splits. This method allowed us to assess the model’s performance on different subsets of the data, minimizing the risk of overfitting to any particular split and providing more robust estimates of its generalization ability.
The results of the cross-validation were consistent, with the model showing stable performance across different folds. The performance metrics for each fold are summarized in Table 4, which includes mAP, precision, recall, mAP50, and the percentage fluctuation for each metric. These results reinforce the model’s robustness and reliability in real-world applications.
The results from the five-fold cross-validation demonstrate that the model performs consistently across different folds. The average mAP was 0.869, with precision of 0.840, recall of 0.794, and mAP50-95 of 0.723. These values reflect the model’s balanced performance across all metrics. The fluctuation percentages for each metric were minimal, highlighting the model’s stability across data splits. mAP showed a small fluctuation at 0.7%, indicating high consistency in the model’s overall accuracy. The recall metric exhibited a slightly higher fluctuation of 1.5%, which may suggest some variability in the detection of true positives across different subsets of the dataset. Overall, these results confirm that the model’s performance is robust, making it suitable for real-world applications where consistency is crucial.

3.4. Failure Analysis

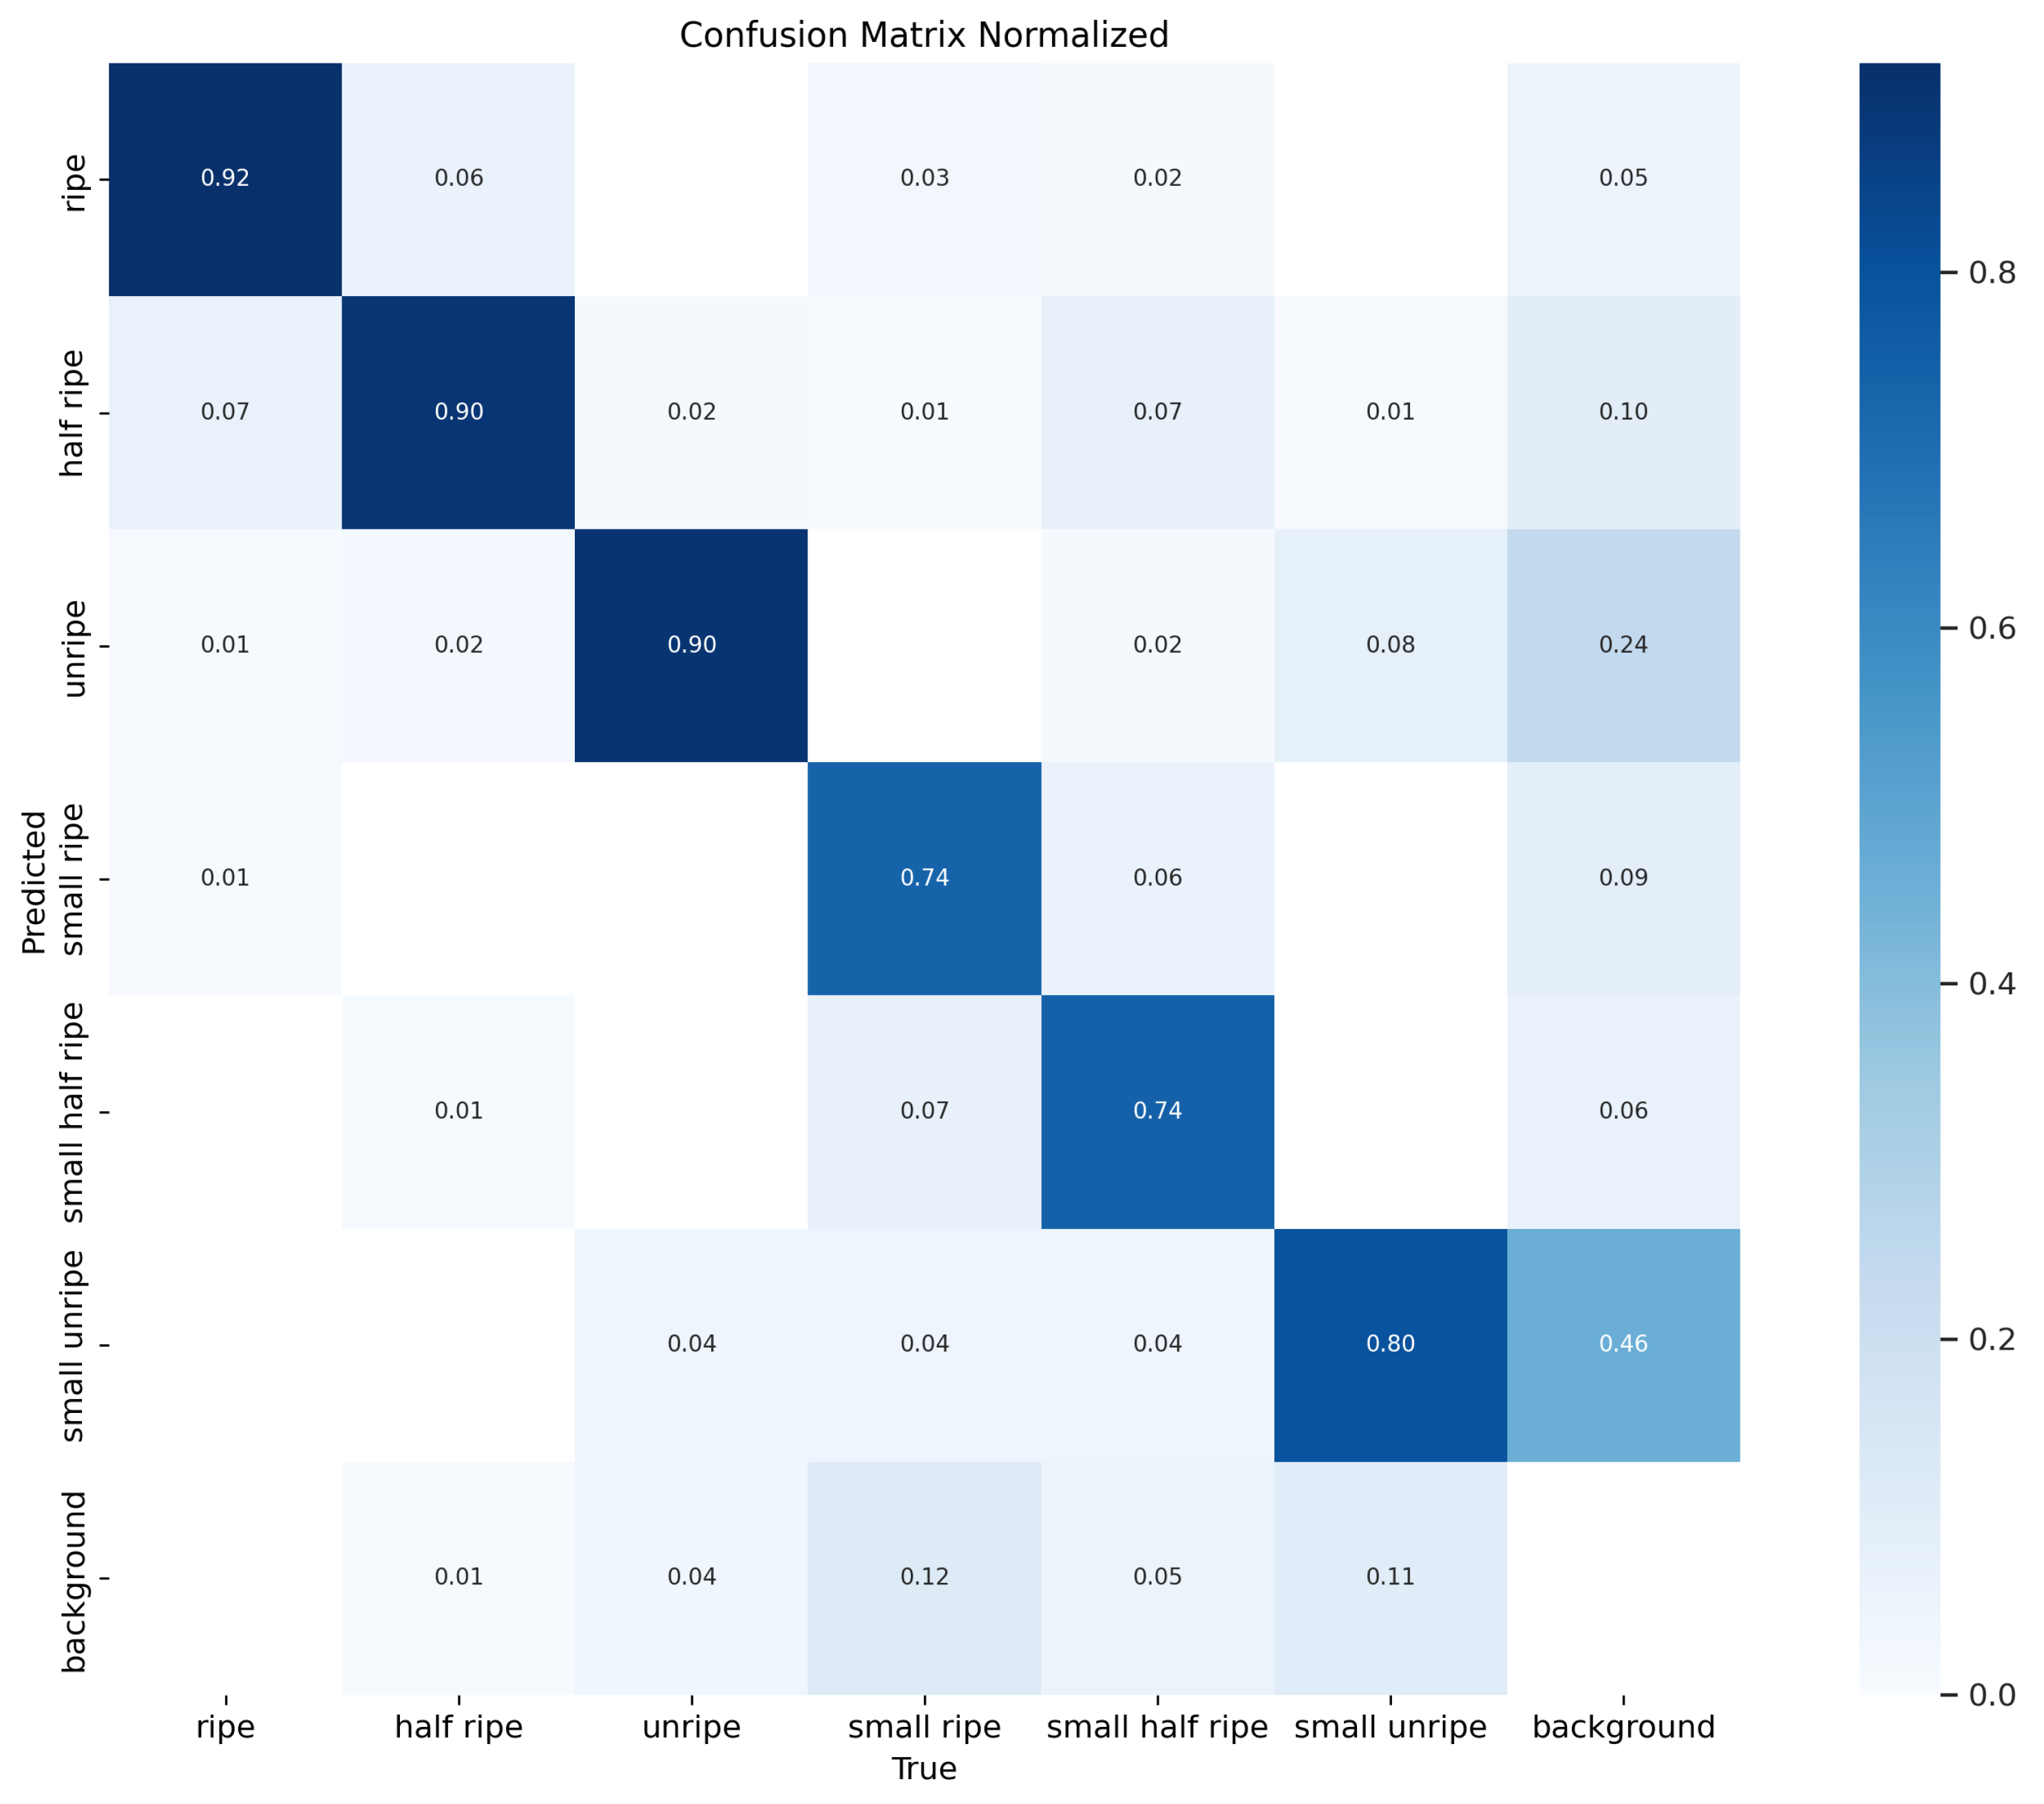
A confusion matrix is a tool used to evaluate classification models by comparing the true and predicted labels. It helps identify misclassifications and provides insight into where the model makes errors. Since our dataset contains imbalanced categories, we normalized the confusion matrix to ensure fair visualization of performance across all classes.
The confusion matrix in Figure 9 shows that the model performs well in the ripe and half-ripe categories, with correct classifications of 92% and 90%, respectively. For small ripe, small half-ripe, and small unripe tomatoes, the model’s accuracy is 74%, 74%, and 80%, respectively. However, misclassifications occur, with 12%, 5%, and 11% of these tomatoes being identified as background. Due to their smaller size, these categories are more difficult to detect and are more easily misclassified as background compared to larger categories. While the model shows strong performance for larger categories, it still provides reliable results for smaller objects. Improving small object detection and background separation will further enhance its accuracy.

3.5. Ablation Experiment

In this study, the original YOLOv11 model is used as a benchmark for ablation experiments to evaluate the contribution of different modules. We use mAP@0.5:0.95, mAP@0.5, precision, and recall as performance metrics to evaluate the effectiveness of the model on the customized tomato dataset. The results of the ablation experiments are shown in Table 5. As shown in the table, the addition of the UniRepLKNetBlock module improves recall by 1.1%. After integrating the RFCBAM module, mAP@0.5 increases by 1%. With the addition of the TAADH module, mAP@0.5:0.95 further increases by 0.8%, and parameters decrease by 0.38 M. In addition, when the UniRepLKNetBlock module is used in conjunction with the RFCBAM module, the model performance is significantly improved, with precision increasing by 4.7% and mAP@0.5:0.95 improving by 1.9%. When all three modules (UniRepLKNetBlock, RFCBAM, and TAADH) are used in combination, the performance is significantly improved, with mAP@0.5 and mAP@0.5:0.95 increasing by 1.9% and 1.6%, respectively. Precision and recall are also improved by 5.7% and 1.1%, respectively. Compared to the non-use of the TAADH module, parameters are reduced by 0.25 M, and precision and recall are also improved by 5.7% and 1.1%, respectively. These results indicate that combining the various modules together can significantly improve the overall performance of the model, thus further validating the effectiveness of each module.
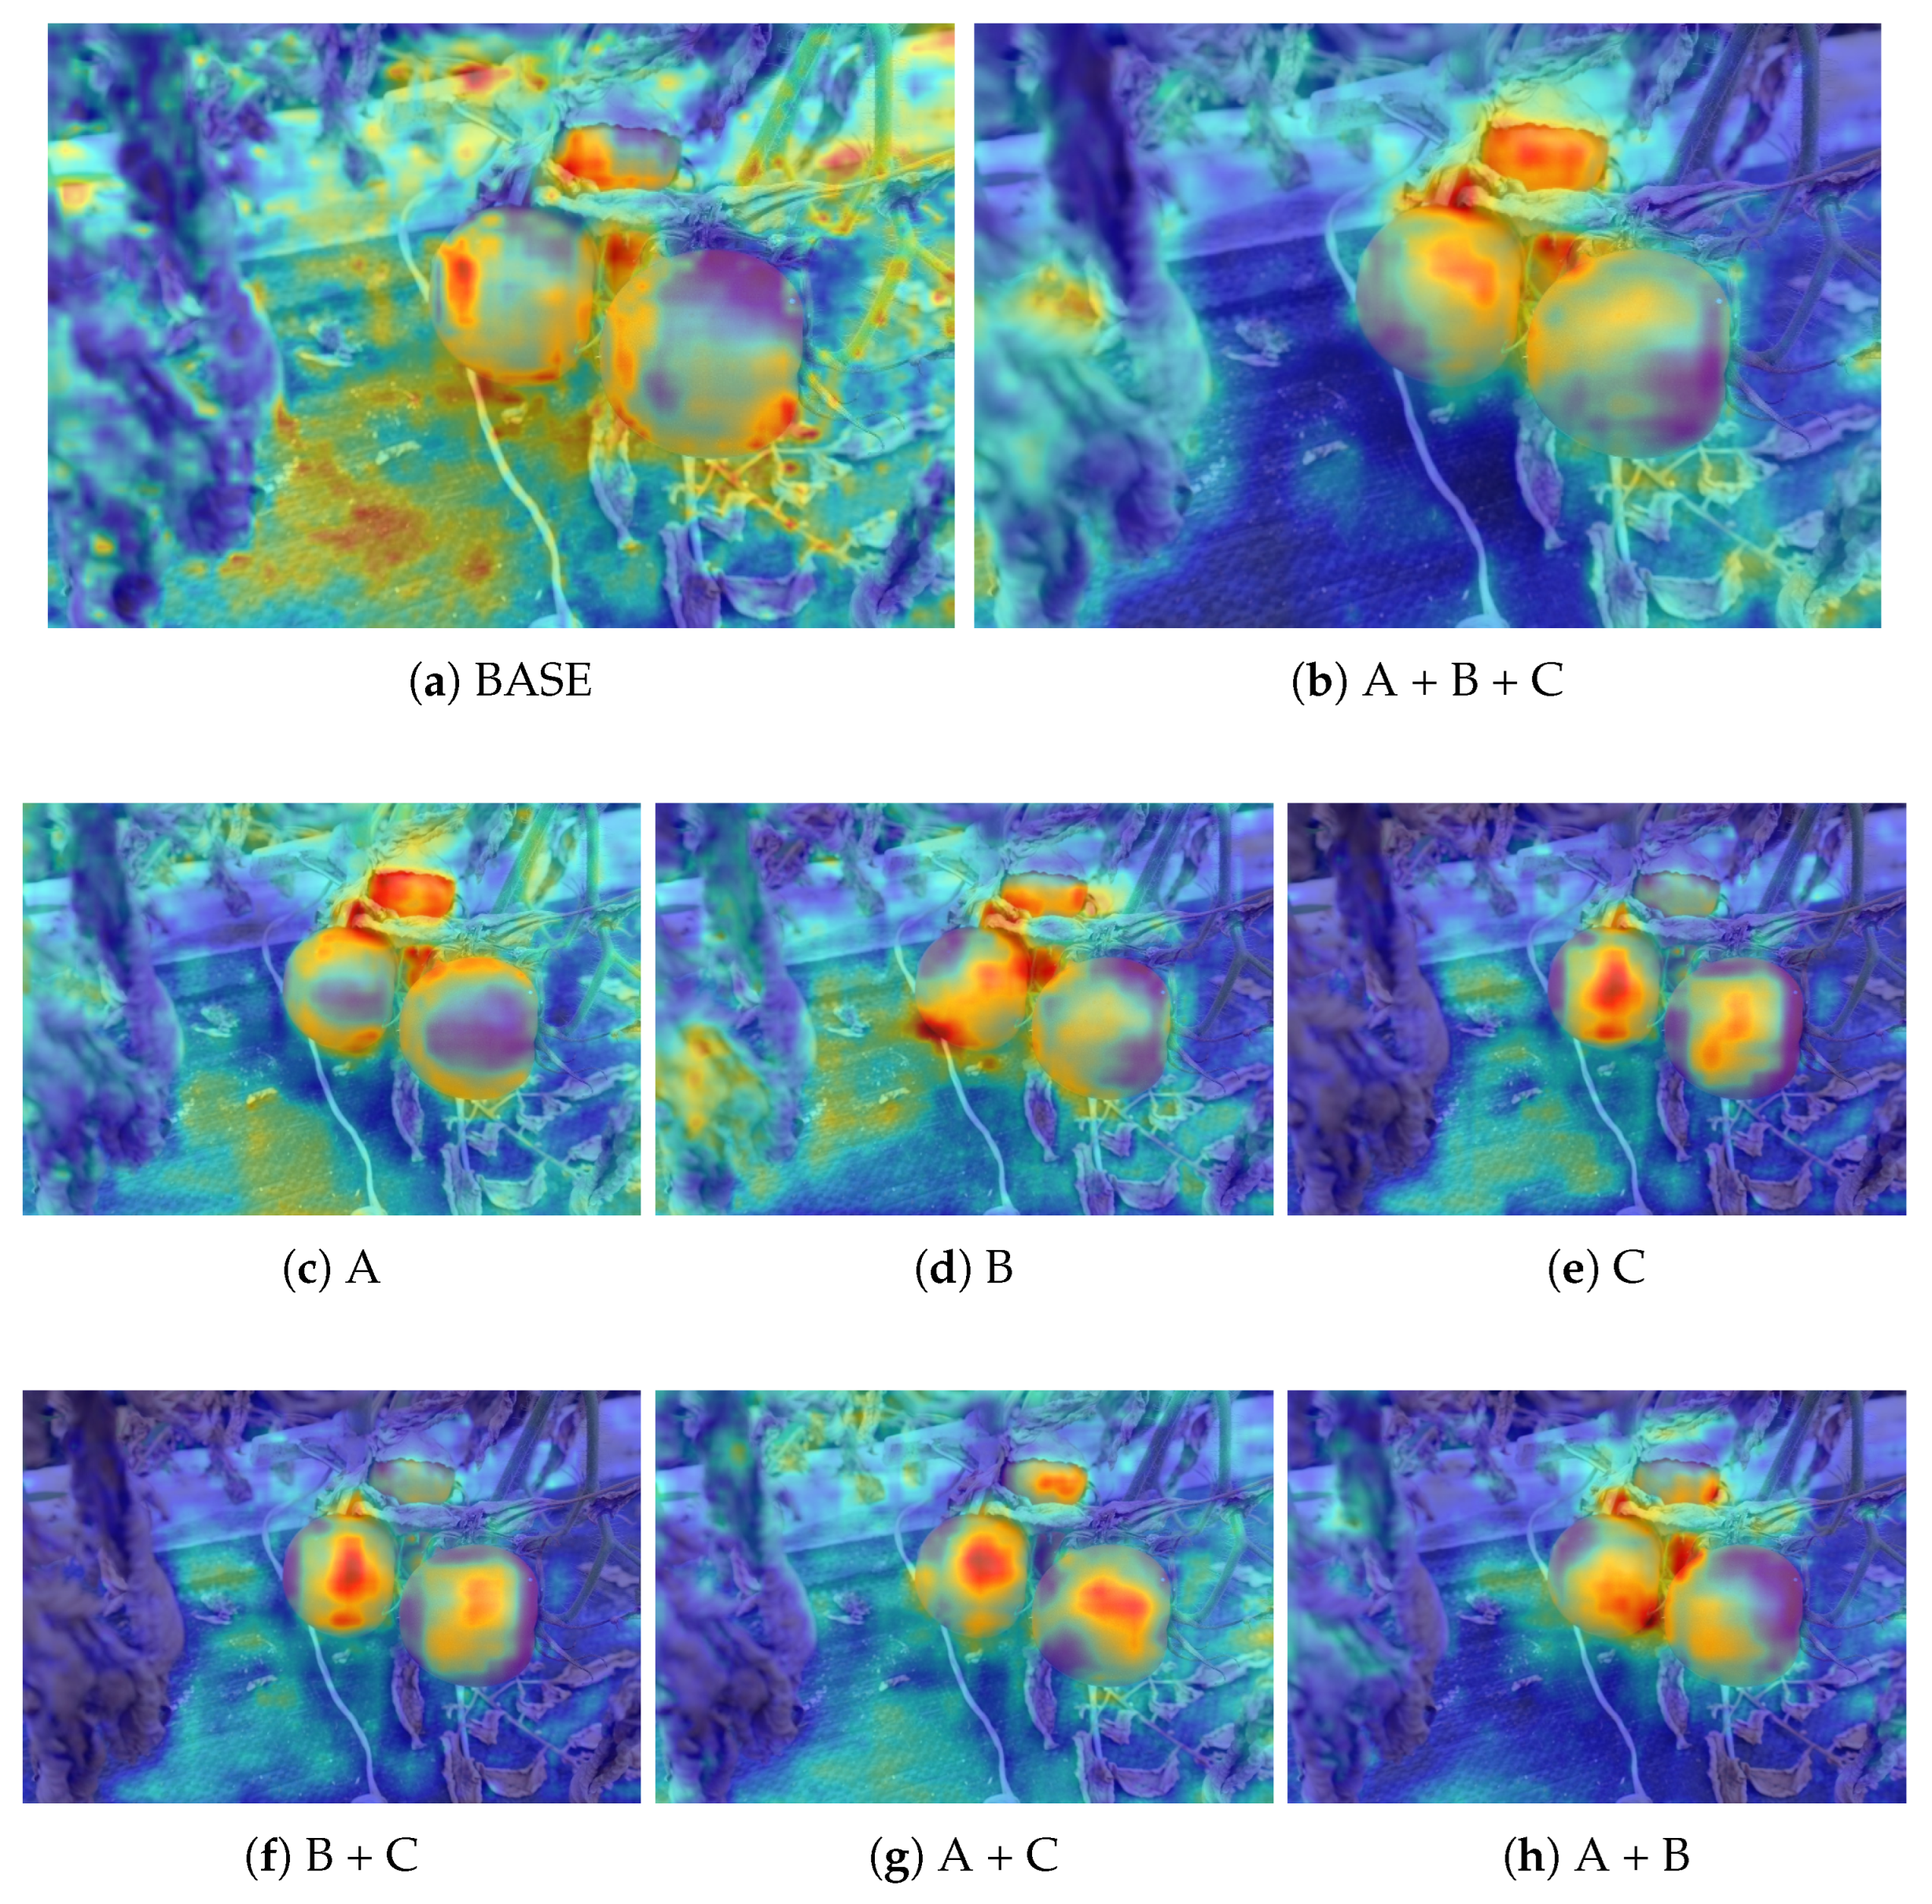
To further validate the impact of each module, Grad-CAM visualizations are used to analyze the model’s attention distribution before and after module integration, as shown in Figure 10. The baseline YOLOv11 model exhibits dispersed attention, highlighting not only the target fruits but also irrelevant regions like branches and the background, leading to potential false detections.
With the addition of UniRepLKNetBlock, the model’s recall improves as it captures more contextual information, though some background noise remains. The RFCBAM module enhances object–background differentiation, reducing distractions and increasing mAP@0.5. Incorporating TAADH further sharpens attention on the fruits while reducing parameters, leading to better efficiency. When all three modules are combined, the model achieves the most precise attention, with significant improvements in mAP, precision, and recall, confirming the effectiveness of each module in refining detection performance.

3.6. Comparison Between Different Target Detection Networks

To evaluate the actual detection performance of the improved algorithm, a comparison is made between the proposed algorithm and several classical object detection methods. The object detection algorithms included in this comparison are SSD, faster R-CNN, YOLOv5, YOLOv8, YOLOv9, YOLOv10, and DETR. The SSD model uses MobileNetv2 as its backbone network, while faster R-CNN employs ResNet101 as the backbone. The other models are based on their default architectures. The experimental results are presented in Table 6.
Table 6 demonstrates that our improved YOLO model achieves superior performance, attaining a 2.2% higher mAP@0.5 compared to the state-of-the-art YOLOv11 benchmark. Specifically, URT-YOLOv11 achieves an accuracy of 84.0%, a recall of 80.3%, an mAP of 87.3%, and an F1-score of 82.2%, highlighting a substantial enhancement in detection accuracy and robustness under complex agricultural conditions.
In addition to improved accuracy, URT-YOLOv11 demonstrates significant computational efficiency. The model reduces the parameter count by approximately 16.4% (from 2.58 M to 2.16 M), leading to a decrease in memory usage (from 4.2 GB to 3.9 GB) and a notable increase in processing speed (576 FPS vs. 479 FPS). GFLOPs are also reduced from 6.3 to 5.8, reinforcing the model’s suitability for real-time applications on resource-constrained platforms.
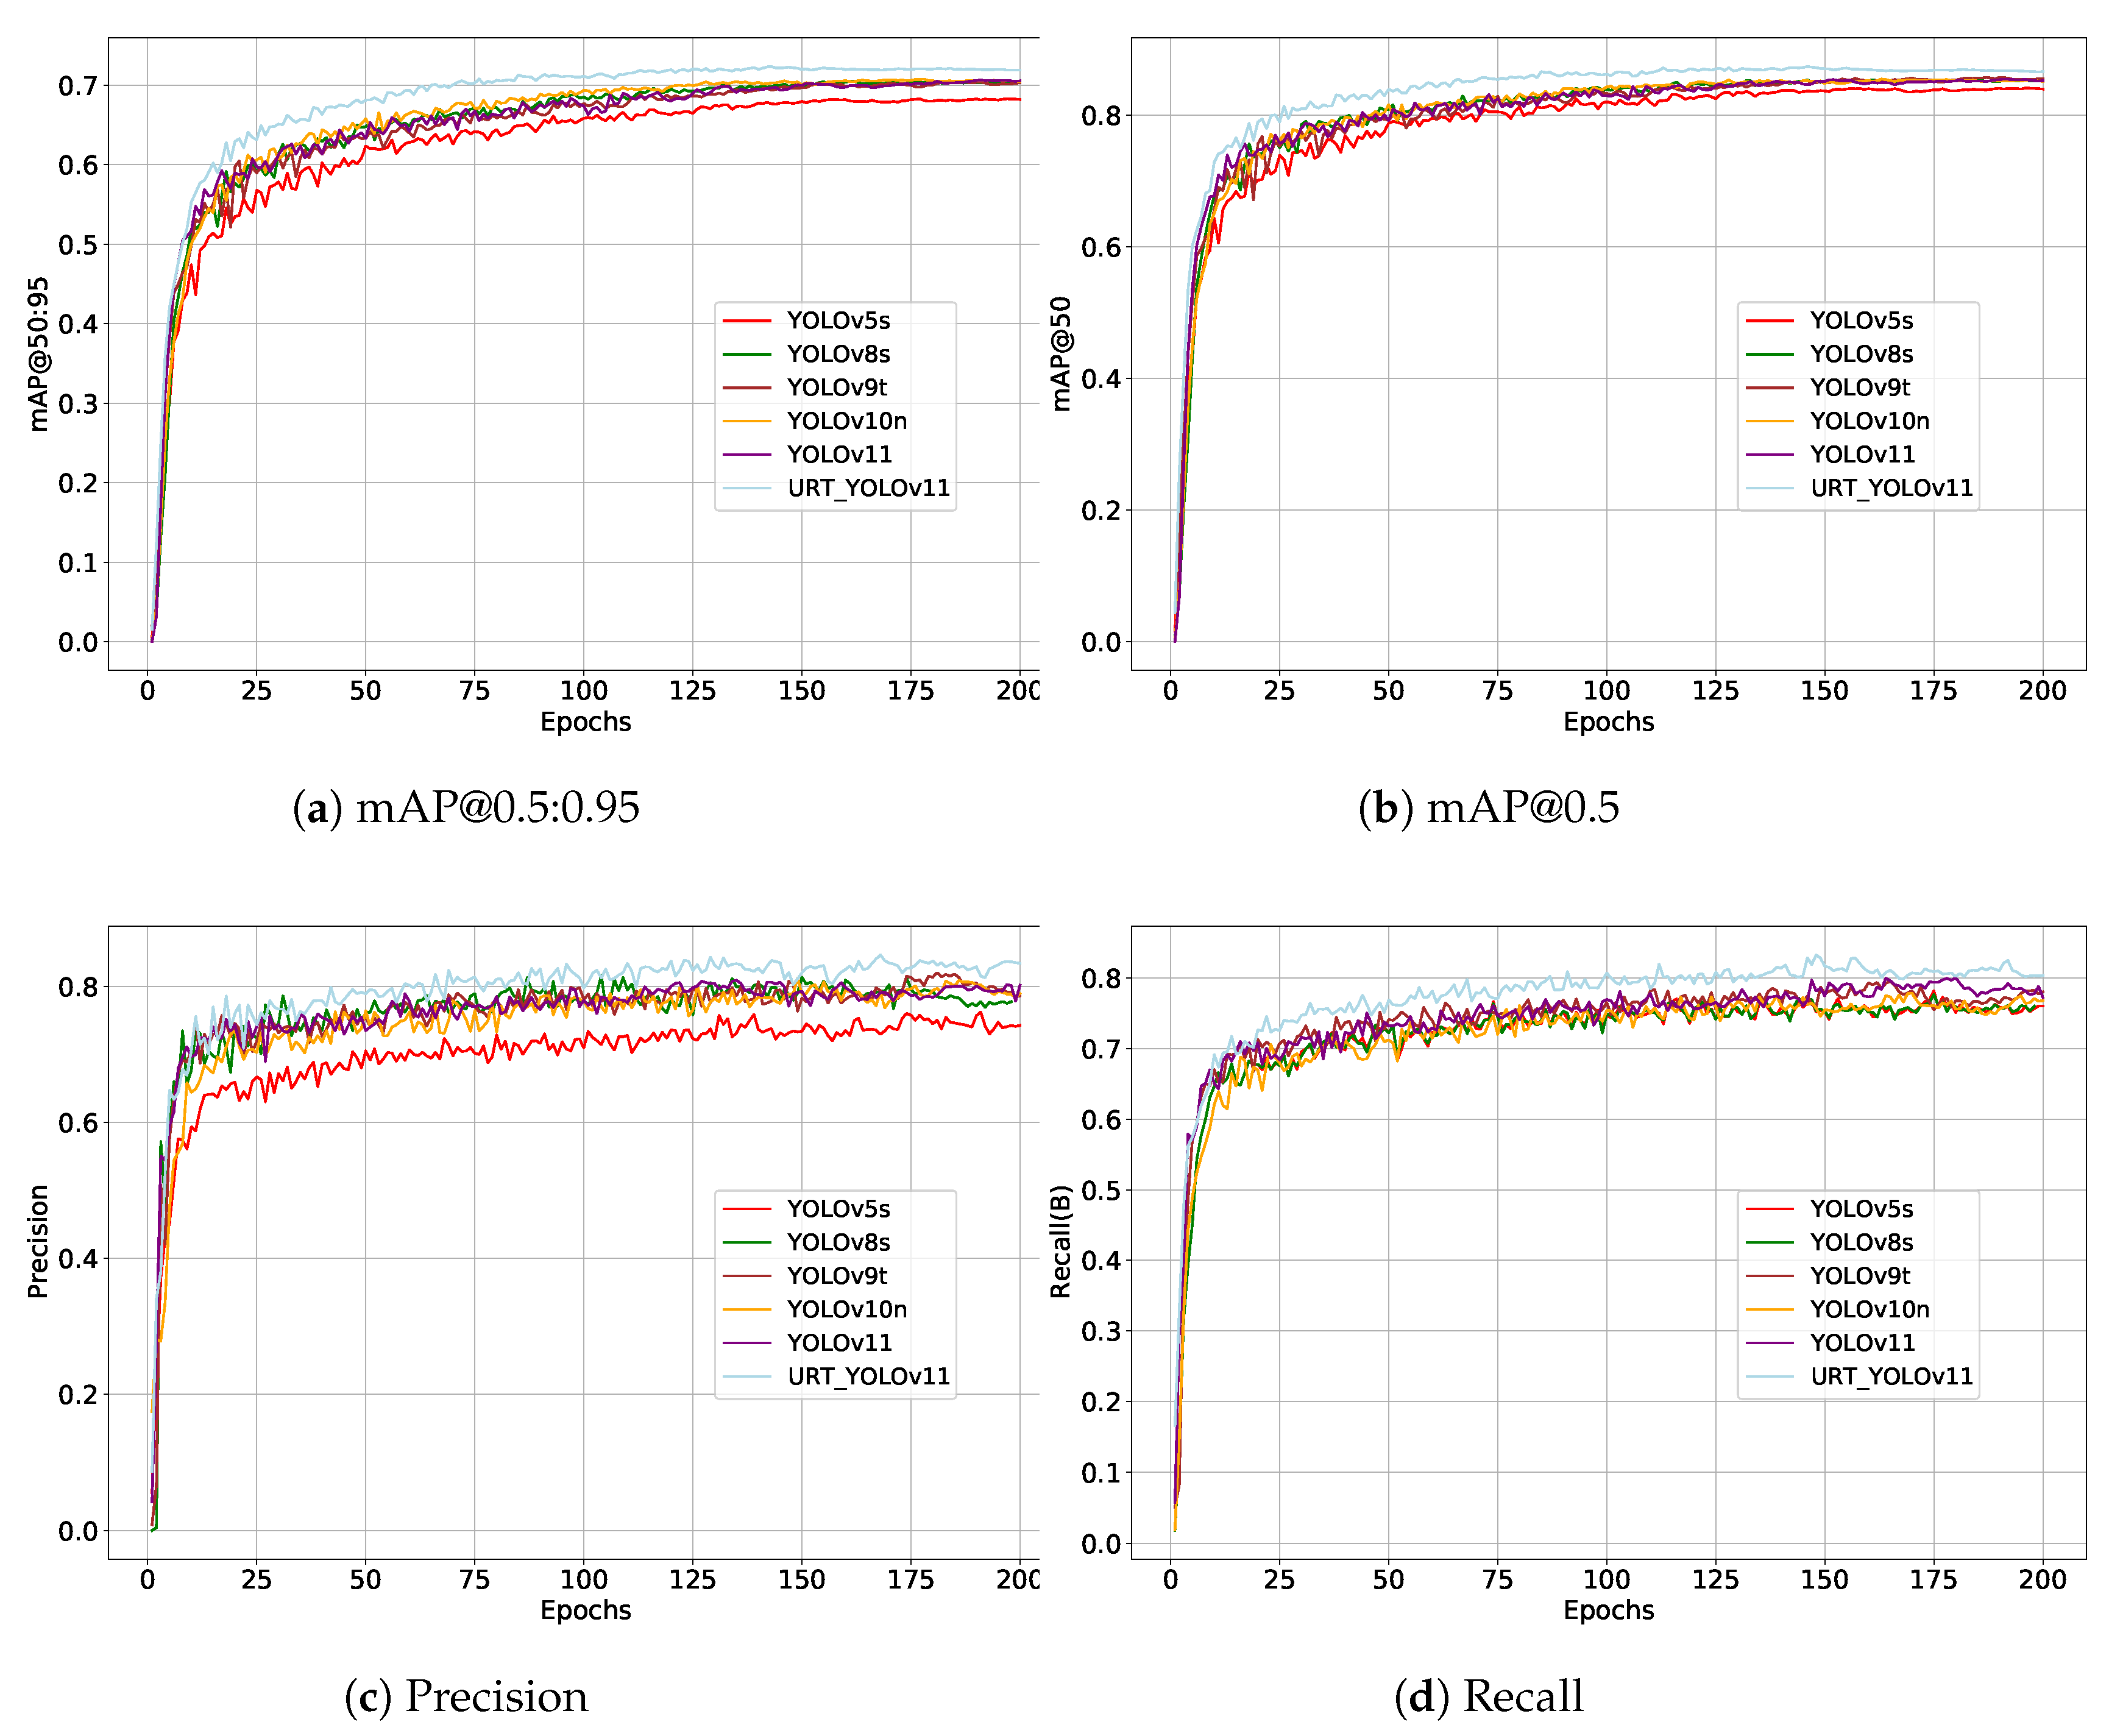
Additionally, this study presents the trends of the mAP@0.5 and mAP@0.5:0.95 metrics on the test set throughout the training process, as illustrated in Figure 11a and Figure 11b, respectively, providing further insights into their comparative performance. As shown specifically in Figure 11, these trends offer a detailed analysis of the model’s performance during training.
Table 7 presents a comparative analysis of performance metrics between the proposed model (“ours”) and the baseline YOLOv11 model across various object classes. The evaluation metrics include precision, recall, F1-score, mAP50, and model size.
For the overall performance across all categories, our model achieves a precision of 84.0% and a recall of 81.0%, resulting in an F1-score of 82.6% and an mAP50 of 85.0%. In comparison, the YOLOv11 model achieves 81.5% precision, 81.2% recall, and an F1-score of 82.0%, with a higher mAP50 of 88.0%.
Analyzing individual object classes, our model exhibits notable improvements in specific cases. For the large half-ripe class, our model outperforms YOLOv11, achieving higher precision (89.4% vs. 84.6%) although the base model retains a slight recall advantage. Similarly, for the small unripe class, our model surpasses YOLOv11 in both precision (82.8% vs. 82.2%) and F1-score (82.2% vs. 80.4%), demonstrating its robustness in detecting smaller objects.
In terms of model efficiency, our approach maintains a competitive balance between accuracy and computational complexity. Notably, our model achieves a model size of 2.16 M parameters, compared to the 2.58 M parameters required by YOLOv11. This reduction in complexity highlights that our model is more efficient while still achieving high detection accuracy.
These results collectively indicate that the proposed model achieves comparable or superior detection performance across various object classes while maintaining a more optimized model size, making it an attractive candidate for real-time applications and deployment in resource-constrained environments.

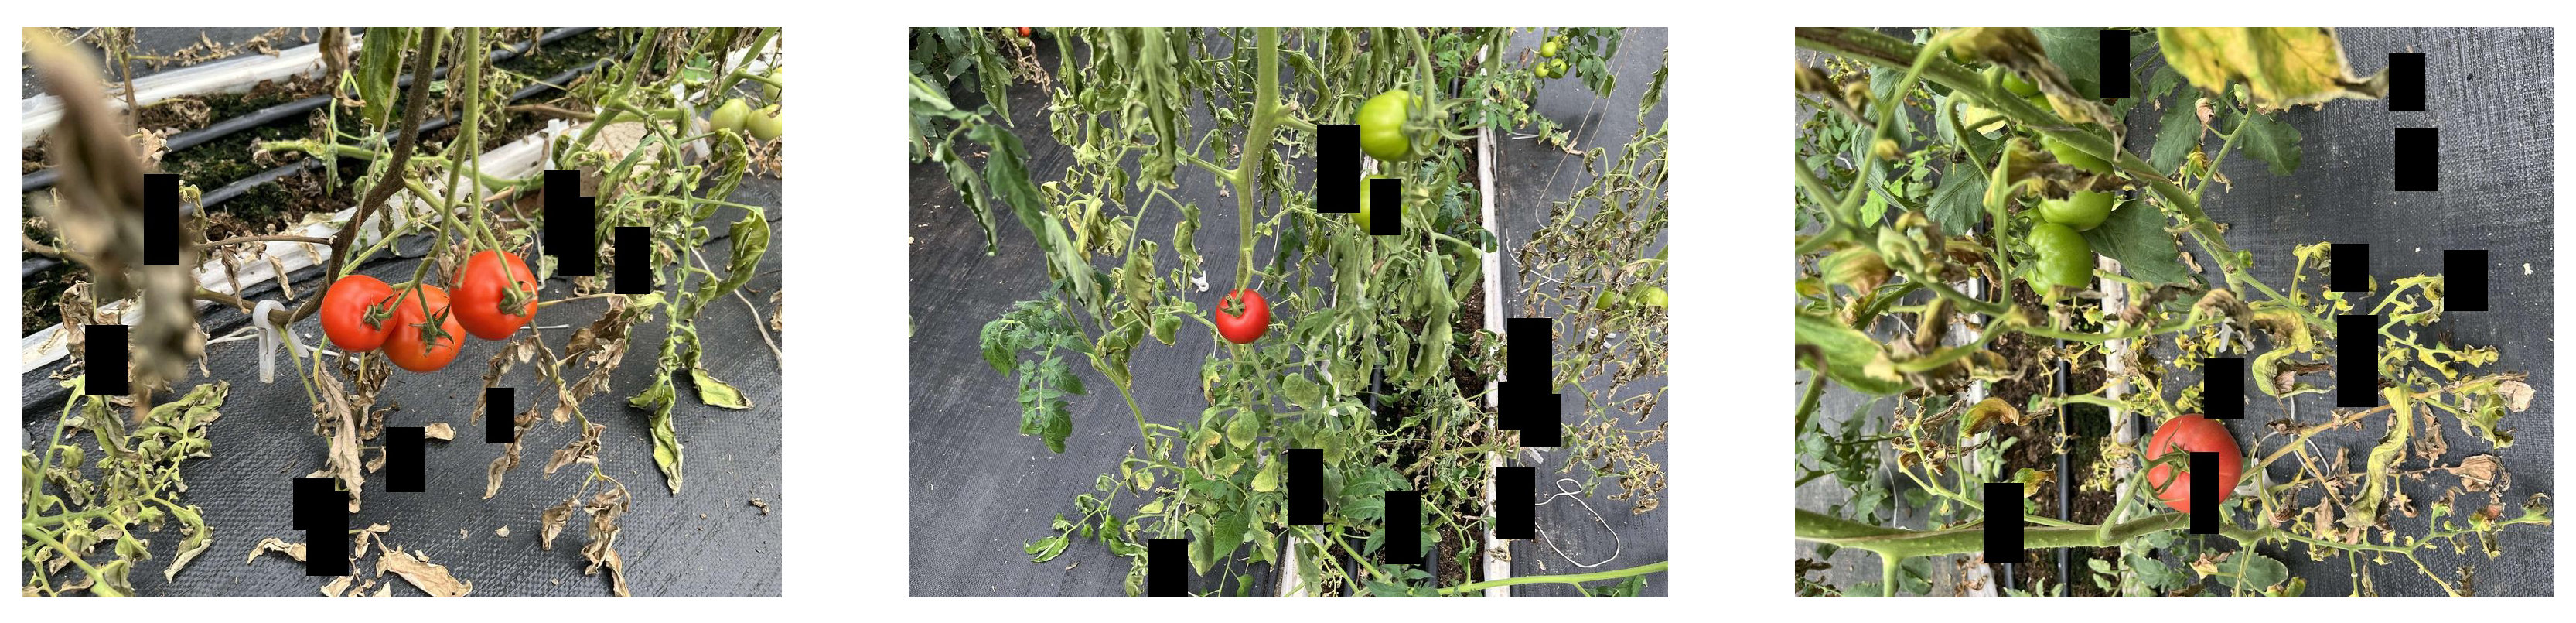
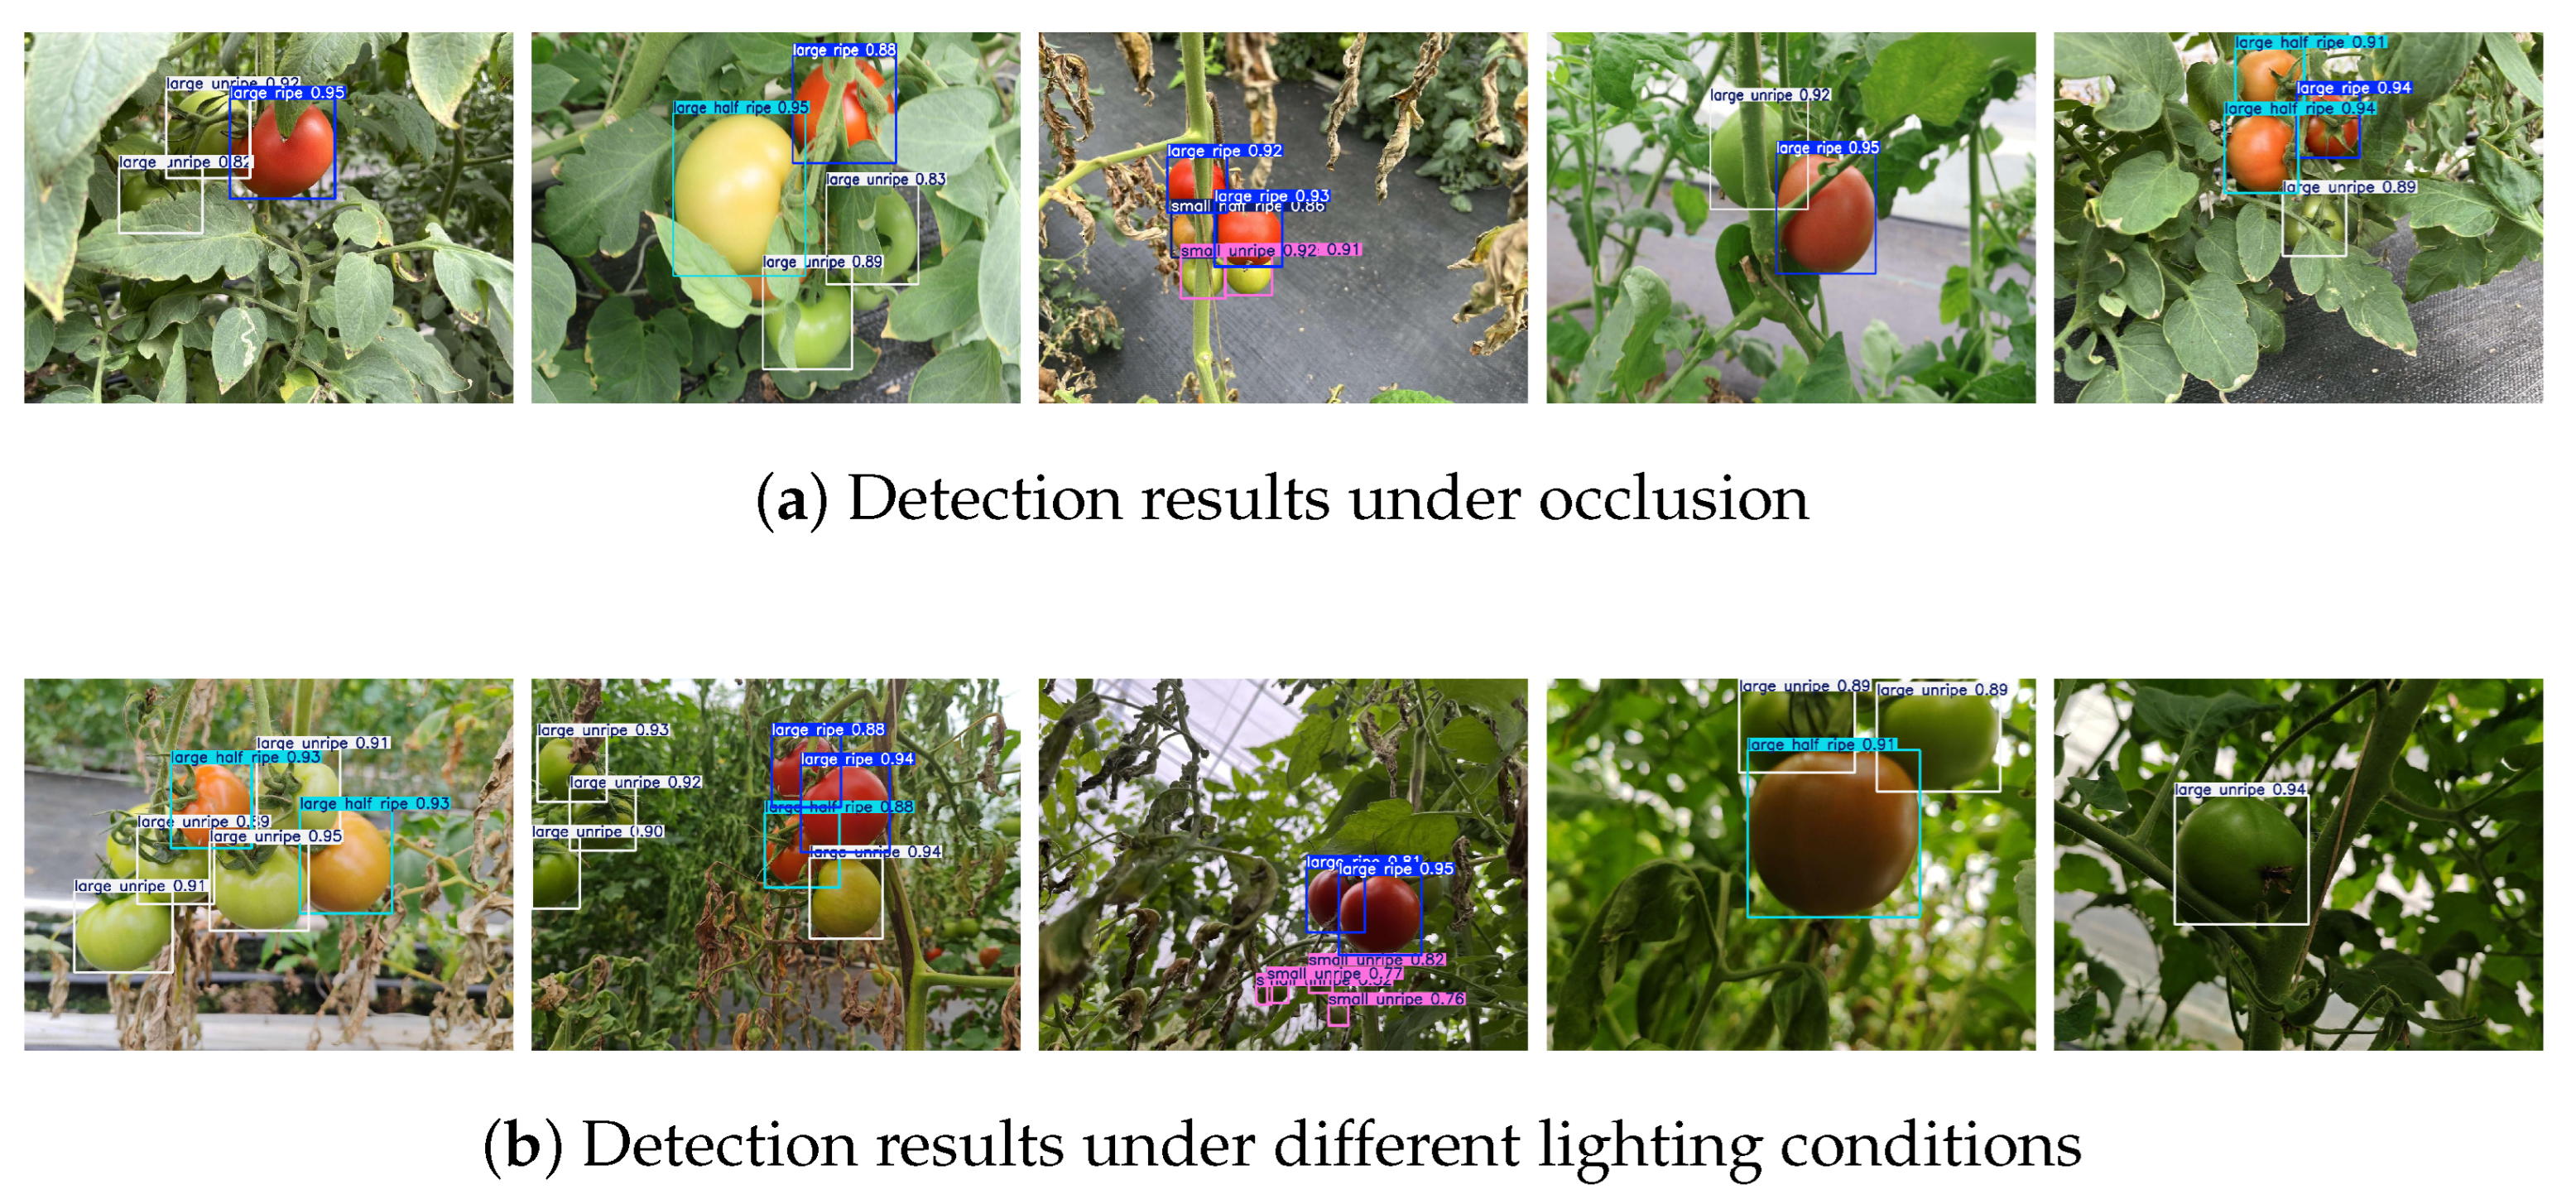
3.7. Testing in Occluded Conditions

In practical tomato cultivation environments, occlusions frequently arise from branches, leaves, and overlapping fruits, which complicate the accurate detection and classification of tomatoes. To systematically assess the robustness of our model in the presence of such occlusions, we artificially introduce occlusions into the test dataset by modifying the original images.
Figure 12 presents examples of artificially created occlusions, demonstrating different occlusion conditions designed to simulate real-world challenges encountered in paddy fields.
Table 8 summarizes the performance of our model when tested under occlusion conditions. The results demonstrate that the proposed approach maintains strong detection capabilities despite occlusions. The overall mean average precision (mAP) for all tomato species reaches 83.5%, with each individual species achieving an mAP above 70%. These findings highlight the generalization ability of our model in challenging field conditions.

3.8. Testing Under Different Lighting Conditions

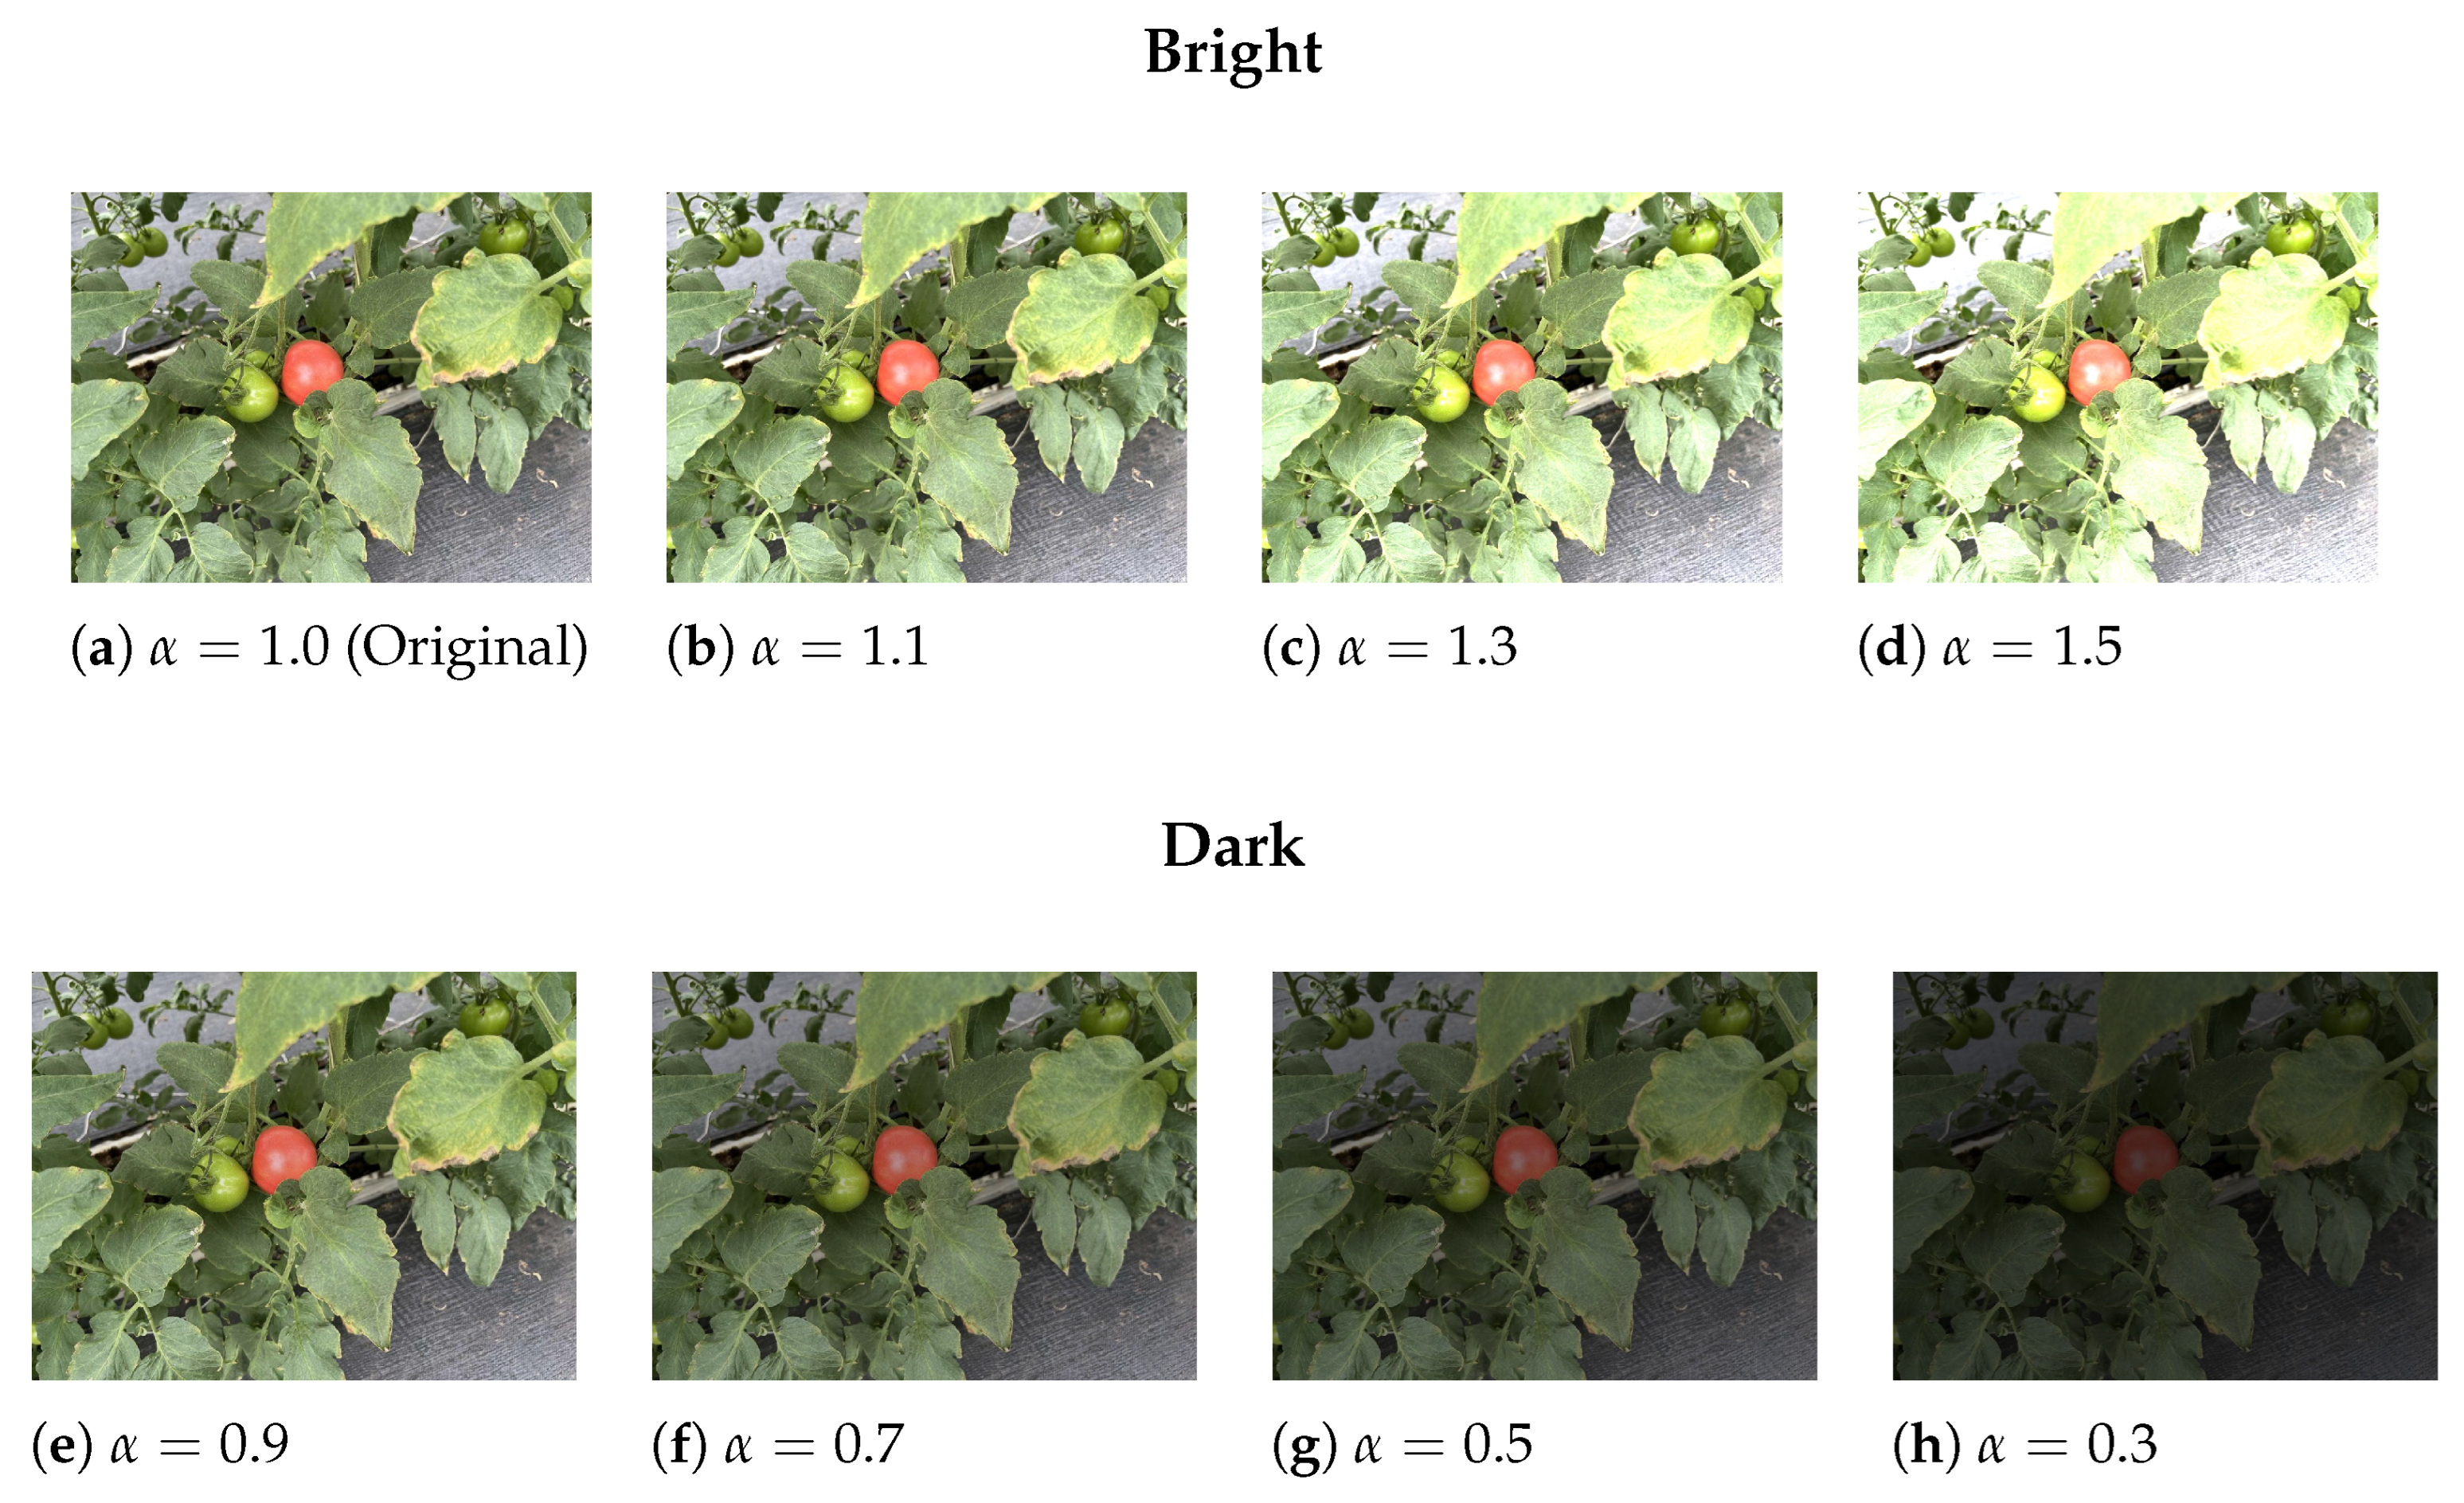
In real-world applications, variations in lighting conditions can significantly impact image-based models. Factors such as weather changes, time of day, or artificial lighting can lead to differences in brightness levels. For instance, overcast conditions or night-time settings may cause reduced illumination, while strong sunlight can result in excessive brightness. To analyze the robustness of our proposed model, we simulate various lighting conditions by adjusting the illumination factor α and evaluate the model’s performance accordingly. The brightness adjustment follows the equation below:
I new ( x , y ) = α I orig ( x , y ) ,
where I orig ( x , y ) represents the original pixel intensity at position ( x , y ) , and I new ( x , y ) denotes the adjusted pixel value after brightness modification. The illumination factor α is used to control brightness, where α > 1 increases brightness, 0 < α < 1 decreases brightness, and α = 1 preserves the original lighting conditions. The images under different brightness levels are shown in Figure 13.
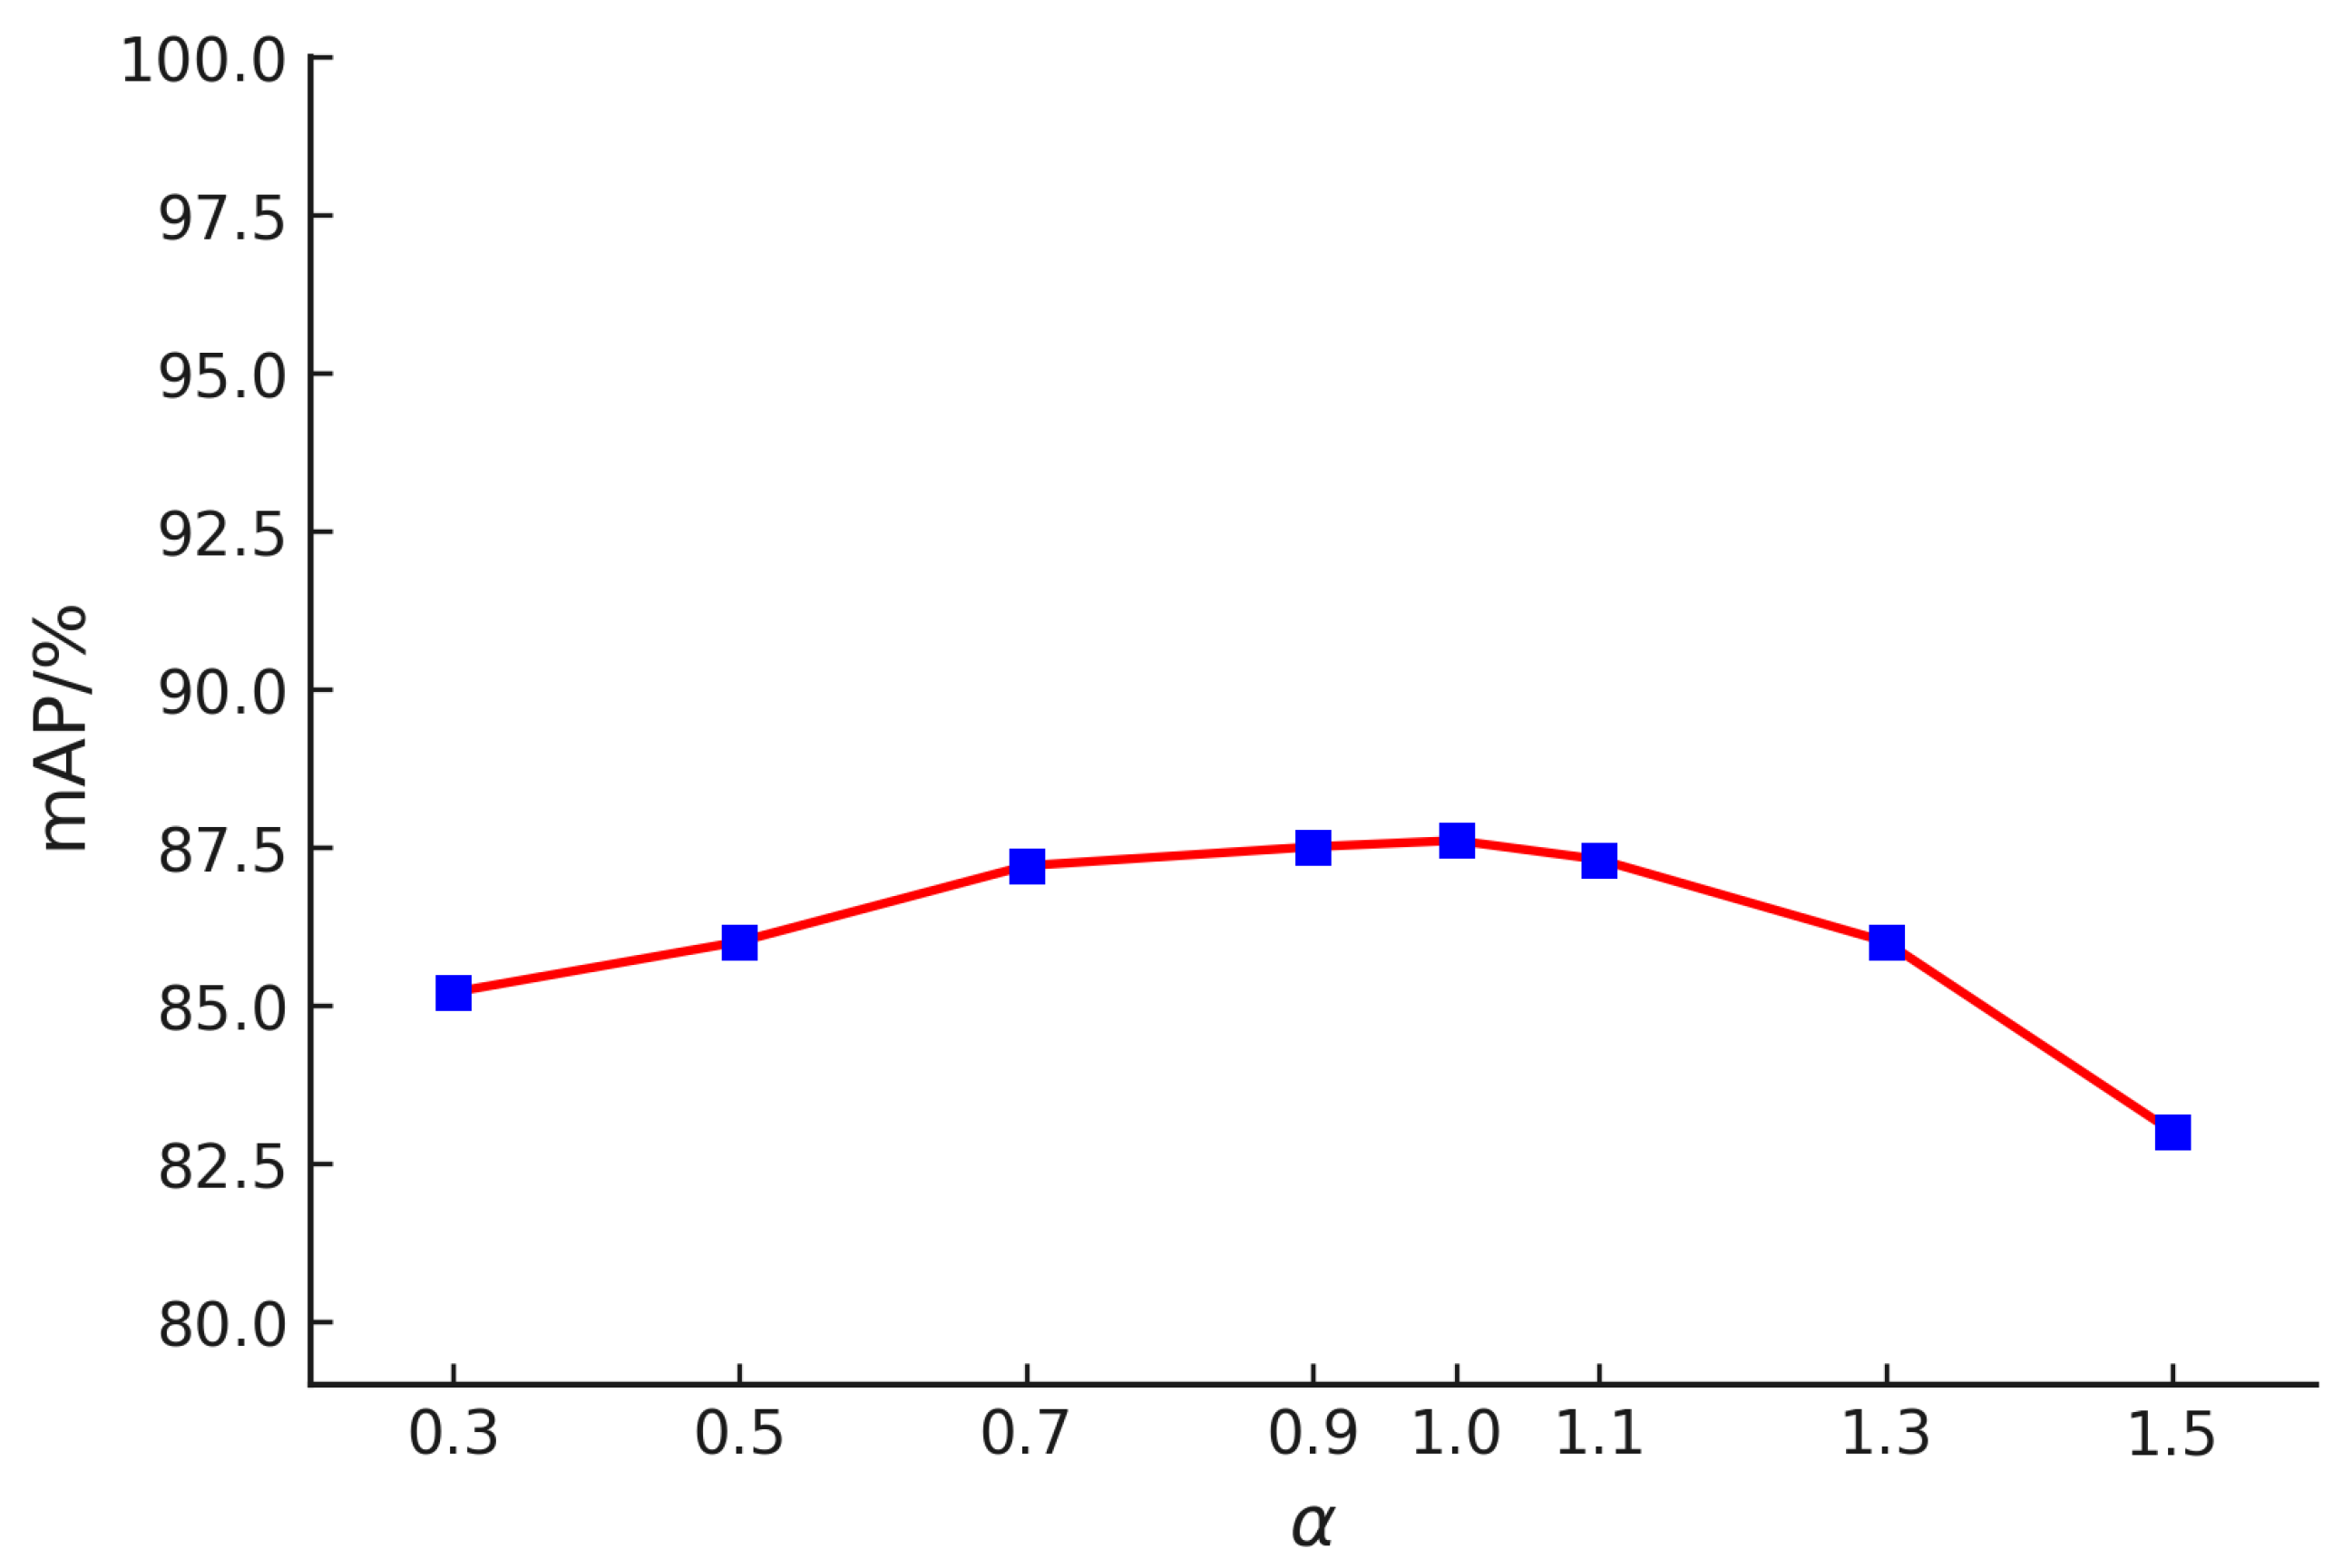
To further assess model stability, we test different values of α and summarize the results in Figure 14. Our observations indicate that when α is within the range of 0.3 to 1.1, the model maintains stable performance, with mAP values consistently above 85%. However, as α further increases, a gradual decline in mAP is observed, though it remains above 82%. This suggests that the model effectively adapts to both low-light and moderately bright conditions, demonstrating strong generalization capabilities across varying illumination settings.

3.9. Edge Deployment on Raspberry Pi

To verify the practical applicability of the proposed method in real-world agricultural environments, the URT-YOLOv11n model is deployed on Raspberry Pi 5, an edge AI computing platform. The deployment system consists of Raspberry Pi 5 (8 GB RAM) and a Hailo-8 accelerator (26 TOPS INT8), integrated with a 12-megapixel IMX477R camera (CSI interface). Field experiments conducted in a commercial tomato orchard demonstrate that the system achieves stable real-time inference at 30 FPS, with a total power consumption of approximately 15 W.
These results confirm that the proposed model delivers high precision and real-time detection performance on a low-power embedded device, validating its potential for integration into agricultural robots and other field-deployable platforms.

4. Display of Some Test Results

Some test results are shown in Figure 15. In these images, the background is very complex, and tomatoes block each other. The color of the small, immature green fruit is similar to the background color, which is difficult to distinguish. As shown in the figure, the basic model failed to effectively distinguish the size of the tomatoes, which led to recognition errors due to overlapping targets. On the contrary, our method accurately identified small, immature classes.
Through comparative analysis, we can see that our improved model significantly enhances the detection ability in complex backgrounds, especially when the color of the target is similar to the environment, causing the performance of the model is more stable and accurate. Compared with traditional methods, the improved model can extract key features more effectively, reduce the missed and false detection caused by background interference, and thus improve the overall detection accuracy. This progress is particularly important for tomato maturity detection because it not only optimizes the recognition of tomatoes at different maturity stages but also enhances the detection ability for small and densely distributed targets, as well as the robustness and reliability of the model. It can maintain stable detection performance in complex planting environments.
In the complex agricultural environment, fruit detection is not only affected by similar backgrounds but also by the change in light and the occlusion of the target, resulting in a decline in detection accuracy. Through a series of network optimizations, URT-YOLOv11 significantly improves the adaptability of the model under special conditions. As shown in Figure 16, URT-YOLOv11 can still accurately locate and identify partially occluded fruits when fruits are occluded by leaves and branches. In addition, the RFCBAMConv structure enhances the ability to extract model features and maintains high accuracy in strong light and shadow environments. The task adaptive detection terminal (TADDH) realizes more reasonable weight allocation between classification and regression tasks and improves the robustness and generalization ability of the model. Experiments show that the detection accuracy of URT-YOLOv11 in complex scenes is significantly better than that of standard YOLOv11, providing an efficient and reliable solution for fruit maturity detection in intelligent agriculture.

5. Discussion

This study introduces an advanced deep learning approach tailored for tomato ripeness detection, significantly enhancing both accuracy and processing efficiency. Conventional image processing techniques, such as those used in previous studies [45], often encounter challenges related to computational complexity and prolonged processing times. To overcome these obstacles, our model leverages deep learning to address the intricate problem of tomato ripeness detection within diverse and complex environments. A major limitation of the baseline model is its difficulty in differentiating tomatoes of varying sizes. To mitigate this issue, we incorporate several novel modules that expand multi-scale receptive fields and enhance object detection capabilities. As a result, the model effectively identifies both tomato ripeness and size with high precision.

5.1. Comparison with Traditional Methods

In contrast to conventional machine learning approaches such as SVM, which relies on handcrafted color and texture features and lacks robustness in complex agricultural environments, URT-YOLOv11 autonomously learns high-dimensional feature representations, significantly improving its adaptability to variations in lighting and occlusion. Traditional SVM-based methods require extensive manual feature engineering and perform poorly when background complexity increases. While these models may achieve high accuracy in controlled settings, they struggle with real-world agricultural conditions where factors such as occlusion, non-uniform lighting, and variable fruit sizes significantly impact detection performance.
Another key feature of our model is its real-time performance optimization, striking a balance between detection accuracy and computational efficiency. While faster R-CNN achieves high accuracy in structured environments, its inference speed (26 FPS) and computational cost (180 GFLOPs) limit its feasibility for real-time applications. URT-YOLOv11 addresses this by reducing computational complexity to 5.8 GFLOPs while maintaining high detection performance at 576 FPS, making it ideal for edge computing in agricultural automation. This ensures practical applicability in time-sensitive agricultural applications where rapid decision-making is crucial.
Compared to existing models, which often focus solely on detecting larger tomatoes or are constrained to controlled environments such as greenhouses [46], our approach significantly bridges a gap in the current literature. By training on a diverse dataset that includes tomatoes of multiple sizes and varying growth conditions, URT-YOLOv11 enhances robustness and scalability, ensuring superior detection performance across different field conditions.

5.2. Method Limitations

Despite the significant improvements of URT-YOLOv11 over conventional methods, several challenges remain in real-world agricultural applications. These limitations primarily include lighting variations, object occlusion, small object detection, and computational constraints.

5.2.1. Lighting Variations

While the proposed RFCBAMConv module enhances feature extraction under varying lighting conditions, extreme cases such as harsh sunlight and deep shadows still present challenges. In particular, unripe tomatoes often exhibit colors similar to the background in strong light conditions, leading to misclassification. Future research could explore advanced data augmentation techniques or adaptive exposure control mechanisms to further mitigate these effects.

5.2.2. Object Occlusion

The model’s performance is affected by object occlusion, especially in dense foliage environments where tomatoes are partially obscured by leaves or other fruits. Although the integration of attention mechanisms has improved feature extraction, occluded tomatoes still present a challenge for accurate detection. As shown in Table 7, while the model demonstrates notable enhancement in detecting small targets, particularly with the precision for the “small ripe” class reaching a level comparable to that of the large classes, there remains a noticeable gap in precision for the “small half-ripe” and “small unripe” classes relative to the large classes. This discrepancy may be attributed to the fact that unripe tomatoes tend to grow closely together, as illustrated in Figure 1, leading to frequent occlusions and increased detection difficulty. In contrast, mature tomatoes are typically more spaced out, which reduces occlusion and facilitates more accurate detection. Potential solutions include the incorporation of depth information from RGB-D sensors or multi-view detection strategies.

5.2.3. Small Object Detection

URT-YOLOv11 has demonstrated significant improvements in detecting tomatoes of different ripeness levels, but its recall on small tomatoes, particularly distant unripe ones, remains a limitation. The model’s receptive field has been expanded through UniRepLKNetBlock, yet small object detection is still constrained by the resolution of input images and feature extraction capabilities. Further enhancements, such as the use of super-resolution techniques or feature fusion networks, may improve performance.

5.2.4. Computational Constraints

Although URT-YOLOv11 is designed as a lightweight model with only 2.16 M parameters and 5.8 GFLOPs, its deployment on ultra-low-power agricultural devices remains a challenge. While the model is optimized for real-time performance (576 FPS on an NVIDIA RTX 4090D GPU), agricultural robotics and UAVs with limited computational resources may still struggle to run the model efficiently. Future efforts could focus on model quantization, pruning, or developing a mobile-friendly variant to ensure broader applicability.

5.3. Future Research Directions

Several key areas remain for future exploration to further enhance the model’s robustness, scalability, and efficiency. One critical direction is domain adaptation, ensuring that models trained on one dataset can generalize better to unseen agricultural environments with varying weather conditions, soil types, and growth stages. Additionally, multi-modal learning, integrating RGB images with thermal or hyperspectral data, could improve the detection of subtle ripeness variations that are not easily captured through standard RGB-based methods.
Another key challenge is scalability and real-world deployment. While URT-YOLOv11 has demonstrated high accuracy in controlled conditions, further research is needed to adapt the model for other crops, such as strawberries, apples, or peppers, using transfer learning techniques. This would enhance the model’s versatility and broaden its impact in precision agriculture. Moreover, continuous learning frameworks could be explored, allowing the model to be updated incrementally with new data over multiple growing seasons, improving long-term adaptability and preventing performance degradation.
To facilitate large-scale adoption, hardware optimization is crucial. Future research should focus on model quantization and edge AI implementations, enabling URT-YOLOv11 to run efficiently on low-power IoT sensors, embedded systems, and agricultural drones. The integration of hardware-efficient AI accelerators, such as TPUs and FPGAs, could further enhance inference speed while reducing power consumption, making real-time ripeness detection more accessible to smallholder farmers and scalable for large-scale precision agriculture systems.
Furthermore, future research should explore the ethical implications of AI-driven agricultural automation. While such systems offer enhanced efficiency and reduced resource waste, they may also impact employment in traditional farming by reducing the demand for manual labor in fruit sorting and quality assessment. Developing human–AI collaborative models that assist rather than replace farm workers could help mitigate these concerns. Additionally, as AI systems collect vast amounts of agricultural data, ensuring secure data management and privacy protection will be essential to prevent misuse or unauthorized access. Research into privacy-preserving machine learning and blockchain-based agricultural data security could address these challenges and ensure responsible AI deployment in precision agriculture.
By addressing these challenges, URT-YOLOv11 can evolve into a versatile, lightweight, and adaptive tool for smart farming applications, driving improvements in food production efficiency and sustainability. Furthermore, refining the model’s effectiveness and expanding its potential applications in agricultural automation, intelligent fruit quality assessment, and broader smart farming technologies will enhance its impact. The findings of this study not only contribute to precision agriculture but also lay the groundwork for optimizing real-time fruit monitoring systems, ultimately leading to more sustainable and efficient agricultural practices.

6. Conclusions

This research delves into the challenges of traditional fruit recognition algorithms and critically examines the shortcomings of current methods in complex agricultural settings. To overcome these issues, we introduce an enhanced YOLOv11 model that integrates multiple architectural improvements. Notably, the UniRepLKNetBlock substitutes the C3k2 block in the backbone, improving computational efficiency, expanding the receptive field for multi-scale feature extraction, and significantly reducing overall computational demands. In the neck structure, we implement the RFCBAMConv module, which replaces the C3k2 block, combining residual feature extraction with a channel-spatial attention mechanism (RFCBAM). This modification boosts the model’s ability to detect smaller objects and improves its robustness under varying lighting conditions. Additionally, the detection head is optimized with the task-adaptive detection decoding head (TADDH), which applies a task-adaptive optimization strategy, effectively balancing classification and regression, thus enhancing detection performance across different object scales.
Experimental evaluations show that the proposed enhancements result in substantial gains in both accuracy and computational efficiency. The model achieves an mAP@50 of 87.3% and a recall of 80.3%, demonstrating a 2.2% improvement in mAP@50 and a 5% increase in precision compared to the original YOLOv11 model. Furthermore, the model complexity is reduced to 2.14 million parameters, which results in significant computational savings without sacrificing detection accuracy. This lightweight architecture makes the model more suitable for deployment on embedded systems and mobile devices, allowing for real-time detection in environments with limited resources. The efficacy of each modification was confirmed through ablation studies, which highlighted the positive contributions of UniRepLKNetBlock, RFCBAMConv, and TADDH in optimizing model performance.
In conclusion, the improved YOLOv11 algorithm demonstrates exceptional performance in detecting tomato ripeness, especially in challenging environments characterized by occlusions and fluctuating lighting conditions. By refining the model architecture and enhancing detection precision, this study presents a robust solution for smart agriculture, advancing the capabilities of real-time tomato ripeness detection. These outcomes not only contribute to more precise crop management but also offer a promising approach to boosting the efficiency and quality of agricultural production, highlighting the practical potential of this technology in real-world applications.

Author Contributions

Conceptualization, D.M., Y.G. and W.W.; methodology, D.M., Y.G. and F.M.; validation, C.G., R.P. and Q.H.; formal analysis, W.W. and Q.H.; investigation, D.M. and F.M.; resources, Y.G. and R.P.; writing—original draft preparation, D.M. and Y.X.; writing—review and editing, Y.G., Y.X. and C.G.; visualization, D.M. and F.M.; supervision, W.W.; project administration, Q.H. All authors have read and agreed to the published version of the manuscript.

Funding

This work was supported by the Sichuan Province Department of Education through the Innovation and Entrepreneurship Training Program for College Students (Grant No. S202410626004X). The research by Francesco Marinello was supported by the European Union Next-GenerationEU (PIANO NAZIONALE DI RIPRESA E RESILIENZA (PNRR)—MISSIONE 4 COMPONENTE 2, INVESTIMENTO 1.4—DD 1032 17/06/2022, CN00000022).

Institutional Review Board Statement

Not applicable.

Data Availability Statement

Data will be made available upon request.

Acknowledgments

We would like to thank the College of Information Engineering of the Sichuan Agricultural University and Modern Agricultural Science and Technology Innovation Demonstration Park of the Sichuan Academy of Agricultural Sciences for providing us with the platform and Qiang Huang for his guidance on this experiment.

Conflicts of Interest

The authors declare no conflicts of interest.

References

  1. Willer, H.; Travnlicek, J.; Schlatter, S. The World of Organic Agriculture. Statistics and Emerging Trends 2024; Research Institute of Organic Agriculture FiBL: Frick, Switzerland, 2024. [Google Scholar]
  2. Costa, J.; Heuvelink, E. The global tomato industry. In Tomatoes; Heuvelink, E., Ed.; CABI: Wallingford, UK, 2018; pp. 1–26. [Google Scholar]
  3. Ghezavati, V.; Hooshyar, S.; Tavakkoli-Moghaddam, R. A Benders’ decomposition algorithm for optimizing distribution of perishable products considering postharvest biological behavior in agri-food supply chain: A case study of tomato. Cent. Eur. J. Oper. Res. 2017, 25, 29–54. [Google Scholar] [CrossRef]
  4. Li, P.; Zheng, J.; Li, P.; Long, H.; Li, M.; Gao, L. Tomato maturity detection and counting model based on MHSA-YOLOv8. Sensors 2023, 23, 6701. [Google Scholar] [CrossRef]
  5. Li, R.; Ji, Z.; Hu, S.; Huang, X.; Yang, J.; Li, W. Tomato maturity recognition model based on improved YOLOv5 in greenhouse. Agronomy 2023, 13, 603. [Google Scholar] [CrossRef]
  6. Jiang, Y.; Chen, S.; Bian, B.; Li, Y.; Wang, X. Discrimination of tomato maturity using hyperspectral imaging combined with graph-based semi-supervised method considering class probability information. Food Anal. Methods 2021, 14, 968–983. [Google Scholar] [CrossRef]
  7. Wang, Z.; Ling, Y.; Wang, X.; Meng, D.; Nie, L.; An, G.; Wang, X. An improved Faster R-CNN model for multi-object tomato maturity detection in complex scenarios. Ecol. Inform. 2022, 72, 101886. [Google Scholar] [CrossRef]
  8. Ma, C.; Zhang, X.; Li, Y.; Lin, S.; Xiao, D.; Zhang, L. Identification of immature tomatoes base on salient region detection and improved Hough transform method. Trans. Chin. Soc. Agric. Eng. 2016, 32, 219–226. [Google Scholar]
  9. Kelman, E.; Linker, R. Vision-based localisation of mature apples in tree images using convexity. Biosyst. Eng. 2014, 118, 174–185. [Google Scholar] [CrossRef]
  10. Zhang, Y.; Yin, X.; Xu, T.; Zhao, J. On-line sorting maturity of cherry tomato bymachine vision. In Proceedings of the Computer And Computing Technologies in Agriculture II, Volume 3: The Second IFIP International Conference on Computer and Computing Technologies in Agriculture (CCTA2008), Beijing, China, 18–20 October 2008; pp. 2223–2229. [Google Scholar]
  11. El-Bendary, N.; El Hariri, E.; Hassanien, A.; Badr, A. Using machine learning techniques for evaluating tomato ripeness. Expert Syst. Appl. 2015, 42, 1892–1905. [Google Scholar] [CrossRef]
  12. Kumar, S.; Esakkirajan, S.; Bama, S.; Keerthiveena, B. A microcontroller based machine vision approach for tomato grading and sorting using SVM classifier. Microprocess. Microsyst. 2020, 76, 103090. [Google Scholar] [CrossRef]
  13. Malik, M.; Zhang, T.; Li, H.; Zhang, M.; Shabbir, S.; Saeed, A. Mature tomato fruit detection algorithm based on improved HSV and watershed algorithm. IFAC-PapersOnLine 2018, 51, 431–436. [Google Scholar] [CrossRef]
  14. Lu, H.; Wang, F.; Liu, X.; Wu, Y. Rapid assessment of tomato ripeness using visible/near-infrared spectroscopy and machine vision. Food Anal. Methods 2017, 10, 1721–1726. [Google Scholar] [CrossRef]
  15. Terven, J.; Córdova-Esparza, D.; Romero-González, J. A comprehensive review of yolo architectures in computer vision: From yolov1 to yolov8 and yolo-nas. Mach. Learn. Knowl. Extr. 2023, 5, 1680–1716. [Google Scholar] [CrossRef]
  16. Rong, J.; Zhou, H.; Zhang, F.; Yuan, T.; Wang, P. Tomato cluster detection and counting using improved YOLOv5 based on RGB-D fusion. Comput. Electron. Agric. 2023, 207, 107741. [Google Scholar] [CrossRef]
  17. Redmon, J.; Divvala, S.; Girshick, R.; Farhadi, A. You only look once: Unified, real-time object detection. In Proceedings of the IEEE Conference On Computer Vision And Pattern Recognition, Las Vegas, NV, USA, 27–30 June 2016; pp. 779–788. [Google Scholar]
  18. Liu, W.; Anguelov, D.; Erhan, D.; Szegedy, C.; Reed, S.; Fu, C.; Berg, A. Ssd: Single shot multibox detector. In Proceedings of the Computer Vision–ECCV 2016: 14th European Conference, Amsterdam, The Netherlands, 11–14 October 2016; Proceedings, Part I 14. pp. 21–37. [Google Scholar]
  19. Ren, S.; He, K.; Girshick, R.; Sun, J. Faster R-CNN: Towards real-time object detection with region proposal networks. IEEE Trans. Pattern Anal. Mach. Intell. 2016, 39, 1137–1149. [Google Scholar] [CrossRef] [PubMed]
  20. Liu, Z.; Lin, Y.; Cao, Y.; Hu, H.; Wei, Y.; Zhang, Z.; Lin, S.; Guo, B. Swin transformer: Hierarchical vision transformer using shifted windows. In Proceedings of the IEEE/CVF International Conference On Computer Vision, Montreal, QC, Canada, 10–17 October 2021; pp. 10012–10022. [Google Scholar]
  21. Guo, J.; Yang, Y.; Lin, X.; Memon, M.; Liu, W.; Zhang, M.; Sun, E. Revolutionizing Agriculture: Real-Time Ripe Tomato Detection With the Enhanced Tomato-YOLOv7 System. IEEE Access 2023, 11, 133086–133098. [Google Scholar]
  22. Zhou, J.; Zhang, Y.; Wang, J. RDE-YOLOv7: An improved model based on YOLOv7 for better performance in detecting dragon fruits. Agronomy 2023, 13, 1042. [Google Scholar] [CrossRef]
  23. Li, H.; Gu, Z.; He, D.; Wang, X.; Huang, J.; Mo, Y.; Li, P.; Huang, Z.; Wu, F. A lightweight improved YOLOv5s model and its deployment for detecting pitaya fruits in daytime and nighttime light-supplement environments. Comput. Electron. Agric. 2024, 220, 108914. [Google Scholar] [CrossRef]
  24. Sun, X. Enhanced tomato detection in greenhouse environments: A lightweight model based on S-YOLO with high accuracy. Front. Plant Sci. 2024, 15, 1451018. [Google Scholar] [CrossRef]
  25. Umar, M.; Altaf, S.; Ahmad, S.; Mahmoud, H.; Mohamed, A.; Ayub, R. Precision agriculture through deep learning: Tomato plant multiple diseases recognition with cnn and improved yolov7. IEEE Access 2024, 12, 49167–49183. [Google Scholar] [CrossRef]
  26. Zheng, S.; Jia, X.; He, M.; Zheng, Z.; Lin, T.; Weng, W. Tomato Recognition Method Based on the YOLOv8-Tomato Model in Complex Greenhouse Environments. Agronomy 2024, 14, 1764. [Google Scholar] [CrossRef]
  27. Leng, L.; Wang, L.; Lv, J.; Xie, P.; Zeng, C.; Wu, W.; Fan, C. Study on Real-Time Detection of Lightweight Tomato Plant Height Under Improved YOLOv5 and Visual Features. Processes 2024, 12, 2622. [Google Scholar] [CrossRef]
  28. Khanam, R.; Hussain, M. Yolov11: An overview of the key architectural enhancements. arXiv 2024, arXiv:2410.17725. [Google Scholar]
  29. Lin, T.; Dollár, P.; Girshick, R.; He, K.; Hariharan, B.; Belongie, S. Feature pyramid networks for object detection. In Proceedings of the IEEE Conference On Computer Vision And Pattern Recognition, Honolulu, HI, USA, 21–26 July 2017; pp. 2117–2125. [Google Scholar]
  30. Liu, S.; Qi, L.; Qin, H.; Shi, J.; Jia, J. Path aggregation network for instance segmentation. In Proceedings of the IEEE Conference On Computer Vision And Pattern Recognition, Salt Lake City, UT, USA, 18–23 June 2018; pp. 8759–8768. [Google Scholar]
  31. Ding, X.; Zhang, Y.; Ge, Y.; Zhao, S.; Song, L.; Yue, X.; Shan, Y. UniRepLKNet: A Universal Perception Large-Kernel ConvNet for Audio Video Point Cloud Time-Series and Image Recognition. In Proceedings of the IEEE/CVF Conference On Computer Vision And Pattern Recognition, Seattle, WA, USA, 16–22 June 2024; pp. 5513–5524. [Google Scholar]
  32. Zhang, X.; Zhou, X.; Lin, M.; Sun, J. Shufflenet: An extremely efficient convolutional neural network for mobile devices. In Proceedings of the IEEE Conference on Computer Vision And Pattern Recognition, Salt Lake City, UT, USA, 18–23 June 2018; pp. 6848–6856. [Google Scholar]
  33. Ding, X.; Chen, H.; Zhang, X.; Han, J.; Ding, G. Repmlpnet: Hierarchical vision mlp with re-parameterized locality. In Proceedings of the IEEE/CVF Conference on Computer Vision And Pattern Recognition, New Orleans, LA, USA, 18–24 June 2022; pp. 578–587. [Google Scholar]
  34. He, K.; Zhang, X.; Ren, S.; Sun, J. Deep residual learning for image recognition. In Proceedings of the IEEE Conference On Computer Vision And Pattern Recognition, Las Vegas, NV, USA, 27–30 June 2016; pp. 770–778. [Google Scholar]
  35. Howard, A. Mobilenets: Efficient convolutional neural networks for mobile vision applications. arXiv 2017, arXiv:1704.04861. [Google Scholar]
  36. Huang, G.; Liu, Z.; Van Der Maaten, L.; Weinberger, K. Densely connected convolutional networks. In Proceedings of the IEEE Conference on Computer Vision And Pattern Recognition, Honolulu, HI, USA, 21–26 July 2017; pp. 4700–4708. [Google Scholar]
  37. Radosavovic, I.; Kosaraju, R.; Girshick, R.; He, K.; Dollár, P. Designing network design spaces. In Proceedings of the IEEE/CVF Conference On Computer Vision And Pattern Recognition, Seattle, WA, USA, 13–19 June 2020; pp. 10428–10436. [Google Scholar]
  38. Simonyan, K. Very deep convolutional networks for large-scale image recognition. arXiv 2014, arXiv:1409.1556. [Google Scholar]
  39. Hu, J.; Shen, L.; Sun, G. Squeeze-and-excitation networks. In Proceedings of the IEEE Conference on Computer Vision and Pattern Recognition, Salt Lake City, UT, USA, 18–23 June 2018; pp. 7132–7141. [Google Scholar]
  40. Wang, X.; Girshick, R.; Gupta, A.; He, K. Non-local neural networks. In Proceedings of the IEEE Conference on Computer Vision and Pattern Recognition, Salt Lake City, UT, USA, 18–23 June 2018; pp. 7794–7803. [Google Scholar]
  41. Zhang, X.; Liu, C.; Yang, D.; Song, T.; Ye, Y.; Li, K.; Song, Y. RFAConv: Innovating spatial attention and standard convolutional operation. arXiv 2023, arXiv:2304.03198. [Google Scholar]
  42. Woo, S.; Park, J.; Lee, J.; Kweon, I. Cbam: Convolutional block attention module. In Proceedings of the European Conference on Computer Vision (ECCV), Munich, Germany, 8–14 September 2018; pp. 3–19. [Google Scholar]
  43. Feng, C.; Zhong, Y.; Gao, Y.; Scott, M.; Huang, W. Tood: Task-aligned one-stage object detection. In Proceedings of the 2021 IEEE/CVF International Conference On Computer Vision (ICCV), Montreal, QC, Canada, 10–17 October 2021; pp. 3490–3499. [Google Scholar]
  44. Zhu, X.; Hu, H.; Lin, S.; Dai, J. Deformable convnets v2: More deformable, better results. In Proceedings of the IEEE. CVF Conference On Computer Vision And Pattern Recognition (CVPR), Long Beach, CA, USA, 15–20 June 2019; pp. 9300–9308. [Google Scholar]
  45. Li, H.; Zhang, M.; Gao, Y.; Li, M.; Ji, Y. Green ripe tomato detection method based on machine vision in greenhouse. Trans. Chin. Soc. Agric. Eng. 2017, 33, 328–334. [Google Scholar]
  46. Afonso, M.; Fonteijn, H.; Fiorentin, F.; Lensink, D.; Mooij, M.; Faber, N.; Polder, G.; Wehrens, R. Tomato fruit detection and counting in greenhouses using deep learning. Front. Plant Sci. 2020, 11, 571299. [Google Scholar] [CrossRef]
Figure 1. Different stages of tomato ripening.
Agriculture 15 01060 g001
Figure 2. Examples of original and augmented images.
Agriculture 15 01060 g002
Figure 3. YOLOv11 base model.
Agriculture 15 01060 g003
Figure 4. Improved YOLOv11 model.
Agriculture 15 01060 g004
Figure 5. UniRepLKNetBlock.
Agriculture 15 01060 g005
Figure 6. RFCBAMConv.
Agriculture 15 01060 g006
Figure 7. Detect_TADDH.
Agriculture 15 01060 g007
Figure 8. Training and validation curves for the proposed model.
Agriculture 15 01060 g008
Figure 9. Normalized confusion matrix.
Agriculture 15 01060 g009
Figure 10. Visualization of the ablation study for different model modules.
Agriculture 15 01060 g010
Figure 11. Comparison of mAP@0.5, mAP@0.5:0.95, precision, and recall.
Agriculture 15 01060 g011
Figure 12. Examples of original and augmented images.
Agriculture 15 01060 g012
Figure 13. Visualization of image brightness variations.
Agriculture 15 01060 g013
Figure 14. Model performance under different illumination factors.
Agriculture 15 01060 g014
Figure 15. Comparison of our object detection results.
Agriculture 15 01060 g015
Figure 16. URT-YOLOv11 detection performance under special conditions.
Agriculture 15 01060 g016
Table 1. Class distribution across datasets.
TypeTraining SetValidation SetTest SetTotalPercentage (%)
large ripe2476681330348714.9
large half ripe3105854469442818.9
large unripe48471303998714830.5
small ripe157352620423039.8
small half ripe8752438812065.1
small unripe51121560766743831.7
Note: The “Percentage” column indicates the proportion of each class in the entire dataset.
Table 2. Experimental environment configuration.
ItemConfiguration
Operating SystemUbuntu 20.04.3 LTS
FrameworkPyTorch 1.10.0+cu113
GPUNVIDIA RTX 4090
CPU16 vCPU Intel(R) Xeon(R) Platinum 8474C
RAM80 GB
Storage30 GB (System Disk), 50 GB (Data Disk)
Python VersionPython 3.8.10
Table 3. Training parameters for the model.
ParameterValue
OptimizerSGD
Input Image Size640 × 640
Random Scaling Range50% to 150%
Training Epochs200
Batch Size16
Initial Learning Rate0.01
Warm-up Epochs3
Momentum Factor0.9
Learning Rate SchedulerCosineAnnealingLR
Table 4. Performance metrics from five-fold cross-validation.
FoldmAPPrecisionRecallmAP50-95
Fold 10.8650.8290.8000.721
Fold 20.8690.8480.7940.724
Fold 30.8720.8250.8060.721
Fold 40.8690.8430.7910.723
Fold 50.8700.8560.7890.725
Avg0.8690.8400.7940.723
Fluct0.0070.0310.0150.004
Table 5. Results of the ablation experiment. A checkmark indicates that the module is used.
Model+UniRepLKNetBlock+RFCBAM+TAADHBox(P)RmAP50mAP50-95Parameters (M)
Base 0.7970.7920.8510.7082.58M
A 0.7920.8030.8540.7122.56 M
B 0.8140.7930.8610.7132.48 M
C 0.8240.7790.8590.7162.20 M
A + B 0.8440.7970.8690.7212.44 M,
B + C 0.8330.7860.8670.7212.23 M
A + C 0.8510.7720.8660.722.14 M
A + B + C0.8540.8030.8730.7232.16 M
Bold font indicates the best-performing model results.
Table 6. Comparison of different model algorithms.
MethodsPrecisionRecallF1mAP50ParamsFPSGFLOPsVRAM (GB)
SSD80.8%73.5%76.98%0.85824.41 M60378.2
DETR83%77.4%80.1%0.66141.28 M89867
Faster R-CNN83.8%77.8%80.69%0.65832.81 M261808.6
YOLOv5s82.5%78.3%80.35%0.8589.11 M27023.85.2
YOLOv8n83.0%77.4%80.10%0.8513.01 M4188.14
YOLOv8s83.7%77.4%80.43%0.86111.13 M28623.86
YOLOv9t83.1%78.0%80.47%0.8631.97 M3337.65.2
YOLOv10n82.1%77.6%79.79%0.8532.70 M5266.44
YOLOv10s82.3%74.8%78.37%0.8498.04 M4766.54.5
YOLOv1180.4%80.3%80.35%0.8512.58 M4796.34.2
URT-YOLOv1184.0%80.3%82.2%0.873 (+2.2%)2.16 M5765.83.9
Bold font indicates the best-performing model results.
Table 7. Comparison of the YOLOv11 model and ours.
MethodsClassPrecisionRecallF1-ScoremAP50Model Size
Our Modelall84.0%0.8030.8210.873
large ripe89.4%0.9320.9130.951
large half ripe86.3%0.9160.8890.930
large unripe81.8%0.8840.8500.9172.16 M
small ripe89.8%0.6840.7770.839
small half ripe77.0%0.6870.7260.778
small unripe79.6%0.7150.7530.821
YOLOv11all80.4%0.8030.8040.851
large ripe84.6%0.9210.8820.935
large half ripe83.9%0.9040.8700.932
large unripe84.6%0.9050.8750.9332.58 M
small ripe84.2%0.6910.7590.791
small half ripe71.5%0.7120.7130.754
small unripe73.4%0.6830.7080.764
‘all’ represents the average performance across all categories.
Table 8. Comparison of baseline and obstructed conditions.
MethodsClassPrecisionRecallF1-ScoremAP50
Baselineall84.0%0.8030.8210.873
large ripe89.4%0.9320.9130.951
large half ripe86.3%0.9160.8890.930
large unripe81.8%0.8840.8500.917
small ripe89.8%0.6840.7770.839
small half ripe77.0%0.6870.7260.778
small unripe79.6%0.7150.7530.821
Obstructedall78.3%0.7800.7900.835
large ripe82.5%0.9000.8600.920
large half ripe81.2%0.8900.8500.910
large unripe81.5%0.8800.8600.910
small ripe81.0%0.6700.7300.765
small half ripe68.5%0.6800.6900.730
small unripe70.2%0.6500.6800.740
‘all’ represents the average performance across all categories.
Disclaimer/Publisher’s Note: The statements, opinions and data contained in all publications are solely those of the individual author(s) and contributor(s) and not of MDPI and/or the editor(s). MDPI and/or the editor(s) disclaim responsibility for any injury to people or property resulting from any ideas, methods, instructions or products referred to in the content.

