Article

Research on Grain Temperature Detection Based on Rational Sound-Source Signal

by
Hongyi Ge
1,2,3,
Bo Feng
1,2,3,
Yuying Jiang
1,2,4,*,
Yuan Zhang
1,2,3,
Chengxin Cai
1,2,3,
Chunyan Guo
1,2,3,
Heng Wang
1,2,3,
Ziyu Liu
1,2,4 and
Xinxin Liu
5
1
Key Laboratory of Grain Information Processing & Control, Ministry of Education, Henan University of Technology, Zhengzhou 450001, China
2
Henan Provincial Key Laboratory of Grain Photoelectric Detection and Control, Zhengzhou 450001, China
3
College of Information Science and Engineering, Henan University of Technology, Zhengzhou 450001, China
4
School of Artificial Intelligence and Big Data, Henan University of Technology, Zhengzhou 450001, China
5
National Grain and Oil Information Center, Beijing 100834, China
*
Author to whom correspondence should be addressed.
Agriculture 2025, 15(10), 1035; https://doi.org/10.3390/agriculture15101035
Submission received: 25 March 2025 / Revised: 23 April 2025 / Accepted: 9 May 2025 / Published: 11 May 2025

Abstract

:
The selection of sound-source signals is a pivotal aspect of temperature measurement in stored grain using the acoustic method, as their characteristics directly influence the propagation effects of sound waves in grain media and the accuracy of temperature measurement. To identify a sound-source signal with optimal propagation performance, this study focused on analyzing the signal attenuation levels of typical sound sources, including simulated pulse signals and linear swept signals, during propagation. The results demonstrated that the linear swept signal exhibited superior propagation characteristics in grain media, with significantly lower signal attenuation compared to other sound-source signals. Specifically, a linear swept signal with a duration of 0.5 s and a frequency range of 200 Hz to 1000 Hz showed the best propagation performance. Finally, based on this rational signal, the temperature of grain samples was measured, yielding a mean absolute error of 1.62 °C.

1. Introduction

Grain storage safety is of great significance for ensuring China’s food security, reducing waste, and ensuring the supply of grain. Studies have shown that, by monitoring the changes in grain temperature during the storage process for grains, potential problems such as mold growth, insect infestation, or abnormal moisture content can be detected in time. Therefore, temperature monitoring of stored grains is a common and traditional method to detect the deterioration of grains [1,2]. Currently, thermocouple matrices, thermistor matrices, or fiber-optic temperature measuring cables are commonly used for grain temperature detection [3,4,5], as shown in Table 1. Although the existing temperature detection technology has largely solved the problem of monitoring the temperature of stored grain, it is limited by the complex environment of stored grain, and the long-time-lag phenomenon of heat transfer in grains makes it difficult to further improve the data acquisition timeliness of this technology. Therefore, there is an urgent need to develop novel technology for the real-time and comprehensive monitoring of the internal temperature of stored grains.
In recent years, technological development has promoted the adoption of acoustic wave temperature measurement technology in many fields as a new non-contact temperature measurement method. This technology mainly measures temperatures by using the propagation characteristics of sound waves at different temperatures, providing advantages such as non-contact, a wide measurement range, a large measurement space, and real-time monitoring [6]. In particular, in areas such as air temperature measurement [7,8,9], boiler furnace temperature measurement [10,11,12,13], water temperature measurement [14,15,16], and biomass fuels [17,18], acoustic wave temperature measurement technology has gradually replaced some of the traditional temperature measurement methods, demonstrating its unique advantages and potential. Saito et al. [19] successfully obtained indoor vertical temperature distribution by experimentally measuring the propagation time of reflected sound waves between five different reflective surfaces. In these measurements, the average system error remained 2.43 °C, indicating that changes in temperature distribution over time can be monitored accurately. Guo et al. [20] built an experimental system to measure the temperature of biomass fuels using acoustics, conducting in-depth research on the propagation speed of sound waves in biomass at different temperatures. The results showed good inversion accuracy between sound velocity and biomass fuel temperature in the range of 22–48.9 °C. The aforementioned research results demonstrate the feasibility of using acoustic methods for temperature detection; however, further research is needed for the temperature detection of grains, which are quasi-porous media.
The propagation of sound waves in stored grains primarily depends on the pores between grain particles, which are filled with gases through which the sound waves travel [21,22]. However, the effects of viscous damping and heat conduction losses within the grains cause the speed of sound waves in these pores to be different from that in free space. Additionally, sound waves do not travel in a straight line between grain particles [23]. Therefore, given the limited research on selecting sound-source signals in acoustic temperature measurement in stored grain, this study analyzed two typical sound-source signals: simulated pulse signals and linear sweep signals. The amplitude of the acoustic attenuation coefficient and its sensitivity to temperature were used as evaluation metrics. Additionally, based on the main peak size of the correlation curve and the difference between the main peak and the largest interference peak, the frequency bandwidth and period of the linear sweep signal were analyzed. The rational acoustic source signal type and frequency most suitable for acoustic temperature measurement in stored grain were selected. Using this signal, temperature measurements were conducted with grain samples. This study aimed to provide parameter support for the application of acoustic temperature measurement technology in stored grain. Furthermore, it proposes a new method for detecting grain temperature to ensure the quality and safety of stored grain.

2. Materials and Methods

2.1. Modeling of Acoustic Temperature Measurement in Grain Storage

The speed of sound in a gaseous medium is related to the temperature of the gas. The sound speed can be considered a single-valued function of the temperature of the gas. The expression for the sound velocity in an ideal gas is as follows [24]:
C = γ P ρ
where the following applies: C is the speed of sound in air, measured in m/s; γ is the ratio of the specific heat capacity at a constant gas pressure to the specific heat capacity at a constant gas volume; P is the atmospheric pressure, measured in Pa; and ρ is the density of air, measured in kg/m3.
Based on the mechanical properties of stored grain and its porous medium characteristics, the grain bulk can be considered a quasi-porous medium. The propagation of acoustic waves through this medium occurs primarily through gas-filled intergranular pores. For a quantitative analysis, the ideal gas within these pores can be considered to constitute a fixed-mass system. Given the rapid propagation velocity of sound waves, there is a negligible heat exchange of gas molecules with the surrounding environment during acoustic transmission, thereby establishing an adiabatic process. This fundamental assumption enables the following derivation:
P V = γ P
where V is the volume of gas, measured in m3. If the ideal gas system is in thermodynamic equilibrium, the following relationship holds [25]:
P V = M m R T + 273.15 = n R T + 273.15
where the following applies: M represents the gas mass, measured in kg; m denotes the molar mass, measured in kg/mol; R is the ideal gas universal constant, which has a value of 8.31446 J/(mol·k); T is temperature, measured in °C; and n indicates molar quantity, measured in mol. By combining (2) with (3) and substituting the result into (1), the following result is obtained:
C = γ P ρ = γ m ρ × M V × R T + 273.15 = γ R m × T + 273.15 = σ T + 273.15  
where σ denotes the sound constant of the gas medium, and σ = γ R m , which has a value of 20.045 J/(kg·k) in air medium.
Therefore, if a pair of acoustic transducers are installed at both extremities of the measurement zone, and the measured acoustic wave propagation time between them is denoted as ts, the path-averaged temperature TL can be determined as follows:
T L = C s σ 2 273.15 = L t s σ 2 273.15  
where L is the distance between the two microphones measured in m; Cs represents the propagation speed of sound waves in an ideal loose grain in m/s.
The preceding analysis represents the acoustic propagation path through loose grain bulk as an ideal linear transmission model. However, in practical conditions, sound waves propagate through tortuous air-filled pores between grain particles, causing measurable deviations between experimentally obtained sound velocities and idealized theoretical values. To address these discrepancies, a path-correction factor, λ, is proposed. The following equation is obtained after the corresponding adjustments to (5) are included:
T L = λ L t s   · σ 2 273.15

2.2. Calibration of Path-Correction Factor

The propagation of sound waves through the stored grain occurs primarily via the air within pores between grains. These pores can be approximately regarded as long, narrow, and rigid cylindrical tubes [26]. The propagation speed of sound waves in rigid, cylindrical, narrow tubes, denoted as Cp, can be expressed as follows:
C p = C 1 F d π f C 1 + F d π f  
where the following applies: Cp is measured in m/s; d is the equivalent diameter of the rigid cylindrical tubes, measured in m; F is a combined thermodynamic parameter that depends on the thermodynamic properties of the gas within the stored grain pores; and f is the sound-wave frequency, measured in Hz.
Next, a tortuosity parameter, φ, is introduced to quantify the refraction phenomenon caused by the interaction between the solid and gas interface among the grain particles. This allows the experimentally measured sound speed, Cs, in the grain sample to be expressed as follows:
  C s = L t s = C p φ = C φ 1 + F d π f = σ T + 273.15 φ 1 + F d π f
where
F = v + γ 1 γ k
In (9), ν and κ are the kinematic viscosity and thermal diffusivity of the gas, respectively.
Based on (8), the theoretical value of λ for sound-wave propagation through loose grain can be expressed as follows:
λ = φ 1 + F d π f  
Thus, the propagation speed of sound waves in the grain material can be expressed as follows:
  C s = C λ = σ T + 273.15 λ  
Equation (10) shows that it is theoretically feasible to directly calculate λ. However, in practice, it is complicated to measure it due to the complexity of the pore structure of grains and the non-linear propagation path of sound waves within the pores. Consequently, the average pore diameter, d, of the grains and φ cannot be directly measured. However, as (11) shows, when the distance between Transducers 1 and 2 is L, and the distance and temperature conditions are identical, the sound-wave propagation time in free space is t, while that through the grain particles is ts. Thus, λ can be indirectly calibrated using the ratio of the sound-wave propagation times as follows:
λ = C C s = L t L t s = t s t

2.3. Cross-Correlation Calculations

The acoustic delay time calculates the flight time of the signal between two microphones and is commonly used in acoustic temperature measurement-delay estimation methods. The cross-correlation method uses the cross-correlation function to operate on the homologous signal with a time delay, and the abscissa corresponding to the maximum value of the cross-correlation point is the sound-wave flight time. If the signals x1(n) and x2(n) are discrete representations of the signals at microphones 1 and 2, respectively, they can be expressed as follows:
x 1 n = s n + n 1 n  
x 2 n = s n D + n 2 n
where s(n) represents the acoustic wave signals collected via the two microphones, and n1(n) denotes the noise signals simultaneously captured via the microphones during the signal acquisition process. D represents the time delay of the same acoustic wave signal s(n) between the two microphones. The cross-correlation function, R1,2(τ), of the acoustic wave signals received via the two microphones can be expressed as follows:
R 1,2 τ = E x 1 n x 2 n τ   = E s n s n D τ + E s n n 2 n τ + E s n D τ n 1 n + E n 1 n n 2 n τ = [ R s s ( τ D ) + R n 1 s ( τ D ) + R n 2 s ( τ ) + R n 1 n 2 ( τ ) ]
where Rss represents the autocorrelation function of the acoustic wave signal, while Rn1s and Rn2s denote the cross-correlation functions between the acoustic wave signal and the noise signals, respectively. Additionally, Rn1n2 is the cross-correlation function between the noise signals captured via the near-end microphone 1 and the far-end microphone 2.
If the signal s(n) and the noises n1(n) and n2(n) satisfy the uncorrelated assumption, then the following equation is obtained:
R n 1 s τ D = 0 , R n 2 s τ = 0 , R n 1 n 2 τ = 0
Moreover, the following equation can be derived:
R 1,2 τ = R s s ( τ D )
According to the nature of autocorrelation, the following can be obtained:
R s s ( τ D ) R s s ( 0 )
R s s ( τ D ) achieves a maximum at τ − D = 0. Then, the flight time of the sound wave, τ, is obtained.

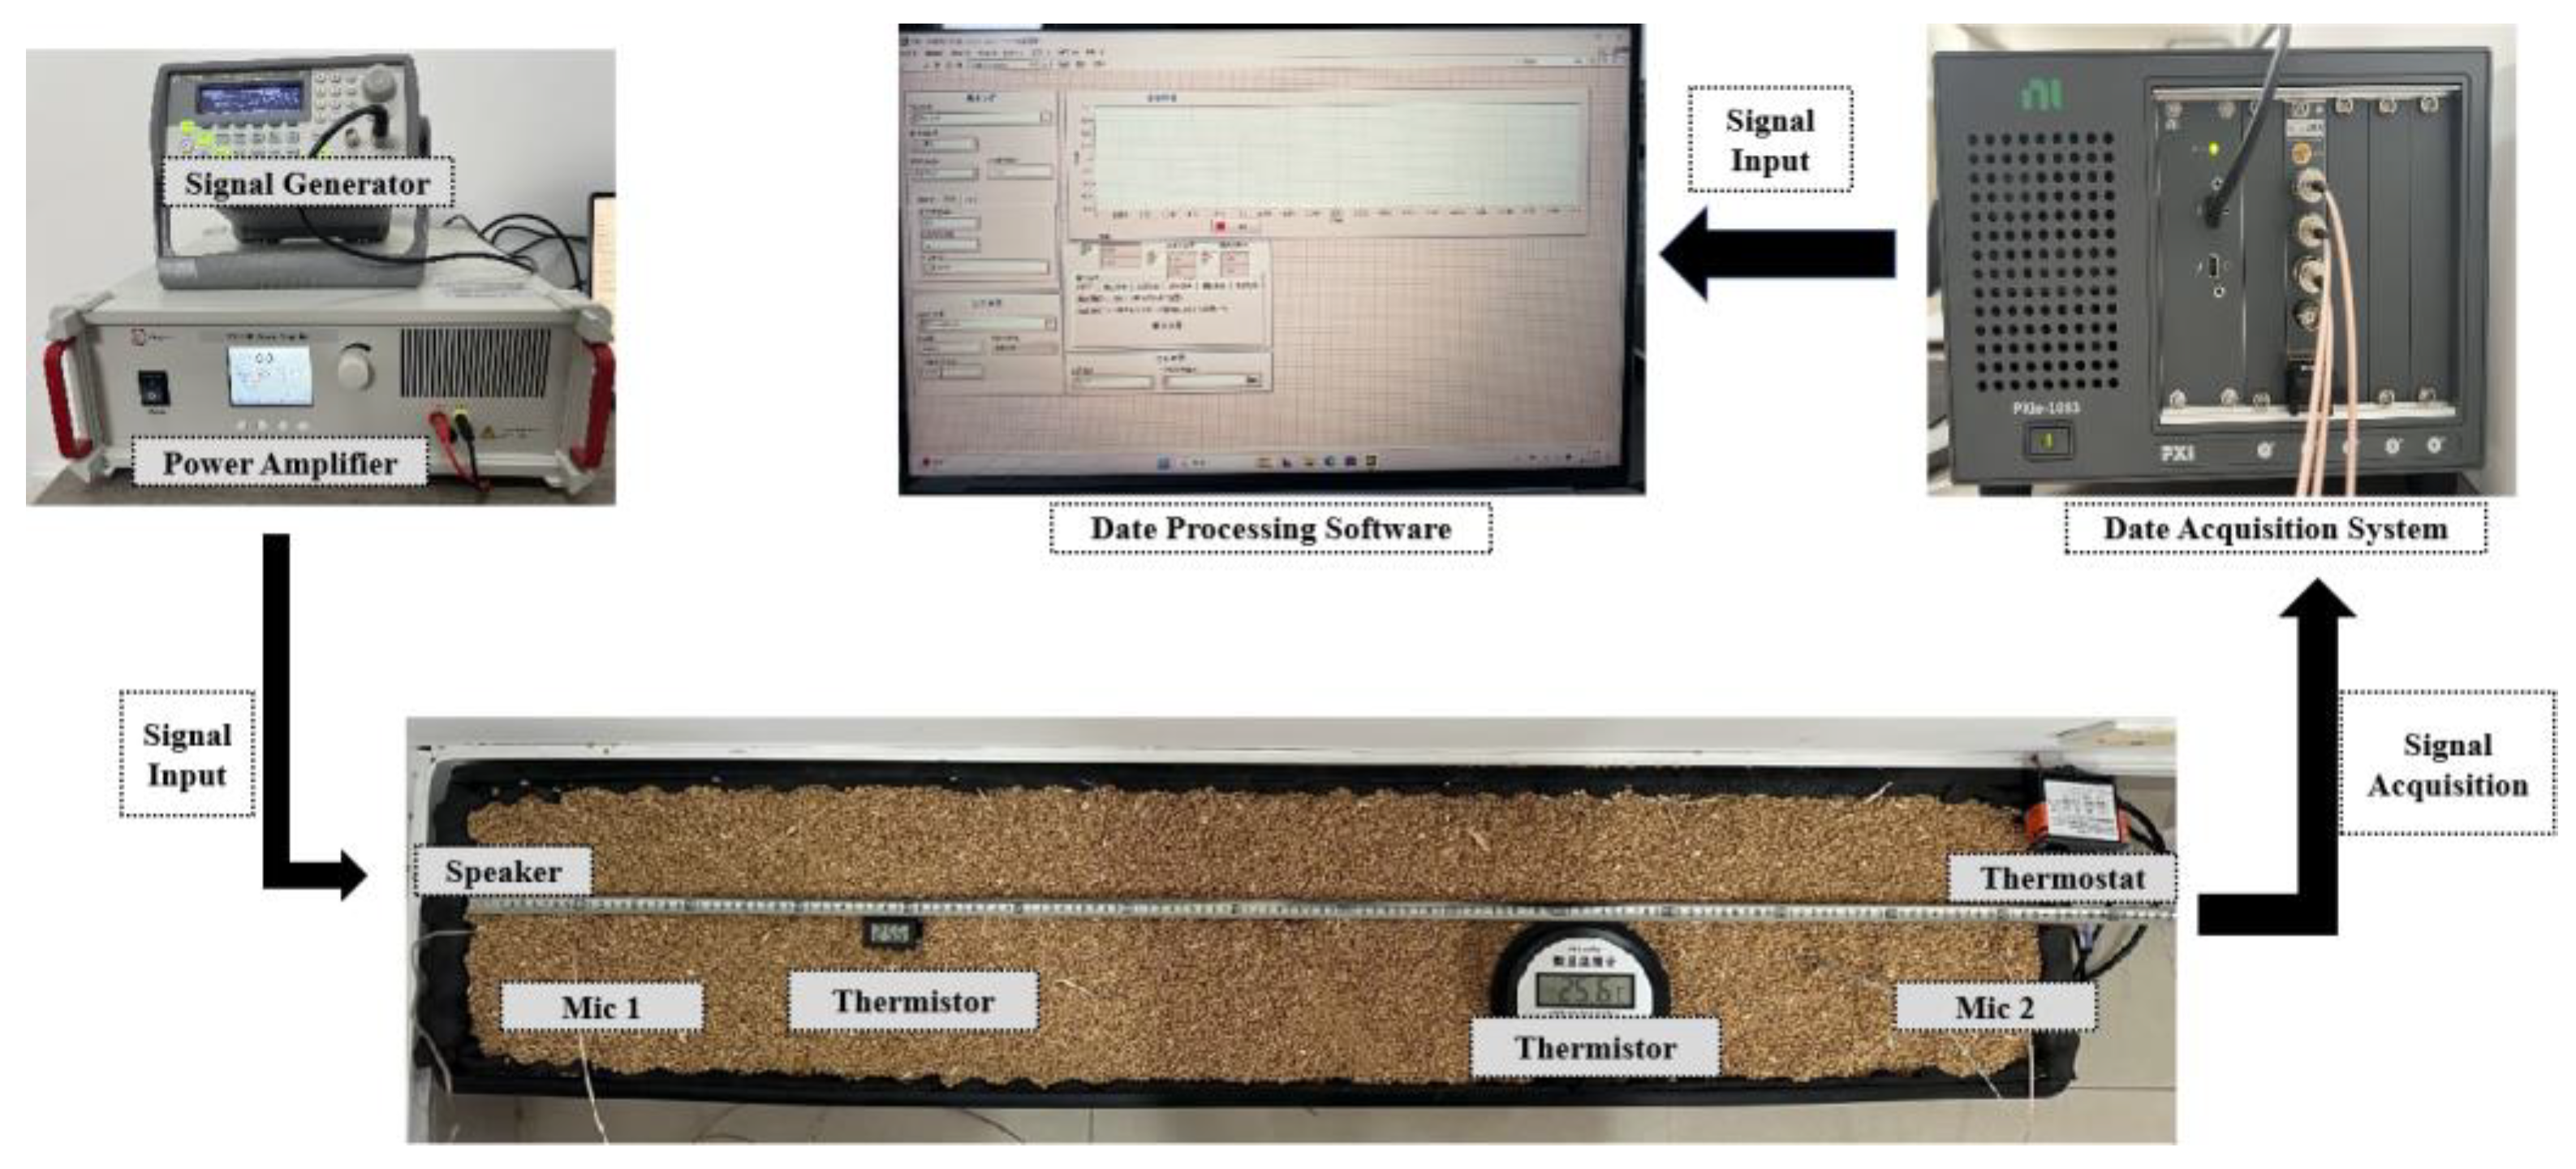
3. Experimental Setup and Signal Selection

3.1. Experimental Setup

In order to realize the selection of rational sound-source signals in acoustic grain storage temperature, the experimental system was designed in this study and experiments were conducted using wheat. Wheat is one of the most important cereal crops in the world. It not only occupies the largest cultivated area and production volume globally but also serves as the primary food source for approximately 35–40% of the global population [27]. Meanwhile, in order to determine the grade of the experimental wheat, a certain number of samples were randomly selected from the experimental wheat, and the result of the weight capacity was 781 g/L using a weight-capacity apparatus. The samples were examined several times using spectroscopic technology, and the content of imperfect grains was 6%; the samples were screened and separated through sieves with different apertures, and then the content of impurities was 0.92% when the weighing method of a balance was used. The wheat was sampled at several points using a grain moisture tester, and the results indicated that the average moisture content of wheat was 11.4%. According to the quality requirements of the national standard GB 1351-2023 Wheat [28], the experimental wheat sample reached the grade standard of commercial secondary wheat. A rectangular test chamber of dimensions 1.5 m × 0.3 m × 0.2 m was designed to contain wheat samples, and its interior walls were lined with 0.02 m-thick acoustic insulation material to minimize interference from acoustic reflections during experimentation. The experimental setup employed eight aluminum-clad thermal resistors mounted on an aluminum plate as heat sources, and they were connected to a temperature controller for thermal regulation. The resistance and power rating of each resistor were equal to 4.2 Ω and 23 W, respectively. Figure 1 and Figure 2 illustrate the schematic diagram and physical configuration, respectively, of the acoustic thermometry hardware system implemented for grain temperature measurement. A signal generator transmits excitation signals to a power amplifier (Aigtek ATA-308 Power Amplifier, Xian, China). The amplified signals generate audible waves through an acoustic source, which is a circular loudspeaker with a nominal power rating of 20 W and an impedance of 8 Ω. Two microphones (MPA201, BSWA) with a sensitivity of 50 mV/Pa were deployed to acquire the sound-pressure signals. In order to solve the potential discrepancies in signal conversion and amplification, both microphones were calibrated using an acoustic coupler, ensuring phase alignment within ±0.1 dB. The acoustic source was positioned 0.1 m away from the first microphone, with a separation of 1.3 m between the two microphones. Both transducers were submerged 0.1 m below the wheat surface. At this time, referring to the research method of Chen et al. [29], the value of the porosity of the wheat at the depth of 0.1 m from the surface layer was 0.41 when the liquid displacement method was used. A PXI 8812 multichannel data acquisition card captured microphone outputs at a sampling frequency of 100 kHz, achieving a 0.001 ms temporal resolution to ensure high-precision time-of-flight measurements. As wheat has a low thermal conductivity, it dissipates heat slowly from heating points to measurement locations. Therefore, two digital thermometers of accuracy equal to ±0.1 °C and with a temperature range between −50 °C and 200 °C were used to simultaneously monitor real-time temperature at a depth of 0.1 m. The arithmetic mean of these dual measurements was used as the reference temperature for the stored wheat, effectively reducing temperature-gradient errors along the acoustic path between the two microphones. Finally, to isolate the effective sound bands and remove the ineffective bands of noise, the digital Butterworth filter (4th-order) built into the system software (v2.4.2) was configured to have a passband of 150–1100 Hz in order to ensure complete coverage of the target signal while avoiding edge effects.

3.2. Research on Attenuation Analysis of Acoustic Signals in Wheat

3.2.1. Calculation Method of Signal Propagation Attenuation Coefficient

Sound waves are attenuated during propagation due to thermal conduction, viscosity, scattering, and molecular relaxation, causing the received acoustic signal intensity to decrease with an increasing propagation distance. The sound-wave attenuation coefficient conforms to the exponential decay law and can be calculated according to an exponential equation. When the loudspeaker emits spherical waves, the sound pressures at two points, r1 and r2, are as follows [30]:
P 1 ( f ) = P 0 f r 1 e α f r 1
P 2 ( f ) = P 0 f r 2 e α f r 2  
where the following applies: P1(f) and P2(f) are the sound pressure at microphones 1 and 2, measured in Pa; r1 denotes the distance between microphone 1 and the loudspeaker, and r2 denotes the distance between microphone 2 and the loudspeaker, measured in m; P0(f) is the sound pressure at the source (loudspeaker), measured in Pa; and α f is the attenuation coefficient, measured in Np/m. Using (19) and (20), the attenuation formula can be obtained as follows:
α f = 1 r 2 r 1 l n r 1 P 1 f r 2 P 2 f  

3.2.2. Research on Attenuation Characteristics of Simulated Pulse Signals

An analog pulse signal is a type of analog signal that varies over time, typically characterized by its transient nature and energy concentration [31]. This type of signal rapidly rises to its peak and then declines quickly, forming a sharp pulse shape. The transient property of the analog pulse signal causes most of its energy to become concentrated within a brief time window during propagation, enabling significant energy output at specific moments. Due to this unique feature, analog pulse signals have practical importance in many applications. For instance, they are widely used in fields where precise timing and high-energy bursts are critical, such as sonar detection, radar systems, and medical ultrasound imaging.
Figure 3 illustrates the variation in attenuation coefficients with wheat temperature when analog pulsed signals of different periods and frequencies are used as acoustic sources, as they propagate through the wheat. It can be observed that, when the period of the analog pulse signal is less than five cycles, the attenuation coefficient undergoes three distinct phases: a steady phase, a rapid transition phase, and a relatively stable phase. Conversely, when the period exceeds five cycles, the attenuation coefficient progresses through three phases; first, it gradually increases, followed by a rapid transition and finally a gradual decline. Higher-frequency analog pulse signals within the same period exhibit higher attenuation coefficients at the same temperature. For analog pulse signals, the minimum fluctuation range of the attenuation coefficient is 0.124 Np/m. Notably, the attenuation coefficients for signals of varying periods and frequencies decrease significantly at 38 °C, reaching a minimum value of 0.765 Np/m at seven cycles, with the overall attenuation coefficient ranging between 0.765 and 1.087 Np/m. Furthermore, the attenuation coefficient of the analog pulse signal increases with the rise in frequency within the same period.

3.2.3. Research on the Attenuation Characteristics of Linear Sweep Signals

A sweep signal is a specialized signal form that emphasizes the dominant frequency along with continuously varying frequencies, thereby generating a frequency-modulated broadband signal [32]. A key advantage of sweep signals is their ability to suppress the maximum sidelobe value of the signal’s correlation function, enhancing its sharpness. This property reduces the misdetection of cross-correlation peak points and improves the time-delay estimation accuracy [33]. Sweep signals are generally categorized into three types: linear sweep signals, logarithmic sweep signals, and quadratic sweep signals. Out of these signals, linear sweep signals, exhibits superior stability, reliability, and noise resistance compared to the other two types [34].
Figure 4 demonstrates the variation in the attenuation coefficient with the temperature of the wheat when a linear frequency-sweep signal (ranging from 200 to 1000 Hz) is used as the sound-source propagating through the wheat. The results indicate that, within the same bandwidth, the attenuation coefficient remains relatively stable under varying temperatures. However, the 900–1000 Hz range shows the most significant variation, with fluctuations up to 0.048 Np/m. Additionally, as the lower frequency limit increases, the attenuation coefficient gradually rises. The overall attenuation coefficient ranges between 0.749 and 1.052 Np/m.

3.2.4. Determination of Sound-Source Signal Types

When acoustic signals propagate through wheat, a higher attenuation coefficient causes poorer signal transmission, which limits the detection range of grain temperature via acoustic techniques. Furthermore, if the attenuation coefficient of the acoustic signal is temperature-sensitive, the signal can become undetectable at the receiver due to excessive attenuation at certain temperature points. Therefore, this study evaluated the acoustic signal quality using both the attenuation coefficient and its sensitivity to temperature.
An analysis of the attenuation characteristics of the two signal types reveals that, although analog pulse signals exhibit an ideal attenuation pattern, their attenuation coefficients vary significantly as a function of temperature variations. This could result in excessive signal attenuation under specific temperature conditions, reducing the signal transmission effectiveness. Therefore, analog pulse signals are unsuitable as acoustic source signals for temperature detection in a wheat sample. In contrast, linear sweep signals demonstrate lower temperature-dependent variations in attenuation coefficients and have relatively stable attenuation characteristics within the same frequency band. Furthermore, the maximum range of fluctuation of the attenuation coefficient of the low-frequency linear swept frequency signal is even lower than the minimum fluctuation range of the attenuation coefficient of the analog pulse signal. Based on these findings, this study selects linear sweep signals as the acoustic source signal for grain temperature detection using acoustic methods.

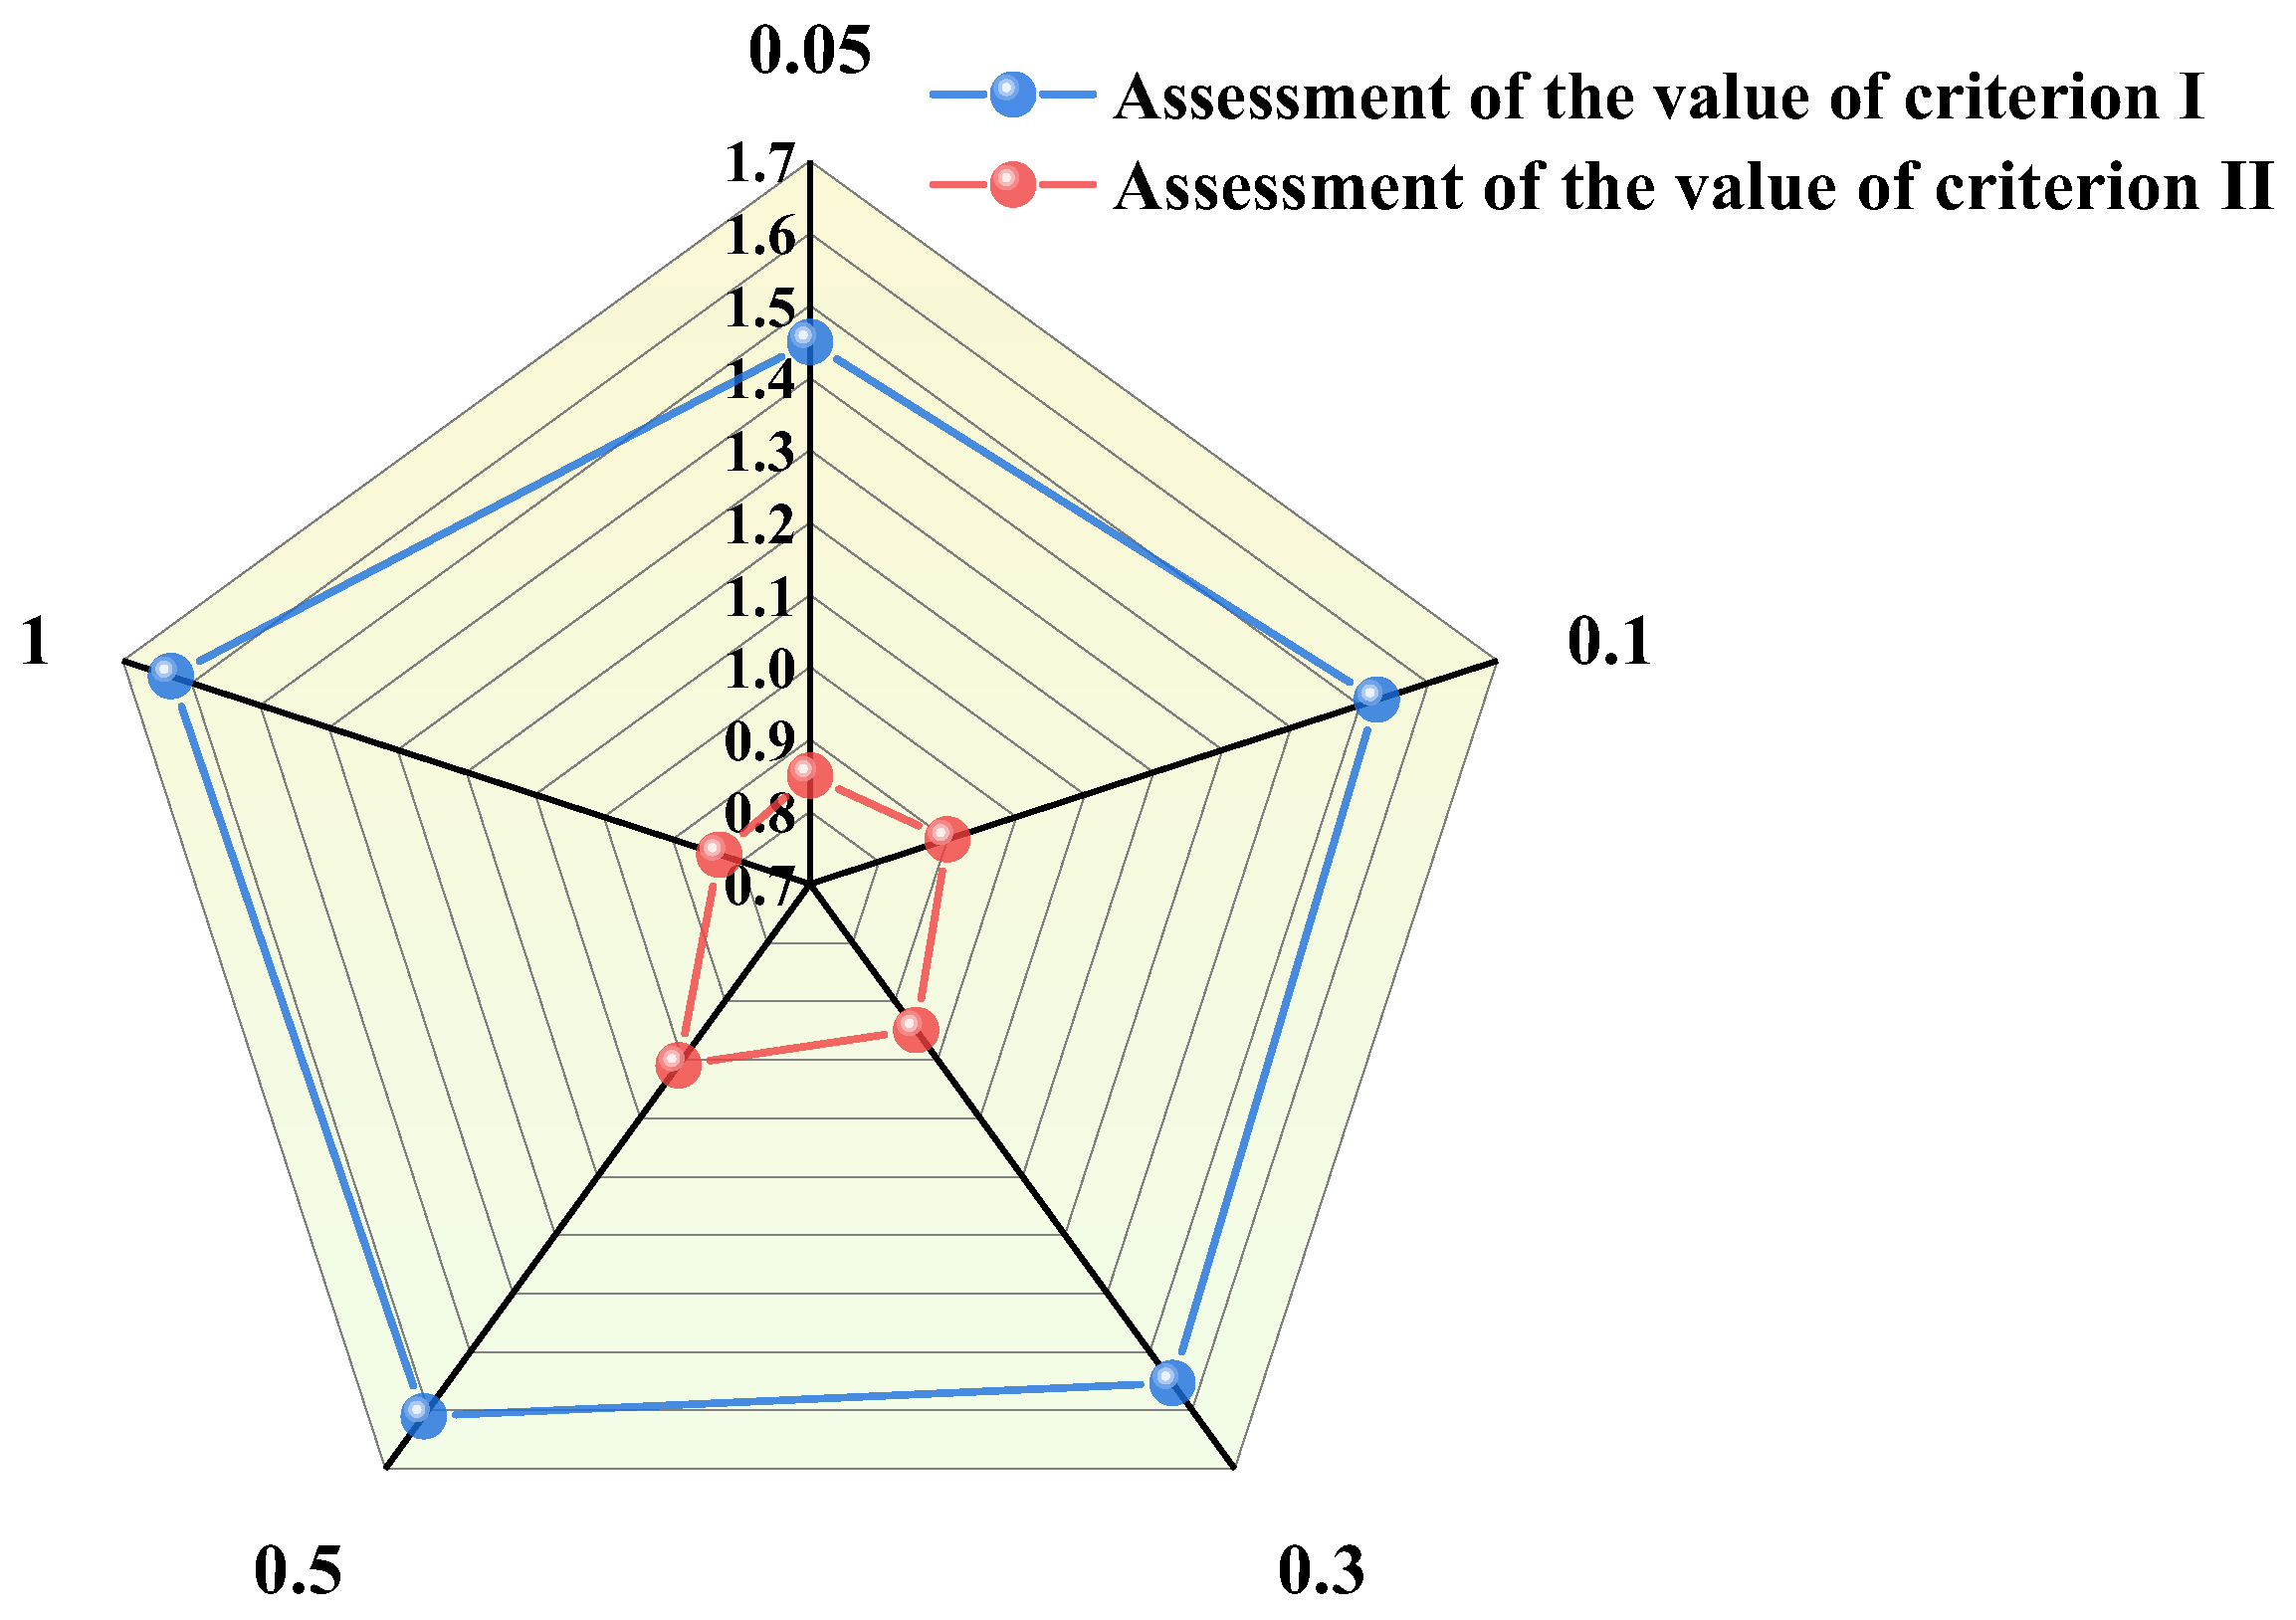
3.3. Research on the Determination of Parameters for Optimal Sound-Source Signals

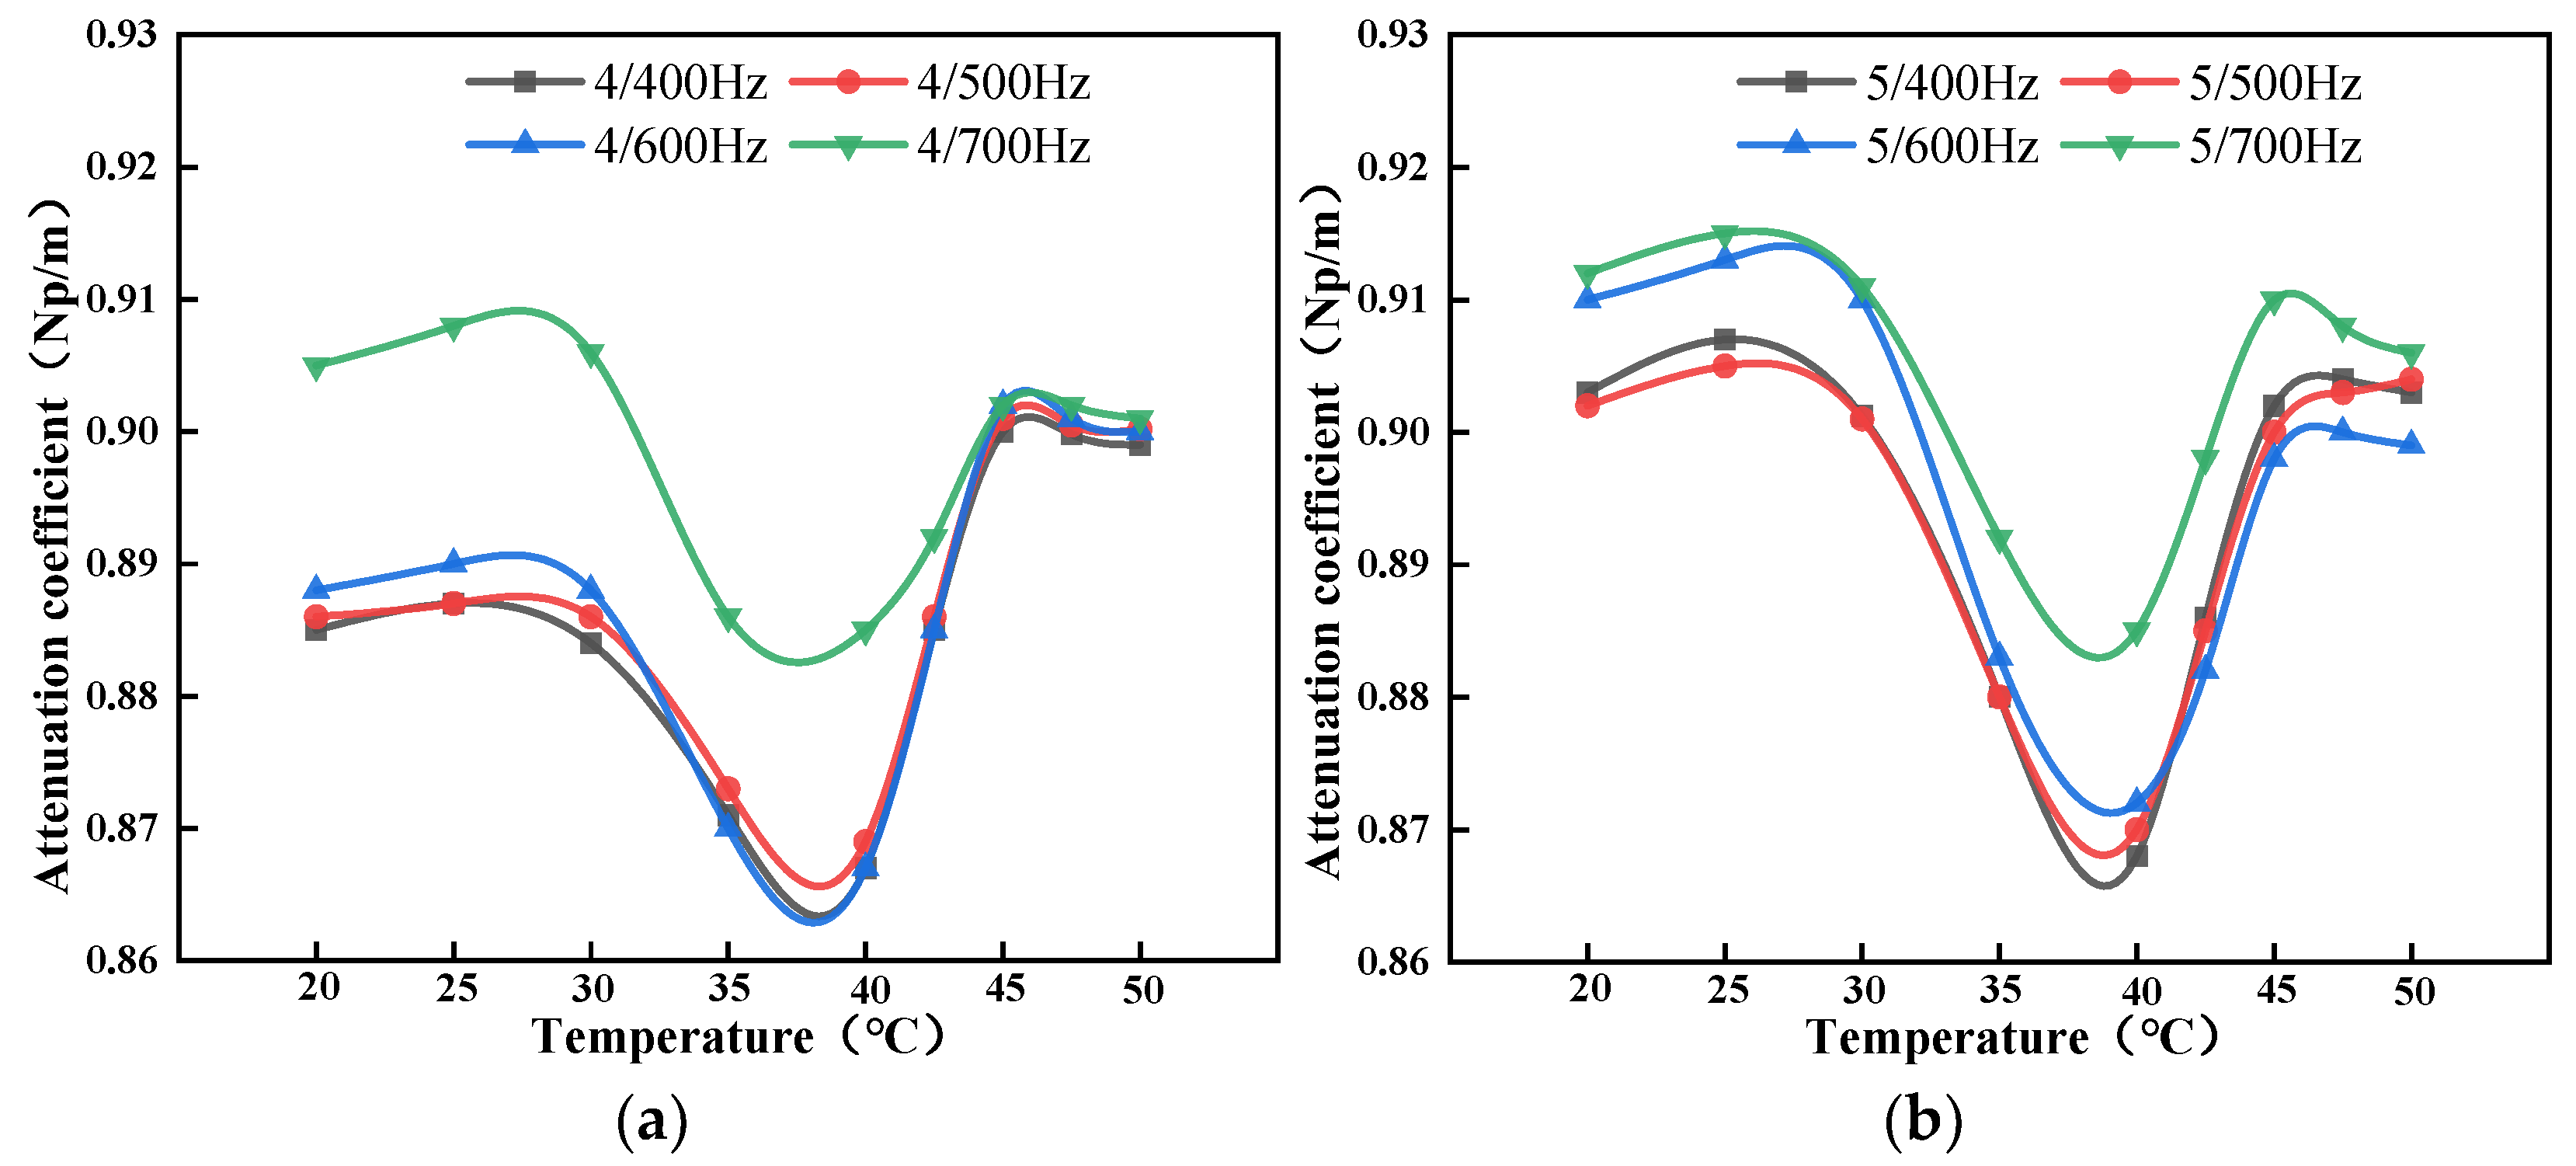
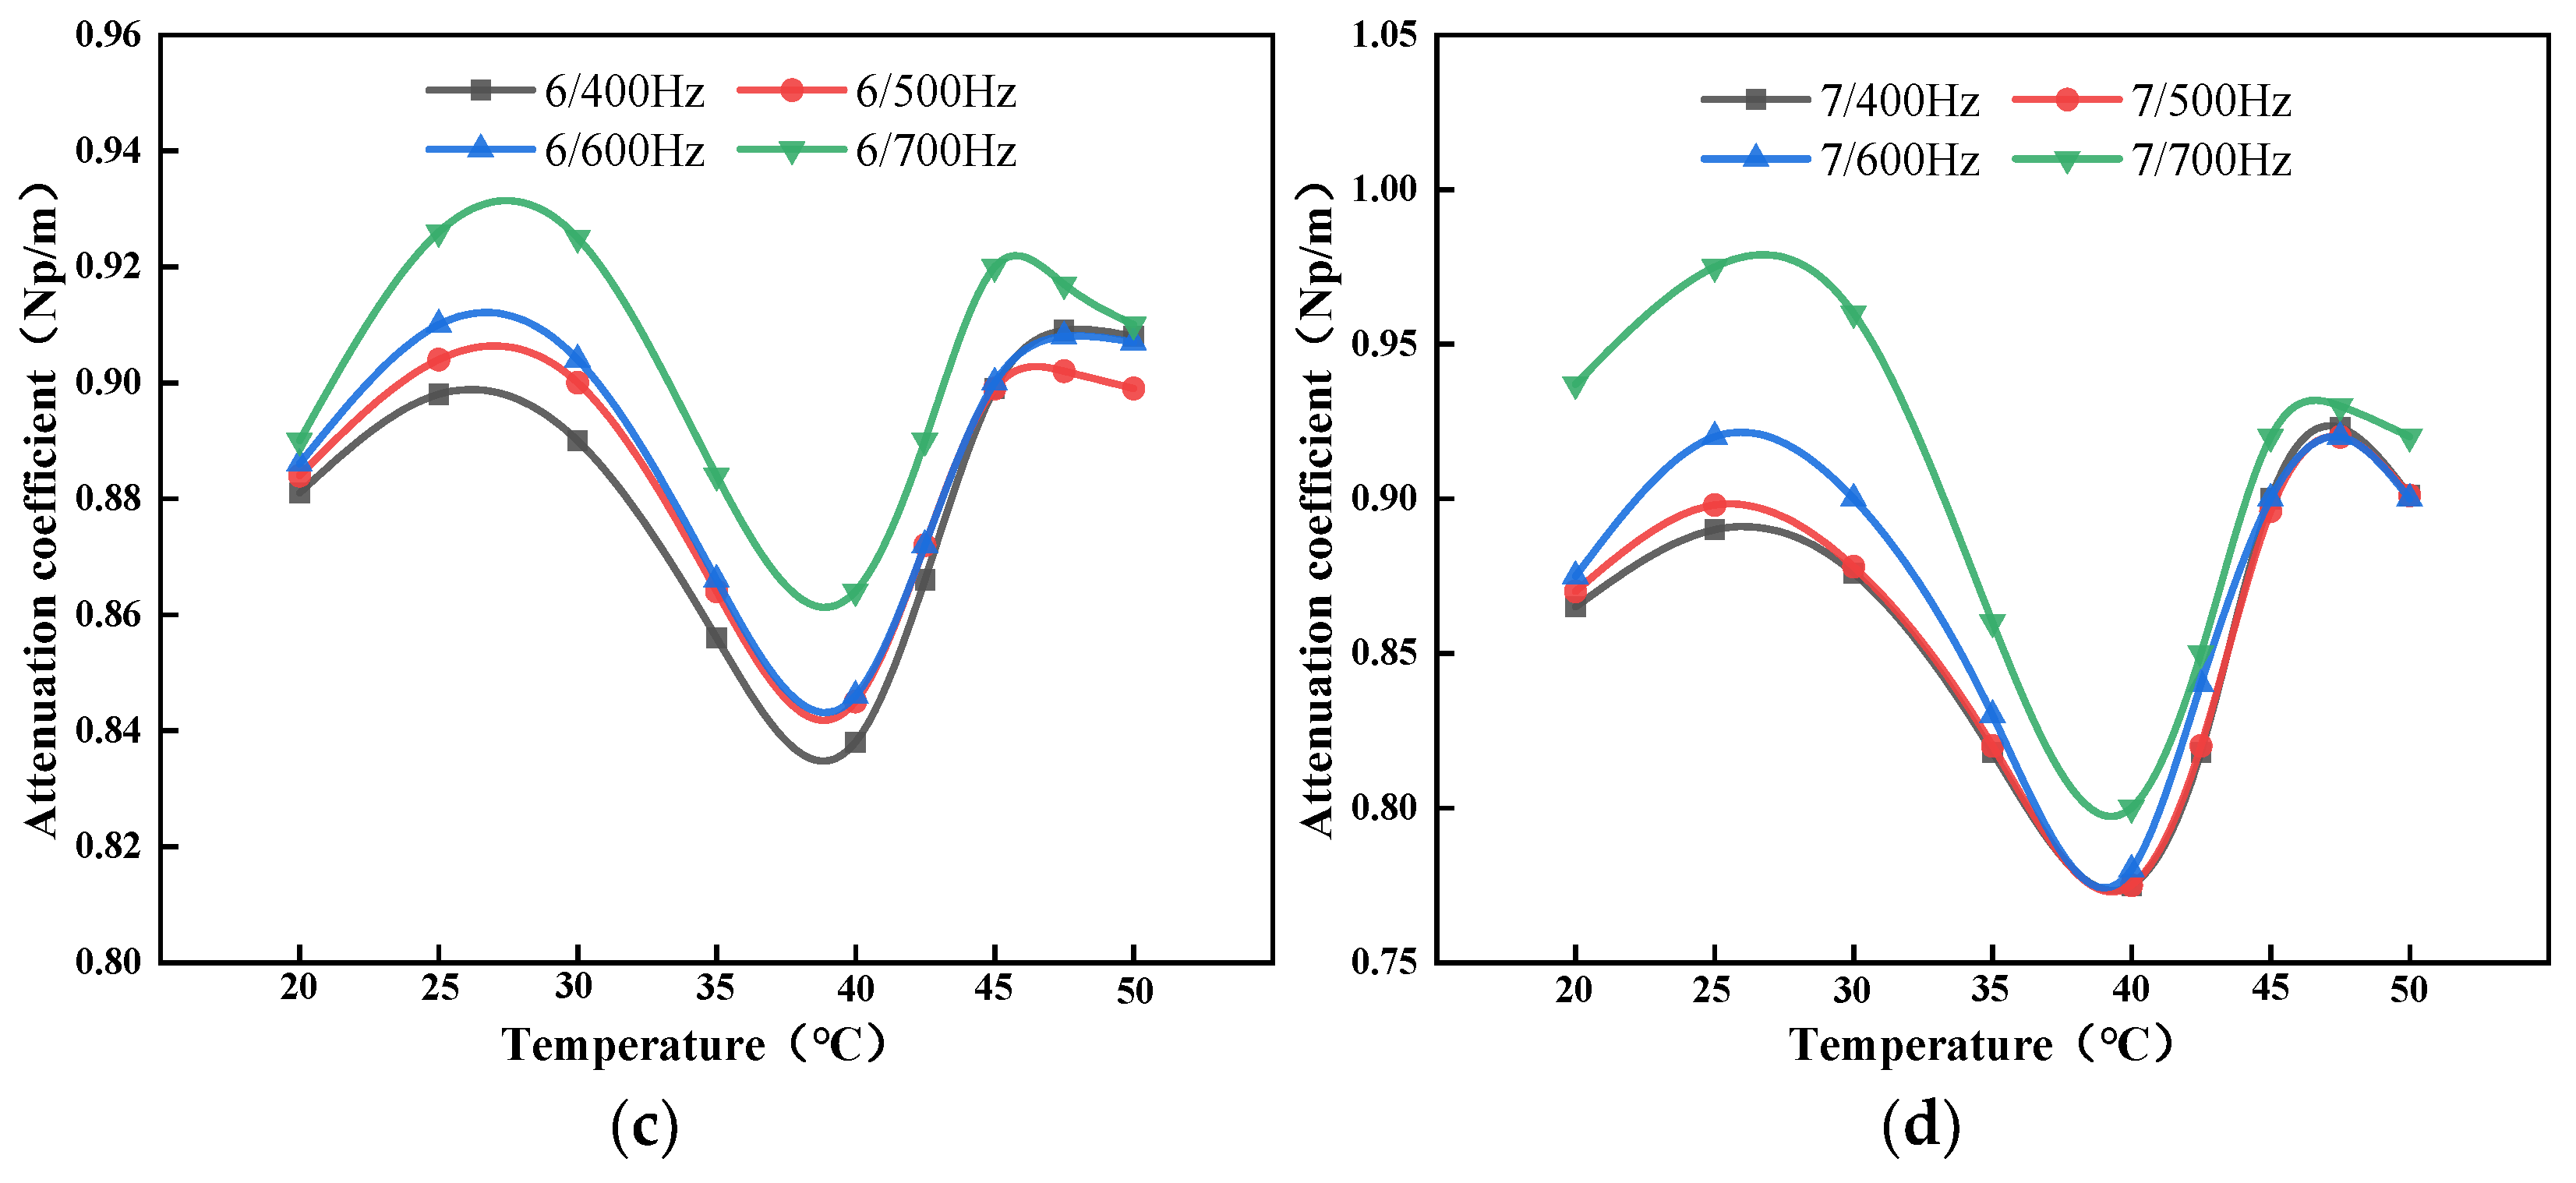
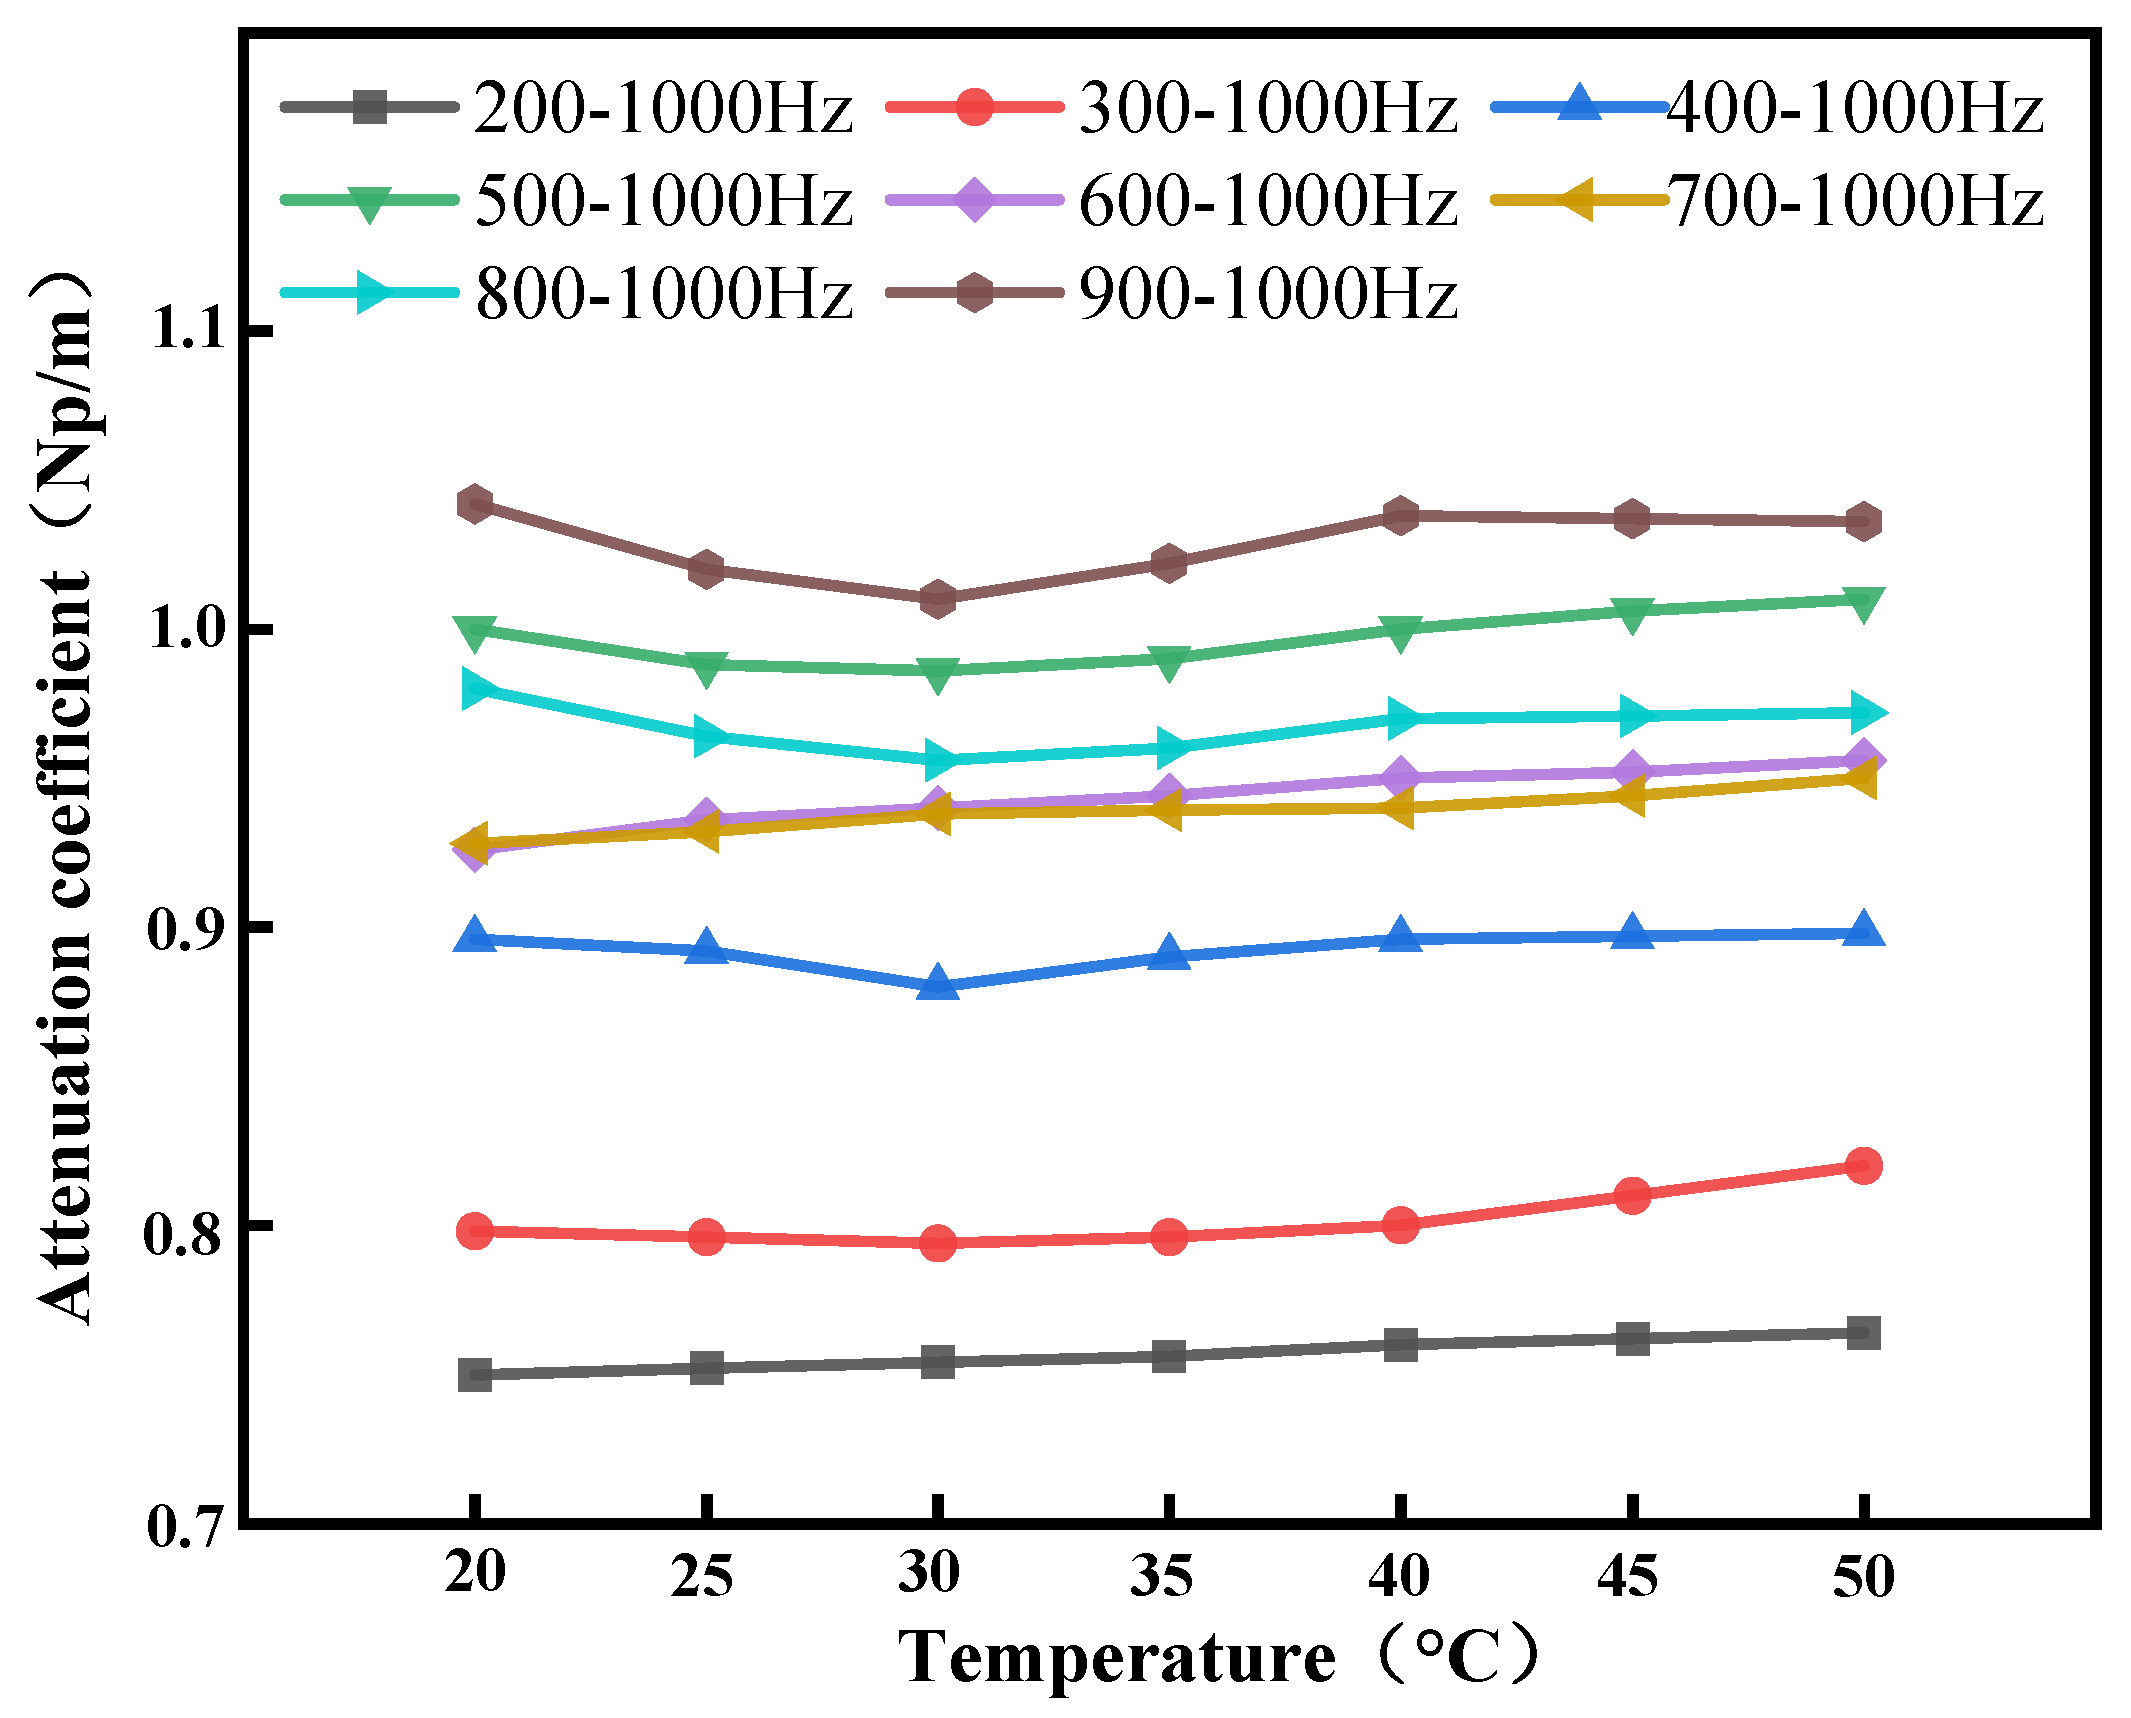
3.3.1. Research on the Determination of the Frequency Band of Linear Sweep Signals

The expression for a linear sweep signal is as follows:
x ( t ) = A s i n π f k f 0 t N + 2 π f 0 t
where the following applies: t represents the time of the signal, measured in s; x(t) represents the signal amplitude as a function of time t; A represents the amplitude of the linear sweep signal, f0 and fk are the starting and ending frequencies, respectively; and N denotes the observation length (duration) of the signal. The linear sweep signal must possess sufficient frequency bandwidth to ensure a stable time-delay estimation of the acoustic source signal. However, research indicates that high-frequency acoustic signals propagating through grain experience significant attenuation, while low-frequency signals undergo substantial variations in sound speed with frequency and shorter propagation distances. In both aforementioned scenarios, the accuracy and stability of time-delay estimation using acoustic signals in grain are adversely affected. Therefore, the frequency band of the linear sweep signal must be carefully determined based on a balanced consideration of these competing factors to identify a rational frequency range.
Cross-correlation operations are performed using linear sweep signals as the acoustic source in order to determine the rational frequency band for acoustic-based grain temperature detection. These signals have a period of 0.5 s and frequency ranges of 200–300 Hz, 200–400 Hz, 200–500 Hz, 200–600 Hz, 200–700 Hz, 200–800 Hz, 200–900 Hz, and 200–1000 Hz. The amplitude of the main peak in the cross-correlation curve reflects the signal-to-noise ratio (SNR) and noise resistance of the signal: a larger amplitude indicates a higher SNR and stronger robustness against noise. Similarly, the difference between the main peak and the maximum interference peak in the cross-correlation curve quantifies interference suppression capability. A larger difference signifies a stronger suppression of interfering peaks, thereby reducing their impact on acoustic propagation time measurement and improving the measurement accuracy. Therefore, two evaluation criteria are defined: Criterion I considers the amplitude of the main peak in the cross-correlation curve. Criterion II measures the difference between the main peak and the maximum interference peak. As Figure 5 shows, the 200–1000 Hz linear sweep signal achieves the highest Criterion I value of 1.63 and the maximum Criterion II value of 1.01 among all tested frequency bands. Considering these results, the 200–1000 Hz linear sweep signal is selected as the acoustic source for grain-temperature detection.

3.3.2. Research on the Cycle Determination of Linear Frequency-Sweep Signal

A linear sweep signal with an excessively long period would require excessive data-acquisition cycles, thereby increasing the data-processing computational workload. Conversely, a very short period may render the received signal susceptible to attenuation-induced interference, introducing significant errors in acoustic propagation time measurement. Therefore, it is critically important to select an appropriate period of linear sweep signals to enhance the precision of acoustic propagation time measurements. To this end, linear sweep signals with a frequency band of 200–1000 Hz and periods of 0.05 s, 0.1 s, 0.3 s, 0.5 s, and 1 s are selected as test signals. Subsequently, the performance of these signals is evaluated by performing a cross-correlation analysis on the received signals.
Figure 6 displays the cross-correlation results for linear sweep signals with different periods. It can be observed that the signals with longer periods have higher main peaks in the cross-correlation curves. Meanwhile, the value of Criterion II increases initially and subsequently decreases with increasing signal period, reaching its maximum value of 1.01 at 0.5 s. However, longer periods signify the requirement of a longer cross-correlation time to analyze the signal, which increases the computational complexity. Conversely, shorter periods make the received signal more vulnerable to self-attenuation and environmental interference, resulting in larger measurement errors. As Criterion II achieves its rational value at 0.5 s, the linear sweep signal with a period of 0.5 s was selected as the rational configuration for subsequent analysis.

4. Results and Discussion

4.1. Measurement of Acoustic Wave Propagation Time

According to the grain storage management specifications, the average temperature of grain in quasi-cold storage should be maintained at or below 20 °C throughout the year, with the local maximum grain temperature not exceeding 25 °C [35]. To comply with these standards, the experimental setup included both a normal temperature range and a warning temperature range. In the normal temperature range, the sample wheat in the test chamber was cooled and stabilized at 15 °C and 18.5 °C. In the warning temperature range, the sample wheat was uniformly heated to 26 °C, 30.2 °C, 35.8 °C, 40.3 °C, 43.5 °C, 47.5 °C, and 50 °C by regulating the current of the RTD (Resistance Temperature Detector). Once the temperature is stabilized at each value, the acoustic source in the experimental setup emits a 200–1000 Hz linear sweep signal into the chamber. Subsequently, the acoustic propagation time was calculated by applying basic cross-correlation time-delay estimation to the signals received via microphones 1 and 2. The measurements were repeated 10 times at each temperature value to ensure experimental stability and reliability. A statistical analysis of the collected data provided the mean acoustic propagation time and the corresponding standard deviations for the wheat samples, as summarized in Table 2.
Table 2 shows that, as the temperature of the wheat samples rises above room temperature, the acoustic propagation time within the samples gradually decreases. This phenomenon occurs because the pores between wheat grains are filled with air, and rising temperatures accelerate the motion of air molecules. Consequently, the speed of molecular vibration transfer during sound-wave propagation increases, ultimately reducing the acoustic propagation time. Simultaneously, it was observed that the experimental data aligned with the theoretical analysis, demonstrating that the speed of sound propagation increases with a higher temperature. This further validates the accuracy and reliability of the experimental methodology.

4.2. Path-Correction Factor Calculation

Next, the effect of temperature on the path-correction factor λ is explored. Consider that air at standard atmospheric pressure is contained in the pores between wheat grains, where the wheat is heated from 0 °C to 50 °C. Subsequently, the kinetic viscosity, v, of air rises from 1.78 × 10⁻⁵ m2/s to 1.92 × 10⁻⁵ m2/s, and thermal diffusivity, k, rises from 1.88 × 10⁻⁵ m2/s to 2.57 × 10⁻⁵ m2/s [36]. If the ratio between the constant-pressure specific heat capacity and the constant-volume specific heat capacity of air is 1.4, the pore diameter, d, between wheat particles is 0.00061 m, the acoustic wave path zigzag degree in wheat is about 1.33 [21], and the acoustic wave frequency f is 1000 Hz. Using (8) and (9), it can be calculated that, as the temperature increases, F varies from 5.685 × 10⁻³ m/s1/2 to 6.096 × 10⁻³ m/s1/2; i.e., there is a relative change of 7.2%, and λ changes from 1.551 to 1.567, i.e., there is a relative change of 1.03%. In summary, it can be concluded that the temperature change has a minor effect on λ, which is usually negligible over the wide range of temperature measurements of the grain heap. Using (12), we obtained λ as 1.2593 when the wheat temperature was room temperature, 21 °C, and at the same time, we could use the value as a calibration value of λ in the present experiment.

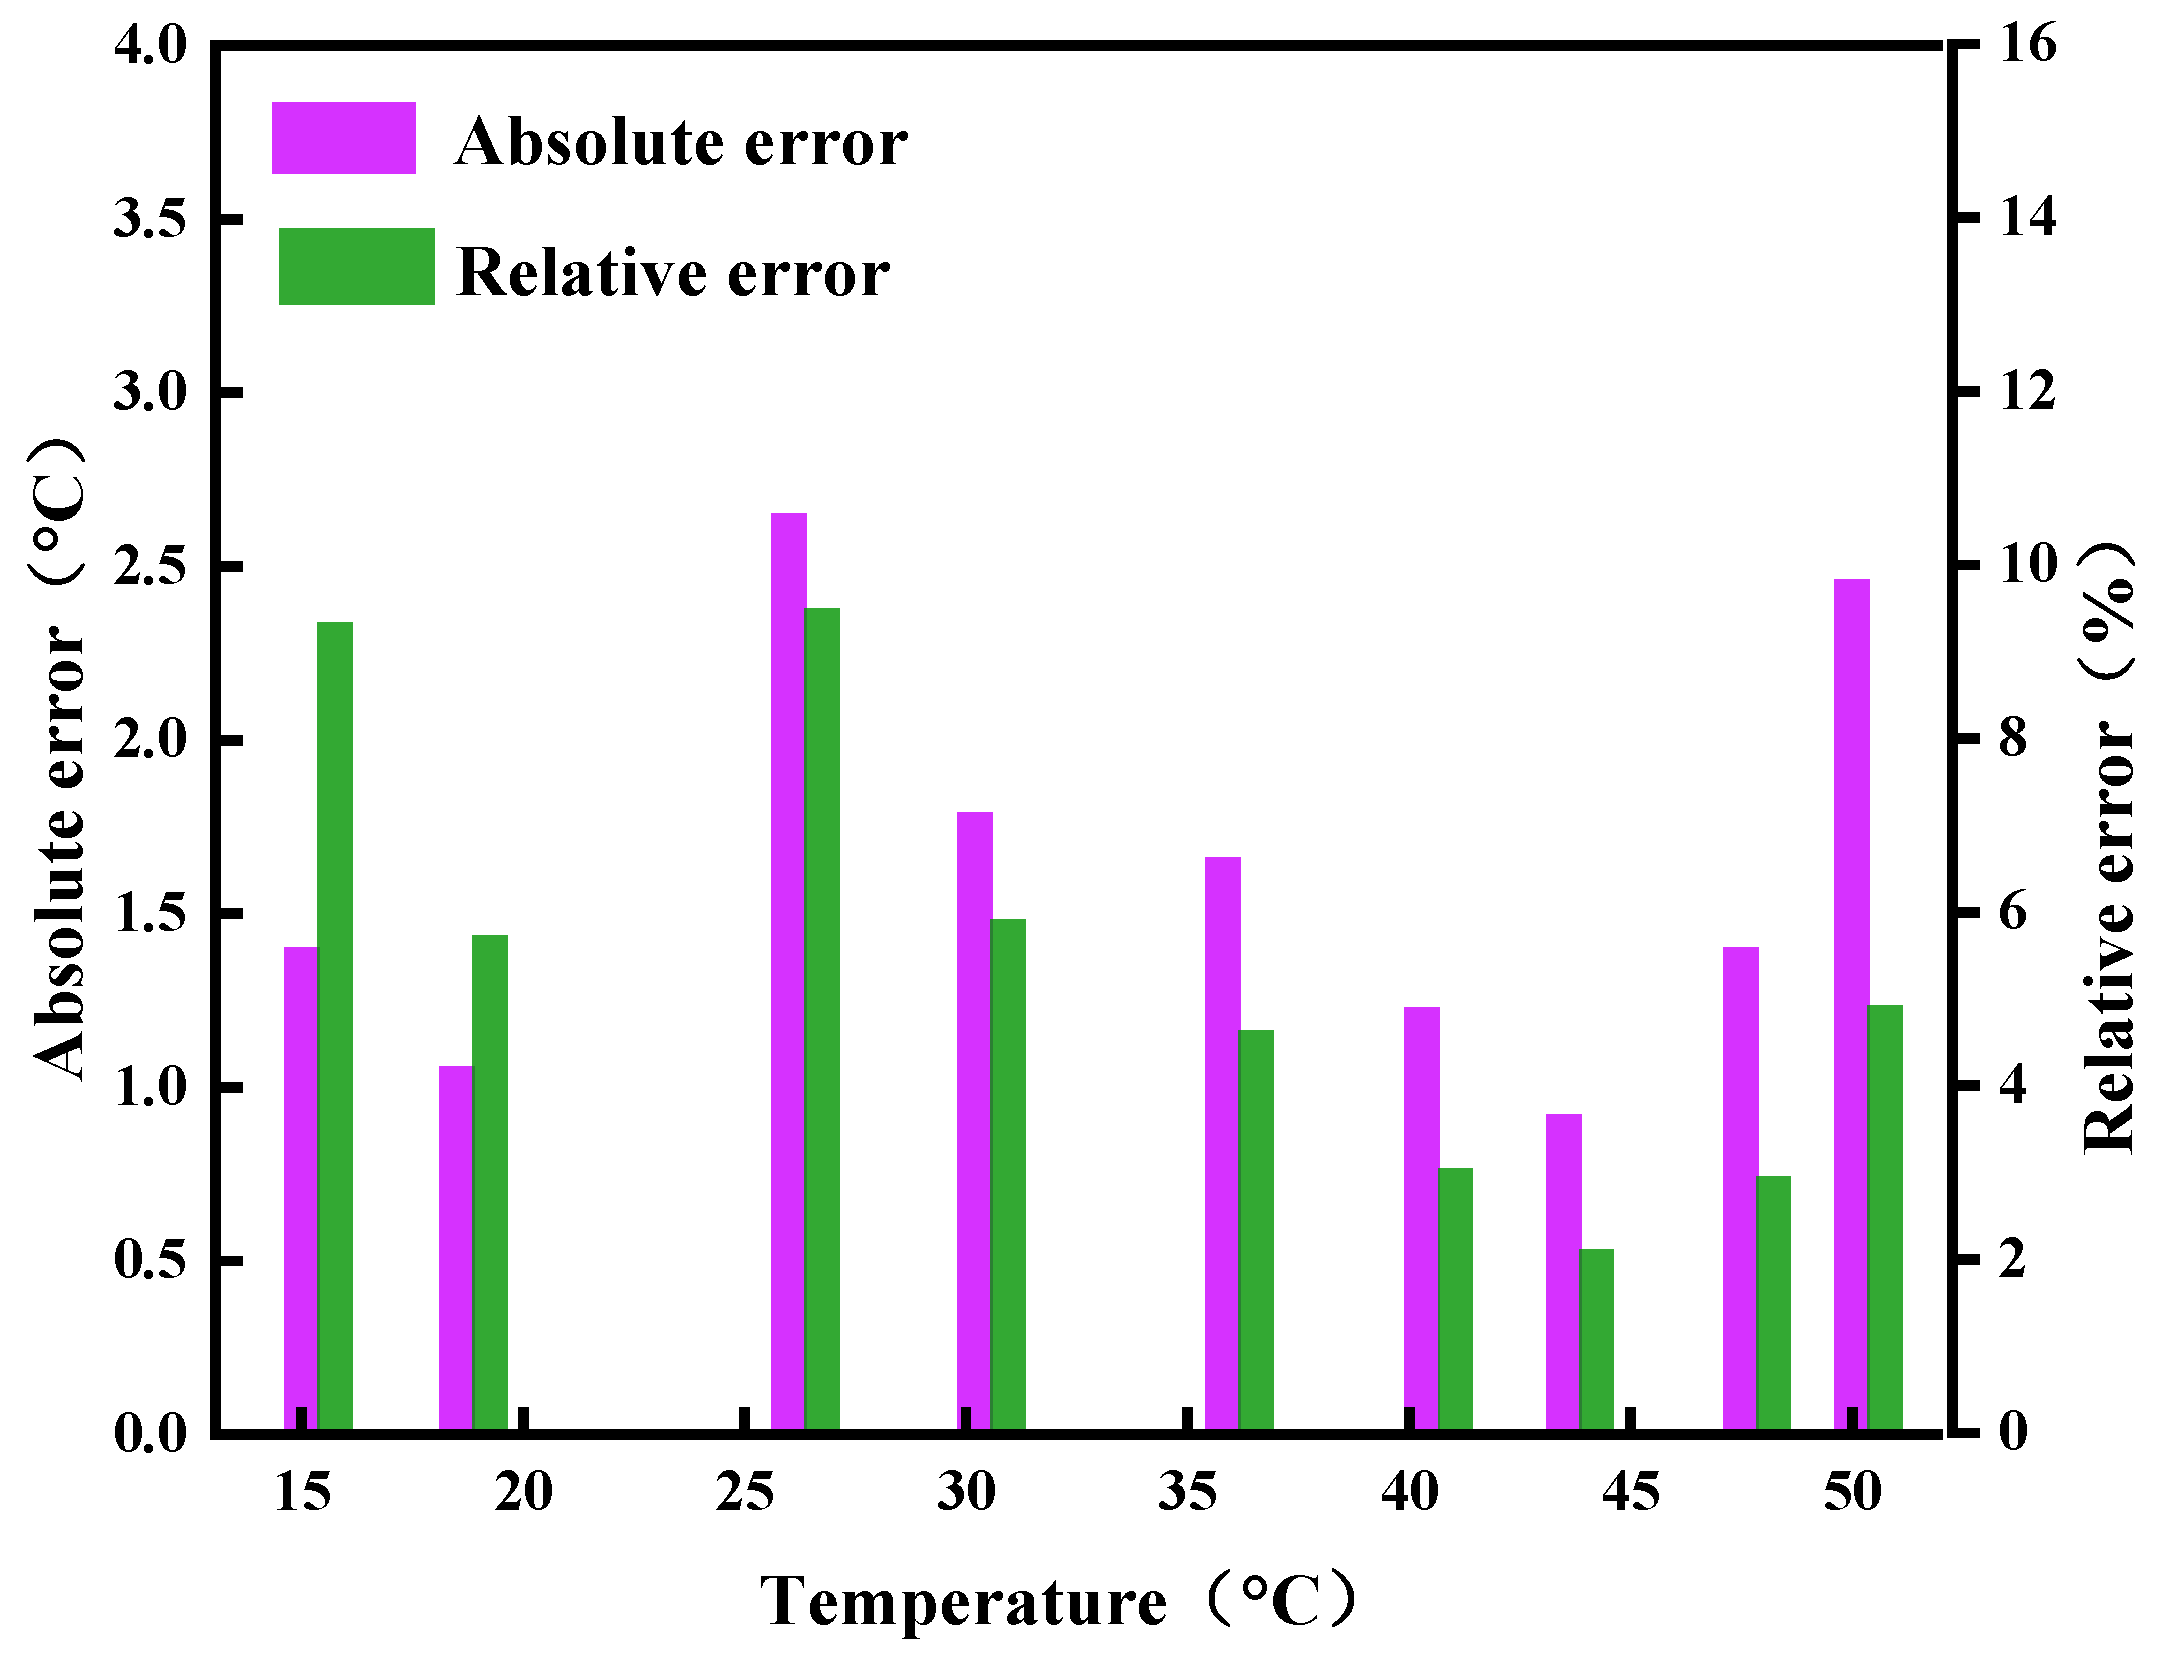
4.3. Temperature Measurement Results

Grain temperature inversion was carried out based on the constructed model of the mapping relationship between the grain temperature and sound velocity. Figure 7 and Figure 8 show the grain temperature obtained after inversion. The results show that, when the actual temperature is 15 °C, the temperature obtained using the model is 13.6 °C; i.e., there is a temperature difference of 1.4 °C. When the actual temperature is 26 °C, the temperature obtained using the model is 23.35 °C; i.e., there is a temperature difference of 2.65 °C. When the actual temperature is 40.3 °C, the obtained temperature is 1.23 °C lower at 39.07 °C. When the actual temperature is 50 °C, the temperature inverted using the model is 52.46 °C; i.e., there is a temperature difference of 2.46 °C. In the temperature measurement interval between 15 °C to 50 °C, the maximum, minimum, and average temperature differences are 2.65 °C, 0.92 °C, and 1.62 °C, respectively, while the average relative error is 5.35%. These results show that, although there is a certain degree of error between the inverted temperature obtained using the sound velocity and grain temperature mapping model and the temperature measured via the contact thermometer, it does not affect the determination of anomalies in large-scale storage of grain and the mapping relationship between the measured speed of sound and grain temperature is still good. Therefore, the linear sweep signal with a period of 0.5 s and a frequency band of 200–1000 Hz can be used as an acoustic signal to measure the temperature of grain storage through the acoustic method.

4.4. Discussion

4.4.1. Influence of Grain Thermal Conductivity

Acoustic temperature measurement technology does not directly detect the grain temperature but instead considers the air temperature within the grain pores to be equal to the grain temperature. This assumption introduces discrepancies because of the difference between the air temperature in the pores and the actual grain temperature. Furthermore, grain acts as a poor thermal conductor that propagates heat extremely slowly during heating. This causes the temperature to be distributed non-uniformly between regions near the heat source and those farther away, which may introduce temperature measurement errors. Therefore, after heating the grain to the preset temperature, the grain is left to stand for about 10 min to allow the temperature to be spread evenly. This reduces temperature gradients between regions near and far from the heat source, minimizing measurement errors.

4.4.2. Influence of Acoustic Propagation Time Measurement Errors

In acoustic temperature measurement systems, discrepancies may exist in the conversion of received acoustic signals into electrical signals and their amplification via the two microphones, causing systematic time-delay errors in the calculated acoustic propagation time. These errors directly compromise the temperature detection accuracy in grain-using acoustic methods. Therefore, to mitigate discrepancies in signal conversion and amplification, the microphones were calibrated using acoustic couplers for each experiment. This ensures consistent sensitivity and phase responses across the two microphones, reducing time-delay errors.

5. Conclusions

In this paper, an acoustic method for temperature detection in stored grain was studied to determine the rational sound-source signal type and frequency using simulated pulse signals and linear frequency-swept signals. The results showed that the attenuation coefficients of the analog pulse signals varied from 0.765 to 1.087 Np/m, and the attenuation coefficients were most sensitive to wheat temperature. In contrast, the attenuation coefficients of the linear swept signal signals varied from 0.749 to 1.052 Np/m, and the attenuation characteristics remain relatively stable at different temperatures. Two evaluation criteria were used to assess the performance of the two signals. The linear frequency-swept signal with a 0.5-s period achieved maximum values of both Evaluation Criterion I and Evaluation Criterion II in the 200–1000 Hz frequency range, indicating rational performance in both signal penetration and attenuation characteristics. This rational sound-source signal was used for temperature detection in a wheat sample. The measured results showed an average relative error is 5.35%, a mean absolute error of 1.62 °C, and a maximum temperature deviation of 2.65 °C, demonstrating that, although the rational signal exhibits discrepancies from the actual temperature, it is capable of reasonably and swiftly detecting the actual temperature conditions of the stored grain.
Acoustic temperature measurement technology offers a novel approach to grain temperature detection in complex storage environments, demonstrating promising application prospects. However, the model and key parameters can be improved in future practical implementations by considering additional factors, such as spatial distribution characteristics of stored grain and depth variations. These factors can enhance temperature detection accuracy.

Author Contributions

Conceptualization, H.G. and B.F.; methodology and experiments, H.G., B.F. and C.C.; data acquisition and formal analysis, B.F., Z.L. and X.L.; investigation, Y.Z., C.G. and H.W.; writing—original draft preparation, B.F.; writing—review and editing, H.G., B.F. and Y.J.; supervision, H.G.; project administration, H.G.; funding acquisition, H.G., Y.J., B.F. and Y.Z. All authors have read and agreed to the published version of the manuscript.

Funding

This work was supported by the National Natural Science Foundation of China (Grant No. 62271191, No. 61975053), the Natural Science Foundation of Henan (No. 222300420040), The Innovative Funds Plan of Henan University of Technology (No. 2021ZKCJ04), the Key Science and Technology Program of Henan Province (No. 222102110246, No. 222103810072), the Program for Science & Technology Innovation Talents in Universities of Henan Province (No. 23HASTIT024, No. 22HASTIT017), the Open Fund Project of Key Laboratory of Grain Information Processing & Control, Ministry of Education, Henan University of Technology (No. KFJJ2020103 and No. KFJJ2021102), and the Cultivation Programme for Young Backbone Teachers in Henan University of Technology.

Institutional Review Board Statement

Not applicable.

Data Availability Statement

The data presented in this study are available upon request from the corresponding author.

Conflicts of Interest

The authors declare no conflicts of interest.

References

  1. Duan, S.; Yang, W.; Wang, X.; Mao, S.; Zhang, Y. Temperature forecasting for stored grain: A deep spatiotemporal attention approach. IEEE Internet Things J. 2021, 8, 17147–17160. [Google Scholar] [CrossRef]
  2. Zhang, B.; Gao, T.; Chen, Y.; Jin, X.; Feng, T.; Chen, X. Research on unmanned transfer vehicle path planning for raw grain warehousing. Intell. Fuzzy Syst. 2023, 45, 6513–6533. [Google Scholar] [CrossRef]
  3. Plumier, B.; Maier, D. Effect of temperature sensor numbers and placement on aeration cooling of a stored grain mass using a 3D finite element model. Agriculture 2021, 11, 231. [Google Scholar] [CrossRef]
  4. Neto, A.J.S.; Lopes, D.D.C. Thermistor based system for grain aeration monitoring and control. Comput. Electron. Agric. 2015, 116, 45–54. [Google Scholar] [CrossRef]
  5. Zhao, L.; Wang, J.; Li, Z.; Hou, M.; Dong, G.; Liu, T.; Sun, T.; Grattan, K.T.V. Quasi-distributed fiber optic temperature and humidity sensor system for monitoring of grain storage in granaries. IEEE Sens. 2020, 20, 9226–9233. [Google Scholar] [CrossRef]
  6. Yang, G.; Yan, J.D.; Shen, G.; An, L.; Li, Z. Real-time monitoring of temperature field in piled pulverized coal based on acoustic method. Clean Coal Technol. 2022, 28, 59–65. [Google Scholar] [CrossRef]
  7. Dokhanchi, N.S.; Othmani, C.; Arnold, J.; Vogel, A.; Merchel, S.; Voelker, C.; Altinsoy, M.E. Indoor air temperature measurements using ultrasonic travel-time tomography. Appl. Acoust. 2024, 218, 109894. [Google Scholar] [CrossRef]
  8. Sukhanov, D.; Khalil, A. Two Dimensional Ultrasonic Air Temperature Tomography Based on Phase Shift Processing of Multi-Frequency Measurements. IEEE Trans. Instrum. Meas. 2024, 73, 4508706. [Google Scholar] [CrossRef]
  9. Lin, F.-S.; Huang, M.-C.; Tai, S.-K.; Chu, Y.-C.; Shen, S.-H.; Huang, C.-H. Investigation of an FPGA-based acoustic gas thermometer for monitoring indoor temperature distribution two-dimensionally. IEEE Sens. J. 2024, 24, 15197–15209. [Google Scholar] [CrossRef]
  10. Zhang, W.; Jiang, G.; Sun, J.; Liu, Y. Measurement the 3D temperature distribution in the combustion zone using acoustic tomography and nolinear wavefont tracing. J. Meas. 2024, 229, 114439. [Google Scholar] [CrossRef]
  11. Duan, Y.; Chen, L.; Zhou, X.; Shi, Y.; Wu, N. Boiler Furnace Temperature Field Measurement and Reconstruction Error Elimination Based on Temperature Field Residual Correction Network. IEEE Trans. Instrum. Meas. 2024, 73, 2507215. [Google Scholar] [CrossRef]
  12. Kong, Q.; Jiang, G.; Liu, Y.; Sun, J. 3D high-quality temperature-field reconstruction method in furnace based on acoustic tomography. Appl. Therm. Eng. 2020, 179, 115693. [Google Scholar] [CrossRef]
  13. Wang, H.; Zhou, X.; Yang, Q.; Chen, J.; Dong, C.; Zhao, L. A reconstruction method of boiler furnace temperature distribution based on acoustic measurement. IEEE Trans. Instrum. Meas. 2021, 70, 9600413. [Google Scholar] [CrossRef]
  14. Fan, W.; Chen, Y.; Pan, H.; Ye, Y.; Cai, Y.; Zhang, Z. Experimental study on underwater acoustic imaging of 2-D temperature distribution around hot springs on floor of Lake Qiezishan, China. Exp. Therm. Fluid Sci. 2010, 34, 1334–1345. [Google Scholar] [CrossRef]
  15. Yu, X.; Zhuang, X.; Li, Y.; Zhang, Y. Real-time observation of range-averaged temperature by high-frequency underwater acoustic thermometry. IEEE Access 2019, 7, 17975–17980. [Google Scholar] [CrossRef]
  16. Xu, S.; Li, G.; Feng, R.; Hu, Z.; Xu, P.; Huang, H. 3-D Water temperature distribution observation via coastal acoustic tomography sensing network. IEEE Trans. Geosci. Remote Sens. 2023, 61, 4206418. [Google Scholar] [CrossRef]
  17. Hu, Y.; Guo, M.; Yan, Y.; Lu, G.; Cheng, X. Temperature measurement of stored biomass of different types and bulk densities using acoustic techniques. Fuel 2019, 257, 115986. [Google Scholar] [CrossRef]
  18. Zheng, L.J. Temperature Measurement of Biomass Piles Using Acoustic Sensors; North China Electric Power University: Beijing, China, 2021. [Google Scholar] [CrossRef]
  19. Saito, I.; Mizutani, K.; Wakatsuki, N.; Kawabe, S. Measurement of vertical temperature distribution using a single pair of loudspeaker and microphone with acoustic reflection. Jpn. J. Appl. Phys. 2009, 48, 07GB05. [Google Scholar] [CrossRef]
  20. Guo, M. Research on Temperature Measurement of Stacked Biomass Based on Acoustic Method; North China Electric Power University: Beijing, China, 2019. [Google Scholar] [CrossRef]
  21. Hickling, R.; Wei, W.; Hagstrum, D. Studies of sound transmission in various types of stored grain for acoustic detection of insects. Appl. Acoust. 1997, 50, 263–278. [Google Scholar] [CrossRef]
  22. Hickling, R.; Wei, W. Sound transmission in stored grain. Appl. Acoust. 1995, 45, 1–8. [Google Scholar] [CrossRef]
  23. Ge, M.; Chen, G.; Liu, W.; Liu, C.; Zheng, D. Study on the pore structure characteristics of maize grain piles and their effects on air flow distribution. Comput. Electron. Agric. 2024, 224, 109136. [Google Scholar] [CrossRef]
  24. Guo, M.; Yan, Y.; Hu, Y.; Lu, G.; Zhang, J. Temperature measurement of stored biomass using low-frequency acoustic waves and correlation signal processing techniques. Fuel 2018, 227, 89–98. [Google Scholar] [CrossRef]
  25. Ribert, G.; Domingo, P.; Vervisch, L. Analysis of sub-grid scale modeling of the ideal-gas equation of state in hydrogen–oxygen premixed flames. Proc. Combust. Inst. 2019, 37, 2345–2351. [Google Scholar] [CrossRef]
  26. Yan, H.; Chen, G.; Zhou, Y.; Liu, L. Primary study of temperature distribution measurement in stored grain based on acoustic tomography. Exp. Therm. Fluid Sci. 2012, 42, 55–63. [Google Scholar] [CrossRef]
  27. Jiang, H.; Zhang, S.; Yang, Z.; Zhao, L.; Zhou, Y.; Zhou, D. Quality classification of stored wheat based on evidence reasoning rule and stacking ensemble learning. Comput. Electron. Agric. 2023, 214, 108339. [Google Scholar] [CrossRef]
  28. GB 1351-2023; People’s Republic of China National Standard Wheat. State Administration for Market Supervision and Administration of the People’s Republic of China: Beijing, China; National Standardization Administration of the People’s Republic of China: Beijing, China, 2023.
  29. Chen, J.H.; Li, J.X.; Zheng, D.Q.; Yin, J.; Huang, H.R.; Ge, M.M.; Zhang, J.Y. Prediction of Grain Porosity Based on GWO-BP Neural Network and Grain Compression Experiment. Sci. Technol. Cereals Oils Foods 2024, 32, 186–193. [Google Scholar] [CrossRef]
  30. Zhang, J.; Hao, R.; Gu, X. Amplitude attenuation laws of acoustic emission waves in plate structures. Dyna 2019, 94, 67–74. [Google Scholar] [CrossRef]
  31. Zhang, Z.W.; Li, Z.S.; Wang, H.P.; Xin, J. A method based on power-law detector in deep-sea multi-path pulse signal joint detection. J. Acoust. Technol. 2025, 1–6. [Google Scholar] [CrossRef]
  32. Li, S.; Wang, F.; Zhang, Y.; Li, R.; Shi, S.; Li, Y.; Li, X.; da Costa, D.B. Orthogonal chirp division multiplexing assisted dual-function radar communication in IoT networks. IEEE Internet Things J. 2024, 13, 23752–23764. [Google Scholar] [CrossRef]
  33. Wu, R. Design of an Acoustic Temperature Measurement System Based on FPGA; North China Electric Power University: Beijing, China, 2021. [Google Scholar] [CrossRef]
  34. Zhang, J.; Zhao, G.; Xu, L.; Zhang, X.; Liu, X.; Zhu, J. Characteristic analysis and data comparative of linear and nonlinear low-frequency sweep in vibroseis. J. Geophys. Eng. 2024, 21, 244–256. [Google Scholar] [CrossRef]
  35. GB/T 29890-2013; Technical Specification for Grain and Oil Storage. General Administration of Quality Supervision, Inspection and Quarantine of the People’s Republic of China: Beijing, China; Standardization Administration of the People’s Republic of China: Beijing, China, 2013.
  36. Tao, W.Q. Heat Transfer, 5th ed.; Higher Education Press: Beijing China, 2019; p. 536. [Google Scholar]
Figure 1. System diagram for measuring the temperature of stored wheat using sound waves (units: m).
Agriculture 15 01035 g001
Figure 2. Experimental device diagram of wheat temperature measurement system.
Agriculture 15 01035 g002
Figure 3. Schematic diagram of the variation in the attenuation coefficients of analog pulse signals versus temperature under different cycles and frequencies. (a) Four-cycle simulated pulse signal; (b) Five-cycle simulated pulse signal; (c) Six-cycle simulated pulse signal; (d) Seven-cycle simulated pulse signal.
Agriculture 15 01035 g003aAgriculture 15 01035 g003b
Figure 4. Attenuation coefficient variation curve of linear sweep signals versus varying temperatures in different frequency ranges.
Agriculture 15 01035 g004
Figure 5. Comparison of cross-correlations of linear frequency-swept signals in the 200–1000 Hz frequency band.
Agriculture 15 01035 g005
Figure 6. Results of the cross-correlation curves of linear frequency-modulated signals over different periods.
Agriculture 15 01035 g006
Figure 7. Inversion of grain temperature results using the sound and grain temperature-mapping model.
Agriculture 15 01035 g007
Figure 8. Inversion temperature error distribution of sound velocity.
Agriculture 15 01035 g008
Table 1. Comparison of grain storage temperature detection technologies.
Temperature Measurement MethodAdvantagesDisadvantages
Thermocouple [3]Wide temperature range; durability; fast response.Lower accuracy; requires cold-junction compensation.
Thermistor [4]High sensitivity; low cost; small size.Non-linear; requires calibration.
Optical fiber [5]High precision; high stability; safety.Complex installation (fragile fibers); slower response.
Table 2. Propagation times at different temperatures.
Temperature (°C)Microphone Depth: 0.1 m;
Microphone Spacing: 1.3 m.
TOF (ms)Standard Deviation (µs)
Normal154.8230.43
18.54.7910.32
Room temperature214.7620.39
Alert temperature264.7430.32
30.24.7030.41
35.84.6590.26
40.34.6220.35
43.54.5830.45
47.54.5510.50
504.5260.36
Disclaimer/Publisher’s Note: The statements, opinions and data contained in all publications are solely those of the individual author(s) and contributor(s) and not of MDPI and/or the editor(s). MDPI and/or the editor(s) disclaim responsibility for any injury to people or property resulting from any ideas, methods, instructions or products referred to in the content.

