Abstract
The accurate estimation of double-season rice yield is critical for ensuring national food security. To address the limitations of traditional crop models in spatial resolution and accuracy, this study innovatively developed the HASM-APSIM coupled model by integrating High-Accuracy Surface Modeling (HASM) with the Agricultural Production Systems sIMulator (APSIM) to simulate the historical yield of double-season rice in Jiangxi Province from 2000 to 2018. The methodological advancements included the following: the localized parameter optimization of APSIM using the Nelder–Mead simplex algorithm and NSGA-II multi-objective genetic algorithm to adapt to regional rice varieties, enhancing model robustness; coarse-resolution yield simulations (10 km grids) driven by meteorological, soil, and management data; and high-resolution refinement (1 km grids) via HASM, which fused APSIM outputs with station-observed yields as optimization constraints, resolving the trade-off between accuracy and spatial granularity. The results showed that the following: (1) Compared to the APSIM model, the HASM-APSIM model demonstrated higher accuracy and reliability in simulating historical yields of double-season rice. For early rice, the R-value increased by 14.67% (0.75→0.86), RMSE decreased by 34.02% (838.50→553.21 kg/hm2), MAE decreased by 31.43% (670.92→460.03 kg/hm2), and MAPE dropped from 11.03% to 7.65%. For late rice, the R-value improved by 27.42% (0.62→0.79), RMSE decreased by 36.75% (959.0→606.58 kg/hm2), MAE reduced by 26.37% (718.05→528.72 kg/hm2), and MAPE declined from 11.05% to 8.08%. (2) Significant spatiotemporal variations in double-season rice yields were observed in Jiangxi Province. Temporally, the simulated yields of early and late rice aligned with statistical yields in terms of numerical distribution and interannual trends, but simulated yields exhibited greater fluctuations. Spatially, high-yield zones for early rice were concentrated in the eastern and central regions, while late rice high-yield areas were predominantly distributed around Poyang Lake. The 1 km resolution outputs enabled the precise identification of yield heterogeneity, supporting targeted agricultural interventions. (3) The growth rate of double-season rice yield is slowing down. To safeguard food security, the study area needs to boost the development of high-yield and high-quality crop varieties and adopt region-specific strategies. The model proposed in this study offers a novel approach for simulating crop yield at the regional scale. The findings provide a scientific basis for agricultural production planning and decision-making in Jiangxi Province and help promote the sustainable development of the double-season rice industry.
1. Introduction
As an important food crop in China, double-season rice plays a critical role in ensuring national food security [,,]. In recent years, significant changes have occurred in China’s grain production patterns, with the geographical focus of rice cultivation and yield gradually shifting northeastward, and the “Northern Grain to Southern Consumption” circulation structure becoming increasingly prominent [,]. In this context, how to stabilize and increase the yield in the traditional double-cropping rice areas in the south has become a key issue in the national food security strategy. The high-precision and high-resolution simulation of crop yields is of irreplaceable importance for governments to formulate scientific and rational agricultural policies, optimize resource allocation, and guide practical agricultural production to enhance productivity. This not only aids in the precise planning of planting areas and the rational allocation of agricultural inputs but also enables the early prediction of yield fluctuations, providing strong support for grain reserves and market regulation.
Existing crop yield estimation methods are diverse, primarily including statistical models, crop growth models, and machine learning models []. Statistical models [] and machine learning models [] are similar in nature, as both predict yields based on multiple environmental variables. These methods are user-friendly and transparent but lack a consideration of the intrinsic mechanisms of biophysical processes [,]. Crop growth models (e.g., APSIM [,], AquaCrop [,], CERES [], DSSAT [,], WOFOST []) integrate multidisciplinary elements such as biology, physics, chemistry, and data science, offering advantages in mechanism and temporal continuity, making them powerful tools for simulating crop growth and yield formation. The widely used APSIM model, due to its modular structure, flexibility, data-driven characteristics, and multi-scale, multi-domain applicability, has been extensively applied in crop yield simulation [,,,,,]. Its Oryza module can simulate the entire process of rice growth from sowing to harvest, including physiological processes such as photosynthesis, respiration, and transpiration, as well as interactions with environmental factors like temperature, water, and nutrients, making it widely used in rice yield simulation studies [,]. However, the APSIM model also has limitations. Although APSIM can obtain crop yield data for each grid point in a specific region through batch simulation, the number of grid points that need to be simulated increases exponentially when the resolution is improved, which poses certain difficulties for this task. Also, due to input data quality and simplified crop growth processes, its simulation results often deviate from actual ones []. Existing agricultural observation stations offer high-precision data, but APSIM cannot fully use multiple data sources to enhance resolution and accuracy.
A surface is uniquely determined by both extrinsic and intrinsic measures. Intrinsic measures, which reflect the microscopic details of ecological environments, can be obtained through ground-based observations and spatial sampling. Extrinsic measures, which represent macroscopic global information, can be acquired via satellite remote sensing and spatial modeling []. Considering both can significantly enhance simulation accuracy. However, how to integrate extrinsic and intrinsic information in a theoretically comprehensive way remains a key challenge. To address this, Yue et al. introduced systems theory, optimal control theory, and surface theory into Earth’s surface system modeling and developed the High-Accuracy Surface Modeling (HASM) method. This method effectively synthesizes intrinsic (microscopic process) and extrinsic (macroscopic pattern) information, solving the long-standing surface modeling error and multi-scale problems that have plagued the field for half a century []. This method has been widely applied in climate change analysis [,,,,,,,], soil property simulation [,,,,], ecological environmental element simulation [,], carbon dioxide concentration data fusion [,,,,], the dynamic simulation of population spatial distribution [,,], and the simulation analysis of ecosystem spatial distribution changes [], with significant improvements in accuracy post-application, establishing it as a critical mathematical model in geosciences [,,]. However, its potential coupling with crop models remains unexplored.
Existing studies show that in crop yield estimation, multi-model ensemble approaches, compared to single models, have become an effective way to improve the accuracy of yield estimation [,,,,,,,]. Based on the above theoretical framework and background, this study innovatively proposes the HASM-APSIM coupled model to simulate the yield of double-season rice in Jiangxi, a key double-rice-growing province in southern China, for 2000–2018. This provides a new method and technical approach for the accurate and efficient estimation of double-season rice yields, holding significant theoretical and practical value.
2. Materials and Methods
2.1. Study Area
Jiangxi Province is located in southeastern China, on the southern bank of the middle and lower reaches of the Yangtze River (24°29′–30°04′ N, 113°34′–118°28′ E) within a subtropical humid monsoon climate zone []. The region is characterized by warm and humid conditions, abundant sunlight, and plentiful precipitation, providing ideal climatic conditions for double-season rice cultivation. The topography of Jiangxi is dominated by mountains and hills, with higher elevations in the south and lower in the north. This complex terrain leads to significant variations in climate, soil, and other natural conditions across different regions, which differentially affect double-season rice planting and growth. The province has a well-developed water system, with five major rivers—the Ganjiang, Fuhe, Xinjiang, Raohe, and Xiuhe—traversing the region, ensuring sufficient irrigation resources for double-season rice. As one of China’s critical grain-producing areas, Jiangxi has consistently supplied commercial grain to the nation since the founding of the People’s Republic of China. Rice cultivation dominates agricultural production, with double-season rice accounting for 90% of the total rice planting area, making it the province with the highest proportion of double-season rice cultivation nationwide []. Its production efficiency directly impacts the stability of the grain supply chain in the Yangtze River Economic Belt [].
2.2. Data Sources
The data used in this study include meteorological data, soil data, double-season rice observation data, and agricultural statistical data.
- (1)
- Meteorological Data
The APSIM model simulates rice growth by accounting for processes such as photosynthesis and operates on a daily time step. The required climatic input data include the daily maximum temperature, daily minimum temperature, daily precipitation, daily evaporation, daily relative humidity, and daily solar radiation. This study utilized the China Meteorological Forcing Dataset (CMFD) as the climatic input data.
- (2)
- Soil Data
The APSIM model requires comprehensive soil data, including soil structure parameters (e.g., sand, silt, and clay content), nutrient-related parameters (organic and inorganic matter), and soil water cycle parameters (e.g., soil water content, pH). This study selected the China Soil Organic Matter Dataset produced by Dai Yongjiu’s team (www.tpdc.ac.cn, accessed on 1 June 2023)as the soil input data. Default values were applied for other soil parameters during the simulation.
- (3)
- Double-Season Rice Observation Data
Annual observation data for early and late rice in Jiangxi Province from 2000 to 2018 were obtained from the Jiangxi Agricultural Meteorological Observation Stations, the Jiangxi Cultivated Land Quality Monitoring Dataset (2011–2015), and the related literature [,,,,]. The spatial distribution of observation stations is shown in Figure 1. Station information included latitude and longitude, rice sowing and harvesting dates, yield, and field management practices. These data were used to evaluate the performance of APSIM simulations and served as optimization control conditions for HASM data in constructing the HASM-APSIM model.
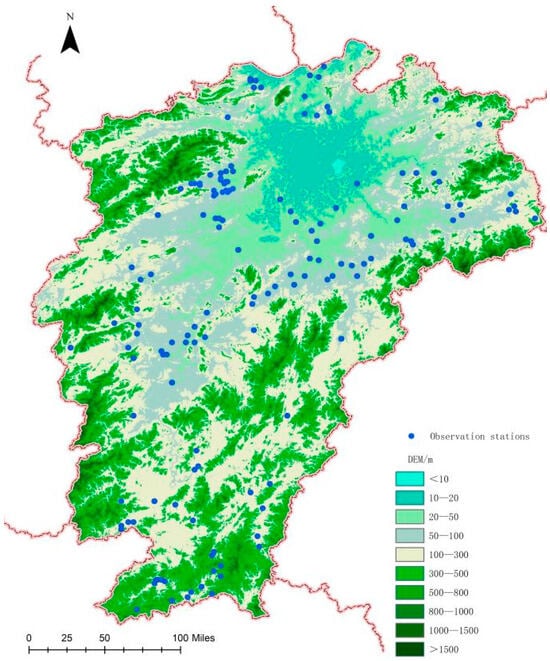
Figure 1.
Spatial distribution of observation stations.
- (4)
- Agricultural Statistical Data
Double-season rice yield data for the study area from 2000 to 2018 were obtained from the Jiangxi Statistical Yearbook (2001–2019).
2.3. Research Methods
2.3.1. Technical Workflow
First, the Nelder–Mead and NSGA-II optimization methods were applied to optimize rice cultivar parameters in the APSIM model using observational data, obtaining localized optimal crop parameters. Subsequently, the optimized parameters were used in APSIM to simulate early and late rice yields in Jiangxi Province from 2000 to 2018 at a coarse spatial resolution. Finally, the HASM method was employed to integrate station-observed double-season rice yield data with APSIM simulation results, generating fine-scale, high-precision yield data. Validation points were used to evaluate the simulation accuracy for both early and late rice (Figure 2).
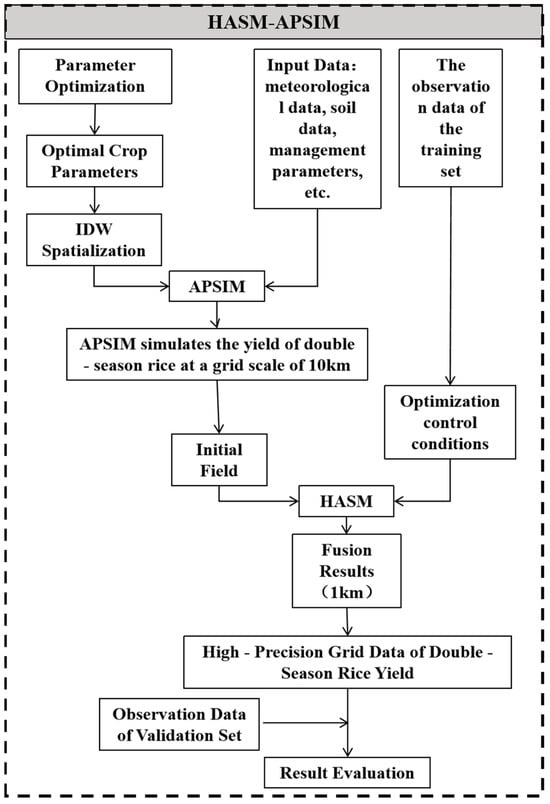
Figure 2.
Technical workflow diagram.
2.3.2. Methods
- (1)
- Nelder–Mead
The Nelder–Mead method, also known as the simplex or downhill simplex algorithm, is a direct search algorithm for solving unconstrained optimization problems, particularly when derivatives of the objective function are unavailable or non-existent. By constructing a geometric shape (simplex), the method iteratively adjusts its shape and position to approach the optimal solution. Key steps include the initialization, iteration (reflection, expansion, contraction, and shrinkage), and termination criteria. This derivative-free algorithm is suitable for nonlinear, multimodal, and non-differentiable optimization problems. Its advantages include simplicity, ease of implementation, robustness to initial values, and the ability to find approximate optimal solutions under diverse conditions [].
To simulate crop growth and development processes, the first step is to adjust the parameters based on the crop variety. In the ORYZA model, approximately 90% of the crop parameters demonstrate universal applicability across all rice varieties [], requiring no calibration. The empirical parameters requiring experimental calibration primarily represent critical crop characteristics that exhibit the most significant response to environmental characteristics. Han et al. [] proposed that the parameters that needs to be adjusted in the ORYZA model are the Developmental Rate Juvenile phase (DVRJ), Developmental Rate Inductive phase (DVRI), Developmental Rate Photoperiod-sensitive phase (DVRP), and Developmental Rate Reproductive phase (DVRR). So, in this study, this method is primarily used to obtain the optimal bounds of the parameters (DVRJ, DVRI, DVRP, DVRR) in APSIM. During actual optimization, 500 iterations are set to acquire the bounds of these four parameters from the obtained set.
- (2)
- NSGA-II
NSGA-II (Non-dominated Sorting Genetic Algorithm II) is a classical multi-objective optimization algorithm widely used to resolve conflicting objectives. It mimics natural selection and genetic mechanisms, balancing solution convergence and diversity through non-dominated sorting, crowding distance calculation, and elitism. The algorithm involves defining objective functions and constraints, initializing a population, performing non-dominated sorting, calculating crowding distances, selecting individuals, applying crossover and mutation, and iterating to generate a Pareto-optimal solution set. NSGA-II reduces the complexity of its predecessor while maintaining fast computation and strong convergence, making it a benchmark for evaluating other multi-objective optimization algorithms [].
In this study, the method is primarily employed to determine the optimal values of the APSIM parameters DVRJ, DVRI, DVRP, and DVRR. The NSGA-II algorithm is configured with a population size of 40 and 20 generations during optimization.
- (3)
- HASM
Yue et al. systematically summarized the development and application of the HASM theory, establishing the fundamental theorem of Earth surface system modeling. They also developed corollaries for spatial interpolation, upscaling, downscaling, data fusion, and model–data assimilation [,]. The principle of HASM is as follows:
If the ecological environmental element surface of a region can be expressed as , the mathematical formulation of HASM is:
Here, are geographic coordinates; represents the value of the ecological environmental element at ; is the -th iteration () of the -surface; , , and are coefficient matrices corresponding to the three equations of the HASM master system; , , and are right-hand term vectors for the three equations, determined by the -th iteration ; , , and are derived from the initial field ; and are the position matrix and observation vector for the ground observation equality constraints, respectively; is the inequality control position matrix; and and are inequality control vectors based on prior knowledge. Machine learning methods can generally be classified into supervised, unsupervised, reinforcement, and hybrid learning. HASM belongs to the reinforcement learning category [].
In this study, we mainly use the data fusion function of HASM. Data fusion integrates multi-source and multi-scale data and knowledge of the same real-world object into a coherent and useful form. Its main goal is to enhance information quality so that the fusion results are more accurate than those from any single data source.
- (4)
- APSIM
The APSIM model [,], developed in Australia, simulates crop growth and development. It includes modules for input, output, plotting, and more, allowing users to modify and optimize it based on practical needs. The Oryza module, specifically designed for simulating rice growth, covers physiological processes such as photosynthesis, respiration, and transpiration, as well as interactions with environmental factors like temperature, water, and nutrients.
In this study, APSIM is used to simulate the historical double-season rice yield in Jiangxi Province.
- (5)
- HASM-APSIM
HASM facilitates the integration of intrinsic and extrinsic information and is highly effective at utilizing diverse data sources. In this study, the HASM-APSIM coupled model we constructed uses the yield results simulated by APSIM as the driving field for HASM, and the yield data observed at stations as the optimization control field. By fusing these data, the model generates a high-resolution and high-accuracy grid data for the historical yield of double-season rice in Jiangxi Province.
2.4. Model Evaluation
After simulations, the accuracy of APSIM-simulated double-season rice yields is evaluated using the root mean square error (RMSE), mean absolute error (MAE), mean absolute percentage error (MAPE), and correlation coefficient (R) based on the validation datasets. RMSE, MAE, and MAPE quantify the deviation between simulated and observed values, with smaller values indicating better model performance. R measures the consistency between simulations and observations, where values closer to 1 signify higher accuracy []. The formulas for these metrics are as follows:
where represents the observation index, denotes the -th simulated value from APSIM or HASM-APSIM, and is the corresponding -th observed value.
3. Results
3.1. Accuracy Validation
3.1.1. Validation of Early Rice Yield Accuracy in Jiangxi Province
A comparison between simulated and observed early rice yields in Jiangxi Province is shown in Figure 3. The results indicate that the HASM-APSIM model significantly outperformed the standalone APSIM model. The correlation coefficient increased from 0.75 to 0.86, RMSE decreased from 838.5 kg/hm2 to 553.21 kg/hm2, MAE reduced from 670.92 kg/hm2 to 460.03 kg/hm2, and MAPE dropped from 11.03% to 7.65%. Furthermore, the simulated results from HASM-APSIM aligned more closely with the regression line compared to APSIM, demonstrating its ability to mitigate the impact of outliers.
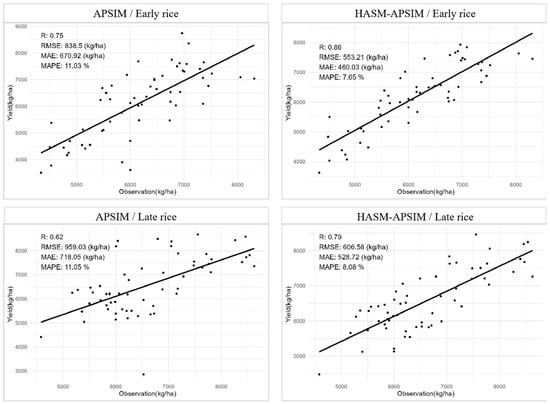
Figure 3.
Comparison between the simulated and observed values of the yield per unit area of double-cropping rice in Jiangxi Province.
3.1.2. Validation of Late Rice Yield Accuracy in Jiangxi Province
A comparison between simulated and observed late rice yields in Jiangxi Province is presented in Figure 3. The HASM-APSIM model also significantly improved the simulation accuracy for late rice. The correlation coefficient rose from 0.62 to 0.79, RMSE decreased from 959.03 kg/hm2 to 606.58 kg/hm2, MAE reduced from 718.05 kg/hm2 to 528.72 kg/hm2, and MAPE declined from 11.05% to 8.08%. The HASM-APSIM simulations aligned more closely with the regression line than APSIM, further confirming its robustness against outlier interference.
3.2. Double-Season Rice Yield Simulation in Jiangxi Province
3.2.1. Early Rice Yield Simulation
Spatially, early rice yields exhibited uneven distribution across the study area (Figure 4). In 2000, high-yield areas were concentrated in the eastern and central regions, while yields in the west and south were generally lower. By 2009, the spatial pattern of high- and low-yield zones remained similar to 2000, but yields in low-yield regions increased slightly. In 2018, yields in the western and northern regions were lower than those in the central and southern areas, with an expansion of low-yield zones compared to 2000 and 2009.
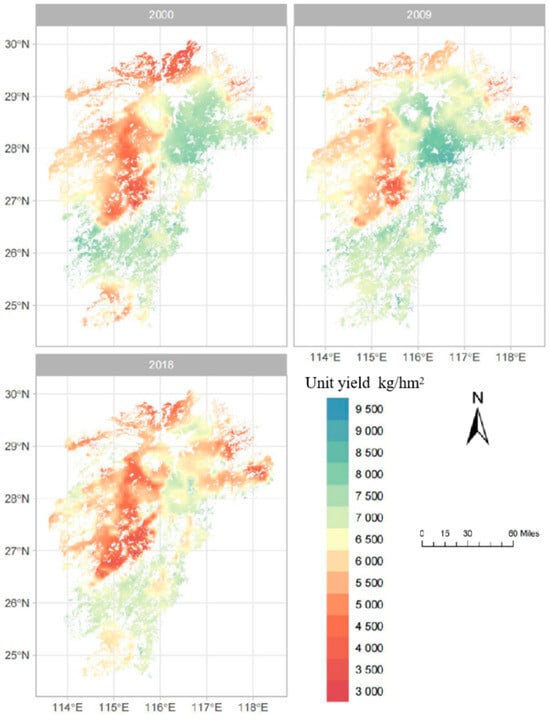
Figure 4.
Spatial distribution of early rice yields in the study area (2000/2009/2018).
Temporal analysis (Figure 5) showed that simulated early rice yields were slightly lower than statistical values from 2016 to 2018 but were higher in other years. The largest discrepancy occurred in 2001 (1524 kg/hm2), gradually decreasing over time to 177.89 kg/hm2 by 2016. Both simulated and statistical yields exhibited fluctuating trends, though simulated yields showed greater variability, while statistical yields remained relatively stable. This divergence may have stemmed from the model’s incomplete incorporation of complex real-world production factors.
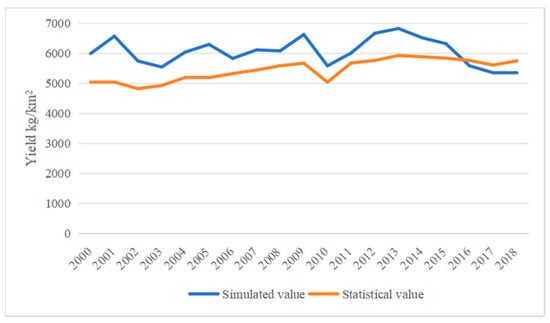
Figure 5.
Comparison of simulated and statistical early rice yields in the study area (2000–2018).
3.2.2. Late Rice Yield Simulation
Spatially, late rice yields were unevenly distributed (Figure 6). From 2000 to 2018, higher yields were consistently observed in the central region, particularly around Poyang Lake, while lower yields prevailed in the west, east, and south. In 2009, yields in previously low-yield areas (2000) improved slightly. By 2018, low-yield zones expanded further, mainly in the western and northern regions.
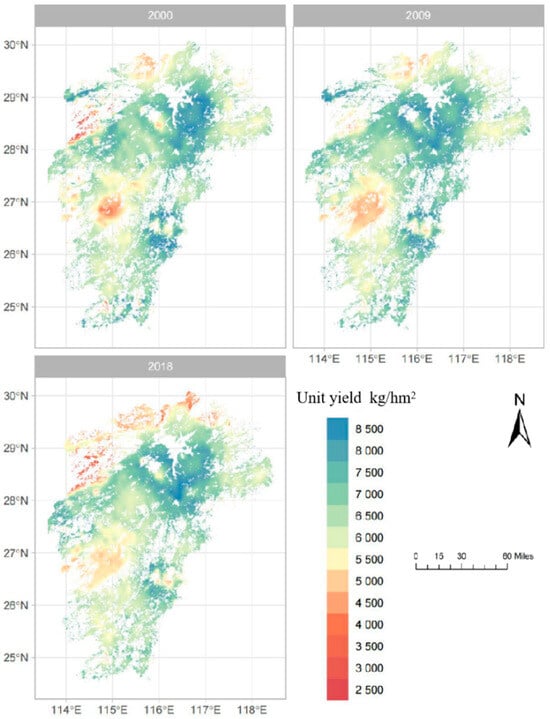
Figure 6.
Spatial distribution of late rice yields in the study area (2000/2009/2018).
Temporally, simulated and statistical late rice yields followed similar fluctuating trends (Figure 7). Simulated yields exhibited greater variability, while statistical yields were smoother, with no clear upward or downward trend. Except for in 2010, simulated yields exceeded statistical values throughout the study period, peaking at a discrepancy of 1633 kg/hm2 in 2001 and dropping to 53 kg/hm2 in 2018. Overall, simulated and statistical yields aligned in numerical distribution and interannual trends, but discrepancies persisted, likely due to unaccounted complexities in actual production. Further investigation is needed to refine the model.
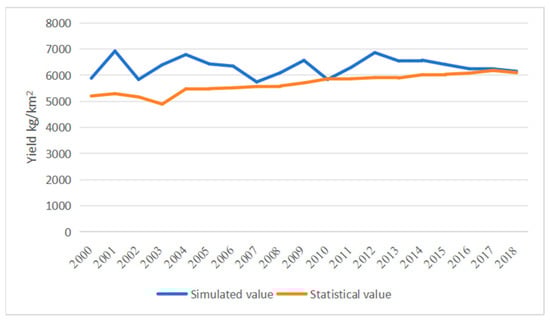
Figure 7.
Comparison of simulated and statistical late rice yields in the study area (2000–2018).
4. Discussion
4.1. Model Accuracy
To enhance the accuracy and spatial resolution of crop model simulations, this study integrated the mechanistic advantages of APSIM with the high-precision surface optimization capabilities of HASM, innovatively constructing the HASM-APSIM model. The results demonstrate that the coupled model significantly outperformed the standalone APSIM model in simulation accuracy. For early rice, the correlation coefficient R increased by 0.11, while RMSE, MAE, and MAPE decreased by 285.29 kg/ha, 210.89 kg/ha, and 3.38%, respectively. For late rice, R improved by 0.17, with RMSE, MAE, and MAPE reduced by 352.45 kg/ha, 189.33 kg/ha, and 2.97%, respectively. These accuracy enhancements enabled the simulations to better reflect actual yield conditions, providing more reliable data support for agricultural decision-making. In terms of spatial resolution, traditional crop growth models exhibit low spatial resolution when applied over large areas, making it challenging to capture regional yield variations. By leveraging the HASM method, this study fused site-observed double-cropping rice yield data with APSIM simulation results, achieving a transition from coarse spatial resolution (10 km APSIM simulation grids) to a fine scale (1 km fused results). This substantial improvement in spatial resolution facilitated a more detailed analysis of the spatial distribution characteristics of double-cropping rice yields, offering robust technical support for the implementation of precision agriculture within the region.
Compared to other methodologies, the proposed model demonstrated distinct advantages. For instance, Wang et al. utilized the conditional vegetation temperature index and leaf area index, which are closely related to maize growth and yield, to estimate maize yields via extreme gradient boosting and random forest algorithms, achieving an R2 of 0.32 []. Zhou et al. reported a correlation R2 of 0.52 between winter wheat yield estimates based on spatiotemporal fused LAI and statistical yield data []. Xu et al. employed a remote-sensing-integrated DSSAT crop model to estimate soybean yields in Jilin Province, China (2008–2017), yielding a correlation coefficient R of 0.59 []. Furthermore, compared to artificial intelligence models such as deep learning, the proposed model exhibited stronger mechanistic interpretability and enhanced transparency in yield estimation.
4.2. Applicability of the Model
From a theoretical perspective, this method exhibits broad generalizability. To apply it in other regions, only the collection of new rice yield data, phenological records, and management practices from agricultural observation stations within the target area are required, while retaining the original APSIM simulation and optimization processes. For applications to other crop types, adjustments are limited to modifying the relevant crop-specific parameters in the APSIM simulation phase. Future studies could further validate this inference through targeted experimental research.
4.3. Model Limitations and Future Directions
Although the HASM-APSIM model demonstrates satisfactory performance in simulating double-cropping rice yields, certain limitations and uncertainties remain. The limited availability of observational data and the model’s restricted consideration of influencing factors—primarily meteorological, soil, and partial management practices—fail to account for pests, diseases, human interventions, and dynamic adjustments in agricultural policies. These omissions may compromise simulation accuracy.
To address these issues, future research could focus on integrating unmanned aerial vehicle and Internet of Things technologies to acquire higher spatiotemporal resolution field data, thereby enriching data sources and enhancing simulation accuracy by incorporating additional influencing factors. Additionally, advancements in quantum computing offer novel opportunities for yield estimation simulations. For example, Yue et al. explore HASM quantum machine learning []. Future studies may further optimize the model by incorporating quantum computing technologies. Addressing these challenges will provide more precise and scientific foundations for regional agricultural planning and decision-making, promoting the sustainable development of double-cropping rice systems.
4.4. Challenges and Countermeasures in Double-Cropping Rice Production in Jiangxi Province
Simulations and statistical results show that since 2000, the average yield of double-season rice in Jiangxi Province has increased slowly. Spatially, there is marked heterogeneity in rice yield. The yield difference between early and late rice is large, with a high proportion of low-yield areas, indicating that there is room for improvement in the rice yield within the study area. Future work should focus on crop variety research to develop high-yield and high-quality varieties. High-standard farmland should be prioritized in high-yield areas like the Poyang Lake region, while low-yield areas need better agricultural infrastructure, especially irrigation and drainage systems. Finally, it is recommended to build a yield prediction platform based on HASM-APSIM to support future production decision-making [].
5. Conclusions
This study integrated the principles of the APSIM and HASM models to develop the HASM-APSIM model, significantly improving the simulation accuracy of double-cropping rice yields in Jiangxi Province. From 2000 to 2018, spatial yield heterogeneity was evident, with high-yield zones for early rice concentrated in the eastern and central regions, while late rice high-yield areas were primarily around Poyang Lake. Interannual variations showed that the simulated yields aligned with statistical data in distribution and trends, though the simulated yields exhibited greater fluctuations.
Author Contributions
Conceptualization, M.Z. and Y.J.; methodology, C.W. and T.Y.; software, W.S.; validation, M.Z. and H.H.; formal analysis, X.Z.; investigation, M.Z.; resources, T.Y.; data curation, Y.J.; writing—original draft preparation, M.Z.; writing—review and editing, M.Z. and Y.Z. (Ying Zhang); visualization, X.G.; supervision, Y.Z. (Yongshou Zhang); project administration, T.Y.; funding acquisition, T.Y. All authors have read and agreed to the published version of the manuscript.
Funding
This work was supported by grants from the Science Fund for Creative Research Groups of the National Natural Science Foundation of China (72221002), the National Natural Science Foundation of China (42330707), the National Key Research and Development Program of China (2024YFD1700904), the Chinese Academy of Sciences Key Research Program in Basic and Interdisciplinary Frontier Sciences (XDB0740100-01), Natural Science Foundation of Henan Province (252300421747), Scientific and Technological Project of Henan Province (252102320001).
Institutional Review Board Statement
Not applicable.
Data Availability Statement
Considering the confidential information involved in the data, the data used in this study is not publicly available. If interested, please contact the corresponding author Prof Yue (yue@lreis.ac.cn) for access.
Conflicts of Interest
The authors declare no conflicts of interest.
References
- Wang, S.B.; Wang, L.X.; Yang, W.T.; Yang, B.J.; Zhou, Q.; Huang, G.Q. Effects of multiple winter cropping on soil organic carbon and double-cropping rice yield in the south of China. Acta Ecol. Sin. 2018, 38, 8. [Google Scholar]
- Deng, N.; Grassini, P.; Yang, H.; Huang, J.; Cassman, K.G.; Peng, S. Closing yield gaps for rice self-sufficiency in China. Nat. Communnat. Commun. 2019, 10, 1725. [Google Scholar] [CrossRef] [PubMed]
- Jiang, M.; Li, X.B.; Xin, L.J.; Tan, M.H. Paddy rice multiple cropping index changes in Southern China: Impacts on national grain production capacity and policy implications. J. Geogr. Sci. 2019, 74, 12. [Google Scholar] [CrossRef]
- Qi, L. Trends and Basic Causes of the Regional Pattern Changes in China’s Grain Production Since 1950’s. Prog. Geogr. 1997, 16, 31–36. [Google Scholar]
- Foley, J.A. Global Consequences of Land Use. Science 2005, 309, 570–574. [Google Scholar] [CrossRef]
- Aravind, K.S.; Vashisth, A.; Krishnan, P.; Kundu, M.; Prasad, S.; Meena, M.C.; Lama, A.; Das, P.; Das, B. Development of multistage crop yield estimation model using machine learning and deep learning techniques. Int. J. Biometeorol. 2025, 69, 499–515. [Google Scholar] [CrossRef] [PubMed]
- Bachinger, J.; Reining, E. An empirical statistical model for predicting the yield of herbage from legume-grass swards within organic crop rotations based on cumulative water balances. Grass Forage Sci. 2009, 64, 144–159. [Google Scholar] [CrossRef]
- Liu, Q.; Yang, M.; Mohammadi, K.; Song, D.; Bi, J.; Wang, G. Machine Learning Crop Yield Models Based on Meteorological Features and Comparison with a Process-Based Model. Artif. Intell. Earth Syst. 2022, 1, e220002. [Google Scholar] [CrossRef]
- Ciais, P.; Reichstein, M.; Viovy, N.; Granier, A.; Ogee, J.; Allard, V.; Aubinet, M.; Buchmann, N.; Bernhofer, C.; Carrara, A. Europe-wide reduction in primary productivity caused by the heat and drought in 2003. Nature 2005, 437, 529–533. [Google Scholar] [CrossRef]
- Lobell, D.B.; Cahill, K.N.; Field, C.B. Historical effects of temperature and precipitation on California crop yields. Clim. Change 2007, 81, 187–203. [Google Scholar] [CrossRef]
- Keating, B.A.; Carberry, P.S.; Hammer, G.L.; Probert, M.E.; Smith, C.J. An overview of APSIM, a model designed for farming systems simulation. Eur. J. Agron. 2003, 18, 267–288. [Google Scholar] [CrossRef]
- Mccown, R.L.; Hammer, G.L.; Hargreaves, J.N.G.; Holzworth, D.P.; Freebairn, D.M. APSIM: A novel software system for model development, model testing and simulation in agricultural systems research. Agric. Syst. 1996, 50, 255–271. [Google Scholar] [CrossRef]
- Li, H.; Liu, Y.; Cai, J.B.; Mao, X.M. The Applicability and Application of AquaCrop Model. J. Irrig. Drain. 2011, 30, 28–33. [Google Scholar]
- Montoya, F.; Camargo, D.; Ortega, J.F.; Córcoles, J.I.; Domínguez, A. Evaluation of Aquacrop model for a potato crop under different irrigation conditions. Agric. Water Manag. 2016, 164, 267–280. [Google Scholar] [CrossRef]
- Soler, C.M.T.; Sentelhas, P.C.; Hoogenboom, G. Application of the CSM-CERES-Maize model for planting date evaluation and yield forecasting for maize grown off-season in a subtropical environment. Eur. J. Agron. 2007, 27, 165–177. [Google Scholar] [CrossRef]
- Alderman, P.D. A comprehensive R interface for the DSSAT Cropping Systems Model. Comput. Electron. Agric. 2020, 172, 105325. [Google Scholar] [CrossRef]
- Xu, C.M.; Tian, Z.Y.; Chen, W.; Liu, J.J.; Bai, J. Simulations and validations of the soybean yields per unit area using DSSAT crop model in the major soybean producing areas of China and America. Trans. Chin. Soc. Agric. Eng. (Trans. CSAE) 2021, 37, 8. [Google Scholar]
- Wang, Z.; Shi, Y.; Hou, C.; Zhang, P. Sensitivity analysis of simulated Lycium barbarum L. yield in the WOFOST model under different climate conditions. Ecol. Model. 2024, 488, 110602. [Google Scholar] [CrossRef]
- Sha, H.; Li, Q.; Sun, X.; Hu, Z.; Qiao, Y.; Ma, W.; Wang, X. Effects of warming and drought stress on winter wheat in Jiangsu Province, China. Agron. J. 2022, 114, 2056–2068. [Google Scholar] [CrossRef]
- Hosseinpour, S.; Pirdashti, H.; Kaveh, M.; Dokoohaki, H.; Mousavi, H. Determination of a Sustainable Management for Rice Production Through a Modeling Approach. Int. J. Plant Prod. 2025, 19, 47–64. [Google Scholar] [CrossRef]
- Robertson, M.J.; Lilley, J.M. Simulation of growth, development and yield of canola (Brassica napus) in APSIM. Crop. Pasture Sci. 2016, 67, 332. [Google Scholar] [CrossRef]
- George, N.A.; Pedro Cuamba, H.D.J.; Lundy, M.E.; Bennett, S.J. Evaluating the Agricultural Production Systems sIMulator (APSIM) wheat module for California. Crop. Pasture Sci. 2024, 75, CP23046. [Google Scholar] [CrossRef]
- Zhao, Z.; Li, Z.; Li, Y.; Yu, L.; Gu, X.; Cai, H. Optimization of water and nitrogen measures for maize-soybean intercropping under climate change conditions based on the APSIM model in the Guanzhong plain, China. Agric. Syst. 2024, 224, 104236. [Google Scholar] [CrossRef]
- Hao, S.; Ryu, D.; Western, A.W.; Perry, E.; Bogena, H.; Franssen, H.J.H. Global sensitivity analysis of APSIM-wheat yield predictions to model parameters and inputs. Ecol. Model. 2023, 487, 110551. [Google Scholar] [CrossRef]
- Radanielson, A.M.; Gaydon, D.S.; Li, T.; Angeles, O.; Roth, C.H. Modeling salinity effect on rice growth and grain yield with ORYZA v3 and APSIM-Oryza. Eur. J. Agron. 2018, 100, 44–55. [Google Scholar] [CrossRef]
- Liu, J.; Liu, Z.; Zhu, A.X.; Shen, F.; Lei, Q.; Duan, Z. Global sensitivity analysis of the APSIM-Oryza rice growth model under different environmental conditions. Sci. Total Environ. 2018, 651, 953–968. [Google Scholar] [CrossRef] [PubMed]
- Luo, Y.; Guo, W. Development and problems of crop models. Trans. Chin. Soc. Agric. 2008, 24, 6. [Google Scholar]
- Yue, T.X.; Liu, Y.; Zhao, M.W.; Du, Z.P.; Zhao, N. A fundamental theorem of Earth’s surface modelling. Environ. Earth Sci. 2016, 75, 751. [Google Scholar] [CrossRef]
- Yue, T.X. Principles and Methods of Earth’s Surface System Modeling and Analysis 2007; Science Press: Beijing, China, 2017. [Google Scholar]
- Zhao, N.; Yue, T.X.; Wang, C.L. Surface modeling of seasonal mean precipitation in China during 1951–2010. Prog. Geogr. 2013, 32, 49–58. [Google Scholar]
- Yue, T.X.; Zhao, N.; Ramsey, R.D.; Wang, C.L.; Fan, Z.M.; Chen, C.F.; Lu, Y.M.; Li, B.L. Climate change trend in China, with improved accuracy. Clim. Change 2013, 120, 137–151. [Google Scholar] [CrossRef]
- Yue, T.; Zhang, L.; Zhao, M.; Wang, Y.; Wilson, J. Space- and ground-based CO2 measurements: A review. Sci. China (Earth Sci.) 2016, 59, 2089–2097. [Google Scholar] [CrossRef]
- Zhao, N.; Yue, T.; Zhou, X.; Zhao, M.; Zhang, L. Statistical downscaling of precipitation using local regression and high accuracy surface modeling method. Theor. Appl. Clim. 2016, 129, 281–292. [Google Scholar] [CrossRef]
- Zhao, N.; Lu, N.; Chen, C.; Li, H.; Yue, T.; Zhang, L.; Liu, Y. Mapping temperature using a Bayesian statistical method and a high accuracy surface modelling method in the Beijing–Tianjin–Hebei region, China. Meteorol. Appl. 2017, 24, 571–579. [Google Scholar] [CrossRef]
- Zhao, N.; Yue, T.; Chen, C.; Zhao, M.; Du, Z. An improved HASM method for dealing with large spatial data sets. Sci. China (Earth Sci.) 2018, 61, 1078–1087. [Google Scholar] [CrossRef]
- Zhao, N.; Yue, T.; Li, H.; Zhang, L.; Yin, X.; Liu, Y. Spatio-temporal changes in precipitation over Beijing-Tianjin-Hebei region, China. Atmos. Res. 2018, 202, 156–168. [Google Scholar] [CrossRef]
- Yue, T.X.; Zhao, N.; Fan, Z.M.; Li, J.; Chen, C.F.; Lu, Y.M.; Wang, C.L.; Gao, J.; Xu, B.; Jiao, Y.M. Methods for simulating climate scenarios with improved spatiotemporal specificity and less uncertainty. Glob. Planet. Change 2019, 181, 102973. [Google Scholar] [CrossRef]
- Li, Q.Q.; Yue, T.X.; Wang, C.Q.; Zhang, W.J.; Yu, Y.; Li, B.; Yang, J.; Bai, G.C. Spatially distributed modeling of soil organic matter across China: An application of artificial neural network approach. Catena 2013, 104, 210–218. [Google Scholar] [CrossRef]
- Li, Q.Q.; Zhang, H.; Jiang, X.Y.; Luo, Y.; Wang, C.Q.; Yue, T.X.; Li, B.; Gao, X.S. Spatially distributed modeling of soil organic carbon across China with improved accuracy. J. Adv. Model. Earth Syst. 2017, 9, 1167–1185. [Google Scholar] [CrossRef]
- Shi, W.; Liu, J.; Du, Z.; Stein, A.; Yue, T. Surface modelling of soil properties based on land use information. Geoderma 2011, 162, 347–357. [Google Scholar] [CrossRef]
- Shi, W.J.; Liu, J.Y.; Du, Z.P.; Yue, T.X. High Accuracy Surface Modeling of Soil Properties Based on Geographic Information. Acta Geogr. Sin. 2011, 66, 8. [Google Scholar]
- Shi, W.J.; Yue, T.X.; Fan, Z.M. An Overview of High Accuracy Surface Modeling of Soil Properties. Procedia Environ. Sci. 2012, 13, 2304–2309. [Google Scholar] [CrossRef]
- Yue, T.X.; Song, D.J.; Zheng-Ping, D.U.; Wang, W. High-accuracy surface modelling and its application to DEM generation. Int. J. Remote. Sens. 2010, 31, 2205–2226. [Google Scholar] [CrossRef]
- Liu, Y.; Yue, T.; Zhang, L.; Zhao, N.; Zhao, M.; Liu, Y. Simulation and analysis of XCO2 in North China based on high accuracy surface modeling. Environ. Sci. Pollut. Res. 2018, 25, 27378–27392. [Google Scholar] [CrossRef] [PubMed]
- Yue, T.X.; Zhao, N.; Fan, Z.M.; Li, J.; Chen, C.F.; Lu, Y.M.; Wang, C.L.; Xu, B.; Wilson, J. CMIP5 downscaling and its uncertainty in China. Glob. Planet. Change 2016, 146, 30–37. [Google Scholar] [CrossRef]
- Zhao, M.; Zhang, X.; Yue, T.; Wang, C.; Jiang, L.; Sun, J. A high-accuracy method for simulating the XCO2 global distribution using GOSAT retrieval data. Sci. China Earth Sci. 2017, 60, 143–155. [Google Scholar] [CrossRef]
- Zhao, M.; Yue, T.; Zhang, X.; Sun, J.; Jiang, L.; Wang, C. Fusion of multi-source near-surface CO2 concentration data based on high accuracy surface modeling—ScienceDirect. Atmos. Pollut. Res. 2017, 8, 1170–1178. [Google Scholar]
- Zhang, L.; Yue, T.; Wilson, J.; Wang, D.; Zhao, N.; Liu, Y.; Liu, D.; Du, Z.; Wang, Y.; Lin, C. Modelling of XCO2 Surfaces Based on Flight Tests of TanSat Instruments. Sensors 2016, 16, 1818. [Google Scholar] [CrossRef]
- Yue, T.X.; Wang, Y.A.; Chen, S.P.; Liu, J.Y.; Qiu, D.S.; Deng, X.Z.; Liu, M.L.; Tian, Y.Z. Numerical Simulation of Population Distribution in China. Popul. Environ. 2003, 25, 141–163. [Google Scholar] [CrossRef]
- Yue, T.X.; Wang, Y.A.; Liu, J.Y.; Chen, S.P.; Qiu, D.S.; Deng, X.Z.; Liu, M.L.; Tian, Y.Z.; Su, B.P. Surface modelling of human population distribution in China. Ecol. Model. 2005, 181, 461–478. [Google Scholar] [CrossRef]
- Yue, T.X.; Wang, Y.A.; Liu, J.Y.; Chen, S.P.; Tian, Y.Z.; Su, B.P. SMPD Scenarios of Spatial Distribution of Human Population in China. Popul. Environ. 2005, 26, 207–228. [Google Scholar] [CrossRef]
- Yue, T.X.; Du, Z.P.; Lu, M.; Fan, Z.M.; Wang, C.L.; Tian, Y.Z.; Xu, B. Surface modeling of ecosystem responses to climatic change in Poyang Lake Basin of China. Ecol. Model. 2015, 306, 16–23. [Google Scholar] [CrossRef]
- Yue, T.X.; Wu, C.C.; Liu, Y.; Du, Z.P.; Zhao, N.; Jiao, Y.M.; Xu, Z.; Shi, W.J. HASM quantum machine learning. Sci. China Earth Sci. 2023, 53, 1958–1966. [Google Scholar] [CrossRef]
- Zhang, L.L.; Zhao, N.; Zhao, M.W.; Chen, C.F.; Du, Z.P.; Song, D.J.; Fan, Z.M.; Shi, W.J.; Wang, S.H.; Yan, C.Q.; et al. A review of recent developments in HASM. Environ. Earth Sci. 2015, 74, 6541–6549. [Google Scholar]
- Yue, T.; Zhao, N.; Liu, Y.; Wang, Y.; Zhang, B.; Du, Z.; Fan, Z.; Shi, W.; Chen, C.; Zhao, M.; et al. A fundamental theorem for eco-environmental surface modelling and its applications. Sci. China Earth Sci. 2020, 63, 1092–1112. [Google Scholar] [CrossRef]
- Jiang, Z.W.; Chen, Z.X.; Ren, J.Q.; Zhou, Q.B. Estimation of crop yield using CERES-Wheat model based on particle filter data assimilation method. Trans. Chin. Soc. Agric. 2012, 28, 138–146. [Google Scholar]
- Song, L.J.; Ye, W.J.; Lu, Z.J.; Fu, B.; Xin, R.; Huang, N.; Wang, M.Y.; Bi, H.W. Review on Data Assimilation of Remote Sensing and Crop Growth Models in Rice. China Rice 2020, 26, 84–89. [Google Scholar]
- Li, W.; Li, M.; Awais, M.; Ji, L.; Li, H.; Song, R.; Cheema, M.J.M.; Agarwal, R. Research on Assimilation of Unmanned Aerial Vehicle Remote Sensing Data and AquaCrop Model. Sensors 2024, 24, 3255. [Google Scholar] [CrossRef]
- Shahhosseini, M.; Hu, G.; Huber, I.; Archontoulis, S.V. Coupling machine learning and crop modeling improves crop yield prediction in the US Corn Belt. Sci. Rep. 2021, 11, 1606. [Google Scholar] [CrossRef]
- Dhillon, M.S.; Dahms, T.; Kuebert-Flock, C.; Rummler, T.; Arnault, J.; Stefan-Dewenter, I.; Ullmann, T. Integrating random forest and crop modeling improves the crop yield prediction of winter wheat and oil seed rape. Front. Remote. Sens. 2023, 3, 1010978. [Google Scholar] [CrossRef]
- Li, Z.; Nie, Z.; Li, G. Integrating Crop Modeling and Machine Learning for the Improved Prediction of Dryland Wheat Yield. Agronomy 2024, 14, 777. [Google Scholar] [CrossRef]
- Feng, P.; Wang, B.; Liu, D.L.; Waters, C.M.; Yu, Q. Incorporating machine learning with biophysical model can improve the evaluation of climate extremes impacts on wheat yield in south-eastern Australia. Agric. For. Meteorol. 2019, 275, 100–113. [Google Scholar] [CrossRef]
- Guerif, M.; Launay, M.; Duke, C. Remote sensing as a tool enabling the spatial use of crop models for crop diagnosis and yield prediction. In Proceedings of the IEEE 2000 International Geoscience and Remote Sensing Symposium, Honolulu, HI, USA, 24–28 July 2000. [Google Scholar]
- Zhang, F.L.; Liu, W.Y.; Tian, J.; Wang, J.J.; Liu, D.; Yang, J.; Li, Y.C.; Zhang, Y.Z. Simulating effects of climate change on growth season and yield of double cropping rice in Jiangxi province based on DSSAT model. Acta Agron. Sin. 2024, 50, 2614–2624. [Google Scholar]
- Duan, L.C.; Zhang, K.; Guo, R.G.; Cai, Z.; Wang, J.J.; Liu, D. Regional Division of Suitable Direct Sowing Date of Double Season Early Rice in Jiangxi Province. Chin. J. Agrometeorol. 2021, 42, 112. [Google Scholar]
- Guo, X.; Huang, J.; Zhu, A.F.; Lai, J.C.; Xie, W.; Zhao, X.M. A Study on Early Rice Yield Estimation Based on TM Image in Southern Hill Regions—A Case Study of Fengxin County. Acta Agric. Univ. Jiangxiensis 2010, 32, 1103–1108. [Google Scholar]
- Tang, J.; Huang, S.; Tan, X.M.; Shi, Q.H.; Pan, X.H. Effect of Different Tillage Regimes on Rice Yield under Mechanical Transplanting in A Double Rice Cropping System. Acta Agric. Univ. Jiangxiensis 2014, 36, 996–1001. [Google Scholar]
- Yang, B.J.; Wang, L.X.; Yuan, J.X.; Huang, G.Q. Study on different winter crops and multiple cropping patterns on rice yield and soil nitrogen characteristics in middle reaches of Yangtze River. Ecol. Sci. 2021, 40, 75–82. [Google Scholar]
- Tang, G.; Liao, P.; Sui, F.; Lu, W.S.; Zhang, J.; Ceng, Y.J.; Huang, S. Effects of Moldboard Plow Tillage under all Straw Returning in Late Rice Season on Greenhouse Gas Emissions and Yield in Double Rice-Cropping System. Crops 2021, 101–107. [Google Scholar]
- Chen, A.Q.; Lei, B.K.; Lu, Y.; Mao, Y.T.; Zhang, D. Study on nitrogen application rate tolerance based on rice yield and ecological security in hilly areas of South China. Trans. Chin. Soc. Agric. 2013, 29, 131–139. [Google Scholar]
- Stanisic, S.M.; Radakovic, Z.R. Method for characterization of soil electrical resistivity based on Wenner measurements by means of Nelder-Mead algorithm and FEM calculations. Electr. Eng. 2023, 105, 4427–4441. [Google Scholar] [CrossRef]
- Bouman, B.A.M.; van Laar, H.H. Description and evaluation of the rice growth model ORYZA2000 under nitrogen-limited conditions. Agric. Syst. 2006, 87, 249–273. [Google Scholar] [CrossRef]
- Han, X.Y.; Jing, Y.S.; Hao, Y.; Geng, L.N. The Comparison of Regional Parameters of ORYZA2000 Based on The Field Test. J. Arid. Meteorol. 2013, 31, 37–42. [Google Scholar]
- Deb, K.; Pratap, A.; Agarwal, S.; Meyarivan, T. A fast and elitist multiobjective genetic algorithm: NSGA-II. IEEE Trans. Evol. Comput. 2002, 6, 182–197. [Google Scholar] [CrossRef]
- Wang, Y.H.; Wang, M.L.; Yan, H.M.; Yang, J.Y.; Shi, W.J. Estimating maize yield in Jilin Province of China using VPM model combined with conversion coefficient. Trans. Chin. Soc. Agric. Eng. (Trans. CSAE) 2024, 40, 195–201. [Google Scholar]
- Wang, P.X.; Qiao, C.; Li, L.; Zhou, X.J.; Xu, L.X.; Hu, Y.J. Estimation of Maize Yield Based on Shapley Value Combination Forecasting. Trans. Chin. Soc. Agric. Mach. 2021, 52, 221–229. [Google Scholar]
- Zhou, X.J.; Zhang, Y.; Wang, P.X.; Zhang, S.Y.; Li, H.M.; Tian, H.R. Reconstruction of Time Series LAI and Winter Wheat Yield Estimation at Field Scales Based on Sentinel Satellites. Trans. Chin. Soc. Agric. Mach. 2022, 53, 173–185. [Google Scholar]
- Huang, G.Q. Achievements, problems and strategic countermeasures of development of paddy field farming systems in Southern China. J. Huazhong Agric. Univ. 2022, 41, 1–20. [Google Scholar]
Disclaimer/Publisher’s Note: The statements, opinions and data contained in all publications are solely those of the individual author(s) and contributor(s) and not of MDPI and/or the editor(s). MDPI and/or the editor(s) disclaim responsibility for any injury to people or property resulting from any ideas, methods, instructions or products referred to in the content. |
© 2025 by the authors. Licensee MDPI, Basel, Switzerland. This article is an open access article distributed under the terms and conditions of the Creative Commons Attribution (CC BY) license (https://creativecommons.org/licenses/by/4.0/).