Article

Design and Experiment of Dual Flexible Air Duct Spraying Device for Orchards

1
College of Mechanical and Electrical Engineering, Hebei Agricultural University, Baoding 071000, China
2
College of Science and Technology, Hebei Agricultural University, Huanghua 061100, China
3
Hebei Province Smart Agriculture Equipment Technology Innovation Center, Baoding 071001, China
*
Author to whom correspondence should be addressed.
Agriculture 2025, 15(10), 1031; https://doi.org/10.3390/agriculture15101031
Submission received: 14 April 2025 / Revised: 8 May 2025 / Accepted: 8 May 2025 / Published: 9 May 2025
(This article belongs to the Section Agricultural Technology)

Abstract

:
To address uneven airflow distribution and pesticide deposition coverage in orchard pesticide application, we developed a double-flexible duct spraying device. Utilizing FLUENT 2022 software for airflow field simulation, we analyzed various structural parameters to identify optimal configurations for the air duct type, diameter, and nozzle outlet diameter. The results indicated that the nozzle outlet diameter most significantly influences wind field uniformity, followed by the air duct diameter and type. The optimal settings were identified as follows: C-Type air duct, 100 mm duct diameter, and 50 mm nozzle outlet diameter. Validation tests confirmed these settings, with simulated and actual wind speed measurements, showing no more than a 10% relative error, affirming the simulation’s accuracy. Field tests demonstrated an average droplet density of 35.38 droplets/cm2 within tree canopies, indicating strong penetration ability. Droplet distribution followed a lower > middle > upper pattern in the canopy’s vertical direction, fulfilling technical requirements for high spindle-shaped fruit trees and providing a foundation for achieving a uniform canopy coverage.

1. Introduction

Pest and disease control holds a vital position in orchard production management [1]. By optimizing the match between air-assisted spraying technology and tree characteristics, pesticide deposition can be improved and droplet drift reduced, providing important technical support for orchard sprayer performance research [2,3]. The high-speed rotation of the fan generates airflow that further atomizes the pesticide solution into finer droplets, enhancing droplet deposition uniformity within the tree canopy by disturbing the canopy structure [4,5,6]. The air-assisted system of an orchard sprayer mainly consists of a fan and an air-guiding device. Due to the complexity of airflow field characteristics, researchers widely apply computational fluid dynamics (CFD) [7,8,9,10] for simulation analyses, involving devices such as annular guide plates [11], conical multi-exit devices [12], multi-fan-assisted sprayers [13,14], and tower-type rectifiers [15]. The multi-duct system designed by Yang Xin [16] enhanced the vertical uniformity of droplet deposition within the canopy. The technique proposed by Jiang Honghua et al. [17] utilized canopy characteristics to adjust airflow in real-time, significantly increasing droplet deposition. Li Longlong et al. [18] achieved flexible airflow adjustment through empirical formulas. Duga A T [19] developed a three-dimensional dynamic model combining tree morphology and airflow field to suppress droplet drift. Ding Tianhang [20] analyzed the airflow field distribution in single-fan and dual-fan dual-duct structures. Qiu Wei et al. [21] designed guide plates and adjustment plates to regulate airflow, but the response speed was slow. Wang Jie et al. [22] studied the changes in wind speed and pressure in multi-exit devices. Although there has been extensive research on theories of airflow velocity and volume requirements, methods for wind and mist field distribution, and airflow adjustment technologies [23,24,25], there are still deficiencies in optimizing the structure, adaptability, and real-time performance of air-assisted systems [26,27,28,29].
In summary, although significant progress has been made in the theory and application of air-assisted spraying technology, several research gaps remain: there is a lack of optimized designs for different tree morphologies, particularly in tall spindle-shaped trees, where spray uniformity and pesticide deposition rates still require improvement; research on the application of flexible ducts is limited, with a lack of trials and validations under real orchard conditions, restricting their widespread application; and the existing air-assisted systems mostly focus on overall airflow regulation, lacking research on precise local control of wind speed and volume, making it difficult to meet deposition needs across different canopy parts.
To address this, the present study designed a dual flexible duct spraying device for orchard operations targeting tall spindle-shaped tree canopies. Based on the airflow and pressure requirements for spraying, and using simulation and experimental validation methods, a systematic analysis was conducted on the effects of duct type, duct diameter, and nozzle outlet diameter on airflow distribution and droplet deposition density, leading to an optimized design proposal. Field experiments verified the feasibility and superiority of the designed spraying device in enhancing pesticide coverage and meeting technical requirements for pest and disease control in orchards. This study can provide a reference and support for optimizing air-assisted system structures and advancing precision spraying technology in orchards.

2. Materials and Methods

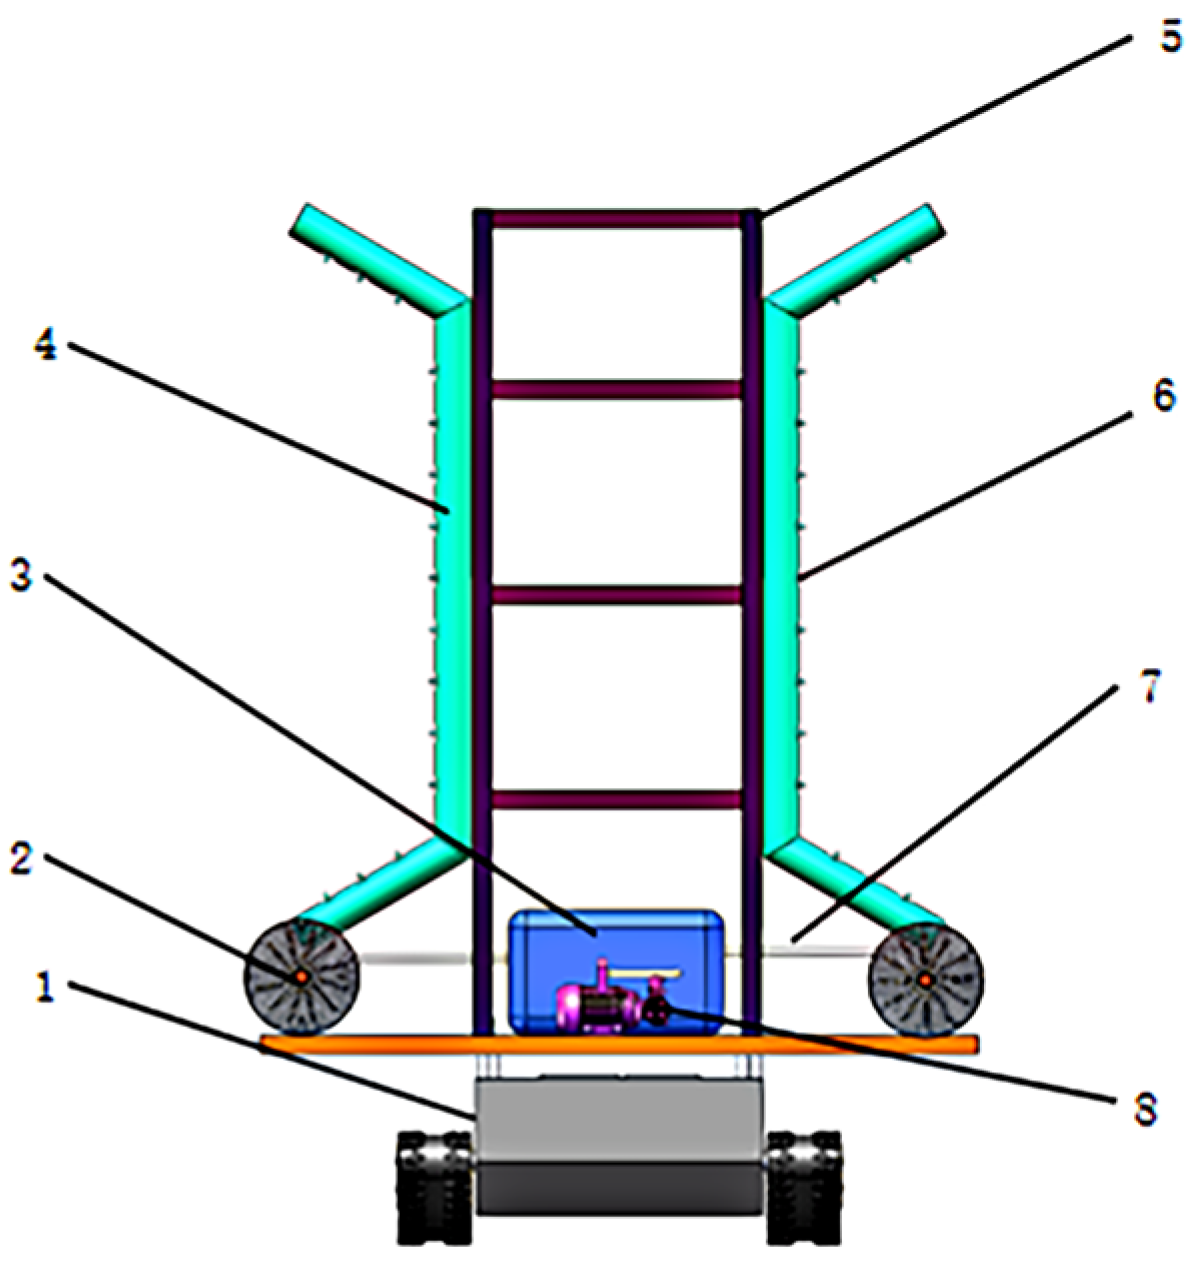
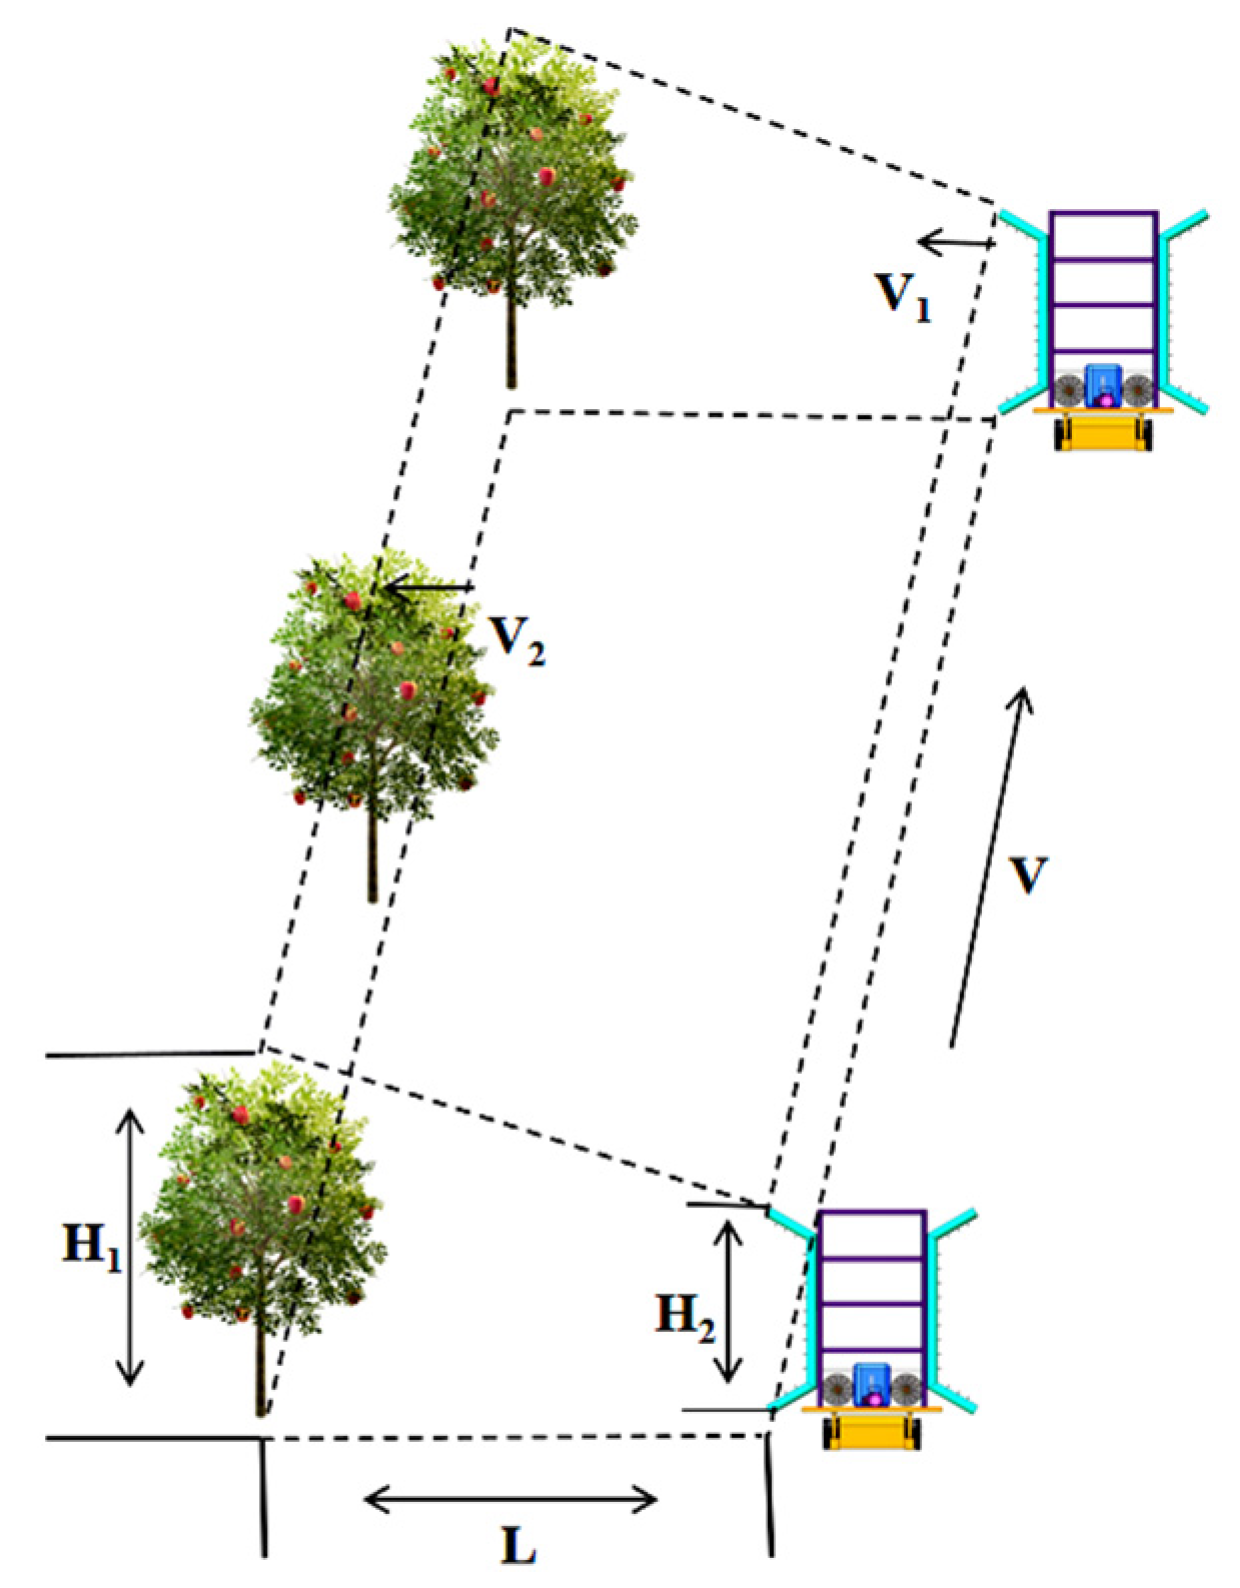
2.1. Double Flexible Duct Spraying Device Working Principle

The orchard double flexible duct spray device consists of an electric chassis, axial fan, pesticide tank, flexible duct, bracket, Ge qiang 65 series nozzle (Geqiang Spray Nozzle, Guiyang, China), liquid pipe, plunger pump, and other working parts, as shown in Figure 1, and the detailed parameters can be found in Table 1. The device works through the electric chassis drive axial fan and electric plunger pump. The axial fan generates high-speed airflow through the flexible duct guide to form a directional airflow field, and the formation of a stable wind screen envelopes the fruit tree canopy. The electric plunger pump produces pesticide tank liquid pressurization via liquid pipe delivery to the nozzle, through the atomization of the formation of uniform droplets. At the flexible duct outlet of the high-speed airflow, atomized droplets will be wrapped in the formation of aerosol mixing flow, by virtue of directional pneumatic power, to penetrate the canopy of the fruit tree. In this way, droplets reach the branches and leaves on the front and back sides and pass inside for precise coverage, to enhance the liquid reach.

2.2. Dual Flexible Ductwork Design

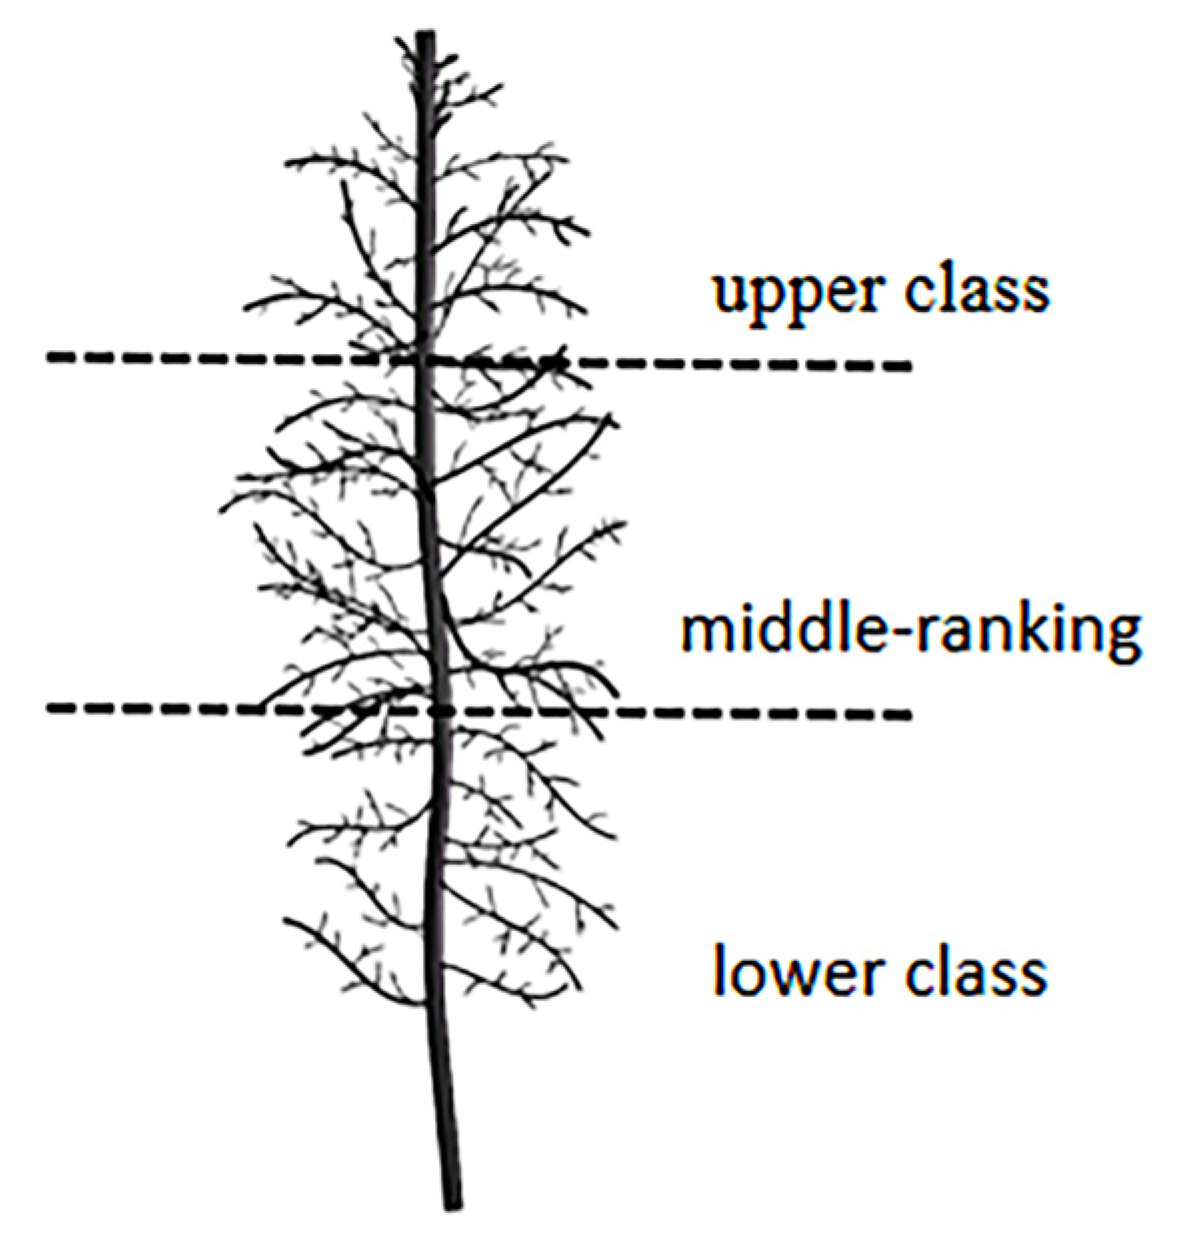
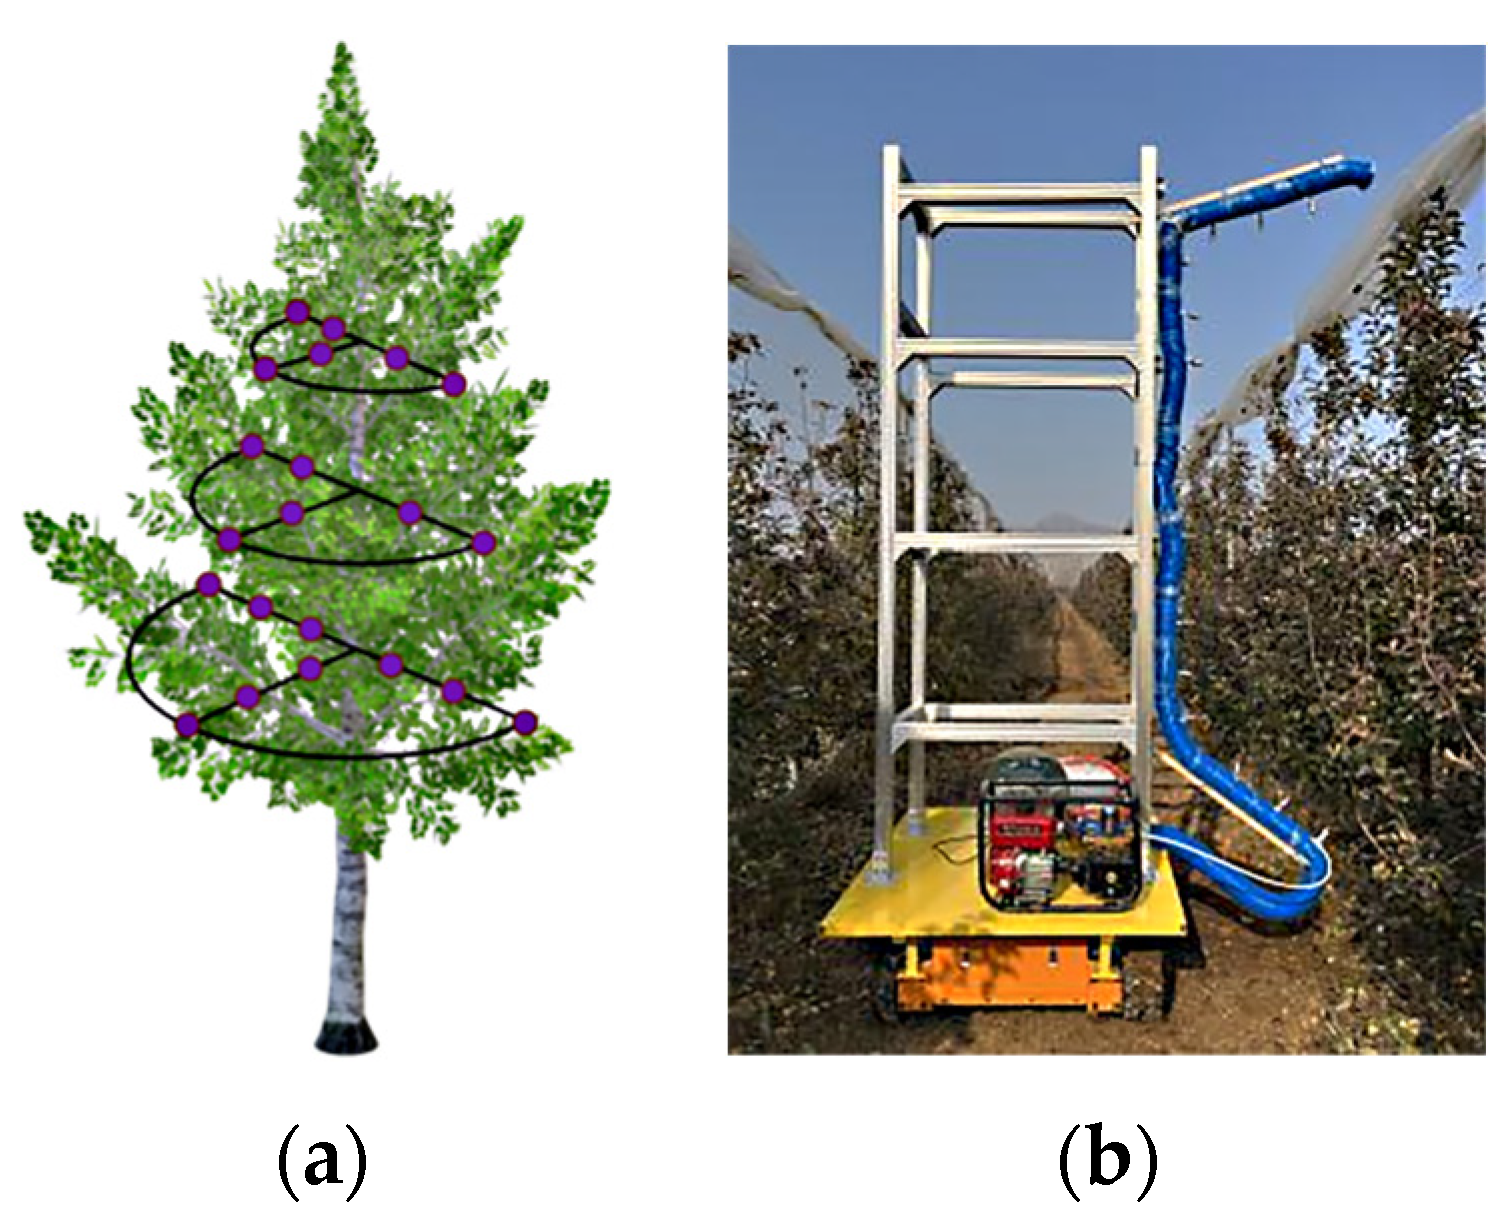
2.2.1. Analysis of Fruit Tree Shape and Canopy Structure

The main trunk of the high imitation pendant apple fruit tree is kept upright, with the main branches extending vertically from it and evenly distributed to form an open canopy. The plant spacing is between 1.0 and 1.2 m, with row spacing ranging from 3.5 to 4.0 m. The tree height is between 3.5 and 4.0 m, and the crown spread is 1.5 to 2.0 m, as illustrated in Figure 2. Based on the spindle-shaped canopy distribution characteristics, the canopy is analyzed in terms of application needs for different segments. Due to the irregular characteristics of the canopy, it is divided vertically into three layers: the upper layer (3.0 to 4.0 m), the middle layer (1.5 to 3.0 m), and the lower layer (0.5 to 1.5 m). The canopy is larger in the middle and smaller at the ends, and these characteristics significantly affect the resistance and attenuation of airflow within the canopy.

2.2.2. Structural Design of Flexible Ducts

In this study, three flexible duct spraying devices were designed to adapt to the canopy morphology of fruit trees, enabling airflow wind speed transformation through the use of modular flexible ducts, as illustrated in Figure 3. The device adopts a multi-stage flexible pipe structure, by adjusting the angle of adjacent pipe segments (120°–150°) and pipe diameter parameters (duct diameter 60–140 mm, air outlet diameter 20–60 mm), to build the air duct and the fruit tree canopy three-dimensional morphology to match the airflow field, to achieve the precise delivery of spray droplets. The Type A device adopts a five-section structure, where each section is connected at an angle of 150°, and the design can generate a continuous curved airflow wind field along the outer contour of the canopy to ensure the effective deposition of droplets on the surface of the canopy. The Type B four-section device adopts a 150°–150°–120° tapering angle configuration, focusing on strengthening the airflow superposition effect in the middle and upper layers of the canopy, while eliminating the airflow blind spot of the traditional device in the region of a larger crown diameter. The Type C three-section unit features a symmetrical 120° bifurcated structure that synchronizes penetration coverage at the top and at the base of the canopy via airflow channels that are extended both upward and downward.

2.3. Analysis of Wind Volume and Wind Resistance

2.3.1. Calculation of Airflow

Fan performance directly affects the spray effect of the orchard sprayer. Wind-driven sprayers require that the exit airflow have some kinetic energy in order to reach the inside of the fruit tree canopy; the airflow carrying the droplets can expel and replace the air between the sides of the sprayer and the fruit tree. The principle of replacement and the principle of terminal velocity [30] were used to determine the optimal wind-propelled sprayer for the orchard, as shown in Figure 4.
According to the principle of replacement, the air volume generated by the fan must completely replace the air in the entire space of the fruit tree. The air volume calculation formula is as follows:
Q d = v m L K 1 2 ( H 1 + H 2 )
Qd—spray machine single-side outlet air volume, m3/s;
H1—spray machine spray height, m;
H2—tree height, m;
L—distance between the air outlet and the trunk, m;
vm—sprayer walking speed, m/s;
K1—taking into account the attenuation of the airflow and the loss along the coefficient determined, generally take 1.3~1.6.
According to the principle of terminal velocity, the air volume through the cross-section is equal, and the airflow velocity at the outlet of the sprayer is obtained as follows:
v 1 = H 2 v 2 H 1 K 2
v1—sprayer outlet air velocity, m/s;
v2—airflow to reach the trunk of the fruit tree speed, m/s;
K2—with meteorological conditions, crop varieties, and branches’ and leaves’ denseness and other factors, generally take 1.3~1.8.
The orchard double flexible duct spray device is mainly used for high fusiform apple tree application. The airflow to reach the fruit tree at the end of the velocity is optimal for v2 for 9~10 m/s, while the other parameters are optimal with H1 for 1.5 m, H2 for 3.5~4 m, L for 1.2 m, and Vm for 0.5~1 m/s. Substitution of the formula can be derived from v1 for 11.67~20.51 m/s and Qd for 1.95~5.28 m3/s.
In order to ensure that the air volume is sufficient for larger plants, with a proposed optimal v1 for 20.00 m/s and Qd for 4 m3/s, that is, 14,400 m3/h, check the “New Fan Selection and Design Practical Manual” to choose the air volume of a 18,700 m3/h SF axial fan.
The orchard wind sprayer requires both a certain kinetic energy of the airflow at the outlet to reach the interior of the canopy and a certain pressure at the inlet of the fan [31], calculated as dynamic pressure loss:
p = ρ v 2 2
p—air pressure at the outlet of the sprayer, Pa;
ρ—air density, kg/m3;
v—air velocity, m/s;
The reference values are as follows: ρ is 1.2 kg/m3, v is 20 m/s, and p is calculated to be 240 Pa.

2.3.2. Calculation of Wind Resistance

The outlet wind speed of an orchard air-delivery application system is a key parameter that determines the quality of droplet deposition. Currently, the industry typically uses “canopy surface arrival wind speed” as the primary evaluation criterion for this parameter. In view of the short distance between the sprayer outlet and the fruit tree canopy in this study and the low wind speed in the field at the time of the test, the airflow energy attenuation phenomenon in the outer region of the canopy can be ignored. Based on the porous medium theory [32], this study equates the fruit tree canopy structure to a porous medium model, and the momentum equation is modified by introducing the momentum additional source term Sm, in order to characterize the momentum loss generated during the airflow penetration through the canopy along the horizontal x-axis.
S m = j = 1 3 D i j μ μ j + j = 1 3 C ij 1 2 ρ u μ j
u—airflow velocity vector;
μj—airflow velocity vector in direction j;
μ—fluid viscosity coefficient, which indicates the mass density of airflow, kg/m3;
Dij—matrix of viscous drag coefficient;
Cij—matrix of inertial drag coefficient.
Since the viscosity coefficient term is small and the velocity perpendicular to the flow direction is neglected [33], the momentum loss Sm of the horizontal flow reaching the trunk simplifies to
S m = 1 2 C f ρ μ 1 μ 1
Cf—drag coefficient, determined by the value of the canopy thinning rate, where the measured value of the canopy thinning rate is 1.8;
μ1—velocity vector of the airflow at the outlet in the horizontal direction.
According to the constant flow momentum equation, there are
q m μ 2 μ 1 = S m A q m = ρ μ 1 A
The simplified formula can be obtained:
μ 2 μ 1 = 1 2 C f μ 1
qm—gas mass flow rate, kg/s;
μ2—airflow velocity at the trunk, m/s;
A—cross-sectional area of the air outlet, with 2.9 × 10⁻² in the structure of this paper, m2.
When combining an outlet airflow velocity μ1 of 10.67~20.51 m/s to derive a horizontal airflow velocity μ2 of 1.07~2.05 m/s within the inner chamber of the canopy, it is found that the kinetic energy of the airflow can effectively agitate the surfaces of branches and leaves. This significantly enhances the deposition efficiency of spray droplets on leaf surfaces.

2.4. Analysis of Drug Flow Resistance

2.4.1. Calculation of Along-Stream Pressure Loss

When pharmaceutical fluid flows through the delivery pipe, the pipe length, fluid flow rate, and pipe diameter are directly related due to frictional resistance between the fluid and the pipe wall and mechanical energy loss.
Δ P 1 = f L D ρ v 3 2 2
f—friction coefficient (related to Reynolds number Re and pipe wall roughness);
L—pipe length, m;
D—pipe inner diameter, m;
v3—average fluid flow rate, m/s;
ρ—fluid density, kg/m3.
Determination of the friction coefficient f turbulence:
R e = ρ v 3 D μ f = 0.25 log ε / D 3.7 + 5.74 Re 0.9 2 0.25 log 0.015 / 0.01 3.7 + 5.74 20000 0.9 2
ε is 0.015 (PVC pipe roughness), ρ is 1000 kg/m3, μ is 0.001, v3 is taken as 2 m/s, L is 5.3 m, D is 0.01 m, f is 0.13, and ∆p1 is 137,800 Pa.

2.4.2. Calculation of Local Pressure Loss

When pharmaceutical fluids flow through abrupt structural changes in the piping system, the sudden alteration in flow channel shape triggers fluid separation, vortex formation, and kinetic energy dissipation, leading to mechanical energy loss. This loss is characterized by concentrated energy dissipation in local areas, and the magnitude of the energy loss is proportional to the square of the fluid flow rate.
Δ P 2 = K ρ v 3 2 2
K—local resistance coefficient (0.3~1.1);
v3—fluid flow rate (m/s);
We calculated ∆p2 to be 600~2200 Pa.

2.4.3. Pump and Nozzle Flow Analysis

The sprayer plunger pump can be converted into high-pressure liquid, atomized by the nozzle sprayed on the fruit trees, but there is a need to choose a good performance. With the work process requirements, the flow rate and pressure have a strong adaptability and assurance, and according to the required liquid flow rate and the number of nozzles, we can determine the flow rate of the nozzle threshold range.
Q = M v m B 600 q = Q 15
Q—total flow of liquid sprayed by the applicator, L/min;
M—amount of medicine per unit area of the orchard, L/ha;
vm—speed of movement of the sprayer application, km/h;
B—row spacing (operating width), m;
q—individual spray nozzle flow, L/min.
The modern orchard dosage in 700~800 L/ha, with a spray machine field application speed of 0.5~1 m/s and where B = 3.5~4 m. When substituting the values into the equation, you can find the total flow of liquid solution of the applicator at 2.04~5.33 L/min.
Nozzle type: Ge qiang 65 series high-pressure fan-shaped nozzle, with a flow range of 0.14 to 0.35 L/min, an atomization angle of 65°, and a required pressure of 1 MPa.
Required liquid pump displacement calculation equation:
D = k n q + V R × 12 %
D—liquid pump displacement, L/min;
K—liquid pump flow coefficient, take 1.05~1.1;
n—number of spray nozzles, one;
q—individual nozzle flow, L/min;
VR—nozzle liquid tank volume, L.
The volume of the pesticide tank is 150 L, and the liquid pump displacement is calculated to be 20.21~23.78 L/min. According to the size of the displacement, the liquid pump used for medicine application is selected as a 26-type plunger pump, which has a displacement of 15~25 L/min, a pressure of 1~4.5 MPa, and a rotational speed of 800~1400 r/min.

3. Results

The air duct is a core component of the orchard dual flexible duct spray system, connected to an axial fan to channel airflow toward the nozzle outlet. To examine how different parameters affect the wind speed variation at the outlet, structural optimization and simulation analysis were performed. Based on preliminary experimental results, a Type C duct was selected, and key parameters influencing wind speed were initially identified through single-factor tests. Reasonable ranges for both the duct diameter and the nozzle outlet diameter were established to enhance data accuracy and avoid outliers.

3.1. One-Way Test for Analysis of Duct Parameters

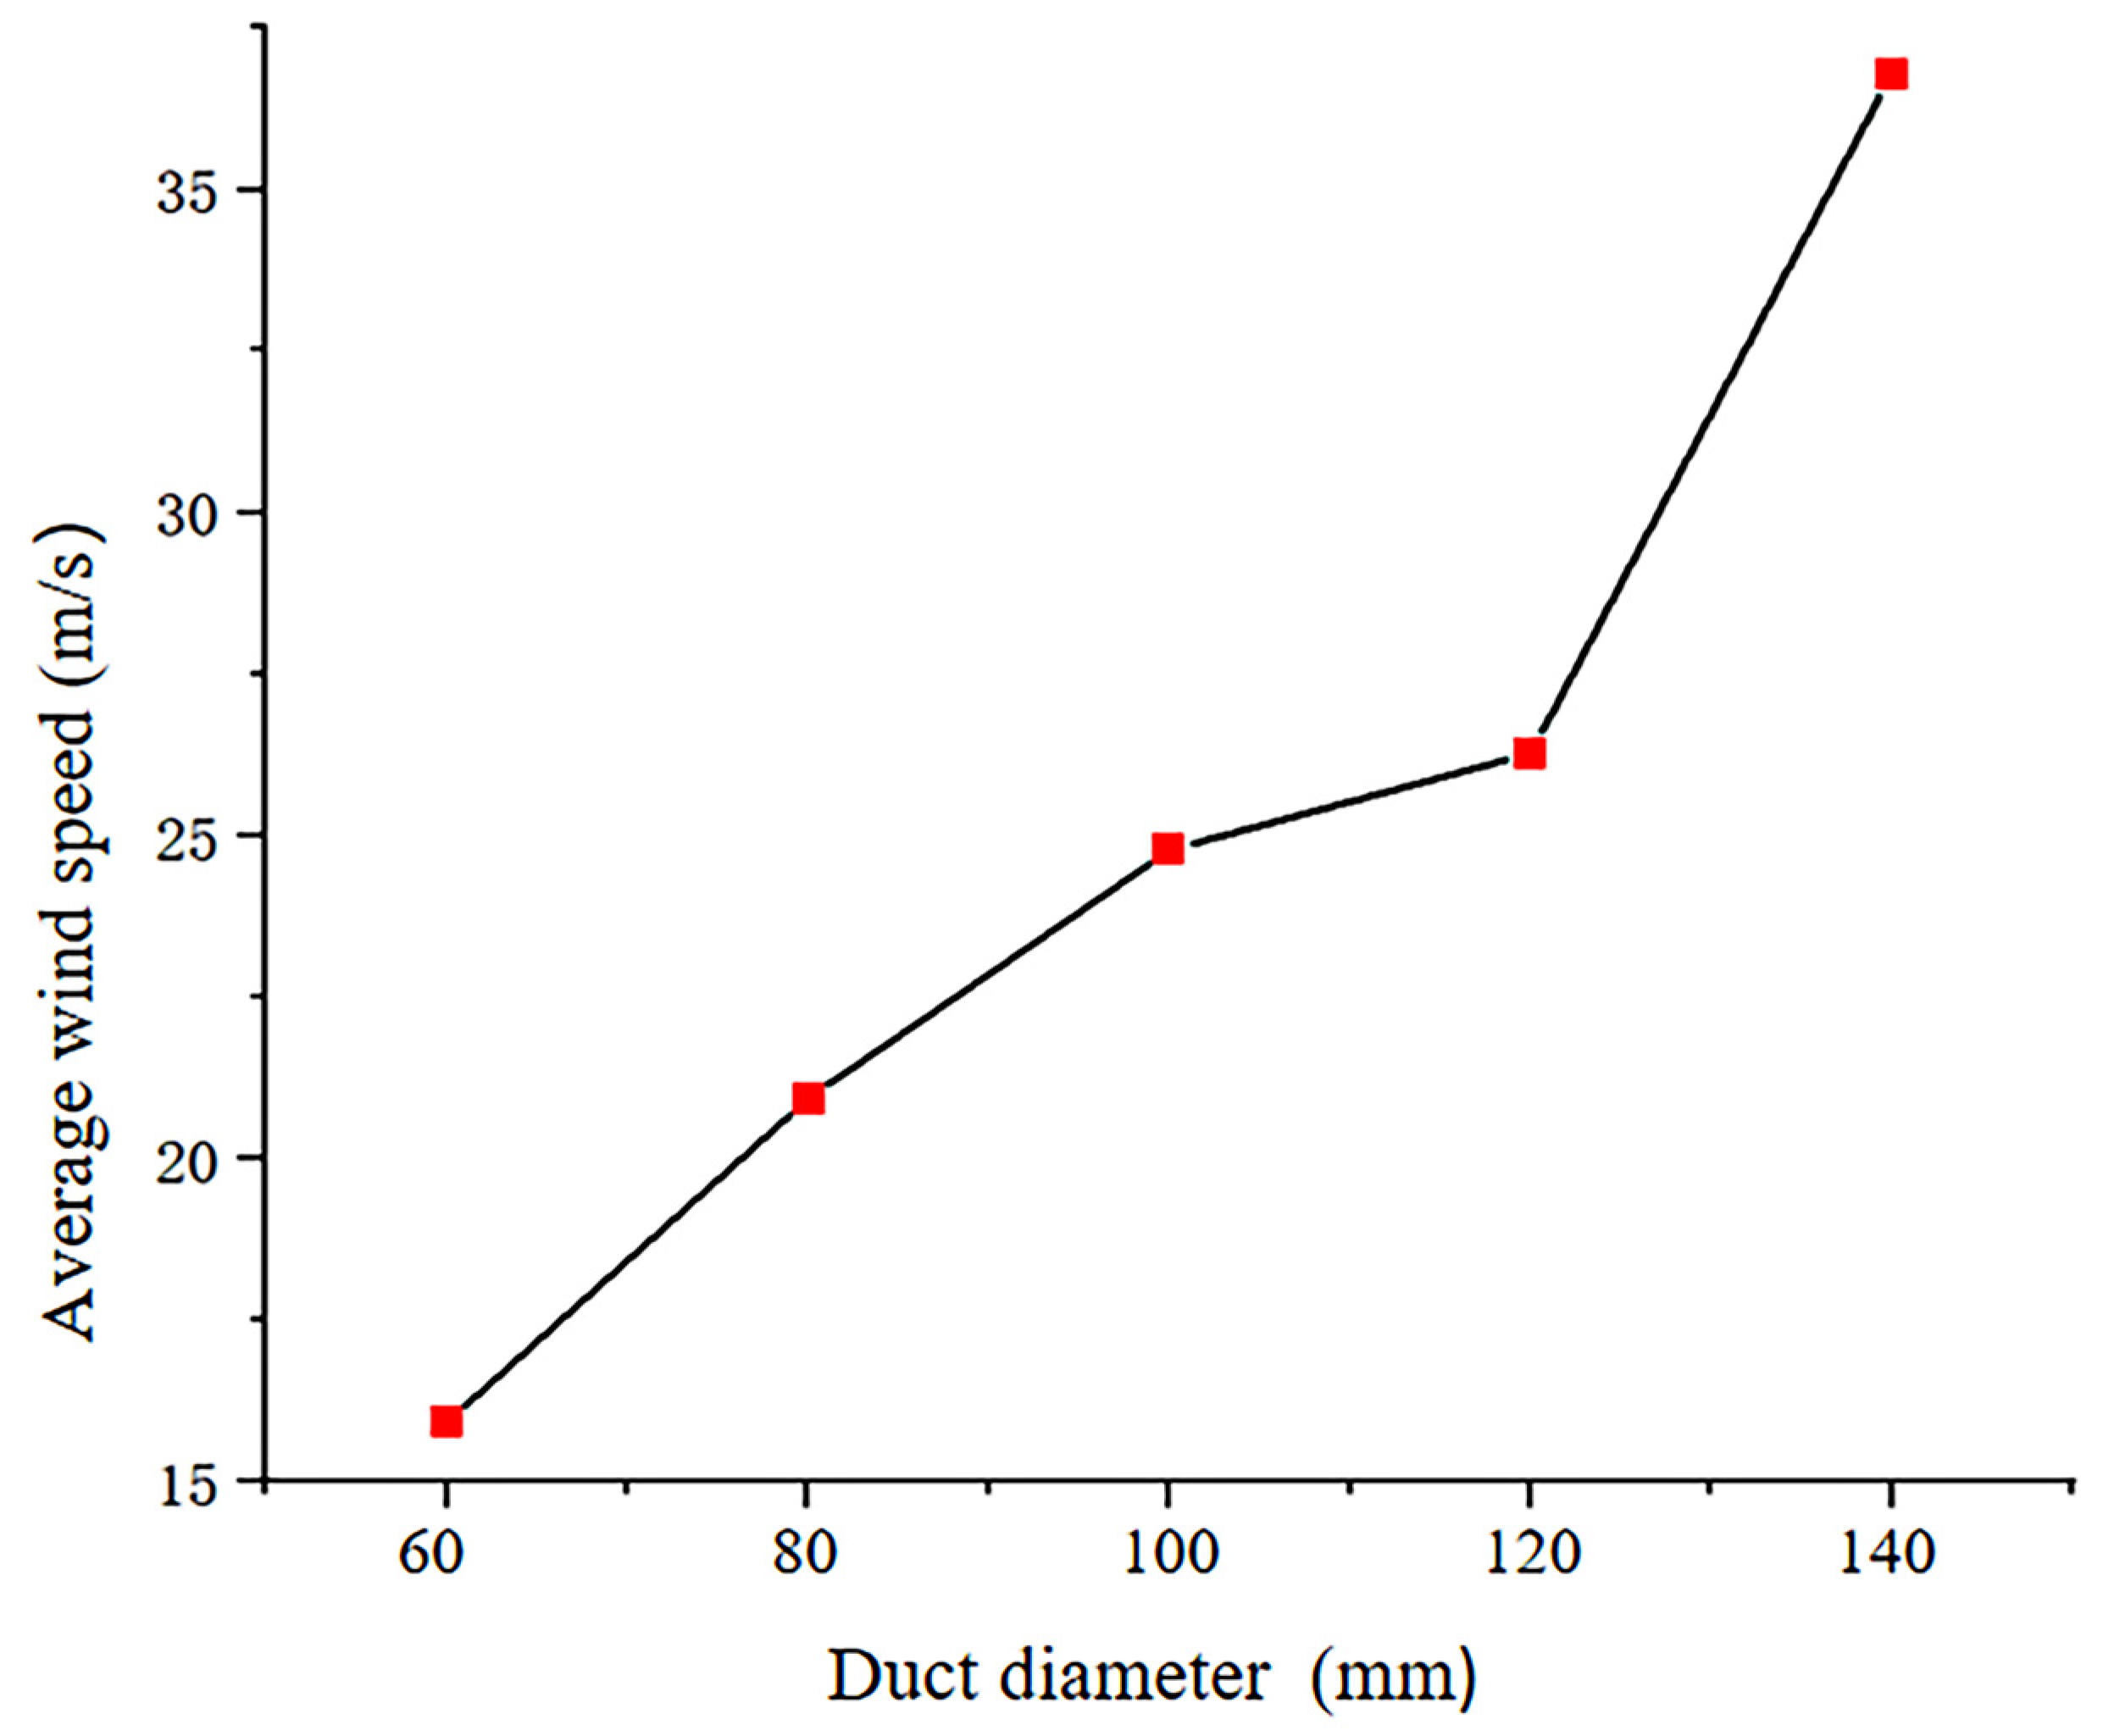
3.1.1. Effect of Duct Diameter on Air Velocity

Changes in the diameter of the pipe will also affect the air velocity of the airflow in the pipe. By reasonably designing the diameter of the duct, the airflow rate and the overall performance of the system can be optimized to meet the needs of specific applications. With the type of duct and outlet diameter at the nozzle fixed, changes in duct diameter directly affect the flow characteristics of the airstream. A diameter that is too small results in a low outlet airspeed, leaving the airflow incapable of effectively penetrating the tree canopy. Conversely, a larger duct diameter reduces airflow resistance, increasing the outlet airspeed. However, an excessively large diameter could lead to excessive penetration through the tree canopy due to a high airflow speed, possibly impacting the uniformity of spray coverage, so the diameter of the air duct was set as 60~140 mm. According to the pre-experiment results, the Type-C duct with the optimal mean value of wind speed was selected, where the diameter of the air outlet at the nozzle was 40 mm, and the diameters of the ducts were 60 mm, 80 mm, 100 mm, 120 mm, and 140 mm, respectively. Simulation analyses were carried out to extract and compute the average wind speed of the air outlet of the sprayer, which is shown in Figure 5, and the simulation results are shown in Figure 6a–e. As the diameter of the air duct increased, the average air velocity at the outlet of the sprayer exhibited a trend of steady increase, consistent with fluid dynamics principles that dictate that duct diameter directly affects air velocity. Selecting an appropriate air duct diameter enhances the sprayer’s performance. To narrow the scope of multi-factor experiments and ensure test accuracy, air ducts with diameters of 80 mm, 100 mm, and 120 mm were chosen as test levels.

3.1.2. Effect of Outlet Diameter on Air Velocity

In regard to the nozzle outlet diameter in the single-factor test, too small of an outlet diameter could lead to an excessively high airflow speed, which, despite enhancing droplet penetration, may damage fruit tree leaves. Conversely, a larger outlet diameter may result in a lower airflow speed, making effective spray coverage difficult to achieve, so we determined an optimal diameter of the outlet of 20~60 mm. We selected the Type-C duct, a uniform duct diameter of 100 mm, and nozzles at the outlet with diameters of 20 mm, 30 mm, 40 mm, 50 mm, and 60 mm for simulation analysis, and the average wind speed results are shown in Figure 7, while the simulation results are shown in Figure 8a–e. As the outlet diameter increases, the average wind speed tends to decrease, accurately reflecting the inverse relationship between the outlet cross-sectional area and wind speed. To minimize interference from excessive variables and precisely capture the impact of diameter changes on wind speed effectiveness, diameters of 30 mm, 40 mm, and 50 mm were chosen as test levels for the multi-factor experiments, thereby enhancing the accuracy of the experimental results.

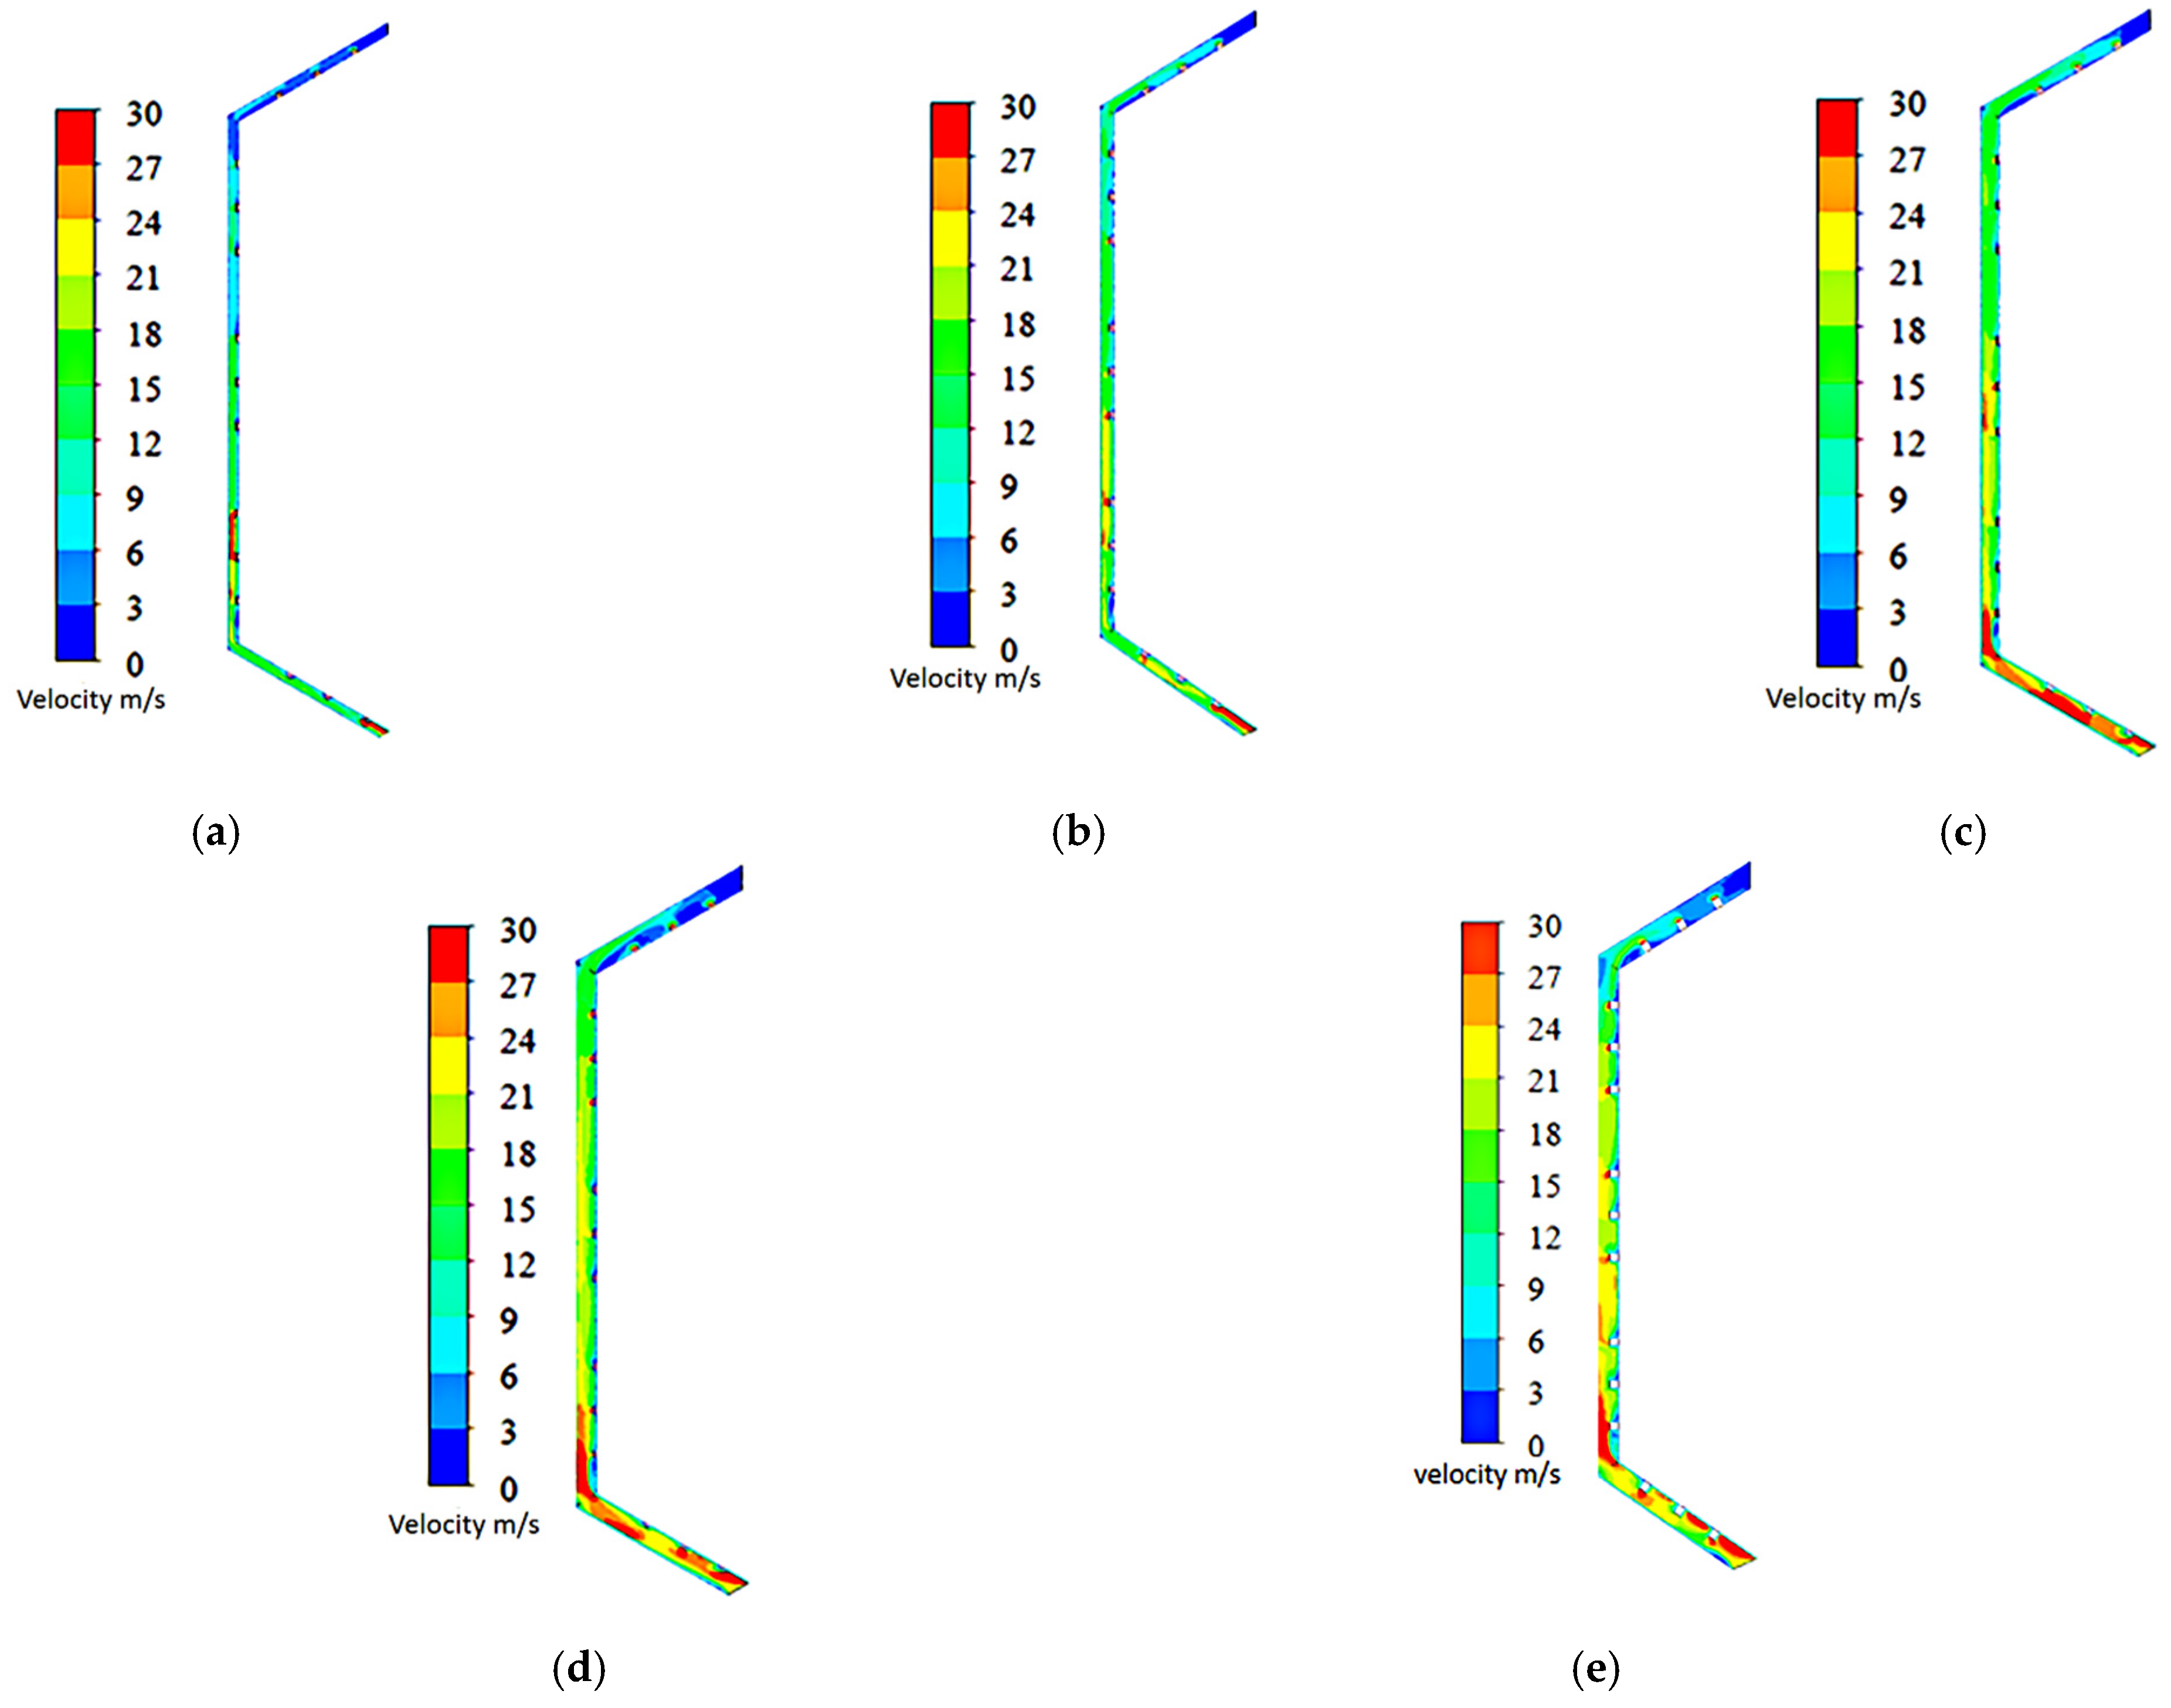
3.2. Multi-Factor Test for Analysis of Duct Structure

3.2.1. Test Program and Results

A response surface methodology (RSM) was employed to conduct a three-factor, three-level experiment evaluating the sprayer’s duct type, duct diameter, and nozzle outlet diameter. This method was used to analyze the interaction effects among the factors and to identify the optimal combination of parameters. The mean value of wind speed at the outlet of the sprayer was selected as the response value Y. The factor levels for the test are shown in Table 2. The scenarios were analyzed using Design-Expert 13 software, where X1, X2, and X3 were the factor coded values.

3.2.2. Mathematical Modeling and Analysis of Variance
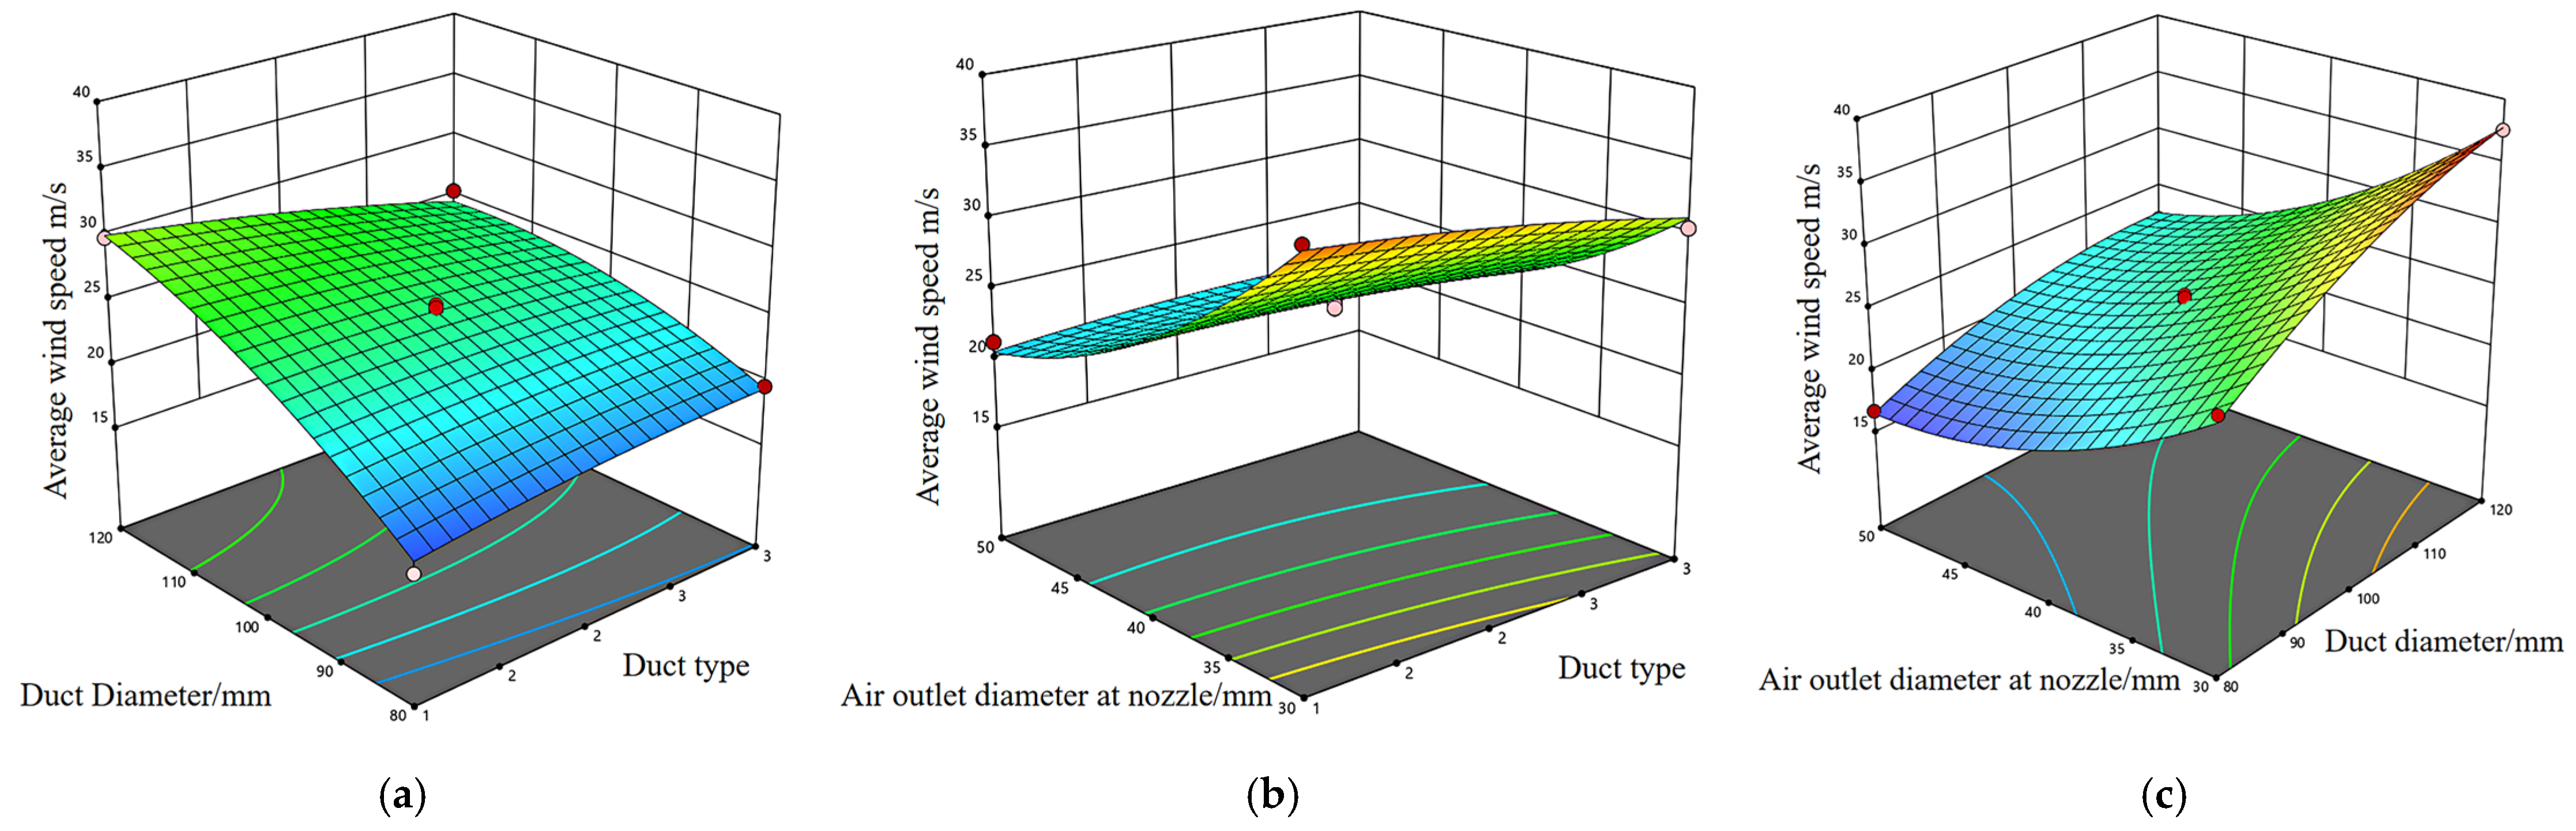
On the basis of one-factor simulation, response surface test analysis was carried out using Design-Expert 13 software; the scheme and results are shown in Table 3, and the analysis of variance is shown in Table 4. The quadratic polynomial regression fitting model for the mean air velocity (Y) at the sprayer duct outlet obtained by regression fitting for the type of duct, duct diameter, and outlet diameter at the nozzle of the sprayer is
Y = 24.83 − 0.8925X1 + 4.43X2 − 6.21X3 − 1.89X1X2 + 1.16X1X3 − 1.31X2X3 − 0.4330X12 − 1.56X22 + 2.57X32.
Based on the model, the F-test was used to obtain the p-value, to determine the effect of each factor on the response value. Significance results are shown in Table 4. With a model significance of p < 0.0001, the regression equation is highly significant, meaning it is able to describe the relationship between the factors and the response value. The loss of fit term > 0.05 is insignificant, indicating that no loss of fit factor exists and the error is small. The fitting statistic R2 = 0.99, which means that the model fits well and generalizes well. The factors X2 and X3 were highly significant and X1, X1X2, X1X3, and X2X3 were significant. The order of precedence of the effect of each factor of the duct on the mean value of air velocity at the outlet of the sprayer was as follows: diameter of the outlet at the nozzle > diameter of the duct > type of the duct.

3.2.3. Interactions

The mean wind speed response surface for the interaction of the three factors is plotted according to the prediction model, as shown in Figure 9. In order to ensure that the air volume produced by the spraying device is sufficient for larger plants, the average value of wind speed should be close to the proposed value calculated in Section 2.2.1. When the type of air duct is determined, with the increase in the diameter of the air duct, the average value of wind speed at the air outlet also increases gradually, because with the increase in the diameter of the air duct, the obstruction of the airflow is gradually reduced. Then the type of air duct is A, the diameter of the air duct is 120 mm and the average value of the wind speed is the largest (Figure 9a).
When the diameter of the air outlet at the nozzle is 30 mm, the mean value of wind speed changes with the change in duct type due to the different losses caused by different types of ducts on the airflow velocity. The mean value of wind speed is highest for Type A and lowest for Type C (Figure 9b).
When the diameter of the duct is 120 mm, with the increase in the diameter of the outlet at the nozzle, the mean value of the wind speed of the duct decreases gradually; the reason is that with the increase in the diameter of the outlet at the nozzle, it requires a lower velocity flow to maintain the volume flow rate. When the diameter of the outlet of the nozzle is 50 mm, the mean value of the wind speed of the duct is minimum (Figure 9c).
In order to obtain the optimal combination of parameters for the duct, the Design-Expert 13 software was used for optimization, and the mean value of the wind speed at the air outlet of the duct of the sprayer was 20.18 m/s when the type of the duct was C, the diameter of the duct was 100 mm, and the diameter of the outlet at the nozzle was 50 mm. According to the above optimal parameter combination established by the simulation model, a simulation test of the double flexible duct spray device was performed, and a cross-section of the velocity cloud is shown in Figure 10, where the average value of the wind speed at the outlet of the sprayer is 20.64 m/s and the relative error with the optimization results is 2.2%.
In summary, the influence of each factor on the spray device outlet wind speed average value had the following order: nozzle outlet diameter > duct diameter > duct type. We identified Duct Type C, a duct diameter of 100 mm, and a nozzle outlet diameter of 50 mm as the optimal combination for the optimization of the design of the dual flexible duct. spray device.

4. Experimental Validation and Results Analysis

4.1. Test Materials and Equipment

In order to verify the application performance of the optimal air conveying device obtained from the simulation, processing and trial production of the double flexible duct spraying device and air conveying system were completed according to the simulation parameters. The test was conducted using an airflow-assisted spray deposition testing system. The system includes a comprehensive test bench for spray performance, SF axial fan, (Shanghai Brand Ventilation Equipment Foreman, Shanghai, China), UT363S digital anemometer, (UNI-T Technology Instruments, Suzhou, China), wind delivery measurement range of 0.4~30 m/s, resolution of 0.01 m/s, accuracy ±5%, water-sensitive paper (produced by Chongqing Liu liu Shan shi mian Plant Protection Science and Technology Co., Chongqing, China), Image-master droplet analysis software Version 3.6.1, a Ge qiang high-pressure atomizing nozzle, (Geqiang Spray Nozzle, Guiyang, China), a 26-type electric plunger pump (Horticulture and Landscape Electromechanical, Hangzhou, China), etc.

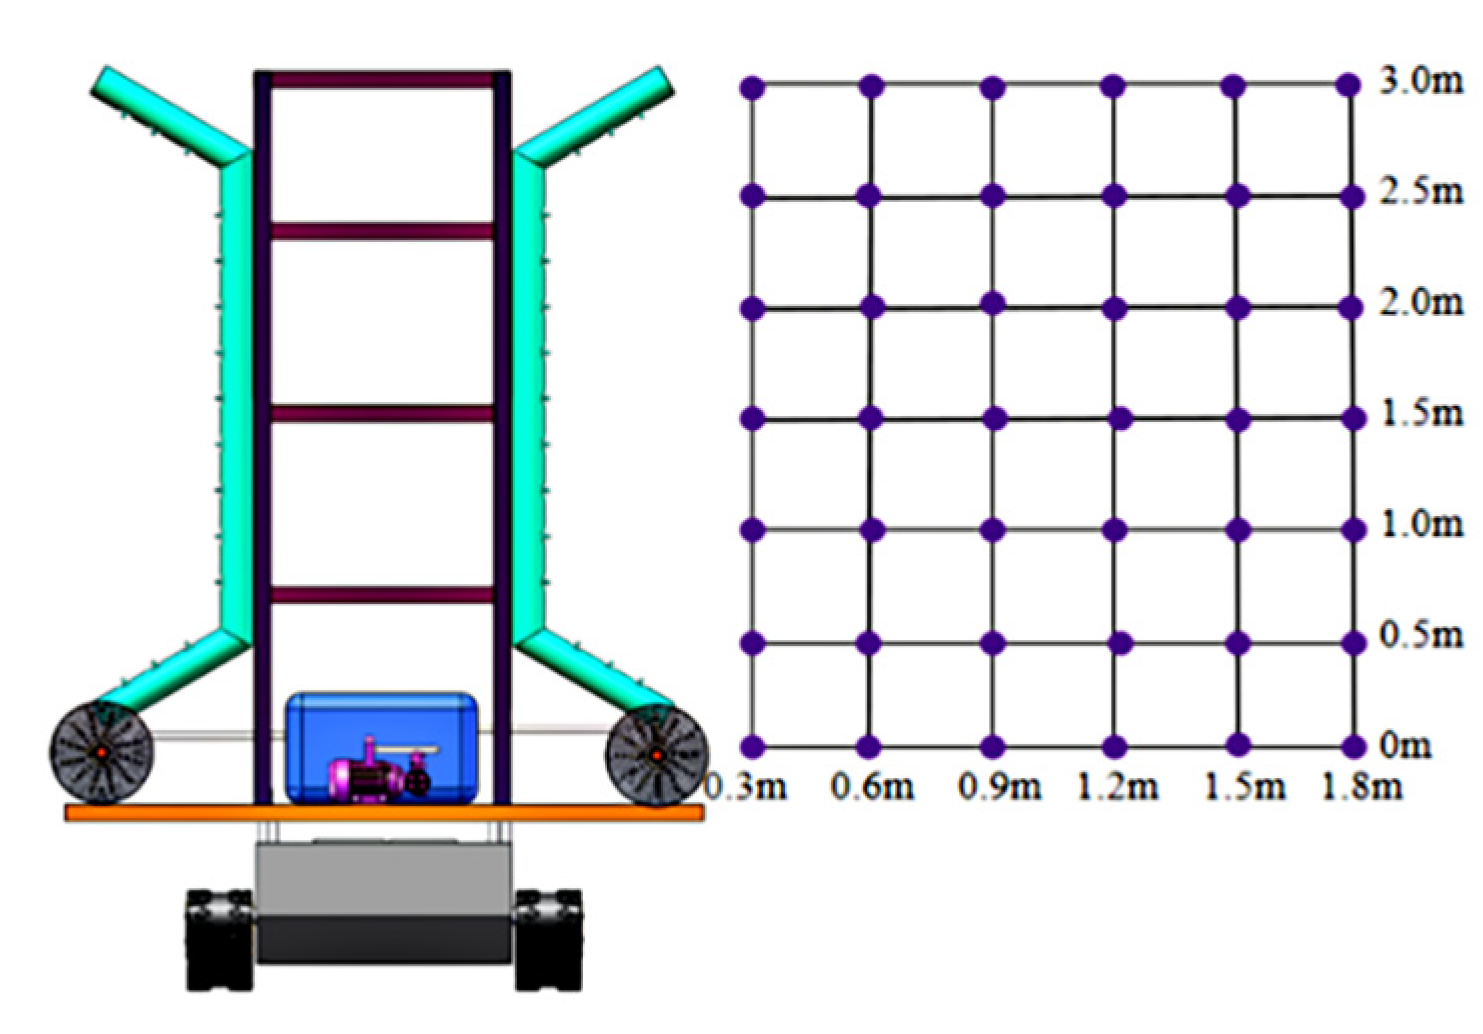
4.2. Spray Device Wind Field Uniformity Test and Analysis

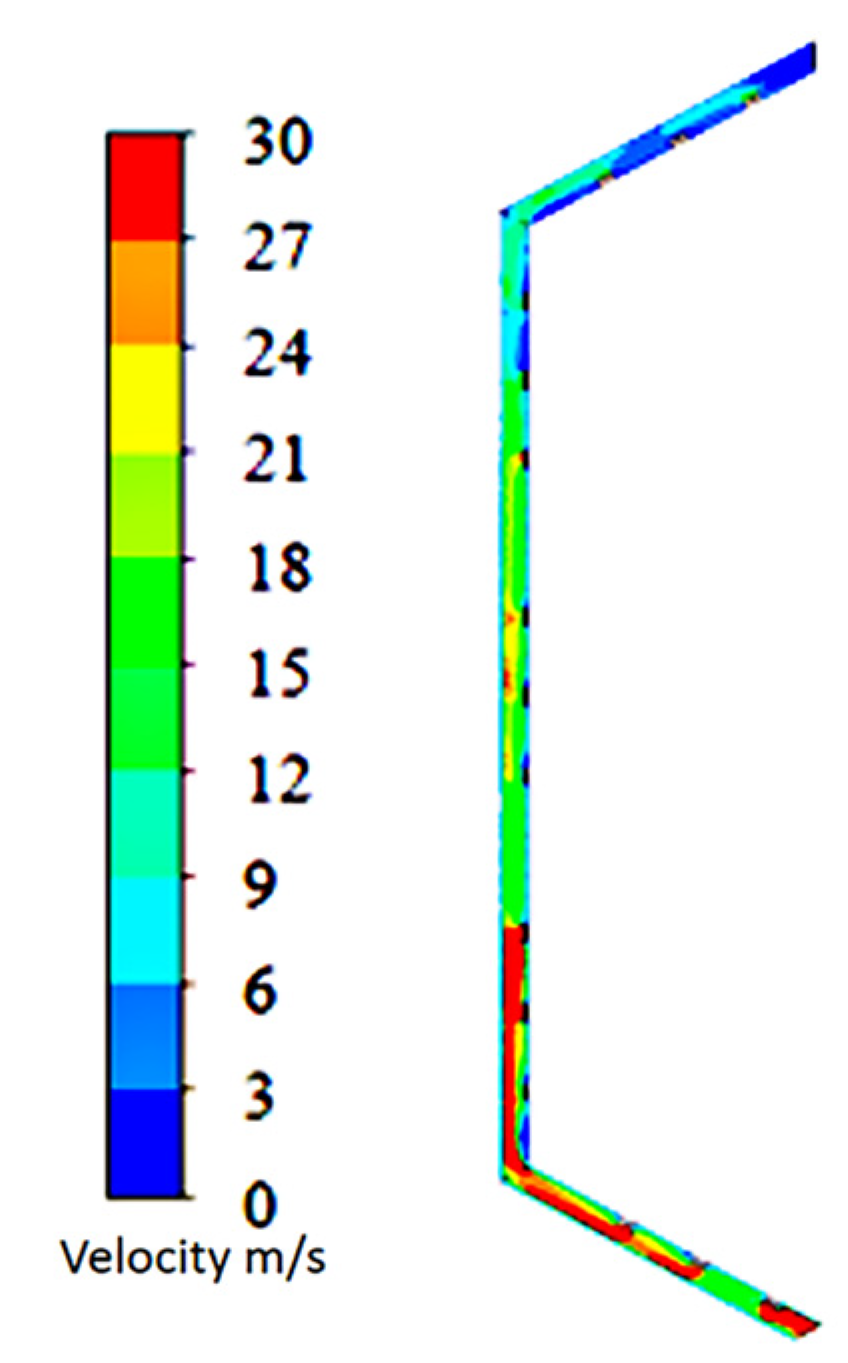
4.2.1. Duct Model Validation Tests and Analysis

In air-assisted spraying operations, the airflow from the air-assisted system is directed toward the target through smooth hoses. By measuring the wind speed at 15 outlets, an external flow field distribution model is established to validate the accuracy of numerical simulations and evaluate airflow attenuation and system performance before and after optimization. To ensure measurement accuracy, each outlet is monitored for 10 s, with each trial repeated three times. The average of these three values is used as the final indicator.
The relative error between the simulated wind speed values at each outlet of the spraying device and the measured experimental values is shown in Table 5. Under the optimal simulation scenario, the relative error between the simulated and measured wind speeds at each outlet is controlled within 10%. This indicates that the established simulation model is highly reliable and can accurately reflect the airflow field distribution characteristics of the optimized air delivery system during actual operations. The simulation results can serve as a key reference for design validation, providing strong support during the design phase while also helping to save both costs and time.

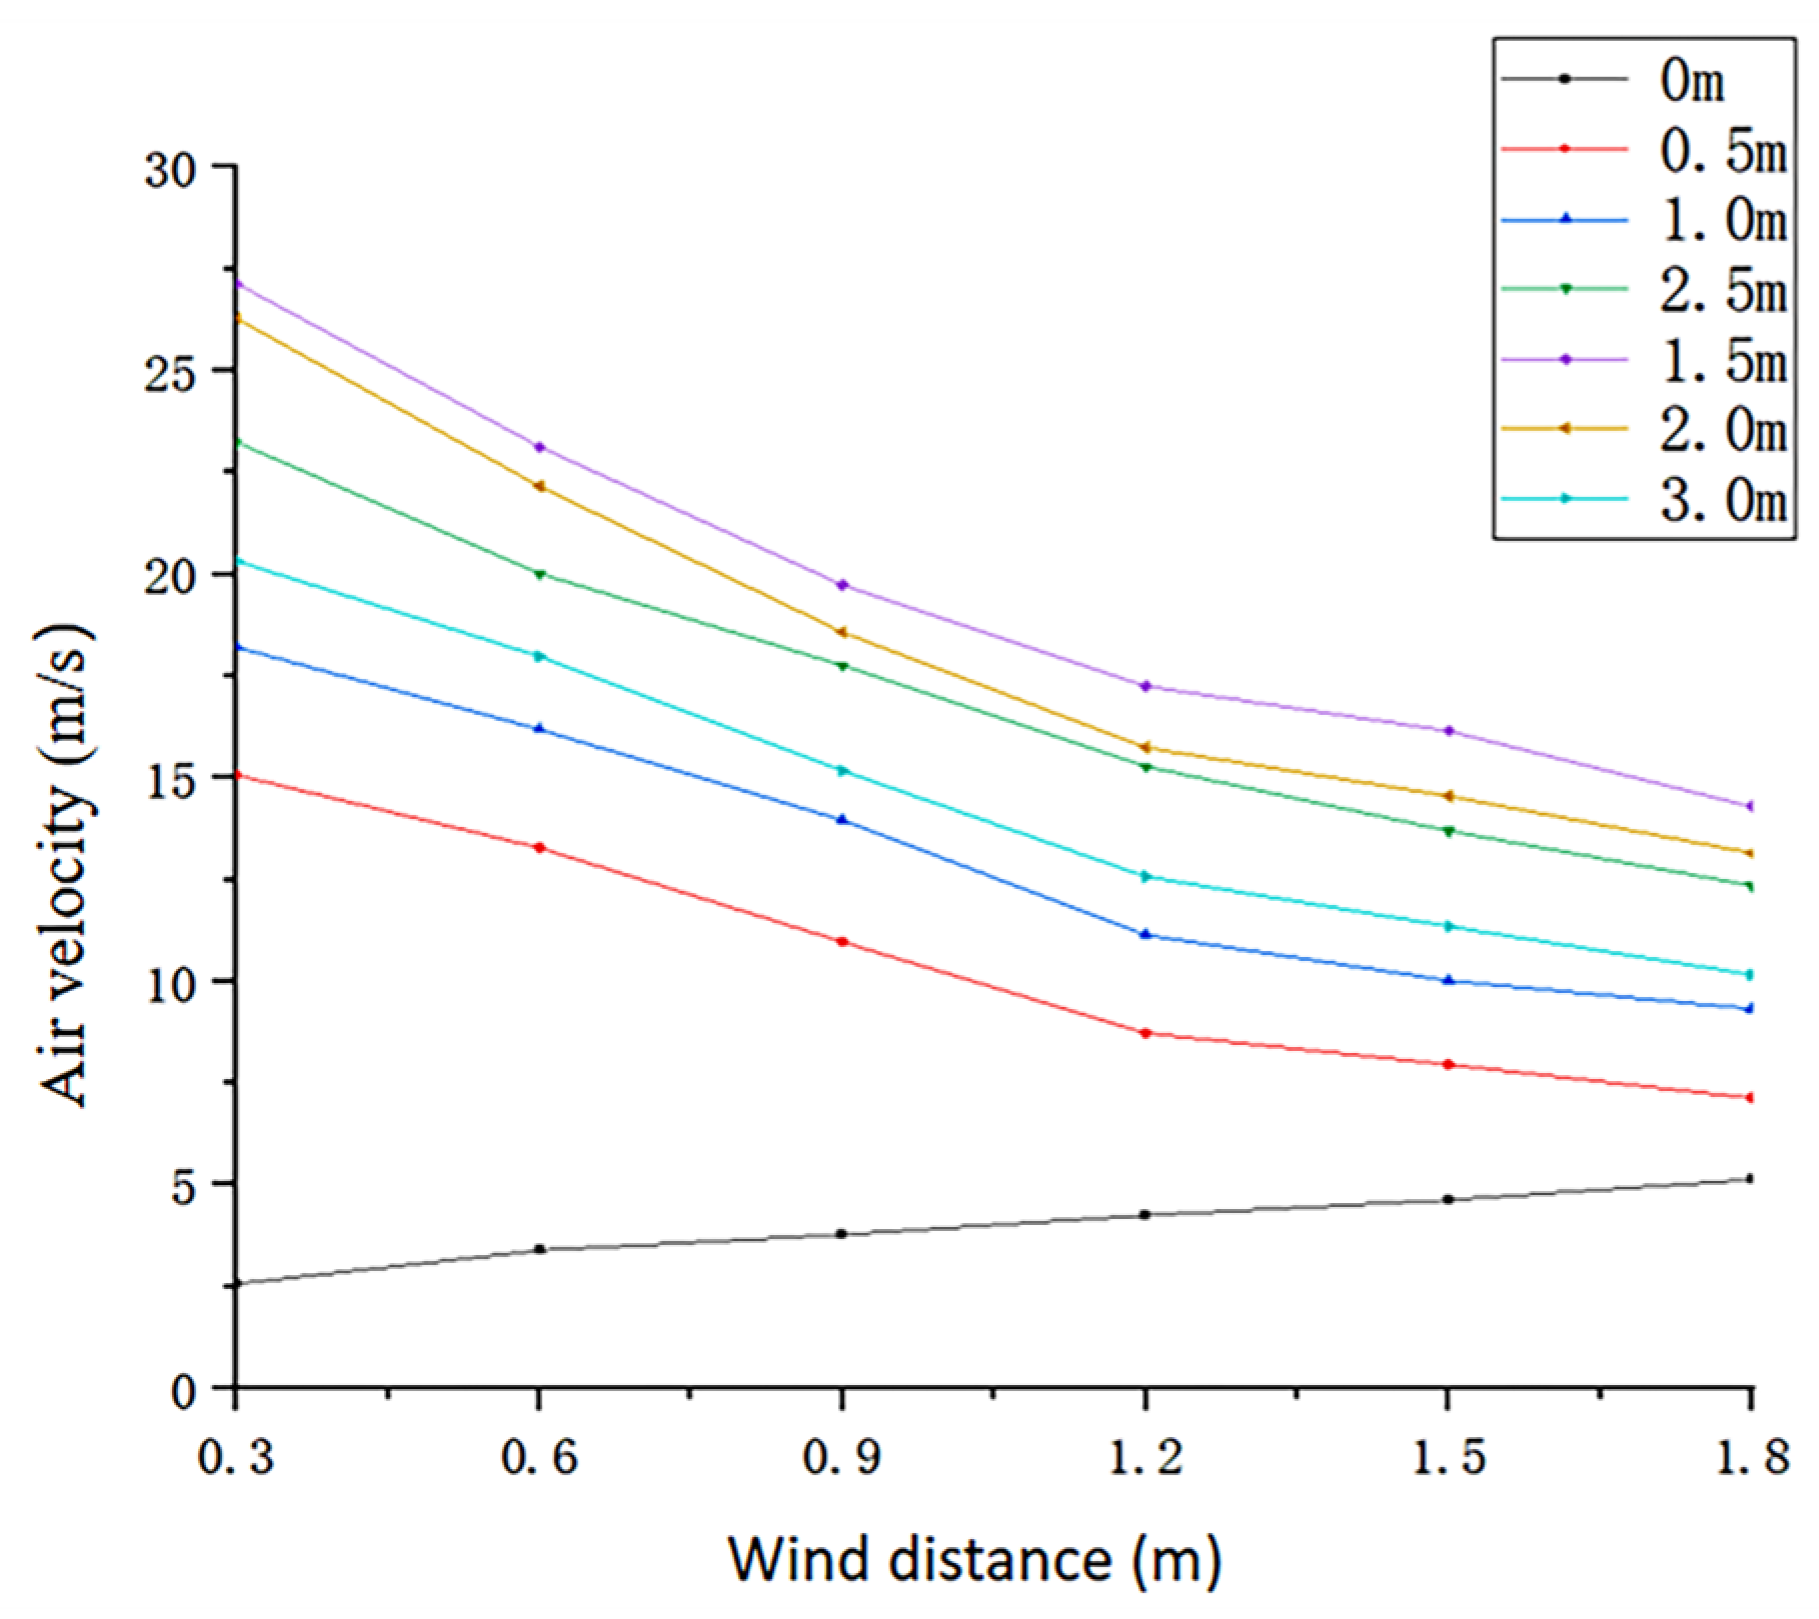
4.2.2. Test and Analysis of the External Flow Field of Air Ducts

To thoroughly investigate the distribution pattern and attenuation characteristics of airflow velocity for the external airflow field of the orchard dual flexible duct sprayer, wind speed measurement points were established within the tree canopy on the right side of the sprayer (as shown in Figure 11). Using the center of the outlet on the right side of the sprayer as the origin, a total of 42 grid-based monitoring points were deployed, with horizontal distances ranging from 0.3 to 1.8 m and vertical distances from 0 to 3 m. Wind speeds at each measurement point were accurately measured using an anemometer. This experiment was conducted on 2 November 2024, at the Baoding Comprehensive Experiment Station of the National Apple Industry Technology System (located in Xiyujiazhuang Village, Pushang Town, Shunping County). Ambient conditions included a wind speed of 0.31 m/s and a temperature of 12.5 °C.
By carrying out the performance test of the external flow field of the air delivery system of the sprayer, the variation in the air velocity at the outlet of the sprayer with the horizontal distance of the air delivery was obtained, as shown in Figure 12. As can be seen in Figure 12, the wind field on the right side of the orchard dual flexible duct spray device gradually decays with an increasing horizontal distance. In the range of horizontal distance of 0.3~1.2 m, the wind speed of each height decreases dramatically because of the obstruction effect of the air on the high-speed airflow; in the range of 1.2~1.5 m, the airflow speed decreases slowly because of the reduction in airflow speed, resulting in a reduction in air resistance, and the airflow reaches the position of 1.5 m when the speeds are higher than 1.5 m/s. According to a large number of experimental studies, when the wind speed is less than 1.5 m/s, the airflow penetration of the canopy is insufficient, indicating that the distance of the sprayer airflow meets the requirements of the range, has good penetration, is conducive to the uniform coverage of the entire operating area, and improves the efficiency of the sprayer.

4.3. Test and Analysis of Droplet Deposition Uniformity

To verify the spraying effectiveness of the optimized dual flexible duct spray device equipped with an air delivery system, a field trial was conducted in a densely planted dwarf apple orchard at the Bao ding Comprehensive Experimental Station. The experiment was conducted in a 5-year-old Fuji apple orchard with a fusiform canopy [34], dwarf rootstock planted densely in a north–south direction, and irrigation by water and fertilizer integration; the ambient temperature was 12.5 °C, and the ambient wind speed was class 1. Three typical fruit trees with lush foliage were selected at right-handed intervals between rows in the park [35], and three sets of parallel experiments were performed in accordance with the “Operational Quality of Air-delivered Orchard Sprayers” [36]. The arrangement of the water-sensitive paper is shown in Figure 13a, and the field operation is depicted in Figure 13b. After the tests were completed, the collected water-sensitive paper was scanned and processed page by page [37,38]. The droplet deposition at each location in each test group was analyzed using the Image-Master droplet analysis software Version 3.6.1, and these results were used to assess the effectiveness of the subsequent tests.

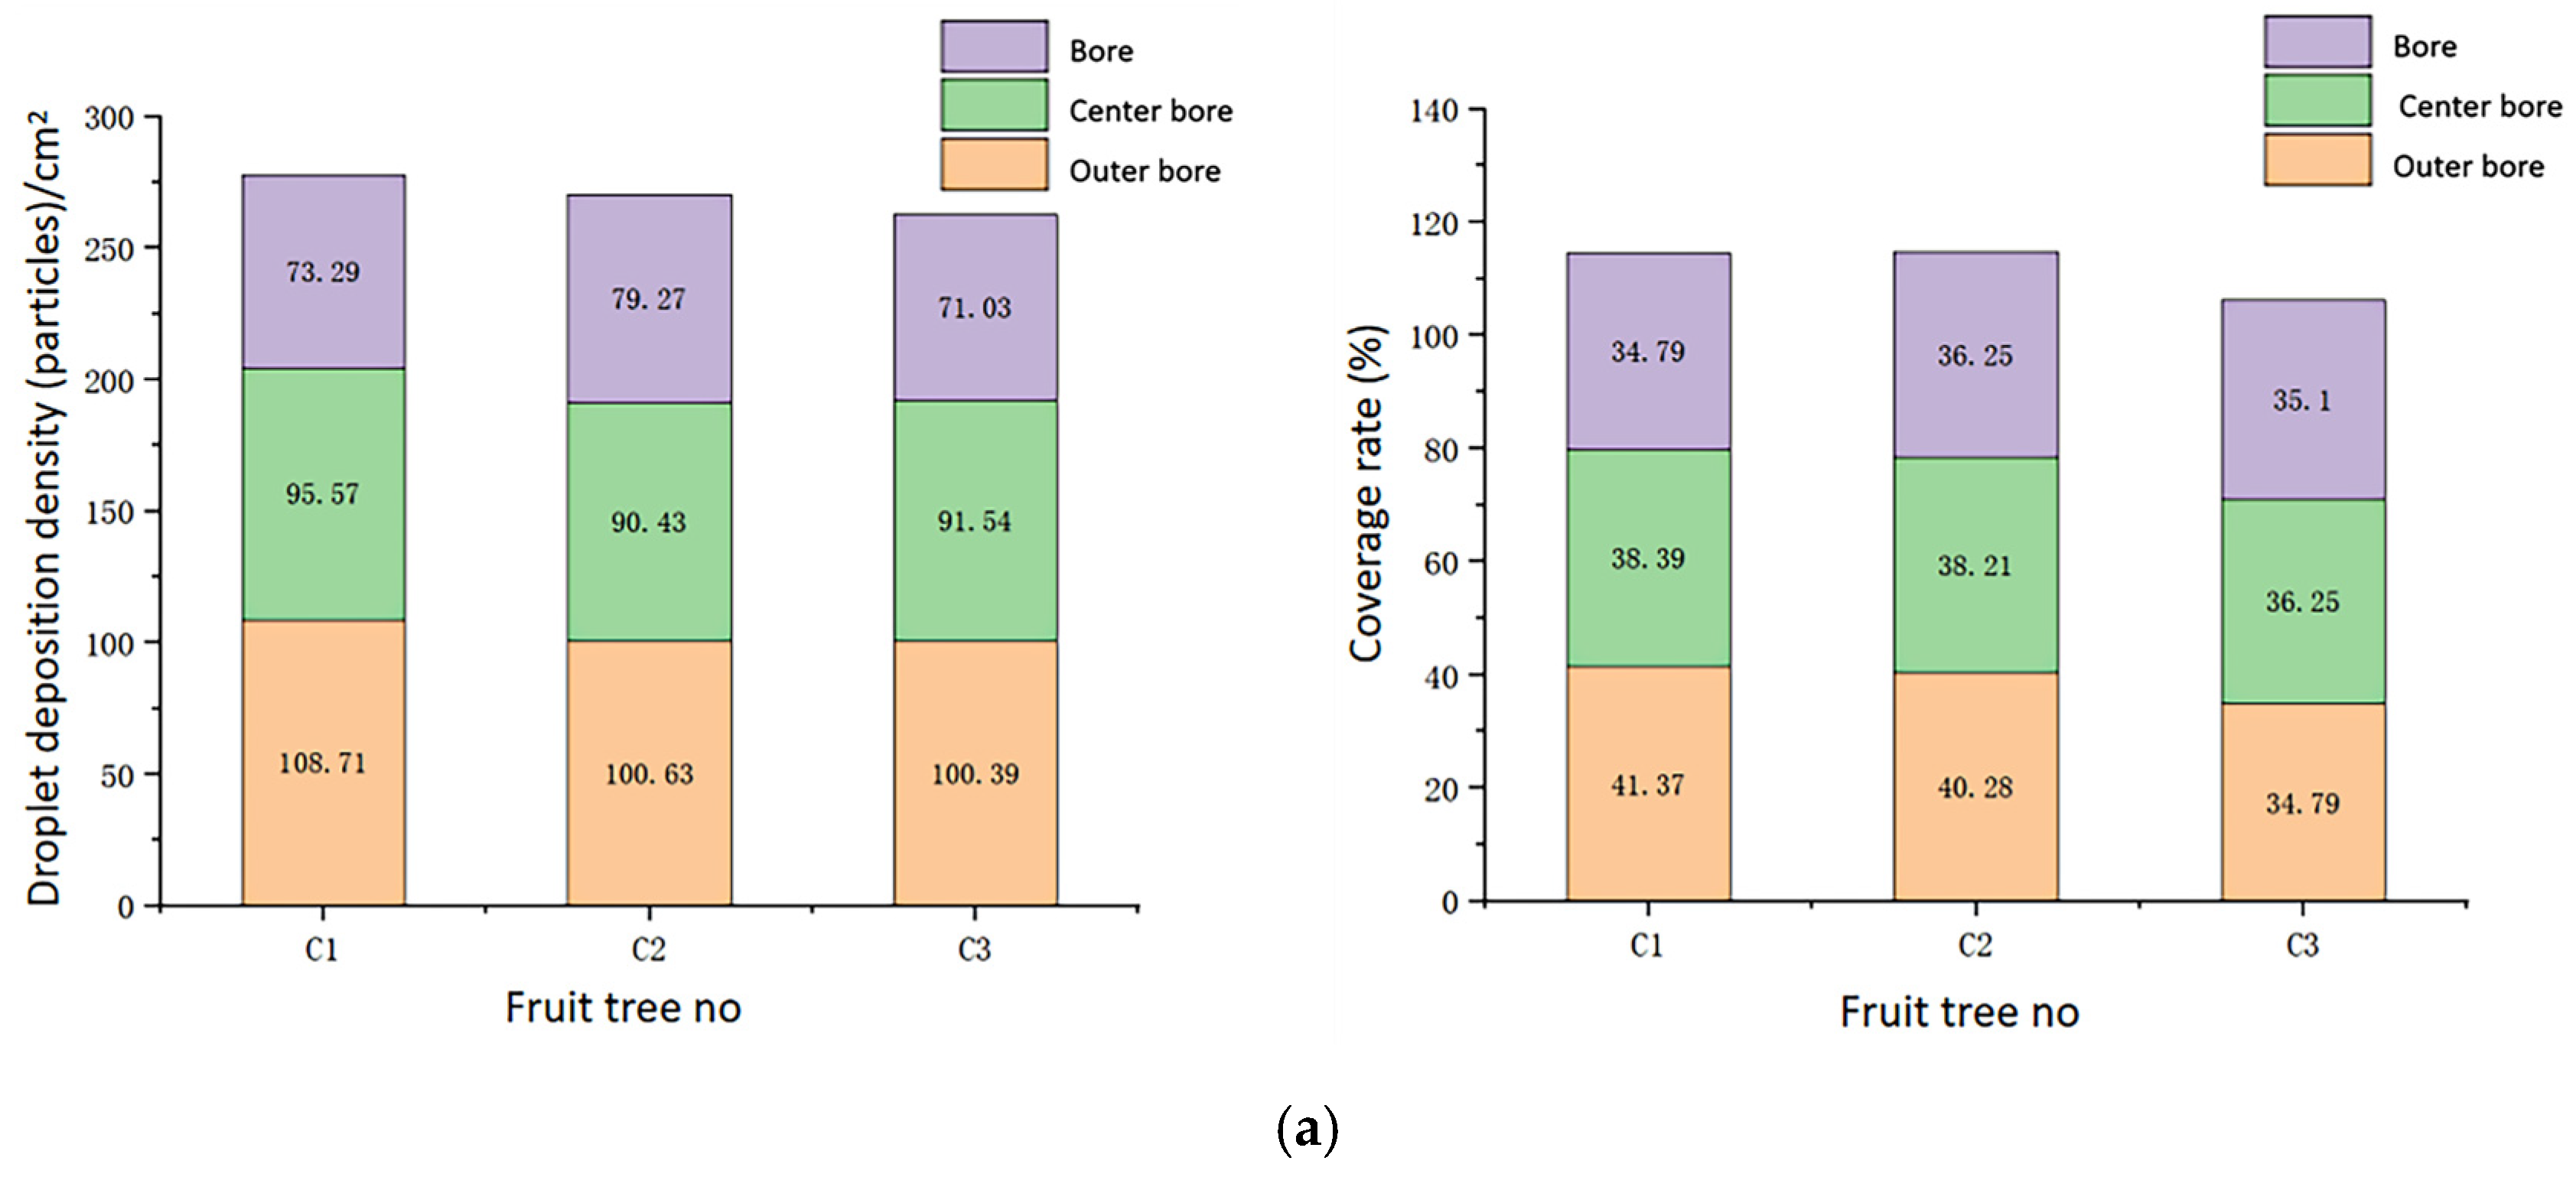
4.3.1. Droplet Penetration Analysis

To investigate the droplet penetration performance of the optimized orchard dual flexible duct spray device during operation, comparative analyses of droplet deposition and coverage inside and outside the fruit tree canopy were conducted, as shown in Figure 14a. As indicated in the figure, the density of spray droplet deposition and droplet coverage both exhibited a general trend of outer > middle > inner within and outside the canopy. The average droplet deposition density in the inner canopy was 74.53 droplets/cm2, and the average droplet coverage in the inner canopy was 35.38%, both of which meet the operational quality requirements for air-driven orchard sprayers. This demonstrates that the optimized orchard dual flexible duct sprayer achieves strong droplet penetration during operation and can satisfy practical operational needs.

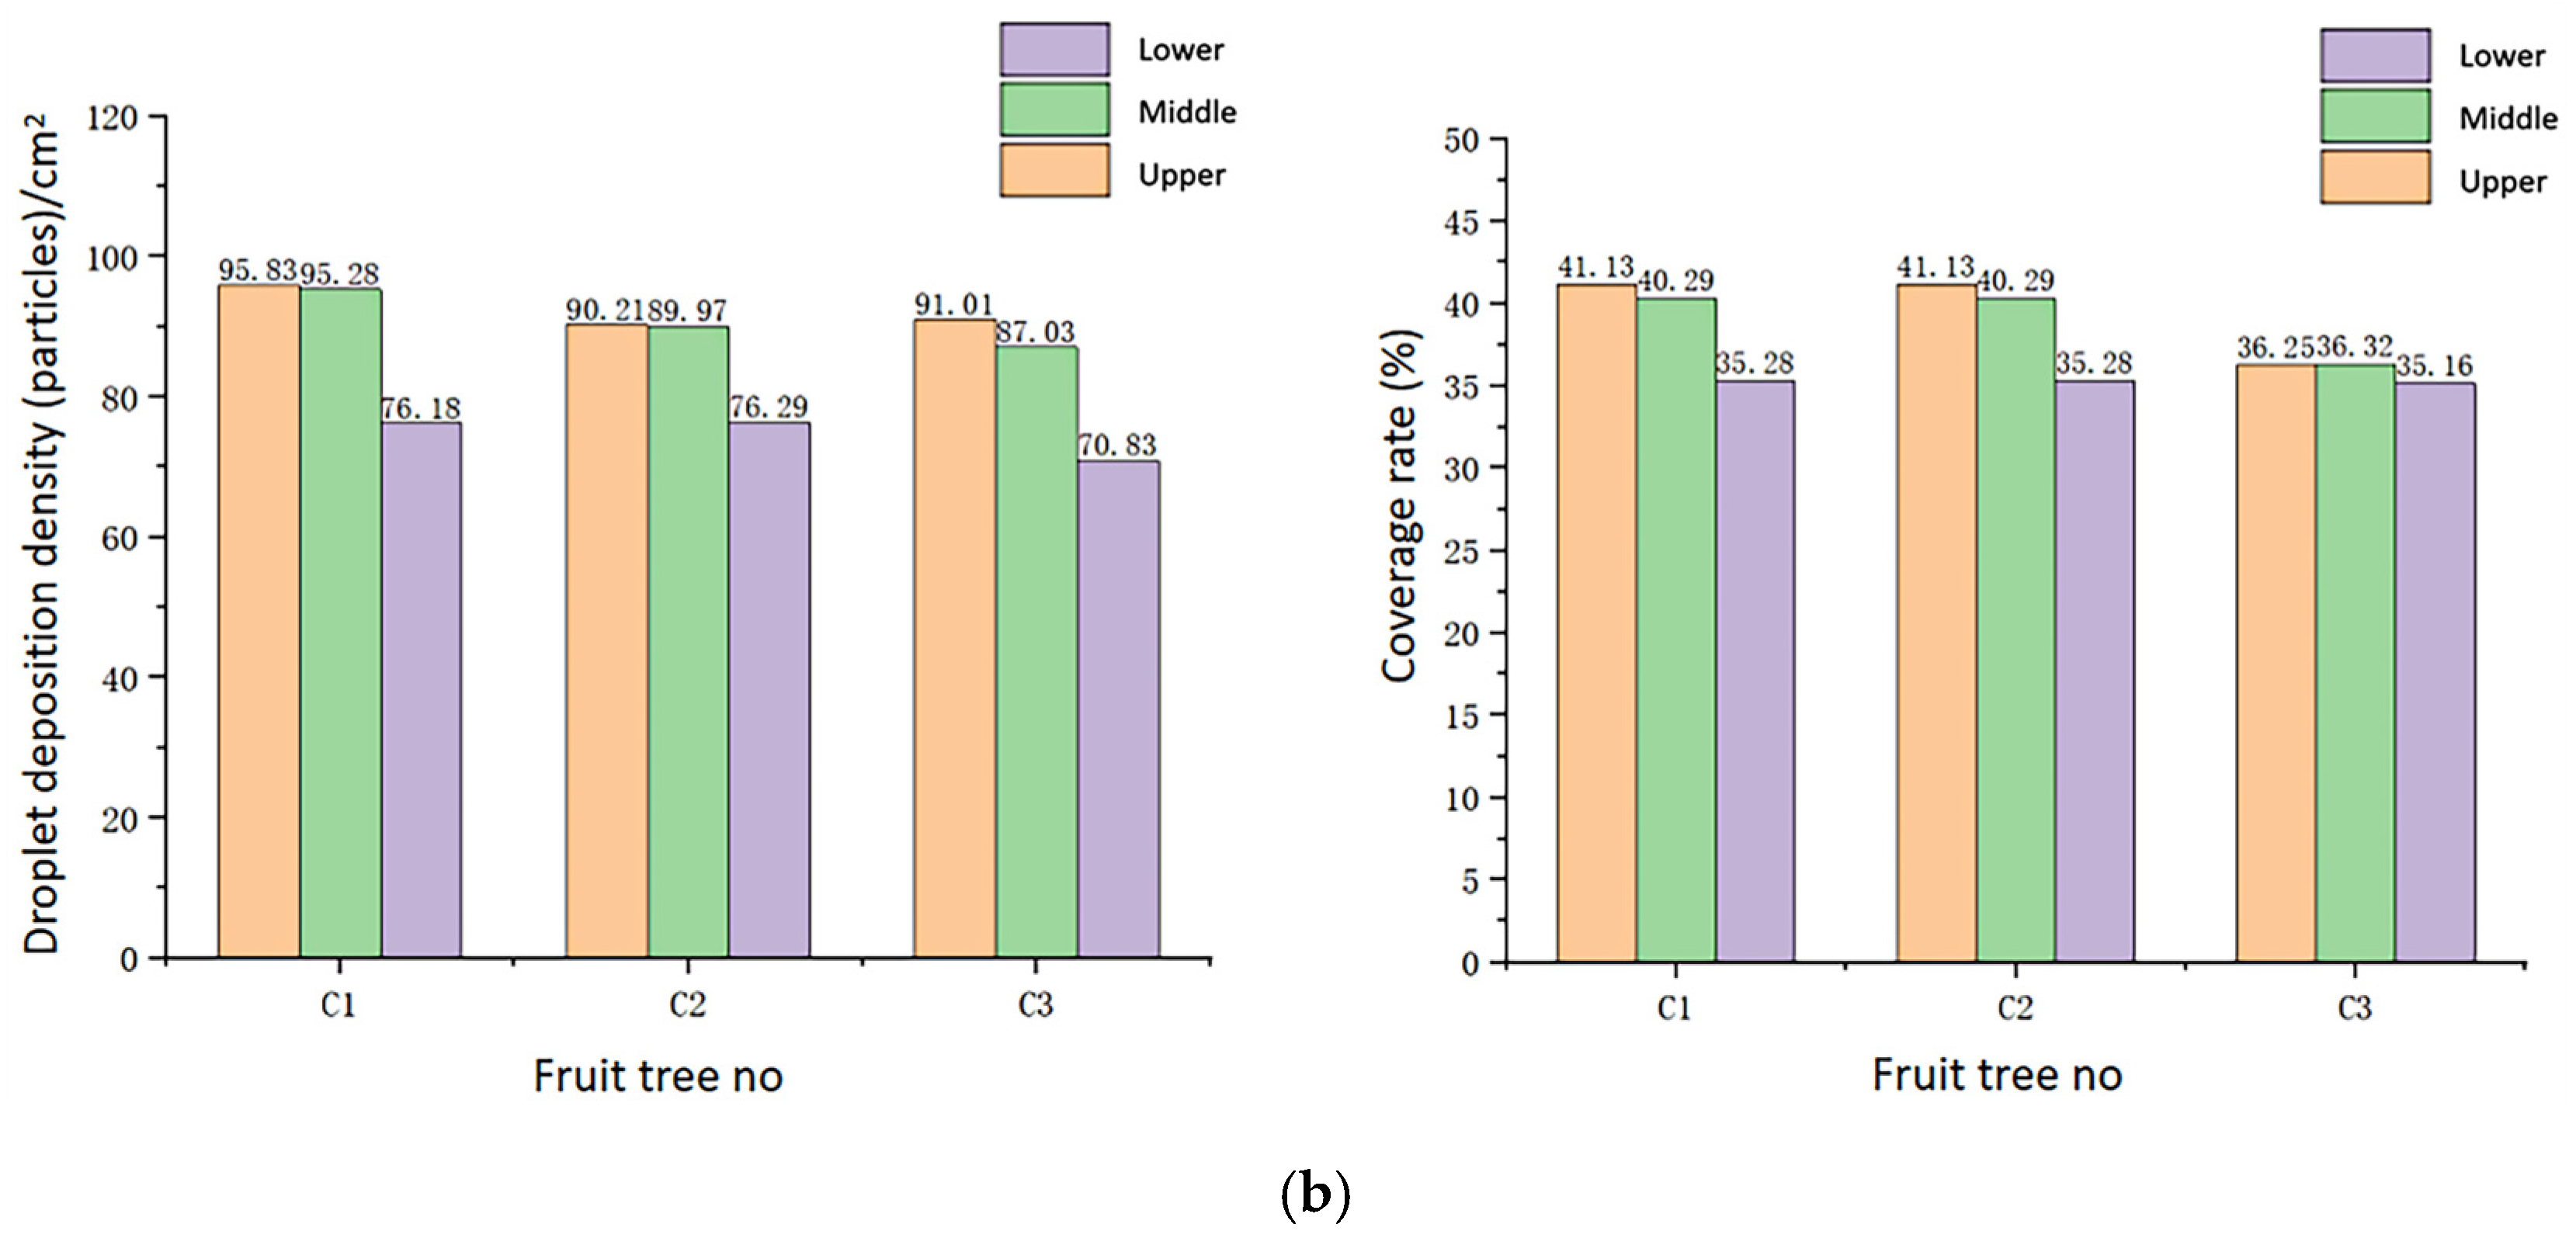
4.3.2. Vertical Distribution Uniformity Analysis of Spray Droplets

To explore the vertical distribution pattern of spray droplet deposition within the fruit tree canopy, the density and coverage of spray droplet deposition in the upper, middle, and lower canopy layers were compared, as shown in Figure 14b. As indicated in the figure, the vertical distribution of spray droplets generally follows the trend of lower > middle > upper, aligning with the characteristics of the fusiform fruit tree canopy shape. The average spray droplet deposition densities in the upper, middle, and lower layers were 74.49 grains/cm2, 90.76 grains/cm2, and 92.35 grains/cm2, respectively—all exceeding the standards for orchard spraying operations. The average spray droplet coverage values for the upper, middle, and lower canopy layers were 35.36%, 37.82%, and 38.76%, respectively, all meeting the criteria for orchard application quality.

5. Discussion

This paper presents the design of a dual flexible air duct spray device and the subsequent construction and testing of its air delivery system, all based on the optimal parameter configuration. The test results indicate that the device excels in droplet coverage within the canopy, achieving an average rate of 35.88%, which surpasses the industry standard of 33%. This demonstrates the sprayer’s strong penetration capability. Furthermore, the average droplet deposition density within the canopy is 74.53 particles/cm2, exceeding the industry standard of 70 particles/cm2. These findings indicate that the device effectively meets the technical requirements for applying chemicals to high spindle-shaped fruit tree canopies, thereby promoting droplet deposition within the canopy. Compared to existing studies, this device excels in droplet penetration and deposition uniformity. Traditional air-assisted sprayers often struggle with coverage of the upper canopy, but this device significantly addresses this issue by optimizing the duct structure and parameters. Especially in complex canopy structures, it ensures a uniform droplet distribution across different layers, which is crucial for enhancing pesticide efficiency and reducing environmental pollution.
This device costs approximately USD 2500 and is suitable for spindle-shaped orchard planting patterns. Compared with large-scale spray machines, it can save costs. In terms of maintenance, the main focus is on maintaining the chassis battery while also paying attention to battery health and wear and tear on the air ducts, to ensure the device operates normally. Additionally, the device can precisely deliver auxiliary airflow to specific canopy locations, enhancing the uniformity of the airflow field and improving droplet deposition on the target canopy. However, this study still has several limitations, such as the absence of canopy morphology monitoring sensor systems, wind speed detection sensor systems, and feedback control systems; the test was conducted only under low wind speed conditions without evaluating the effect of strong wind on airflow stability and droplet deposition; large fluctuation of wind speed at the outlet; and the effect of long-term wear and deformation of the flexible duct on the uniformity and service life of the airflow was not examined.
Future research directions should include the following: Adding visual sensors enables real-time monitoring of morphological changes in the plant canopy. After capturing and analyzing features such as canopy height, thickness, and density, data generated by the sensors are input into powerful AI algorithms. These algorithms dynamically calculate optimal spraying parameters and adjust the air duct angle, wind speed, and outlet diameter of the spraying equipment in real-time. This adaptive system not only ensures a uniform chemical coverage across the entire canopy but also adjusts to changes in plant growth status, minimizing chemical waste while ensuring plants receive adequate protection. Installing deflector blades at the outlet of the duct allows us to optimize the direction of the airflow and improve the consistency of the outlet wind speed; combining with anti-drift devices reduces the interference of the ambient wind on the stability of the airflow; the use of lightweight and anti-aging flexible composite materials improves the durability of the duct and reduces airflow resistance; and exploring the design of collapsible or telescopic ducts allows for simplifying the structure and reducing storage and transportation costs.

6. Conclusions

(1)
A dual flexible duct sprayer designed for apple orchards with wide rows and dense planting was developed. The key components were selected and structurally optimized, with us identifying the nozzle outlet diameter, duct diameter, and duct type as the core factors influencing the performance of the air delivery system.
(2)
Through FLUENT fluid simulation analysis, it was determined that the parameters of the air ducts impact the uniformity of air velocity in the air supply system in the following descending order: the diameter of the nozzle outlet, the diameter of the air duct, and the type of air duct. It was found that the optimal configuration for the double flexible air duct spray device is air duct Type C, with an air duct diameter of 100 mm and a nozzle outlet diameter of 50 mm.
(3)
Based on the field experimental data of spray droplet deposition, when the optimized orchard dual flexible duct spraying device is in operation, the average inner canopy spray droplet coverage is 35.88%, indicating that the sprayer has excellent penetrability. The average inner canopy spray droplet deposition density is 74.53 droplets/cm2, demonstrating an efficient deposition of spray droplets within the tree’s inner canopy. The vertical distribution of spray droplet deposition follows the trend of lower > middle > upper, which aligns with the pesticide adhesion requirements for high fusiform fruit trees. This lower-layer > middle-layer > upper-layer vertical deposition pattern meets the liquid adhesion needs of high fusiform canopies, ensuring a uniform pesticide coverage across all parts of the fruit trees.

Author Contributions

Conceptualization, Z.Z. and D.W.; methodology, J.L.; software, Z.Z. and S.T.; validation, Z.Z., D.W. and J.L.; formal analysis, Z.Z.; investigation, Z.Z. and D.W.; resources, J.L.; data curation, Z.Z. and D.W.; writing—original draft preparation, Z.Z.; writing—review and editing, Z.Z., S.T. and J.L.; visualization, Y.G.; supervision, P.W.; project administration, J.L. All authors have read and agreed to the published version of the manuscript.

Funding

This research was funded by the Earmarked Fund for CARS (CARS-27) and supported by the Earmarked Fund for the Hebei Apple Innovation Team of the Modern Agro-industry Technology Research System (HBCT2024150202).

Institutional Review Board Statement

Not applicable.

Data Availability Statement

The data presented in this study are available on request from the corresponding author.

Conflicts of Interest

The authors declare no conflicts of interest.

References

  1. Zheng, Y.; Chen, B.; Lyu, H.; Kang, F.; Jiang, S. Research progress of orchard plant protection mechanization technology and equipment in China. Trans. Chin. Soc. Agric. Eng. (Trans. CSAE) 2020, 36, 110–124. [Google Scholar]
  2. Lü, X.; Fu, X.; Wu, P.; Ding, S.; Zhou, L.; Yan, H. Influence of Spray Operating Parameters on Droplet Deposition. Trans. Chin. Soc. Agric. Mach. 2011, 42, 70–75. [Google Scholar]
  3. Wang, Z.; Niu, H.; Tang, Y. Research status of orchard spray machinery and technology. J. Tarim Univ. 2019, 31, 83–91. [Google Scholar]
  4. Wang, J.; Tao, Z.; Ru, Y. Research status and Prospect of fan application in Agriculture and forestry plant protection machinery. Chin. J. Agric. Mech. 2016, 37, 67–74. [Google Scholar]
  5. Ade, G.; Molari, G.; Rondelli, V. Recycling tunnel sprayer for poesticide dose adjustment to the crop environment. Trans. ASABE 2007, 50, 409–413. [Google Scholar] [CrossRef]
  6. Salcedo, R.; Alleta, A.; Granell, R. Eulerian–Lagrangian model of the behaviour of droplets produced by an air–assisted sprayer in a citrus orchard. Biosyst. Eng. 2017, 154, 76–91. [Google Scholar] [CrossRef]
  7. Wang, Y.; Chen, H.; Liu, J. Research and Development Tendency of Counter–roating Axial. Equip. Manuf. Technol. 2012, 1, 120–121. [Google Scholar]
  8. Chang, Z.; Luo, H.; Guo, L. Application of CFD Software in the Design of Fan. Fan Technol. 2009, 2, 60–64+72. [Google Scholar]
  9. Sidahmed, M.; Brownr, B. Simulation of spray dispersal and deposition from a forestry airblast sprayer—Part I: Air jet mode. Trans. ASAE 2001, 44, 5–10. [Google Scholar] [CrossRef]
  10. Zhou, L.; Xue, X.; Jia, W. Application of CFD technology in air–assisted spraying in orchard and analysis of its prospects. J. Drain. Irrig. Mach. Eng. 2014, 32, 776–782. [Google Scholar]
  11. Lv, X.; Zhang, M.; Chang, Y. Influence of deflector angles for orchard air–assisted sprayer on 3D airflow distribution. Trans. Chin. Soc. Agric. Eng. (Trans. CSAE) 2017, 33, 81–87. [Google Scholar]
  12. Ru, Y.; Chen, X.; Liu, B.; Wang, S.; Lin, M. Optimized Design and Performance Test of Axial Flow Orchard Sprayer Air Delivery System. Trans. Chin. Soc. Agric. Mach. 2022, 53, 147–157. [Google Scholar]
  13. Endalew, A.; Derbaer, M.; Rutten, N. A new integrated CFD modelling approach towards air–assisted orchard spraying—Part II: Validation for different sprayer types. Comput. Electron. Agric. 2010, 71, 137–147. [Google Scholar] [CrossRef]
  14. Endalew, A.; Derbaer, C.; Rutten, N. Modelling pesticide flow and deposition from air–assisted orchard spraying in orchards: A new integrated CFD approach. Agric. For. Meteorol. 2010, 150, 1383–1392. [Google Scholar] [CrossRef]
  15. Wang, P.; Xu, S.; Yang, X.; Li, S. Optimization Design and Test of Air Delivery System for Tower Sprayer. Trans. Chin. Soc. Agric. Mach. 2024, 55, 342–351, 390. [Google Scholar]
  16. Yang, X.; Liu, Y.; Wang, Y. Flow field simulation and test of air delivery system for orchard multi–duct sprayer. J. Jilin Univ. (Eng. Ed.) 2024, 54, 2723–2732. [Google Scholar]
  17. Jiang, H.; Niu, C.; Liu, L.; Wang, D.; Wang, J.; Mao, W. Design and Experiment of Air Volume Control System of Orchard Multi–pipe Air Spraye. Trans. Chin. Soc. Agric. Mach. 2020, 51, 298–307. [Google Scholar]
  18. Li, L.; He, X.; Song, J.; Wang, X.; Jia, X.; Liu, C. Design and experiment of automatic profiling orchard sprayer based on variable air volume and flow rate. Trans. Chin. Soc. Agric. Eng. (Trans. CSAE) 2017, 33, 70–76. [Google Scholar]
  19. Duga, A.T.; Delele, M.A.; Rysen, K.; Dekeyser, D.; Nuyttens, D.; Bylemans, D.; Nicolai, B.M.; Verboven, P. Development and a; idation of a 3D CFD model of drift and its application to air–assisted orchard sprayers. Biosyst. Eng. 2016, 154, 62–75. [Google Scholar] [CrossRef]
  20. Ding, T. Research on Airflow field Characteristics of Double–fan double–channel orchard sprayer. Chin. Acad. Agric. Sci. 2016. [Google Scholar]
  21. Qiu, W.; Ding, W.; Wang, X.; Gong, Y.; Zhang, X.; Lü, X. 3WZ–700 Self–propelled Air–blowing Orchard Sprayer. Trans. Chin. Soc. Agric. Mach. 2012, 43, 26–30, 44. [Google Scholar]
  22. Wang, J.; Ru, Y.; Zhou, H. Optimal design and airflow field test of seedling sprayer air–assisted system. J. For. Eng. 2020, 5, 129–138. [Google Scholar]
  23. Zhou, L.; Xue, X.; Zhou, L.; Zhang, L.; Ding, S.; Chang, C.; Zhang, X.; Chen, C. Research situation and progress analysis on orchard variable rate spraying technology. Trans. Chin. Soc. Agric. Eng. (Trans. CSAE) 2017, 33, 80–92. [Google Scholar]
  24. Ma, C.; Li, G.; Li, X.; Huang, X.; Song, J.; Yang, S. Development of multi–orientation automatic spraying device for citrus orchards in hilly and mountainous areas. Trans. CSAE Trans. Chin. Soc. Agric. Eng. (Trans. CSAE) 2019, 35, 31–41. [Google Scholar]
  25. Xu, S.; Zhai, C.; Zhu, R. Design of an orchard air–assisted sprayer with adjustable spray height. J. Northwest AF Univ. (Nat. Sci. Ed.) 2013, 41, 229–234. [Google Scholar]
  26. Ryszard, H.; Grzegorz, D.; Waldemar, S. Variable air assistance system for orchard sprayers, concept, design and preliminary testing. Biosyst. Eng. 2017, 163, 134–149. [Google Scholar]
  27. Mirand–Fuentes, A.; Rodrguez–Lizana, A.; Gil, E. Influence of liquid–volume and airflow rates on spray application quality and homogeneity in super–intensive olive tree canopies. Sci. Total Environ. 2015, 537, 250–259. [Google Scholar] [CrossRef]
  28. Friso, D.; Baldoin, C.; Pezzle, F. Mathematical modeling of the dynamics of air jet crossing the canopy of tree crops during pesticide application. Appl. Math. Sci. 2015, 9, 1281–1296. [Google Scholar] [CrossRef]
  29. Salcedo, R.; Garcera, C.; Granell, R. Description of the airflow produced by an air–assisted sprayer during pesticide applications to citrus. Span. J. Agric. Res. 2015, 13, e0208. [Google Scholar] [CrossRef]
  30. Dai, F. Selection and calculation of air flow rate of wind sprayer. Plant Prot. 2008, 6, 124–127. [Google Scholar]
  31. Li, C.; Zhang, X.; Jiang, J.; Hu, Y. Development and experiment of riser air–blowing sprayer in vineyard. Trans. Chin. Soc. Agric. Eng. (Trans. CSAE) 2013, 29, 71–78. [Google Scholar]
  32. Li, B.; Yang, Q.; Xu, Z. Windbreak performance of tree on wind load on low–rise building. J. Build. Struct. 2016, 37, 33–38. [Google Scholar]
  33. Maruyama, T. Large eddy simulation of turbulent flow around a windbreak. J. Wind Eng. Ind. Aerodyn. 2008, 96, 1998–2006. [Google Scholar] [CrossRef]
  34. Zhang, Y. CFD Modeling of Spraying Space Wind Field and Wind Tree Interaction in Orchard; Northwest A&F University: Shaanxi, China, 2021. [Google Scholar]
  35. Li, J.; Bian, Y.; Yang, X. Operational parameter optimization and testing of an air–assisted multi–fan orchard sprayer. J. Jilin Univ. (Eng. Technol. Ed.) 2022, 52, 2474–2485. [Google Scholar]
  36. National Agricultural Machinery Standardization Technical Committee. Operation Quality of Air–Driven Orchard Sprayer: NY/T 992–2006; Ministry of Agriculture, People’s Republic of China: Beijing, China, 2006.
  37. Cao, J.; Qi, L.; Yang, Z. Experimental study of droplet distribution based on image processing. J. China Agric. Univ. 2019, 24, 130–137. [Google Scholar]
  38. Chen, Y. Study on the relationship between properties of spray liquid and utilization rate of pesticide deposition. Chin. Acad. Agric. Sci. 2021. [Google Scholar] [CrossRef]
Figure 1. Sprayer assembly drawing: (1) motorized chassis; (2) axial fan; (3) pesticide tank; (4) flexible duct; (5) bracket; (6) Ge qiang 65 series nozzle; (7) pesticide tube; (8) plunger pump.
Agriculture 15 01031 g001
Figure 2. High spindle-shaped fruit tree.
Agriculture 15 01031 g002
Figure 3. Types of air ducts: (a) Type A air duct; (b)Type B air duct; (c) Type C air duct.
Agriculture 15 01031 g003
Figure 4. Sprayer airflow rate distribution diagram.
Agriculture 15 01031 g004
Figure 5. Wind speed changes based on the diameter of the duct.
Agriculture 15 01031 g005
Figure 6. Simulation results show the change in the diameter of the Type C air duct: (a) C-40-60; (b) C-40-80; (c) C-40-100; (d) C-40-120; (e) C-40-140.
Agriculture 15 01031 g006
Figure 7. Wind speed varies according to the diameter of the nozzle outlet.
Agriculture 15 01031 g007
Figure 8. The simulation results reveal variations in the outlet diameter of the Type C air duct: (a) C-100-20; (b) C-100-30; (c) C-100-40; (d) C-100-50; (e) C-100-60.
Agriculture 15 01031 g008
Figure 9. Response surface of average wind speed-to-factor interactions: (a) response surface of interaction between air duct diameter and type; (b) response surface of interaction between outlet diameter at nozzle and air duct type; (c) response surface of interaction between outlet diameter at nozzle and air duct diameter.
Agriculture 15 01031 g009
Figure 10. Air duct cross-section velocity contour plot.
Agriculture 15 01031 g010
Figure 11. External flow field wind speed measurement point distribution diagram.
Agriculture 15 01031 g011
Figure 12. External flow field wind speed diagram.
Agriculture 15 01031 g012
Figure 13. Process of field experiment: (a) water-sensitive paper layout diagram; (b) field operation diagram.
Agriculture 15 01031 g013
Figure 14. Comparison of droplet deposition: (a) droplet penetration; (b) vertical distribution uniformity of droplets.
Agriculture 15 01031 g014aAgriculture 15 01031 g014b
Table 1. Key component parameters of the dual flexible air duct spraying device for orchards.
Technical ParametersNumerical Value
Motorized chassis traveling speed0.5~1 m/s
Motorized chassis platform dimensions (Length × Width)2000 × 1600 mm
Axial fan air volume18,700 m3/h
Bracket dimensions (Length × Width × Height)1600 × 1200 × 3000 mm
Pesticide tank capacity150 L
Flexible duct length4.3 m
Pesticide tube length5.3 m
Ge qiang 65 series nozzle flow range0.14~0.35 L/min
Ge qiang 65 series nozzle pressure1 MPa
Plunger pump flow range20.21~23.78 L/min
Plunger pump pressure1~4.5 MPa
Plunger pump rotational speed800~1400 r/min
Table 2. Coding of test factors.
EncodingFactor
Duct TypeDuct Diameter/mmAir Outlet Diameter at Nozzle/mm
−1A8030
0B10040
1C12050
Table 3. Test scheme and results of average wind speed.
NumberLevel of FactorsAverage Wind Speed (m/s)
X 1 X 2 X 3
11804016.50
23804019.59
311204029.86
431204025.39
511003035.60
631003030.41
711005021.21
831005020.64
92803036.85
1021203037.60
112805016.69
1221205022.22
1321004024.92
1421004024.71
1521004025.35
1621004024.26
1721004025.09
Table 4. Analysis of variance.
SourceSquare SumDegrees of FreedomMean SquareFp
Model535.57959.5193.69<0.0001 **
X16.3716.3710.030.0158 *
X2157.001157.00247.17<0.0001 **
X3308.761308.76486.10<0.0001 **
X1X214.29114.2922.500.0021 **
X1X35.3415.348.400.0230 *
X2X36.8116.8110.720.0136 *
X120.789410.78941.240.3017
X2210.22110.2216.090.0051 **
X3227.85127.8543.850.0003 **
residual4.4570.6352
vector term3.6731.226.330.0533
pure error0.773340.1933
Sum540.0216
Note: ** denotes a highly significant difference (p < 0.01); * denotes a significant difference (0.01 < p < 0.05).
Table 5. Comparison of test and simulation results.
Air OutletAnalog Value (m/s)Experimental Value (m/s)Relative Error %
129.2729.922.22
217.2518.537.42
328.4129.273.02
425.9127.837.41
515.1015.814.70
615.2516.125.70
720.7921.533.56
826.8128.697.01
916.5117.385.27
1016.4417.214.68
1120.4021.274.26
1215.1116.579.66
1318.2319.185.21
1421.3422.354.73
1522.7223.141.85
Disclaimer/Publisher’s Note: The statements, opinions and data contained in all publications are solely those of the individual author(s) and contributor(s) and not of MDPI and/or the editor(s). MDPI and/or the editor(s) disclaim responsibility for any injury to people or property resulting from any ideas, methods, instructions or products referred to in the content.

