Article

Comparative Analysis of Air Quality in Agricultural and Urban Areas in Korea

1
Department of Environmental Engineering, Anyang University, Anyang 14028, Republic of Korea
2
Climate Change Assessment Division, National Institute of Agricultural Sciences, Rural Development Administration, Wanju 55365, Republic of Korea
*
Authors to whom correspondence should be addressed.
Agriculture 2025, 15(10), 1027; https://doi.org/10.3390/agriculture15101027
Submission received: 17 March 2025 / Revised: 27 April 2025 / Accepted: 29 April 2025 / Published: 9 May 2025

Abstract

:
Air pollution monitoring in Korea has not yet been implemented in agricultural areas. Documenting air quality in purely agricultural areas is inherently valuable. This study compares agricultural air quality with urban air quality during two periods: (1) the entire measurement period and (2) high-PM episodes. To ensure broad spatial coverage, eight monitoring stations were installed in Yeoju, Nonsan, Naju, Gimhae, Hongcheon, Danyang, Muan, and Sangju. Real-time measurements of PM10, PM2.5, SO2, and NOx were conducted continuously from March 2023 to December 2024. Over the entire measurement period, PM concentrations were similar in both agricultural and urban areas, but gaseous pollutants were lower in agricultural areas. PM levels were higher in agricultural areas during summer, whereas urban areas showed higher concentrations in other seasons. During high-PM episodes (29 days), all pollutants were significantly higher in urban areas, with PM2.5 showing a greater difference than PM10. Diurnal variations revealed that PM10, PM2.5, and NO2 peaked in the morning and reached their lowest levels around 3 PM, with urban levels consistently higher than those in agricultural areas. SO2 showed a different pattern, reaching its lowest concentration at 6 AM and peaking at noon in urban areas and at 6 PM in agricultural areas. This pattern closely followed temperature and wind speed variations.

1. Introduction

Air pollution is a major environmental concern with profound implications for public health, ecological sustainability, and agricultural productivity [1,2,3]. In Korea, approximately 800 air pollution monitoring networks are currently in operation, primarily focusing on urban, roadside, background, and rural areas [4,5]. Despite extensive monitoring efforts, air quality assessments in agricultural areas have been limited. Agricultural areas are often grouped with rural regions, though they are distinct in terms of land use and activities. However, rural areas can sometimes have heavy traffic and include industrial complexes in Korea, making them very different from purely agricultural zones, which mainly consist of rice paddies and dry fields [4,6]. Agricultural areas cover a large portion of the national land and may exhibit unique air pollution characteristics influenced by farming activities, weather conditions, and long-range transport. Thus, comprehensive measurements are needed to accurately represent both agricultural regions and nearby cities [7,8].
Agricultural and urban environments exhibit distinct air pollution characteristics due to differences in emission sources, land use, and meteorological influences. While urban areas experience high pollutant levels from transportation, industrial activities, and residential heating, rural regions are impacted by agricultural practices such as biomass burning, fertilizer use, and livestock emissions [3,9]. Meteorological factors, including wind patterns, humidity, and solar radiation, further influence pollutant dispersion and chemical interactions, contributing to variations in air quality [10,11,12]. Given these complexities, further research is needed to better understand the relationship between agricultural emissions and air pollution dynamics in Korea.
Although air pollution levels in rural areas are generally lower than in urban regions due to reduced industrial and vehicular emissions [13,14,15], some rural areas can experience higher pollution levels. Agricultural activities, such as biomass burning, fertilizer use, and livestock emissions, can significantly contribute to air pollution, sometimes resulting in higher particulate matter (PM) concentrations than in urban areas [9,16]. Meteorological conditions and long-range transport of pollutants can also exacerbate air quality issues in rural regions [10,12].
In particular, ammonia (NH3) emissions from agricultural activities are a key contributor to secondary particulate matter formation and regional air pollution [16,17,18,19]. Ammonia from livestock and fertilizers interacts with SO2 and NO2 to form secondary aerosols, impacting PM2.5 levels [9]. While many studies highlight the role of agricultural ammonia emissions in PM2.5 formation, sulfur dioxide (SO2) and nitrogen dioxide (NO2) are sometimes considered more influential [16,20]. This discrepancy arises from limited research on agricultural air quality. Further comprehensive research is required to better assess rural air pollution. Furthermore, a deeper understanding of air pollution dynamics in agricultural areas is crucial for formulating effective environmental policies and reducing health risks for rural communities [10,11,21].
In Korea, the urban air quality monitoring network continuously measures six criteria air pollutants in real time: PM2.5, PM10, SO2, NO2, CO, and O3. In response to the identified need for agricultural air quality monitoring, the Rural Development Administration (RDA) of Korea launched a research project to examine the potential for developing an agricultural monitoring network analogous to the urban system. The selected parameters of the research project—PM2.5, PM10, SO2, NOx, and NH3—show slight differences from those used in urban monitoring. Eight air pollution monitoring stations were established in agricultural regions across Korea. As part of this research project, the present study conducted a comparative assessment of air quality (PM10, PM2.5, SO2, and NOx) across agricultural and urban environments. The data were analyzed in two periods: (1) the full measurement period and (2) high-PM episodes. By investigating temporal variations in air pollution, this study aims to provide a deeper understanding of air quality dynamics in agricultural regions and highlight the necessity of continuous monitoring efforts.

2. Materials and Methods

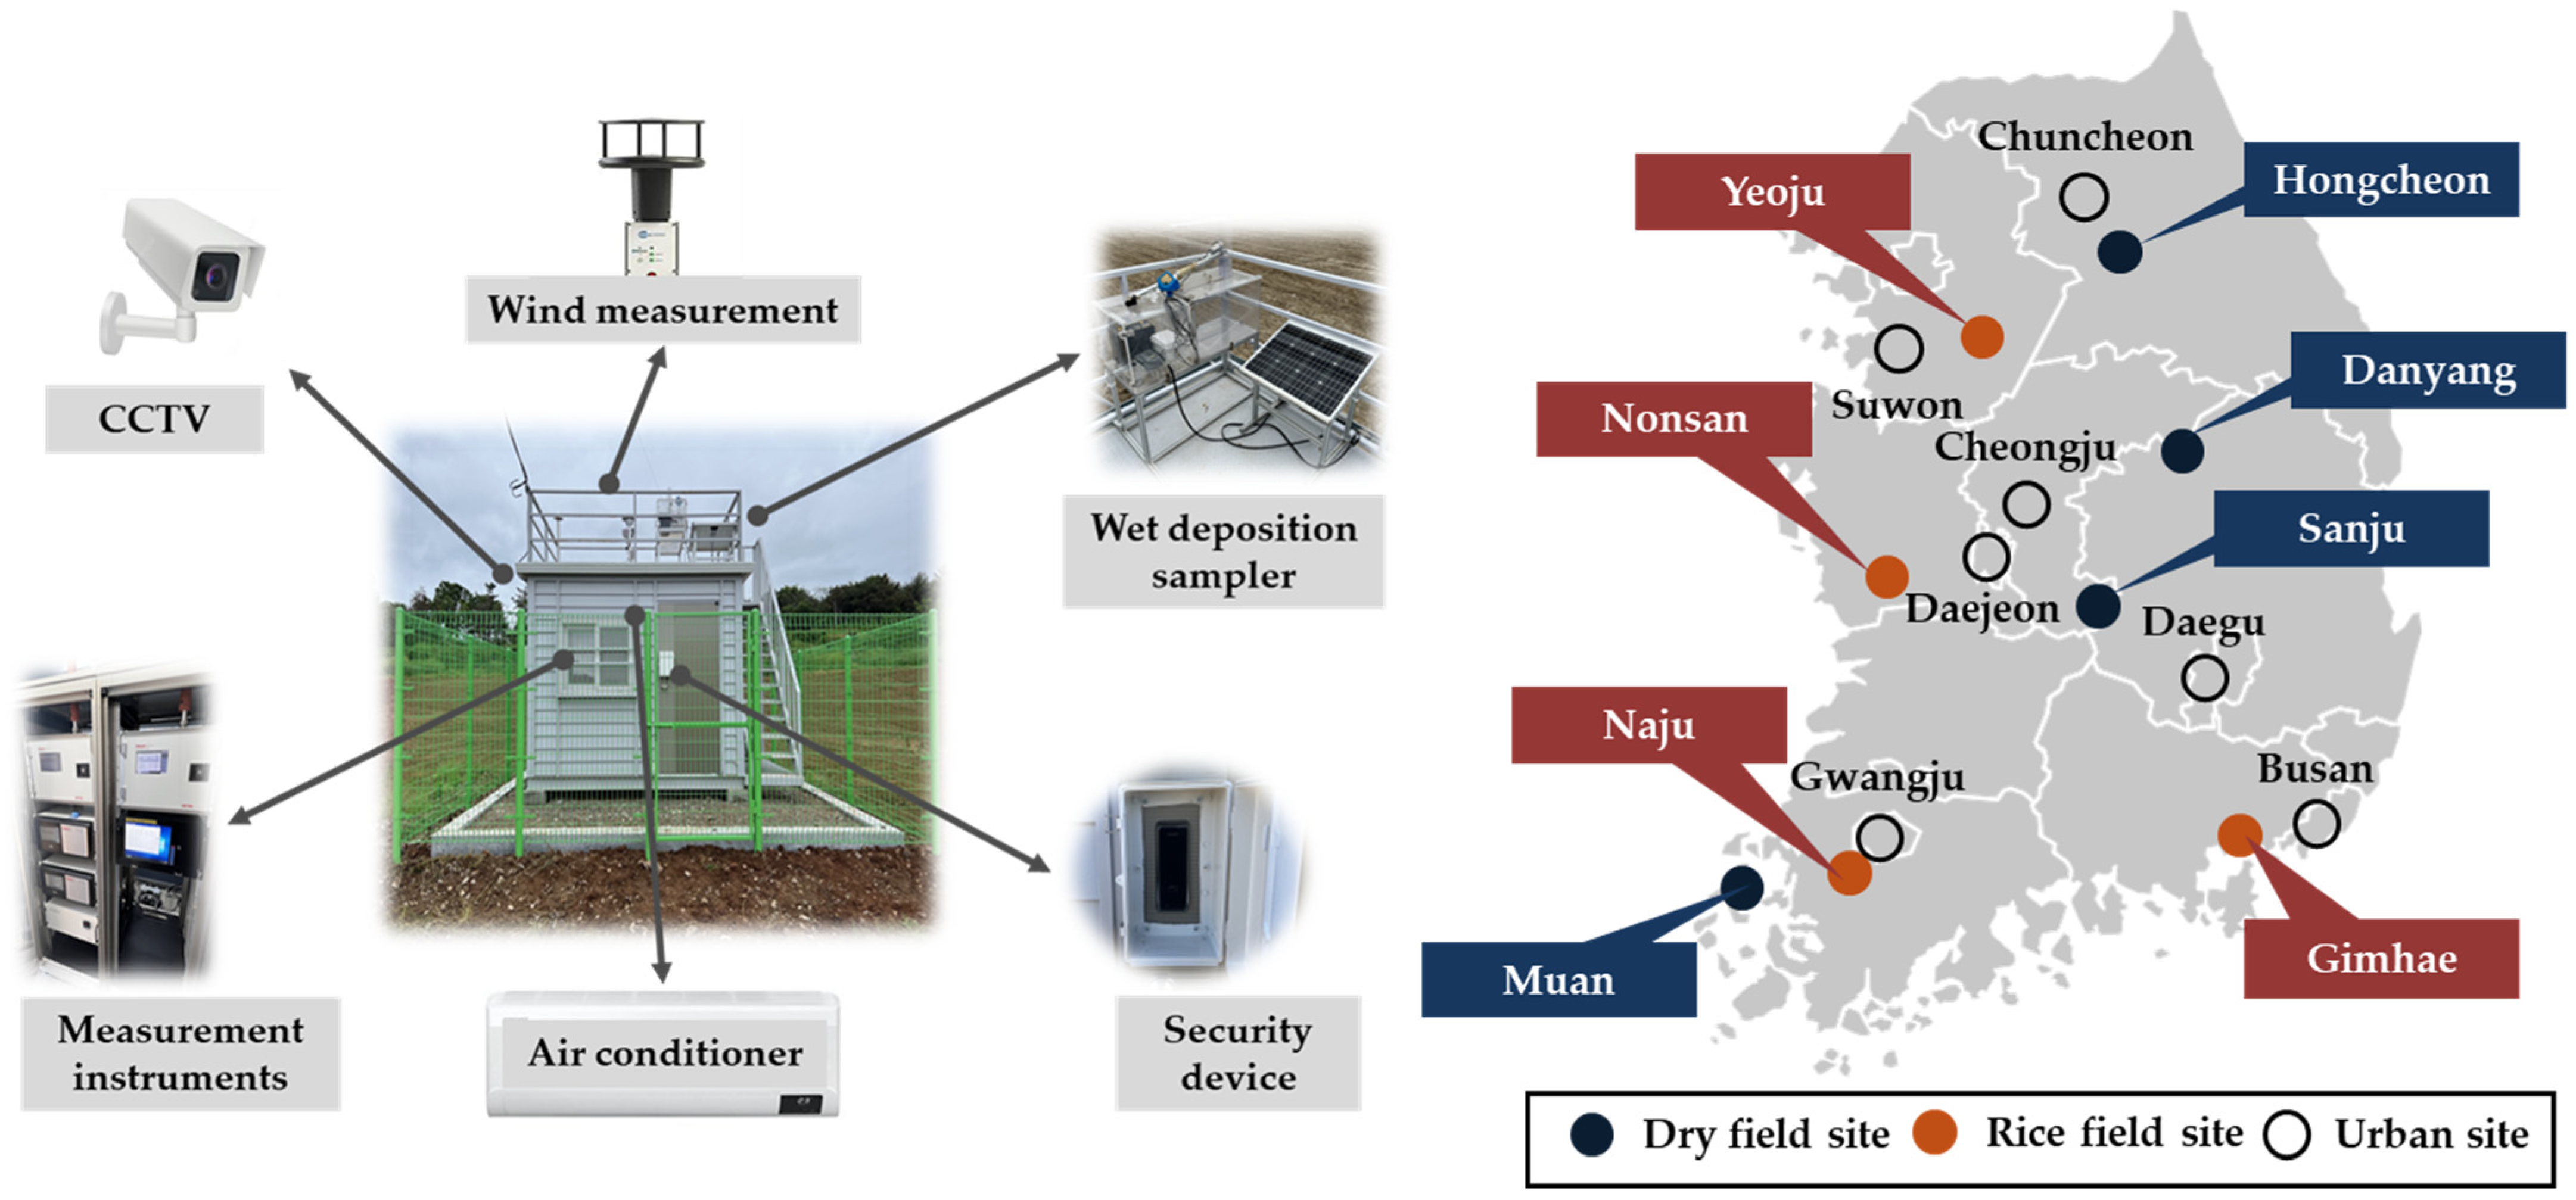
2.1. Monitoring Sites

Figure 1 shows the site composition and locations for agricultural air quality monitoring. The air quality monitoring system in agricultural areas includes measurement equipment for pollutants (e.g., PM, NOx, NH3, SO2), meteorological sensors (wind, rain), and an automatic wet precipitation sampler. It features a closed-circuit television (CCTV) and security devices for monitoring and protection, alongside air conditioning to maintain optimal conditions. This setup provides essential data for understanding and managing agricultural air pollution. The map illustrates the locations of air quality monitoring stations in agricultural regions across South Korea. These eight sites are categorized into rice cultivation areas (e.g., Nonsan, Naju, Gimhae, Yeoju) and upland crop regions (e.g., Hongcheon, Danyang, Sangju, Muan). The selection of these sites ensures comprehensive coverage of different agricultural environments, facilitating a better understanding of pollutant emissions and atmospheric interactions in agricultural areas. The specific criteria for site selection include spatially balanced distribution, the exclusion of non-agricultural influences, cultivation of representative crops, the exclusion of influence from livestock farms, and so on.

2.2. Measurement

Particulate matter (PM10 and PM2.5) was measured using the β-ray attenuation method (Mezus 610, Kentek, Daejeon, Korea), which quantifies particle concentration by analyzing beta radiation absorption [22]. Sulfur dioxide (SO2) was detected via the pulse UV fluorescence method (Mezus 110, Kentek, Daejeon, Korea), where SO2 molecules emit fluorescence upon ultraviolet excitation [23]. Nitrogen oxides (NO, NO2) were measured using the chemiluminescence method (Mzus 210, Kentek, Daejeon, Korea), which combines an NH3 converter with an NOx analyzer [24]. The measurement ranges were 0–2000 µg/m3 for PM and 0–1 ppm for gaseous pollutants, with data recorded at five-minute intervals. PM10 and PM2.5 were measured in micrograms per cubic meter (µg/m3) with a resolution of 1 µg/m3, while SO2 and NOx were in parts per million (ppm) with a resolution of 0.5 parts per billion (ppb). These methods comply with certification standards from the Korean Ministry of Environment and the U.S. EPA, ensuring reliable air quality assessments in agricultural regions. Wind speed, wind direction, temperature, and relative humidity were measured using an ultrasonic anemometer (KMS-4300, KEMIC corporation, Seongnam, Korea). For urban air quality monitoring, the largest city within each region encompassing an agricultural site was selected. Air quality data were obtained from monitoring stations located in the central areas of these cities. A total of seven cities were chosen: Suwon (Ingae-dong), Chuncheon (Yaksamyeong-dong), Daejeon (Dunsan-dong), Cheongju (Sacheon-dong), Gwangju (Yucheon-dong), Busan (Yousan-dong), and Daegu (Suchang-dong). Notably, Gwangju was selected as it is the largest city in the region that includes both the Muan and Naju agricultural sites. Urban air quality monitoring networks in Korea, managed by local governments, continuously measure criteria air pollutants (PM10, PM2.5, NO2, SO2, CO, and O3) along with meteorological variables such as wind direction, wind speed, temperature, and humidity in real time. All monitoring instruments employed are officially approved devices.

2.3. Data Processing and Maintenance

Since March 2023, monitoring sites have been measuring air pollution in agricultural areas, and the calibration and maintenance protocol for all measuring instruments and sampling systems was also periodically carried out. This study utilizes two years of measurement data from eight agricultural sites, covering the period from March 2023 to December 2024. The data were categorized into two periods: the full measurement period and the high-PM event period. High-PM episodes were identified as periods during which urban PM2.5 levels (24-h average) remained above Korea’s 24-h air quality standard of 35 μg/m3. Since air quality in agricultural areas has not been measured to date, high PM episodes were selected based on urban air quality standards (PM2.5). The dataset was processed using five-minute average data (raw data). Data affected by mechanical or electrical sparks, periods of constant values suggesting instrumental errors, and readings affected by inaccurate calibration were removed to ensure accuracy. The data presented in this study were averaged into one-hour intervals after data screening. Air quality data from near major cities (matched pairs: Daejeon–Nonsan, Gwangju–Naju, Busan–Gimhae, Suwon-Yeoju, Chuncheon-Hongcheon, Jecheon-Danyang, Daegu-Sangju, and Gwangju-Muan), measured by the urban air quality monitoring network, were also processed for a comparative analysis of agricultural and urban air quality. The average value of the eight sites was used as the representative value for each region, and the arithmetic means of the measurement data from the eight monitoring sites were used to calculate national average concentrations in agricultural and urban areas. Because each comparatively paired agricultural and urban area belongs to the same region, meteorological data such as temperature, relative humidity, and wind velocity measured at the agricultural site were applied equally. The data analysis period was divided into two main periods: (1) the entire measurement period and (2) the high-PM events period. In the daily variation analysis, different patterns were observed between summer and the other seasons. Thus, the period was divided into June to September and October to May, and the hourly averages for each period were used.

3. Results

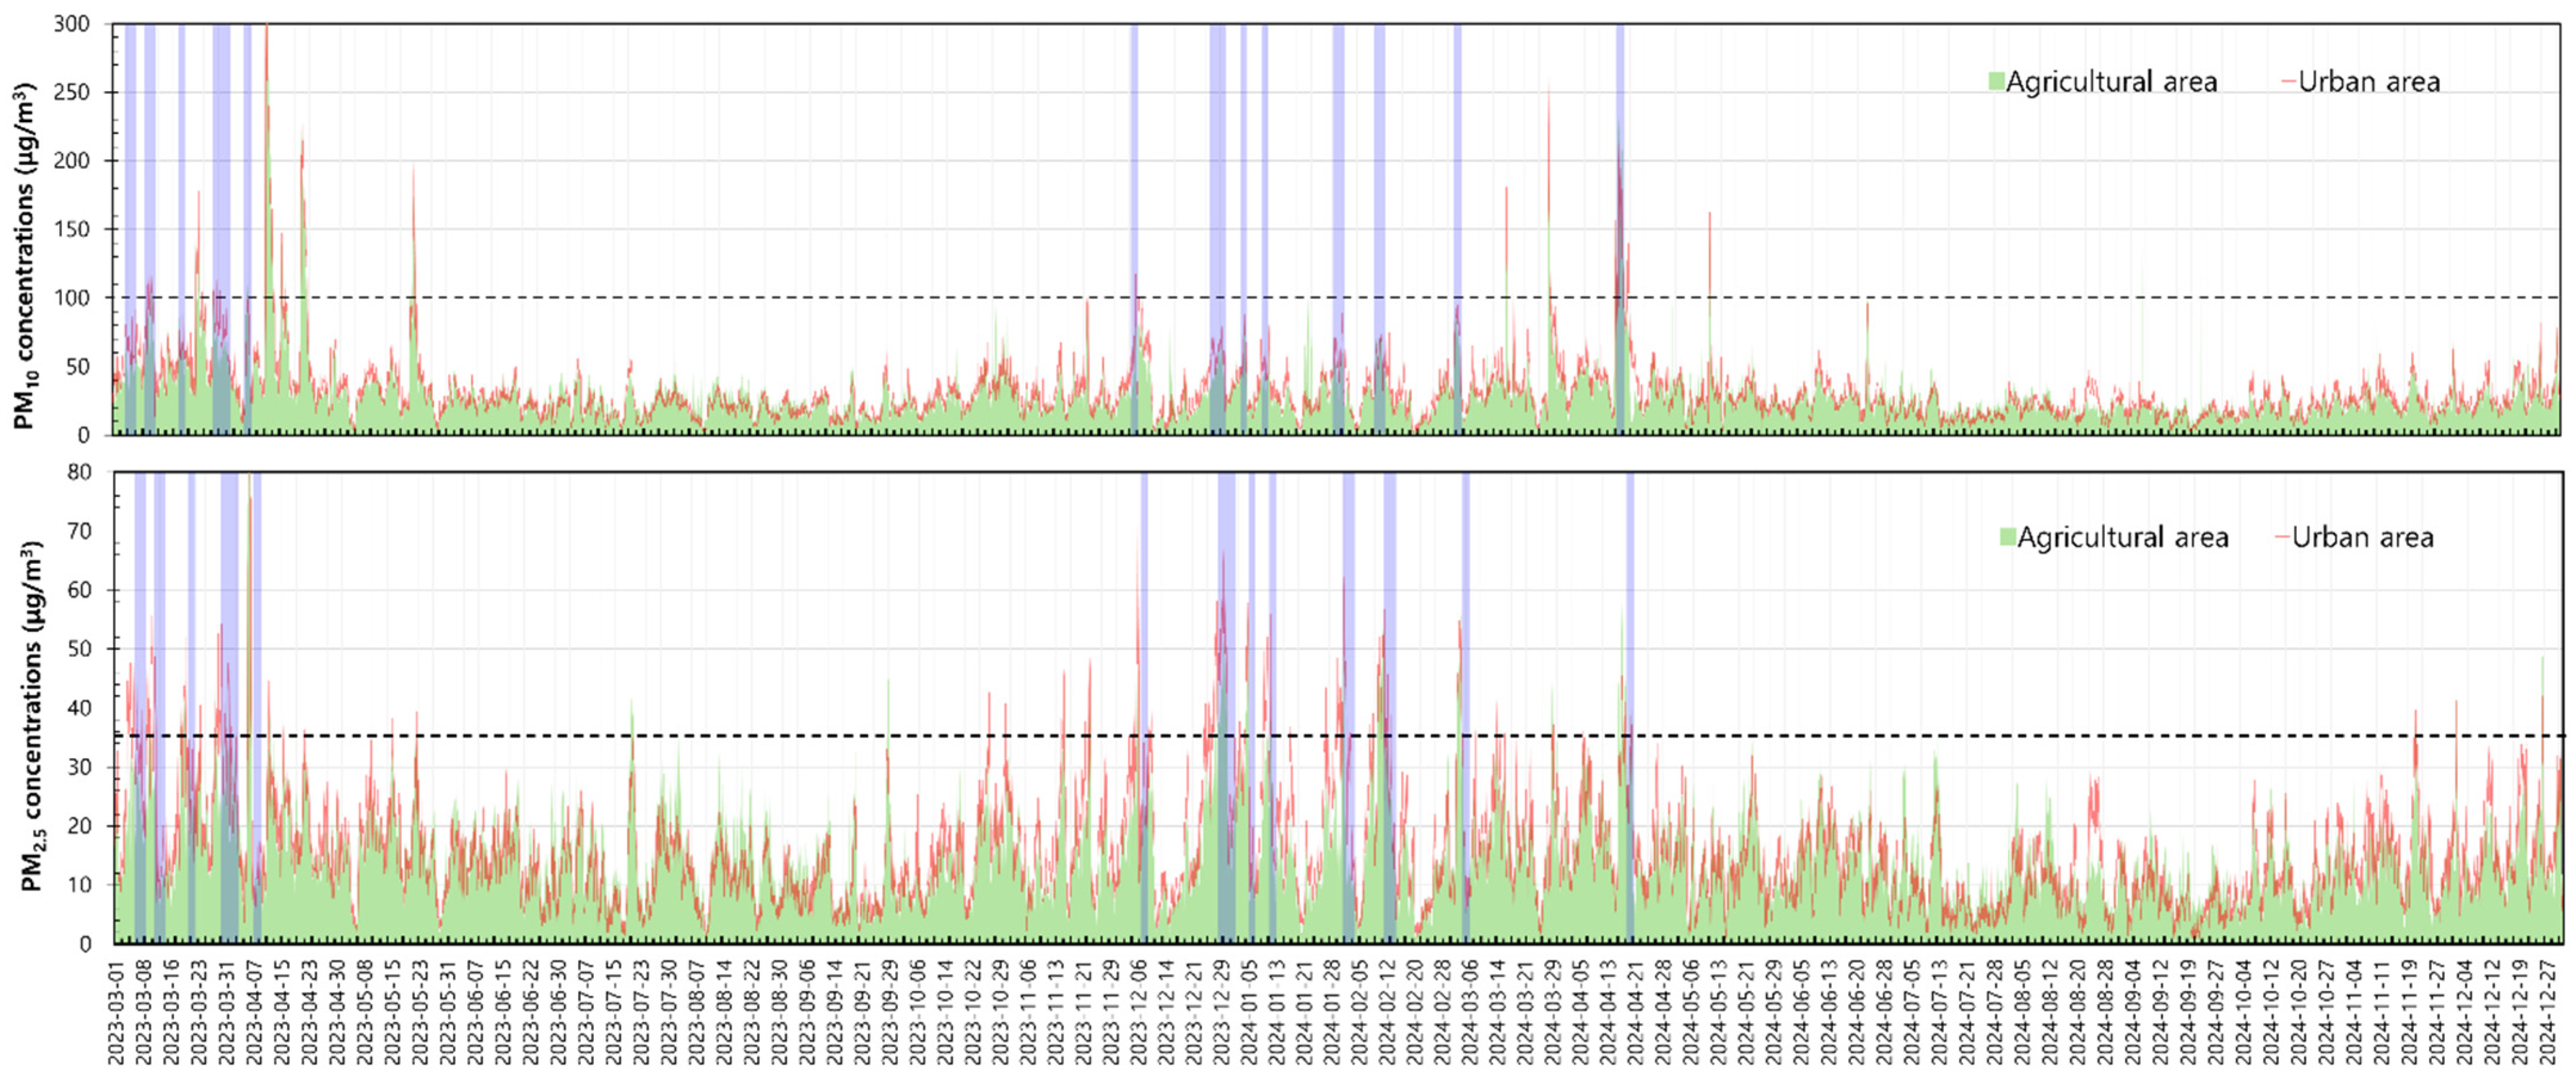
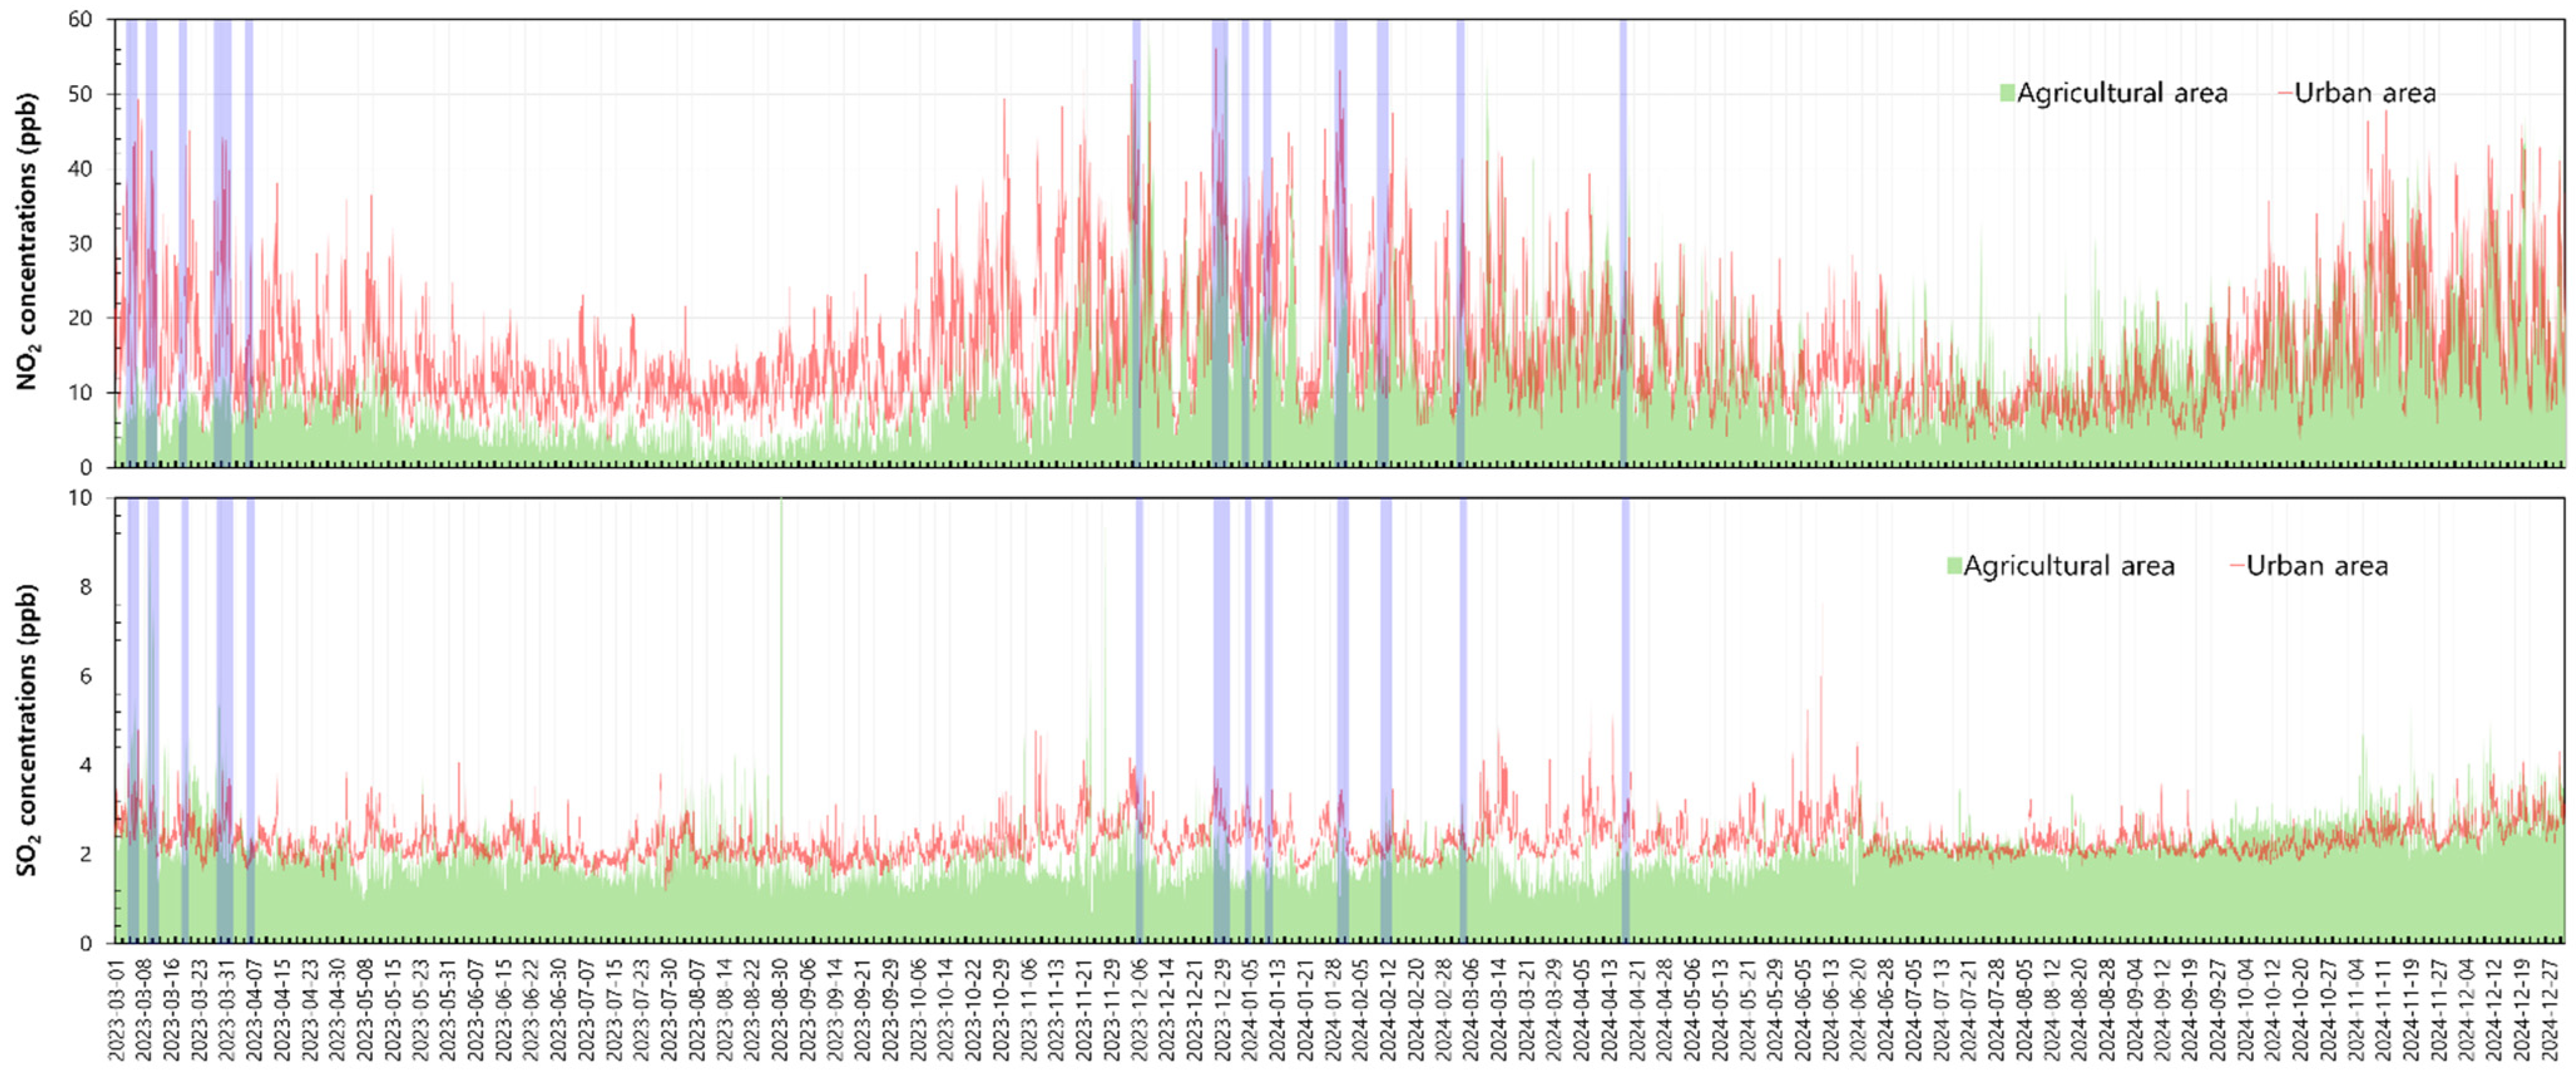
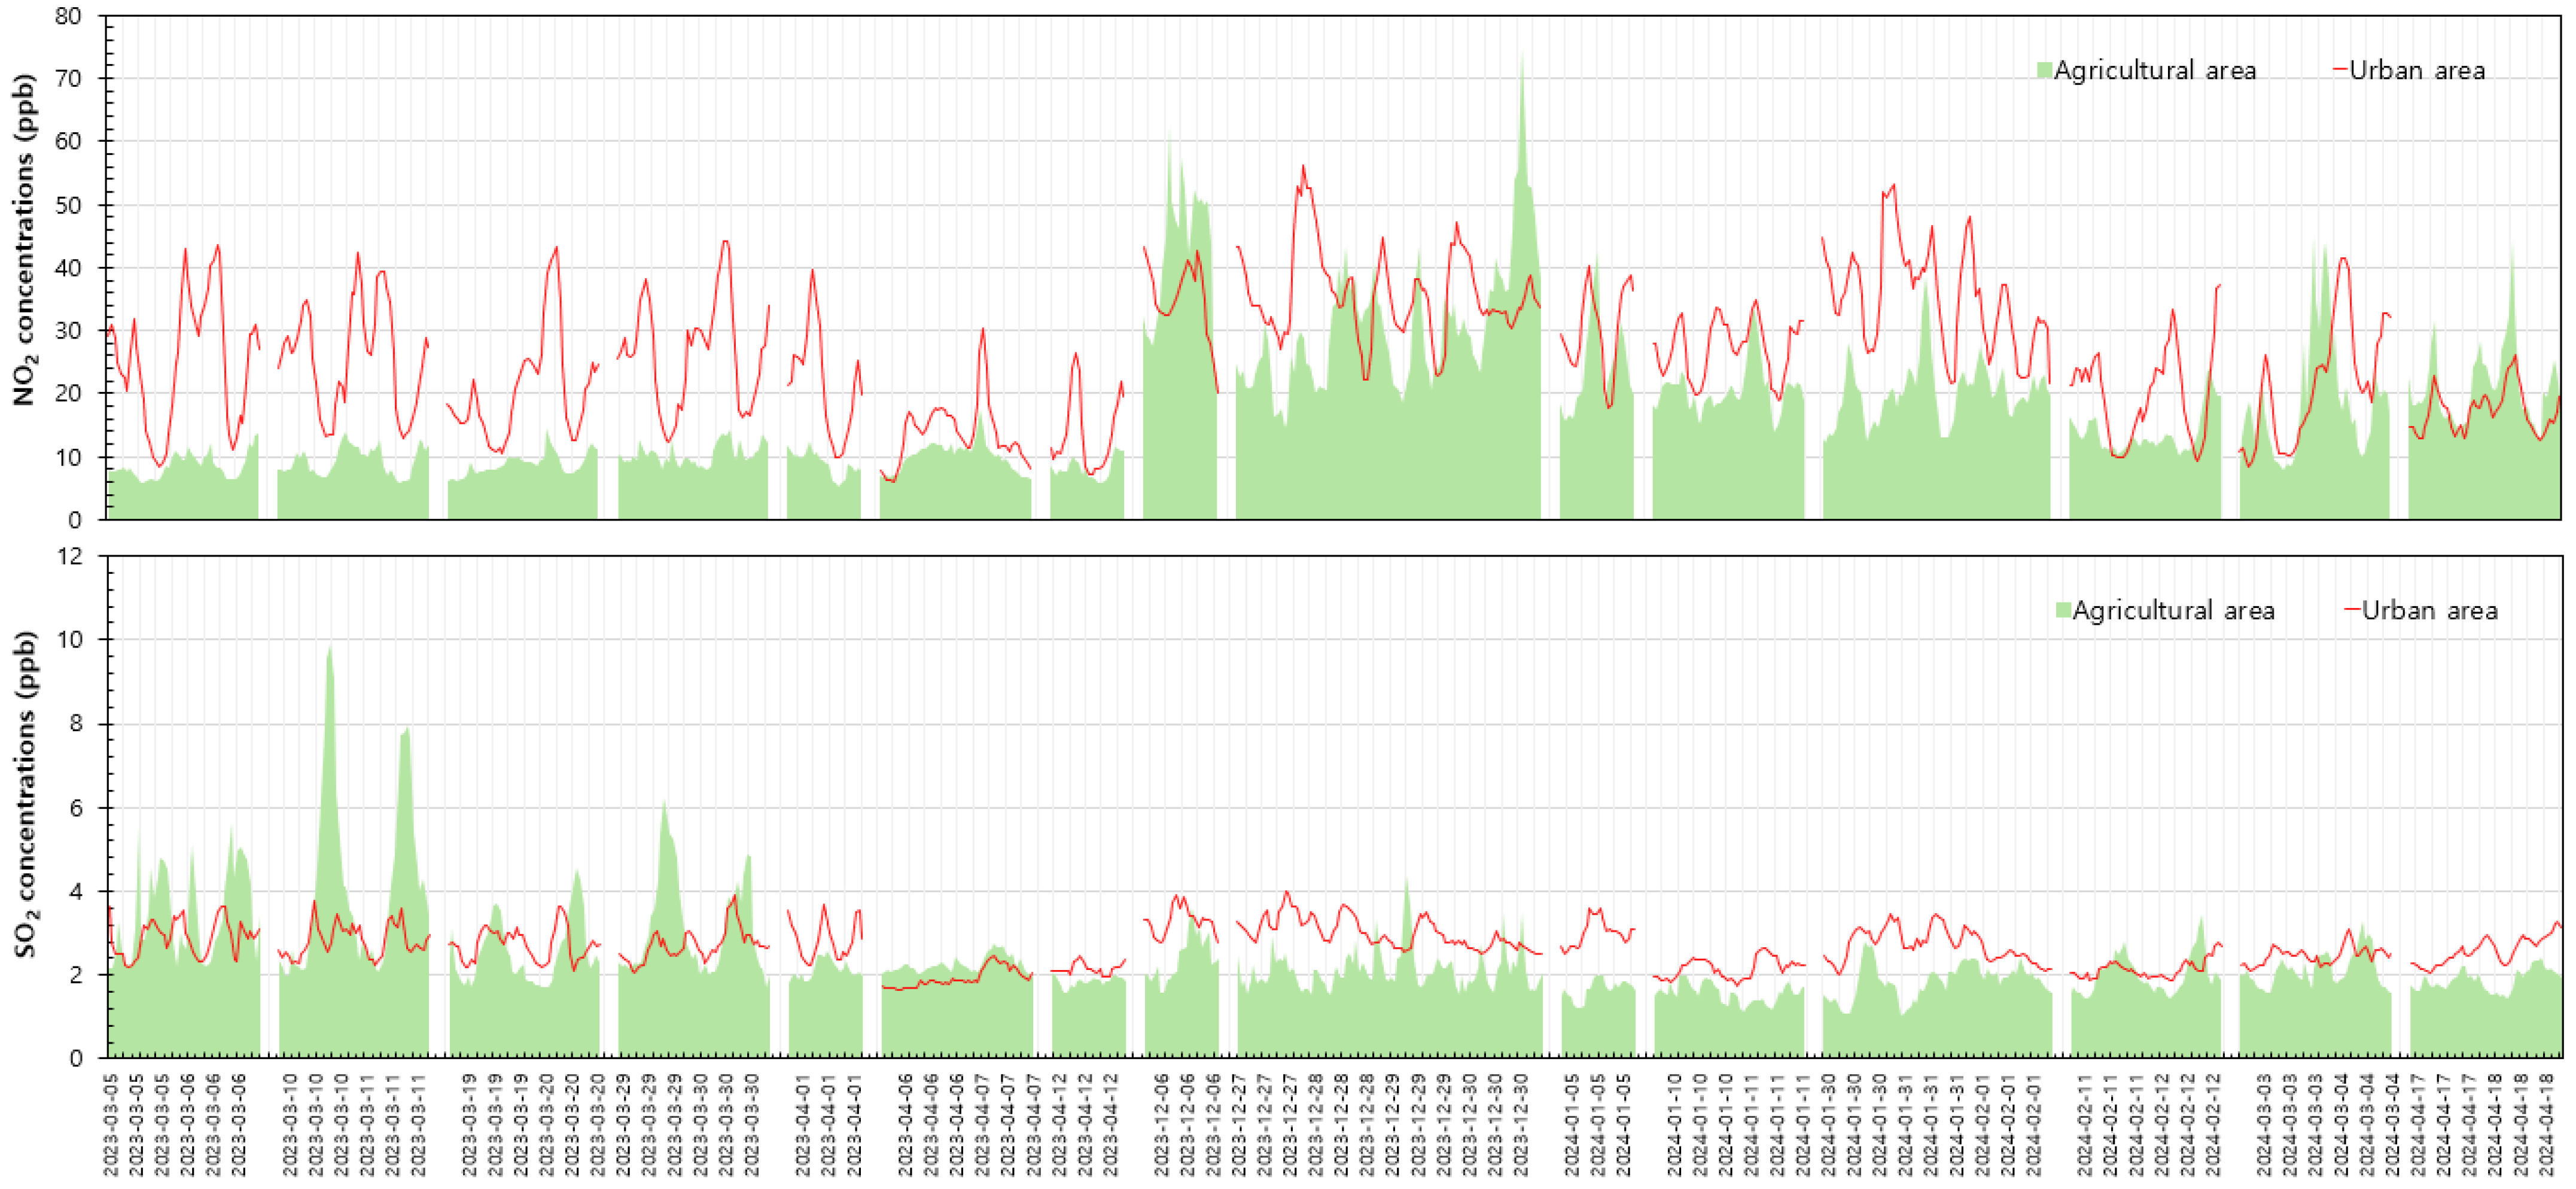
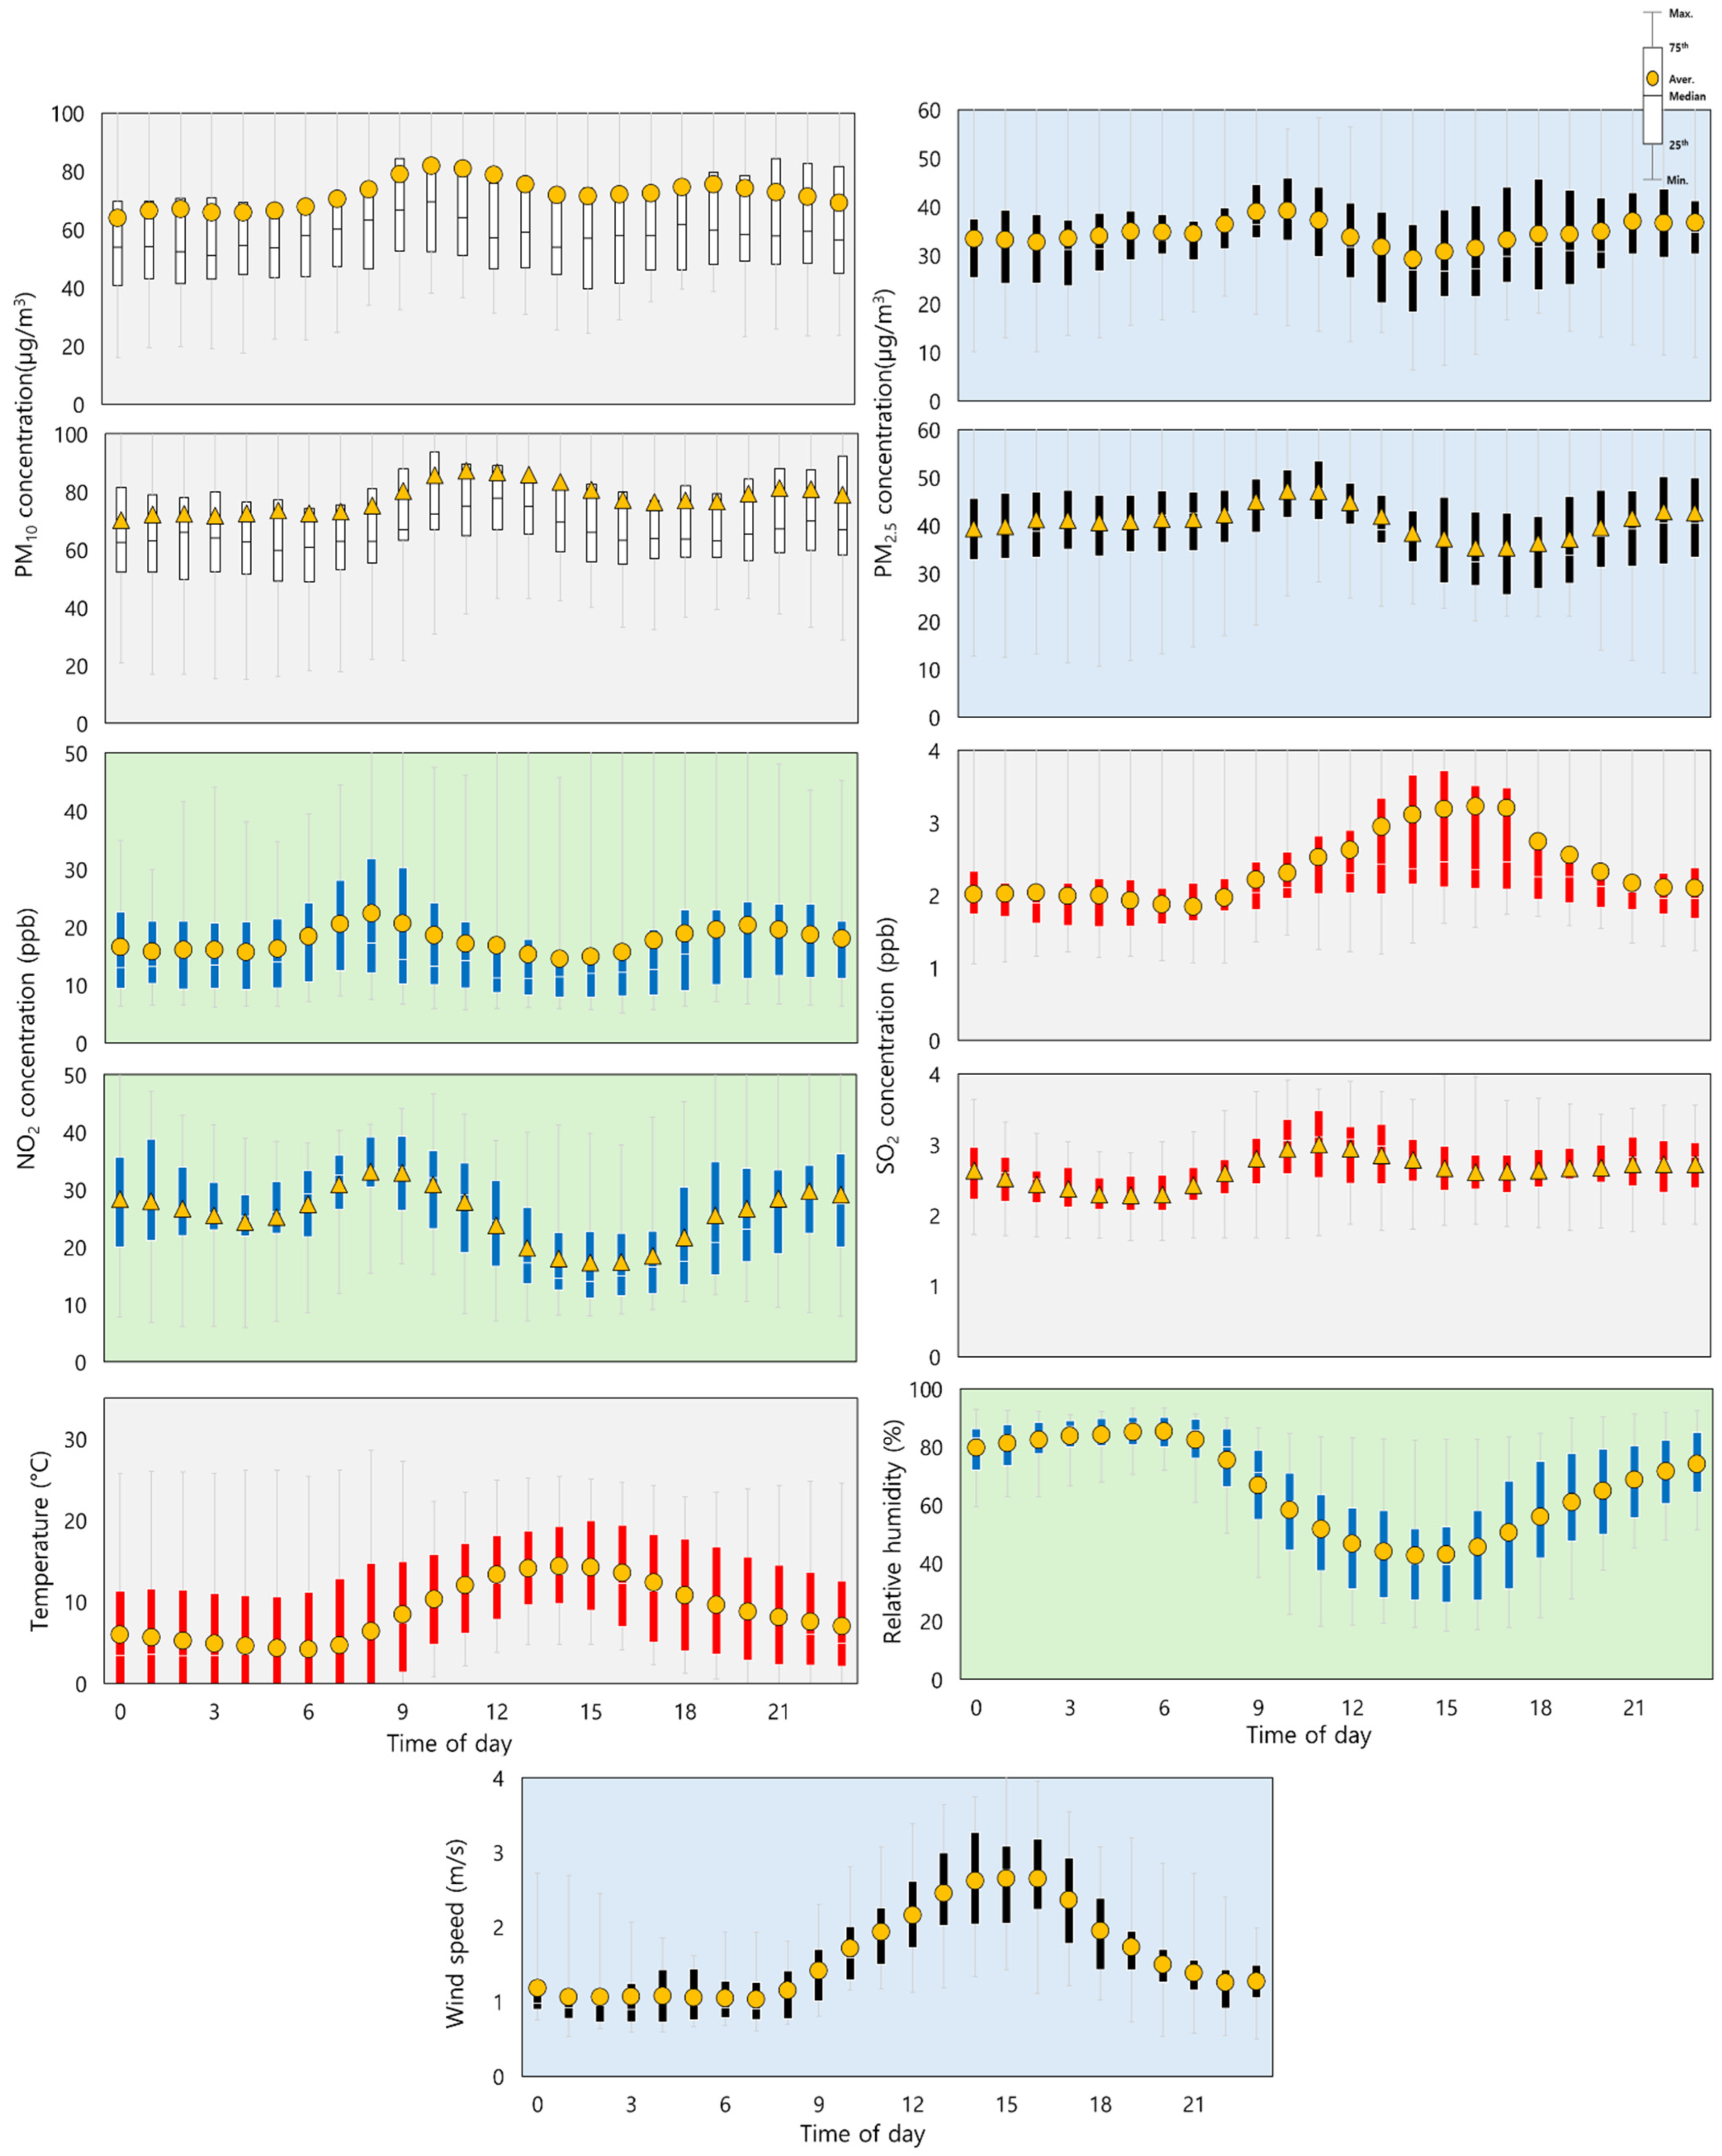
3.1. Comparative Analysis of Air Quality Between Agricultural and Urban Regions

Figure 2 illustrates time-series variations in average PM10 and PM2.5 concentrations measured at urban and agricultural monitoring sites from March 2023 to December 2024. High-PM event periods of fine particulate matter (PM2.5) occurred eight times in 2023 and six times in 2024 (29 days = 696 h). Considering that measurements began in March 2023, it can be observed that 2023 was a year with more frequent high-PM events than the year 2024. Most of these high-PM event periods occurred between December and April. Throughout the observation period, both urban and agricultural areas showed very similar concentration levels and variations, which can be attributed to the widespread spatial distribution of PM2.5 and PM10 pollution. Particularly, particulate matter generally showed higher concentrations in agricultural areas than in urban areas during the summer, with a more noticeable difference in PM2.5 levels. This suggests that the secondary formation mechanisms in the two regions differ during the summer. The increase in PM2.5 in agricultural areas during the summer is primarily attributed to enhanced ammonia (NH3) volatilization under high temperatures, leading to gas-to-particle conversion. This secondary particulate matter formation is more significant than physical activities such as plowing and harvesting, which are associated with coarse particles [20,25,26].
Figure 3 illustrates time-series variations in average NO2 and SO2 concentrations measured at urban and agricultural monitoring sites from March 2023 to December 2024. Similar to particulate matter, gaseous substances also exhibited a similar pattern of concentration changes between urban and rural areas, with higher concentrations observed in urban areas. This was because urban areas have a high concentration of emission sources of nitrogen oxides and sulfur oxide emissions compared to rural or agricultural areas. Assuming that the main sources of SO2 and NO2 emissions are in urban areas rather than agricultural areas, NO2 and SO2 undergo significant gas-to-particle conversion in urban areas [4,27].
Table 1 compares air quality data for urban and agricultural areas, focusing on PM10, PM2.5, NO2, and SO2 concentrations. Average PM10 levels are similar in both regions (urban: 31.36 µg/m3, agricultural: 31.04 µg/m3), though the maximum concentration is slightly higher in urban areas (361.67 µg/m3) compared to agricultural areas (313.46 µg/m3). For PM2.5, average concentrations are nearly identical (urban: 15.52 µg/m3, agricultural: 15.50 µg/m3). The maximum level is also higher in urban areas (96.00 µg/m3) than in agricultural areas (84.67 µg/m3). NO2 levels are higher in urban areas both on average (15.42 ppb vs. 12.50 ppb) and at peak concentrations (56.14 ppb vs. 74.88 ppb), reflecting more consistent urban pollution. SO2 levels are slightly higher on average in urban areas (2.33 ppb vs. 2.11 ppb), while agricultural areas experience higher peak concentrations (7.63 ppb vs. 11.56 ppb). The averages from March 2023 to December 2024 also showed a similar trend to the averages for each year. Overall, urban areas exhibit more consistent pollution, while agricultural regions experience occasional spikes in certain pollutants.
Figure 4 illustrates the diurnal patterns of particulate matter concentrations and meteorological parameters in agricultural and urban areas. Significant seasonal differences in fine particulate matter (PM2.5) levels were observed. During summer, agricultural areas exhibited higher PM2.5 concentrations, whereas urban areas experienced elevated levels in all other seasons. Kim et al. (2021) compared agriculture in a specific region (Gochang, southwestern Korea) with urban areas and found that dry field areas had lower PM2.5 concentrations during the summer of 2020, while dry field areas showed higher PM2.5 levels in all other seasons [4]. The result differs somewhat from the findings of this study. This discrepancy arises because our study used average values from eight sites distributed across the Korean Peninsula, while Kim et al.’s study focused on a specific area, comparing a single dry field site with a nearby urban site [4]. In general, many studies have reported that PM2.5 concentrations in urban areas are higher than those in rural or background regions [6,13,14,15]. Ammonia concentrations also exhibit seasonal variations between rural and urban areas. Rural regions generally have higher NH3 levels due to agricultural activities like fertilizer use and livestock farming [17]. In rural areas, NH3 peaks in summer due to increased volatilization, while winter sees the lowest levels due to reduced emissions. It is generally known that ammonia concentrations are lower in urban areas and emissions from traffic and industry contribute to seasonal fluctuations. NH3 volatilization is known to intensify with increasing temperatures [28,29]. In Korea, summer farming activities are particularly active, with dry fields undergoing repeated fertilization, sowing, and harvesting of crops such as lettuce, chili peppers, and sesame, while rice paddies receive additional fertilizer to enhance growth. Unlike urban areas, which are largely covered with concrete and asphalt, agricultural areas are primarily characterized by soil surfaces containing relatively high NH3 content. This environmental difference contributes to the greater NH3 volatilization observed in agricultural regions during the summer. Although the contribution of ammonia to secondary particulate matter formation has been widely studied globally, this aspect is not addressed in the present study due to the absence of a detailed analysis of particulate-phase ions on secondary formation. During the summer, the highest PM2.5 concentrations in urban areas were observed between 9 AM and 12 PM, both in the morning and afternoon. In contrast, agricultural areas exhibited their peak PM2.5 levels earlier in the day, typically between 6 AM and 9 AM, occurring approximately three hours earlier than in urban areas. Specifically, the highest PM2.5 concentrations in agricultural areas were observed between 6 PM and 9 PM, while the highest concentrations in urban areas tended to occur between 9 AM and 12 PM. Previous research has shown that PM2.5 concentrations in urban areas peak between 9 AM and 12 PM, decrease afterward, and then rise again in the evening, continuing to increase until midnight [6]. A previous monitoring study conducted in an agricultural area (dairy farm) observed a PM2.5 peak between 6 AM and 9 AM, followed by a decrease. Another peak was observed in the evening, between 6 PM and 10 PM [20]. These PM2.5 daily variations are consistent with the findings of this study. Elevated PM concentrations in agricultural areas during the early morning hours can be attributed to three main factors. First, pollutants emitted from urban traffic may disperse into agricultural areas. Second, early morning agricultural activities generate local emissions. Third, lower morning temperatures reduce the height of the planetary boundary layer (PBL), resulting in the accumulation of particulate matter near the surface. PM2.5 concentrations were highest during times of high temperatures (wind speed) and low humidity, and also showed high levels when humidity was high. Regardless of the season, PM2.5 concentrations in agricultural areas followed a pattern closely resembling that of humidity among the meteorological factors.
Figure 5 presents the diurnal variations of NO2 and SO2 concentrations in agricultural and urban areas. The concentrations of both NO2 and SO2 were generally higher in urban areas. NO2 levels reached their peak during the morning and evening rush hours at both urban and agricultural sites, with lower concentrations observed during the late morning and around 3 PM. While NO2 levels in urban areas showed consistent diurnal variation across seasons, agricultural areas in summer exhibited a unique pattern, characterized by a midday decrease in concentration and relatively stable levels throughout the rest of the day. NO2 emissions are commonly associated with automobiles. From October to May, both agricultural and urban areas are primarily influenced by vehicle emissions during rush hours, and this result is consistent with previous research findings [6]. During the summer months, NO2 concentrations in urban areas continue to be affected by vehicle emissions, while agricultural areas are mainly influenced by other factors (meteorological parameters, agricultural activities, and so on) rather than vehicle emissions. SO2 concentrations followed a simpler diurnal pattern, increasing during daylight hours and decreasing afterward. The concentration levels and diurnal patterns of SO2 were nearly identical between urban and agricultural areas in summer. The diurnal variation pattern of SO2 concentrations in both urban and agricultural areas follows a trend similar to temperature and wind speed, increasing in the morning, peaking during the hottest hours, and then decreasing afterward [30]. Luvsan et al. (2012) reported that in Mongolia, SO2 concentrations are directly proportional to humidity and inversely proportional to temperature [30,31]. On the other hand, some studies have reported that SO2 concentrations are directly proportional to temperature and that their relationship with climate and urban location (e.g., coastal cities) can vary, showing either a direct or inverse correlation to temperature [32,33]. At this point, the diurnal variation patterns of SO2 concentrations cannot be clearly defined. A more in-depth study is needed to assess the contribution of SO2 to secondary formation and to analyze its correlations with various factors using statistical methods.

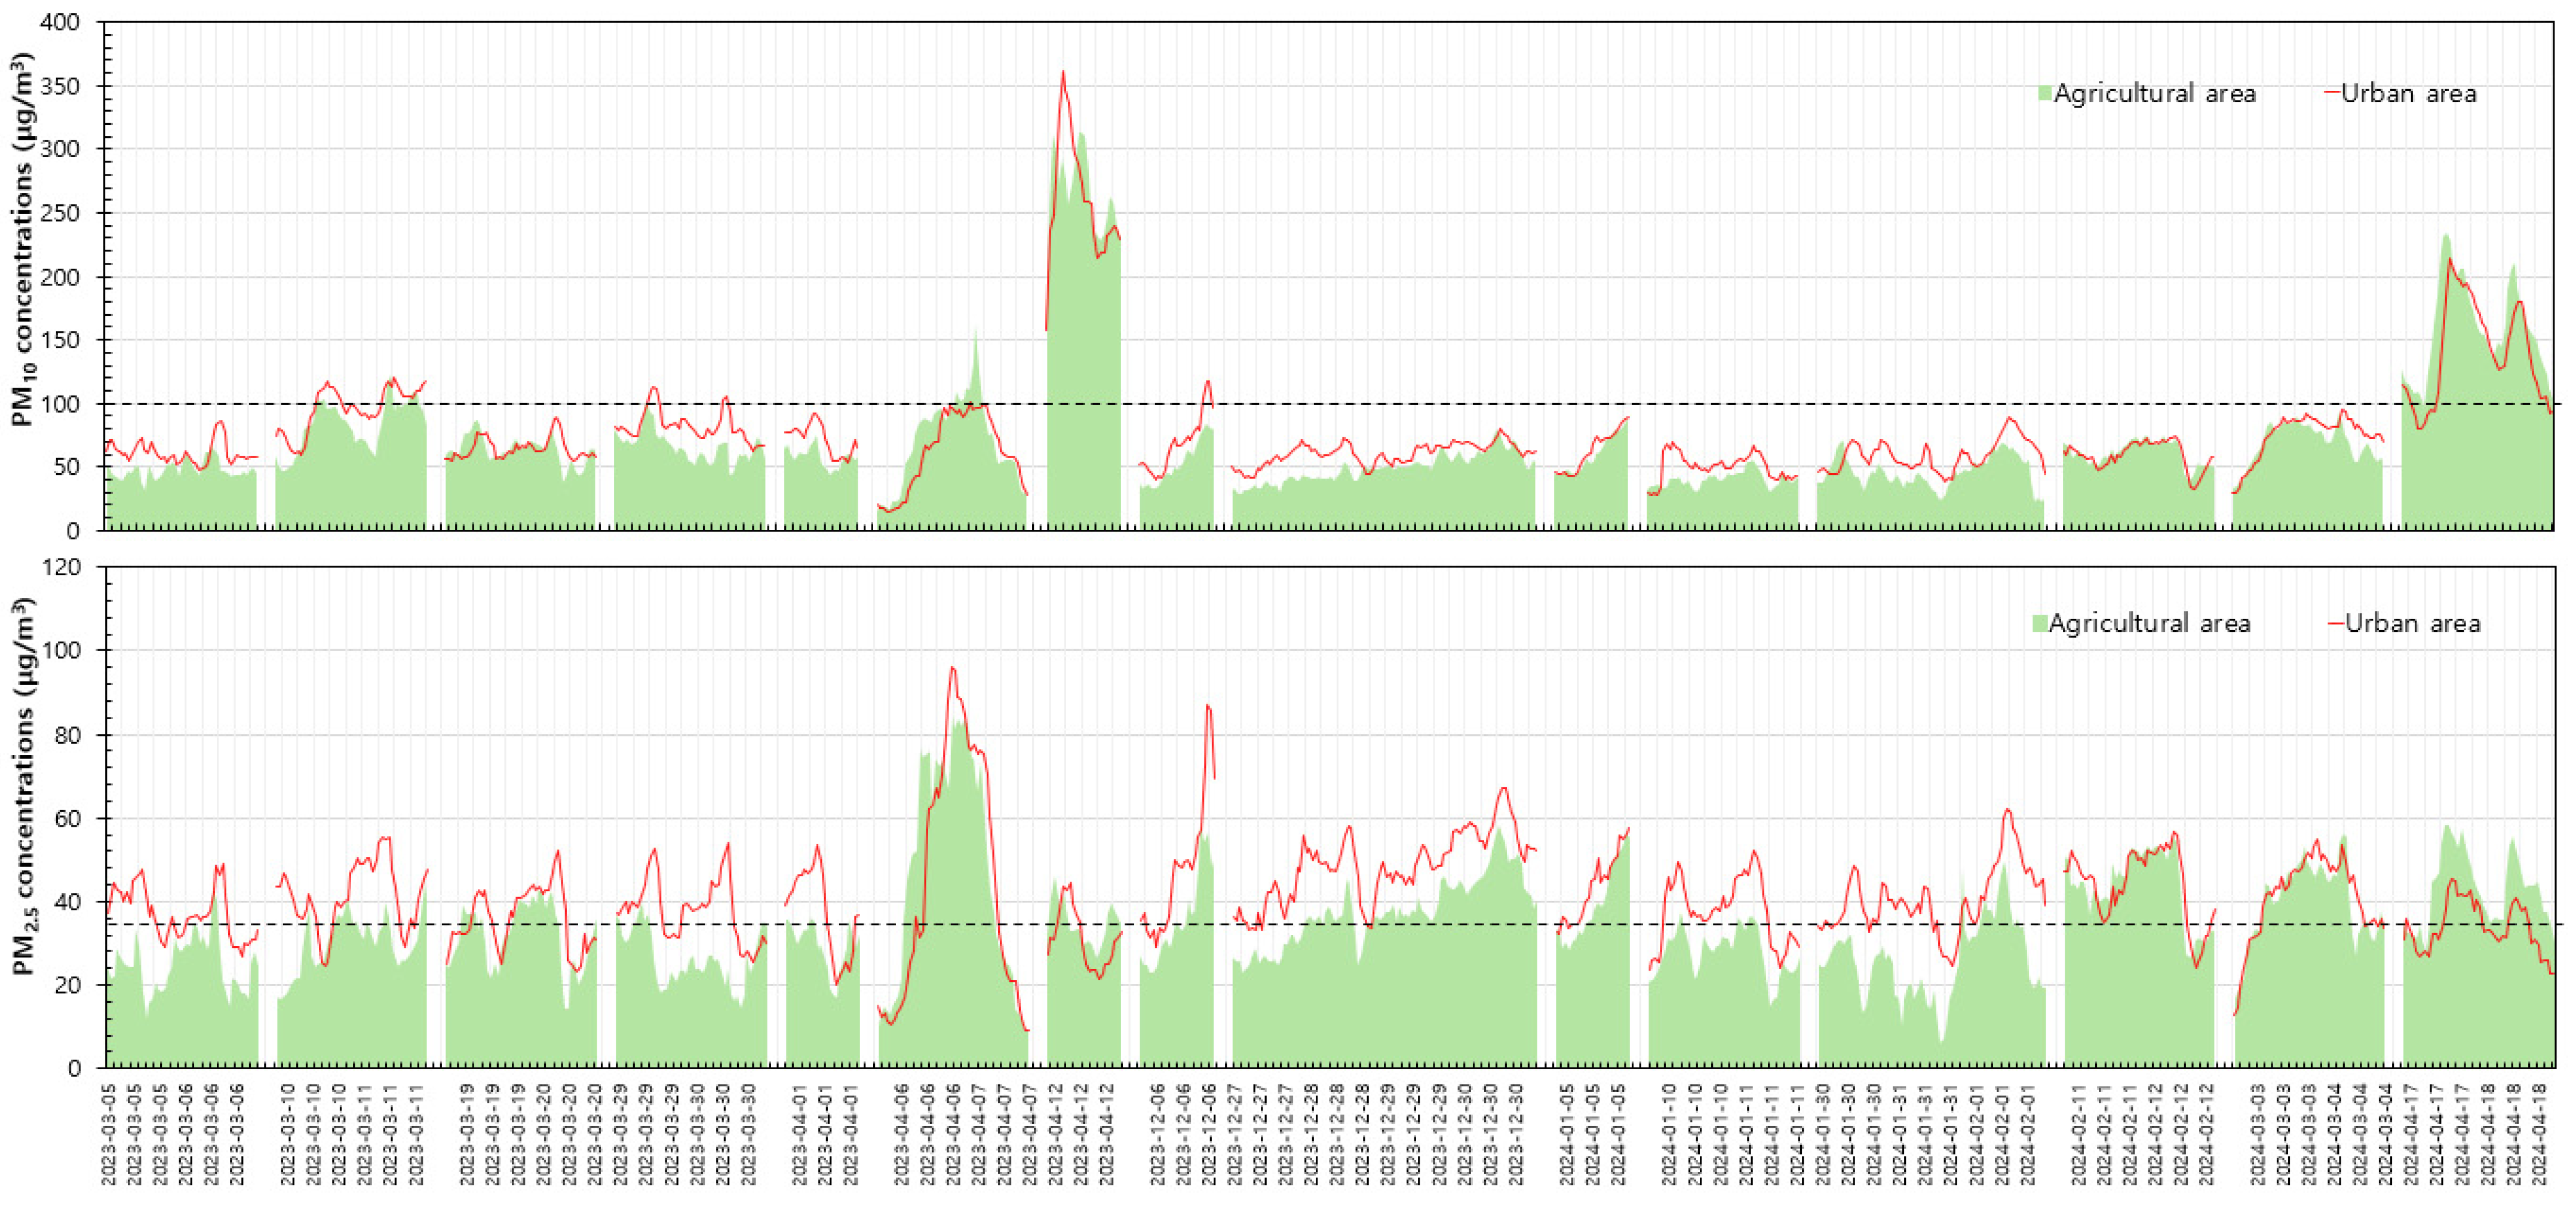
3.2. Comparative Analysis of Air Quality in High-PM Event Periods

Figure 6 and Figure 7 show the concentrations of particulate matter, NO2, and SO2 during high-PM event periods in urban and agricultural areas. In general, pollutant concentrations were higher in urban areas than in agricultural areas. During Asian Dust episodes, coarse particles typically increase, which lowers the PM2.5/PM10 ratio. On 12 April 2023, and 17–18 April 2024, this pattern suggests that these periods corresponded to Asian Dust events [34,35]. In contrast, the PM10 ratio was relatively lower than PM2.5 concentrations on 6–7 April 2023, suggesting that the secondary formation of fine particles might have been dominant during this period. The notably high NO2 concentrations observed in December 2023 are significant. In March 2023, when cultivation was being prepared, high SO2 concentrations were detected in agricultural regions. The high concentrations during certain periods are likely closely associated with large-scale agricultural activities (land preparation, open burning of agricultural residues, use of farming machinery, fertilizer application, and so on) conducted during those times.
Table 2 compares the concentrations of PM10, PM2.5, NO2, and SO2 during high-PM event periods at eight sites in urban and agricultural areas. During the high-PM event season, not only the concentration of particulate matter but also that of gaseous substances significantly increased, compared to those during the entire measurement period. Urban areas show higher average concentrations of PM10 (77.98 µg/m3) and PM2.5 (40.85 µg/m3) compared to agricultural areas (PM10: 71.98 µg/m3, PM2.5: 34.40 µg/m3), with higher maximum values in urban areas (PM10: 361.67 µg/m3, PM2.5: 96.00 µg/m3). NO2 levels are also higher in urban areas (average: 25.71 ppb) compared to agricultural areas (17.69 ppb), with urban maximums reaching 56.14 ppb. SO2 concentrations are slightly higher in urban areas on average (2.63 ppb), but peak levels are much higher in agricultural areas (9.91 ppb vs. 3.98 ppb in urban areas). These findings suggest that urban areas experience higher average pollution levels, while agricultural areas see occasional peaks, particularly in SO2.
Figure 8 shows diurnal patterns of particulate matter, NO2, and SO2 concentrations and meteorological parameters in agricultural and urban areas. During high-PM event periods, the concentrations of particulate matter were higher in urban areas than in agricultural areas across all time points. Both urban and agricultural areas exhibited similar diurnal patterns. In agricultural areas, PM2.5 concentrations peaked between 9 and 10 AM, while in urban areas, the peak occurred between 10 and 11 AM, with the lowest concentrations observed between 2 and 4 PM. NO2 concentrations were highest around 8 AM in both agricultural and urban areas, with the lowest levels observed between 2 and 4 PM, suggesting that gas-to-particle (nitrate) conversion from NO2 in the atmosphere may have influenced these patterns. In urban areas, PM10, PM2.5, NO2, and SO2 all followed similar diurnal patterns, whereas SO2 exhibited a single peak between 3 and 6 PM in agricultural areas. This unusual pattern is likely due to increased emissions from SO2 sources depending on weather conditions [34,35,36]. Notably, the concentration difference of PM2.5 between urban and rural areas was significantly higher than that of PM10. Compared with Figure 4, this result highlights a distinct feature of high-PM event periods, likely linked to secondary formation. Seinfeld and Pandis (2016) emphasized that secondary aerosols play a key role in urban air pollution; higher concentrations of oxidants (OH radicals, NO) and precursor gases (NH3, SO2, NO2) enhance gas-to-particle conversion compared to rural areas [37]. Huang et al. (2014) and Zhang et al. (2015) further support this, showing that secondary formation significantly contributes to urban particulate pollution, especially during haze events [11,38]. Similar to the previous findings, SO2 concentrations in agricultural areas during high-concentration periods exhibited a pattern consistent with temperature and wind speed trends, suggesting that meteorological factors predominantly influence SO2 levels in agricultural regions. To interpret it more clearly, further investigation through correlation and statistical analysis is warranted.
In this study, CO and O3, which are among the criteria air pollutants in Korea, were not included as measurement parameters. A previous study highlighted the importance of measuring carbonaceous components in agricultural areas [39]. Ozone concentrations have also been observed to be high in agricultural areas [4]. Therefore, it is considered necessary to include carbonaceous components and O3 as measurement items when establishing and operating air quality monitoring networks in agricultural areas in the future.

4. Conclusions

This study aimed to establish air pollution monitoring stations in agricultural areas across Korea, as air pollution monitoring has not been implemented in these regions. Eight stations were set up in agricultural areas, and real-time measurements of PM10, PM2.5, SO2, NOx, and NH3 were conducted from March 2023 to December 2024. A comparative analysis was performed between air quality in agricultural and urban environments during the entire measurement period and high-PM episodes. Overall, the concentration of particulate matter was observed to be similar in both agricultural and urban areas, while gaseous pollutants were higher in urban areas than in agricultural areas. In summer, PM2.5 concentrations were higher in agricultural areas than in urban areas, indicating differences in secondary formation mechanisms. Gaseous substances showed similar diurnal concentration patterns in urban and agricultural areas but were higher in urban areas due to more nitrogen oxide and sulfur oxide emission sources. PM2.5 concentrations were higher in agricultural areas during summer due to ammonia emissions from fertilizer, while urban areas had consistently high levels in other seasons. High-PM events were more frequent in 2023 than in 2024, with most occurring between December and April. During high-PM event periods, particulate matter concentrations were higher in urban areas, with both urban and agricultural areas showing similar diurnal patterns. The greater difference in PM2.5 levels between urban and agricultural areas suggests that secondary formation plays a key role, driven by higher concentrations of oxidants and precursor gases in urban environments. Meteorological factors, particularly temperature and wind speed, primarily influence SO2 concentrations in agricultural areas during high-PM event periods. The findings of this study will provide valuable insights into the behavior of airborne pollutants in agricultural settings and contribute to the development of targeted strategies for improving air quality management in these regions. The results of this study are intended as a valuable baseline for understanding the average air quality conditions in Korea’s agricultural regions and to support future more in-depth and comprehensive investigations. Future research will include a comprehensive analysis of the relationships between gaseous precursors such as ammonia—which were not addressed in the present study—and particulate matter, as well as their associations with meteorological factors. Various statistical techniques will be applied to elucidate the dynamics of air pollutants in agricultural areas. In addition, it is considered necessary to include carbonaceous components and ozone as measurement parameters when establishing monitoring stations in agricultural areas in the future.

Author Contributions

Conceptualization, H.-S.J., J.-H.K. and B.-W.O.; methodology, J.-D.B., M.-W.K. and H.-S.J.; software, J.-D.B. and S.-H.B.; validation, H.-S.J. and J.-D.B.; formal analysis, J.-D.B. and S.-H.B.; investigation, J.-D.B., H.-S.J. and S.-H.B.; data curation, H.-S.J., J.-D.B., S.-H.B., J.-H.K. and B.-W.O.; writing—original draft preparation, J.-D.B. and H.-S.J.; writing—review and editing, H.-S.J.; visualization, J.-D.B., M.-W.K. and S.-H.B.; supervision, H.-S.J.; project administration, J.-H.K., B.-W.O. and M.-W.K.; funding acquisition, J.-H.K. and M.-W.K. All authors have read and agreed to the published version of the manuscript.

Funding

This work was carried out with the support of the “Cooperative Research Program for Agriculture Science and Technology Development” (Project No. RS-2022-RD010348), Rural Development Administration, Republic of Korea.

Data Availability Statement

The data that support the findings of this study are available from the corresponding authors, [H.-S.J] and [J.-H.K], upon reasonable request.

Conflicts of Interest

The authors declare no conflicts of interest.

Abbreviations

The following abbreviations are used in this manuscript:
PM10Particulate matter with diameters less than 10 microns
PM2.5Particulate matter with diameters less than 2.5 microns
SO2Sulfur dioxide
NO2Nitrogen dioxide
AMAnte meridiem
PMPost meridiem
WHOWorld Health Organization
NH3Ammonia
NOxNitrogen oxides
CCTVClosed-circuit television
UVUltraviolet
ppbPart per billion
U.S. EPAUnited States Environmental Protection Agency
OHHydroxyl
NONitrogen monoxide

References

  1. Kim, K.-H.; Jahan, S.A.; Kabir, E. A review on human health perspective of air pollution with respect to allergies and asthma. Environ. Int. 2013, 59, 41–52. [Google Scholar] [CrossRef]
  2. World Health Organization (WHO). Air Pollution and Health; WHO: Geneva, Switzerland, 2021. Available online: https://www.who.int/news-room/fact-sheets/detail/ambient-(outdoor)-air-quality-and-health (accessed on 17 March 2025).
  3. Wyer, K.E.; Kelleghan, D.B.; Blanesidal, V.; Schauberger, G.; Curran, T.P. Ammonia emissions from agriculture and their contribution to fine particulate matter: A review of implications for human health. J. Environ. Manag. 2022, 323, 116285. [Google Scholar] [CrossRef] [PubMed]
  4. Kim, M.; Kim, J.; Kim, K.; Hong, S. Study on the Emission Characteristics of Air Pollutants from Agricultural Area. Korean J. Environ. Agric. 2021, 40, 211–218. [Google Scholar] [CrossRef]
  5. Jung, C.H.; Kim, Y.P. Current status of air quality and greenhouse gas monitoring networks: Case studies from various countries and implications for South Korea. J. Korean Soc. Atmos. Environ. 2024, 40, 704–732. [Google Scholar] [CrossRef]
  6. Oh, S.-H.; Oh, S.-H.; Bae, M.-S. Characteristics of Atmospheric Compounds based on Regional Multicorrelation Analysis in Honam Area. J. Environ. Anal. Health Toxicol. 2022, 25, 85–98. [Google Scholar] [CrossRef]
  7. Seo, J.; Park, D.-S.R.; Kim, J.Y.; Youn, D.; Lim, Y.B.; Kim, Y. Effects of meteorology and emissions on urban air quality: A quantitative statistical approach to long-term records (1999–2016) in Seoul, South Korea. Atmos. Chem. Phys. 2018, 18, 16121–16137. [Google Scholar] [CrossRef]
  8. Zhang, Y.; Tao, S.; Shen, H.; Ma, J. Inhalation exposure to ambient polycyclic aromatic hydrocarbons and lung cancer risk of the Chinese population. Proc. Natl. Acad. Sci. USA 2019, 106, 21063–21067. [Google Scholar] [CrossRef]
  9. Gu, B.; Zhang, L.; Van Dingenen, R.; Vieno, M.; Van Grinsven, H.J.M.; Zhang, X.; Zhang, S.; Chen, Y.; Wang, S.; Ren, C.; et al. Abating ammonia is more cost-effective than nitrogen oxides for mitigating PM2.5 air pollution. Science 2021, 374, 758–762. [Google Scholar] [CrossRef]
  10. Huang, K.; Zhuang, G.; Lin, Y.; Wang, Q.; Fu, J.S.; Fu, Q.; Liu, T.; Deng, C. How to improve the air quality over megacities in China: Pollution characterization and source analysis in Shanghai before, during, and after the 2010 World Expo. Atmos. Chem. Phys. 2013, 13, 5927–5942. [Google Scholar] [CrossRef]
  11. Huang, R.J.; Zhang, Y.; Bozzetti, C.; Ho, K.F.; Cao, J.J.; Han, Y.; Daellenbach, K.R.; Slowik, J.G.; Platt, S.M.; Canonaco, F.; et al. High secondary aerosol contribution to particulate pollution during haze events in China. Nature 2014, 514, 218–222. [Google Scholar] [CrossRef]
  12. Yadav, R.; Sahu, L.K.; Beig, G.; Jaaffrey, S.N.A. Role of long-range transport and local meteorology in seasonal variation of surface ozone and its precursors at an urban site in India. Atmos. Res. 2016, 176–177, 96–107. [Google Scholar] [CrossRef]
  13. Röösli, M.; Braun-Fährlander, C.; Künzli, N.; Oglesby, L.; Theis, G.; Camenzind, M.; Mathys, P.; Staehelin, J. Spatial variability of different fractions of particulate matter within an urban environment and between urban and rural sites. J. Air Waste Manag. Assoc. 2000, 50, 1115–1124. [Google Scholar] [CrossRef]
  14. Van Donkelaar, A.; Martin, R.V.; Brauer, M.; Kahn, R.; Levy, R.; Verduzco, C.; Villeneuve, P.J. Global estimates of ambient fine particulate matter concentrations from satellite-based aerosol optical depth: Development and application. Environ. Health Perspect. 2010, 118, 847–855. [Google Scholar] [CrossRef] [PubMed]
  15. Mues, A.; Manders, A.; Schaap, M.; van Ulft, L.H.; van Meijgaard, E.; Builtjes, P. Differences in particulate matter concentrations between urban and rural regions under current and changing climate conditions. Atmos. Environ. 2013, 80, 232–247. [Google Scholar] [CrossRef]
  16. Behera, S.N.; Sharma, M. Reconstructing primary and secondary components of PM2.5 composition for an urban atmosphere. Aerosol. Sci. Technol. 2010, 44, 983–992. [Google Scholar] [CrossRef]
  17. Behera, S.N.; Sharma, M.; Aneja, V.P.; Balasubramanian, R. Ammonia in the atmosphere: A review on emission sources, atmospheric chemistry, and deposition on terrestrial bodies. Environ. Sci. Pollut. Res. 2013, 20, 8092–8131. [Google Scholar] [CrossRef] [PubMed]
  18. Pinder, R.W.; Dennis, R.L.; Bhave, P.V. Observable indicators of the sensitivity of PM2.5 nitrate to emission reductions—Part I: Derivation of the adjusted gas ratio and applicability at regulatory-relevant time scales. Atmos. Environ. 2008, 42, 1275–1286. [Google Scholar] [CrossRef]
  19. Paulot, F.; Jacob, D.J. Hidden cost of US agricultural exports: Particulate matter from ammonia emissions. Environ. Sci. Technol. 2014, 48, 903–908. [Google Scholar] [CrossRef]
  20. Joo, H.S.; Han, S.W.; Han, J.S.; Ndegwa, P.M. Emission characteristics of fine particles in relation to precursor gases in agricultural emission sources: A case study of dairy barns. Atmosphere 2023, 14, 171. [Google Scholar] [CrossRef]
  21. Van der Werf, G.R.; Randerson, J.T.; Giglio, L.; Van Leeuwen, T.T.; Chen, Y.; Rogers, B.M.; Kasibhatla, P.S. Global fire emissions and the contribution of deforestation, savanna, forest, agricultural, and peat fires (1997–2009). Atmos. Chem. Phys. 2010, 10, 11707–11735. [Google Scholar] [CrossRef]
  22. McMurry, P.H. A review of atmospheric aerosol measurements. Atmos. Environ. 2000, 34, 1959–1999. [Google Scholar] [CrossRef]
  23. Luke, W.T. Evaluation of a commercial pulsed fluorescence detector for the measurement of low-level SO2 concentrations during Gas-Phase Sulfur intercomparison experiment. J. Geophys. Res. 1997, 102, 16255–16265. [Google Scholar] [CrossRef]
  24. Maeda, Y.; Takenaka, N. Chemiluminescence determination of trace amounts of ammonia and halogen species in the environment. In Optical Methods in Atmospheric Chemistry; SPIE: Bellingham, WA, USA, 1993; Volume 1715. [Google Scholar] [CrossRef]
  25. Joo, H.S.; Park, K.; Lee, K.; Ndegwa, P.M. Mass concentration coupled with mass loading rate for evaluating PM2.5 pollution status in the atmosphere: A case study based on dairy barns. Environ. Pollut. 2015, 207, 374–380. [Google Scholar] [CrossRef]
  26. Meng, Z.; Xu, X.; Lin, W.; Ge, B.; Xie, Y.; Song, B.; Jia, S.; Zhang, R.; Peng, W.; Wang, Y.; et al. Role of ambient ammonia in particulate ammonium formation at a rural site in the North China Plain. Atmos. Chem. Phys. 2018, 18, 167–184. [Google Scholar] [CrossRef]
  27. Khoder, M.I. Atmospheric conversion of sulfur dioxide to particulate sulfate and nitrogen dioxide to particulate nitrate and gaseous nitric acid in an urban area. Chemosphere 2002, 49, 675–684. [Google Scholar] [CrossRef] [PubMed]
  28. Sutton, M.A.; Erisman, J.W.; Dentener, F.; Möller, D. Ammonia in the environment: From ancient times to the present. Environ. Pollut. 2008, 156, 583–604. [Google Scholar] [CrossRef]
  29. Joo, H.S.; Ndegwa, P.M.; Wang, X.; Heber, A.J.; Ni, J.-Q.; Cortus, E.L.; Ramirez-Dorronsoro, J.C.; Bogan, B.W.; Chai, L. Ammonia and hydrogen sulfide concentrations and emissions for naturally ventilated freestall dairy barns. Trans. ASABE 2015, 58, 1321–1331. [Google Scholar]
  30. Luvsan, M.-E.; Shie, R.-H.; Purevdorj, T.; Badarch, L.; Baldorj, B.; Chan, C.-C. The influence of emission sources and meteorological conditions on SO2 pollution in Mongolia. Atmos. Environ. 2012, 61, 542–549. [Google Scholar] [CrossRef]
  31. Sezer Turalıoğlu, F.; Nuhoğlu, A.; Bayraktar, H. Impacts of some meteorological parameters on SO2 and TSP concentrations in Erzurum, Turkey. Chemosphere 2005, 59, 1633–1642. [Google Scholar] [CrossRef]
  32. Jayamurugan, R.; Kumaravel, B.; Palanivelraja, S.; Chockalingam, M.P. Influence of Temperature, Relative Humidity and Seasonal Variability on Ambient Air Quality in a Coastal Urban Area. Int. J. Atmos. Sci. 2013, 2013, 264046. [Google Scholar] [CrossRef]
  33. Li, R.; Fu, H.; Cui, L.; Li, J.; Wu, Y.; Meng, Y.; Wang, Y.; Chen, J. The spatiotemporal variation and key factors of SO2 in 336 cities across China. J. Clean. Prod. 2019, 210, 602–611. [Google Scholar] [CrossRef]
  34. Han, S.; Joo, H.; Song, H.; Lee, S.; Han, J. Source Apportionment of PM2.5 in Daejeon Metropolitan Region during January and May to June 2021 in Korea Using a Hybrid Receptor Model. Atmosphere 2022, 13, 1902. [Google Scholar] [CrossRef]
  35. Han, S.; Joo, H.; Kim, K.; Cho, J.; Moon, K.; Han, J. Modification of Hybrid Receptor Model for Atmospheric Fine Particles (PM2.5) in 2020 Daejeon, Korea, Using an ACERWT Model. Atmosphere 2024, 15, 477. [Google Scholar] [CrossRef]
  36. Kim, K.; Lee, C.; Choi, D.; Han, S.; Eom, J.; Han, J. A Study on the Formation Reactions and Conversion Mechanisms of HONO and HNO3 in the Atmosphere of Daejeon, Korea. Atmosphere 2024, 15, 267. [Google Scholar] [CrossRef]
  37. Seinfeld, J.H.; Pandis, S.N. Atmospheric Chemistry and Physics: From Air Pollution to Climate Change; John Wiley & Sons: Hoboken, NJ, USA, 2016. [Google Scholar]
  38. Zhang, Q.; Wang, G.; Guo, S.; Zamora, M.; Ying, Q.; Wang, W.; Hu, M.; Wang, Y. Formation of urban fine particulate matter. Chem. Rev. 2015, 115, 3803–3855. [Google Scholar] [CrossRef]
  39. Huang, J.; Lu, H.; Du, M. Regional differences in agricultural carbon emissions in China: Measurement, decomposition, and influencing factors. Land 2025, 14, 682. [Google Scholar] [CrossRef]
Figure 1. Site composition (left) and locations (right) for agricultural air quality monitoring.
Agriculture 15 01027 g001
Figure 2. PM10 and PM2.5 concentrations in agricultural and urban sites of Korea from 2023 to 2024. Horizontal dotted line indicates Korea’s 24-h air quality standards and vertically blue shade areas were the high-PM event periods.
Agriculture 15 01027 g002
Figure 3. NO2 and SO2 concentrations in agricultural and urban sites of Korea from 2023 to 2024. Vertically blue shade areas were the high-PM event periods. (24-h Ambient Air Quality Standard of Korea).
Agriculture 15 01027 g003
Figure 4. Diurnal patterns of particulate matter and meteorological parameters in agricultural (circles) and urban (triangles) areas.
Agriculture 15 01027 g004
Figure 5. Diurnal patterns of NO2 and SO2 concentrations in agricultural (circles) and urban (triangles) areas.
Agriculture 15 01027 g005
Figure 6. Particulate matter concentrations in agricultural and urban areas during high-PM event periods (dashed lines: 24-h Ambient Air Quality Standard of Korea).
Agriculture 15 01027 g006
Figure 7. NO2 and SO2 concentrations in agricultural and urban areas during high-PM event periods.
Agriculture 15 01027 g007
Figure 8. Diurnal patterns of particulate matter, NO2, and SO2 concentrations in agricultural (circles) and urban (triangles) areas during high-PM event period.
Agriculture 15 01027 g008
Table 1. Comparison of particulate matter, NO2, and SO2 concentrations (8 sites average) between agricultural and urban sites.
PM10 (μg/m3)PM2.5 (μg/m3)NO2 (ppb)SO2 (ppb)
UrbanAgriculturalUrbanAgriculturalUrbanAgriculturalUrbanAgricultural
PeriodMarch 2023 to December 2024
Average31.3631.0415.5215.5015.4212.502.332.11
Maximum361.67313.4696.0084.6756.1474.887.6311.56
75th37.4335.9719.7119.7219.3217.032.532.39
Median25.8626.0913.5014.0412.9010.562.242.04
25th17.8618.708.719.499.396.162.041.65
Minimum2.001.721.000.683.270.341.180.56
PeriodMarch 2023 to December 2023
Average34.7734.2216.5416.4415.228.802.282.01
Maximum361.67313.4696.0084.6756.1474.884.8011.56
75th41.0039.2620.6721.0518.4610.362.492.24
Median27.6728.3014.2915.0612.706.632.201.86
25th18.7119.869.4310.179.464.131.991.55
Minimum2.292.861.001.023.270.341.180.56
PeriodJanuary 2024 to December 2024
Average28.5028.3814.6614.7215.5915.602.372.19
Maximum260.57233.7762.3358.3253.1457.657.637.68
75th34.7133.3118.8618.3620.0919.932.562.50
Median24.7124.5212.8613.2613.1014.282.292.15
25th17.0017.958.149.059.3310.032.091.80
Minimum2.001.721.000.683.290.961.590.77
Table 2. Comparison of particulate matter, NO2, and SO2 concentrations (8 sites average) in high-PM event periods.
PM10 (μg/m3)PM2.5 (μg/m3)NO2 (ppb)SO2 (ppb)
UrbanAgriculturalUrbanAgriculturalUrbanAgriculturalUrbanAgricultural
Average77.9871.9840.8534.4025.7117.692.632.38
Maximum361.67313.4696.0084.6756.1474.883.989.91
75th83.7475.6947.7140.8133.4821.972.992.47
Median66.7557.8639.8633.0225.5114.012.602.09
25th55.6844.8232.8625.8817.009.702.271.81
Minimum15.1415.919.146.375.965.111.641.06
Disclaimer/Publisher’s Note: The statements, opinions and data contained in all publications are solely those of the individual author(s) and contributor(s) and not of MDPI and/or the editor(s). MDPI and/or the editor(s) disclaim responsibility for any injury to people or property resulting from any ideas, methods, instructions or products referred to in the content.

