Article

Modeling of the Physicochemical and Nutritional Composition of Musa paradisiaca (Williams Variety) at Different Ripening Stages in Ecuador

by
María Fernanda Garcés-Moncayo
1,
Fabricio Guevara-Viejó
2,
Juan Diego Valenzuela-Cobos
2,*,
Purificación Galindo-Villardón
2,3 and
Purificación Vicente-Galindo
2,3,4
1
Facultad de Ciencias e Ingeniería, Universidad Estatal de Milagro (UNEMI), 091050 Milagro, Ecuador
2
Centro de Estudios Estadísticos, Universidad Estatal de Milagro (UNEMI), 091050 Milagro, Ecuador
3
Department of Statistics, University of Salamanca, 37008 Salamanca, Spain
4
Institute for Biomedical Research of Salamanca (IBSAL), 37007 Salamanca, Spain
*
Author to whom correspondence should be addressed.
Agriculture 2025, 15(10), 1025; https://doi.org/10.3390/agriculture15101025
Submission received: 20 January 2025 / Revised: 17 February 2025 / Accepted: 19 February 2025 / Published: 9 May 2025
(This article belongs to the Special Issue Analysis of Agricultural Food Physicochemical and Sensory Properties)

Abstract

:
The banana (Musa paradisiaca AAA) is a tropical fruit native to Southeast Asia, widely cultivated in over 130 tropical and subtropical countries. It plays a vital role in both rural and urban diets and serves as a key economic resource in producing regions. This study examined how different ripening stages of bananas (Musa paradisiaca var. Williams) affect their physicochemical properties and nutritional composition. The bananas underwent a controlled ripening process and were classified into eight stages based on pericarp color, ranging from dark green (P1) to yellow with pronounced brown spots (P8). The results showed significant changes during ripening: pH decreased from 5.48 to 4.95, soluble solids (SS) increased from 15.2% to 21.73%, total starch (TS) decreased from 76.15% to 33.92%, and free sugars (FS) increased from 19.78 mg/g to 361.85 mg/g. Vitamin C content rose from 281.4 µg/g to 354.14 µg/g, while oxalic acid and tannins decreased significantly, improving palatability. Statistical analysis using PERMANOVA confirmed significant differences between ripening stages in the evaluated properties (p < 0.001), explaining more than 75% of the observed variability. The HJ-Biplot analysis illustrated the relationships between ripening stages and variables, showing that early stages were correlated with higher starch and acidic compound content, while later stages were associated with increased sugar levels and vitamin C content. These findings demonstrate that ripening stages significantly influence the composition of bananas, providing essential information for optimizing agricultural, industrial, and commercial practices to enhance their nutritional value and meet the demands of consumers seeking healthy foods.

1. Introduction

The banana, also known as plantain, is scientifically classified as Musa paradisiaca AAA, belonging to the Musaceae family. It is a tropical fruit widely consumed and valued globally [1]. Bananas are eaten both green and ripe by rural and urban consumers in humid tropical regions and serve as an essential source for the rural economy. Originally from Southeast Asia, bananas are now cultivated in over 130 countries in tropical and subtropical regions [2]. Ecuador stands out as the world’s largest banana exporter; according to the National Institute of Statistics and Censuses (INEC), annual banana production in 2023 reached 7.2 million tons, primarily concentrated in the coastal region. The provinces of Los Ríos, Guayas, and El Oro account for 89% of national production, while the highland region contributes 11% [3].
Bananas are well-known for their high nutritional value, providing dietary fiber, pectin, essential minerals such as potassium and phosphorus, phenolic compounds, vitamins (A, B, C, and E), β-carotene, and phytosterols [4]. However, there is a growing interest among consumers in foods that promote health and general well-being [5]. The nutritional composition of bananas varies between the green and ripe stages due to changes in fiber, minerals, and bioactive compounds like phenols and vitamins, influenced by factors such as cultivar, climate, soil, and agricultural practices [6].
During ripening, bananas undergo physiological, biochemical, and organoleptic changes, transforming the fruit into a soft, edible food. Visual appearance is one of the main factors influencing consumers’ perception and acceptance of bananas [7], which has led to greater awareness of reducing food waste by avoiding the unnecessary discarding of imperfect fruits [8,9].
Despite the extensive production and consumption of bananas worldwide, research on their nutritional variability as a function of growing and ripening conditions is still deficient. Existing studies have prioritized the general characterization of the chemical profile; however, analysis of the influence of agroecological factors and agricultural practices on the nutritional composition of Ecuadorian bananas and their bioactive potential is limited. The growing trend towards the consumption of foods with healthy properties highlights the need to deepen knowledge on the formulation of products with the greatest socioeconomic impact.
To precisely analyze the differences in the physicochemical and nutritional properties of bananas at various ripening stages, it is imperative to employ robust multivariate statistical methodologies. In this study, permutational analysis of variance (PERMANOVA) [10] was used to identify statistically significant differences in the evaluated properties throughout the maturation stages. PERMANOVA is a non-parametric technique designed to assess differences within multivariate distance matrices, making it particularly suitable for datasets that do not conform to assumptions of normality and homogeneity of variances [11].
Furthermore, the HJ-Biplot method [12] is employed to jointly visualize and characterize both the observations (ripening stages) and the variables (physicochemical and nutritional properties). The HJ-Biplot is an exploratory analytical tool that enables the simultaneous representation of samples and variables in a two-dimensional space, thereby facilitating the interpretation of multivariate patterns and relationships within the dataset [13].
The primary aim of this study is to elucidate the influence of distinct ripening stages of bananas (Musa paradisiaca var. Williams) on their physicochemical properties and nutritional composition. PERMANOVA is applied to statistically evaluate significant differences between the ripening stages, while the HJ-Biplot enables the visualization of these differences and the comprehension of interrelations between variables and ripening phases.

2. Materials and Methods

2.1. Materials

Bananas of the Williams variety (AAA group) were obtained from the “Sofia” banana company in September 2024. The fruits were harvested and transported on the same day to the laboratories of Ecuahidrolizados S.A.S. (Guayaquil, Ecuador), maintaining a temperature of 24–28 °C during a 45 min transit period. The bananas were washed with a sodium hypochlorite solution at a concentration of 10 ppm using sufficient water for a duration of 3 min.
To preserve postharvest quality, a pre-cooling process was carried out at a controlled temperature of 14–18 °C for 24 h, followed by a ripening treatment involving exposure to 1000 ppm ethylene gas at 15 °C [14]. The duration of ethylene exposure was specific to each ripening stage, set at eight distinct periods: F1 (10 min), F2 (2 h), F3 (5 h), F4 (18 h), F5 (26 h), F6 (37 h), F7 (50 h), F8 (72 h). Bananas were classified into eight stages according to pericarp color using a standardized ripening program:
  • P1 (Stage 1): Dark green pericarp,
  • P2 (Stage 2): Light green pericarp,
  • P3 (Stage 3): Green pericarp with small yellow spots,
  • P4 (Stage 4): Green pericarp with yellow streaks,
  • P5 (Stage 5): Yellow pericarp with green margins,
  • P6 (Stage 6): Fully yellow pericarp,
  • P7 (Stage 7): Yellow pericarp with small, pigmented spots,
  • P8 (Stage 8): Yellow pericarp with pronounced brown spots.
The bananas were then placed in polyethylene bags (approximately 4 kg per stage) and returned to the laboratory for analysis.

2.2. Banana Flour

Once the ripening process was completed, the banana (Musa paradisiaca) samples (Williams variety) were washed with distilled water to remove any possible impurities from the surface, followed by pulping.
To prevent enzymatic and oxidative reactions during preservation, the fresh pulps underwent rapid cooling by immersion in liquid nitrogen (−196 °C) [15]. This process allowed for the instantaneous formation of microcrystals within the cellular structure, minimizing tissue damage and preserving the original physicochemical composition [16].
After rapid cooling, the frozen samples were transferred to an ultra-low temperature freezer (−80 °C) to ensure complete and uniform freezing of the matrix [17]. Subsequently, the samples underwent lyophilization to remove water content, preserving the structural and chemical properties of the material.
Once the lyophilization process was complete, the dried samples were pulverized using a mill to obtain a fine banana flour powder. This powder was immediately packed into multilayer polyethylene bags (PET/PVDC/CPP) to protect it from moisture and oxidation. Finally, the bags were stored at −20 °C to prevent potential degradation or quality alterations during extended storage [18].

2.3. Preparation of Aqueous Samples

For the preparation of aqueous samples, 10 g of banana flour was weighed for each sample and submerged in 100 mL of distilled water. The mixture was stirred continuously for 16 h using a magnetic stirrer to ensure homogeneity. After stirring, the mixture was filtered through filter paper to remove any insoluble residues. The filtrate was then centrifuged at 400× g for 10 min. The resulting supernatant was collected for the analysis of vitamin C (ascorbic acid) content. Separately, a portion of the dried banana flour was reserved for the analysis of starch and free sugars.

2.4. Analysis of Basic Components

The basic components of the banana samples were characterized following the protocols established by the Association of Official Analytical Chemists (AOAC) [19]:
Crude fat content: Determined by the AOAC 30-10 method, using the Soxhlet extraction system, whose principle extracts and quantifies lipid content in food samples.
Ash content: Measured by the AOAC 08-01 method, quantifying the mineral and inorganic compounds present in the samples.
Crude fiber content: Analyzed following the AOAC 32-10 method, which evaluates the fraction of non-digestible carbohydrates, providing information on digestibility and its possible impact on nutrient absorption and intestinal health.
Crude protein content: Quantified by the AOAC 46-11A method, based on the principle of the Kjeldahl technique. This method measures the total nitrogen content and calculates the protein concentration in the samples [20].

2.5. Determination of Starch and Free Sugar Content

The determination of starch and free sugars was performed using 0.02 g of finely pulverized banana flour. The samples were extracted with 80% ethanol heated to optimize the solubility of target compounds. The mixture was centrifuged at 2000 rpm for 10 min. The supernatant obtained was used for the analysis of free sugars, while the solid residue resulting from the centrifugation process was used for starch quantification [21].

2.5.1. Determination of Total Starch Content

The total starch content was measured following the Megazyme® K-TSTA 07/11 kit protocol (Megazyme Ltd., Bray, Ireland), which adheres to the AOAC Official Method 996.11 and AACC Method 76.13 [22]. The starch concentration was calculated using the following equation:
S t a r c h % = Δ E × F × F V 0.1 × 100 W × 162 180 = Δ E × F W × F V × 0.9
where:
  • Δ E : Absorbance of the sample relative to the blank.
  • F : Conversion factor for 100 µg of D-glucose absorbance.
  • F V : Final volume.
  • W : Weight of the sample in milligrams.
  • 0.1: Volume of the sample analyzed (in mL).
  • 162 180 : Adjustment factor for converting free D-glucose to anhydrous D-glucose.

2.5.2. Determination of Resistant Starch Content

Resistant starch content was determined using the Megazyme® K-RSTAR 08/11 kit (Megazyme Ltd., Bray, Ireland), which complies with AOAC Official Method 2002.02 and AACC Method 32-40.01. The resistant starch concentration was calculated using the following equation:
S t a r c h % = Δ E × F × 10 0.1 × 100 W × 162 180 = Δ E × F W × 9.27
where:
  • Δ E : Absorbance of the sample relative to the blank.
  • F : Conversion factor for 100 µg of D-glucose absorbance.
  • W : Correction for the volume (0.1 mL taken from 10 mL).
  • 10 0.1 : Volume of the sample analyzed (in mL).
  • 162 180 : Adjustment factor for converting free D-glucose to anhydrous D-glucose.

2.5.3. Determination of Free Sugar Content

The free sugar content was determined following the method described by Huang et al. [23], with minor modifications. A mixture was prepared by combining 0.2 mL of the diluted supernatant with 0.5 mL of 5% phenol solution and 2.5 mL of concentrated sulfuric acid (H2SO4). The resulting mixture was allowed to cool to room temperature, and its absorbance was measured at 490 nm using a spectrophotometer. The total free sugar content of the sample was calculated based on a standard glucose calibration curve prepared alongside the sample analysis.

2.6. Soluble Solids Content (°Brix)

The soluble solids content, measured in °Brix, provides a direct estimate of the concentration of soluble carbohydrates in the sample, primarily including monosaccharides and disaccharides such as glucose, fructose, and sucrose. These sugars increase as the fruit ripens and are key indicators of maturity and quality [24].
For this analysis, the fruit pulp was homogenized into juice. A small amount of the juice was placed on the measurement surface of a digital refractometer (HI96814, Hanna Instruments, Smithfield, RI, USA). The °Brix values were recorded and used to evaluate the concentration of soluble solids in the banana samples.

2.7. pH Measurement

The pH is a critical parameter for determining the preservation conditions and the microbiological stability of food products [25]. Most edible fruits exhibit acidic pH values ranging from 3 to 5, though genetic variations can influence the acidity in different fruit crops [26].
To measure the pH, 20 mL of the juice obtained during the soluble solids analysis was used. A multiparameter pH meter (PC60, Apera Instruments, Columbus, OH, USA) was immersed directly in the sample for the measurement. The resulting pH values provide essential information on the fruit’s acid–base balance, which is crucial for postharvest management and processing.

2.8. Titratable Acidity

Titratable acidity quantifies the total organic acid content in the sample, typically expressed as a percentage of citric acid or malic acid. For this analysis, 25 mL of the diluted test sample was pipetted into a beaker with constant stirring. A phenolphthalein solution (0.1%, 0.26–0.5 mL) was added as an indicator. The sample was titrated with 0.1 N sodium hydroxide (NaOH) until a pink color persisted for 30 s.
The titratable acidity was calculated following the NTE 750:2013 standard [26], taking malic acid as a reference. The following formula was used for its calculation:
T i t r a t a b l e   A c i d i t y = 250 V × V 1 × C × 100 V o
where:
  • V = Volume of the test sample (mL).
  • V0 = Volume of the test portion (mL).
  • V1 = Volume of the NaOH titrant solution (mL).
  • C = Concentration of NaOH solution in moles per liter.

2.9. Determination of Vitamin Content via High-Performance Liquid Chromatography (HPLC)

2.9.1. Ascorbic Acid (Vitamin C)

The quantification of ascorbic acid (vitamin C) followed the methodology of Gentili and Del Bosco [27], with modifications in sample preparation. A 3 g sample was homogenized with 30 mL of 5% phosphoric acid (H3PO3) solution for 10 min, and the volume was adjusted to 50 mL. The solution was filtered through a 0.22 µm membrane filter, and 20 µL were injected into the HPLC system. To prevent oxidation, the analysis was conducted at low temperatures and shielded from light.
The mobile phase consisted of 0.05 M potassium dihydrogen phosphate (KH2PO4) at pH 4.5 and acetonitrile in a 30:70 (v/v) ratio. The flow rate was set to 1 mL/min, and a UV detector was used at a wavelength of 210 nm. The analytical column was an RP-18 (4.6 × 250 mm, 5 µm). A standard curve of L-ascorbic acid was prepared, and concentrations were determined via interpolation.

2.9.2. Thiamine (Vitamin B1), Riboflavin (Vitamin B2), and Pyridoxine (Vitamin B6)

The analysis of thiamine, riboflavin, and pyridoxine content was conducted using HPLC, adapted from Gentili and Del Bosco [28] and Huang et al. [23] with minor modifications. A 5 g sample was digested in 0.1 M HCl at 100 °C for 30 min, and the pH was adjusted to 4.5 using sodium acetate solution. Enzymatic digestion was performed by adding 50 mg of β-amylase and 500 mg of takadiastase, incubating the sample at 37 °C for 18 h. The volume was then adjusted to 100 mL and filtered through a 0.22 µm cellulose acetate membrane.
A 20 µL filtered sample was analyzed using a mobile phase of methanol and 0.05 M sodium acetate solution in a 30:70 (v/v) ratio. The flow rate was set to 1 mL/min, and a UV detector measured specific wavelengths: 275 nm for riboflavin and pyridoxine. Thiamine was oxidized with potassium ferricyanide to form thiochrome, which was measured at the same wavelength. A Mightysil RP-18 (Kanto Chemical Co., Inc., Tokyo, Japan) column was used, and standard curves for each vitamin were prepared for concentration determination.

2.9.3. Peroxidase Activity

Peroxidase activity was determined according to Nelson and Parsonage [29], with minor modifications. A 5 g sample was homogenized with 60 mL of 0.2 M sodium phosphate buffer (pH 6.0) containing 5% NaCl for 60 s and then filtered. A reaction mixture was prepared by combining 2.9 mL of 0.2 M sodium phosphate buffer with 0.05 M guaiacol and 0.02 M H2O2 (substrate solution). Then, 0.1 mL of crude enzyme extract was added to the substrate solution. The absorbance was measured at 420 nm using a spectrophotometer, and the rate of absorbance change per minute was recorded. Enzymatic activity was expressed in units (U) as:
E n z y m e   A c t i v i t y = U / m i n / g = A b s t × g s a m p l e
where:
  • ∆Abs: Change in absorbance.
  • t : Time interval in minutes.
  • g s a m p l e : Sample weight in grams.

2.9.4. Oxalic Acid and Tannin Content

The determination of oxalic acid and tannin content was performed following Karamad et al. [30] and Verzele and Delahaye [31], with minor modifications. A 1 g sample was mixed with 40 mL of 0.6 N HCl and heated at 100 °C for 15 min in a water bath. The mixture was filtered through a 0.22 µm membrane and 20 µL of the filtrate was injected into the HPLC system. The detection of oxalic acid was performed at 210 nm using 0.01 N sulfuric acid as a mobile phase, while tannins were detected at 280 nm using a mobile phase composed of methanol and acetic acid (60:40, v/v).
The concentrations were calculated via interpolation using standard curves and the formula:
C o n c e n t r a t i o n   m g L = Absorbance of the sample Slope of the standard curve

2.10. Statistical Analysis

In this study, each parameter was measured in ten replicates to ensure robust reliability and reproducibility of the results, thereby minimizing potential experimental errors and enhancing the precision of the findings.
To evaluate the multivariate normality of the data corresponding to the physicochemical and vitamin variables, the Mardia test was applied, which analyzes the skewness and kurtosis of the data in a multivariate space. The results showed a significant deviation from normality in both data sets. For the physicochemical data, an extremely high multivariate skewness value was obtained (Mardia Skewness = 611.59, p < 0.001), indicating that the distribution of the data was not symmetric. However, the multivariate kurtosis showed no significant difference from normality (Mardia Kurtosis = −0.2848, p = 0.7758). Similarly, the vitamin data presented high multivariate skewness (Mardia Skewness = 1337.17, p < 0.001) and kurtosis (Mardia Kurtosis = 17.78, p < 0.001), confirming a strong deviation from normality.
Since a multivariate normal distribution must comply with symmetry and expected values of kurtosis in all its dimensions [32], these results justify the rejection of normality in both data sets. As several studies have pointed out, multivariate normality is a fundamental requirement for the application of MANOVA [33,34]. Since this condition was not met, we opted for a nonparametric approach based on permutations, specifically PERMANOVA, which does not assume normality and is suitable for assessing differences between groups as a function of distance matrices [35].
Statistical analyses were performed using PERMANOVA (Permutational Multivariate Analysis of Variance) and HJ-Biplot, advanced multivariate techniques that allow for the exploration and identification of significant relationships and differences among variables in a reduced-dimensional space. In addition, Tukey’s test was applied (p < 0.05).
All analyses were conducted using R software version 4.4.1 (R Core Team, Vienna, Austria), a platform widely recognized for its capability to handle large datasets and implement sophisticated mathematical models [36].

2.10.1. PERMANOVA Model

The PERMANOVA model was applied to assess significant differences among ripening phases, accounting for the multidimensional and non-parametric nature of the data [37]. The Bray-Curtis dissimilarity measure was used, where x l k   and x l k represent the values of the observations in dimension k for individuals l and l , respectively, and p denotes the total number of dimensions. The Bray-Curtis metric calculates the differences between observations as a ratio normalized by the total sum [38]:
d l l = k = 1 p x l k x l k k = 1 p ( x l k + x l k ) 2
According to Anderson, the total sum of squares S S T o t a l is decomposed into components between S S A and within groups S S w , where d i j is the distance between observations i and j :
S S T o t a l = i < j d i j 2
The F-statistic was calculated as follows:
F = S S A a 1 S S w N a
where:
  • a : Number of groups.
  • N : Total number of observations.
The statistical significance of F was evaluated using a permutation approach, generating null distributions through random permutations of group labels [35]. The p-value was computed as:
p = N o .   o f   F π F + 1 T o t a l   n o .   o f   F π + 1

2.10.2. HJ-Biplot

The HJ-Biplot technique was employed as a multivariate approach to simultaneously represent observations (individuals) and variables in a reduced-dimensional space, retaining the maximum possible information from the original dataset [12]. This method is based on the singular value decomposition (SVD) of the standardized data matrix [39]:
X = U Σ V T
where:
  • U: A matrix whose columns are orthonormal eigenvectors of X X T .
  • Σ : A diagonal matrix of singular values of X .
  • V: An orthogonal matrix whose columns are eigenvectors of X T X .
The coordinates of the observations (G) and variables (H) in the reduced space were calculated as:
G = U   y   H T = Σ V T
The HJ-Biplot analysis was conducted using the multBiplotR package in R, enabling the identification of patterns among ripening phases and variables while highlighting their relative contributions. The results were visualized in a biplot, where variables were represented as vectors and observations as points, facilitating the interpretation of relationships between the two sets.

3. Results

3.1. Characterization of Physicochemical and Nutritional Properties

3.1.1. Descriptive Analysis of the Physicochemical Composition of Banana

The descriptive analysis of the physicochemical properties of banana across the eight ripening stages revealed significant changes in key parameters, including pH, soluble solids (SS), titratable acidity (TA), crude fiber (CF), crude fat (CFAT), crude protein (CP), ash content (A), total starch (TS), resistant starch (RS), and free sugars (FS).
These results highlight the biochemical processes associated with ripening, such as starch conversion to sugars, acid metabolism, and structural changes in the fruit. These processes are influenced by factors such as cultivar type, agronomic conditions, and the metabolic activity of the fruit during maturation [40].
Table 1 demonstrates that the pH decreased significantly from 5.48 ± 0.03 in P1 to 4.95 ± 0.04 in P8, indicating an increase in fruit acidity due to the accumulation and metabolism of organic acids, such as citric acid [40]. Similarly, the titratable acidity (TA) increased from 0.29 ± 0.01% in P1 to 0.68 ± 0.01% in P8, reflecting a balance between the synthesis and degradation of these organic compounds.
The soluble solids (SS) content rose progressively from 15.2% in P1 to 21.73% in P8. This increase is attributed to the enzymatic conversion of starch into simple sugars, primarily catalyzed by enzymes like sucrose-phosphate synthase [41]. On the other hand, total starch (TS) content decreased significantly, from 76.15 ± 0.05% in P1 to 33.92 ± 0.03% in P8, coinciding with the transition of the pericarp color to yellow between stages P3 and P4. In contrast, free sugars (FS) content increased substantially, from 19.76 ± 0.008 mg/g in P1 to 361.82 ± 0.013 mg/g in P8, reflecting the activity of enzymes such as amyloglucosidase during ripening [42].
The crude fiber (CF) content increased slightly in P5 (0.67 ± 0.003%) before decreasing to 0.53 ± 0.002% in P8, likely due to the breakdown of cell wall components as ripening progresses. Meanwhile, the crude fat (CFAT) content remained relatively constant, ranging between 0.30% and 0.41%, suggesting minimal changes in lipid metabolism. The crude protein (CP) content, however, decreased from 6.27 ± 0.02% in P1 to 5.65 ± 0.03% in P8, which may be attributed to the degradation of nitrogenous compounds during maturation. Finally, the ash content (A) showed limited variation, with values ranging from 3.48% to 3.77% across all ripening stages, indicating minimal changes in the mineral composition of the fruit.

3.1.2. Descriptive Analysis of Nutritional Composition

The analysis of the nutritional composition revealed slight but notable changes in vitamin content throughout the ripening stages (Table 2). Vitamin C (ascorbic acid) content increased gradually during ripening, starting at 281.4 ± 0.95 µg/g in P1 and reaching 354.14 ± 1.42 µg/g in P8, reflecting its stabilization as the fruit matures.
Thiamine (B1) exhibited no significant changes, with values fluctuating between 0.59 µg/g and 0.82 µg/g, suggesting limited metabolic or degradative activity involving this vitamin. In contrast, riboflavin (B2) showed a slight increase, ranging from 3.76 ± 0.02 µg/g in P1 to 4.58 ± 0.03 µg/g in P8, indicative of metabolic processes associated with this nutrient.
Pyridoxal (B6) displayed a more dynamic trend, with its content peaking at 52.33 ± 0.15 µg/g in P5 before stabilizing in later stages. This peak may be linked to its role in enzymatic reactions that are particularly active during intermediate ripening stages. The analysis of the vitamin C content increased slightly during the maturing period (Table 2).
Oxalic acid, an antinutritional compound, decreased drastically during ripening, from 22,905.33 ± 56.54 µg/g in P1 to just 14.00 ± 0.18 µg/g in P8. This significant reduction enhances the sensory acceptability of the fruit in the later ripening stages. Similarly, there was a progressive decrease in tannin content, from 578 µg/g in P2 to nearly undetectable levels in P8, reducing the astringency perception in the final stages of ripening [43].
The activity of polyphenol oxidase (PPO), a key enzyme involved in enzymatic browning, increased consistently during ripening, starting at 2.56 ± 0.01 U in P1 and reaching 24.53 ± 0.03 U in P8. This increase explains the heightened susceptibility to browning in the advanced ripening stages. In contrast, the activity of peroxidase (POD) decreased significantly, from 3.88 ± 0.02 U in P1 to 0.80 ± 0.02 U in P8, reflecting reduced availability of oxidizable phenolic compounds in the later stages of ripening.

3.2. Multivariate Analysis of Variance and Biplot Visualization of Physicochemical and Nutritional Differences During Ripening

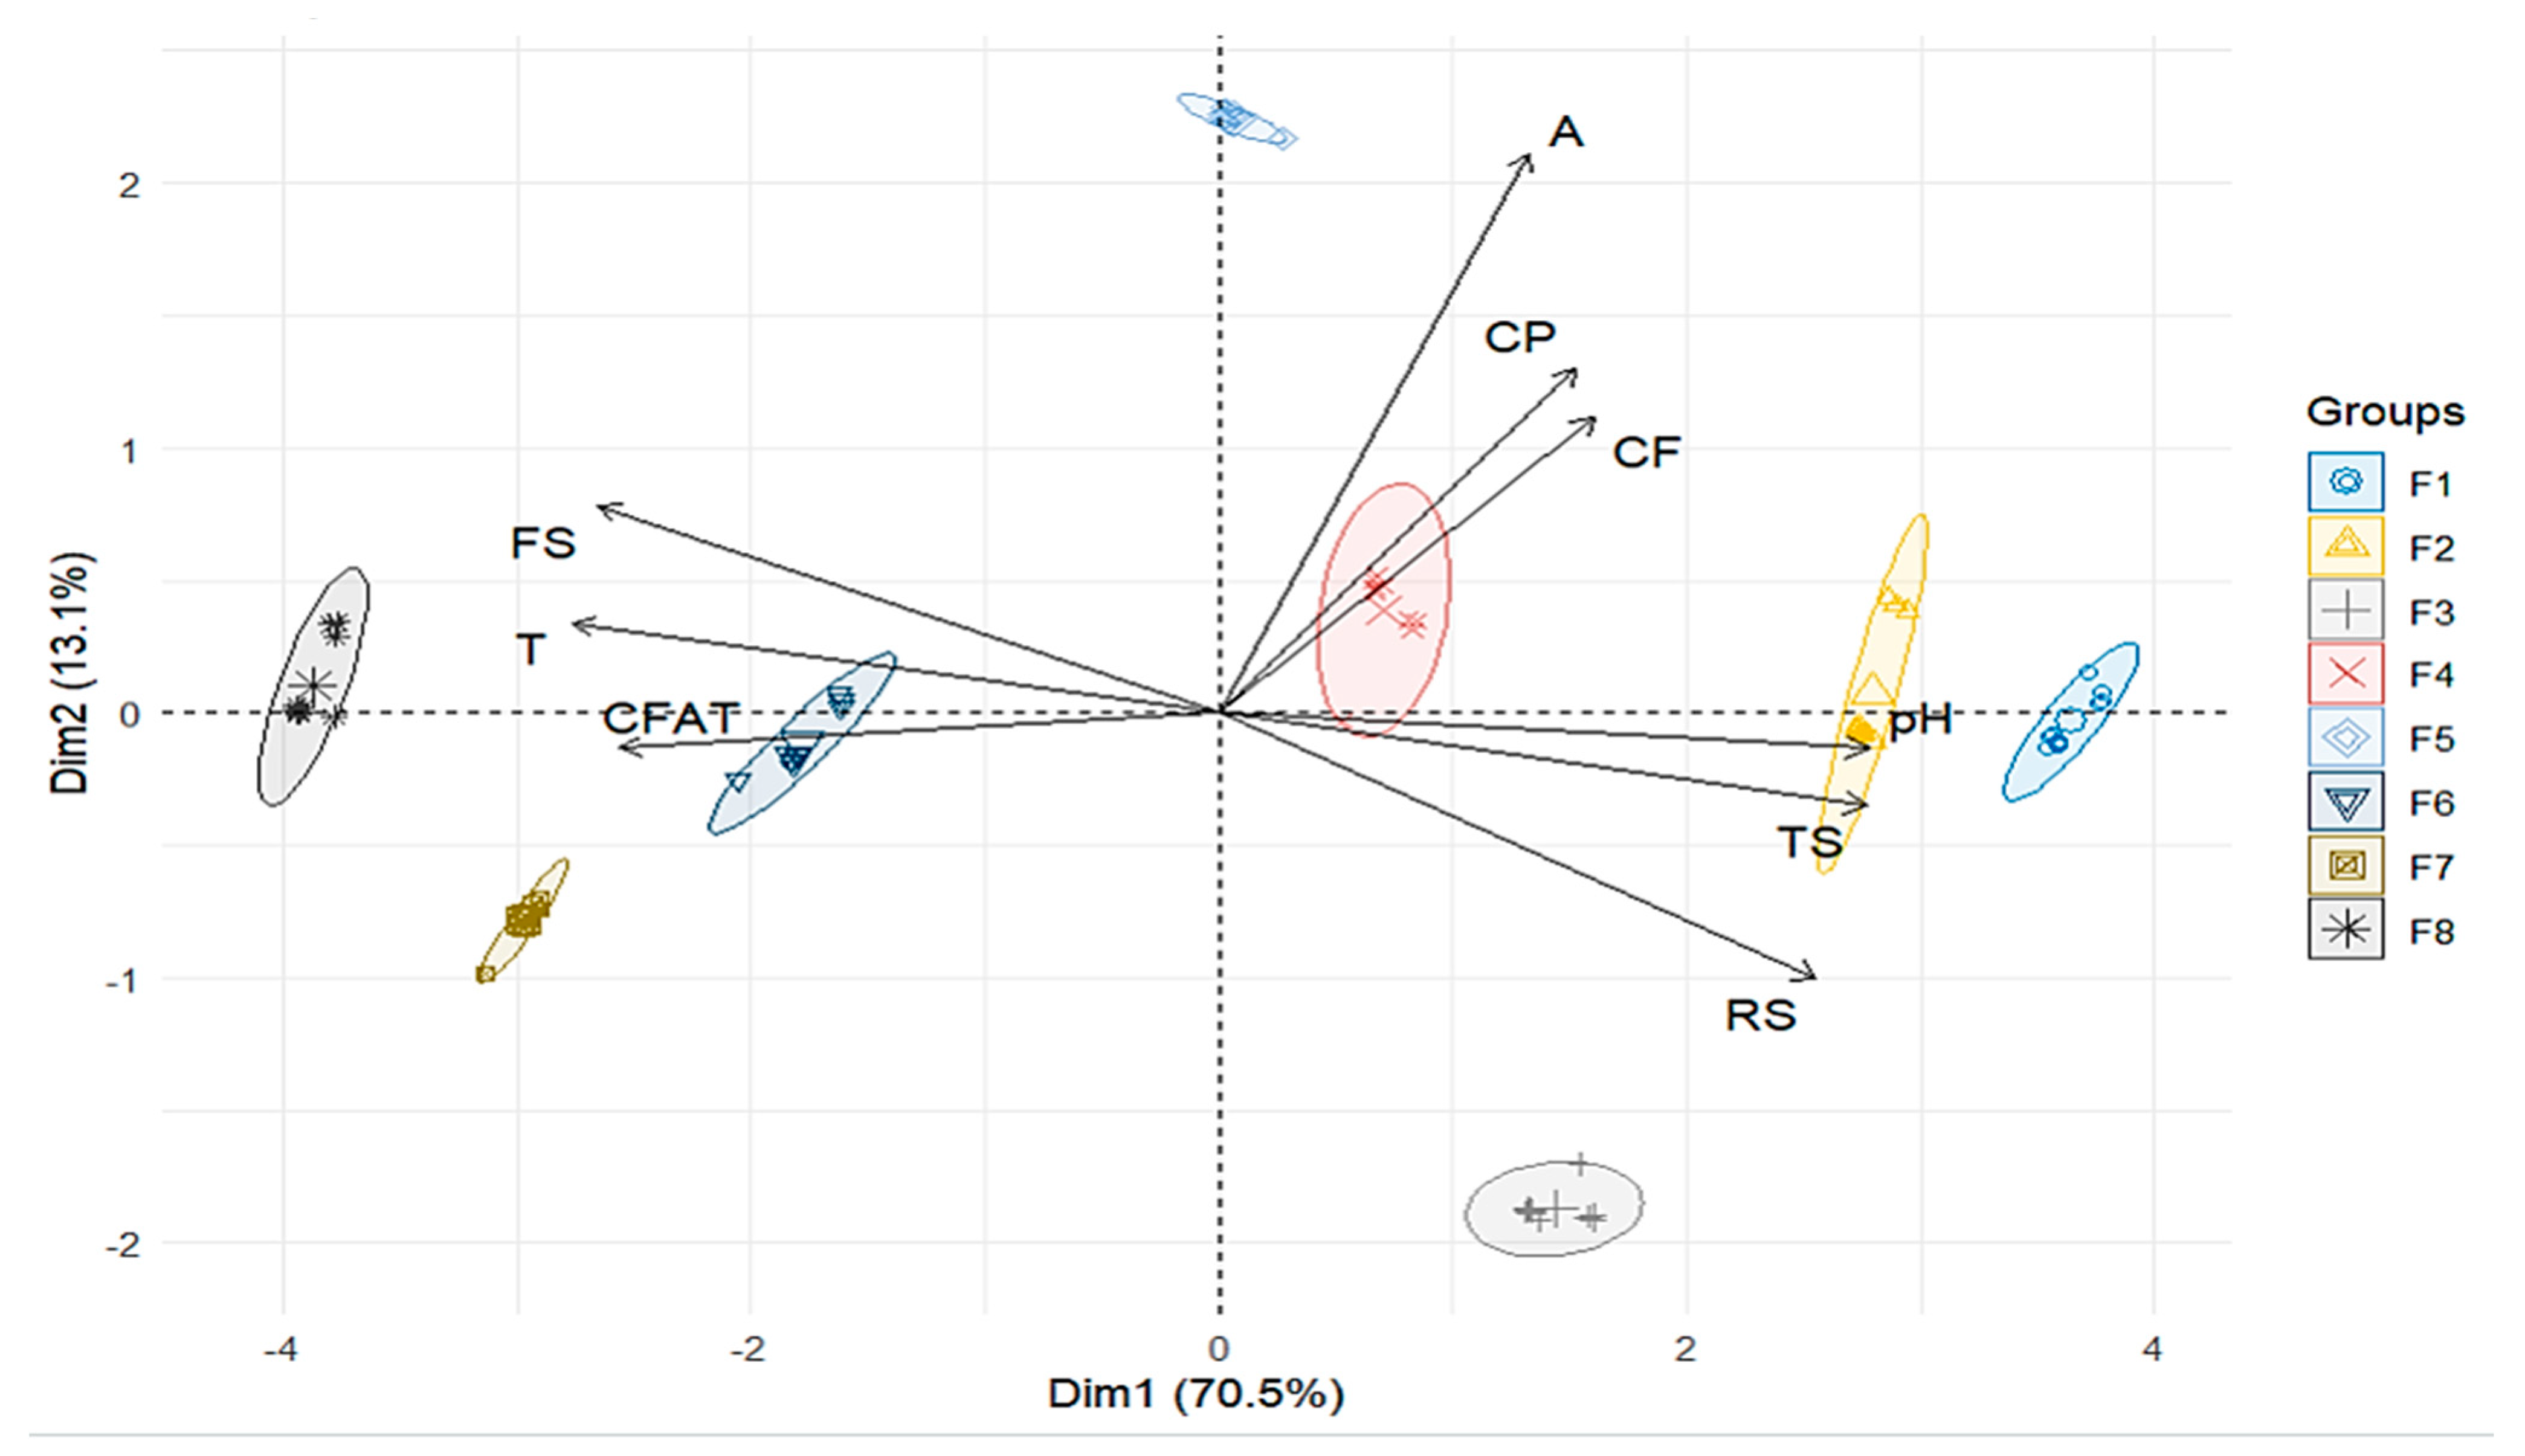
3.2.1. PERMANOVA and HJ-Biplot Analysis to Assess Significant Differences and Associations

The Permutational Multivariate Analysis of Variance (PERMANOVA) (Table 3) revealed that the differences among ripening stages were statistically significant (pseudo-F = 1105.7; p < 0.001). The determination coefficient (R2 = 0.9341) indicates that 93.41% of the variability in physicochemical composition can be attributed to differences between ripening stages, with only 6.59% attributed to residual variation. These findings emphasize the consistency of physicochemical properties within each stage, establishing them as statistically robust indicators of the ripening status of the fruit.
The statistical model was based on a Bray–Curtis distance matrix and was expressed as:
d i s t m a t r i x F i s q u i ~ p h a s e s
The PERMANOVA analysis confirmed that ripening stages are significantly associated with multivariate variation in the physicochemical properties of bananas (p < 0.001). This result demonstrates that the ripening state has a substantial impact on physicochemical composition, supporting its role as a key determinant in the differentiation of the fruit’s biochemical profile.
Additionally, an HJ-Biplot was performed to explore the relationships between the ripening stages and the physicochemical variables of the banana. As shown in Figure 1, the first axis (Dim1) accounted for 67.6% of the variation, while the second axis (Dim2) explained 13.1%, resulting in a cumulative inertia of 80.8%.
This biplot highlights the contributions of key physicochemical variables such as pH, soluble solids (SS), titratable acidity (TA), total starch (TS), and free sugars (FS) to the differentiation of ripening stages, providing a comprehensive visualization of the associations between the variables and the ripening process.
Figure 1 illustrates how the initial ripening stages (P1–P3) cluster in the lower-left quadrant, showing a strong association with total starch (TS) and resistant starch (RS). These variables have the longest vectors in the biplot, indicating their high contribution to the variance explained by the first principal component (Dim1), which accounts for 70.5% of the total variation. This clustering reflects the predominance of complex carbohydrates in the early ripening stages.
The intermediate stages (P4–P5) are positioned in transitional regions of the biplot, with moderate associations toward variables such as crude protein (CP) and ash content (A). This indicates a biochemical balance during these phases, as starch hydrolysis progresses and other compounds stabilize. The angles between the TS and SS vectors confirm their inverse relationship, consistent with the enzymatic conversion of starch into simple sugars during ripening.
In contrast, the later ripening stages (P6–P8), located in the upper-right quadrant, are strongly associated with variables such as pH, soluble solids (SS), and free sugars (FS). The alignment of these vectors with Dim1 reinforces their discriminative role in these advanced stages, characterized by higher sugar content and reduced acidity.

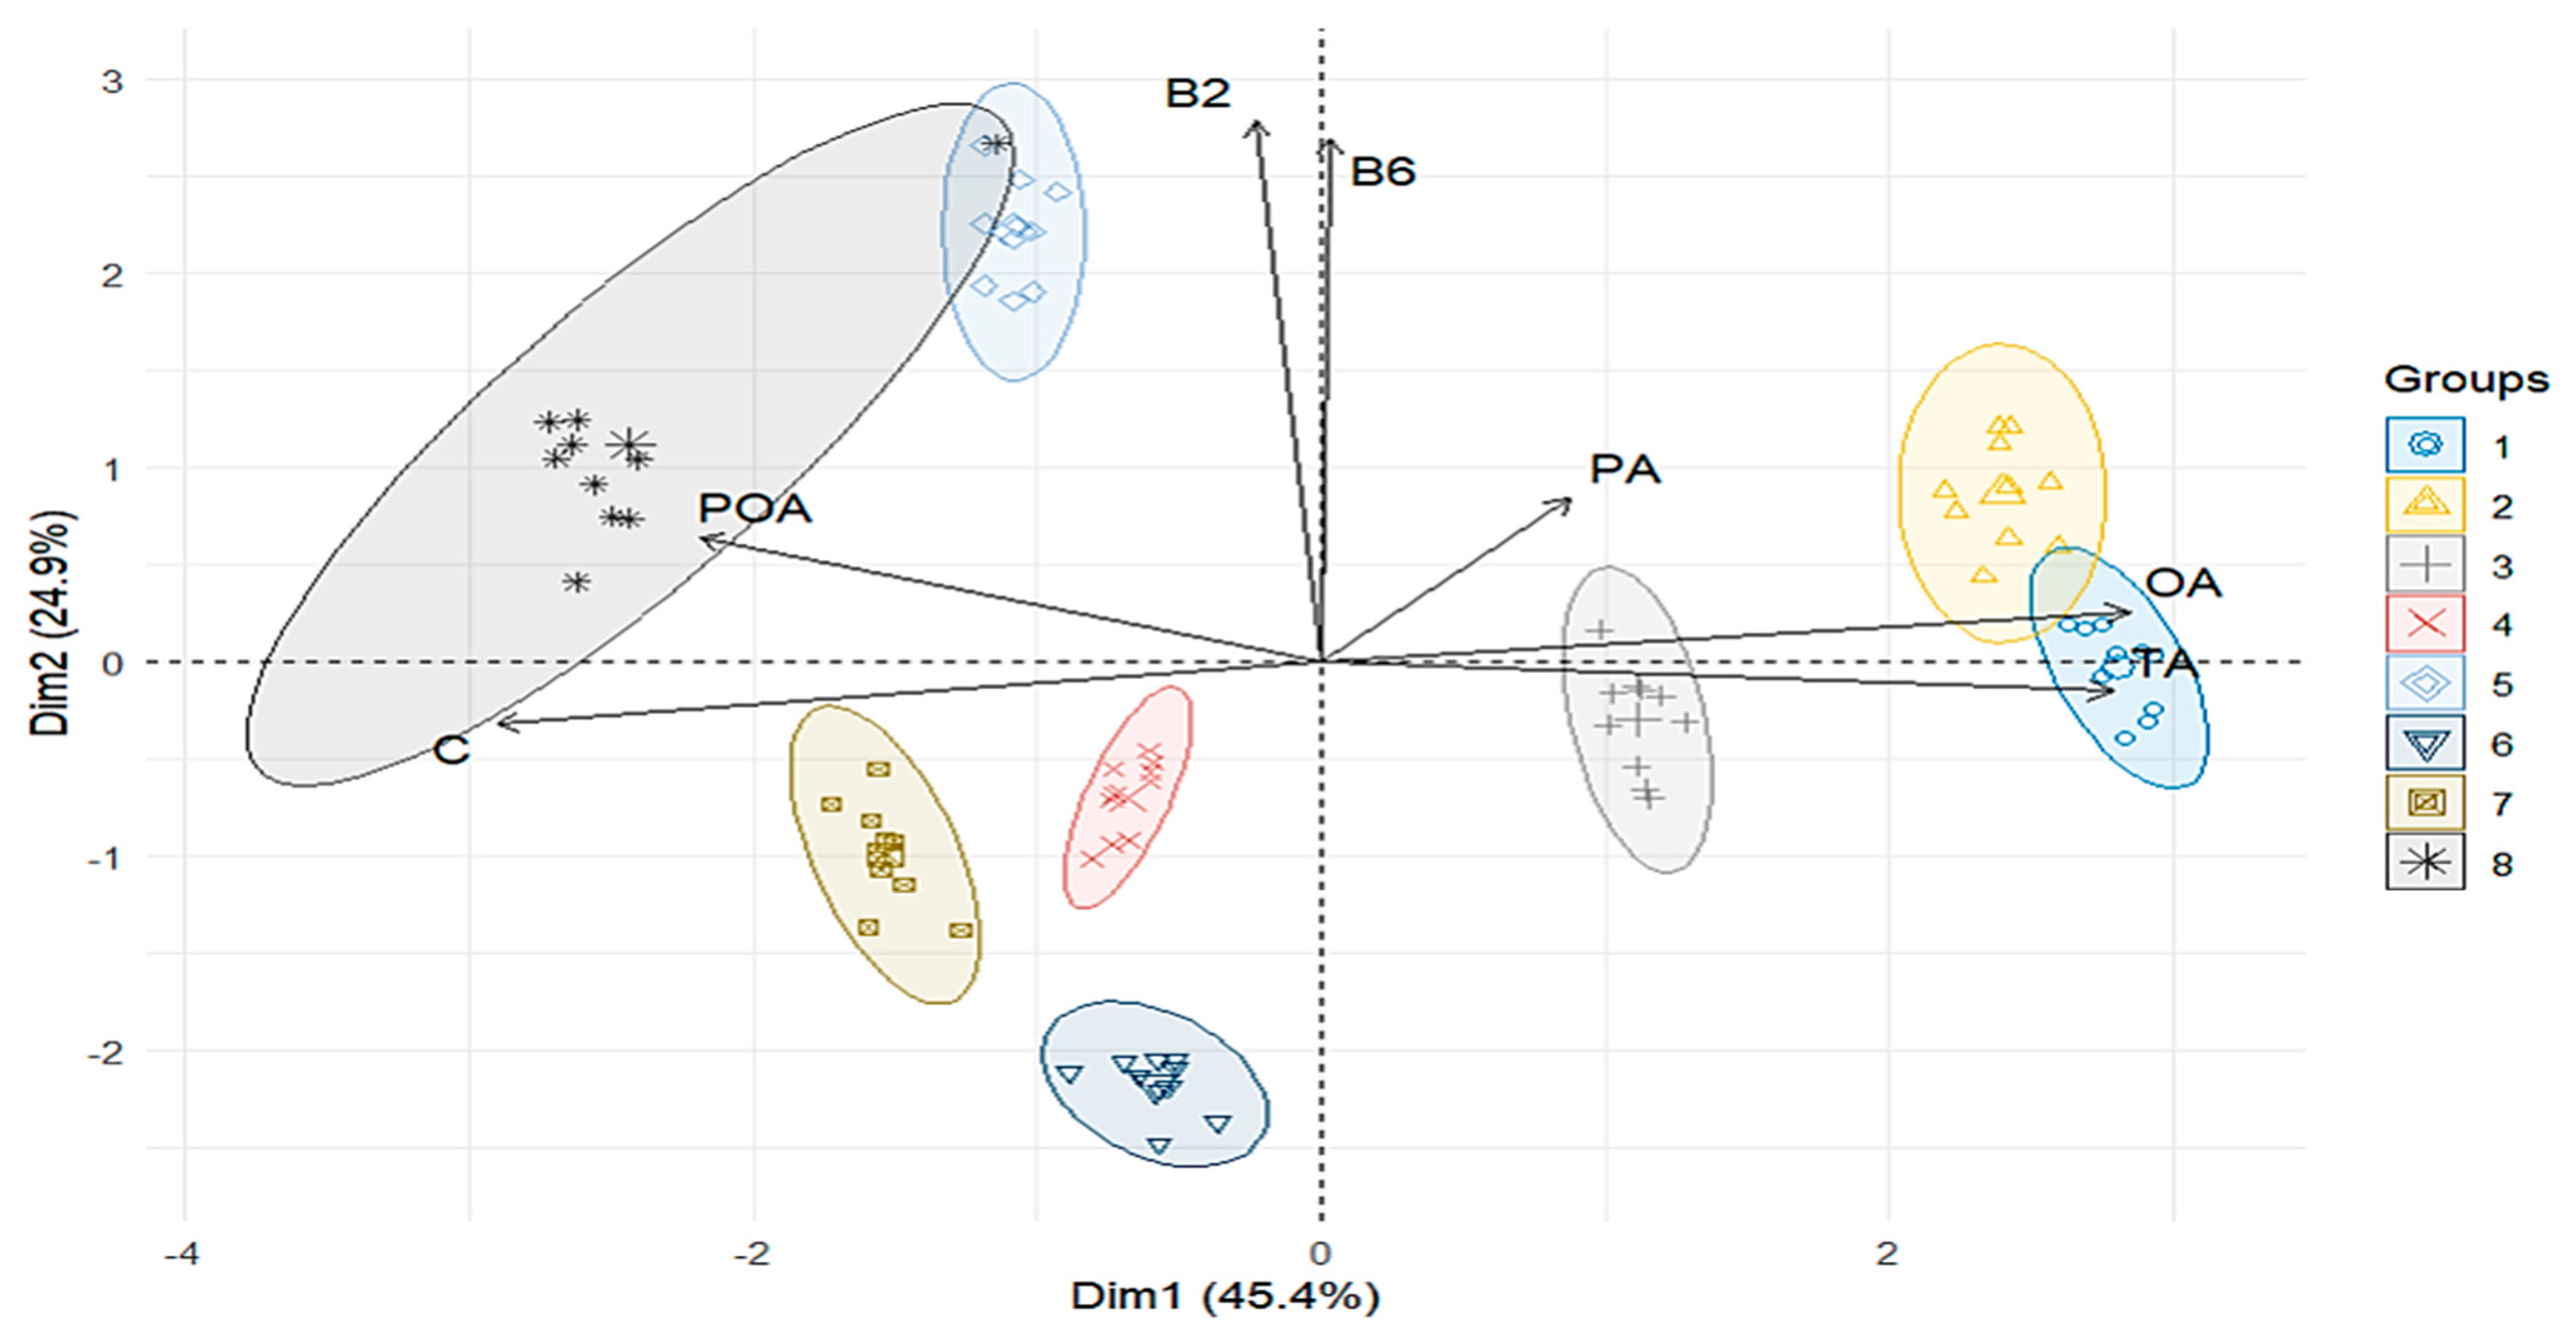
3.2.2. PERMANOVA of Nutritional Properties

The Permutational Multivariate Analysis of Variance (PERMANOVA) (Table 4) assessed the multivariate differences in nutritional properties of bananas (Musa paradisiaca) across ripening stages. The results indicated that the differences between stages were statistically significant (pseudo-F = 234.37; p < 0.001).
The determination coefficient (R2 = 0.7503) revealed that 75.03% of the variability in nutritional properties could be explained by ripening stages, with the remaining 24.97% attributed to residual variation, likely due to uncontrolled factors or intragroup variability. These findings confirm that ripening has a substantial impact on the nutritional composition of bananas, underscoring the importance of ripening stage as a determinant of the fruit’s nutritional profile.
Additionally, HJ-Biplot was performed to explore the relationships between the ripening stages and the physicochemical variables of bananas. As shown in Figure 2, the first axis (Dim1) explained 67.6% of the total variation, while the second axis (Dim2) explained 13.1%, resulting in a cumulative inertia of 80.8%. For the nutritional variables, the first axis (Dim1) accounted for 45.4% of the total variation, while the second axis (Dim2) contributed an additional 24.9%, leading to a cumulative inertia of 70.3%. This proportion effectively captures the main trends in nutritional differences across the ripening stages, providing a clear visualization of how key variables are associated with each phase.
In Figure 2, the vectors with the greatest lengths, such as those corresponding to oxalic acid (OA) and titratable acidity (TA), account for a substantial proportion of the variance observed in the early ripening stages (P1–P3), which cluster in the right quadrant of the biplot. This indicates that these variables are the primary contributors to the nutritional profile during the initial phases of maturation, characterized by elevated levels of acidic compounds.
In contrast, the left quadrant of the biplot captures the clustering of the later ripening stages (P7–P8). These stages are strongly associated with variables such as polyphenol oxidase activity (POA) and ascorbic acid (C), suggesting that these attributes play a significant role in differentiating fully mature fruits. The orientation and magnitude of these vectors along Dim1, which explains 45.4% of the total variance, emphasize their discriminative power at advanced ripening stages.
Intermediate stages (P4–P6) occupy transitional positions in the biplot and show moderate associations with variables such as B-complex vitamins (B1, B2, and B6) and tannic acid (PA). This distribution suggests a nutritional shift characterized by the reduction of acidic compounds, as indicated by shorter vectors for OA and TA, and a concurrent increase in antioxidant properties and enzymatic activity. These attributes reflect a balance between the early and advanced stages of ripening, explaining the 24.9% of variance captured by Dim2.

4. Discussion

The objective of this study was to analyze, through HJ-Biplot and PERMANOVA, the significant differences and similarities in the physicochemical and nutritional composition of bananas across different ripening stages. Eight ripening phases were considered, classified according to pericarp color, and evaluated with 10 replicates per phase. This approach enabled the identification of significant patterns in the nutritional and physicochemical changes associated with banana ripening.

4.1. Physicochemical Properties and Their Evolution During Ripening

The descriptive analysis of physicochemical properties revealed significant changes in parameters such as pH, soluble solids (SS), total starch (TS), and free sugars (FS). The progressive decrease in pH, from 5.48 in P1 to 4.95 in P8, likely reflects alterations in the acidic composition of the fruit, potentially due to the accumulation of secondary acids during later stages of ripening. In parallel, the increase in SS (from 15.2% in P1 to 21.73% in P8) and the marked rise in FS (from 19.78 mg/g in P1 to 361.85 mg/g in P8) highlight the enzymatic conversion of starch into simple sugars, primarily catalyzed by enzymes such as amyloglucosidase [44].
These findings align with prior research [45], which has observed a significant decrease in pH (p < 0.05) and notable increases in total soluble solids (TSS) and titratable acidity (TA) during fruit ripening. The PERMANOVA results reinforced these observations, revealing that 93.41% of the variation in physicochemical properties is significantly associated with ripening stages (p < 0.001). This underscores the critical role of ripening stages as the primary determinant of physicochemical differences in the fruit [46].
The HJ-Biplot analysis provided additional insights into these patterns. It demonstrated that early ripening stages (P1–P3) were strongly associated with total starch (TS) and resistant starch (RS), reflecting the predominance of complex carbohydrates in unripe bananas. In contrast, later ripening stages (P6–P8) were characterized by higher levels of free sugars (FS) and soluble solids (SS), indicating the biochemical transformation of starch into simple, digestible sugars [47].
Ethylene treatment, although not analyzed as a variable in this study, could play a relevant role in modulating the observed biochemical changes. Previous studies have reported that controlled application of ethylene accelerates ripening and optimizes enzymatic conversion of carbohydrates, which could have implications for both the marketability and nutritional profile of bananas. Evaluating its effect in future research would allow a better understanding of how this plant hormone can be used to adjust the physicochemical and nutritional characteristics of the fruit according to market demands and the dietary needs of consumers [48].
These results highlight the dynamic nature of the ripening process and its role in enhancing the sensory and nutritional qualities of bananas. The biochemical transitions observed during ripening align with previous reports on tropical fruits, further validating the findings [49].

4.2. Nutritional and Antioxidant Composition

In terms of nutritional properties, the progressive increase in ascorbic acid (C) content, from 281.4 ± 0.95 µg/g in P1 to 354.14 ± 1.42 µg/g in P8, indicates an enhancement in the antioxidant capacity of the fruit. This finding aligns with similar studies [21], which reported a 35% increase in vitamin C content in the final ripening stages of pineapples compared to the initial phase.
The reduction in oxalic acid (OA), from 22,905 ± 56.54 µg/g in P1 to just 14.00 ± 0.18 µg/g in P8, is another noteworthy result. This decline improves the fruit’s palatability, as oxalic acid contributes to unpleasant flavors and may have adverse effects on human health. Tannins, responsible for astringency in fruits, also showed a significant reduction, improving sensory acceptability by diminishing astringency and enhancing consumer preference [50,51]. These reductions align with prior findings, which noted that antinutrients such as tannins, oxalates, and phytates negatively impact mineral and protein absorption due to their chelating properties [52,53].
The PERMANOVA analysis for nutritional properties indicated that 75.03% of the multivariate variation could be significantly explained by ripening stages (p < 0.001). Although this percentage is lower than that observed for physicochemical properties, it highlights the substantial impact of ripening on the nutritional profiles of bananas. This underscores the importance of biochemical changes in key compounds, such as antioxidants and vitamins, during ripening [54].
The HJ-Biplot provided additional insights, showing that early stages (P1–P3) were associated with high levels of oxalic acid (OA) and titratable acidity (TA), whereas later stages (P7–P8) were linked to polyphenol oxidase activity (POA) and ascorbic acid (C). These findings are consistent with previous studies [55], which observed increased oxidative enzyme activity, such as POA, in the final ripening stages, contributing to enzymatic browning. Notably, other research [50] reported that pre-harvest applications of glycine betaine reduced POA activity and delayed browning in bananas, while also inhibiting chlorophyll degradation and ethylene production.
Intermediate stages (P4–P6) clustered with B-complex vitamins (B1, B2, B6) and tannic acid (PA), suggesting a metabolic balance characterized by a progressive reduction in acidic compounds and an increase in antioxidants and enzymatic activity. This transition aligns with findings from prior studies [56], which emphasized the critical role of intermediate stages in the nutritional development of tropical fruits.
The increase in vitamin C in the later stages of banana ripening shows how important this process is for improving the antioxidant properties of bananas. Vitamin C helps protect the body from damage caused by oxidative stress and strengthens the immune system, so riper bananas may be a better choice for those seeking a healthier diet. In addition, tannins and oxalic acid, compounds that can hinder the absorption of minerals such as calcium and iron, decrease in these stages. This means that riper bananas can provide more usable nutrients. Overall, these results show that the degree of ripening directly influences the nutritional value of the fruit [48].
Overall, the evolution of the physicochemical and nutritional properties of bananas during ripening has direct implications on consumer perception and nutritional value. As the fruit ripens, the conversion of starch to simple sugars improves the degree of sweetness and palatability, which influences consumer preference, especially in markets where sensory perception is a critical factor in the selection and subsequent purchase of a product. Previous research has stated that increased soluble solids and reduced acidity are related to increased acceptability, aligning with the findings of this study. From a commercial point of view, these changes justify the selection of certain ripening stages for distribution and sale, ensuring a balance between sensory quality and postharvest stability.
On the other hand, the interaction between the physicochemical and nutritional properties of bananas affects not only their quality and acceptability, but also their applicability in the food industry. In this sense, changes in starch and sugar content determine their suitability for the production of derived products such as flours, purees, or natural sweeteners. The reduction of astringent compounds in advanced stages of maturation also favors their use in formulations where texture and flavor play an essential role [57].

5. Conclusions

This study demonstrated the significant impact of ripening stages on the physicochemical and nutritional properties of bananas, using PERMANOVA and HJ-Biplot analyses to uncover key differences and associations. The physicochemical changes, such as the decrease in pH and total starch (TS) and the increase in soluble solids (SS) and free sugars (FS), reflect a biochemical transition from complex carbohydrates to simple sugars, driven by enzymatic activity. These transformations were shown to be robust indicators of ripening, with 93.41% of the variation in physicochemical properties explained by the ripening stages (p < 0.001).
Nutritional properties, including an increase in ascorbic acid (C) and a reduction in oxalic acid (OA) and tannins, underscore the enhancement of antioxidant capacity and sensory acceptability in later ripening stages. While 75.03% of the variation in nutritional properties was explained by ripening stages (p < 0.001), the clustering of stages in the HJ-Biplot revealed clear patterns, such as the association of early stages with antinutritional factors (e.g., OA and TA) and later stages with antioxidants (e.g., C) and enzymatic activity (e.g., POA). These findings provide a comprehensive understanding of the dynamic changes in bananas during ripening, emphasizing the ripening stages as a primary determinant of their physicochemical and nutritional profiles. This knowledge offers practical applications for the food industry by enabling the optimization of harvest timing, processing, and storage to enhance quality, nutritional value, and consumer satisfaction.
In addition to the applied impact, these results also contribute to the field of food science by providing a quantitative and multivariate approach to characterize banana ripening, which can be extrapolated to other tropical fruits with similar biochemical processes. The integration of advanced techniques such as PERMANOVA and HJ-Biplot in this type of studies allows a more accurate assessment of the factors that influence fruit quality and composition, opening new opportunities for comparative studies and predictive models in the agri-food industry.

Author Contributions

Conceptualization, M.F.G.-M., J.D.V.-C. and F.G.-V.; formal analysis, J.D.V.-C. and F.G.-V.; investigation, M.F.G.-M. and F.G.-V.; methodology, M.F.G.-M., J.D.V.-C. and F.G.-V.; supervision, P.G.-V. and P.V.-G.; writing—original draft, M.F.G.-M., F.G.-V., J.D.V.-C., P.G.-V. and P.V.-G.; writing—review and editing, P.G.-V. and P.V.-G. All authors have read and agreed to the published version of the manuscript.

Funding

This research was funded by Universidad Estatal de Milagro (UNEMI).

Institutional Review Board Statement

Not applicable.

Informed Consent Statement

Not applicable.

Data Availability Statement

The original contributions presented in the study are included in the article; further inquiries can be directed to the corresponding author.

Acknowledgments

The authors are grateful to the Universidad Estatal de Milagro (UNEMI).

Conflicts of Interest

The authors declare no conflicts of interest.

References

  1. Martínez-Solórzano, G.E.; Rey-Brina, J.C. Bananos (Musa AAA): Importancia, Producción y Comercio En Tiempos de COVID-19. Agron. Mesoam. 2021, 32, 1034–1046. [Google Scholar] [CrossRef]
  2. Ruiz Medina, M.D.; Ruales, J. Post-Harvest Alternatives in Banana Cultivation. Agronomy 2024, 14, 2109. [Google Scholar] [CrossRef]
  3. INEC. Encuesta de Superficie y Producción Agropecuaria Continua (ESPAC). 2023. Available online: https://anda.inec.gob.ec/anda/index.php/catalog/1037 (accessed on 4 May 2024).
  4. Keivani Rad, N.; Mohri, M.; Seifi, H.A.; Haghparast, A. Supplementation of Overripe Pulp Extract and Green Peel Extract or Powder of Banana Fruit Peel (Musa. Cavendish) to Diets of Neonatal Dairy Calves: Effects on Haematological, Immunological and Performance Characteristics. Vet. Med. Sci. 2021, 7, 876–887. [Google Scholar] [CrossRef] [PubMed]
  5. Chamorro-Hernandez, L.M.; Herrera-Granda, E.P.; Rivas-Rosero, C. Selection of the Processing Method for Green Banana Chips from Barraganete and Dominico Varieties Using Multivariate Techniques. Appl. Sci. 2024, 14, 2682. [Google Scholar] [CrossRef]
  6. Assunção, A.G.L.; Cakmak, I.; Clemens, S.; González-Guerrero, M.; Nawrocki, A.; Thomine, S. Micronutrient Homeostasis in Plants for More Sustainable Agriculture and Healthier Human Nutrition. J. Exp. Bot. 2022, 73, 1789–1799. [Google Scholar] [CrossRef]
  7. Symmank, C.; Zahn, S.; Rohm, H. Visually Suboptimal Bananas: How Ripeness Affects Consumer Expectation and Perception. Appetite 2018, 120, 472–481. [Google Scholar] [CrossRef]
  8. Maduwanthi, S.D.T.; Marapana, R.A.U.J. Induced Ripening Agents and Their Effect on Fruit Quality of Banana. Int. J. Food Sci. 2019, 2019, 2520179. [Google Scholar] [CrossRef]
  9. Swinnen, J.; Maertens, M.; Colen, L. The Role of Food Standards in Trade and Development. In Food Safety, Market Organization, Trade and Development; Springer International Publishing: Cham, Switzerland, 2015; pp. 133–149. [Google Scholar] [CrossRef]
  10. Anderson, M.J. Permutation Tests for Univariate or Multivariate Analysis of Variance and Regression. Can. J. Fish. Aquat. Sci. 2001, 58, 626–639. [Google Scholar] [CrossRef]
  11. Garrido-Martín, D.; Calvo, M.; Reverter, F.; Guigó, R. A Fast Non-Parametric Test of Association for Multiple Traits. Genome Biol. 2023, 24, 230. [Google Scholar] [CrossRef]
  12. Galindo, M. Una Alternativa de Representación Simultánea: HJBiplot; Universitat Politècnica de Barcelona: Barcelona, Spain, 1986. [Google Scholar]
  13. Pilacuan-Bonete, L.; Galindo-Villardón, P.; Delgado-Álvarez, F. HJ-Biplot as a Tool to Give an Extra Analytical Boost for the Latent Dirichlet Assignment (LDA) Model: With an Application to Digital News Analysis about COVID-19. Mathematics 2022, 10, 2529. [Google Scholar] [CrossRef]
  14. Cheng, Y.; Huang, P.; Chan, Y.; Chiang, P.; Lu, W.; Hsieh, C.; Liang, Z.; Yan, B.; Wang, C.R.; Li, P. Investigate the Composition and Physicochemical Properties Attributes of Banana Starch and Flour during Ripening. Carbohydr. Polym. Technol. Appl. 2024, 7, 100446. [Google Scholar] [CrossRef]
  15. Chassagne-Berces, S.; Fonseca, F.; Citeau, M.; Marin, M. Freezing Protocol Effect on Quality Properties of Fruit Tissue According to the Fruit, the Variety and the Stage of Maturity. LWT-Food Sci. Technol. 2010, 43, 1441–1449. [Google Scholar] [CrossRef]
  16. Li, Z.; Thomas, C. Quantitative Evaluation of Mechanical Damage to Fresh Fruits. Trends Food Sci. Technol. 2014, 35, 138–150. [Google Scholar] [CrossRef]
  17. Guadalupe-Moyano, V.; Palacios-Ponce, A.S.; Rosell, C.M.; Cornejo, F. Impact of Drying Methods on Banana Flour in the Gluten-Free Bread Quality. LWT 2022, 168, 113904. [Google Scholar] [CrossRef]
  18. Martín Lorenzo, M.; Piedra-Buena Díaz, A.; Díaz Romero, C.; Rodríguez-Rodríguez, E.M.; Lobo, M.G. Physicochemical and Nutritional Characterization of Green Banana Flour from Discarded Cavendish Bananas. Sustainability 2024, 16, 6647. [Google Scholar] [CrossRef]
  19. AOAC. Official Methods of Analysis of AOAC International; AOAC International: Gaithersburg, MD, USA, 2006. [Google Scholar]
  20. Valenzuela Cobos, J.D.; Guevara Viejó, F.; Grijalva Endara, A.; Vicente Galindo, P.; Galindo Villardón, P. Multivariate Statistical Techniques: A New Approach to Identify the Commercial Properties of Mixtures of Flours of Lentinula Edodes and Cocoa Pod Husk. J. Fungi 2023, 9, 991. [Google Scholar] [CrossRef]
  21. Adedayo, B.C.; Oboh, G.; Oyeleye, S.I.; Olasehinde, T.A. Antioxidant and Antihyperglycemic Properties of Three Banana Cultivars (Musa spp.). Scientifica 2016, 2016, 8391398. [Google Scholar] [CrossRef]
  22. Megazyme. Total Starch Assay Procedure (Amyloglucosidase/α-Amylase Method). AOAC Method 996.11; AACC Method 76.13. 2011. Available online: https://www.fts.co.nz/image/data/PDF/K-TSTA_1107_DATA.pdf (accessed on 18 February 2025).
  23. Huang, P.-H.; Cheng, Y.-T.; Lu, W.-C.; Chiang, P.-Y.; Yeh, J.-L.; Wang, C.-C.; Liang, Y.-S.; Li, P.-H. Changes in Nutrient Content and Physicochemical Properties of Cavendish Bananas Var. Pei Chiao during Ripening. Horticulturae 2024, 10, 384. [Google Scholar] [CrossRef]
  24. Scalisi, A.; O’Connell, M.G. Relationships between Soluble Solids and Dry Matter in the Flesh of Stone Fruit at Harvest. Analytica 2021, 2, 14–24. [Google Scholar] [CrossRef]
  25. Polak, N.; Kalisz, S.; Kruszewski, B. High-Temperature Short-Time and Ultra-High-Temperature Processing of Juices, Nectars and Beverages: Influences on Enzyme, Microbial Inactivation and Retention of Bioactive Compounds. Appl. Sci. 2024, 14, 8978. [Google Scholar] [CrossRef]
  26. Cohen, S.; Itkin, M.; Yeselson, Y.; Tzuri, G.; Portnoy, V.; Harel-Baja, R.; Lev, S.; Sa‘ar, U.; Davidovitz-Rikanati, R.; Baranes, N.; et al. The PH Gene Determines Fruit Acidity and Contributes to the Evolution of Sweet Melons. Nat. Commun. 2014, 5, 4026. [Google Scholar] [CrossRef]
  27. NTE INEN-ISO 750; Productos Vegetales Y DE Frutas–Determinación de La Acidez Titulable (IDT). ISO: Geneva, Switzerland, 2013.
  28. Gentili, A.; Dal Bosco, C. Analysis of Vitamins by Liquid Chromatography. In Liquid Chromatography; Elsevier: Amsterdam, The Netherlands, 2023; pp. 733–786. [Google Scholar] [CrossRef]
  29. Nelson, K.J.; Parsonage, D. Measurement of Peroxiredoxin Activity. Curr. Protoc. Toxicol. 2011, 49, 7–10. [Google Scholar] [CrossRef] [PubMed]
  30. Karamad, D.; Khrosravi, K.; Hosseini, H.; Tavasoli, S. Analytical Procedures and Methods Validation for Oxalate Content Estimation. Biointerface Res. Appl. Chem. 2019, 9, 4305–4310. [Google Scholar] [CrossRef]
  31. Verzele, M.; Delahaye, P. Analysis of Tannic Acids by High-Performance Liquid Chromatography. J. Chromatogr. A 1983, 268, 469–476. [Google Scholar] [CrossRef]
  32. Mardia, K.V. Measures of Multivariate Skewness and Kurtosis with Applications. Biometrika 1970, 57, 519–530. [Google Scholar] [CrossRef]
  33. Tabachnick, B.G.; Fidell, L.S. Using Multivariate Statistics, 6th ed.; Pearson: Boston, MA, USA, 2013. [Google Scholar]
  34. Hair, J.; Babin, B.; Anderson, R.; Black, W. Multivariate Data Analysis, 8th ed.; Pearson Prentice: England, UK, 2019. [Google Scholar]
  35. Anderson, M.J. A New Method for Non-parametric Multivariate Analysis of Variance. Austral Ecol. 2001, 26, 32–46. [Google Scholar] [CrossRef]
  36. Zeileis, A.; Köll, S.; Graham, N. Various Versatile Variances: An Object-Oriented Implementation of Clustered Covariances in R. J. Stat. Softw. 2020, 95, 1–36. [Google Scholar] [CrossRef]
  37. Anderson, M.J. Distance-Based Tests for Homogeneity of Multivariate Dispersions. Biometrics 2006, 62, 245–253. [Google Scholar] [CrossRef]
  38. Bray, J.R.; Curtis, J.T. An Ordination of the Upland Forest Communities of Southern Wisconsin. Ecol. Monogr. 1957, 27, 325–349. [Google Scholar] [CrossRef]
  39. Gabriel, K. The Biplot Graphic Display of Matrices with Application to Principal Component Analysis. Biometrika 1971, 58, 453–467. [Google Scholar] [CrossRef]
  40. Samanros, A.; Lin, J. Physicochemical Properties and in Vitro Digestibility of Starches from Different Taiwanese Banana Cultivars. Int. Food Res. J. 2021, 28, 1257–1267. [Google Scholar] [CrossRef]
  41. Li, M.-C.; Chou, C.-F.; Hsu, S.-C.; Lin, J.-S. Physicochemical Characteristics and Resistant Starch of Different Varieties of Banana from Taiwan. Int. J. Food Prop. 2020, 23, 1168–1175. [Google Scholar] [CrossRef]
  42. Biabiany, S.; Araou, E.; Cormier, F.; Martin, G.; Carreel, F.; Hervouet, C.; Salmon, F.; Efile, J.-C.; Lopez-Lauri, F.; D’Hont, A.; et al. Detection of Dynamic QTLs for Traits Related to Organoleptic Quality during Banana Ripening. Sci. Hortic. 2022, 293, 110690. [Google Scholar] [CrossRef]
  43. Pareek, S. Nutritional and Biochemical Composition of Banana (Musa spp.) Cultivars. In Nutritional Composition of Fruit Cultivars; Elsevier: Amsterdam, The Netherlands, 2015; pp. 49–81. [Google Scholar] [CrossRef]
  44. Fu, Y.; Meng, X.J.; Lu, N.N.; Jian, H.L.; Di, Y. Characteristics Changes in Banana Peel Coagulant during Storage Process. Int. J. Environ. Sci. Technol. 2019, 16, 7747–7756. [Google Scholar] [CrossRef]
  45. Addai, Z.R.; Abdullah, A.; Abd. Mutalib, S.; Musa, K.H.; Douqan, E.M.A. Antioxidant Activity and Physicochemical Properties of Mature Papaya Fruit (Carica papaya L. Cv. Eksotika). Adv. J. Food Sci. Technol. 2013, 5, 859–865. [Google Scholar] [CrossRef]
  46. Rop, O.; Sochor, J.; Jurikova, T.; Zitka, O.; Skutkova, H.; Mlcek, J.; Salas, P.; Krska, B.; Babula, P.; Adam, V.; et al. Effect of Five Different Stages of Ripening on Chemical Compounds in Medlar (Mespilus germanica L.). Molecules 2010, 16, 74–91. [Google Scholar] [CrossRef]
  47. Prabha, T.N.; Bhagyalakshmi, N. Carbohydrate Metabolism in Ripening Banana Fruit. Phytochemistry 1998, 48, 915–919. [Google Scholar] [CrossRef]
  48. Hardisson, A.; Rubio, C.; Baez, A.; Martin, M.; Alvarez, R.; Diaz, E. Mineral Composition of the Banana (Musa Acuminata) from the Island of Tenerife. Food Chem. 2001, 73, 153–161. [Google Scholar] [CrossRef]
  49. Mahmood, U.L.; Zora, S.; Hafiz, S.; Jashanpreet, K.; Andrew, W. Oxalic Acid: A Blooming Organic Acid for Postharvest Quality Preservation of Fresh Fruit and Vegetables. Postharvest Biol. Technol. 2023, 206, 112574. [Google Scholar] [CrossRef]
  50. Li, X.; Ouyang, W.; Jiang, Y.; Lin, Q.; Peng, X.; Hu, H.; Ye, Z.; Liu, G.; Cao, Y.; Yu, Y. Dextran-Sulfate-Sodium-Induced Colitis-Ameliorating Effect of Aqueous Phyllanthus emblica L. Extract through Regulating Colonic Cell Gene Expression and Gut Microbiomes. J. Agric. Food Chem. 2023, 71, 6999–7008. [Google Scholar] [CrossRef]
  51. Fernando, H.R.P.; Srilaong, V.; Pongpraser, N.; Boonyaritthongchai, P.; Jitareera, P. Changes in Antioxidant Properties and Chemical Composition during Ripening in Banana Variety ‘Hom Thong’ (AAA Group) and ‘Khai’ (AA Group). Int. Food Res. J. 2013, 21, 749–754. [Google Scholar]
  52. Freeland-Graves, J.H.; Sachdev, P.K.; Binderberger, A.Z.; Sosanya, M.E. Global Diversity of Dietary Intakes and Standards for Zinc, Iron, and Copper. J. Trace Elem. Med. Biol. 2020, 61, 126515. [Google Scholar] [CrossRef] [PubMed]
  53. Nguyễn, H.V.H.; Savage, G.P. Oxalate Content of New Zealand Grown and Imported Fruits. J. Food Compos. Anal. 2013, 31, 180–184. [Google Scholar] [CrossRef]
  54. Kalogiouri, N.P.; Aalizadeh, R.; Thomaidis, N.S. Application of an Advanced and Wide Scope Non-Target Screening Workflow with LC-ESI-QTOF-MS and Chemometrics for the Classification of the Greek Olive Oil Varieties. Food Chem. 2018, 256, 53–61. [Google Scholar] [CrossRef]
  55. Prasanna, V.; Prabha, T.N.; Tharanathan, R.N. Fruit Ripening Phenomena—An Overview. Crit. Rev. Food Sci. Nutr. 2007, 47, 1–19. [Google Scholar] [CrossRef]
  56. Holderbaum, D.F.; Kon, T.; Kudo, T.; Guerra, M.P. Enzymatic Browning, Polyphenol Oxidase Activity, and Polyphenols in Four Apple Cultivars: Dynamics during Fruit Development. HortScience 2010, 45, 1150–1154. [Google Scholar] [CrossRef]
  57. Wang, B.; Kang, J.; Wang, S.; Haider, F.U.; Zhong, Y.; Zhang, P. Variations in the End-Use Quality of Whole Grain Flour Are Closely Related to the Metabolites in the Grains of Pigmented Wheat (Triticum aestivum L.). Plants 2025, 14, 171. [Google Scholar] [CrossRef]
Figure 1. HJ-Biplot of the distribution and correlation of physicochemical properties across ripening stages.
Agriculture 15 01025 g001
Figure 2. HJ-Biplot of multivariate nutritional and vitamin properties across ripening stages.
Agriculture 15 01025 g002
Table 1. Changes in chemical composition during banana ripening.
PhasespHSSTACFCFAtCPATSRSFS
P15.48 a ± 0.0315.20 h ± 0.100.29 h ± 0.010.64 bc ± 0.020.30 f ± 0.016.27 a ± 0.023.49 c ± 0.0176.15 a ± 0.0533.30 b ± 0.0219.78 h ± 0.05
P25.41 b ± 0.0116.10 g ± 0.100.36 g ± 0.010.63 b ± 0.020.33 d ± 0.015.92 b ± 0.033.60 b ± 0.0572.52 b ± 0.0333.27 b ± 0.0328.32 g ± 0.03
P35.34 c ± 0.0317.00 f ± 0.100.41 f ± 0.010.62 d ± 0.010.34 d ± 0.015.16 g ± 0.023.37 e ± 0.0268.08 c ± 0.0336.04 a ± 0.0652.38 f ± 0.03
P45.28 d ± 0.0118.50 e ± 0.100.45 e ± 0.020.61 d ± 0.020.31 e ± 0.015.51 f ± 0.023.60 b ± 0.0256.80 d ± 0.0519.59 c ± 0.01183.15 e ± 0.05
P55.20 e ± 0.0119.30 d ± 0.100.52 d ± 0.010.67 a ± 0.020.35 c ± 0.025.70 c ± 0.023.78 a ± 0.0353.83 e ± 0.0213.35 d ± 0.02272.32 d ± 0.03
P65.10 f ± 0.0120.00 c ± 0.100.56 c ± 0.010.62 cd ± 0.010.36 c ± 0.025.61 e ± 0.073.24 f ± 0.0345.05 f ± 0.059.24 e ± 0.03316.62 c ± 0.04
P75.02 g ± 0.0221.00 b ± 0.100.62 b ± 0.010.61 d ± 0.010.40 b ± 0.015.20 g ± 0.023.20 g ± 0.0241.33 g ± 0.029.12 e ± 0.03323.91 b ± 0.04
P84.95 h ± 0.0421.73 a ± 0.120.68 a ± 0.010.53 e ± 0.010.41 a ± 0.025.65 d ± 0.033.42 d ± 0.0333.92 h ± 0.035.78 f ± 0.03361.85 a ± 0.06
Note: Standard deviation indices have been included in the analysis. Categories were defined on the basis of pericarp characteristics: P1 (dark green), P2 (light green), P3 (green with small yellow spots), P4 (green with yellow stripes), P5 (yellow with green margins), P6 (completely yellow), P7 (yellow with small pigmented spots), and P8 (yellow with pronounced brown spots). Different superscript letters within the same column indicate statistically significant differences between phases (p < 0.05)
Table 2. Biochemical and enzymatic transformations during banana ripening.
PhasesVitamin (ug/g)Bioactive Component
CB1B2B6OATAPOAPA
P1281.40 f ± 0.950.77 b ± 0.023.89 d ± 0.0147.80 cd ± 0.2022,905.33 a ± 56.54459.18 b ± 3.312.56 g ± 0.013.88 a ± 0.02
P2289.58 e ± 0.830.82 a ± 0.024.23 bc ± 0.0349.87 b ± 0.1513,533.00 b ± 72.34581.00 a ± 3.613.73 f ± 0.033.33 b ± 0.02
P3297.57 d ± 0.750.72 d ± 0.014.14 c ± 0.0444.60 e ± 0.1011,550.00 c ± 50.00351.00 c ± 3.615.59 e ± 0.011.85 c ± 0.03
P4349.35 b ± 0.760.59 e ± 0.013.85 de ± 0.0547.30 cd ± 0.20335.00 d ± 5.00312.33 d ± 2.526.05 d ± 0.051.87 c ± 0.02
P5331.28 c ± 0.940.72 cd ± 0.014.58 a ± 0.0352.33 a ± 0.15128.67 de ± 2.08130.00 h ± 2.005.88 de ± 0.021.72 d ± 0.03
P6326.10 c ± 0.260.81 ab ± 0.013.71 e ± 0.0441.67 f ± 0.15100.17 e ± 0.76241.07 e ± 1.016.39 c ± 0.011.52 e ± 0.03
P7354.88 a ± 1.400.80 bc ± 0.013.76 e ± 0.0246.39 d ± 0.0386.73 e ± 0.26187.57 f ± 0.839.52 b ± 0.030.71 g ± 0.01
P8354.14 ab ± 1.420.82 a ± 0.014.30 b ± 0.0548.28 c ± 0.0314.00 e ± 0.18157.53 g ± 1.1124.53 a ± 0.030.80 f ± 0.02
Note: Standard deviation indices have been included in the analysis. Las variables han sido abreviadas de la siguiente manera: C (Ascorbic Acid), B1 (Thiamine), B2 (Riboflavin), B6 (Pyridoxal), OA (Oxalic Acid), TA (Tannins), POA (Polyphenol Oxidase Activity), PA (Peroxidase Activity). Different superscript letters within the same column indicate statistically significant differences between phases (p < 0.05).
Table 3. Analysis of physicochemical variations during ripening stages.
DfSumOfSqsR2FPr (>F)
Phases71,357,0210.93411105.700.001 ***
Residual7295,7290.0659
Total791,452,75010.000
Note: *** High significance.
Table 4. PERMANOVA analysis of nutritional properties across ripening stages.
DfSumOfSqsR2FPr (>F)
Phases14,067,951,7300.7503234.370.001 ***
Residual781,353,837,3930.2497
Total795,421,789,12310.000
Note: *** High significance.
Disclaimer/Publisher’s Note: The statements, opinions and data contained in all publications are solely those of the individual author(s) and contributor(s) and not of MDPI and/or the editor(s). MDPI and/or the editor(s) disclaim responsibility for any injury to people or property resulting from any ideas, methods, instructions or products referred to in the content.

