1. Introduction
Honeybees (
Apis mellifera L.) play an essential role in global ecosystems as pollinators, contributing significantly to global biodiversity and agricultural productivity [
1]. However, their populations face multiple threats, including habitat degradation, chemical exposure, and elevated predation rates, which can result in colony stress and decline [
2]. For this reason, continuous monitoring of hive activity is crucial for evaluating the status of the colony. Although direct observation at the hive entrance is not capable of diagnosing internal conditions such as brood health or diseases, changes in foraging patterns, reduced traffic, or increased mortality can serve as early indicators of environmental stressors, predation pressure, or forage availability.
Traditional beekeeping practices rely on periodic manual inspections to evaluate internal condition of the hive, and these inspections remain vital for maintaining colony’s health. However, they are often time-consuming, labor-intensive, and can disturb the colony’s environment. Automated vision-based monitoring systems offer an advanced approach to continuous, non-intrusive assessment of external hive activity, supporting the principles of precision beekeeping by providing real-time detection of changes in foraging behavior, traffic patterns, or the presence of external threats. These capabilities ensure a more rapid identification of potential issues in comparison to periodic manual checks. Furthermore, the implementation of such systems in multiple hives enables beekeepers to prioritize interventions based on objective indicators of colony status.
However, the detection and classification of insect activity at the hive entrance presents significant challenges due to the inherent complexities of the visual environment. Effective models must maintain a high detection accuracy despite variations in illumination, background complexity, and frequent occlusions. Honeybees often appear partially occluded or blurred due to movement, shadows, or overlapping individuals, further complicating the detection process. In addition, models trained on limited insect classes can misclassify morphologically similar insects, such as drones and wasps, which share overlapping morphological features related to body size, shape, and coloration. This can lead to inaccurate assessment of the hive’s condition.
A broader assessment of hive activity requires the simultaneous detection and classification of multiple insect groups, including bees, pollen-carrying bees, drones, and wasps. The presence and relative abundance of these groups provide critical insights into various aspects of colony’s health and function [
3,
4,
5]. Pollen collected by foragers is essential for brood development [
6,
7,
8], while drones contribute to genetic diversity through mating [
9,
10]. Predatory wasps, such as
Vespa velutina and
Vespa crabro, pose significant threats by preying on bees and robbing hive resources [
11,
12,
13]. Simultaneous monitoring of these key insect groups offers a more holistic understanding of colony status and supports early identification of potential threats, thereby enhancing the beekeeper’s ability to maintain healthy and productive colonies.
Moreover, existing datasets for insect detection, while valuable, often exhibit limitations that hinder the development of robust, field-deployable monitoring systems. Many of them focus on only one or two insect classes [
14,
15,
16,
17,
18,
19], are collected at a single hive location [
14,
15,
17,
19,
20], or employ controlled, and often artificial lighting [
21,
22] or background conditions [
14,
17,
18,
23,
24,
25]. Some studies even use modifications to the hive environment, such as shading from direct sunlight [
15] or transparent corridors [
15,
18], which can alter natural bee behavior and potentially confound the evaluation of the hive’s condition. Furthermore, the use of specialized, often costly, equipment in some data acquisition setups limits portability and scalability for deployment across multiple hives and diverse apiary locations. Therefore, there is a clear need for comprehensive, multi-class insect datasets that capture natural bee behavior under diverse and representative field conditions to enable the development of generalizable, practical monitoring solutions.
To address these challenges, this paper focuses on the development of a model for detecting worker bees, pollen-carrying bees, drones, and wasps on the native entrance ramps of beehives as a key component of a broader bee behavior recognition system. To ensure the model is robust under varying lighting conditions, landing board shapes, backgrounds, bee concentrations, and partial occlusions, a new four-class dataset was collected from video recordings of different beehive entrances within a single apiary and meticulously annotated by two independent annotators. The detection model serves as the foundation for future tracking algorithms, which will analyze insect movement paths to enable behavior recognition. Therefore, this study evaluates various deep learning models to determine the most suitable one for tracking applications. Additionally, multiple detection architectures were tested, and targeted modifications were introduced to enhance small object detectability, particularly for pollen-bearing bees. The models were also assessed on the Jetson AGX Orin platform to ensure efficient deployment on embedded systems. The proposed work represents the first step toward developing a long-term automated monitoring system that directly processes visual data to extract behavioral statistics, identify significant events at the beehive entrance, and monitor hive conditions through visual inspection.
Our contributions can be summarized as follows:
A new dataset [
26] was collected, annotated, and publicly provided for worker bee, pollen, drone, and wasp detection at the hive entrance. It contains the following:
- –
A total 15 different beehives, 11,008 annotated frames, and 609 background images.
- –
A total 116,853 instances of worker bees, 14,062 pollen, 1320 drones, and 1405 wasps.
We performed a comparative evaluation of various object detection models for worker bee, pollen, drone, and wasp detection on an RTX 4080 Super 16 GB and a Jetson AGX Orin 64 GB.
2. Related Works
Previous studies (
Table 1) related to the presented work can be broadly categorized into three main areas: studies focused solely on pollen detection, studies dedicated to invasive insect detection, and research that addresses both tasks simultaneously. Pollen detection studies generally involve either direct identification of pollen grains or classification of bees based on their pollen-bearing status. Invasive insect detection research primarily aims to identify and mitigate threats posed by invasive species such as hornets, wasps, and other insects. Significant advancements have been made in these individual domains; however, only a limited number of studies have attempted to integrate both aspects within a unified framework. A summary of studies related to the detection of pollen and invasive species is presented in
Table 1, which is divided into three sections based on the scope of the tasks addressed. The initial section presents studies that propose a solution to pollen detection. The second section is dedicated to papers focusing on invasive insect detection, while the third section presents works that address the detection of both pollen and invasive insects. The following subsections provide a detailed review of prior work within each category.
2.1. Pollen Detection
Among the three primary research areas, pollen detection has received the most extensive attention. This focus is driven by its critical role in understanding pollination dynamics and monitoring the foraging behavior of bees, both of which are essential for assessing colony health and ecosystem stability. Most studies have focused on classifying honeybees as pollen-bearing or non-pollen bearing based on visual cues and leveraging traditional computer vision, machine learning or deep learning techniques.
Rodriguez et al. [
15] addressed this challenge by collecting a publicly available dataset of 710 high-resolution images of honeybees, labeled as pollen-bearing or non-pollen bearing, to perform automated analysis of foraging behavior. The authors investigated multiple classification approaches, including baseline classifiers (KNN, SVM, and Naïve Bayes), shallow Convolutional Neural Networks (CNNs), and deep learning models like VGG-16, VGG-19, and ResNet-50. The results revealed that shallow CNNs outperformed both traditional classifiers and deep models, achieving a classification accuracy of up to 96.4% in distinguishing between pollen-bearing and non-pollen bearing honeybees.
Building upon the dataset introduced in the paper above, subsequent studies investigated alternative architectures and training strategies to further improve pollen detection performance. Berkaya et al. [
27] leveraged the same dataset within a broader study on beehive monitoring, incorporating pollen detection as a secondary task. The authors of the study proposed multiple deep learning models using transfer learning with pre-trained networks such as AlexNet, DenseNet-201, ResNet-101, GoogLeNet, ResNet-18, VGG-16, and VGG-19. Among these, GoogLeNet with transfer learning achieved the highest accuracy of 99.07%. More recently, Nhung et al. [
28] proposed a novel CNN architecture specifically optimized for pollen detection. Their model features a simplified CNN structure with four convolutional layers, five max-pooling layers, and fully connected dense layers with a Sigmoid activation function. To enhance training efficiency, the authors applied data augmentation techniques such as rescaling, rotation, flipping and other. The experimental results demonstrated that the proposed model outperformed state-of-the-art architectures, including VGG-16, VGG-19, and ResNet-50, achieving a classification accuracy of 100%.
Yoo et al. [
29] introduced BeeNet, a deep learning model designed for enhanced feature representation and classification in honeybee monitoring, with a particular focus on bee species identification and fine-grained health monitoring tasks such as pollen and varroa mite detection. The BeeNet architecture consists of two primary components: a feature extraction block leveraging a modified ResNet-50 network and a transformer-based classification block with a fully connected layer. The model follows a hierarchical classification pipeline, first determining whether an object is a bee, then identifying the bee species, and finally assessing health indicators, such as the presence of pollen or varroa mites. BeeNet achieved 99.18% accuracy in pollen detection, surpassing state-of-the-art models such as ResNet, EfficientNet, and Vision Transformer variants, demonstrating its effectiveness in fine-grained bee health monitoring.
In their study, Nguyen et al. [
19] used YOLOv5 and Faster R-CNN models to enhance the detection of pollen-bearing honeybees from video data. The authors collected a VnPollenBee dataset, consisting of 2051 high-resolution images, each annotated with bounding boxes defining individual bees. These datasets reflects real-world complexities, including a significant class imbalance where pollen-bearing bees are underrepresented. To mitigate this issue, the authors integrated focal loss and overlap sampler techniques into both models. The experimental results demonstrated that the YOLOv5 model with focal loss achieved an F1 score of 93%, while the Faster R-CNN model optimized with the overlap sampler reached an F1 score of 95%, with a precision of 99% and a recall of 93%, highlighting its robustness in detecting pollen-bearing bees under challenging conditions.
Ngo et al. [
18] presented a video-based pollen detection system that continuously monitors honeybee activity at the entrance of a beehive using an off-the-shelf camera. Their system integrates a lightweight, real-time object detection-based classification model, YOLOv3-tiny, to detect, track, classify, and count honeybees as they enter and exit the hive. The authors also collected a dataset from real-time video streams, producing 3000 training images and 500 test images. Model performance was evaluated using precision, recall, and F1-score, with an F1 score of 94% achieved for pollen detection.
A study by Babic et al. [
14] developed a non-invasive, video-based system implemented on a Raspberry Pi model 2 with an RGB camera, capturing video at
resolution at 30 frames per second. Their approach relied on background subtraction using the Mixture of Gaussians (MOG) algorithm for moving object segmentation, followed by a nearest-mean classifier (NMC) for distinguishing between pollen-bearing and non-pollen-bearing honeybees. The classification was performed using two key handcrafted features: color variance and eccentricity. The system demonstrated an accuracy of 88.7% in identifying pollen-bearing honeybees.
In the paper [
16], the authors proposed a two-stage approach involving image segmentation and classification for pollen detection. The segmentation process used two methods based on color descriptors: thresholding on the b component of the LAB color space and k-means clustering. Segmented regions were further refined with morphological post-processing to exclude non-relevant areas. For classification, the authors utilized Scale-Invariant Feature Transform (SIFT) descriptors, which were encoded using the Vector of Locally Aggregated Descriptors (VLAD) and classified via Support Vector Machines (SVMs). Their segmentation method achieved an Intersection over Union (IoU) score of 79.71%, while classification yielded an Area Under the Curve (AUC) of 91.5%, indicating strong performance in distinguishing pollen-bearing honeybees.
While the majority of research in pollen detection focuses on classifying entire honeybees as either pollen-bearing or non-pollen-bearing based on visual cues, some studies have taken a more fine-grained approach by directly detecting and analyzing pollen sacs. In order to reduce the reliance on manual inspections of the hive, Yang and Collins [
17] proposed a deep learning-based model for the detection of pollen sacs on honeybees in monitoring videos. Their approach used Faster R-CNN with a VGG-16 backbone to detect pollen sacs on individual bee images extracted from video frames. The dataset, consisting of 2400 high-resolution images, was recorded at
resolution and 50 frames per second. For the purpose of analysis, individual bee images were cropped to sizes between
and
pixels. The model achieved a detection accuracy of 96% and a measurement error of 7%, significantly outperforming a baseline image processing method, which had a 33% error rate.
Although pollen detection models have achieved high classification accuracies in controlled experiments, several challenges persist under real-world conditions. Small pollen sacs often occupy very few pixels relative to the worker bee body, making them difficult to detect, especially in cluttered or dynamic backgrounds [
17,
19]. Variations in lighting, motion blur, occlusions from other worker bees, and different pollen colors further complicate detection tasks [
18,
28]. These factors contribute to decreased detection robustness when systems are deployed in natural field environments.
2.2. Invasive Insect Detection
The presence of invasive insect species near beehives poses a significant threat to honeybee colonies, affecting foraging behavior, colony stability, and overall hive health. Detecting these invasive species is crucial for early intervention and hive protection. Despite extensive research conducted on the detection of invasive insects; in general [
32], research specifically focusing on the detection of invasive insects at beehive entrances remains limited. The majority of existing studies address insect recognition in broader contexts, such as agricultural settings or laboratory-controlled environments [
33,
34,
35,
36]. However, only a few studies have been conducted under real-world conditions at hive entrances, where lighting variations, occlusions, and insect flight dynamics introduce additional challenges.
In their study, Hu et al. [
30] proposed DY-RetinaNet, an improved object detection model designed to identify Chinese bees, wasps, and cockroaches at beehive nest gates under natural conditions. The authors enhanced the RetinaNet model by incorporating a bidirectional feature pyramid network (BiFPN) to improve multi-scale feature fusion and replacing the smooth L1 loss function with the complete intersection over union (CIOU) loss to enhance small-target localization. Additionally, a dynamic head framework was introduced to refine detection performance through multi-attention mechanisms. The authors also collected a dataset that contains 6000 images of Chinese bees, 2000 images of wasps, and 2000 images of cockroaches. It was expanded to 16,000 images using data augmentation techniques while maintaining a 2:1:1 ratio among the species. The DY-RetinaNet model with a ResNet-101-BiFPN backbone achieved a mean average precision (mAP) of 97.38%, marking a 6.77% improvement over the original RetinaNet.
Nasir et al. [
24] introduced a multi-modal and multi-evidence recognition framework for detecting invasive insects near beehives under unconstrained flying conditions. The framework combines infrared (IR) imagery and 3D trajectory analysis, leveraging a dataset of 456,287 IR images and 14,565 3D trajectories, collected with a depth camera at
resolution and 30 fps over 31 field expeditions. In order to enhance the accuracy of detection, an artificial white background was used during the data collection process. This approach aimed to minimize visual distractions and improve insect visibility. In addition, the authors analyzed insect movement behavior, assessing trajectory lengths and time spent near the beehive to differentiate between species. Various deep learning models such as SqueezeNet, ResNet, InceptionV3, MobileNetV2, GoogLeNet, ResNet50, Xception, EfficientNetB0 were evaluated for image classification, while machine learning models (SVM, k-NN, decision trees, and ensemble classifiers) were tested for trajectory-based classification. The recognition framework achieved a classification accuracy of 97.1% in distinguishing between
Vespa velutina,
Vespa orientalis, and
Apis mellifera.
While promising results have been achieved, detecting invasive insects at the entrance of the hive still remains complicated under natural conditions. Factors such as high-speed flight dynamics, frequent occlusions, visual similarity between species, and varying background textures can degrade detection performance [
24,
30]. Furthermore, a considerable number of datasets depend on artificial backgrounds or constrained environments to mitigate these issues, limiting the generalizability of trained models to realistic apiary scenarios.
2.3. Invasive Insect and Pollen Detection
The effective detection of pollen presence on bees offers valuable insights into colony foraging behavior and nutritional health. Concurrently, the identification of invasive insects at hive entrances is essential for safeguarding colonies against potential threats. However, jointly tackling both problems poses unique challenges such as varied object scales, class imbalance, and the necessity for multi-task learning architectures. Due to these complexities, most research in honeybee monitoring has focused on either pollen detection or invasive insect detection individually. To the best of our knowledge, only one study by Marstaller et al. [
31] has attempted to address both tasks simultaneously.
This study proposed a real-time health monitoring system for honeybee hives by combining edge computing and deep learning techniques. Their system integrates a pipeline consisting of video capture hardware, on-device inference for bee tracking and localization, cloud-based data management, and deep convolutional neural networks for multi-task learning. The core of their approach is DeepBees, a multi-task deep convolutional neural network (MultiNet) that extracts shared features through MobileNet-V2 and performs task-specific processing for genus identification, pollen detection, pose estimation, and bee classification. The genus module classifies insects into four categories: bees, wasps, bumblebees, and hornets, using global average pooling and softmax activation function for classification. The pollen module applies a Single-Shot MultiBox Detector (SSD) to detect and localize pollen on bees, thereby facilitating a spatial analysis of hive nutrition diversity. The classification module categorizes bees into four groups: worker bees with pollen, worker bees without pollen, drones, and dead bees. In contrast to the pollen module, which focuses on individual pollen objects, the classification module evaluates colony composition and health indicators at a more extensive level. The DeepBees system demonstrated high accuracy in classification tasks, achieving 82.4% accuracy for the bee classification module and 76.19% for genus identification, while pollen detection performance was more challenging, reaching only 40.14% accuracy. The study also highlighted challenges such as class imbalances, noisy annotations, and the need for dataset expansion to improve system robustness. This reflects the broader difficulties of jointly detecting invasive insects and pollen, where handling objects of vastly different scales, managing class imbalance, and optimizing for multiple tasks within a single system remain significant challenges.
2.4. Summary of Findings
Given the computational demands of multi-class insect and pollen detection, selecting an appropriate hardware platform is crucial for ensuring both efficiency and real-time performance in field applications. Most studies on insect or pollen detection at hive entrances have been implemented on workstations with dedicated GPUs [
16,
17,
19,
29,
30], leveraging their high computational power for deep learning-based detection models. Fewer studies have explored workstations with dedicated CPU configurations [
15,
24,
27] or cloud-based platforms such as Google Colab [
28], which offer accessibility but are often constrained by computational limitations or dependency on internet connectivity. Although workstations equipped with GPUs offer substantial computational capacity, their feasibility in real-time field applications can be constrained by factors such as size, power consumption, and the need for additional infrastructure. In recent years, Jetson-based platforms, such as Jetson TX2 and Jetson Nano, have been successfully deployed for insect detection and monitoring tasks [
18,
22,
33], demonstrating their ability to run deep learning models directly on edge devices without relying on external computing resources. Similarly, Raspberry Pi-based systems have been investigated for bee monitoring and varroa mite detection [
14,
37,
38,
39], emphasizing their cost-effectiveness and low energy requirements. Compared to GPU-accelerated workstations, Jetson devices provide significant advantages due to their portability, small size, reduced power consumption, and optimized inference, making them ideal for continuous and autonomous monitoring of insect activity in field environments.
Several important inferences can be drawn from the latest advancements in insect and pollen detection at hive entrances. First, CNN-based approaches, including Faster R-CNN, ResNet, VGG-16, VGG-19, GoogLeNet, YOLO, MobileNet-V2, and shallow CNN architectures, have been the most widely utilized in most studies due to their strong feature extraction and object detection capabilities. The majority of researchers have also adopted a single detection model to identify either pollen or insect classes, whereas DeepBees stands out as the only framework implementing a modular detection strategy, integrating MobileNet-V2 for feature extraction alongside an SSD-based pollen detection module. Second, a notable research gap remains in developing a unified framework for multi-class detection of both insects and pollen, as most existing studies focus on either pollen or insect detection, with few exploring both tasks simultaneously. Third, while workstations with integrated GPUs remain dominant in deep learning applications, a growing shift toward embedded AI solutions has emerged. Jetson and Raspberry Pi-based implementations offer significant advantages in terms of portability, energy efficiency, and real-time field deployment, making them increasingly viable alternatives for autonomous hive monitoring systems.
Despite notable progress, detecting pollen and invasive insects at hive entrances under real-world conditions still remains difficult. Challenges such as variations in illumination, frequent occlusions, background complexity, small object sizes, high-speed insect movements, and class imbalance significantly affect detection robustness. Although some studies have used dataset augmentation or controlled setups to mitigate these factors, fully generalizable solutions suitable for natural environments are still limited.
This study addresses several of these challenges by developing a detection system based on a diverse, naturally collected dataset acquired under varying environmental conditions without artificial constraints. It focuses on improving small object detectability, enabling simultaneous multi-class detection, ensuring robust performance under complex backgrounds, and achieving efficient deployment on embedded platforms for continuous, autonomous monitoring in realistic field scenarios.
3. Materials and Methods
The colony’s strength in influencing hive entrance activity and, consequently, object detection performance, while the primary aim of this study was to evaluate detection models under varying visual and environmental conditions, we recognize that the number of foraging bees correlates with overall colony health and size. Although detailed biological assessments of colony strength and health (e.g., number of brood frames, presence of queen, and disease status) were not within the scope of this computer vision-focused study, we observed and recorded hive activity during data collection. The average number of worker bees visible at the hive entrance per frame ranged from 0 to 20. This variability reflects typical daily fluctuations and differences across colonies. Despite this variation, our models demonstrated stable performance across activity levels, suggesting generalizability. However, future work could benefit from integrating explicit colony strength metrics to analyze correlations between hive vitality and detection reliability more precisely.
3.1. Dataset
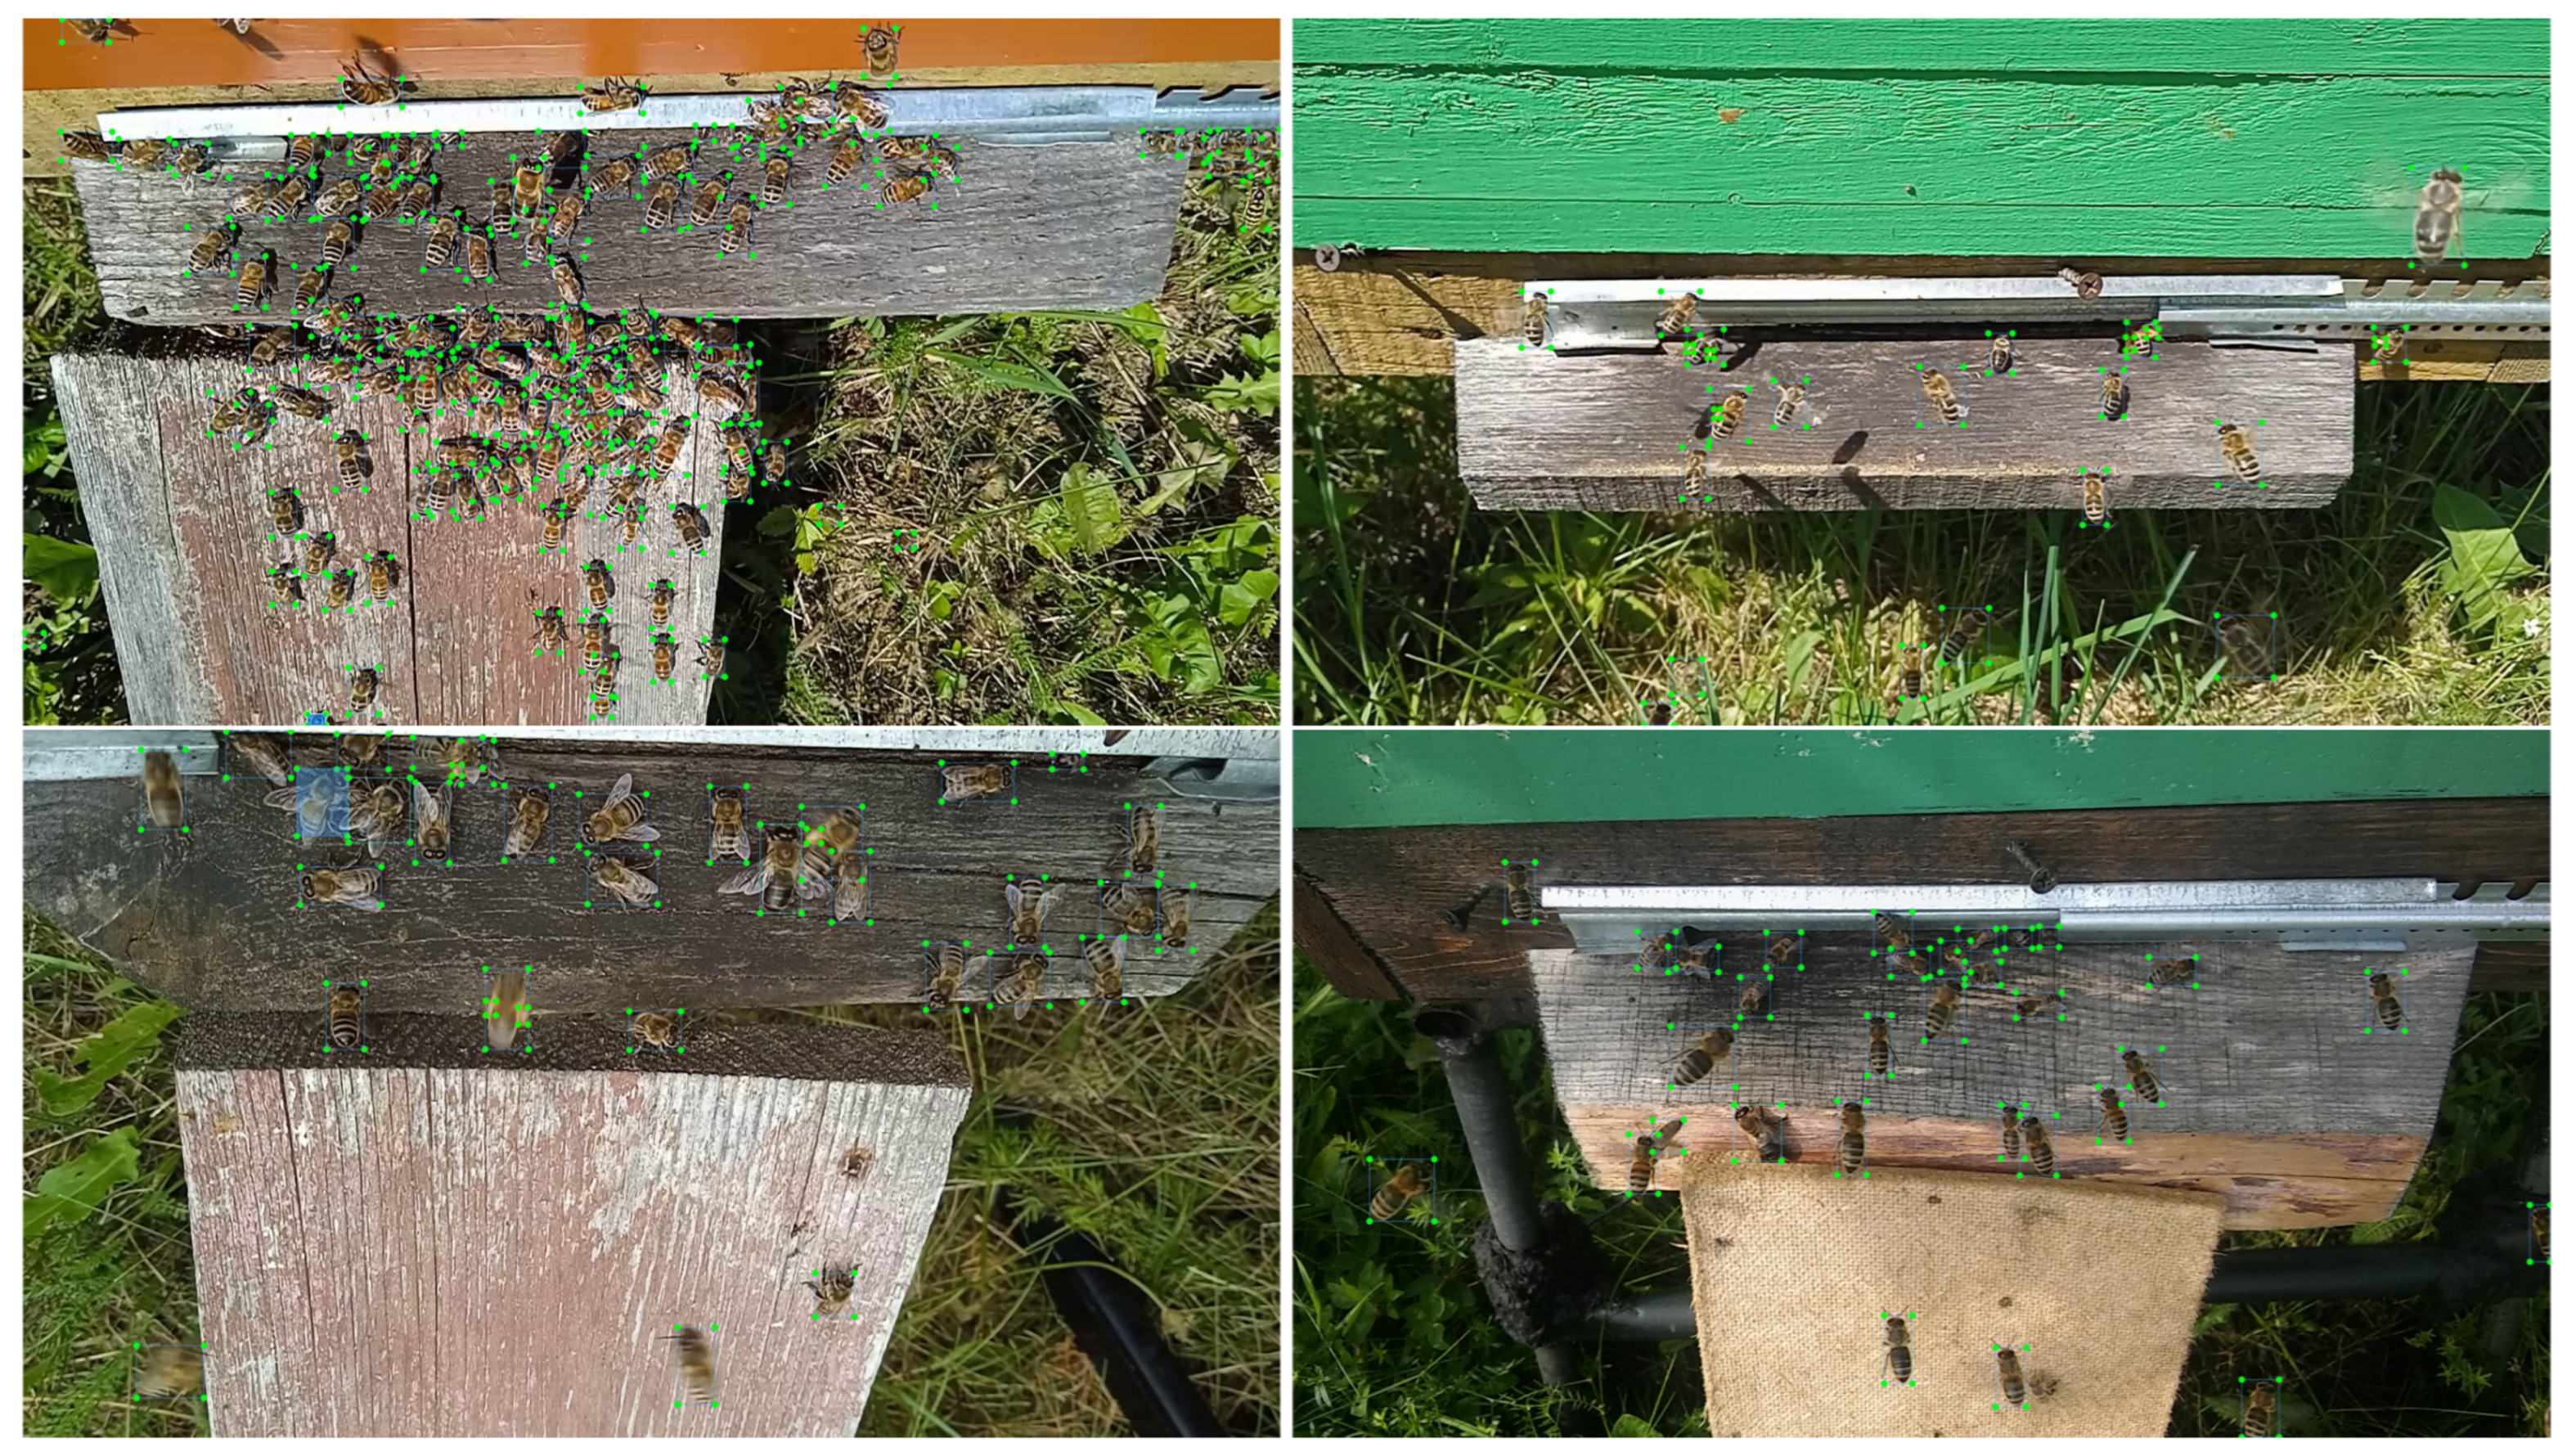
A dataset was created from videos of hive landing boards recorded at a local apiary in the Vilnius district during the 2018–2023 beekeeping seasons. A stationary camera, mounted 30 cm above beehive landing boards, captured footage at a resolution of
pixels. Videos were recorded on both sunny and cloudy days, with each hive represented by 2 to 40 min of MP4 footage. Frames were then extracted from this raw footage for annotation. The dataset consists of high-resolution images collected from 15 different beehives (corresponding to 15 colonies), capturing diverse environmental conditions and insect activity (
Figure 1). It is carefully annotated for the detection of four key classes: worker bees, pollen grains, drones, and wasps. The
LabelImg tool (
https://github.com/tzutalin/labelImg) was used to annotate objects for the detection task. The dataset consists of 11,008 frames, with 116,853 instances of worker bees, 14,062 instances of pollen grains, 1320 instances of drones, and 1405 instances of wasps (
Figure 2). These datasets are publicly available for download [
26] and serves as a valuable resource for developing and evaluating insect detection models at hive entrances.
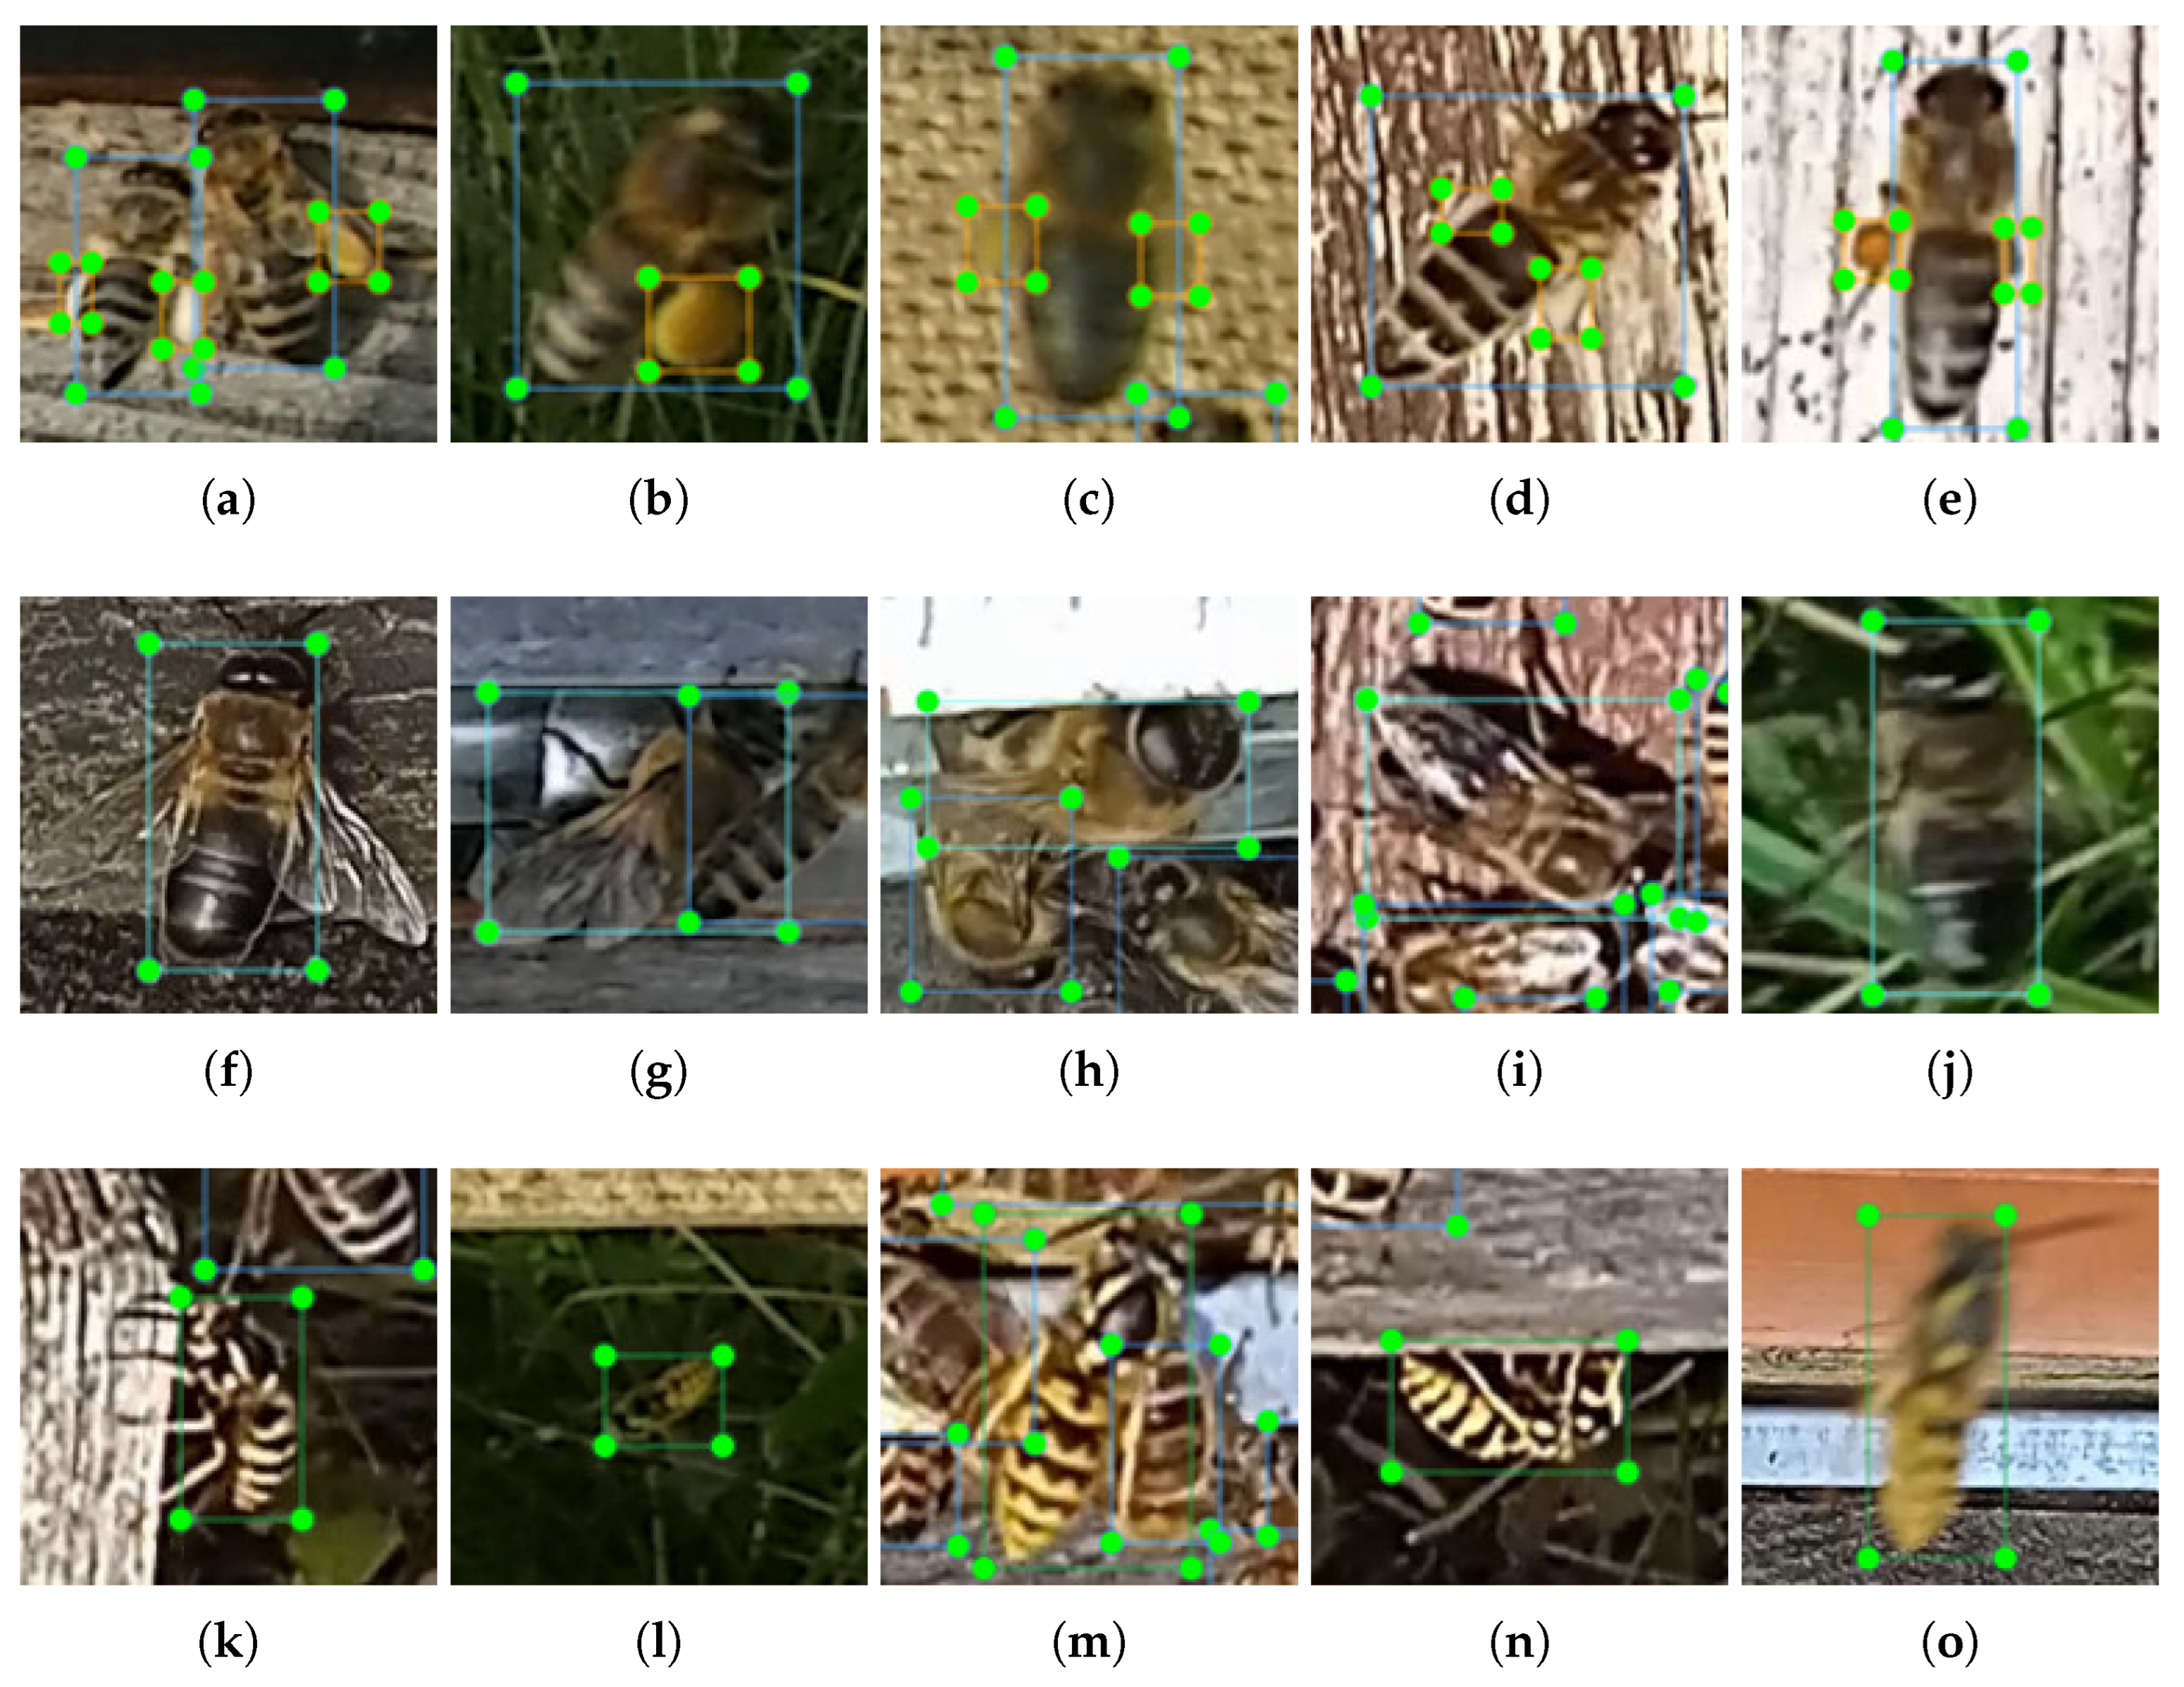
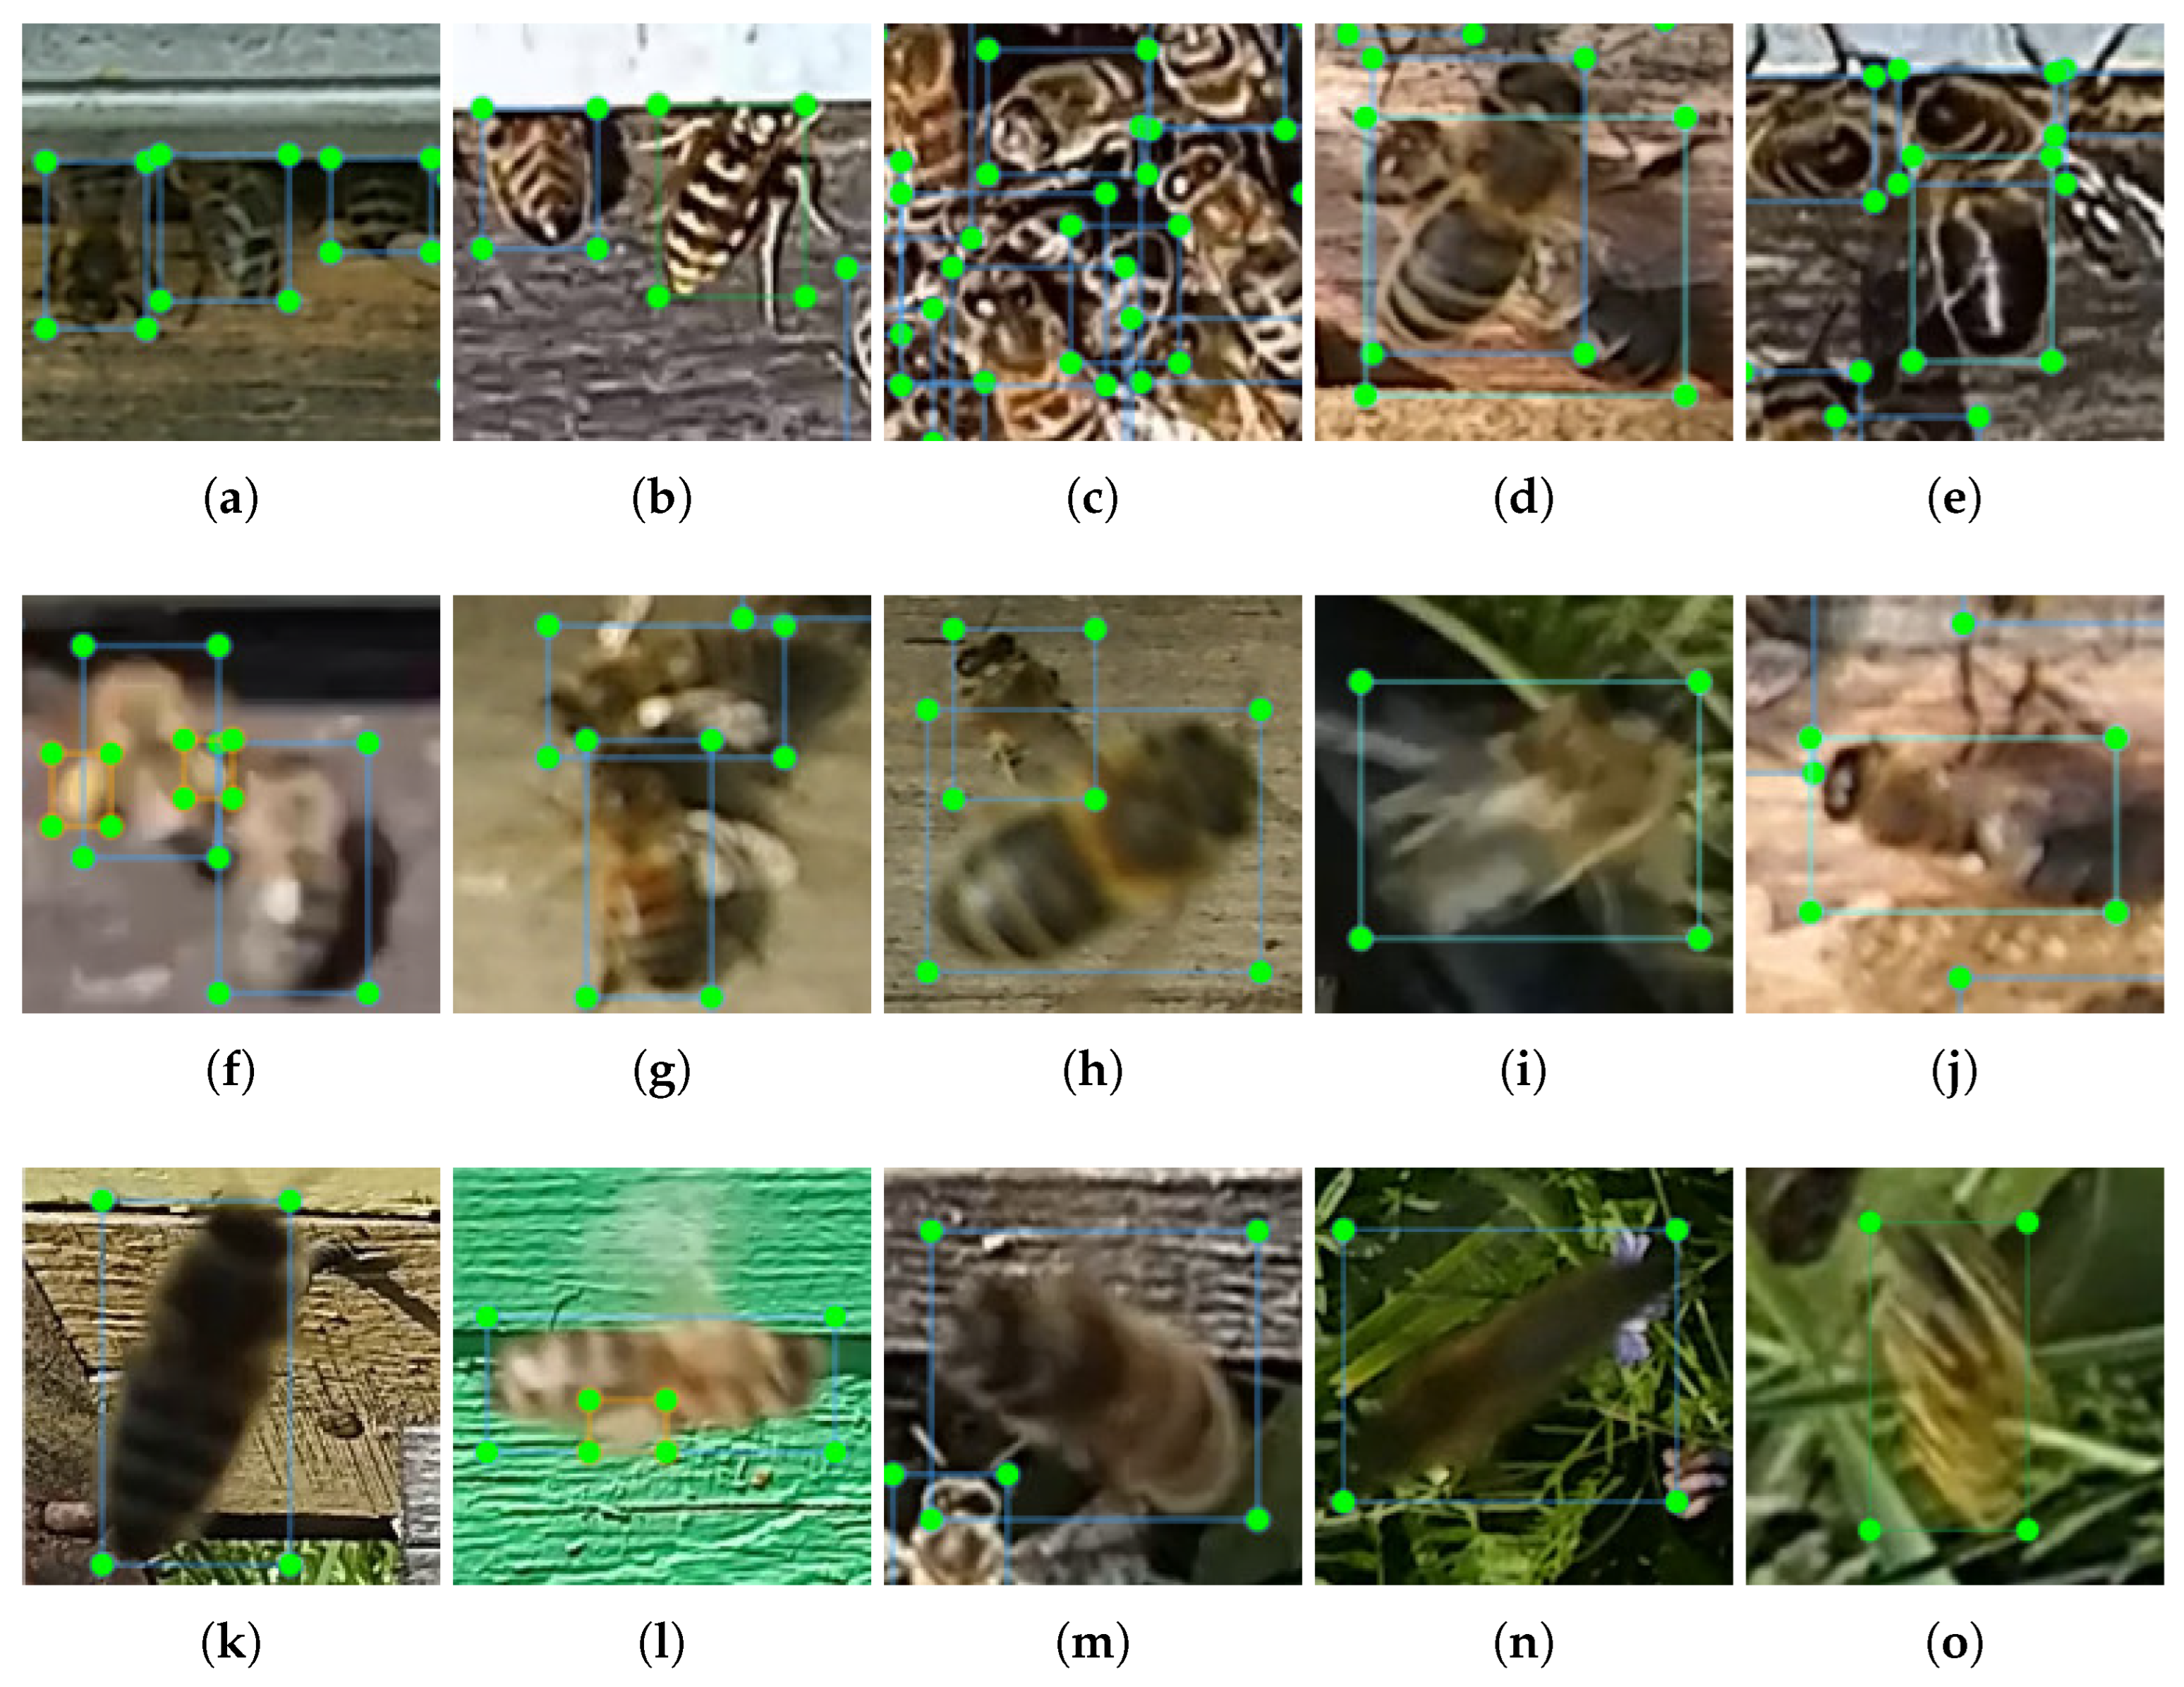
The dataset captures a wide variety of real-world conditions to ensure the robustness and generalizability of the detection models. The images feature blurred and overlapped objects, representing natural movement and occlusions (
Figure 3). They also depict different object scales, capturing insects at varying distances and perspectives. Additionally, diverse backgrounds, including ramp surfaces, grass, and hive walls, contribute to a realistic and challenging detection environment. Furthermore, the dataset includes varied lighting conditions, ranging from sunny to overcast scenarios, which improves the adaptability of models to changing illumination.
To address specific detection challenges, we provide two distinct label sets. The first set merges pollen with bees, introducing a modified class structure: worker bee, pollen-bee, drone, and wasp. The second set annotates pollen grains as separate small objects, maintaining four classes: worker bee, pollen, drone, and wasp. The choice between these variants depends on the application. The pollen-bee class improves detection accuracy for pollen grains compared to treating them as separate small objects. However, for tracking applications, assigning all worker bees to one class while keeping pollen separate is more beneficial. Preliminary investigations indicate that tracking algorithms frequently lose track of worker bees classified as pollen-bees, particularly when pollen grains are faintly visible. Assigning pollen as a distinct class enhances tracking stability and ensures accurate long-term monitoring of worker bee activity at hive entrances.
The distribution of the four classes (worker bee, pollen, drone, and wasp) at the hive entrance exhibits a significant predominance of the “worker bee” class, with nearly 120,000 detected instances, followed by the “pollen” class with a substantially lower count (
Figure 4a). The “drone” and “wasp” classes are minimally represented, indicating their rare occurrence in the dataset. The spatial distribution of detected objects within the frames shows a concentrated cluster in the upper-middle region (
Figure 4b), corresponding to the hive entrances, where worker bees and pollen carriers are primarily located. The size distribution of bounding boxes, analyzed through width and height parameters, reveals a primary density at small dimensions, with most detections occurring within a narrow range. The clustering of worker bee and pollen instances in the lower width-height spectrum, as marked in the density plot (
Figure 4c), suggests a consistent object size for these classes, while outliers represent variations in detection scales.
To address the significant class imbalance, where common classes like worker bees vastly outnumber rarer ones such as pollen, drones, and wasps, we employed several strategies during model training. First, we experimented with two labeling schemes: one merging pollen with worker bees into a combined class, and another treating pollen as a separate object. The latter, while more challenging, offered clearer supervision for the model in distinguishing small pollen grains. We used weighted loss functions that assigned higher penalties to underrepresented classes, particularly pollen and drone instances, to mitigate bias during gradient updates. Additionally, we optimized the model architecture specifically for small object detection by removing deep neck layers designed for large-scale objects and increasing feature map resolution early in the backbone. These changes preserved finer details essential for identifying pollen grains. We also reduced kernel sizes and pruned the network to balance inference time with improved sensitivity. As shown in our results, these modifications led to notable gains in pollen detection accuracy, especially in the ablated YOLOv8 models.
3.2. Network Architecture Ablation
In this work, we investigate the time per inference and precision of the RTDETR—real-time detection transformer, YOLO12, YOLO11, YOLOv8-World-v2, YOLOv8, and also modifications of YOLOv8. First, the default pretrained models were fine tuned on our dataset. Next, we applied ablation to YOLOv8 models to enhance the detection of small objects, with a particular focus on improving pollen grain detection.
Figure 5 presents the structure of YOLOv8 and the applied modifications. To adapt the YOLOv8 model for detecting worker bees, pollen, drones, and wasps at the hive entrance, we introduced several structural modifications aimed at improving detection accuracy while maintaining efficiency. Since all target objects were small, we removed the last three layers in the neck and the final detection layer in the head responsible for large object detection. In the backbone, we eliminated the first convolutional layer to increase the resolution of feature maps passed to subsequent layers, which helps in preserving fine-grained details crucial for small object detection. Additionally, the number of kernels in each convolutional layer within the backbone was reduced by a factor of four to optimize computational efficiency. Furthermore, all four C2f layers in the backbone were removed to simplify the model architecture. Each modification was systematically evaluated by training and analyzing the model using precision vs. latency curves, ensuring an optimal balance between detection performance and computational cost. The modifications introduced to the YOLOv8 are marked in
Figure 5 as follows:
Mod-1 is the number of kernels in the backbone being reduced by a factor of four, and the first convolutional layer was eliminated (pink).
Mod-2 includes mod-1, with the removal of all four C2f layers in the backbone (orange).
Mod-3 includes mod-1, with the removal of the last three layers in the neck and the final detection layer (green).
Figure 5.
The architecture and modifications of the YOLOv8 model for worker bee, pollen, drone, and wasp detection at the hive entrance. The arrows indicate the flow direction of feature maps within the YOLO architecture.
Figure 5.
The architecture and modifications of the YOLOv8 model for worker bee, pollen, drone, and wasp detection at the hive entrance. The arrows indicate the flow direction of feature maps within the YOLO architecture.
3.3. Evaluation Metrics
The models were trained on the proposed dataset for four-class object detection and evaluated using mean average precision (mAP) metrics. The mAP measures how well the model detects objects and is based on the Intersection over Union (IoU) score between the predicted bounding boxes and the ground truth boxes. For , a detection is considered correct if the IoU between the predicted and ground truth box is at least 0.5, meaning that the boxes overlap by 50% or more.
The average precision (AP) at IoU = 0.5 is computed as the area under the Precision-Recall (P-R) curve:
where
is the precision as a function of recall. The
is obtained by averaging the
across all object classes:
where
is the number of object classes, and
is the AP for class
i at IoU = 0.5.
The precision metric evaluates the model’s ability to correctly identify only the relevant objects. It represents the proportion of correctly predicted positive instances and is defined as follows:
where
denotes true positives, and
represents false positives.
Recall measures the model’s ability to detect all relevant instances of ground truth bounding boxes. It quantifies the percentage of true positives among all actual ground truth instances and is given as follows:
where
represents false negatives. A detection is considered a true positive if the IoU exceeds 0.5.
4. Results
The experiments were performed on GeForce RTX 4080 Super GPU with 16 GB of VRAM. The packages and libraries of Ultralytics-8.3.80, Python-3.12.9, torch-2.5.1, and CUDA 12.6 were used to train detection models. TensorRT 8.6.2 was used to convert the PyTorch model to a TensorRT-optimized engine for deployment on the Jetson AGX Orin. All the investigated models were trained on the input resolution
px. The dataset was split into 80% for training and 20% for validation/testing. All models were trained and tested on the same dataset split. For augmentation, image translation was set to ±0.1 of the image width, scaling was set to a gain of ±0.5, and the left-right image flip probability was set to 0.5. The mosaic augmentation was disabled for the final 10 epochs. The AdamW [
40] optimizer, with a momentum of 0.9 and a learning rate of 0.001, was used for weight decay regularization. The maximal number of epoch was set to 1000 with enabled checkpoints save period equal to 10 epochs. The patience was set to 100, meaning that if there is no improvement for 100 consecutive epochs, training will stop early to prevent unnecessary computation and overfitting. The batch size was set experimentally in the range of 2–12, depending on model complexity, aiming to maximize the utilization of available VRAM and accelerate the reduction of total loss. During the experimentation, the models reached minimal loss on the investigated dataset within 300 to 500 epochs. The total loss function used for detection model training is as follows:
where lambdas (
) are loss gains that balance the contribution of each loss component to the total loss: the box loss gain–
, classification loss gain–
, and distribution focal loss gain–
.
4.1. Investigation of Precision vs. Inference Time
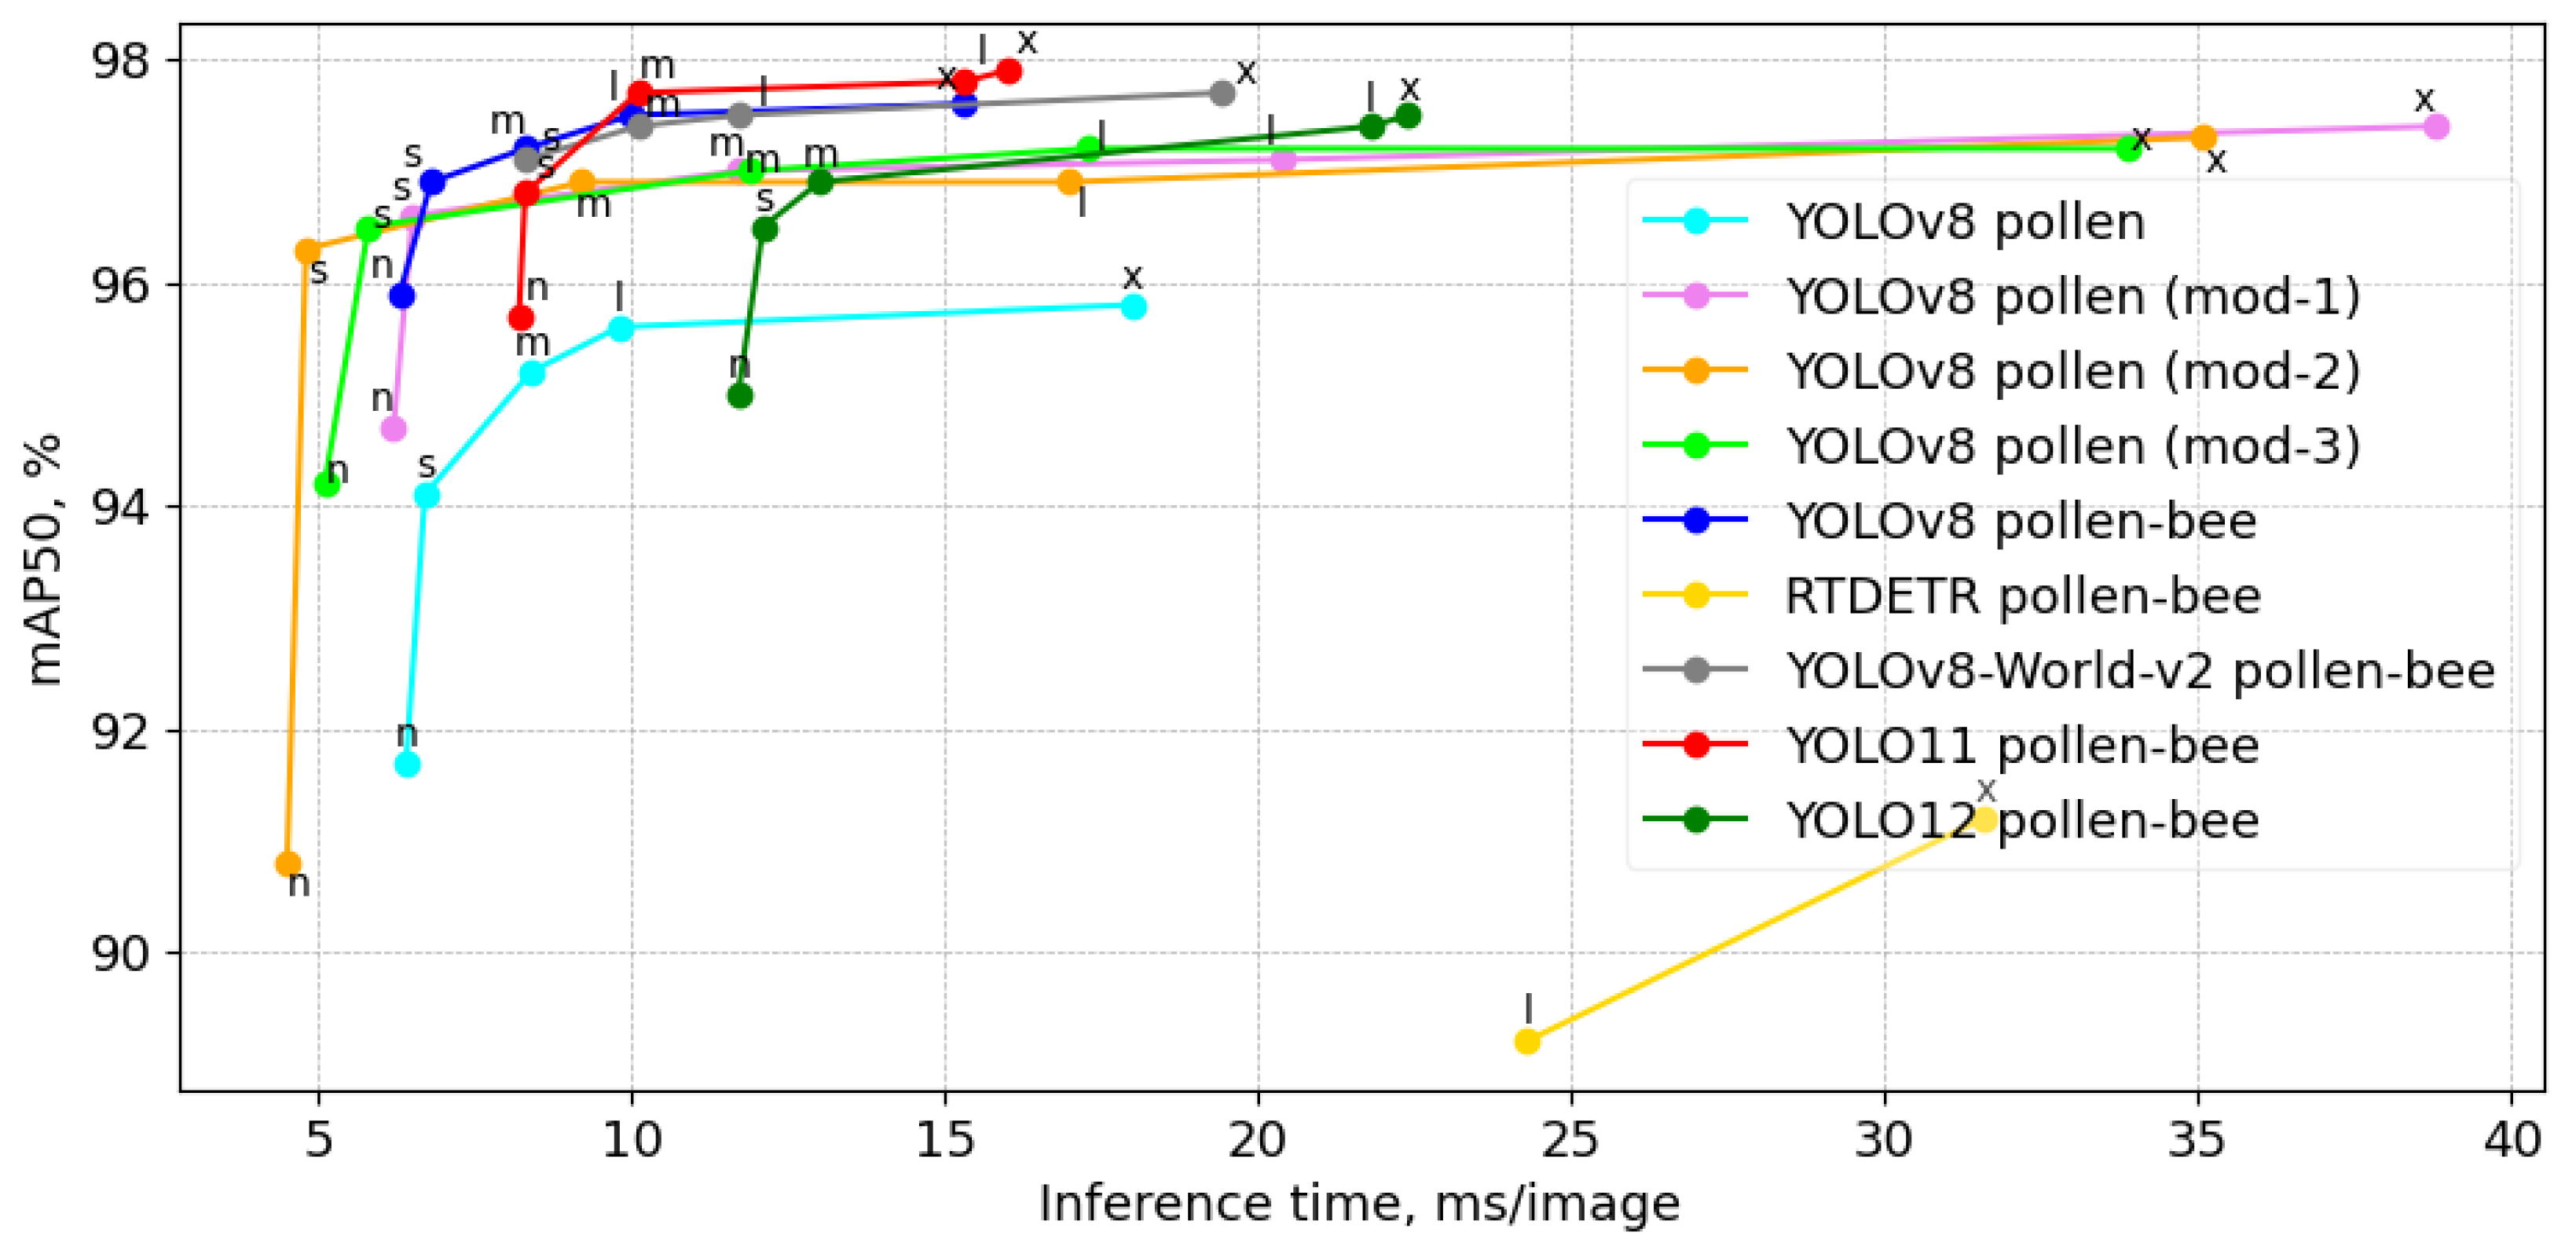
The precision vs. inference time analysis on the RTX4080 GPU, as presented in
Figure 6, evaluates the trade-off between detection accuracy and computational efficiency across different YOLO-based models for recognizing four object classes: worker bee, pollen-bee, drone, and wasp. The inclusion of pollen as a separate class further refines the detection task, distinguishing between worker bee, pollen, drone, and wasp. The figure demonstrates that the pink (mod-1), orange (mod-2), and green (mod-3) curves correspond to our modified YOLOv8 models, which were optimized through network architecture ablation. These modifications yield competitive performance, with improvements in mAP50 while maintaining efficient inference times. In reference to the YOLOv8 models (cyan), the ablations enhance mAP50 in all three proposed modifications, except for the nano-size mod-2. However, the inference time is improved only for the nano and small models. The mAP50 of the modified YOLOv8 small models was increased by at least 2% while simultaneously reducing the inference time. Notably, the YOLOv8 pollen-bee models (blue and gray) maintain a strong balance between precision and speed, while RTDETR (yellow) exhibits significantly slower inference and lowest precision. The red curve, representing YOLO11, achieves the highest precision on medium, large, and extra-large models. However, all YOLOv8 models outperform the corresponding YOLO11 models in inference time, particularly the nano, small, and medium-sized models, with an improvement of up to 1.5–2 ms/image. While YOLO12 demonstrates competitive precision, its slower inference time compared to YOLOv8 and YOLO11 suggests a potential trade-off between accuracy and speed. This performance gap raises questions about the model’s efficiency for real-time applications where faster processing is crucial.
Table 2 presents the performance of the fine-tuned detection models on an RTX 4080, based on the validation set with a confidence threshold of 0.5. Precision and speed results are provided for four extra-large models, where the highest precision was achieved with the first set of labels (worker bee, pollen-bee, drone, wasp). Additionally, results for YOLOv8 small models, both with and without ablation, are shown, demonstrating a significant increase in both precision and speed when using the second set of labels (worker bee, pollen, drone, and wasp). The results show that among the extra-large models, YOLO11-x, YOLOv8-x, and YOLO-World-v2-x achieve the highest mAP50 of 97.6–97.9%, with YOLO11-x and YOLOv8-x having near-identical precision. However, YOLO-World-v2-x maintains competitive accuracy while significantly increasing inference time to 19.4 ms, making it less efficient than the YOLO extra-large models. RTDETR-x, despite having the lowest mAP50 (91.2%), shows the slowest inference time at 31.6 ms, indicating a suboptimal balance between speed and precision. YOLO12x achieves a mAP50 score of 97.5% with 59.1 million parameters, but its inference time of 22.4 ms is notably slower compared to YOLOv8-x and YOLO11-x, which reach similar precision levels with faster processing speeds. This suggests that while YOLO12x offers high accuracy, its computational efficiency may be a limiting factor for real-time applications.
For smaller models, YOLOv8 s achieves a strong mAP50 of 96.9% with an inference time of 6.8 ms. Furthermore, modifications of YOLOv8 s after network architecture ablation (mod-1, mod-2, and mod-3) show a substantial reduction in model size and inference time, with mod-2 achieving the fastest inference at 4.8 ms. Notably, the modified versions demonstrate improvements in pollen detection accuracy, with mod-2 and mod-3 achieving higher precision on the pollen class (72% and 71%, respectively) compared to the original YOLOv8 s (59%). However, mod-1 slightly reduces pollen detection accuracy but maintains strong overall performance. The findings suggest that for real-time applications, mod-3 is the most efficient choice, offering the fastest inference with minimal compromise in precision.
The confusion matrices in
Figure 7 illustrate the performance of YOLOv8 s models under different annotation approaches for detecting worker bees, pollen-carrying bees (or pollen), drones, and wasps. In matrix (a), where pollen-carrying bees are merged into a single pollen-bee class, the model achieves high accuracy for worker bees (96%) and drones (93%), but shows notable confusion between worker bees and pollen-bees, with 15% of pollen-bees misclassified as worker bees. This highlights the challenge of distinguishing pollen-bearing bees from regular worker bees due to their morphological similarity. This merging simplifies annotation but sacrifices granularity, as it conflates two distinct classes, leading to reduced specificity in identifying pollen-bearing bees. The wasp detection is robust with minimal confusion (96%). Matrix (b) separates pollen from worker bees as distinct classes, revealing greater confusion in pollen detection. Only 59% of pollen instances are correctly classified, with significant misclassification as background (41%). Drones and wasps maintain high accuracy (93% and 97%, respectively). Matrix (c) represents a modified YOLOv8 s approach (mod-3) that improves pollen detection accuracy to 71%, reducing misclassification as background to 29%. This adjustment enhances the model’s ability to distinguish between these classes. However, drone accuracy decreases slightly to 90%, suggesting a trade-off in performance across classes. Wasp detection remains consistent at 97%, while this trade-off enhances pollen detection, these findings align with the study’s premise that treating pollen as an independent category benefits long-term tracking applications, as merging it with worker bees increases classification accuracy but may lead to tracking inconsistencies when pollen visibility is low.
The last row in the confusion matrices of
Figure 7 represents the distribution of false positives across all classes. Since the rows are normalized, each row sums up to 1, regardless of the actual number of false positives or true positives for that particular class. The background row specifically indicates the fraction of false positives attributed to each class when the model incorrectly detects an object in areas where no object exists or generates multiple predictions for the same object.
4.2. Deployment on Jetson AGX Orin Platform
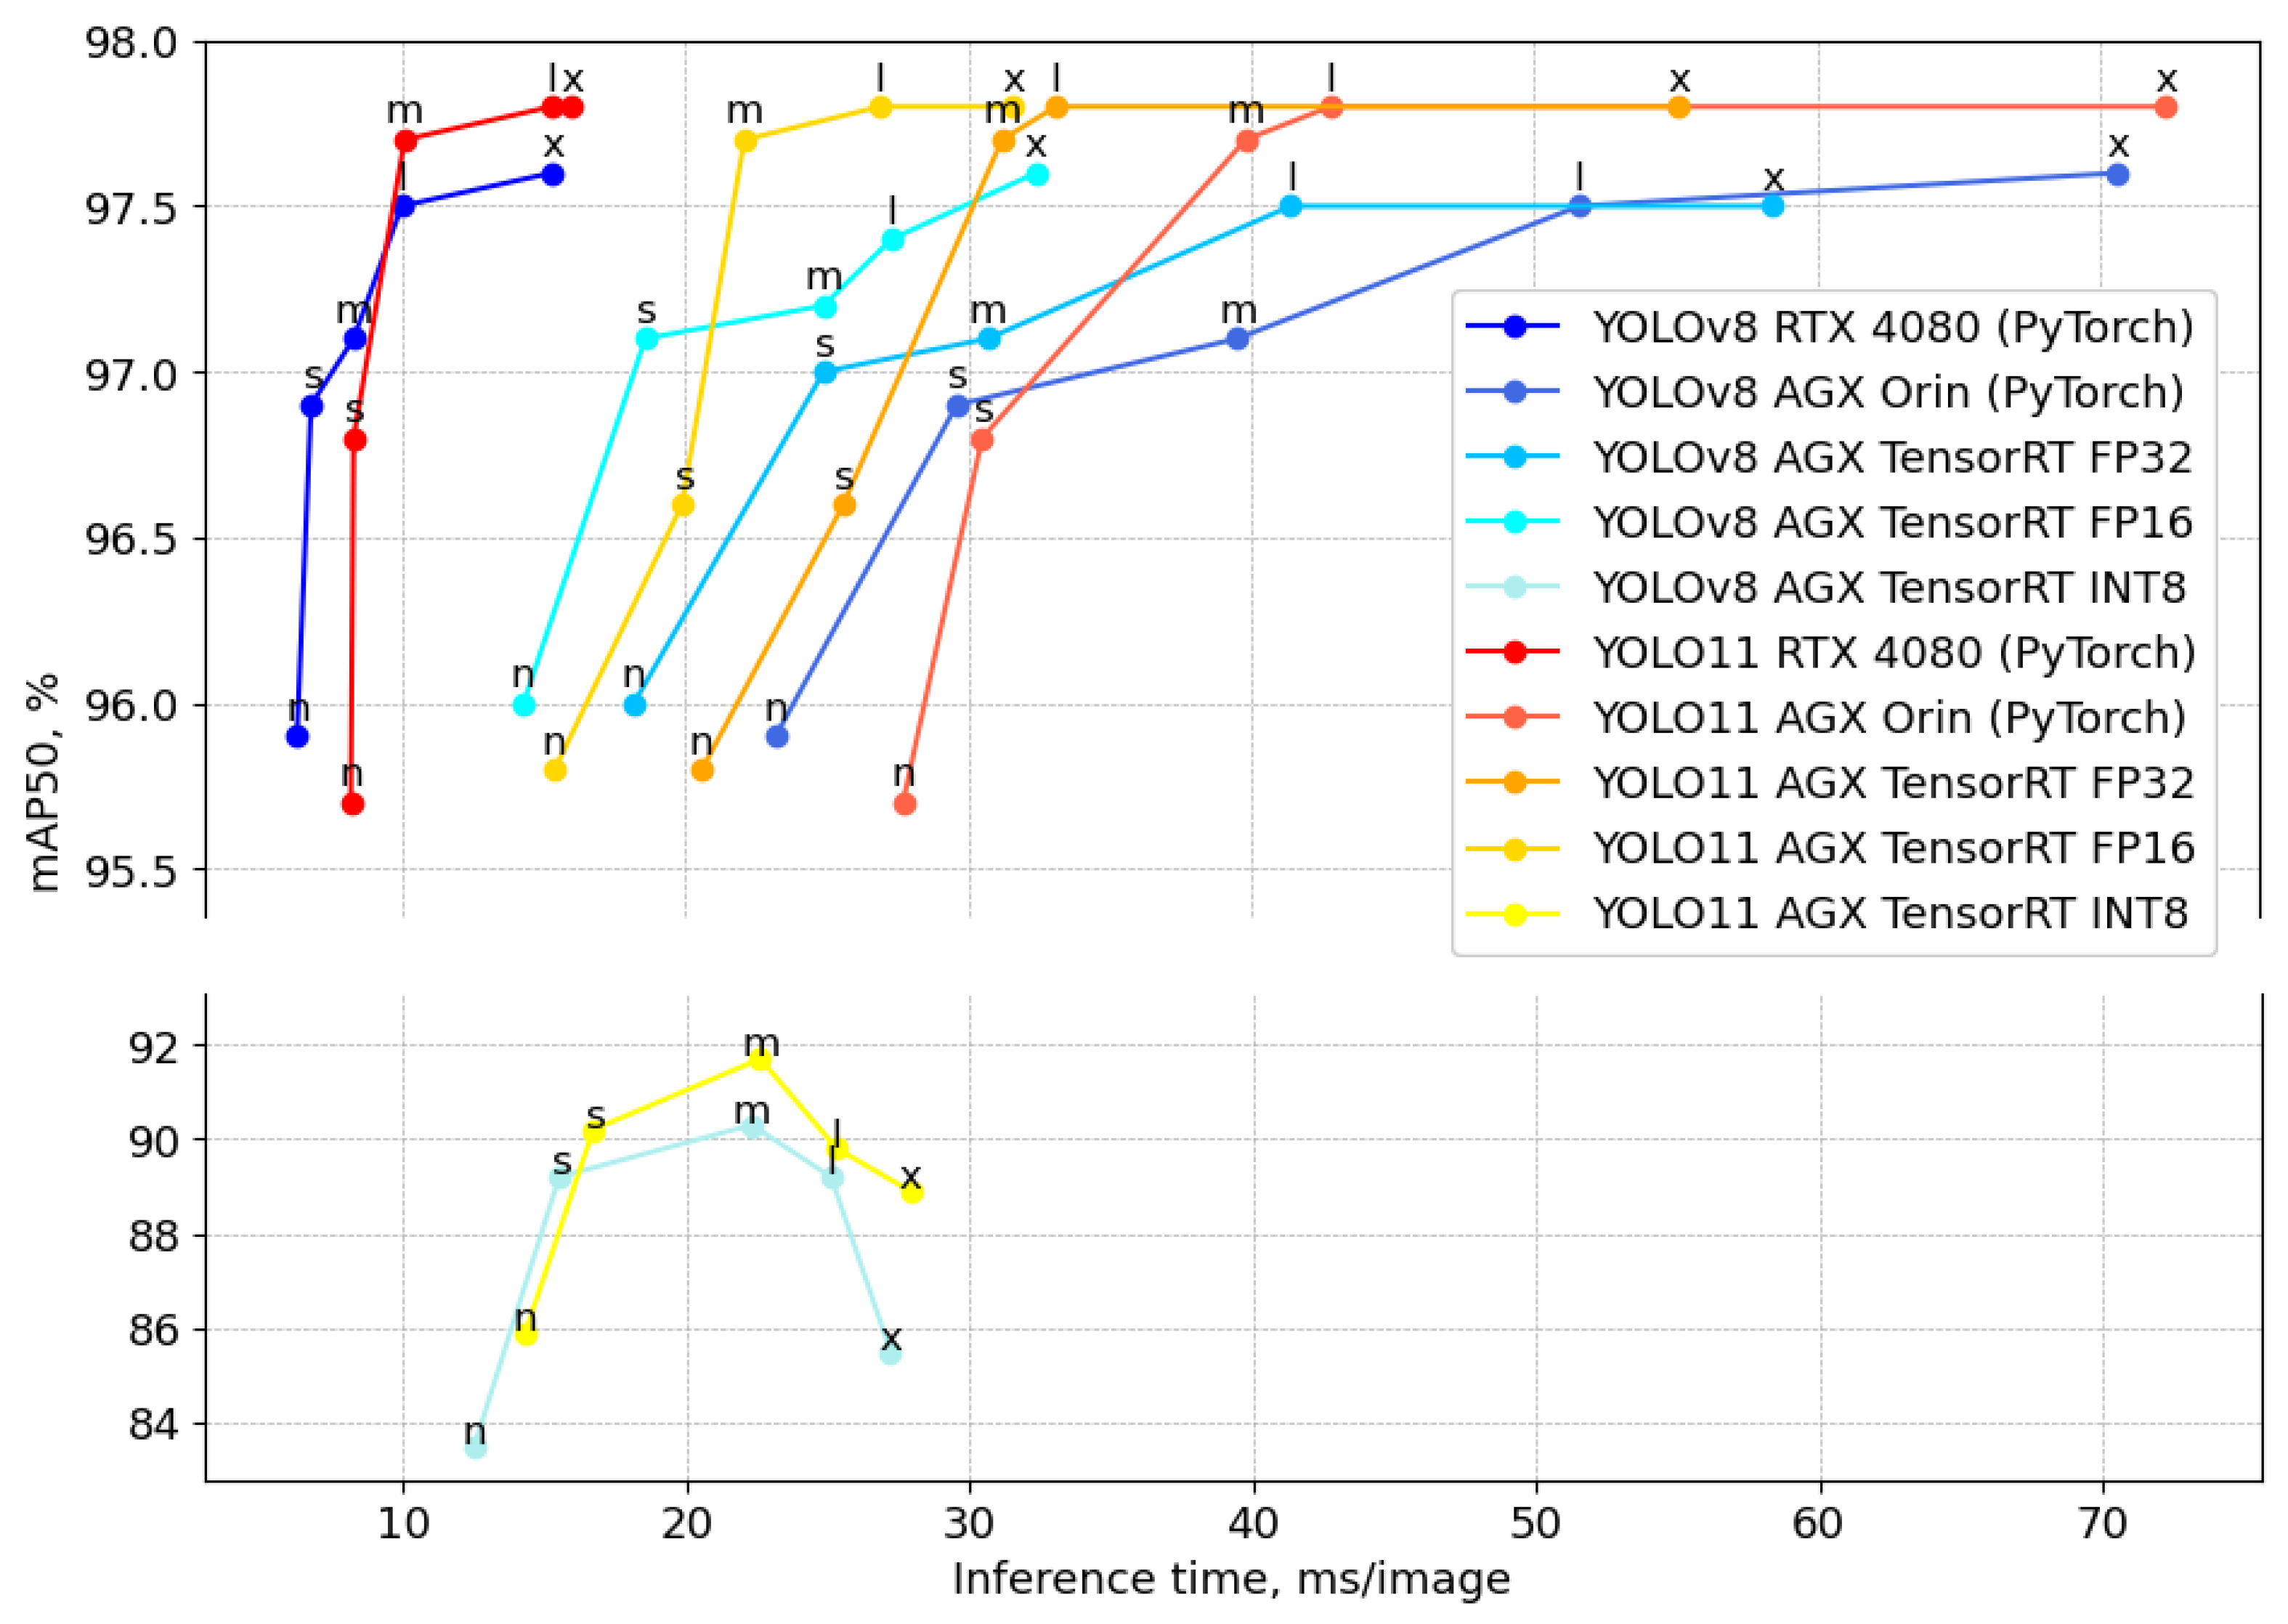
Figure 8 presents a comparative analysis of the YOLOv8 and YOLO11 detection models in terms of mAP50 versus inference latency across different hardware configurations. The RTX 4080 GPU, represented by red (YOLO11) and blue (YOLOv8) curves, demonstrates superior performance in terms of accuracy and efficiency, achieving the highest mAP50 values with significantly lower inference times compared to the Jetson AGX Orin implementations. The AGX Orin models exhibit a trade-off between precision and latency, where lower precision format (FP32 and FP16) improves the inference speed but slightly reduces the accuracy in the case of YOLO11s. The YOLO11 model generally outperforms YOLOv8 in mAP50 across medium, large, and extra-large configurations (m, l, x); however, YOLOv8 demonstrates better precision and inference time, particularly in the smaller models (n, s). The INT8 quantization significantly improves the inference speed, particularly for large (l) and extra-large (x) models, but this comes at the cost of a 6–12% drop in precision compared to higher-precision formats such as FP16 and FP32.
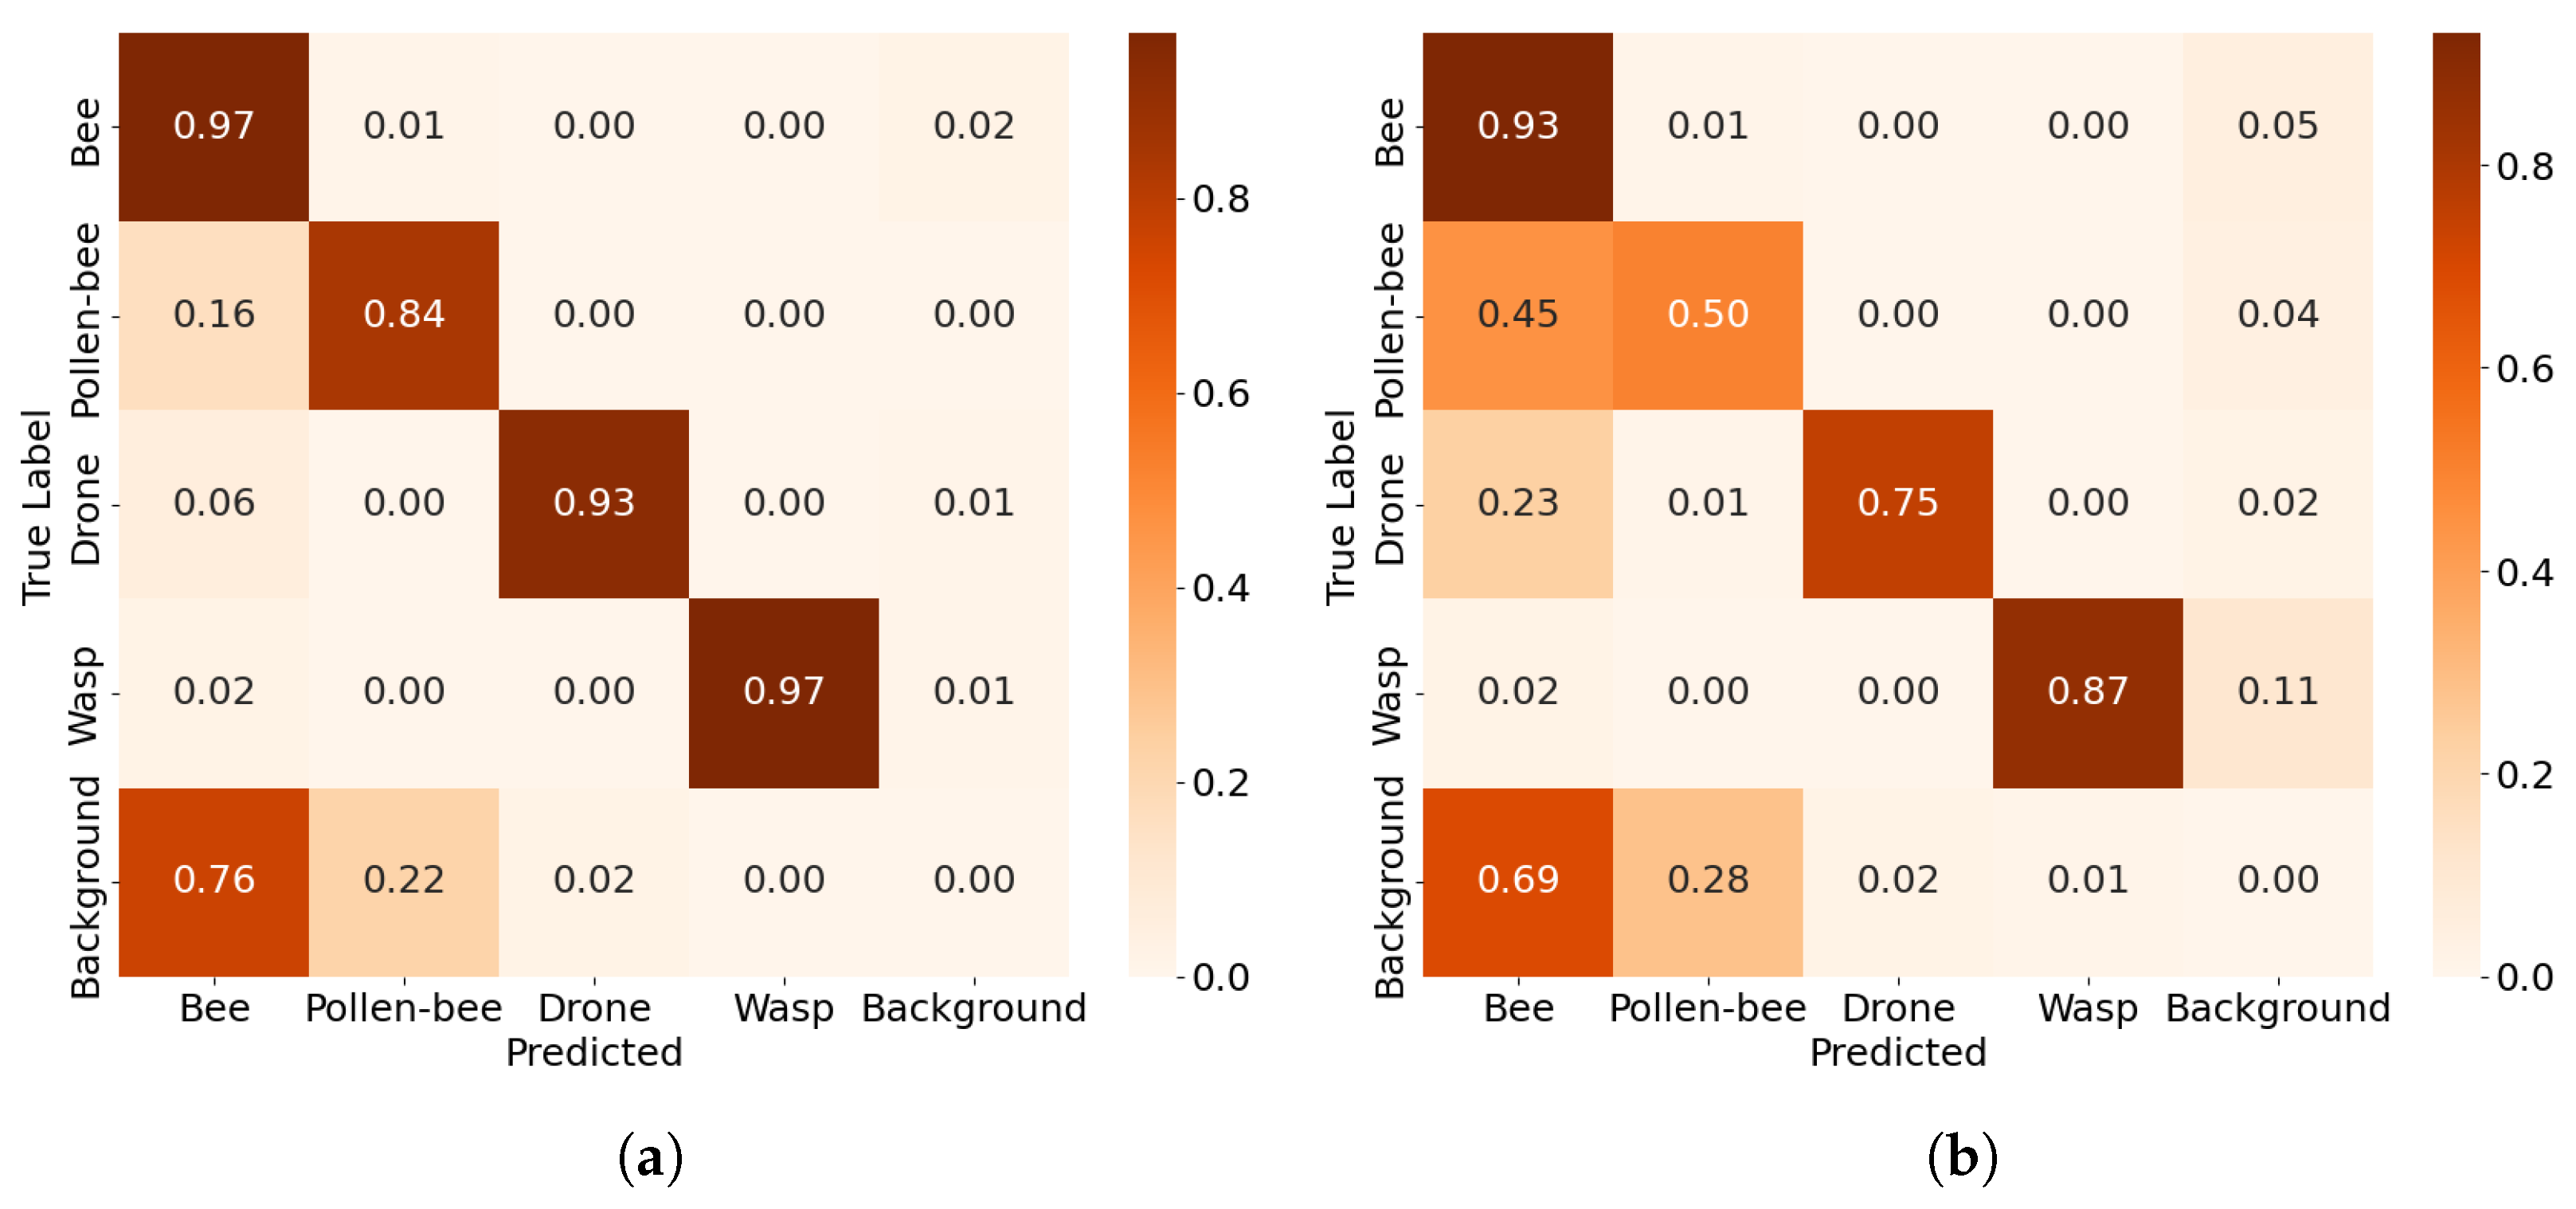
The confusion matrices in
Figure 9 illustrate the impact of quantization on detection accuracy. Compared to the confusion matrix in
Figure 7a, where the mAP50 is 96.9% using the PyTorch implementation,
Figure 9a presents the class confusion for the same model converted to TensorRT FP16, achieving a mAP50 of 97.1%, with a 0.2% performance gain from conversion to the TensorRT engine format. The quantization to 16-bit floating-point has a minimal effect on the distribution of true positives (TP). The TP rates for pollen-bees and drones remain unchanged, while those for worker bees and wasps increase by 1%.
In contrast, TensorRT INT8 quantization (
Figure 9b) has a more pronounced impact on detection accuracy. The TP rate decreases by 4% for worker bees, 10% for wasps, 18% for drones, and 34% for pollen-bees. A notable shift in misclassifications is observed, as worker bees and wasps are increasingly misclassified as background, while pollen-bees and drones are frequently misclassified as worker bees. This effect suggests that smaller features intrinsic to pollen-bees and drones are more susceptible to quantization errors compared to larger objects. The loss of fine-grained details in INT8 precision reduces the model’s ability to distinguish between worker bees, pollen-bees, and drones, leading to a higher rate of incorrect classifications.
Table 3 presents the maximum frames per second (FPS) achieved by YOLOv8 and YOLO11 models across different implementations and precision formats on the Jetson AGX Orin platform. The FPS values are computed based on the time taken by the model to process a single image.
Table 3 also takes into account the time for data preprocessing and postprocessing, which are not included in
Figure 8 but significantly impact overall performance. For PyTorch implementations, preprocessing and postprocessing add approximately 13 ms to the computation time, while FP32, FP16, and INT8 formats require 16 ms for these operations. The table highlights that YOLOv8 consistently outperforms YOLO11 in terms of FPS across nano and small model sizes (n, s). For instance, under FP32 precision, YOLO11 achieves up to 27 FPS for the small model size (s), compared to YOLOv8’s maximum of 29 FPS. However, YOLO11 maintains equal or higher FPS for larger model sizes (m, l and x), indicating its suitability for faster real-time applications. For instance, under FP32 precision, YOLO11 achieves up to 20 FPS for the large model size (l), compared to YOLOv8’s maximum of 17 FPS. The INT8 format generally provides the highest FPS due to reduced computational complexity, followed by the FP16 and FP32 formats.
4.3. Visualizations
The detection results presented in
Figure 10 demonstrate the ability of the trained YOLO models (YOLOv8-x and YOLO11-x) to accurately identify and classify four key insect types at the hive entrance: worker bees, pollen, drones, and wasps. The detected objects are highlighted with distinct bounding boxes: worker bees in blue, pollen in cyan, drones in white, and wasps in aquamarine, enabling a clear visual differentiation of these categories.
Figure 10a–d illustrate successful detections of worker bees and pollen-bearing bees under varying environmental conditions. The models effectively recognize pollen-carrying bees by detecting the presence of pollen sacs on their hind legs. However, the small size of pollen, as shown in
Figure 10c, poses a detection challenge, particularly in cases where lighting conditions or occlusions obscure the pollen sacs, while YOLOv8-x and YOLO11-x perform well in distinguishing pollen from the background, slight misclassifications occur when pollen visibility is low or when it closely blends with the worker bee is body. The improved detection of pollen in these frames confirms that treating pollen as a separate class, rather than merging it with worker bees, allows for more precise identification and tracking of worker bees.
Figure 10e–i focuses on wasp detection, an essential task for monitoring hive security. The detected wasps, marked in aquamarine, exhibit clear distinctions from honeybees in terms of body shape and size.
Figure 10e,g captures a wasp in flight on the grass near the hive entrance, indicating the effectiveness of the models in detecting moving objects. The detection results also highlight the importance of robust classification in preventing false positives, ensuring that wasps are not misclassified as worker bees, which is crucial for beekeepers aiming to assess potential threats.
Figure 10i–l depict drone detections, where the models successfully identify drones distinct from worker bees. Drones, marked in white, are typically larger than worker bees, which aids in their classification.
Figure 10k highlights an instance where a drone is detected alongside multiple worker bees, demonstrating the model’s capacity to differentiate between similar insect classes. However,
Figure 10j reveals a case where the bounding box slightly overlaps with an adjacent worker bee, illustrating the challenge of detecting drones in high-density scenarios. The accurate identification of drones is crucial for tracking colony reproductive health, as their presence or absence provides insights into hive dynamics.
5. Discussion
The effectiveness of object tracking relies heavily on the stability and accuracy of detections across frames. The confusion matrices in
Figure 7 reveal key differences between treating pollen as a separate class versus merging it with worker bees into a “pollen-bee” category, both of which significantly influence tracking performance. When pollen is treated as an independent class, detection accuracy is lower (71% based on YOLOv8s mod-3 implementation), with a substantial portion misclassified as background (29%). This inconsistency in detection can lead to frequent tracking failures, as the bounding box may be intermittently lost or switched to background, disrupting object continuity. Additionally, class ambiguity between pollen and background increases the likelihood of misdetections, causing the tracker to lose reference points, particularly in cases of occlusion or motion blur [
17]. According to the confusion matrices in
Figure 7a,c, the detection of worker bees is increased by 2%, therefore the tracking will be more stable for worker bees. The pollen is not misclassified as worker bees. Worker bees should be tracked, and pollen only detected.
On the other hand, merging pollen with worker bees into a single “pollen-bee” category improves detection accuracy (84%), reducing false negatives and stabilizing tracking performance. However, this approach introduces new challenges, while the detection of pollen-bearing bees is enhanced, class confusion between worker bees and pollen-bees may lead to frequent category switches, especially when worker bees are carrying varying amounts of pollen. This can result in tracker drift, where the model inconsistently reassigns labels between “bee” and “pollen-bee”, affecting long-term tracking stability [
18].
Ultimately, the choice of classification scheme should align with the tracking objective. If the goal is to maintain precise long-term monitoring of individual worker bees, treating pollen as a separate class ensures stability, even at the cost of reduced detection accuracy for pollen. Conversely, if short-term detection accuracy is prioritized over continuous tracking, the pollen-bee category provides a more robust detection framework at the expense of occasional tracker inconsistencies. Future improvements could involve integrating motion-based tracking models or refining object detection algorithms to minimize class switching and bounding box instability.
The Jetson AGX Orin platform provides a promising application in apiary monitoring, enabling real-time detection of worker bees, pollen-carrying bees, drones, and wasps at hive entrances. The achieved speeds, as presented in
Table 3, demonstrate the capability of YOLO11 and YOLOv8 models to process video data efficiently. YOLO11 achieves up to 32 FPS under FP16 precision for the smallest model size (n), while YOLOv8 reaches 33 FPS under similar conditions. These speeds are sufficient for continuous monitoring of hive activity without disrupting worker bee behavior. However, further optimization is possible by matching the resolution of input images (
px) with the model’s input resolution (
px). Such alignment would reduce preprocessing time, which currently adds 10 ms for PyTorch models and 12 ms for FP32, FP16, and INT8 implementations. By minimizing preprocessing overhead, the overall FPS could be increased, enhancing the system’s responsiveness.
When choosing between model sizes and precision formats, it is essential to consider the specific requirements of the application [
18,
33]. If high detection precision is a priority, for example, to distinguish pollen-carrying bees from regular bees or detect rare occurrences such as drones or wasps, then the larger “x” models should be used despite their lower speed. Conversely, if speed is critical for real-time monitoring across multiple hives or high-traffic entrances, smaller models such as “nano” or “small” provide faster processing while maintaining adequate accuracy. This flexibility allows beekeepers to customize the system to their unique needs, ensuring effective hive surveillance and early threat detection.
Misclassifications in our detection pipeline, particularly involving small objects such as pollen grains, primarily arise due to their small-scale, occlusion, and visual similarity to background textures. Small object detection remains a well-known challenge in deep learning models, as these objects often occupy fewer pixels, leading to weaker feature representation in convolutional layers [
17,
41,
42]. In our experiments, pollen grains were frequently misclassified as background or occasionally as parts of the worker bee’s body. This problem becomes even worse in cluttered scenes or when the pollen load is faint in color. Moreover, the presence of motion blur, overlapping insects, and varying poses reduces detection consistency [
43]. Despite architectural modifications that enhanced small object sensitivity (e.g., pruning high-level layers and increasing feature resolution), the trade-off between precision and computational efficiency remained. These findings highlight a structural limitation of standard detection models, especially when applied to small, low-contrast, or partially visible targets in complex environments.
Environmental variability, such as changing light intensity, shadows, reflections, and weather-related artifacts (e.g., raindrops or fog), significantly affects model robustness [
44,
45]. Although our dataset included images from both sunny and overcast days to ensure generalizability, certain lighting conditions, particularly strong backlight or harsh shadows near the hive entrance, degraded detection performance. In such cases, object contours were either overexposed or merged into the background, leading to increased false negatives. Additionally, changes in background surfaces due to moisture, pollen accumulation, or dirt introduced further inconsistencies, while real-time augmentation strategies help mitigate some of these issues during training, extreme or rare lighting configurations are inherently underrepresented. Therefore, models may benefit from incorporating dynamic exposure adjustment, domain adaptation techniques, or adaptive thresholding to better handle such variations in deployment scenarios.
6. Conclusions
This study evaluated deep learning-based insect detection models for monitoring bee activity and potential threats at hive entrances. The experiments compared various YOLO-based architectures in terms of precision and inference speed across different hardware platforms, including an RTX 4080 Super GPU and an embedded Jetson AGX Orin. The results highlight the trade-offs between model size, detection accuracy, and inference efficiency, demonstrating that YOLOv8 modifications improve detection accuracy, particularly for distinguishing pollen from worker bees. The choice of whether to classify pollen separately or merge it with worker bees influences both precision and tracking stability. Additionally, hardware optimizations such as adjusting input resolution can further enhance real-time performance. The findings provide a foundation for future work in automated hive monitoring, including motion-based tracking and real-time behavioral analysis to support beekeepers in colony management.
Future research should explore multimodal approaches to improve detection robustness and behavior interpretation. Integrating sensor data such as temperature, humidity, and acoustic signals with visual inputs could enrich the context for object classification and behavioral analysis. For example, correlating increased wasp activity with temperature spikes or specific audio patterns could improve predictive modeling. Additionally, leveraging infrared imagery or polarized light sensors may help in low-light or shadow-heavy environments, complementing RGB-based vision systems. These modalities can be fused at either the data or decision level, enabling the system to maintain high accuracy even when visual data are compromised. Developing such multimodal architectures, particularly those optimized for edge inference, could substantially enhance real-time monitoring capabilities in diverse apiary conditions.


 ,
, 


