Abstract
The maize tassel represents one of the most pivotal organs dictating maize yield and quality. Investigating its phenotypic information constitutes an exceedingly crucial task within the realm of breeding work, given that an optimal tassel structure is fundamental for attaining high maize yields. High-throughput phenotyping technologies furnish significant tools to augment the efficiency of analyzing maize tassel phenotypic information. Towards this end, we engineered a fully automated multi-angle digital imaging apparatus dedicated to maize tassels. This device was employed to capture images of tassels from 1227 inbred maize lines falling under three genotype classifications (NSS, TST, and SS). By leveraging the 3D reconstruction algorithm SFM (Structure from Motion), we promptly obtained point clouds of the maize tassels. Subsequently, we harnessed the TreeQSM algorithm, which is custom-designed for extracting tree topological structures, to extract 11 archetypal structural phenotypic parameters of the maize tassels. These encompassed main spike diameter, crown height, main spike length, stem length, stem diameter, the number of branches, total branch length, average crown diameter, maximum crown diameter, convex hull volume, and crown area. Finally, we compared the GFC (Gaussian Fuzzy Clustering algorithm) used in this study with commonly used algorithms, such as RF (Random Forest), SVM (Support Vector Machine), and BPNN (BP Neural Network), as well as k-Means, HCM (Hierarchical), and FCM (Fuzzy C-Means). We then conducted a correlation analysis between the extracted phenotypic parameters of the maize tassel structure and the genotypes of the maize materials. The research results showed that the Gaussian Fuzzy Clustering algorithm was the optimal choice for clustering maize genotypes. Specifically, its classification accuracies for the Non-Stiff Stalk (NSS) genotype and the Tropical and Subtropical (TST) genotype reached 67.7% and 78.5%, respectively. Moreover, among the materials with different maize genotypes, the number of branches, the total branch length, and the main spike length were the three indicators with the highest variability, while the crown volume, the average crown diameter, and the crown area were the three indicators with the lowest variability. This not only provided an important reference for the in-depth exploration of the variability of the phenotypic parameters of maize tassels but also opened up a new approach for screening breeding materials.
1. Introduction
Maize is one of the world’s most important food crops, and its yield is critical to ensure food security [1]. Genetic breeding techniques can help increase maize yields and ensure global food security. The accelerated localization of functional genes through high-throughput phenotypic information acquisition techniques has a huge market demand [2] and is key to developing improved varieties [3].
Studies have shown that the structure of maize tassels is directly related to pollen yield and pollination efficiency, which not only affects final kernel yield but also inbred line retention [4]. However, overly dense male tassel branching and oversized male tassel size do not promote final maize yield. On the contrary, on the one hand, it will reduce the photosynthetic efficiency of leaves due to the overly large shading area, and, on the other hand, it will consume a large amount of nutrients, affecting the formation and plumpness of grains [5,6]. Finding the right structure of maize tassels is important for breeding good maize varieties. In recent years, high-throughput phenotyping technologies have played an important role in the breeding work of many crops, and more and more genes related to maize tassel phenotypic traits have been successfully located [7]. High-throughput phenotyping technologies have been crucial in crop breeding. In combination with GWAS technology, more genes related to maize tassel traits like tassel length, branch length, branch number, stem diameter, main spike diameter, and stem length, which can be easily, cheaply, and accurately quantified, have been located successfully. This has made the maize tassel structure a convenient field for QTL study [8,9] and an important foundation for quickly screening excellent tassel traits [10,11].
However, for high-throughput phenotypic measurements of the maize tassels, the multitude of the characterization parameters and the short pollination period, during which the tassels stop growing and begin to degrade, make the effective time available for measuring structural traits in the tassels very limited. In addition, maize tassels are very easy to dehydrate after leaving the plant, resulting in tassels that are easy to break and even undergo large morphological changes, which is very unfavorable to the acquisition of high-throughput data on maize tassels, and indicators such as maximum crown diameter, crown height, average crown diameter, and crown width are also difficult to be measured manually. Therefore, it is particularly important to develop high-throughput measurement techniques for maize tassel.
Currently, a large number of image- and point cloud-based methods have been used to extract crop phenotypes, such as using images to extract the 3D structure of maize seedlings [12] and extracting the leaf area and plant height of maize [13,14,15], as well as extracting the number of branches, branch length, and the angle of the tassel [16,17], and systems have also been developed for this purpose [18,19,20]. However, for analyzing three-dimensional structural parameters, 2D images are unable to overcome the occlusion problem. Three-dimensional point cloud data offer significant advantages in extracting multiple structural parameters of a target object [21,22,23]. Currently, most point cloud data are generated by 3D scanning devices such as LiDAR (2D/3D), TOF cameras (time-of-flight cameras), and structured light scanners. Terrestrial laser scanning (TLS) can accurately characterize the 3D structure of trees with millimeter-level accuracy [24,25]. Lei and Suresh et al. [26] used terrestrial LiDAR data to extract the 3D structural information of maize plants, including leaf area and leaf angle. Paulus et al. [27] studied the acquisition and reconstruction of the 3D point cloud of barley using LiDAR with a measuring arm to extract the leaf area and plant height. Chaivivatrakul et al. [28] used a TOF camera to acquire the point cloud data of maize seedlings to reconstruct a 3D model of maize seedlings, extracting information such as maximum/minimum stem diameter, stem height, leaf area, leaf length, and leaf angle. However, these methods often lack point cloud density or geometric accuracy when studying organ-scale objects such as maize tassel. Dong and Sheng et al. [4,29] constructed a 3D point cloud of a maize tassel using images and extracted metrics such as plant height, leaf area, main spike length, and branching number. However, there are problems of low automation, high cost, and low analysis efficiency. Xu et al. [30] made a significant development. They developed a system known as TIPS, short for three-D image phenotype system. This system utilizes the TreeQSM algorithm. With this algorithm, it reconstructs and analyzes the topology of a single tree. By doing so, it manages to extract the phenotypic parameters of the maize tassel structure that bears resemblance to the tree structure. This extraction process brings several solutions. It solves the problem of automatically acquiring maize tassel images. It also addresses the issues related to 3D point cloud generation and tassel topology reconstruction. Moreover, the system further evaluates certain aspects. It looks into the spatial variability of the point cloud. It also assesses the extracted tassel axial spindle lengths. Additionally, it examines the number of branches, the total branch lengths, and the branch angles. The evaluations lead to a conclusion. The results show that the system is both efficient and accurate. In another aspect, the system accomplishes a particular task. It resolves the tool problem for extracting phenotypic parameters of maize tassels. However, there is a drawback. There has been no analysis carried out on the genetic relationship between phenotype and genotyping.
Tassel clustering genotypes using tassel phenotypic parameters are efficient and easy to use, and they are an innovative aspect of this study. Since maize tassel structural phenotypes are largely controlled by genotypes, different genotypes exhibit significant differences in tassel morphology, providing feasibility for analyzing tassel structural phenotypic information to explore differences in phenotypic performance among four maize genotypes. Song et al. [31] obtained different gene categories after clustering different functional genes through the GFC algorithm, showing the distribution characteristics of gene expression data in the clustering space. Minton et al. [32] provided a step-by-step guide for conducting plant morphometric analysis using the Gaussian Mixture Model and established a new conceptual, statistical, and probabilistic framework for analyzing morphometric data in plant taxonomy. Yang et al. [33] extended the model-based Gaussian clustering method to the fuzzy model and put forward an unsupervised Gaussian clustering algorithm based on the fuzzy model, which solved the problems of the traditional Gaussian clustering algorithm being sensitive to initialization and requiring the number of clusters to be specified in advance. Fuchs et al. [34] compared the Gaussian Mixture Model with existing advanced mixed data clustering models on multiple commonly used datasets. The results showed that this model can achieve more accurate and stable clustering results when dealing with mixed data and is superior to traditional clustering methods. Yang et al. [35] used the GoldenGate assay kit (Illumina, San Diego, CA, USA) containing 1536 SNPs and an association mapping approach for 12 phenotypic traits to typify 527 lines and explored the relationship between genotypic and phenotypic variance. The relationship between genotypes and phenotypic variants was explored. Pan et al. [36] used hierarchical clustering to cluster the phenotypic parameters of 24 watermelon germplasm resources, revealing their diversity and variation patterns. Xie et al. [37] used UAV RGB images to cluster eight phenotypic parameters of 300 rapeseed varieties during flowering using the dynamic K-Means method, grouping the rapeseed varieties into four categories based on flowering characteristics. HAN et al. [38] studied phenotypic variation among different genotypes using dynamic changes in maize plant height and analyzed the maize genotypes using the GFC (Gaussian Fuzzy Clustering). Rincon, Mustafa, and Shrestha et al. [39,40] conducted the clustering analysis of maize materials based on multiple phenotypic traits such as plant height, leaf length, width, leaf temperature, root density, and weight to characterize trait variability in different maize materials. However, studies on clustering genotypes using tassel phenotypic parameters are limited.
Existing research results have solved the problems of multi-angle image acquisition, 3D synthesis, topological reconstruction, and the automatic extraction of phenotypic parameters such as maize main spike length, branch number, branch length, and branch angle [30]. On this basis, this study further extracted seven phenotypic parameters such as main spike diameter, crown height, stem diameter, average crown diameter, maximum crown diameter, crown volume, and crown area from 1227 maize tassels. Additionally, after denoising the original point cloud data using Gaussian filtering and DBSCAN (Density-Based Spatial Clustering of Applications with Noise) algorithms, 1227 single-plant maize tassel point clouds were successfully extracted. Finally, genotypic clustering analysis was performed on these 1227 single-plant maize tassel point cloud data using the Gaussian Fuzzy Clustering (GFC) algorithm. The clustering results showed that the method of this study had a relatively good classification effect on Non-Stiff Stalk (NSS) and Tropical and Subtropical (TST) materials. The method could reveal the variability of multiple structural phenotypic parameters of the maize tassel. Additionally, compared with traditional commonly used machine learning algorithms, the clustering algorithm adopted in this study had a higher classification accuracy. This study innovatively used the three-dimensional structural phenotype of the maize tassel to cluster maize genotypes, providing a certain reference value for the screening of materials in the maize breeding process. Finally, after comparing the measured data, this study found that although the clustering accuracy of the measured data increased by 5% to 10%, the method adopted in this study was more efficient, more economical, and more practical.
2. Materials and Methods
2.1. Study Area and Manual Measurement Data of Tassel
The study area is located at the National Precision Agriculture Research and Demonstration Base in Xiaotangshan, Changping District, Beijing (40°10′60″ N, 116°26′30″ E). In 2022, we collected a total of 409 samples, resulting in 1227 maize tassel images taken after pollination (each sample consists of three sets of images, with 72 images per set). Each sample was planted in two rows with a row spacing of 0.6 m and a plant spacing of 0.4 m. The genotypic types of these 409 sets of maize materials were based on the results analyzed by the Bayesian Markov Chain Monte Carlo (BMCMC) program using the STRUCTURE software (version 2.3.4) [41,42]. These results classified the genotypes of the maize materials into a total of four subgroups: The Tropical and Subtropical (TST) maize germplasm resources are adapted to Tropical and Subtropical climates, possessing hardcore traits that enable them to grow well in hot and humid environments, and this genotype of germplasm resources has strong drought resistance. The Non-Stiff Stalk (NSS) and Stiff Stalk (SS) maize germplasm resources are the way that Dr. Duvick of Pioneer in the United States classifies maize hybrids according to the different requirements of the parent and the mother. The NSS is categorized as a replica, which is characterized by a small pollen load and a short pollen dispersal time, while the SS is classified as a parent, which is characterized by a high seed yield. Among these, there were 28 SS genotypes, 175 NSS genotypes, and 140 TST genotypes. The remaining 55 samples had genotyping probabilities below 0.60 and were classified as mixed subpopulations (MIXED).
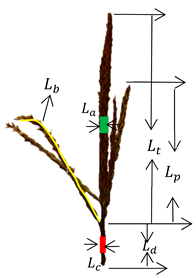
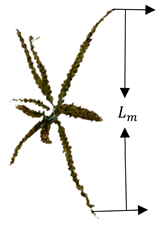
The measured data in this study included the main spike length, branch length, branch number, spike diameter, stem diameter, stem length, crown diameter, and crown height of the tassel. The stem length refers to the portion from the lowest flower silk on the main stem of the tassel to the first node at the top of the maize stem. Maxcrowndiam and crown height refer to the maximum crown diameter and maximum crown height, respectively. A detailed measurement diagram of the phenotypic parameters is shown in Table 1. All lengths were measured in a straightened state, using a ruler with a resolution of 1 mm. The diameter of La is the average of the diameters of five equally spaced regions on the main spike, while Ld refers to the length from the starting point of the first branch of the tassel to the highest node of the maize plant below the tassel. Its diameter Lc is also the average of five equally spaced diameters.

Table 1.
Descriptive statistics of the measured phenotypic parameters.
2.2. TIPS Development and Image Acquisition
The acquisition of image data is primarily automated through the TIPS system, which consists of four main components: hardware, data communication and transmission, data acquisition, and data processing. The hardware includes an electric turntable, a reference board, three digital cameras, and a computer. The data communication and transmission module consists of Wi-Fi wireless communication for the electric turntable and RS232-to-USB wired communication for the cameras. The data acquisition module includes parameter settings, image preview, control of camera shooting, and data classification and storage. The processing module encompasses 3D point cloud reconstruction based on image sequences, point cloud calibration, point cloud segmentation, and phenotypic information extraction.
Using the TIPS system’s hardware module, data transfer, data collection, and data processing, we captured 360-degree images of the maize tassel. For each tassel, 72 images were taken, covering the upper, middle, and lower sections. The digital camera used was a Nikon D5600 with an effective resolution of 24.16 megapixels, paired with a Nikon 18–140 mm f/3.5–5.6 G ED VR lens, supporting 7× zoom. The camera was set to a fixed focal length mode for the shooting. The electric turntable, controlled via wireless Wi-Fi with a precision of 0.01 degrees, has a diameter of 60 cm and is powered by a 24 V DC supply. The calibration board is a square with an 80 cm side length.
The data acquisition and storage processes were automatically completed using data acquisition control software developed in C# on the Visual Studio 2010 platform. Figure 1 shows the schematic and physical diagrams of the TIPS system structure.
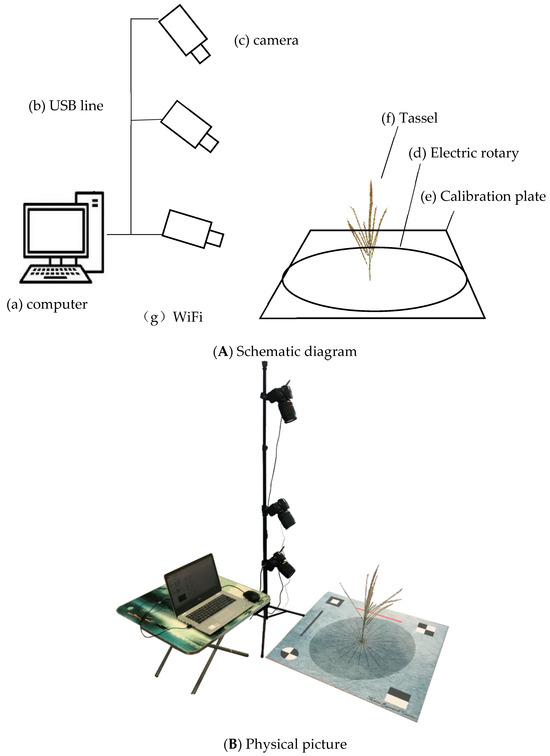
Figure 1.
System structure of TIPS.
During the measurement process, the tassel is fixed at the center of the calibration board. The digital cameras and tripod positions are secured, and the focal length is adjusted to ensure that the calibration board occupies more than 70% of the field of view. Additionally, the overlap of the tassel images in the upper, middle, and lower sections is also maintained at 70% or more.
The data acquisition software is then activated, setting the height and photo intervals for the three cameras before automatically collecting 360-degree image data of the tassel. A total of 1227 effective tassel images were obtained, resulting in 88,344 images in total. The entire process took 81.8 h.
2.3. Point Cloud Generation and Preprocessing
After image acquisition, the images need to undergo 3D point cloud reconstruction using the SFM (Structure from Motion) algorithm. As shown in Figure 2. The process of using the SFM algorithm to generate the 3D point cloud of the maize tassel is as follows. Firstly, the SFM algorithm extracts the focal length information from the input images. Subsequently, feature extraction algorithms such as SIFT are employed to extract image features. Then, the kd-tree model is utilized to calculate the Euclidean distance between the feature points of two images for performing feature point matching, with the aim of identifying the image pairs that possess the requisite number of feature point matches.
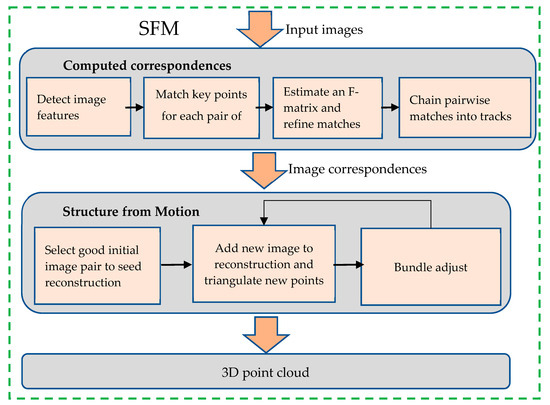
Figure 2.
The process of SFM.
For each of these image matching pairs, the epipolar geometry is computed, and the F matrix is estimated and optimized through the RANSAC algorithm to enhance the quality of the matching pairs. If a feature point can be detected and matched within a matching pair and is continuously detectable, a matching point trajectory will be formed.
Next, the new images are incorporated into the SFM loop for bundle adjustment. This process continues until there are no more suitable images to be added. Finally, the sparse bundle adjustment was adopted in this study to generate the 3D point cloud of the maize tassel.
This algorithm is suitable for various types of scenes and objects, whether indoor or outdoor or static objects or dynamic scenes [43,44].
In this study, we used the domestic commercial software DJI Terra (Shenzhen DJI Technology Co., Ltd., Shenzhen, China, version 3.6.8) to batch reconstruct 3D point cloud data in .ply format. These data include not only the X, Y, and Z coordinates but also RGB color information. Figure 3 had showed the point cloud reconstruction process and some of the point cloud reconstruction results, with all 1227 samples successfully reconstructed.
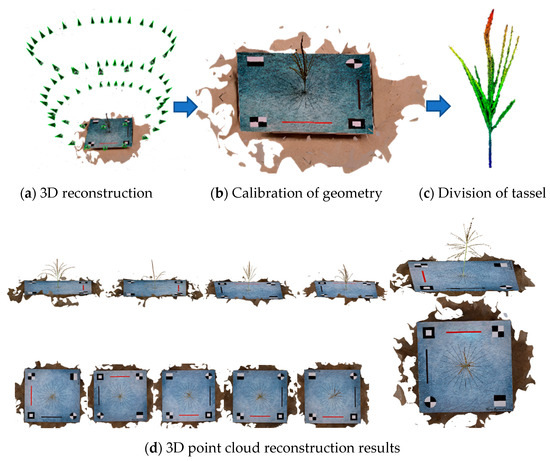
Figure 3.
Preprocessing process of image data.
After generating the point cloud, the spatial information of the 3D reconstruction does not agree with the physical values, and further calibration is required to accurately quantify the spike phenotype parameters. As shown in Figure 3b, the calibration was achieved by designing red and black calibration lines on the calibration board with a standard length of 25 cm, and the point cloud coordinates could be calibrated to the absolute coordinate system by the coefficient of variation between the predicted and actual values that was measured by constructing the ratio between the actual length of the calibration line (25 cm) and the values extracted by TreeQSM.
As shown in Figure 4, first, noise and isolated points in the point cloud are filtered out. Subsequently, the filtered point cloud is segmented into small sets that conform to the tassel surface, and the adjacent relationship of these coverage sets is defined. Next, sets not belonging to the tassel are removed to define tassel components. Tassel components refer to essentially independent parts or clusters in the point cloud, like a single branch, a group of branches, or even the entire tassel.
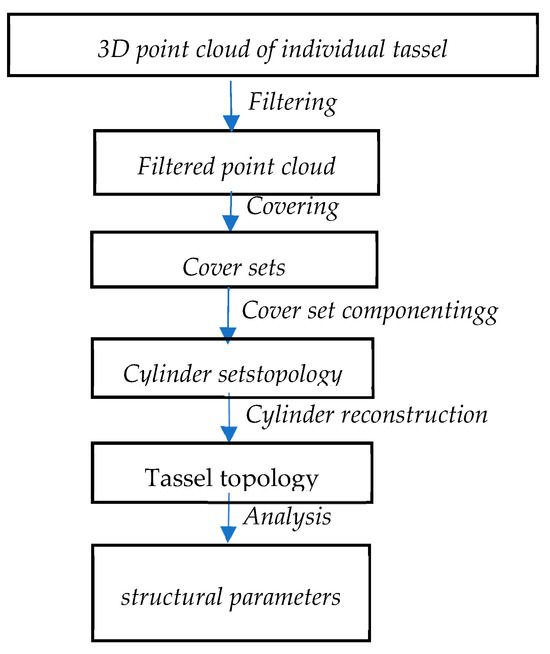
Figure 4.
Flowchart of TreeQSM.
Following this, a surface growth model is employed during the segmentation of tassel components. By checking local connectivity, branches are identified. After that, each part is approximated as a sequence of cylindrical bodies, which may have varying radii, lengths, and directions.
Finally, based on the constructed cylindrical model, the tassel’s topology and other feature parameters are calculated.
Since the extraction of point cloud parameters requires data containing only the object of interest, further filtering and clustering of the point cloud are necessary. As shown in Figure 5, the raw point cloud undergoes Gaussian filtering and DBSCAN clustering to obtain a point cloud containing only the tassel itself.
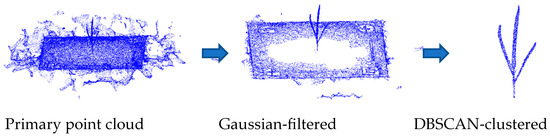
Figure 5.
Tassel division.
The Gaussian filtering process is performed directly in MATLAB 2017b using the pcdenoise (noisyData, “NumComponents”, numComponents) function, with numComponents set to 0.1. After filtering, the DBSCAN (eps = 0.5, min_samples = 150) clustering function is used to extract the individual tassel point cloud. The process is illustrated in Figure 5.
The preprocessing results indicate that out of the total 1227 tassel samples, 1152 were successfully isolated, achieving a success rate of 93.9%. The remaining samples were separated manually.
2.4. Extraction of Phenotypic Parameters for Maize Tassel
The phenotypic information extraction utilizes the TreeQSM algorithm and the Convex Hull algorithm. The metrics extracted by these methods are listed in Table 2. The TreeQSM algorithm has been widely applied for extracting the 3D structure of trees [45,46] and has achieved excellent results. Currently, this algorithm is available in various software versions [47,48,49,50].
Table 2.
The phenotypic indices extracted by different algorithms.
Previous studies have shown that the spatial variability along the x, y, and z axes of the maize tassel topology point clouds reconstructed using the TreeQSM algorithm and images acquired from this system is stable, demonstrating the high accuracy of the original point clouds. Additionally, the correlation coefficient between the predicted and measured values of multiple phenotypic parameters has an average absolute coefficient R2 > 0.9 [30]. It is necessary to remove the length of the stem while obtaining the length of the main spike. TreeQSM can record the coordinates of the lowest point during the reconstruction of the topological structure (usually the lowest point coordinates of the stem) and the coordinates of the first branch, as well as the category, length, and radius of all cylinder fitting segments. Subtract the coordinates of the lowest point from the coordinates of the first branch to obtain the length of the stem, and then obtain the length of the main spike. For the diameter of the main spike and the diameter of the stem, it is the average of all fitted cylinder diameters on the main spike and stem. This study used TreeQSM version 2.4.1. TreeQSM has five input parameters: PatchDiam1, PatchDiam2Min, PatchDiam2Max, BallRad1, and BallRad2. In this study, PatchDiam1, PatchDiam2Min, and PatchDiam2Max were adjusted to obtain the 3D topological structure of maize tassels and extract related phenotypic parameters [51]. Detailed parameter adjustment rules can be found in reference documents [52]. The point cloud spatial scale results extracted using the TreeQSM algorithm are non-physical values and require scale correction to ensure that the extracted phenotype parameter results are physical values with standard quantization units. As shown in Table 2, the convex hull method was used to extract the concave hull crown area (Figure 6a) and the convex hull volume (Figure 6b) of the tassel on the XOY projection plane. The crown area and volume were directly extracted using the boundary function in MATLAB (version 2017b), with the third parameter, representing the degree of looseness, set to 1.
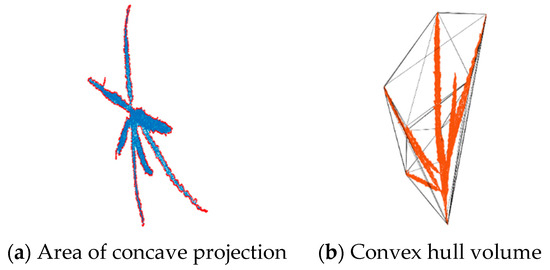
Figure 6.
Convex hull volume and convex hull crown area of tassel.
2.5. Methods of Cluster Analysis
The introduction mentions that the subjects of this study are maize materials from three genetic types (NSS, TST, and SS). The classification of these maize materials is based on genotype probabilities inferred using the STRUCTURE software to determine population structure and assign genotypes to subpopulations.
If the probability of any one genotype (NSS, TST, or SS) exceeds 60%, the material is classified into that genotype category. If none of the proportions exceed 60%, the material is classified into the MIXED category. Since the classification is based on probabilities, the study uses GFC to cluster the 1227 maize tassel samples based on the structural phenotypic parameters extracted using the TreeQSM model, aiming to identify the differences in tassel structure phenotypes among different maize genotypes.
This study uses the GFC model to perform clustering analysis on maize tassel phenotype parameters. GFC is a probabilistic model that has been widely applied in various fields such as pattern recognition, computer vision, machine learning, data mining, and bioinformatics [53,54,55]. GFC combines the concepts of GFC. GFC allows data points to belong to multiple clusters with different degrees of membership rather than being hard-assigned to a single cluster. GFC uses Gaussian functions to define the membership function, resulting in fuzzy memberships. Specifically for this study, the clustering process and key variables are as follows and in Table 3:
Table 3.
Definitions of the main variables in GFC.
- (1)
- Initialize the original data point matrix X and randomly generate the initial affiliation matrix U. Note that the initialized affiliation matrix must satisfy = 1, where is the row number, and k is the column number, from 1 to 11. Normalize the affiliation of each data point so that the sum of its affiliations to all clusters equals 1. Normalize the affiliation of each data point using the formula so that the sum of its affiliations to all clusters equals 1. Here, the normalization still results in the matrix U.(Ld, Lt, Branchnum, Lm, Lp, Lc, La, Crownarea, Crowndiam (AVG), Lb (all), and CrownVolume)
- (2)
- The next step is to calculate the clustering center for each phenotypic parameter, where k is the number of features (here, 11), and the fuzzy coefficient m usually takes the value of 2.The cluster centroids are obtained by calculating as follows.
- (3)
- Compute the Euclidean distance from each data point to each cluster center . The calculation process and results are as follows:
- (4)
- Update the affiliation matrix based on the distance and fuzzy coefficients U, where each element in the U matrix is calculated as follows:where I and k denote the number of rows and columns, respectively, j denotes the number of classifications, and m is the fuzzy coefficient, which still takes the value of 2 here.Use the new post U11…U1127-11 to update the affiliation matrix U. Repeat processes (2) to (4) until the affiliation matrix U converges or reaches the set maximum number of iterations, i.e., 2000.
Since the genotype classification of maize tassel materials in this study is based on probabilities, the GFC algorithm is well suited for handling different genotypes of tassel materials.
This study used the Random Forest algorithm to analyze the importance of extracted maize tassel phenotype parameters, attempting to compare them with GFC classification results and verify the correctness of the results. Using the Random Forest model, the importance of the 11 extracted tassel phenotypic parameters was ranked. With a fixed random seed of 42, 70% of the data was randomly selected as the training set and 30% as the validation set.
2.6. Accuracy Evaluation
We use accuracy, precision, Recall, and F1 to judge the accuracy and effectiveness of the model clustering, calculated as follows:
where Tp is predicted as 1 and is actually 1; FP is predicted as 1 but is actually 0; Fn is predicted as 0 but is actually 1; Tn is predicted as 0 and is actually 0.
F1 = (2 × Precision × Recall)/(Precision + Recall)
3. Results
3.1. Reconstruction Results of the 3D Topological Structure of the Tassel
In this study, the TreeQSM algorithm was optimized by adjusting three parameters (PatchDiam1, PatchDiam2Min, and PatchDiam2Max) to achieve the best reconstruction results. Initially, the parameters were set to 0.005, 0.0005, and 0.005, respectively, resulting in successful 3D topological reconstructions for 986 samples, with a success rate of 80.3%. By further adjusting the parameters, the number of successfully reconstructed tassels increased to 1194, yielding a final success rate of 97.3%. Unsuccessful reconstructions were mainly due to excessively compact tassel shapes, which made it challenging to correctly separate the main spike from the branches. Such data were excluded from subsequent statistical analysis.
Figure 7 shows the results of the TreeQSM reconstruction for some tassel topological structures. The results indicate that the TreeQSM model performs less effectively on tassels with a higher compactness. There are mainly two cases: one where the main stem is identified but cannot be distinctly separated from the branches and another where the main stem is completely failed to be identified. Both cases are considered unsatisfactory extraction results. In contrast, for tassels with lower compactness, the TreeQSM model effectively identifies the main spike and branches, providing the necessary conditions for the further extraction of tassel structural phenotype parameters.
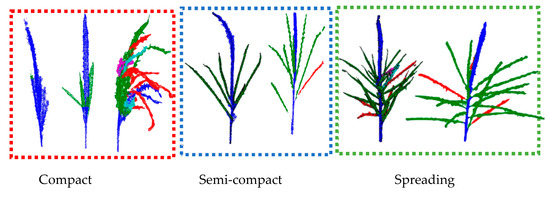
Figure 7.
Results of the TreeQSM topology reconstruction.
3.2. Variability Analysis of Point Cloud and Extraction Results
Parameters extracted using the TreeQSM model are still in Euclidean distance and need to be corrected. The correction process and the accuracy of the results have been verified [30], and the absolute coefficient of variation P of the dataset in this study is between 34 and 39, but more than 84% of the samples have coefficients of variation between 36 and 38, which suggests that the spatial variability of the point clouds obtained under the same conditions is relatively small.
This study analyzed the data distribution of the 11 extracted parameters, as illustrated in the Figure 8. All phenotypic parameters, except for the number of branches, are measured in centimeters. The left side of each set of comparison data in Figure 6a is the measured value, and the right side is the model extracted value. The left four sets of data correspond to the scale labels on the left, while the right two sets of data correspond to the scale labels on the right. From the Figure 6, it is evident that the median, average, minimum, and maximum values of the stem length and main spike length are all larger than those measured. This is primarily because the TreeQSM model provides more detailed length calculations, whereas the measured data, although stretched straight, could not be fully straightened to avoid breaking the tassel. Additionally, the maximum crown diameter, crown height, stem diameter, and main spike diameter show considerable discrepancies between measured and extracted values. This is mainly due to the difficulty in accurately measuring the maximum crown diameter and crown height and the smaller values of stem and main spike diameters, which are prone to larger measurement errors. The average crown diameter, total branch length, crown area, and convex hull volume are all results extracted using TreeQSM. Notably, the average crown diameter is displayed as ten times its extracted value. The left vertical stem represents the red boxplot data scale, with units in cm for average crown diameter and total branch length and cm2 for crown area. The right vertical stem, in blue, represents the convex hull volume with units in cm3. As shown in Figure 6, the average values for these four phenotypic parameters are significantly higher than the median values, indicating that more than 50% of the sample values are distributed below the average.
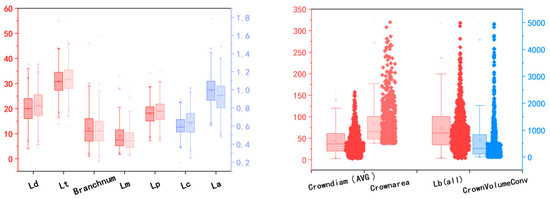
Figure 8.
Data distribution.
Additionally, this study analyzed the variability of the 11 extracted parameters, as shown in Table 4. The results indicate that the extracted phenotypic parameters exhibit considerable variability, reflecting a non-concentrated data distribution and providing a more representative basis for the study’s results.
Table 4.
Extracted phenotypic parameter variability results.
3.3. Analysis Results of Phenotypic Parameter Correlations and Importance
Using the Pearson correlation coefficient method, the correlations between the 11 phenotypic parameters of maize tassels extracted by TreeQSM were constructed. As shown in Figure 9, the highest correlations were found between the number of tassel branches and the total branch length, as well as between the crown area and the convex hull volume, both exceeding 0.9. The average crown diameter showed the next highest correlation with the crown area and convex hull volume, both above 0.8. In contrast, the correlations among main spike diameter, stem diameter, and stem length were relatively lower.
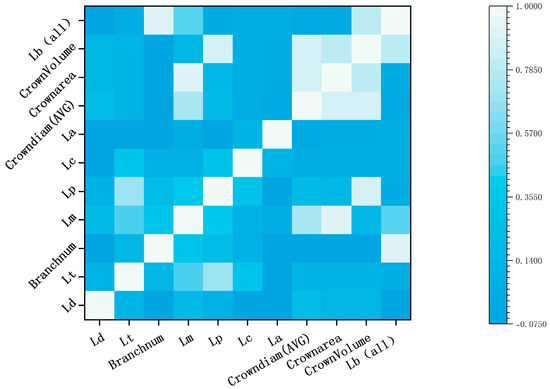
Figure 9.
Correlation of phenotypic parameters.
The importance of 11 maize phenotype parameters calculated using the Random Forest algorithm is shown in Figure 10. It can be observed that for the classification of maize genotypes, the top three most important phenotypic parameters are the number of branches (i.e., Branchnum), total branch length (i.e., Lb (all)), and main spike length (i.e., Lt). The least important parameters are the convex hull volume of the crown (i.e., CrownVolume), the average diameter of the crown (i.e., Crowndiam (AVG)), and the projected area of the crown (i.e., Crownarea).
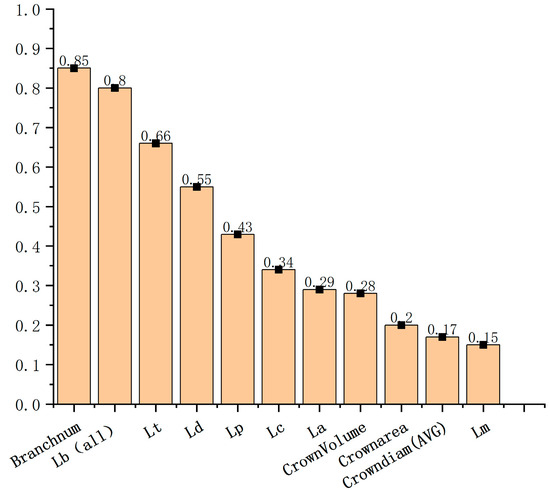
Figure 10.
Ranking of importance of phenotypic parameters.
3.4. Different Genotype Classification Results
This study performed probabilistic clustering using GFC on 10 out of the 11 extracted phenotypic parameters of maize tassels (excluding convex hull volume). The number of clusters was set to 4, and the number of iterations was set to 2000, calculating the probability of each sample belonging to each cluster. Each sample was assigned a probability of belonging to a particular cluster, with probabilities ≥ 0.6 used to classify the samples into NSS, SS, TST, or MIXED categories. The results are shown in Table 4. The columns represent the four clustering results of the GFC, while the rows indicate the number of samples for each genotype in the actual clustering results.
As shown in Table 5, the numbers in the table are the actual number of genotype samples in each category of classification results, and the order of the data volume of the four classification clusters is also consistent with the sample volume, which is NSS, TST, MIXED, and SS in descending order. In the third and the fourth clusters, the classification accuracies of NSS and TST are 67.7% and 78.5%, respectively, and the clustering accuracies of NSS are lower than that of TST. One important reason for this is that the variability of phenotypic traits is greater in the material of the NSS genotype than in the TST. In addition, there is a MIXED category in the classification results, the probabilities of NSS and TST are close to each other and neither of them exceeds 0.6, which brings a certain degree of randomness to the distribution of NSS and TST. This also directly affects the ability of current classification methods to further improve the accuracy of NSS and TST classification.
Table 5.
Results of GFC.
3.5. Comparison of Clustering Results for Different Phenotypic Parameters
In this study, the 11 extracted phenotypic parameters were randomly combined and then clustered. The parameter combinations are shown in Table 6, with a total of seven different combinations, labeled A to G. Each subsequent combination has one fewer parameter than the previous one. The GFC was again used for probabilistic clustering, with the samples divided into four clusters and classified based on probabilities ≥ 0.6. Notably, combinations F and G, which had fewer parameters, were excluded because the GFC could no longer perform accurate clustering with these combinations.
Table 6.
Different parameter combinations and clustering results.
From the clustering results of different parameters (Table 6), it is evident that the precision for the SS and MIXED categories remains relatively low. The clustering accuracy for the NSS and TST genotypes decreases progressively with the reduction in the number of parameters. In particular, a significant drop in accuracy is observed from combinations C to D, indicating that branch length contributes significantly to genotype classification and that its variability is greater. As the number of clustering parameters decreases, the accuracy further declines.
4. Discussion
4.1. Comparison of Results from Different Clustering Methods
The results obtained from different clustering methods vary. In this study, the clustering effects of three common machine learning methods, namelym Support Vector Machine (SVM), Random Forest, and Backpropagation (BP) Neural Network, as well as three commonly used algorithms, namely, k-Means, HCM (Hierarchical) Clustering, and FCM (Fuzzy C-Means) Clustering, were compared. As concluded in previous research, using 10 phenotypic parameters to cluster into four categories can achieve the highest accuracy. Therefore, the same 10 phenotypic parameters were used in this study to compare the results. The sample data were randomly divided into 20 groups of training sets and validation sets at a ratio of 7:3. The clustering precision was calculated based on the proportion of correctly classified samples to the total number. The clustering results are shown in Table 7. When comparing these three machine learning algorithms, Random Forest has the highest accuracy on both the training set and the validation set, but its advantage is not significant. Its accuracy is between 50% and 60%, and the relatively higher accuracy on the training set is also due to the overfitting phenomenon. Judging from the accuracy results, the accuracies of all these three methods are not high, and the differences among them are not significant either. This is because all these three methods are supervised classification methods and are not suitable for the non-linear problem of clustering maize phenotypes and genotypes.
Table 7.
The clustering results based on machine learning methods.
By comparing the clustering results of the other three methods shown in Table 8, it can be found that their clustering precisions are all 6–13% lower than that of the GFC. The possible reason is that the GFC has the characteristics of fuzziness, probabilistic nature, and sensitivity to normally distributed data, while the classification rules for maize material genotypes used in this study are also based on probability, and the sample data also present the characteristics of approximate normal distribution.
Table 8.
The clustering results based on the K-Means, HCM, and FCM.
4.2. Clustering Results Under Different Clustering Modes
In the previous results section, this study clustered the data into four types. However, the “mixed” type does not belong to a definite genetic type of maize materials. This study explores the removal of the “mixed” category. The original MIXED samples were reassigned to SS, NSS, or TST based on the highest proportion probability. The results are shown in Table 9. The redistributed sample numbers were NSS: 605, SS: 133, and TST: 456. The new samples were then subjected to GFC using the 10 parameters. The precision of classifying NSS was 55.7% in the first clustering result, TST genotype precision was 52.9% in the second clustering result, and SS precision was 18.9% in the third clustering result. Compared to the four-category classification, the precision significantly decreased.
Table 9.
Clustering results of different classification methods.
4.3. Comparison with Clustering Results of Measured Values
In this study, eight real-measured quantitative phenotypic traits other than maize tassel crown area, convex bunt volume, and average crown diameter (data that could not be measured realistically) were analyzed according to the clustering; the data samples were still the same as the 1194 groups used by the GFC algorithm, and the results are shown in Table 10. Here, it can be seen that the clustering accuracies of real-measured data were all improved compared to the accuracies of the automated clustering of this phenotyping platform, of which the clustering accuracies of the NSS genotypes were improved, NSS by 5.64% and TST by 10.86% (the classification accuracy of the system in this study was 51.62% and 68.57%), which indicates that the clustering effect of maize tassel genotypes using the methodology of this study is trustworthy and has some reference value.
Table 10.
Comparison of clustering results between predicted and measured results.
5. Conclusions
In this study, the TIPS system was used to achieve the automatic acquisition of maize male tassel images, and the SFM algorithm was used to achieve the synthesis from the image sequence to the 3D point cloud, while the Gaussian filter algorithm and the DBSCAN algorithm were used to achieve the de-noising of the original point cloud as well as the separation and extraction of the point cloud of the male tassel of a single plant. Based on the extracted point cloud, the TIPS system was used to implement a system specifically for the extraction of the tree structure using the algorithm TreeQSM for the reconstruction of the 3D point cloud of the corn tassel. The reconstruction of male ear topology, the extraction of multiple structural phenotypic parameters, and finally the analysis of the extracted structural phenotypic parameters with the genotypes of maize materials by the GFC clustering algorithm, which realizes the technical analysis of the whole set of processes from phenotypic parameter extraction to genotype classification, were explored in this study. The main contributions include the following:
- (a)
- The system developed in this study has high efficiency and accuracy for extracting the structural phenotypes of maize tassel with high precision, especially the use of the combination of Gaussian filtering and DBSCAN algorithms to achieve the separation of the point cloud of the tassel of a single plant proved to be very effective.
- (b)
- For the classification of genotypes of maize materials, the parameter importance was Branchnum > Lb (all) > Lt > Ld > Lp > Lc > La > Lm > Crownarea > Crowndiam (AVG) > CrownVolume, which revealed the magnitude of the variability of the tassel phenotypic parameters of the different genotypes of the maize materials.
- (c)
- Compared with the traditional RF, SVM, and BPNN methods based on supervised classification, the GFC algorithm, an unsupervised classification method, separated NSS and TST maize genotypes more efficiently, with accuracies of 67.7% and 78.5%.
- (d)
- Comparing the clustering results of the measured data and the predicted data, although the clustering accuracy of the measured data is 5–10% higher than that of the predicted data, the method in this study has a higher economic and practical value.
- (e)
- Compared with the traditional process of classifying maize materials by using gene locus information, which is complicated, difficult to operate, and costly, this study has pioneered the first research on clustering maize genotypes using the phenotypic parameters of maize tassels and has proven that its results are more efficient, economical, easy to operate, and highly accurate. The fuzziness, probabilistic nature, and sensitivity to the normal distribution data of the Gaussian Fuzzy Clustering algorithm are in line with the classification rules for maize material genotypes and the characteristics of the sample data used in this study. Therefore, it has relatively good classification accuracy.
- (f)
- Phenotype is the result of gene action. The variability of the branch number, branch length, and main spike length, as well as the clustering accuracy results in this study, fully demonstrate that the heritability of tassel phenotypic traits in different maize genotypes is relatively strong.
In this study, we investigated the trait variation of different genotypes from the perspective of the three-dimensional structure and phenotype of maize tassel, which provides an important tool for the efficient screening of maize materials.
Author Contributions
Conceptualization, B.X. and G.Y.; methodology, B.X.; software, B.X.; validation, H.Y. and H.F.; investigation, B.X., H.Y. and H.F.; data curation, B.X. and C.L.; writing—original draft preparation, B.X., X.Y. and H.Y.; writing—review, editing, visualization, B.X., Y.Z., H.Y. and H.F.; supervision, C.Z. All authors have read and agreed to the published version of the manuscript.
Funding
This article was funded by the National Key Research and Development Program of China (No. 2021YFD2000100, No. 2022YFF1003500, and No. 2021YFD1201601) and supported by the Collaborative Innovation Center for Modern Crop Production, which is co-sponsored by the Province and Ministry, Nanjing Agricultural University, Nanjing, Jiangsu 210095, China; the earmarked fund was CARS-02, Special Fund for Construction of Scientific and Technological Innovation Ability of Beijing Academy of Agriculture and Forestry Sciences (KJCX20230434). We are also grateful to the anonymous reviewers and editors for their valuable comments and recommendations.
Data Availability Statement
The data presented in this study are available on request from the corresponding author.
Conflicts of Interest
The authors declare no conflicts of interest.
References
- Gebbers, R.; Adamchuk, V.I. Precision agriculture and food security. Science 2010, 327, 828–831. [Google Scholar] [CrossRef] [PubMed]
- Tester, M.; Langridge, P. Breeding technologies to increase crop production in a changing world. Science 2010, 327, 818–822. [Google Scholar] [CrossRef] [PubMed]
- Shakoor, N.; Lee, S.; Mockler, T.C. High throughput phenotyping to accelerate crop breeding and monitoring of diseases in the field. Curr. Opin. Plant Biol. 2017, 38, 184–192. [Google Scholar] [CrossRef]
- Han, D.; Yang, G.; Yang, H.; Qiu, C.; Chen, M.; Wen, W.; Niu, Q.; Yang, W. Three Dimensional Information Extraction from Maize Tassel Based on Stereoscopic Vision; Chinese Society of Agricultural Engineering: Beijing, China, 2018. [Google Scholar]
- Geraldi, I.; Miranda Filho, J.; Vencovsky, R. Estimates of genetic parameters for tassel characters in maize (Zea mays L.) and breeding perspectives. Maydica 1985, 30, 1–14. [Google Scholar]
- Liu, J.; Bai, Z.; Wu, W. Evolution of main ear traits of maize hybrids and their effects on breeding objectives. Maize Sci. 2004, 12 (Suppl. S2), 3–4. [Google Scholar]
- Xu, G.; Wang, X.; Huang, C.; Xu, D.; Li, D.; Tian, J.; Chen, Q.; Wang, C.; Liang, Y.; Wu, Y. Complex genetic architecture underlies maize tassel domestication. New Phytol. 2017, 214, 852–864. [Google Scholar] [CrossRef]
- Berke, T.; Rocheford, T. Quantitative trait loci for tassel traits in maize. Crop Sci. 1999, 39, 1439–1443. [Google Scholar] [CrossRef]
- Upadyayula, N.; Da Silva, H.; Bohn, M.O.; Rocheford, T. Genetic and QTL analysis of maize tassel and ear inflorescence architecture. Theor. Appl. Genet. 2006, 112, 592–606. [Google Scholar] [CrossRef] [PubMed]
- Zhou, Y.; Kusmec, A.; Mirnezami, S.V.; Attigala, L.; Srinivasan, S.; Jubery, T.Z.; Schnable, J.C.; Salas-Fernandez, M.G.; Ganapathysubramanian, B.; Schnable, P.S. Identification and utilization of genetic determinants of trait measurement errors in image-based, high-throughput phenotyping. Plant Cell 2021, 33, 2562–2582. [Google Scholar] [CrossRef] [PubMed]
- Wang, X.; Li, J.; Han, L.; Liang, C.; Li, J.; Shang, X.; Miao, X.; Luo, Z.; Zhu, W.; Li, Z. QTG-Miner aids rapid dissection of the genetic base of tassel branch number in maize. Nat. Commun. 2023, 14, 5232. [Google Scholar] [CrossRef] [PubMed]
- Xhu, B.; Liu, F.; Che, Y.; Hui, F.; Ma, Y. Three-dimensional quantification of intercropping crops in field by ground and aerial photography. In Proceedings of the 2018 6th International Symposium on Plant Growth Modeling, Simulation, Visualization and Applications (PMA), Hefei, China, 4–8 November 2018; IEEE: Piscataway Township, NJ, USA, 2018; pp. 8–12. [Google Scholar] [CrossRef]
- Zhang, X.; Huang, C.; Wu, D.; Qiao, F.; Li, W.; Duan, L.; Wang, K.; Xiao, Y.; Chen, G.; Liu, Q. High-throughput phenotyping and QTL mapping reveals the genetic architecture of maize plant growth. Plant Physiol. 2017, 173, 1554–1564. [Google Scholar] [CrossRef]
- Das Choudhury, S.; Samal, A.; Awada, T. Leveraging image analysis for high-throughput plant phenotyping. Front. Plant Sci. 2019, 10, 508. [Google Scholar] [CrossRef] [PubMed]
- Das Choudhury, S.; Maturu, S.; Samal, A.; Stoerger, V.; Awada, T. Leveraging image analysis to compute 3D plant phenotypes based on voxel-grid plant reconstruction. Front. Plant Sci. 2020, 11, 521431. [Google Scholar] [CrossRef] [PubMed]
- Hartmann, A.; Czauderna, T.; Hoffmann, R.; Stein, N.; Schreiber, F. HTPheno: An image analysis pipeline for high-throughput plant phenotyping. BMC Bioinform. 2011, 12, 148. [Google Scholar] [CrossRef]
- Gage, J.L.; Miller, N.D.; Spalding, E.P.; Kaeppler, S.M.; de Leon, N. TIPS: A system for automated image-based phenotyping of maize tassels. Plant Methods 2017, 13, 21. [Google Scholar] [CrossRef] [PubMed]
- Klukas, C.; Chen, D.; Pape, J.-M. Integrated analysis platform: An open-source information system for high-throughput plant phenotyping. Plant Physiol. 2014, 165, 506–518. [Google Scholar] [CrossRef] [PubMed]
- Gibbs, J.A.; Pound, M.; French, A.P.; Wells, D.M.; Murchie, E.; Pridmore, T. Approaches to three-dimensional reconstruction of plant shoot topology and geometry. Funct. Plant Biol. 2016, 44, 62–75. [Google Scholar] [CrossRef] [PubMed]
- Li, J.; Tang, L. Developing a low-cost 3d plant morphological traits characterization system. Comput. Electron. Agric. 2017, 143, 1–13. [Google Scholar] [CrossRef]
- Yang, W.; Guo, Z.; Huang, C.; Duan, L.; Chen, G.; Jiang, N.; Fang, W.; Feng, H.; Xie, W.; Lian, X. Combining high-throughput phenotyping and genome-wide association studies to reveal natural genetic variation in rice. Nat. Commun. 2014, 5, 5087. [Google Scholar] [CrossRef]
- Guo, W.; Fukatsu, T.; Ninomiya, S. Automated characterization of flowering dynamics in rice using field-acquired time-series rgb images. Plant Methods 2015, 11, 7. [Google Scholar] [CrossRef]
- Lu, H.; Cao, Z.; Xiao, Y.; Fang, Z.; Zhu, Y.; Xian, K. Fine-grained maize tassel trait characterization with multi-view representations. Comput. Electron. Agric. 2015, 118, 143–158. [Google Scholar] [CrossRef]
- Kükenbrink, D.; Schneider, F.D.; Leiterer, R.; Schaepman, M.E.; Morsdorf, F. Quantification of hidden canopy volume of airborne laser scanning data using a voxel traversal algorithm. Remote Sens. Environ. 2017, 194, 424–436. [Google Scholar] [CrossRef]
- Kunz, M.; Hess, C.; Raumonen, P.; Bienert, A.; Hackenberg, J.; Maas, H.; Härdtle, W.; Fichtner, A.; Von Oheimb, G. Comparison of wood volume estimates of young trees from terrestrial laser scan data. iFor. Biogeosci. For. 2017, 10, 451–458. [Google Scholar] [CrossRef]
- Thapa, S.; Zhu, F.; Walia, H.; Yu, H.; Ge, Y. A novel LiDAR-based instrument for high-throughput, 3D measurement of morphological traits in maize and sorghum. Sensors 2018, 18, 1187. [Google Scholar] [CrossRef]
- Paulus, S.; Behmann, J.; Mahlein, A.-K.; Plümer, L.; Kuhlmann, H. Low-cost 3d systems: Suitable tools for plant phenotyping. Sensors 2014, 14, 3001–3018. [Google Scholar] [CrossRef] [PubMed]
- Chaivivatrakul, S.; Tang, L.; Dailey, M.N.; Nakarmi, A.D. Automatic morphological trait characterization for corn plants via 3d holographic reconstruction. Comput. Electron. Agric. 2014, 109, 109–123. [Google Scholar] [CrossRef]
- Wu, S.; Wen, W.; Gou, W.; Lu, X.; Zhang, W.; Zheng, C.; Xiang, Z.; Chen, L.; Guo, X. A miniaturized phenotyping platform for individual plants using multi-view stereo 3D reconstruction. Front. Plant Sci. 2022, 13, 897746. [Google Scholar] [CrossRef]
- Xu, B.; Wan, X.; Yang, H.; Feng, H.; Fu, Y.; Cen, H.; Wang, B.; Zhang, Z.; Li, S.; Zhao, C. TIPS: A three-dimensional phenotypic measurement system for individual maize tassel based on TreeQSM. Comput. Electron. Agric. 2023, 212, 108150. [Google Scholar] [CrossRef]
- Song, D. Clustering Study of Gene Expression Data Based on Gaussian Mixture Model. Ph.D. Thesis, Jiangsu University, Zhenjiang, China, 2015. [Google Scholar]
- Minton, R.L. Morphometrics Suggest Reduced Diversity in the Freshwater Snail Genus Gyrotoma Shuttleworth, 1845 (Gastropoda: Pleuroceridae). Ann. Carnegie Mus. 2021, 87, 79–88. [Google Scholar] [CrossRef]
- Yang, M.-S.; Chang-Chien, S.-J.; Nataliani, Y. Unsupervised fuzzy model-based Gaussian clustering. Inf. Sci. 2019, 481, 1–23. [Google Scholar] [CrossRef]
- Fuchs, R.; Pommeret, D.; Viroli, C. Mixed Deep Gaussian Mixture Model: A clustering model for mixed datasets. Adv. Data Anal. Classif. 2022, 16, 31–53. [Google Scholar] [CrossRef]
- Yang, X.; Gao, S.; Xu, S.; Zhang, Z.; Prasanna, B.M.; Li, L.; Li, J.; Yan, J. Characterization of a global germplasm collection and its potential utilization for analysis of complex quantitative traits in maize. Mol. Breed. 2010, 28, 511–526. [Google Scholar] [CrossRef]
- Pan, C.-X.; Hu, Y.; Ji, H.-B.; Li, Y.-M.; Chen, N.-L. Phenotypic diversity and clustering analysis of watermelon germplasm. J. Plant Genet. Resour. 2015, 16, 59–63. [Google Scholar]
- Xie, Z.; Chen, S.; Gao, G.; Li, H.; Wu, X.; Meng, L.; Ma, Y. Evaluation of rapeseed flowering dynamics for different genotypes with UAV platform and machine learning algorithm. Precis. Agric. 2022, 23, 1688–1706. [Google Scholar] [CrossRef]
- Han, L.; Yang, G.; Dai, H.; Yang, H.; Xu, B.; Feng, H.; Li, Z.; Yang, X. Fuzzy clustering of maize plant-height patterns using time series of UAV remote-sensing images and variety traits. Front. Plant Sci. 2019, 10, 926. [Google Scholar] [CrossRef]
- Rincón Sánchez, F.; Johnson, B.; Crossa, J.; Taba, S. Cluster analysis, an approach to sampling variability in maize accessions. Agric. Food Sci. 1996, 41, 4. [Google Scholar]
- Shrestha, J. Cluster analysis of maize inbred lines. J. Nepal Agric. Res. Counc. 2016, 2, 33–36. [Google Scholar] [CrossRef]
- Pritchard, J.K.; Stephens, M.; Rosenberg, N.A.; Donnelly, P. Association mapping in structured populations. Am. J. Hum. Genet. 2000, 67, 170–181. [Google Scholar] [CrossRef]
- Falush, D.; Stephens, M.; Pritchard, J.K. Inference of population structure using multilocus genotype data: Linked loci and correlated allele frequencies. Genetics 2003, 164, 1567–1587. [Google Scholar] [CrossRef] [PubMed]
- Furukawa, Y.; Ponce, J. Accurate, dense, and robust multiview stereopsis. IEEE Trans. Pattern Anal. Mach. Intell. 2009, 32, 1362–1376. [Google Scholar] [CrossRef]
- Wu, C.; Zhan, S. Three-dimensional face modeling of SFM algorithm based on gabor feature. J. Hefei Univ. Technol. Nat. Sci. Ed. 2017, 40, 180–185. [Google Scholar] [CrossRef]
- Dassot, M.; Colin, A.; Santenoise, P.; Fournier, M.; Constant, T. Terrestrial laser scanning for measuring the solid wood volume, including branches, of adult standing trees in the forest environment. Comput. Electron. Agric. 2012, 89, 86–93. [Google Scholar] [CrossRef]
- Calders, K.; Newnham, G.; Burt, A.; Murphy, S.; Raumonen, P.; Herold, M.; Culvenor, D.; Avitabile, V.; Disney, M.; Armston, J. Nondestructive estimates of above-ground biomass using terrestrial laser scanning. Methods Ecol. Evol. 2015, 6, 198–208. [Google Scholar] [CrossRef]
- Raumonen, P.; Casella, E.; Calders, K.; Murphy, S.; Åkerblom, M.; Kaasalainen, M. Massive-scale tree modelling from TLS data. ISPRS Ann. Photogramm. Remote Sens. Spat. Inf. Sci. 2015, 2, 189–196. [Google Scholar] [CrossRef]
- Raumonen, P.; Kaasalainen, M.; Åkerblom, M.; Kaasalainen, S.; Kaartinen, H.; Vastaranta, M.; Holopainen, M.; Disney, M.; Lewis, P. Fast automatic precision tree models from terrestrial laser scanner data. Remote Sens. 2013, 5, 491–520. [Google Scholar] [CrossRef]
- Hackenberg, J.; Spiecker, H.; Calders, K.; Disney, M.; Raumonen, P. SimpleTree—An efficient open source tool to build tree models from TLS clouds. Forests 2015, 6, 4245–4294. [Google Scholar] [CrossRef]
- Delagrange, S.; Jauvin, C.; Rochon, P. PypeTree: A tool for reconstructing tree perennial tissues from point clouds. Sensors 2014, 14, 4271–4289. [Google Scholar] [CrossRef]
- Moorthy, S.M.K.; Raumonen, P.; Van den Bulcke, J.; Calders, K.; Verbeeck, H. Terrestrial laser scanning for non-destructive estimates of liana stem biomass. For. Ecol. Manag. 2020, 456, 117751. [Google Scholar] [CrossRef]
- Hackenberg, J.; Morhart, C.; Sheppard, J.; Spiecker, H.; Disney, M. Highly accurate tree models derived from terrestrial laser scan data: A method description. Forests 2014, 5, 1069–1105. [Google Scholar] [CrossRef]
- Wei, X. EM Algorithm and Its Initialization for Parameter Estimation of Gaussian Mixture Models. Electron. Testing. 2011, 6, 26–30. [Google Scholar] [CrossRef]
- Xing, C.; Zhao, Q.; Wang, X. Research on accelerated EM algorithm based on robust Gaussian mixture model. Comput. Appl. Res. 2017, 4, 1042–1046. [Google Scholar]
- Wu, T. Application of Gaussian Mixture Model Based on EM Algorithm in Iris Dataset. Netw. Secur. Technol. Appl. 2022, 4, 47–49. [Google Scholar]
Disclaimer/Publisher’s Note: The statements, opinions and data contained in all publications are solely those of the individual author(s) and contributor(s) and not of MDPI and/or the editor(s). MDPI and/or the editor(s) disclaim responsibility for any injury to people or property resulting from any ideas, methods, instructions or products referred to in the content. |
© 2025 by the authors. Licensee MDPI, Basel, Switzerland. This article is an open access article distributed under the terms and conditions of the Creative Commons Attribution (CC BY) license (https://creativecommons.org/licenses/by/4.0/).