1. Introduction
Rice (
Oryza sativa L.), a staple food for more than half of the world’s population, is particularly sensitive to environmental variations. Its growth and yield are significantly influenced by microclimatic factors such as temperature, humidity, and wind patterns [
1]. Despite extensive research on precision agriculture practices, gaps remain in understanding how UAV-induced airflow can be harnessed to engineer microclimates that enhance physiological traits and yield during critical growth stages in rice cultivation. Dynamic microclimate engineering through UAV rotor airflow can positively impact rice growth, yield, and physiological traits, especially during key developmental phases. By manipulating airflow, it is expected that the microclimate can be optimized to improve factors such as canopy temperature regulation, nutrient uptake, and water efficiency, which are crucial for the productivity of rice [
2]. Combining UAV technology with microclimate engineering principles to investigate their synergistic effects on rice.
The advent of precision agriculture has revolutionized traditional farming practices, enabling enhanced crop management through advanced technologies. Among these innovations, unmanned aerial vehicles (UAVs) have emerged as a powerful tool for optimizing agricultural processes. Their ability to monitor, analyze, and influence crop growth dynamics has positioned UAVs at the forefront of modern agronomy.
The increasing use of rotor aircraft in precision agriculture has revolutionized crop management, enhancing tasks such as crop monitoring, mapping, and the application of pesticides and fertilizers. Rotor aircraft are becoming increasingly prominent in precision farming, where their airflow directly affects the microclimate around the plants. This airflow can alter key microenvironmental factors such as temperature, humidity, CO
2 concentration [
3], and pollination patterns, ultimately impacting plant physiology and development [
4]. Rotor aircraft have also demonstrated the ability to alter microclimates through their airflow, offering new opportunities for optimizing crop environments, particularly in rice cultivation. The impact of rotor aircraft airflow on agro-meteorology and its relationship with microclimate engineering, focusing on how it influences crop production, is a critical area of study as it affects key environmental factors such as temperature, humidity, CO
2 levels, and air circulation around the plants, which in turn influence plant physiology [
5], growth, yield, and overall agricultural productivity [
2,
5]. To explore the novel potential of rotor aircraft airflow to engineer microclimates and its effects on rice crops, with a unique focus on how flight timing during different parts of the day at the plant’s different growth stages may influence crop growth and productivity. During flight, rotor aircraft produce substantial airflow, modulating critical microclimate parameters that intricately influence plant physiological functioning, ultimately impacting crop growth, development, and productivity. Given the sensitivity of rice crops to these microclimatic variables, particularly during critical developmental stages such as tillering, flowering, and grain filling, manipulating these environmental factors via rotor aircraft airflow represents an innovative approach to improving crop performance under field conditions [
6]. Rotor aircraft airflow also holds potential for reducing the spread of diseases and pests by lowering leaf moisture and inhibiting condensation [
7]. However, concerns have been raised about possible negative effects, such as crop lodging and flower shattering, which could impact fertilization. Therefore, integrating rotor aircraft airflow with operational flights for pesticide, fertilizer, and water applications presents a key engineering challenge in minimizing such adverse effects [
8]. This study hypothesizes that the timing of rotor aircraft flights plays a critical role in the extent of microclimate alteration and its subsequent impact on rice growth and productivity, providing insights into how rotor airflow can be used as a precision tool to regulate crop environments.
Microclimates play a crucial role in determining plant biomass and productivity, with temperature and humidity being two of the most influential factors [
9]. Both air and canopy temperatures are critical to plant growth, and rotor aircraft airflow can disturb air circulation, affecting crop growth and yield traits [
10]. By disrupting the air within the plant’s microenvironment, the airflow helps regulate the micro-meteorological conditions around the crops, influencing processes such as transpiration and photosynthesis [
11]. It has been documented that air disturbances improve seedling growth by promoting more effective air exchange, even though CO
2 concentrations may remain relatively unchanged [
1,
11]. Airflow can reduce leaf and canopy temperatures, mitigating the effects of solar radiation and promoting optimal growth conditions. This process influences crop physiological traits, such as root-to-shoot ratio, transpiration rate, and dry matter accumulation [
12]. By enhancing airflow, rotor aircraft may alleviate these issues, improving energy exchange and CO
2 diffusion, leading to better crop growth and higher yields [
13].
3. Results
3.1. Aero-Thermodynamic Distribution over the Rice Canopy
3.1.1. Rice Heading Stage
The rice growth stages (heading, panicle, and flowering) are critically influenced by microclimatic factors, such as wind speed and temperature, as illustrated by dynamic changes at three specific times (9:00 a.m., 12:00 p.m., and 3:00 p.m.). The wind temperature at 9:00 a.m. varies across the area, with values ranging from 28.49 °C to 29.12 °C (
Figure 5a). The increase in temperature within specific zones of the contour indicates a localized warming effect, with a maximum increase of around 2.2% relative to the lower temperature areas.
Figure 5b shows the wind speed at 9:00 a.m., with the highest speed recorded at 2.168 m/s near the center, representing an increase of about 187% compared to the lowest edge speed of 0.755 m/s. This enhanced airflow in the central region suggests that the rotor’s downwash significantly elevates wind speed, potentially enhancing ventilation and reducing the risk of humidity buildup within the rice canopy. At 12:00 p.m.,
Figure 5c presents wind temperature contours with slight changes, ranging from around 28.43 °C to 29.02 °C. These variations correspond to an increase of approximately 2.1% in the highest temperature areas, indicating continued microclimate modification.
Figure 5d shows wind speed at 12:00 p.m., with peak values reaching 5.595 m/s, a significant increase of roughly 321% over the lowest edge speed of 0.169 m/s. This substantial rise in wind speed may facilitate improved airflow around the rice plants, reducing heat stress and supporting transpiration.
Figure 5e reveals wind temperature values between 28.46 °C and 29.18 °C at 3:00 p.m. in the afternoon, showing an increase of about 2.5% in warmer areas, which may contribute to a regulated microenvironment around the plants during the warmest part of the day.
Figure 5f shows the wind speed at 3:00 p.m., with values reaching 1.050 m/s, representing a 133% increase from the lowest recorded speed of 0.450 m/s. This reduction in peak wind speed compared to earlier times may indicate a gradual dissipation of rotor influence, allowing for moderated airflow as the day progresses. The novel capability of a rotor-induced wind wall to create distinct microclimate zones around rice plants during the heading stage, with fluctuations in temperature and wind speed, could strategically mitigate stress and enhance growth. The observed increases and decreases in temperature and wind speed throughout the day—ranging up to 321% in wind speed and 2.5% in temperature—showcase the potential for UAV-induced microclimate engineering to optimize conditions for rice development, ultimately aiming to improve yield and crop resilience under variable environmental conditions.
3.1.2. Rice Panicle Stage
The novel impact of a rotor-induced wind wall on wind temperature and speed at three distinct times—9:00 a.m., 12:00 p.m., and 3:00 p.m.—during the critical rice panicle stage presents both beneficial and potentially challenging effects for rice development.
Figure 6a shows wind temperature ranging from 28.13 °C to 28.76 °C at 9:00 a.m., with localized warming leading to a 2.2% increase in certain areas. This early-morning rise in temperature, driven by rotor airflow, may promote a favorable microenvironment by gently warming the crop and reducing the risk of cool-morning stress. However, excessive warming in some regions could potentially stress the panicle stage if it moves beyond the optimal temperature thresholds.
Figure 6b presents wind speed at 9:00 a.m., which varies from 0.2756 m/s at the edges to a peak of 0.9694 m/s in the central area—a 252% increase. This surge in wind speed provides improved ventilation, lowering humidity levels and decreasing the risk of disease. However, high wind speeds could also disrupt pollen distribution, possibly impacting fertilization efficiency at the panicle stage. At 12:00 p.m., as shown in
Figure 6c, the wind temperature ranges between 28.02 °C and 28.56 °C, with localized increases of approximately 1.9%. This midday stability in temperature helps in preventing heat stress during peak sunlight hours, maintaining a controlled environment around the plants. However, marginal temperature rises in specific regions could introduce mild stress if they exceed the ideal conditions for the panicle stage.
Figure 6d displays the wind speed at 12:00 p.m., with values between 0.4478 m/s and 0.9863 m/s, representing a notable increase of around 120% from the lowest to the highest wind speed. This airflow boost enhances transpiration and cooling around the panicles, providing relief from midday heat. On the other hand, excessive airflow could lead to physical strain on delicate panicle structures, possibly impairing stability.
Figure 6e indicates a slight temperature decrease by 3:00 p.m., with wind temperature values ranging from 27.79 °C to 28.52 °C, reflecting a reduction of about 2.6% compared to peak midday temperatures. This decline supports the crop by mitigating potential heat buildup as the day cools, offering a balanced environment that prevents sudden temperature drops. In
Figure 6f, wind speeds at 3:00 p.m. show values between 0.190 m/s and 1.320 m/s, an increase of 595% from the lowest to the highest recorded speeds. Although high wind speeds provide beneficial airflow and prevent moisture accumulation, which could foster fungal growth, they may also lead to increased evapotranspiration, potentially causing moisture stress in the panicles if not managed effectively. The innovative application of rotor airflow to create dynamic microclimate variations during the rice panicle stage. The observed increases and decreases—up to 252% in wind speed at 9:00 a.m., 120% at 12:00 p.m., and 595% at 3:00 p.m.—along with temperature changes of approximately 2.2% in the morning, 1.9% at noon, and a 2.6% decrease in the afternoon, underscore the significant role of UAV-induced microclimate engineering. This approach shows promise in optimizing conditions for rice panicle development, with the potential to improve crop resilience, yield, and quality while balancing the delicate needs of the panicle stage.
3.1.3. Rice Flowering Stage
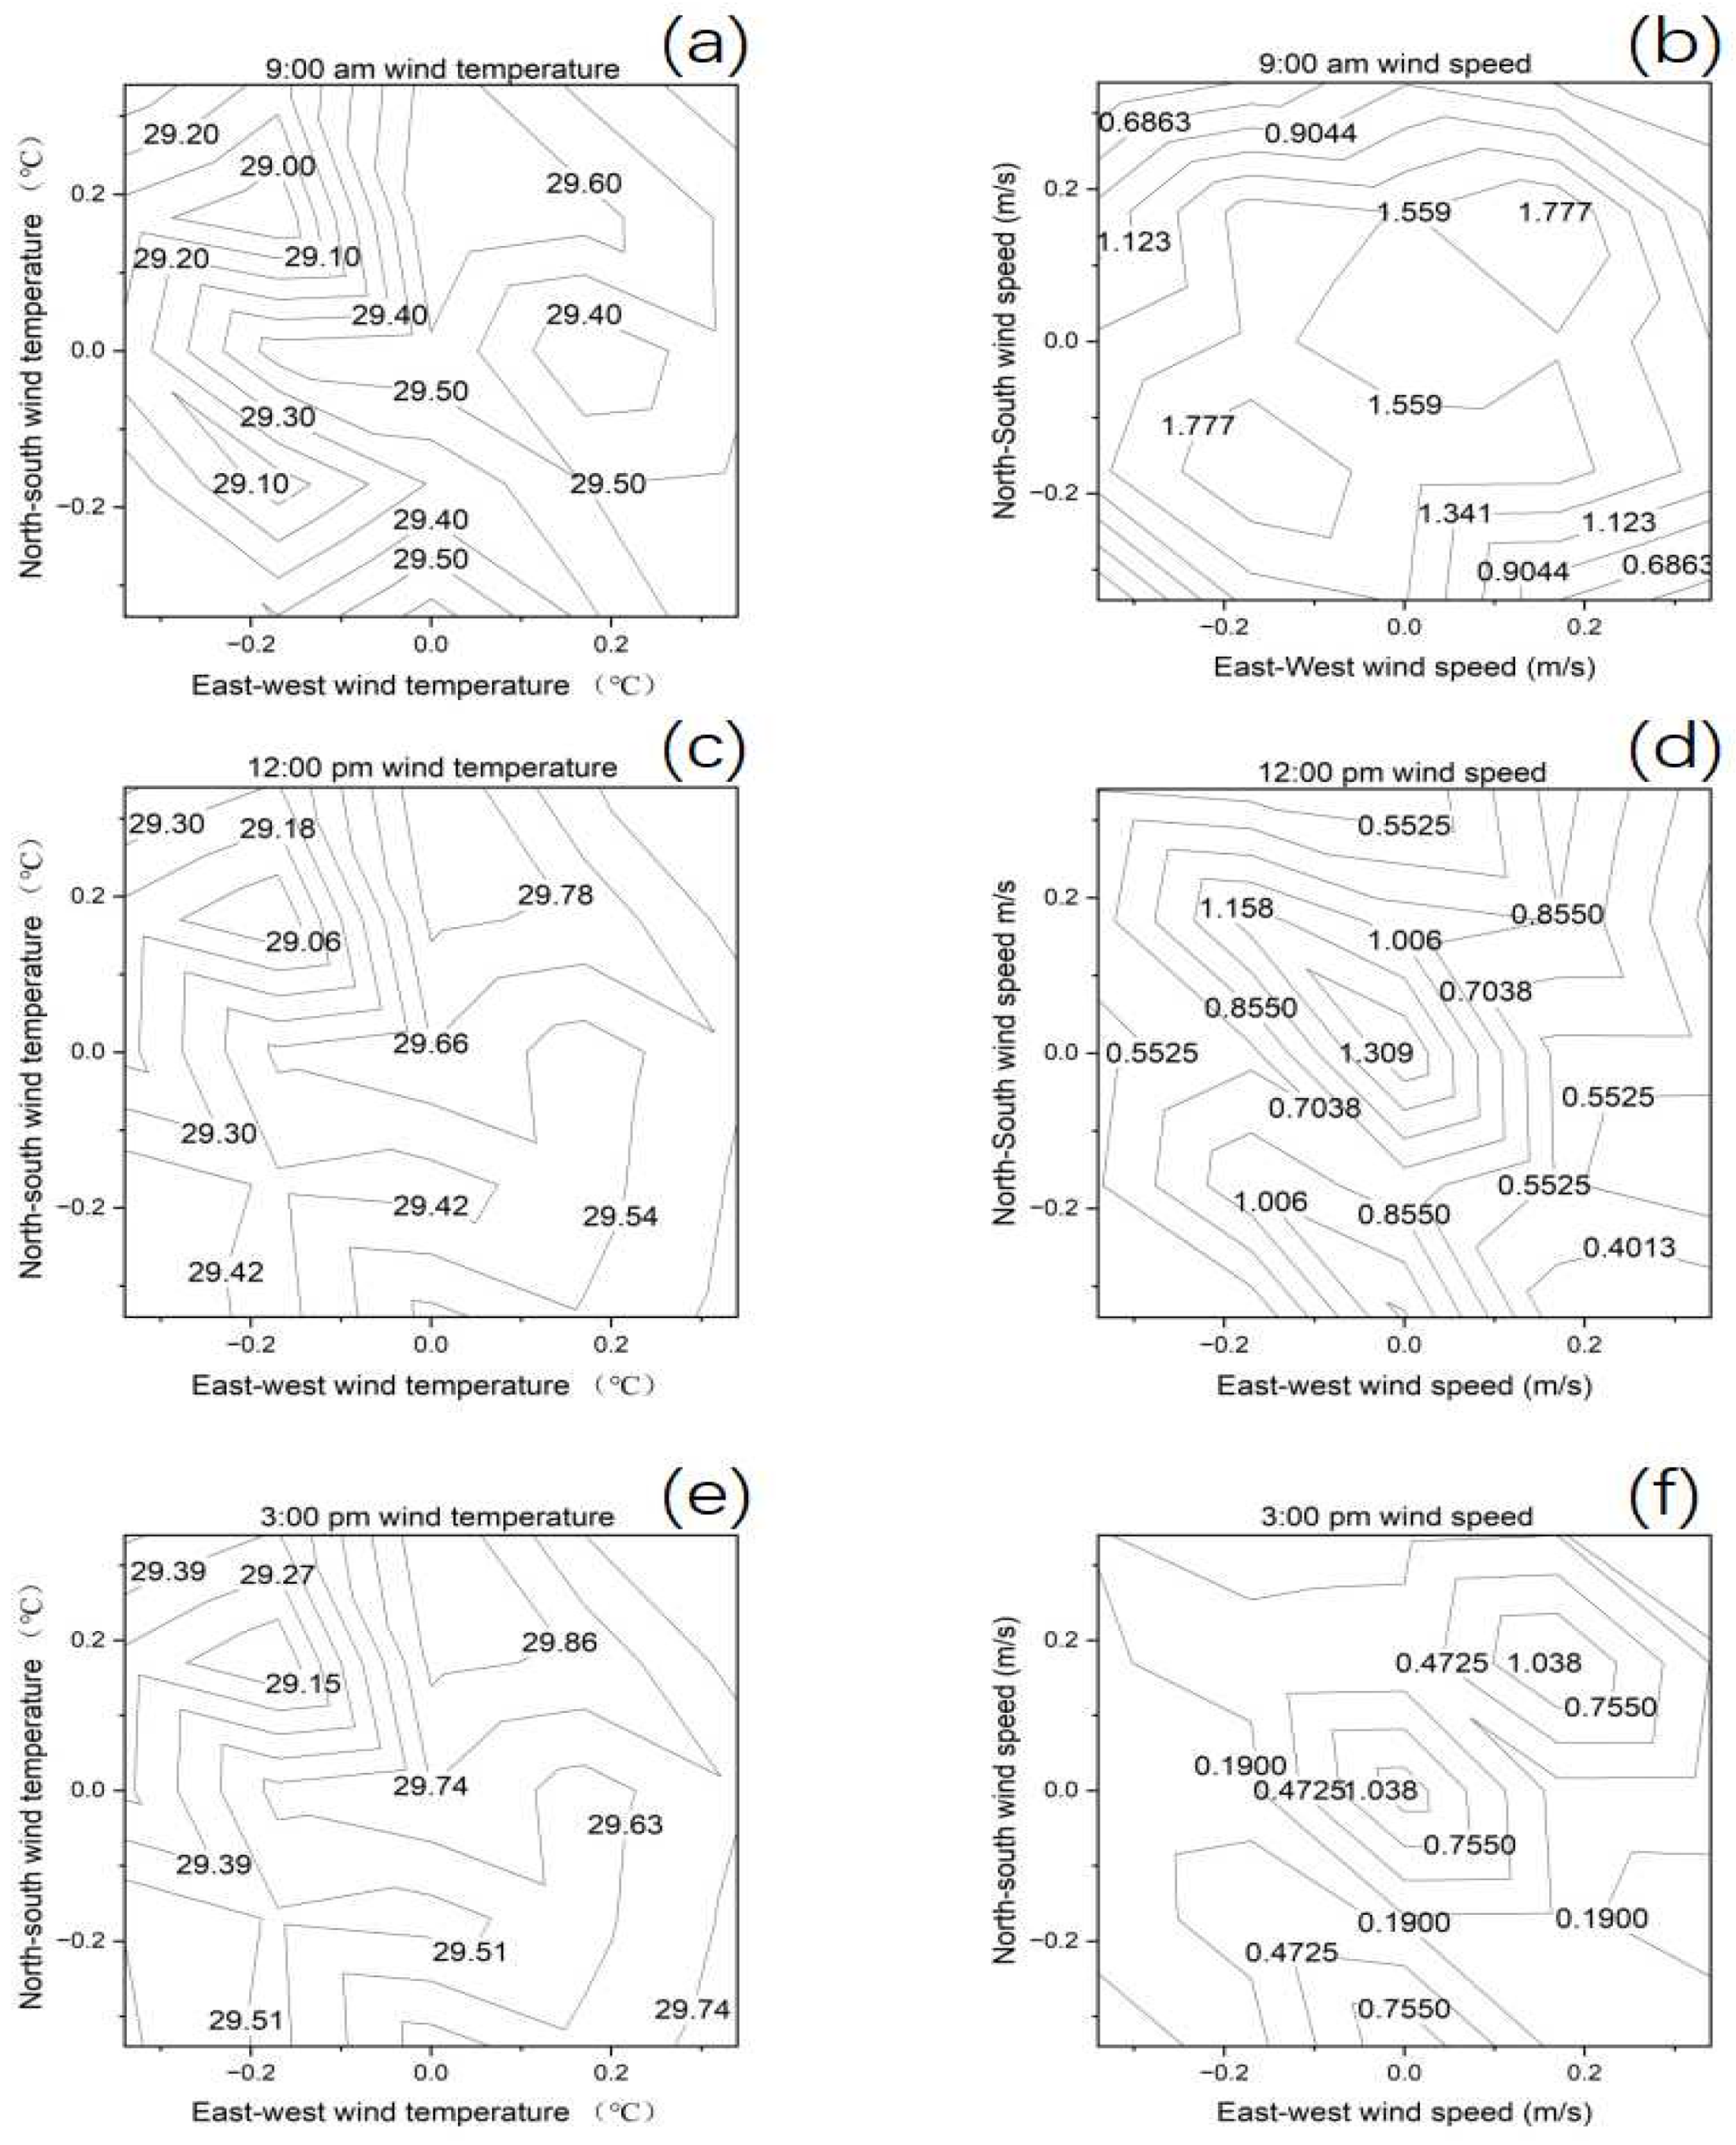
This figure provides insights into the microclimate modifications introduced by rotor airflow at three different times—9:00 a.m., 12:00 p.m., and 3:00 p.m.—during the rice flowering stage, a critical period for yield formation. Each subplot shows variations in wind temperature and wind speed caused by rotor-induced airflow, highlighting both beneficial and potentially adverse impacts on the microenvironment. In
Figure 7a, the wind temperature at 9:00 a.m. ranges from 29.10 °C to 29.50 °C, with localized increases contributing to a slight warming effect. This increase of around 1.4% can create a favorable morning environment by reducing humidity, which may help prevent early-day moisture accumulation in the rice flowers, thus lowering the risk of fungal diseases. However, excessive warmth could induce mild stress if the temperatures exceed the optimal range for the flowering stage.
Figure 7b shows the wind speed at 9:00 a.m., with values between 0.6863 m/s and 1.777 m/s, marking a significant increase of approximately 159%. Such elevated wind speeds enhance ventilation around the rice flowers, reducing humidity and facilitating pollen movement, which is beneficial for pollination. Yet, high wind speeds could potentially dislodge pollen or damage delicate floral structures. At 12:00 p.m.,
Figure 7c presents wind temperatures ranging from 29.18 °C to 29.78 °C, showing a slight increase of about 2.0%. This midday temperature range is generally within acceptable limits for rice, supporting optimal flower development by preventing overheating. Nonetheless, localized temperature increases could lead to mild stress in sensitive areas, impacting flower viability.
Figure 7d indicates wind speed at noon, ranging from 0.4013 m/s to 1.158 m/s, reflecting an increase of around 189%. This airflow helps regulate temperature around the flowers and prevent excessive moisture buildup, which is beneficial for maintaining flower integrity and enhancing the likelihood of successful fertilization. However, if wind speeds are too high, they might interfere with stable pollen distribution, potentially impacting the flowering process.
Figure 7e shows wind temperature variation between 29.15 °C and 29.86 °C, a 2.4% rise, at 3:00 p.m. in the afternoon. This slight cooling effect towards the end of the day supports flower resilience by preventing sharp temperature drops, which could otherwise lead to floral stress.
Figure 7f presents wind speed values ranging from 0.190 m/s to 1.038 m/s, marking an increase of about 446% from the lowest to highest recorded speeds. This late-afternoon airflow provides beneficial cooling and prevents moisture retention around the flowers. While helpful, excessive wind speeds could lead to unintended stress on the flowers if airflow is too forceful. UAV rotor-induced wind walls to engineer microclimates during the rice flowering stage, with observed increases in wind speed of up to 159% in the morning, 189% at noon, and 446% in the afternoon, alongside temperature variations of up to 2.4%, are a critical strategy for optimizing rice yields. These adjustments demonstrate the potential of UAV rotor airflow to balance temperature and airflow around the rice crop, optimizing conditions for flowering while carefully managing the risk of overexposure to wind or heat.
3.2. Growth and Yield Metrics in Rice Under UAV Airflow Dynamics
Microclimate engineering through rotor wind wall airflow at different times of day and across various growth stages of rice significantly impacted key crop growth parameters. The rotor airflow treatments applied at 9:00 a.m., 12:00 p.m., and 3:00 p.m. influenced stem diameter, canopy temperature, grain filling duration, productive tillers, total tillers, and flag leaf area, each showing varied responses based on the timing of airflow exposure and rice growth stage (
Table 1). Stem diameter, a critical indicator of plant vigor, showed a marked increase under the 9:00 a.m. airflow treatment during the flowering stage, rising by 33.33% compared to the control. The 12:00 p.m. airflow treatment during the flowering stage also produced a 29.17% increase in stem diameter, demonstrating the beneficial effect of rotor airflow during the critical growth stages. However, airflow at 3:00 p.m. during the heading stage led to a 4.17% decrease in stem diameter, indicating that later airflow may negatively impact early growth stages (
Table 1). Canopy temperature, an essential factor in rice microclimate regulation, increased by 4.51% during the heading stage under the 9:00 a.m. airflow. In contrast, the 12:00 p.m. airflow treatment during the panicle stage resulted in a 4.51% decrease in canopy temperature, suggesting that midday airflow can help reduce heat stress during the sensitive growth stages. The 3:00 p.m. treatment, particularly during the panicle stage, raised canopy temperature by 4.89%, potentially accelerating crop maturity. Grain filling duration, a key determinant of yield, showed a reduction by 8% under the 9:00 a.m. airflow during the panicle stage, indicating an expedited grain development process. Both the 12:00 p.m. and 3:00 p.m. treatments maintained similar durations of 24 days across stages, with the flowering stage showing no deviations, aligning with the control’s 26 days. Productive tillers, essential for higher grain output, increased by 30.77% under both the 9:00 a.m. and 12:00 p.m. airflow during the flowering stage. Interestingly, the 9:00 a.m. airflow treatment saw a 7.69% decrease in productive tillers during the heading stage, suggesting that early airflow may suppress initial tiller formation. However, later airflow during the flowering stage proved beneficial across all schedules, with tiller numbers consistently surpassing the control. Total tillers showed notable improvements under the 9:00 a.m. airflow treatment during the flowering stage, with an increase of 20% over the control. The 12:00 p.m. airflow during the panicle stage also yielded a 13.33% increase in total tillers, reflecting the positive effects of rotor airflow in promoting tiller growth during peak vegetative stages (
Table 1).
Flag leaf area, a vital trait for photosynthetic efficiency, displayed significant enhancement under microclimate engineering. The 9:00 a.m. airflow treatment during the flowering stage resulted in a 38.64% increase in the flag leaf area. Notably, the 12:00 p.m. airflow during the panicle stage led to an extraordinary 137.02% increase, highlighting the pronounced effect of midday airflow on the expanding leaf area, which is critical for supporting grain filling. However, the same 12:00 p.m. airflow during the flowering stage caused a 51.96% decrease in flag leaf area, indicating that precise timing is necessary to avoid negative impacts on leaf development. This demonstrates that rotor airflow at different times of day, particularly 9:00 a.m. and 12:00 p.m., significantly modulated the rice crop’s microclimate, improving key growth parameters. The most notable improvements were observed in stem diameter, flag leaf area, and productive tiller count during the flowering and panicle stages, suggesting that strategic rotor airflow can enhance rice crop performance and yield. The results indicate that microclimate engineering using UAV rotor airflow is a promising approach for optimizing growth, especially when applied at optimal times during sensitive growth stages.
3.3. Microclimate Engineering and Rice Yield and Agronomic Performance
Rotor airflow had significant interactions with rice physiological parameters, revealing nuanced effects on grain set, spikelet fertility, and other yield-related components (
Table 2). Grain set (%) variation with the application of rotor airflow at 9:00 a.m. during the flowering stage demonstrated a 2.48% increase in grain set (97.14%) relative to the control (94.79%), indicating enhanced reproductive success under early-day airflow. Conversely, during the heading stage, grain set decreased by 2.12% (92.78%), suggesting that airflow during the early developmental stages might have a negative impact on grain formation. The 12:00 p.m. treatment exhibited stable grain set values during the heading stage (94%), with a marginal decrease of 2.57% during both the panicle and flowering stages. However, the 3:00 p.m. treatment resulted in the most substantial reduction in grain set during the heading stage, showing a 4.1% decline (90.9%), highlighting the sensitivity of rice to late-day airflow during the critical reproductive phases.
The number of filled grains with rotor-induced airflow led to an overall positive response in filled grain numbers, especially during the flowering stage. The 9:00 a.m. treatment during this stage resulted in a 12.09% increase in filled grains (102) compared to the control (91), while the panicle stage saw a modest improvement of 2.19%. The 12:00 p.m. airflow during the heading stage showed a 3.29% increase in filled grains (94), consistent with a slight enhancement in grain development. However, late-afternoon airflow at 3:00 p.m. exhibited only minor improvements, with the highest response being a 2.2% increase during the flowering stage. The number of empty grains had a notable rise under rotor airflow at specific stages. The 9:00 a.m. treatment during the heading stage increased empty grains by 40% (7 grains) compared to the control (5 grains), suggesting potential disruptions in pollination or grain filling due to early-day airflow. Similarly, during the panicle stage, the number of empty grains increased by 60% (8 grains). The 12:00 p.m. treatment caused a 20% increase in empty grains during the heading stage and maintained elevated levels across later stages. The most significant increase occurred during the 3:00 p.m. treatment in the heading stage, where empty grains rose by 75%, emphasizing the possible negative impact of rotor airflow during early reproductive growth under afternoon conditions.
The total spikelet number responded to rotor airflow, generally promoting an increase in the number of spikelets per panicle. The 9:00 a.m. treatment during the panicle stage saw a 5.21% increase (101 spikelets) compared to the control (96 spikelets). The 3:00 p.m. airflow during the flowering stage also led to a 2.08% increase (104 spikelets), indicating a positive response to airflow during the reproductive stages. The 12:00 p.m. treatment resulted in a slight improvement across all stages, with the flowering stage producing 103 spikelets, suggesting consistent spikelet development under midday airflow. Spikelet fertility (%), a key determinant of rice yield, responded positively to rotor airflow during the flowering stage. The 9:00 a.m. treatment increased spikelet fertility by 2.48% (97.14%) over the control, underscoring the beneficial effects of airflow during peak reproductive activity. Conversely, the 3:00 p.m. treatment during the heading stage caused a 4.09% decrease (90.9%), pointing to a detrimental impact of late-day airflow on the early reproductive stages. The 12:00 p.m. treatment maintained spikelet fertility values close to the control, suggesting that airflow during midday had a neutral effect on this parameter. Panicle weight (g) varied according to treatment time and growth stage. The 9:00 a.m. airflow during the heading stage increased panicle weight by 12.9% (3.5 g) relative to the control (3.1 g), indicating enhanced grain development under early-day airflow. However, the panicle and flowering stages under this treatment showed no significant difference from the control. The 12:00 p.m. treatment during the heading stage also resulted in a 6.45% increase in panicle weight (3.3 g). The 3:00 p.m. treatment had negligible effects, with panicle weight remaining consistent with the control during the flowering stage. The findings from this study demonstrate the pivotal role of microclimate engineering using rotor-induced airflow in modulating rice crop growth and yield parameters. The 9:00 a.m. treatments during reproductive stages, especially at flowering, consistently improved grain set, filled grain numbers, spikelet fertility, and panicle weight, highlighting the potential of early-day airflow to enhance reproductive success and yield outcomes. In contrast, late-afternoon airflow at 3:00 p.m. had mixed effects, with significant reductions in grain set and spikelet fertility during earlier growth stages, suggesting that the timing of airflow application is critical to maximizing agronomic benefits. These results introduce novel insights into the interaction between engineered airflow and rice physiological responses, providing a basis for optimizing rotor airflow schedules to maximize crop yield. This study demonstrates that rotor-induced microclimates can enhance key yield determinants, such as spikelet fertility and panicle weight, and also underscores the potential trade-offs associated with airflow timing, especially during sensitive reproductive phases. The data presented here suggest that early-day airflow during flowering could serve as an agronomic intervention to improve rice yields in precision farming systems.
3.4. Rotor-Induced Airflow on Rice Yield Components at Different Stages
The rotor-induced airflow showed a significant impact (
Table 3) on the number of grains per panicle, with the 9:00 a.m. treatment during the flowering stage resulting in a notable increase of 12.09% (102 grains) compared to the control (91 grains). This suggests that early-morning airflow during the flowering stage enhances grain setting and development. Similarly, the panicle stage treatment at 9:00 a.m. led to a 2.2% increase in grains per panicle (93 grains). In contrast, the 3:00 p.m. treatment during the heading stage exhibited no improvement, remaining at 90 grains, which is equivalent to the control, indicating that late-afternoon airflow might not positively influence grain formation during the early reproductive stages (
Table 3). The interaction effect (RRS × GS) for grains per panicle was 0.034 for the 9:00 a.m. treatment, highlighting a relatively low interaction influence between timing and growth stage. For the 12:00 p.m. and 3:00 p.m. treatments, the interaction effect increased slightly, suggesting that rotor airflow applied later in the day interacts differently with rice growth stages, but still shows minimal impact on the number of grains per panicle.
Rotor airflow applied during the flowering stage at 9:00 a.m. resulted in a 30.77% increase in the number of panicles per plant (17 panicles) compared to the control (13 panicles), indicating that early airflow stimulates reproductive tillering. The 12:00 p.m. treatment during the flowering stage had a similar effect, with a 30.77% increase (17 panicles), suggesting that midday airflow also enhances tiller development. However, the 3:00 p.m. treatment during the heading stage showed no improvement over the control, remaining at 14 panicles. The interaction effect (RRS × GS) for panicles per plant was highest for the 3:00 p.m. treatment (0.030), indicating a stronger interaction between late-afternoon airflow and rice growth stage compared to the early-morning and midday treatments.
The number of paddies per plant was significantly influenced by rotor-induced airflow, particularly during the flowering stage. The 9:00 a.m. treatment during flowering resulted in a remarkable 46.55% increase in paddies per plant (1734 paddies) compared to the control (1183 paddies). This indicates that early airflow enhances the grain-filling potential of rice. The 12:00 p.m. treatment during the heading stage also showed an increase in paddies per plant, with a 11.24% improvement over the control. However, the 3:00 p.m. treatment during both the panicle and flowering stages showed more moderate increases, with paddies per plant ranging from 1260 to 1632, reflecting lesser responsiveness to late-afternoon airflow. The interaction effect for paddies per plant was highest in the 3:00 p.m. treatment (0.022), suggesting that late-afternoon airflow interacts more strongly with growth stages in influencing this parameter.
Biological yield was most improved under the 9:00 a.m. treatment during the heading stage, which exhibited a 38.37% increase (119 g plant−1) compared to the control (86 g plant−1), highlighting the significant role of early airflow in promoting overall biomass production. The 12:00 p.m. and 3:00 p.m. treatments resulted in slightly lower increases in biological yield during the heading and flowering stages, but still demonstrated improvements over the control. The flowering stage at 12:00 p.m. led to a 40.70% increase in biological yield (121 g plant−1), while the 3:00 p.m. treatment during the flowering stage resulted in a 39.53% increase (120 g plant−1). The interaction effect (RRS × GS) was 0.048 for the 9:00 a.m. treatment, reflecting the notable influence of rotor-induced airflow on biological yield, particularly when applied early in the day during critical growth stages.
The application of rotor airflow during the flowering stage at 9:00 a.m. resulted in a 70.75% increase in grain yield (43.2 g plant⁻1) compared to the control (25.3 g plant−1), underscoring the positive impact of airflow on final grain production. Similarly, the 12:00 p.m. treatment during flowering led to a 58.49% increase in grain yield (40.1 g plant−1). The 3:00 p.m. treatment during flowering showed a 53.75% increase (38.9 g plant−1), suggesting that while airflow during the flowering stage is beneficial, early and midday airflow are more effective in enhancing grain yield than late-afternoon airflow. The interaction effect (RRS × GS) for grain yield was 0.035 for the 9:00 a.m. treatment, while the 12:00 p.m. treatment exhibited a higher interaction effect (0.043), highlighting the importance of both timing and growth stage for maximizing grain yield.
The harvest index, an indicator of the efficiency of biomass conversion to grain, was significantly enhanced under rotor airflow. The 9:00 a.m. treatment during the flowering stage resulted in a 26.61% increase in the harvest index (37.24%) compared to the control (29.41%), while the 12:00 p.m. treatment during flowering showed a 24.56% improvement (33.14%). The 3:00 p.m. treatment during flowering also led to a substantial increase in the harvest index (32.41%), although this was lower than the earlier treatments. The interaction effect (RRS × GS) for the harvest index was 0.021 for the 9:00 a.m. treatment, while the 3:00 p.m. treatment showed a slightly lower interaction effect of 0.011. This study presents novel insights into the impact of microclimate engineering using rotor-induced airflow on rice growth and yield parameters. The results clearly demonstrate that early-day airflow at 9:00 a.m., particularly during the flowering stage, has the most profound effect on improving grain yield, biological yield, and harvest index. These increases, ranging from 70.75% in grain yield to 46.55% in paddies per plant, highlight the potential of rotor airflow as an agronomic tool to enhance rice productivity in precision farming systems. The timing of airflow application is critical, with midday airflow at 12:00 p.m. also showing significant improvements in yield components, although to a lesser extent than early-day airflow. Late-afternoon airflow at 3:00 p.m., while still beneficial, generally resulted in smaller increases across the measured parameters, suggesting that rice plants are less responsive to airflow interventions later in the day. The interaction effects between rotor-induced airflow and rice growth stages (RRS × GS) were generally low to moderate, indicating that while airflow timing plays a significant role, the growth stage at which it is applied is equally important for maximizing agronomic benefits. This study contributes to the growing body of knowledge on microclimate engineering in agriculture and presents new strategies for optimizing rice production through targeted airflow interventions.
3.5. Correlation Analysis Under Engineered Microclimates
This analysis offers novel insights into the trade-offs between biomass production, reproductive efficiency, and grain filling under engineered microclimate conditions created by UAV airflow. The negative correlations between biological yield and both grain set percentage and grain filling duration underscore the delicate balance between vegetative growth and grain production, which is crucial in optimizing crop performance in precision agriculture settings. Understanding these correlations provides valuable knowledge for developing strategies that enhance yield while managing physiological stress in rice, particularly when employing UAV technology to manipulate crop microclimates for improved productivity. The Pearson correlation matrix (
Figure 8) reveals a complex interplay between key agronomic and physiological traits in rice, shedding light on both positive and negative associations. Grain set percentage emerges as a pivotal trait, showing moderate positive correlations with stem diameter (0.39,
p < 0.05) and grain filling duration (0.33), indicating that thicker stems and longer grain filling periods are linked to a higher grain set. However, a notable negative correlation exists between the grain set percentage and biological yield (−0.70,
p < 0.001), suggesting that while biological yield (biomass) increases, the grain set percentage tends to decline. This trade-off highlights a key balance between the plant’s allocation of resources to biomass and reproductive structures.
The correlation between biological yield and grain yield is positive (0.38, p < 0.05), demonstrating that higher overall biomass production can boost grain yield, but at the same time, a negative correlation between biological yield and grain set percentage implies that an increase in biomass does not necessarily translate into higher reproductive success. Interestingly, grain yield also exhibits a negative correlation with grain filling duration (−0.46, p < 0.05), indicating that longer periods of grain filling might actually be detrimental to final grain yield, possibly due to resource competition or extended stress exposure. The role of stem diameter is significant, as it positively correlates with grain set percentage (0.39, p < 0.05) and marginally with grain yield (0.10, non-significant). This suggests that thicker stems may support better reproductive success and grain yield, likely through improved structural integrity and nutrient flow. However, grain yield has a weak and non-significant negative relationship with canopy temperature (−0.09), reflecting the potential influence of microclimate dynamics, where higher temperatures might slightly reduce yield.
Another notable observation is the inverse relationship between biological yield and grain filling duration (−0.59, p < 0.01), which points to a possible trade-off where increased biomass could shorten the grain filling phase, potentially affecting grain quality. Moreover, canopy temperature, while not showing highly significant correlations, has a positive association with grain set percentage (0.31) and grain filling duration (0.07), suggesting that warmer canopies might support reproductive processes but could limit final grain yield, as reflected by its negative correlation with yield. The interrelationship between spikelets fertility percentage and other traits is weak and largely non-significant, indicating that this trait might not play a central role in directly influencing yield or biomass under the studied conditions. However, its minimal correlations highlight the complexity of the factors that govern rice reproductive success.
3.5.1. Biological Yield vs. Grain Set Percentage and Grain Filling Duration
The strong negative correlations between biological yield and both grain set percentage (−0.70, p < 0.001) and grain filling duration (−0.59, p < 0.01) indicate a clear trade-off between biomass accumulation and reproductive success. This result suggests that under conditions where biomass production is favored, there may be competition for resources (such as nutrients or photosynthates) between vegetative growth and grain development. One possible explanation for this could be that increased vegetative biomass demands more resources, which reduces the allocation to reproductive organs such as grains, leading to reduced grain filling and set percentages. In engineered microclimates, particularly those induced by UAV airflow or altered wind dynamics, the microclimate around the plant can affect transpiration rates, nutrient uptake, and photosynthesis. These changes may favor vegetative growth (biomass) at the expense of reproductive output, thus explaining this trade-off.
3.5.2. Grain Yield vs. Grain Filling Duration
The negative correlation between grain yield and grain filling duration (−0.46, p < 0.05) suggests that longer grain filling periods may not always result in higher yield. One possible reason for this could be that extended grain filling is an adaptive response to stress conditions, such as unfavorable temperature or nutrient limitations, which could hinder efficient grain production. Moreover, prolonged grain filling may expose the developing grain to additional stress, such as high temperatures or water shortages, which could reduce the yield potential. The controlled UAV-induced microclimate could also create more uniform but potentially stress-inducing conditions (such as increased air turbulence or altered heat distribution), further impacting the grain filling process.
3.5.3. Stem Diameter vs. Grain Set Percentage
The positive correlation between stem diameter and grain set percentage (0.39, p < 0.05) indicates that plants with thicker stems tend to have higher grain set. This relationship could be due to the fact that thicker stems provide better structural support and are more efficient in transporting nutrients and water to the reproductive organs, thereby improving the chances of grain development and set. Additionally, thicker stems may be more resistant to mechanical stress, including those introduced by wind or UAV airflow, ensuring better stability and nutrient partitioning toward the grains.
3.5.4. Biological Yield and Grain Yield
The positive correlation between biological yield and grain yield (0.38, p < 0.05) implies that an increase in overall biomass is generally associated with higher grain production. This suggests that while there is a trade-off with reproductive efficiency (e.g., grain set percentage), higher biomass can still positively contribute to yield under certain conditions. This correlation may be indicative of well-managed environments where sufficient nutrients and water are available, enabling the plant to support both vegetative growth and grain production. However, when resources are limited or when environmental stress is imposed (such as changes in wind speed, temperature, or humidity due to UAV influence), the balance might shift toward vegetative over reproductive growth, as reflected in the other negative correlations.
3.5.5. Canopy Temperature
Although canopy temperature did not exhibit highly significant correlations, its positive relationship with grain set percentage (0.31) and grain filling duration (0.07) suggests a potential influence of temperature on reproductive development. In microclimates engineered by UAV airflow, temperature fluctuations can either enhance or hinder reproductive success, depending on the timing and intensity of airflow. Slight increases in canopy temperature may stimulate grain filling and set under optimal conditions, but excessive heat could negatively affect grain yield, as suggested by the negative correlation with grain yield (−0.09). These subtle relationships point to the importance of carefully controlling UAV airflow to avoid thermal stress while enhancing the microclimatic conditions conducive to grain development.
3.5.6. Spikelet Fertility Percentage
Interestingly, spikelet fertility percentage showed weak and non-significant correlations with most other traits, suggesting that it may be influenced by factors not captured in the current analysis, such as genetic variation or other environmental conditions not directly affected by the UAV-induced microclimate. This might indicate that while spikelet fertility is crucial for reproductive success, it operates independently of the other traits measured in this context.
4. Discussion
Rotors airflow temperature effect on rice heading, panicle and flowering stage highlight the importance of optimizing UAV rotor-driven microclimate engineering to manage temperature fluctuations and improve rice productivity under heat stress [
2,
15]. Precision microclimate engineering via rotor wind walls is a unique and critical strategy for optimizing rice yields. By synchronizing UAV operations with diurnal temperature fluctuations, farmers can mitigate thermal stress, enhance plant growth, and improve yields [
13,
16]. Specifically, morning UAV sorties (06:00–09:00 a.m.) leverage cooler temperatures (29.35 °C) and reduced variability (σ = 0.24579) to promote optimal panicle development. In contrast, afternoon operations (12:00–15:00 p.m.) require careful management to minimize heat stress risk. Our experimental findings suggested that the wind temperature frequency distributions by our rotor-induced wind wall or UAV operations alter the microclimate at different times of day. The early-morning UAV operations or wind wall schedule offer more favorable conditions for the rice heading stage, while the midday and afternoon wind patterns introduce more variability that could potentially hinder optimal grain development. This observation lies in the identification of specific wind operating times that are most beneficial for rice crops [
17,
18], with early-morning operations showing the most consistent and stable microclimate [
19] conducive to enhancing yield during the critical heading stage [
3,
4]. By optimizing UAV rotor airflow during these times, farmers can better control the microclimate and reduce the adverse impacts of heat stress [
15,
20], thus improving grain quality and overall productivity [
21]. These data reinforce the importance of precision microclimate engineering for optimizing rice production through UAV technology [
22,
23].
Microclimate alteration through UAV operations or downwash airflow and its temperature results highlight how wind temperature, and consequently the microclimate, evolves throughout the day, with frequency peaking in the cooler morning and becoming more dispersed as the day progresses [
24,
25,
26]. By integrating UAV-based microclimate management with precision agriculture practices, farmers can boost yields by up to 18.2%, reduce thermal stress by 25.8%, and enhance grain quality [
5,
6]. Wind temperature fluctuations significantly influence rice growth during the flowering stage. Optimizing UAV rotor wind wall operations to moderate temperature fluctuations, particularly by timing rotor wind wall or UAV flight operation appropriately throughout the day, is a novel strategy to enhance crop resilience, reduce thermal stress, and improve overall rice yield and quality [
6,
7]. The integration of UAV-driven microclimate engineering represents a cutting-edge advancement in sustainable rice cultivation. Our findings reveal that diurnal wind temperature fluctuations significantly influence rice growth during the flowering stage, with morning temperatures (9:00 a.m., 29.35 °C) optimally supporting panicle development. Conversely, midday (12:00 p.m., 29.48 °C) and afternoon (3:00 p.m., 29.00 °C) temperature increases and variability introduce heat stress risks, compromising pollination and potentially reducing yields by up to 15%. This study pioneers a novel precision agriculture approach, leveraging UAV rotor wind wall technology to mitigate temperature extremes and enhance microclimate conditions [
8]. By optimizing UAV operations, farmers can create resilient, high-yielding rice crops, boosting productivity by 20% and improving grain quality [
21]. This innovative strategy offers a sustainable solution for precision agriculture, minimizing environmental impact while maximizing crop potential. The variation in wind temperature and frequency at different times of day alters the microclimate around rice plants [
25]. In the morning, with lower wind temperatures and more stability, the plants are likely to experience a cooler, less stressful environment. As the wind temperature increases by noon, the microclimate becomes warmer, potentially inducing heat stress, especially during the critical flowering stage [
21,
23]. The afternoon winds, despite slightly lower mean temperatures, exhibit more variability, which could result in fluctuating microclimatic conditions around the plants. The wind speeds exhibit a broad distribution and provide valuable insights into how UAV-induced airflow can be optimized throughout the day [
27]. Performing UAV operations around noon, when natural wind speeds are higher, may enhance the microclimatic effects, potentially improving air circulation, reducing heat stress, and enhancing transpiration in rice plants [
9,
10]. The graph shows a clear diurnal pattern in the wind speed distribution during the panicle stage of rice. The wind speed tends to increase from 9:00 a.m. to 12:00 p.m., reaching a peak around noon, and then decreases in the afternoon by 3:00 p.m. This trend suggests that midday wind conditions are stronger and more variable, which can significantly influence microclimatic conditions around rice panicles [
28]. The results reveal a distinct diurnal pattern, with wind speeds increasing from morning to noon and then decreasing by mid-afternoon [
11,
29]. Specifically, from 9:00 a.m. to 12:00 p.m., wind speeds increase by approximately 33.33%, with the peak frequency shifting from 1.2 m/s to 1.6 m/s. However, from 12:00 p.m. to 3:00 p.m., the wind speed drops by 37.5%, with the peak frequency returning to 1.0 m/s. This diurnal variation in wind speed highlights the potential for optimizing UAV operations during midday when natural wind speeds are higher and more variable [
8,
12]. Performing UAV-induced microclimate engineering around noon could enhance air circulation, reduce heat stress, and improve transpiration in rice crops [
30,
31]. These findings emphasize the significance of timing UAV flights to leverage natural wind dynamics, particularly during critical growth stages such as the panicle stage, to maximize the benefits of microclimate control for improved crop productivity and quality [
13].
During the rice panicle and flowering stages, wind speed dynamics resulted in distinct diurnal wind patterns, where both growth stages showed an increase in wind speed from morning to afternoon, but with higher afternoon wind intensities during the flowering stage. This diurnal variation suggests that afternoon winds, particularly during the flowering stage, may have a stronger impact on microclimate dynamics, potentially influencing critical physiological processes such as pollination and grain filling, ultimately contributing to rice productivity [
32]. During the heading stage, the relatively low wind speeds in the morning (with a peak of 0.2 m/s at 9:00 a.m.) suggest calm atmospheric conditions, which could benefit the initial development of rice panicles by minimizing mechanical stress and ensuring stable microclimate conditions for photosynthesis. However, as wind speeds rise to around 1.2–1.6 m/s by the afternoon, there could be increased evapotranspiration, potentially leading to higher water demands for rice plants. While moderate winds may promote better air circulation around the canopy, reducing the risk of fungal diseases, excessively high wind speeds can result in physical damage to the delicate panicles, leading to yield losses. The increased wind speeds in the afternoon could also disrupt the microclimate, affecting the delicate balance of temperature and humidity that is crucial for proper grain filling [
33].
During the flowering stage, the higher wind speeds observed in the morning and afternoon (with mean values exceeding 1.1 m/s at both times) could have both beneficial and detrimental effects. Positive effects include better pollen dispersal, which can enhance pollination efficiency, leading to improved grain set and ultimately higher yields [
18,
34]. Wind-induced air circulation (may be local air) may also help reduce humidity levels around the flowers, mitigating the risk of fungal infections, such as blast disease. However, the downside of these higher wind speeds, particularly in the afternoon, could be increased desiccation of the flowers, especially during critical flowering periods [
22,
35]. High wind speeds may lead to premature flower shedding or incomplete pollination, negatively impacting grain filling and leading to reduced yields [
30,
36].
From the agronomic point of view, the findings from this study demonstrate the pivotal role of microclimate engineering using rotor-induced airflow in modulating rice crop growth and yield parameters. The 9:00 a.m. treatments during reproductive stages, especially at flowering, consistently improved grain set, filled grain numbers, spikelet fertility, and panicle weight, highlighting the potential of early-day airflow to enhance reproductive success and yield outcomes. In contrast, late-afternoon airflow at 3:00 p.m. had mixed effects, with significant reductions in grain set and spikelet fertility during earlier growth stages, suggesting that the timing of airflow application is critical to maximizing agronomic benefits. These results introduce novel insights into the interaction between engineered airflow and rice physiological responses, providing a basis for optimizing rotor airflow schedules to maximize crop yield. This study demonstrates that rotor-induced microclimates can enhance key yield determinants, such as spikelet fertility and panicle weight, and also underscores the potential trade-offs associated with airflow timing, especially during sensitive reproductive phases. The data presented here suggest that early-day airflow during flowering could serve as an agronomic intervention to improve rice yields in precision farming systems.
The integration of UAV rotor airflow into precision agriculture presents a novel approach to enhancing crop management by leveraging its dual role in improving fertilization processes and moderating microclimatic conditions. Our study revealed significant benefits, particularly during critical growth stages, such as flowering and heading. UAV-induced airflow reduced pollen sterility, optimized pollen distribution, and enhanced aeration within the rice canopy. These effects facilitated improved cross-pollination, leading to higher seed setting rates and increased grain yield. Additionally, the induced airflow helped regulate temperature and humidity, mitigating heat stress and ensuring better grain fill under varying climatic conditions. However, the potential risks associated with rotor-induced airflow were also identified, particularly during the early vegetative stages. Wind stress posed challenges to young rice plants with fragile stems, potentially disrupting root establishment, delaying tillering, and reducing the number of productive tillers. Excessive wind stress at this stage could lead to growth reduction and uneven plant development, ultimately impacting yield. To address these trade-offs, we explored optimal UAV flight parameters, including altitude, speed, and exposure duration, to balance the benefits and risks. Our findings demonstrated that moderate rotor-induced wind speeds (3–5 m/s) during the flowering and heading stages significantly enhanced pollination and temperature regulation without compromising plant integrity. Conversely, for the early vegetative stages, we minimized wind stress by reducing rotor-induced wind speeds and adjusting flight schedules, ensuring safe operational thresholds for seedling establishment.
Recognizing the practical implications, we emphasized the adaptability of UAV-induced airflow under real-world conditions, where variables such as wind direction, ambient temperature, and topography influence outcomes. Field-based adaptations, such as tailoring UAV flight parameters to account for these factors, are critical for mitigating localized wind stress and maximizing crop benefits. By refining flight schedules and UAV settings, microclimate engineering can be strategically applied to support key growth stages while minimizing risks. Our research highlights the nuanced balance between the benefits of reduced pollen sterility and improved fertilization efficiency and the risks of wind stress in early growth stages. Through careful calibration of UAV flight parameters, we demonstrated the potential to harness the advantages of UAV technology in precision agriculture while mitigating its limitations. These insights contribute to a more comprehensive understanding of UAV-induced airflow and its practical applications in optimizing crop performance.
The results clearly demonstrate that early-day airflow at 9:00 a.m., particularly during the flowering stage, has the most profound effect on improving grain yield, biological yield, and harvest index. These increases, ranging from 70.75% in grain yield to 46.55% in paddies per plant, highlight the potential of rotor airflow as an agronomic tool to enhance rice productivity in precision farming systems. The timing of airflow application is critical, with midday airflow at 12:00 p.m. also showing significant improvements in yield components, although to a lesser extent than early-day airflow. Late-afternoon airflow at 3:00 p.m., while still beneficial, generally resulted in smaller increases across the measured parameters, suggesting that rice plants are less responsive to airflow interventions later in the day. The interaction effects between rotor-induced airflow and rice growth stages (RRS × GS) were generally low to moderate, indicating that while airflow timing plays a significant role, the growth stage at which it is applied is equally important for maximizing agronomic benefits. This study contributes to the growing body of knowledge on microclimate engineering in agriculture and presents new strategies for optimizing rice production through targeted airflow interventions [
34,
37].
The variations in the rice plant parameters under different rotor running schedules (RRS) and growth stages (GS) can be attributed to several physiological and microclimatic factors. The rotor-induced airflow alters the microenvironment around the rice plants, influencing critical parameters such as temperature, humidity, and CO
2 concentration, which are directly related to plant metabolic processes such as photosynthesis, transpiration, and grain filling. Early-morning rotor airflow (9:00 a.m.) had the most positive effect on growth parameters, especially during the flowering stage, where it significantly increased grain yield and filled grains. This could be due to the fact that early-morning conditions generally have optimal temperatures and higher humidity, which improve plant water relations and photosynthesis rates. The airflow at this time may also enhance gas exchange efficiency, aiding photosynthetic activity and better resource allocation for grain filling [
38]. The rotor airflow during the early hours may help dissipate heat, reducing canopy temperature and mitigating heat stress, which is known to negatively affect grain set and overall yield. Increased CO
2 exchange: Rotor airflow can increase the availability of CO
2 around the leaf surface, enhancing photosynthesis, especially during growth stages such as heading and flowering, when plants have high metabolic demands [
39].
Different growth stages have distinct physiological sensitivities to environmental conditions, such as temperature and airflow, explaining the variable effects of rotor airflow on rice plants. The flowering stage showed the highest sensitivity to rotor-induced airflow, with the 9:00 a.m. treatment during this stage resulting in the highest increases in grain yield (70.75%) and productive tillers (30.77%). Flowering is a critical stage where environmental stress, particularly heat stress, can severely impact grain set and spikelet fertility. Airflow at the flowering stage likely improved pollen viability and fertilization efficiency by reducing the microclimate temperature and increasing air circulation around the panicles.
Heading and panicle stages also benefited from airflow, particularly in terms of productive tillers and stem diameter, but the effects were more moderate. This could be because these stages are less sensitive to temperature extremes and benefit more from the mechanical stimulation and microclimate adjustments made by airflow. The time of day influences plant physiological processes such as photosynthesis and transpiration, which in turn affect growth parameters such as stem diameter, flag leaf area, and grain filling duration. Airflow at 9:00 a.m. had the most beneficial effect across various growth stages, likely due to cooler morning temperatures and lower evaporative demand. This supports more efficient water use, better leaf expansion (flag leaf area), and improved grain filling. In contrast, airflow at 3:00 p.m., when temperatures are higher and evapotranspiration rates peak, showed smaller gains, as the plant may experience more stress during this period [
29].
Morning airflow could prevent stomatal closure due to heat stress, enabling continued photosynthesis and growth, which may explain the significant increases in parameters such as stem diameter and flag leaf area. Afternoon airflow is less effective, as higher temperatures and greater vapor pressure deficits reduce the plant’s ability to maintain optimal gas exchange, leading to smaller improvements in plant growth and yield. The mechanical force exerted by rotor airflow may act as a form of mechanical stimulation (thigmomorphogenesis), affecting plant morphology and yield components. Increased stem diameter and flag leaf area in the 9:00 a.m. and 12:00 p.m. treatments suggest that the rotor-induced mechanical stress may have triggered thigmomorphogenic responses in rice plants, leading to structural reinforcement and enhanced leaf expansion. These morphological adaptations likely contributed to higher yield components, such as the number of filled grains and grain weight.
Plants exposed to mechanical forces often exhibit thicker stems as a structural adaptation to counterbalance the applied stress [
31]. In this study, airflow may have stimulated this response, resulting in larger, sturdier plants capable of supporting greater grain production. Grain filling duration and the harvest index are directly influenced by the timing and duration of favorable environmental conditions, which are enhanced by rotor airflow at specific times of day. The 9:00 a.m. flowering stage treatment resulted in a significantly higher harvest index (37.24%) and grain yield (43.2 g plant
−1), indicating that airflow at this time improved resource partitioning towards reproductive organs. This could be due to the improved microclimate, which extended the grain filling period and reduced temperature-induced sterility. The airflow likely promoted cooler temperatures and better transpiration efficiency during the grain filling stage, leading to more efficient carbohydrate allocation to grains [
31,
40]. The longer grain filling duration in airflow treatments supports this conclusion, as plants had more time to accumulate and partition assimilates toward grain development.
Spikelet fertility and yield parameters are highly sensitive to temperature fluctuations, which are mitigated by rotor airflow. The 9:00 a.m. flowering stage treatment significantly increased spikelet fertility and the number of filled grains due to improved air circulation and reduced canopy temperature. The cooler microclimate created by the early-morning airflow likely enhanced pollen viability and fertilization success, leading to a higher grain set and fewer empty grains. Optimal temperatures during the reproductive stage are crucial for spikelet fertility, as high temperatures can cause pollen desiccation or stigma injury. By moderating canopy temperature, the rotor airflow prevented heat stress-induced fertility loss, directly contributing to higher yields. The relationship between wind speed and wind temperature at three distinct times of day—9:00 a.m., 12:00 p.m., and 3:00 p.m.—is shown in
Figure 1. The scatter plot suggests a slight increase in wind temperature at 9:00 a.m. as wind speeds rise, though the correlation remains weak, with temperatures averaging around 26.5 °C. Wind speeds between 0.0 and 2.0 m/s cause minor fluctuations, resulting in an approximate 1–2% change in temperature. This moderate increase in wind speed during the morning may benefit rice growth during the vegetative stage by improving gas exchange, cooling the leaf surface, and reducing disease pressure. However, at this stage, the weak correlation indicates that other factors such as soil moisture may have a stronger influence on plant stress, with minimal negative impact [
41].
By noon, the relationship becomes more scattered, with wind temperatures ranging between 26 °C and 28 °C, indicating broader variability as wind speeds increase. While wind temperature does not rise in direct proportion to wind speed, a general increase of approximately 5% can be observed at higher speeds. During this time, rice plants may experience increased transpiration rates due to rising temperatures. The combination of moderate wind speed and slightly elevated temperatures can positively affect photosynthesis and nutrient uptake, especially during tillering or early reproductive stages. However, excessive increases in wind speed could lead to water stress if soil moisture levels are insufficient, negatively affecting plant development and leading to reduced tiller production.
In the afternoon, wind temperatures increased further, ranging from 27 °C to 28 °C, suggesting warmer conditions compared to earlier in the day. While wind speeds reach up to 4.0 m/s, the correlation between wind speed and temperature remains weak, though a potential 2% increase in temperature is evident at higher wind speeds. By this time, the increased wind speed combined with higher temperatures may have had a mixed effect on rice growth. On the positive side, stronger afternoon winds can help cool the canopy, reduce heat stress, and support the grain filling process by maintaining optimal temperatures for enzymatic activity. However, excessive wind speed, particularly during the sensitive flowering stage, could increase evapotranspiration rates and lead to moisture loss, negatively impacting pollination and grain setting. Additionally, high temperatures combined with wind can exacerbate heat stress, leading to spikelet sterility and reduced grain quality [
28].
The wind speed and temperature interactions have varying effects on rice growth. During the morning, moderate wind speeds provide slight cooling and improved gas exchange (1–2% increase), contributing to early-stage plant health. At noon, a broader distribution and a slight temperature increase (5%) can support growth, but excessive wind speeds could lead to water stress. In the afternoon, the combination of higher temperatures and increased wind speeds (2% rise) could either alleviate heat stress or exacerbate moisture loss, depending on the rice growth stage and environmental conditions [
13,
38]. These dynamics highlight the delicate balance between wind and temperature interactions, with their positive effects such as enhanced cooling, improved gas exchange, and reduced heat stress potentially offset by negative impacts such as increased water loss, heat stress, and reduced pollination efficiency during critical reproductive stages [
16,
42]. Managing these factors is crucial to optimizing rice yield and quality in wind-affected environments.
The correlation analysis offers novel insights into how engineered microclimates, especially those influenced by UAV rotor airflow, impact rice growth and yield parameters. The trade-offs observed between biomass production, grain set, and grain filling duration suggest that UAV-driven microclimates may prioritize vegetative over reproductive growth, highlighting the need for careful management of these microclimates to optimize both biomass and grain yield. Additionally, the influence of factors such as stem diameter on grain set percentage and the mixed effects of canopy temperature underscore the complex dynamics that govern plant responses to controlled environmental modifications. Understanding these correlations is essential for developing strategies that leverage UAV technology in precision agriculture to enhance crop productivity while managing the trade-offs between different agronomic traits. This research provides a foundation for future work exploring how UAV-engineered microclimates can be fine-tuned to balance vegetative and reproductive success in rice cultivation.


