
Improved Paddy Rice Classification Utilizing Sentinel-1/2 Imagery in Anhui China: Phenological Features, Algorithms, Validation and Analysis

 ,
,
Abstract

1. Introduction
2. Materials
2.1. Study Area
2.2. DataSet
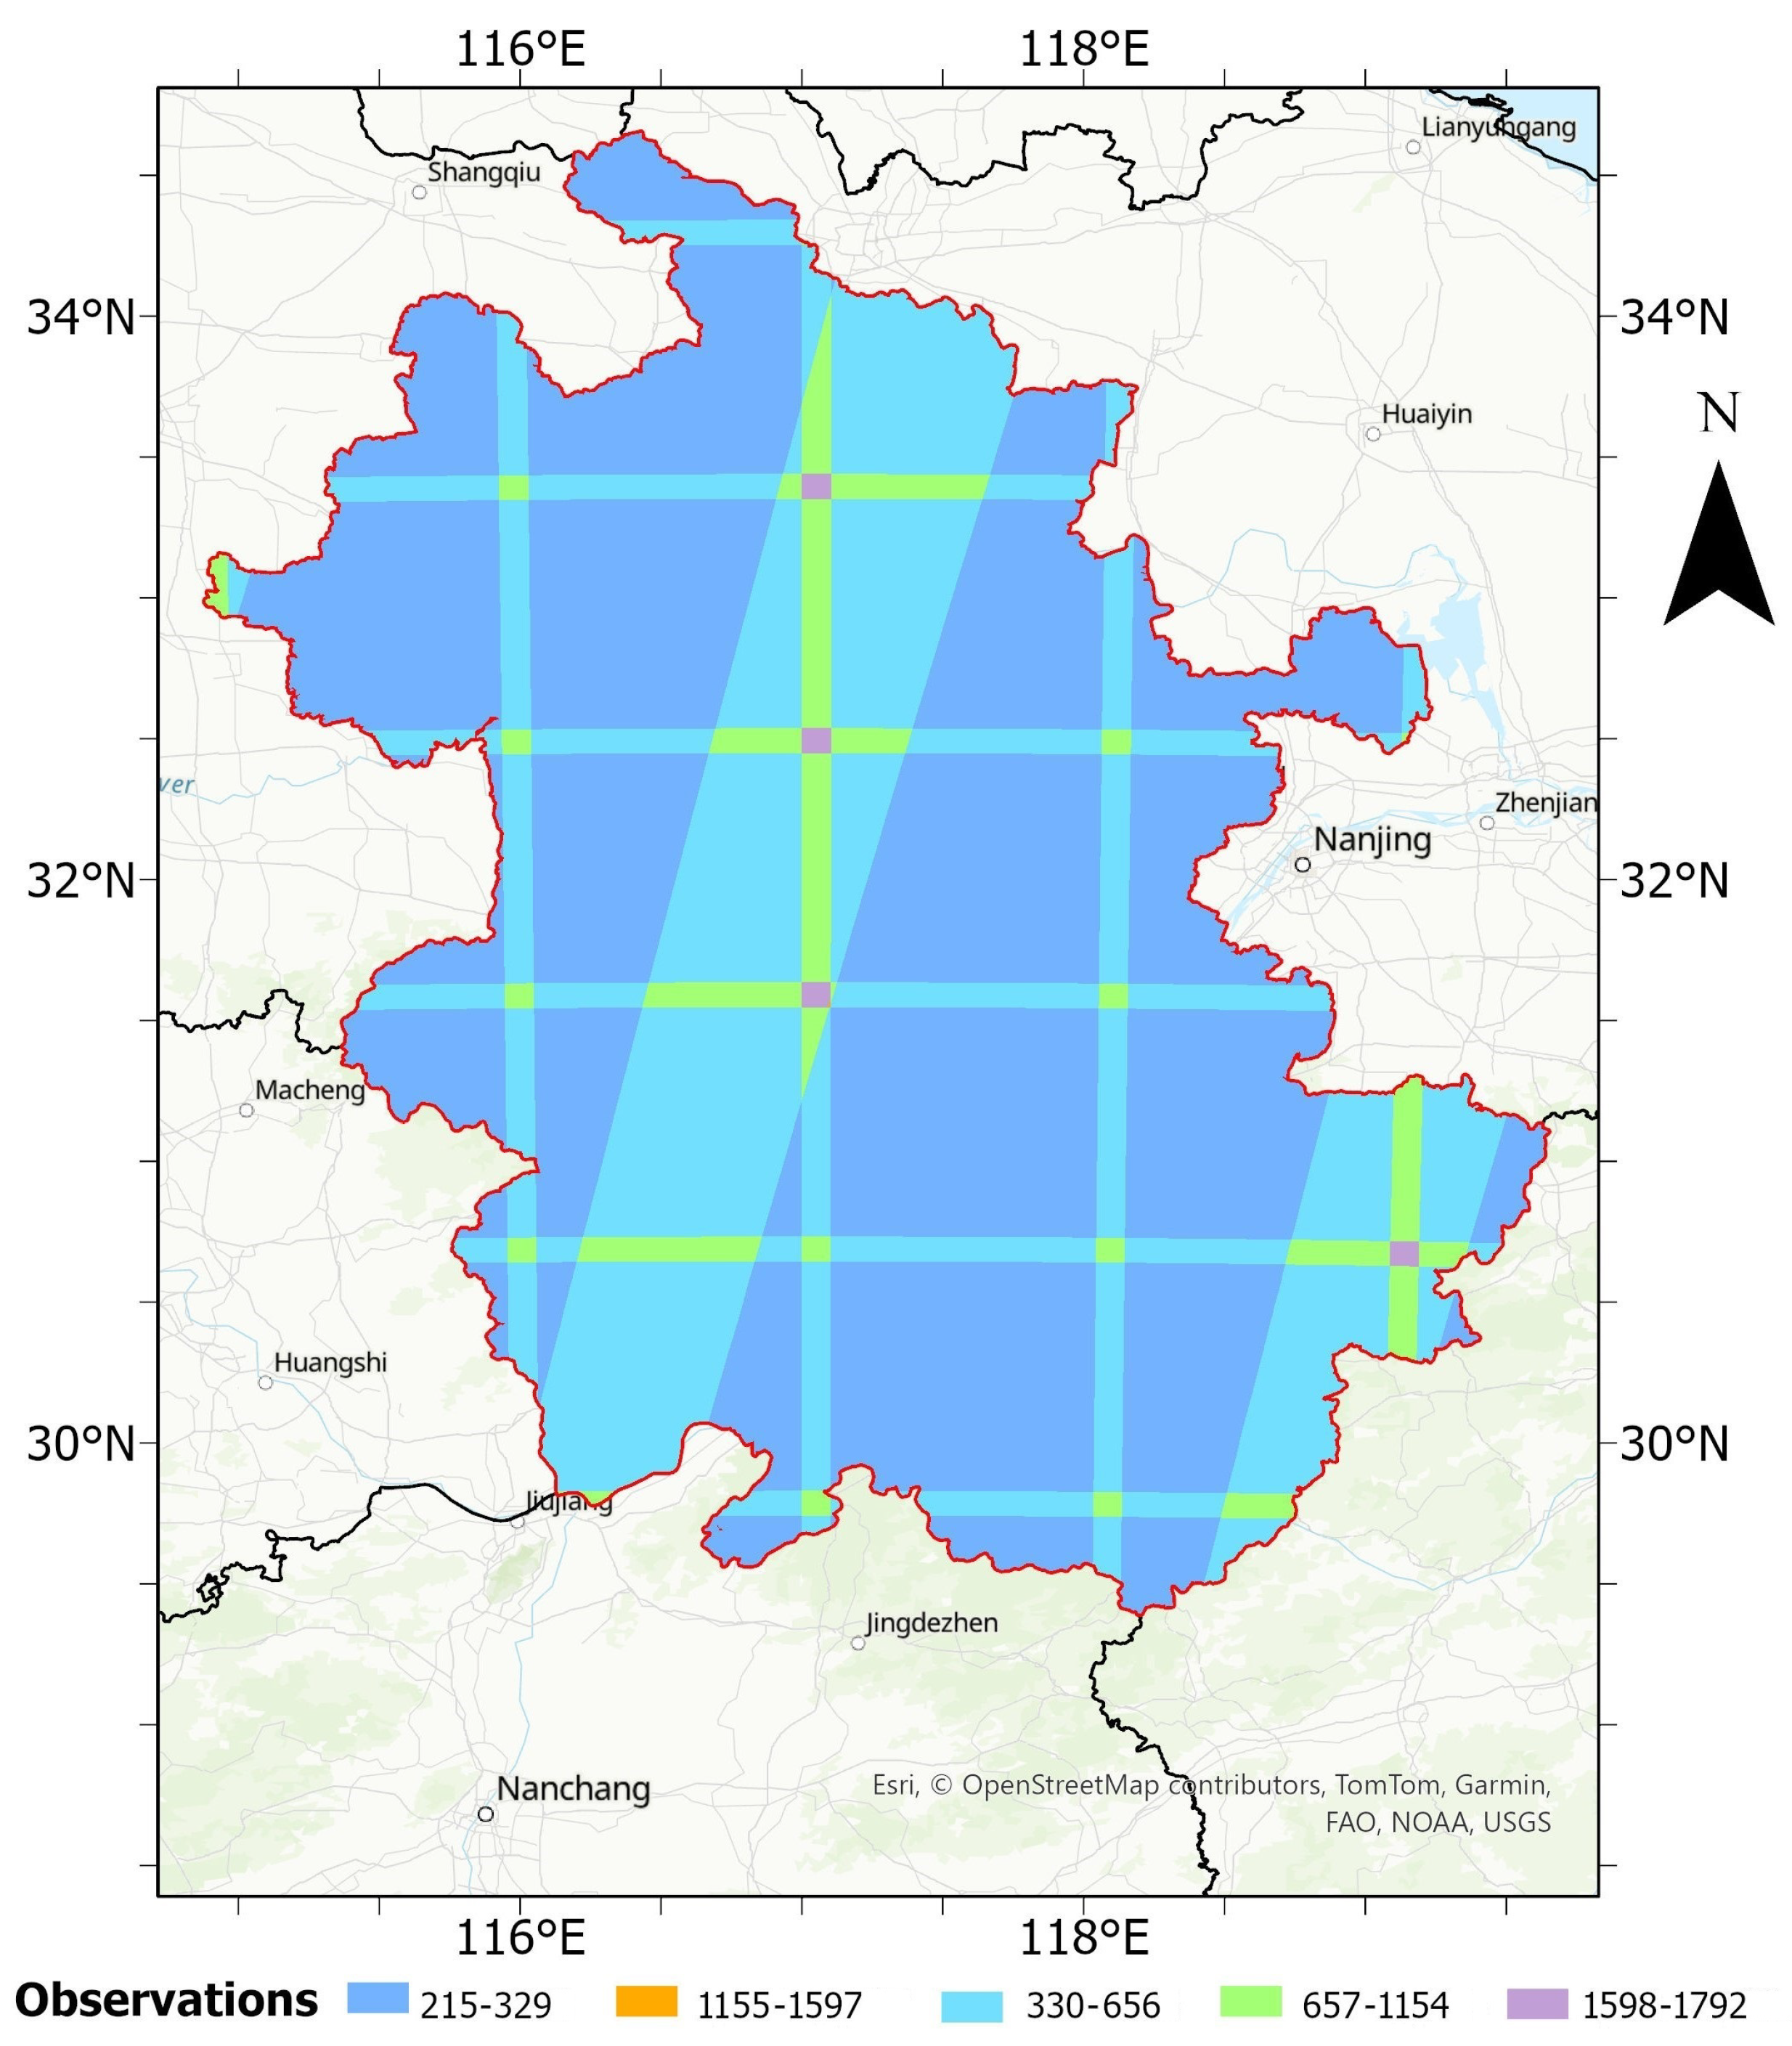
2.2.1. Sentinel 1 SAR
2.2.2. Sentinel 2 (TOA)
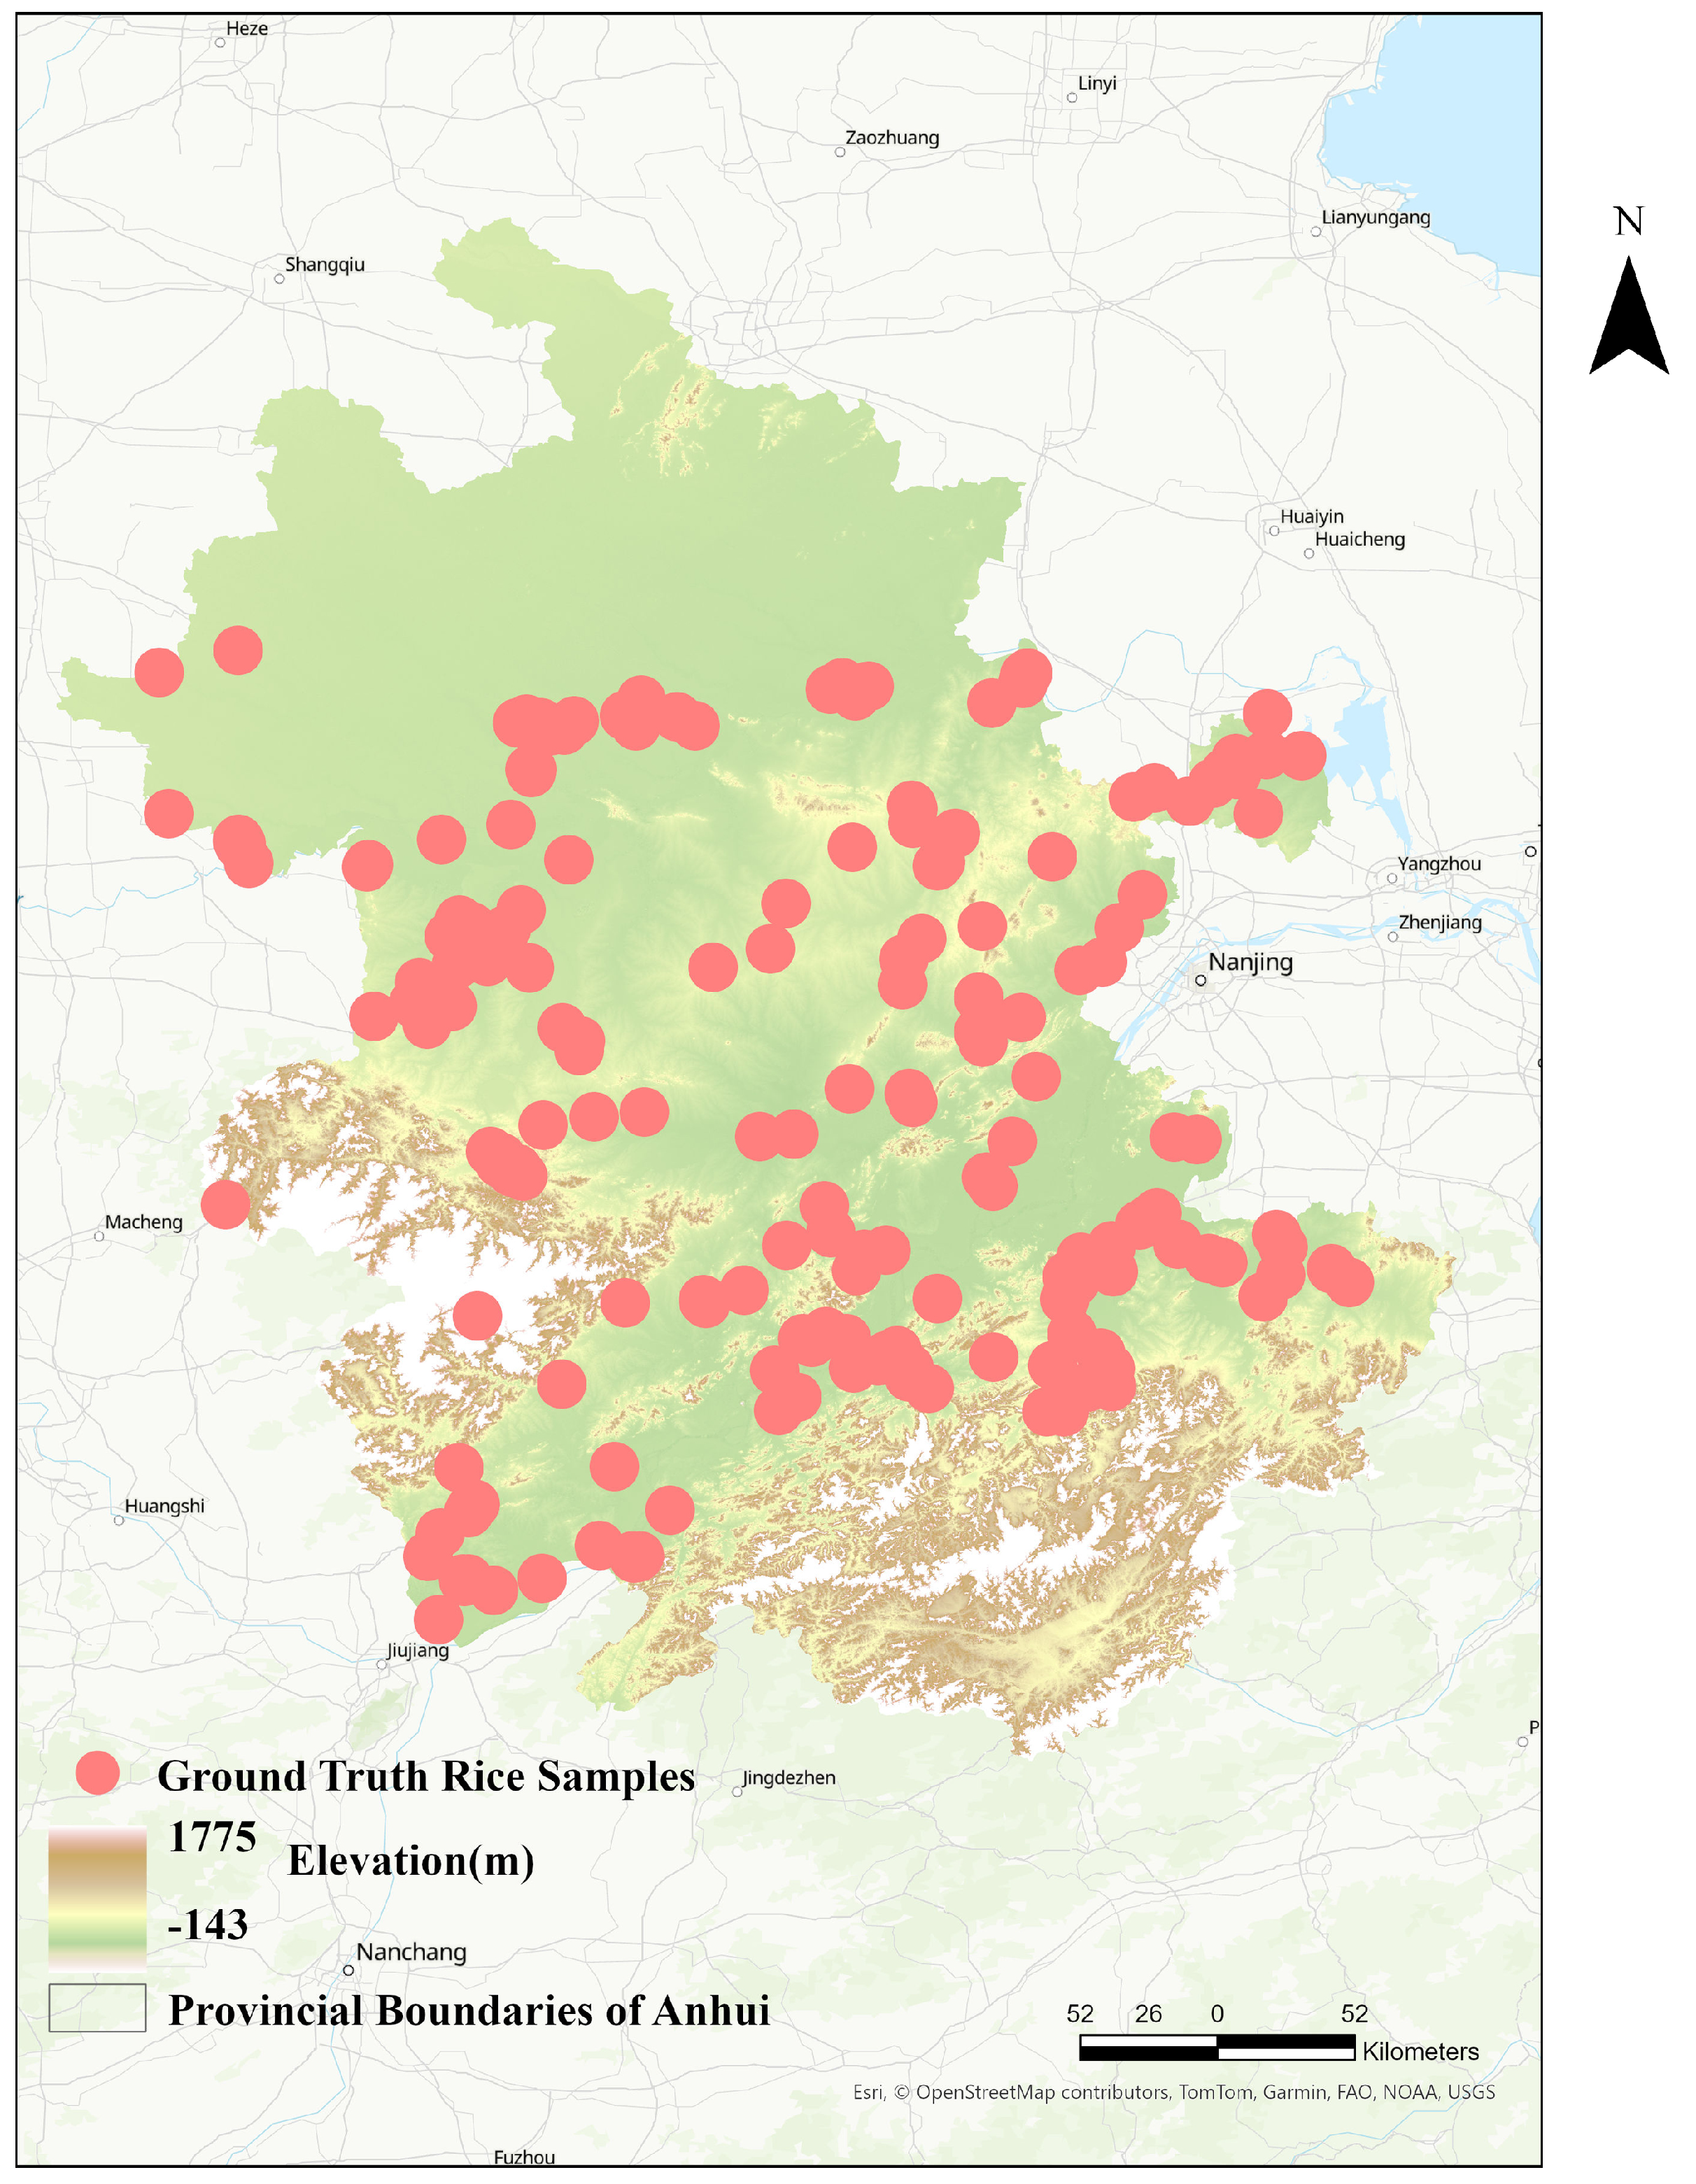
2.2.3. Ground-Truth Data
2.3. Cropland Mask
2.4. Verification Dataset
- Ground Survey Data. Ground survey data were collected from local farmlands from 2021 to 2023. During the survey, we collected the specific rice cultivation fields with GPS coordinates and the dates of specific phenological stages. We have collected 2032 pixel rice sample points from our ground survey. These ground-truth data were then expanded and used to detect the phenological features in the study area. Subsequently, these phenological features were used to extract sample paddy rice points in Anhui. The detailed sample generation process is introduced in Section 3.2.
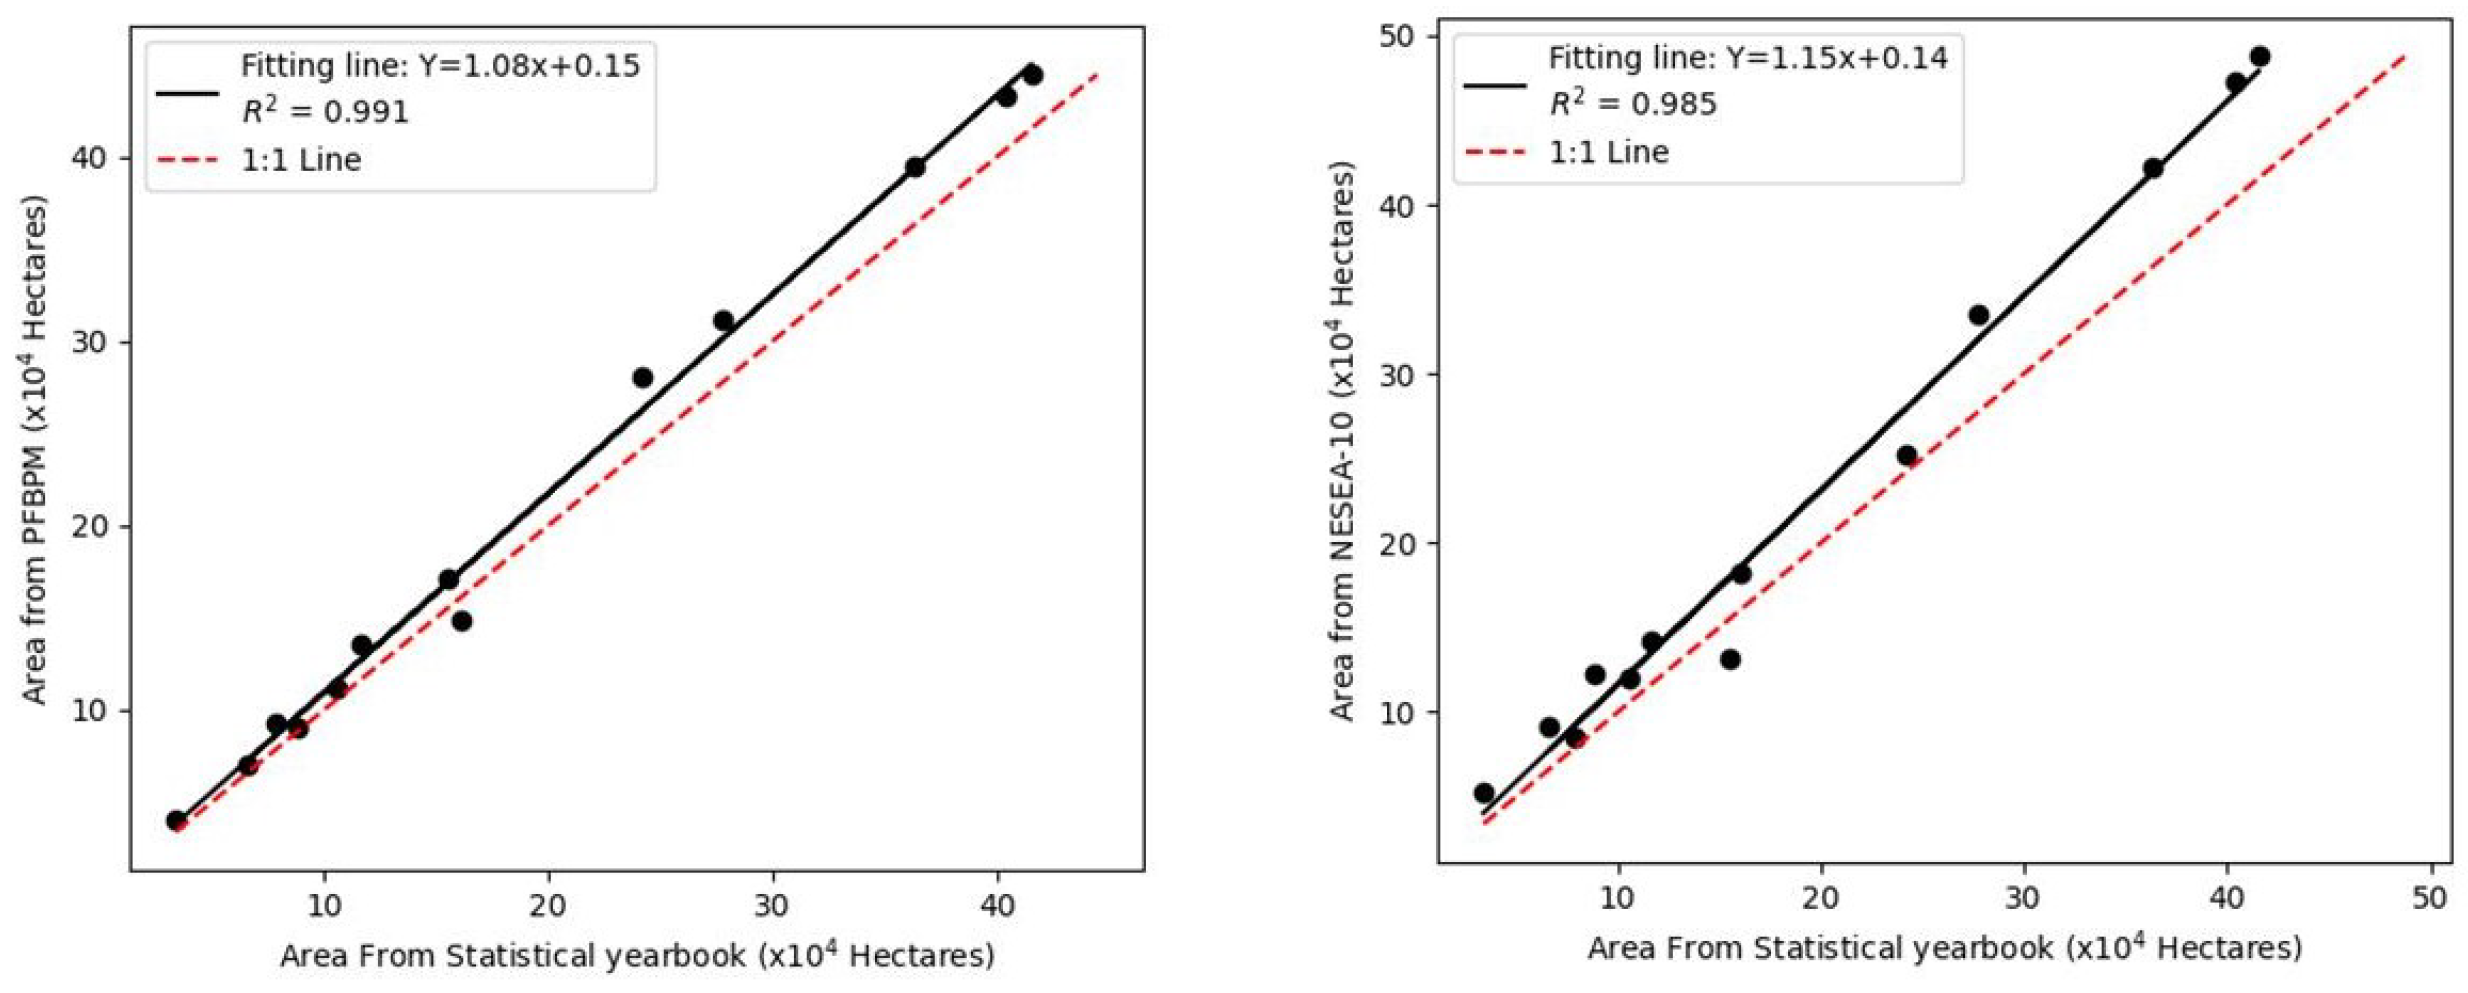
- National and Provincial Statistical Data. The Anhui Statistic Yearbook (ASY) has reported the planting areas of paddy rice for Anhui province annually. From this provincial statistical yearbook of Anhui, we collected the paddy rice planting areas of each prefecture-level city. These data were used as a comparison in our validations.
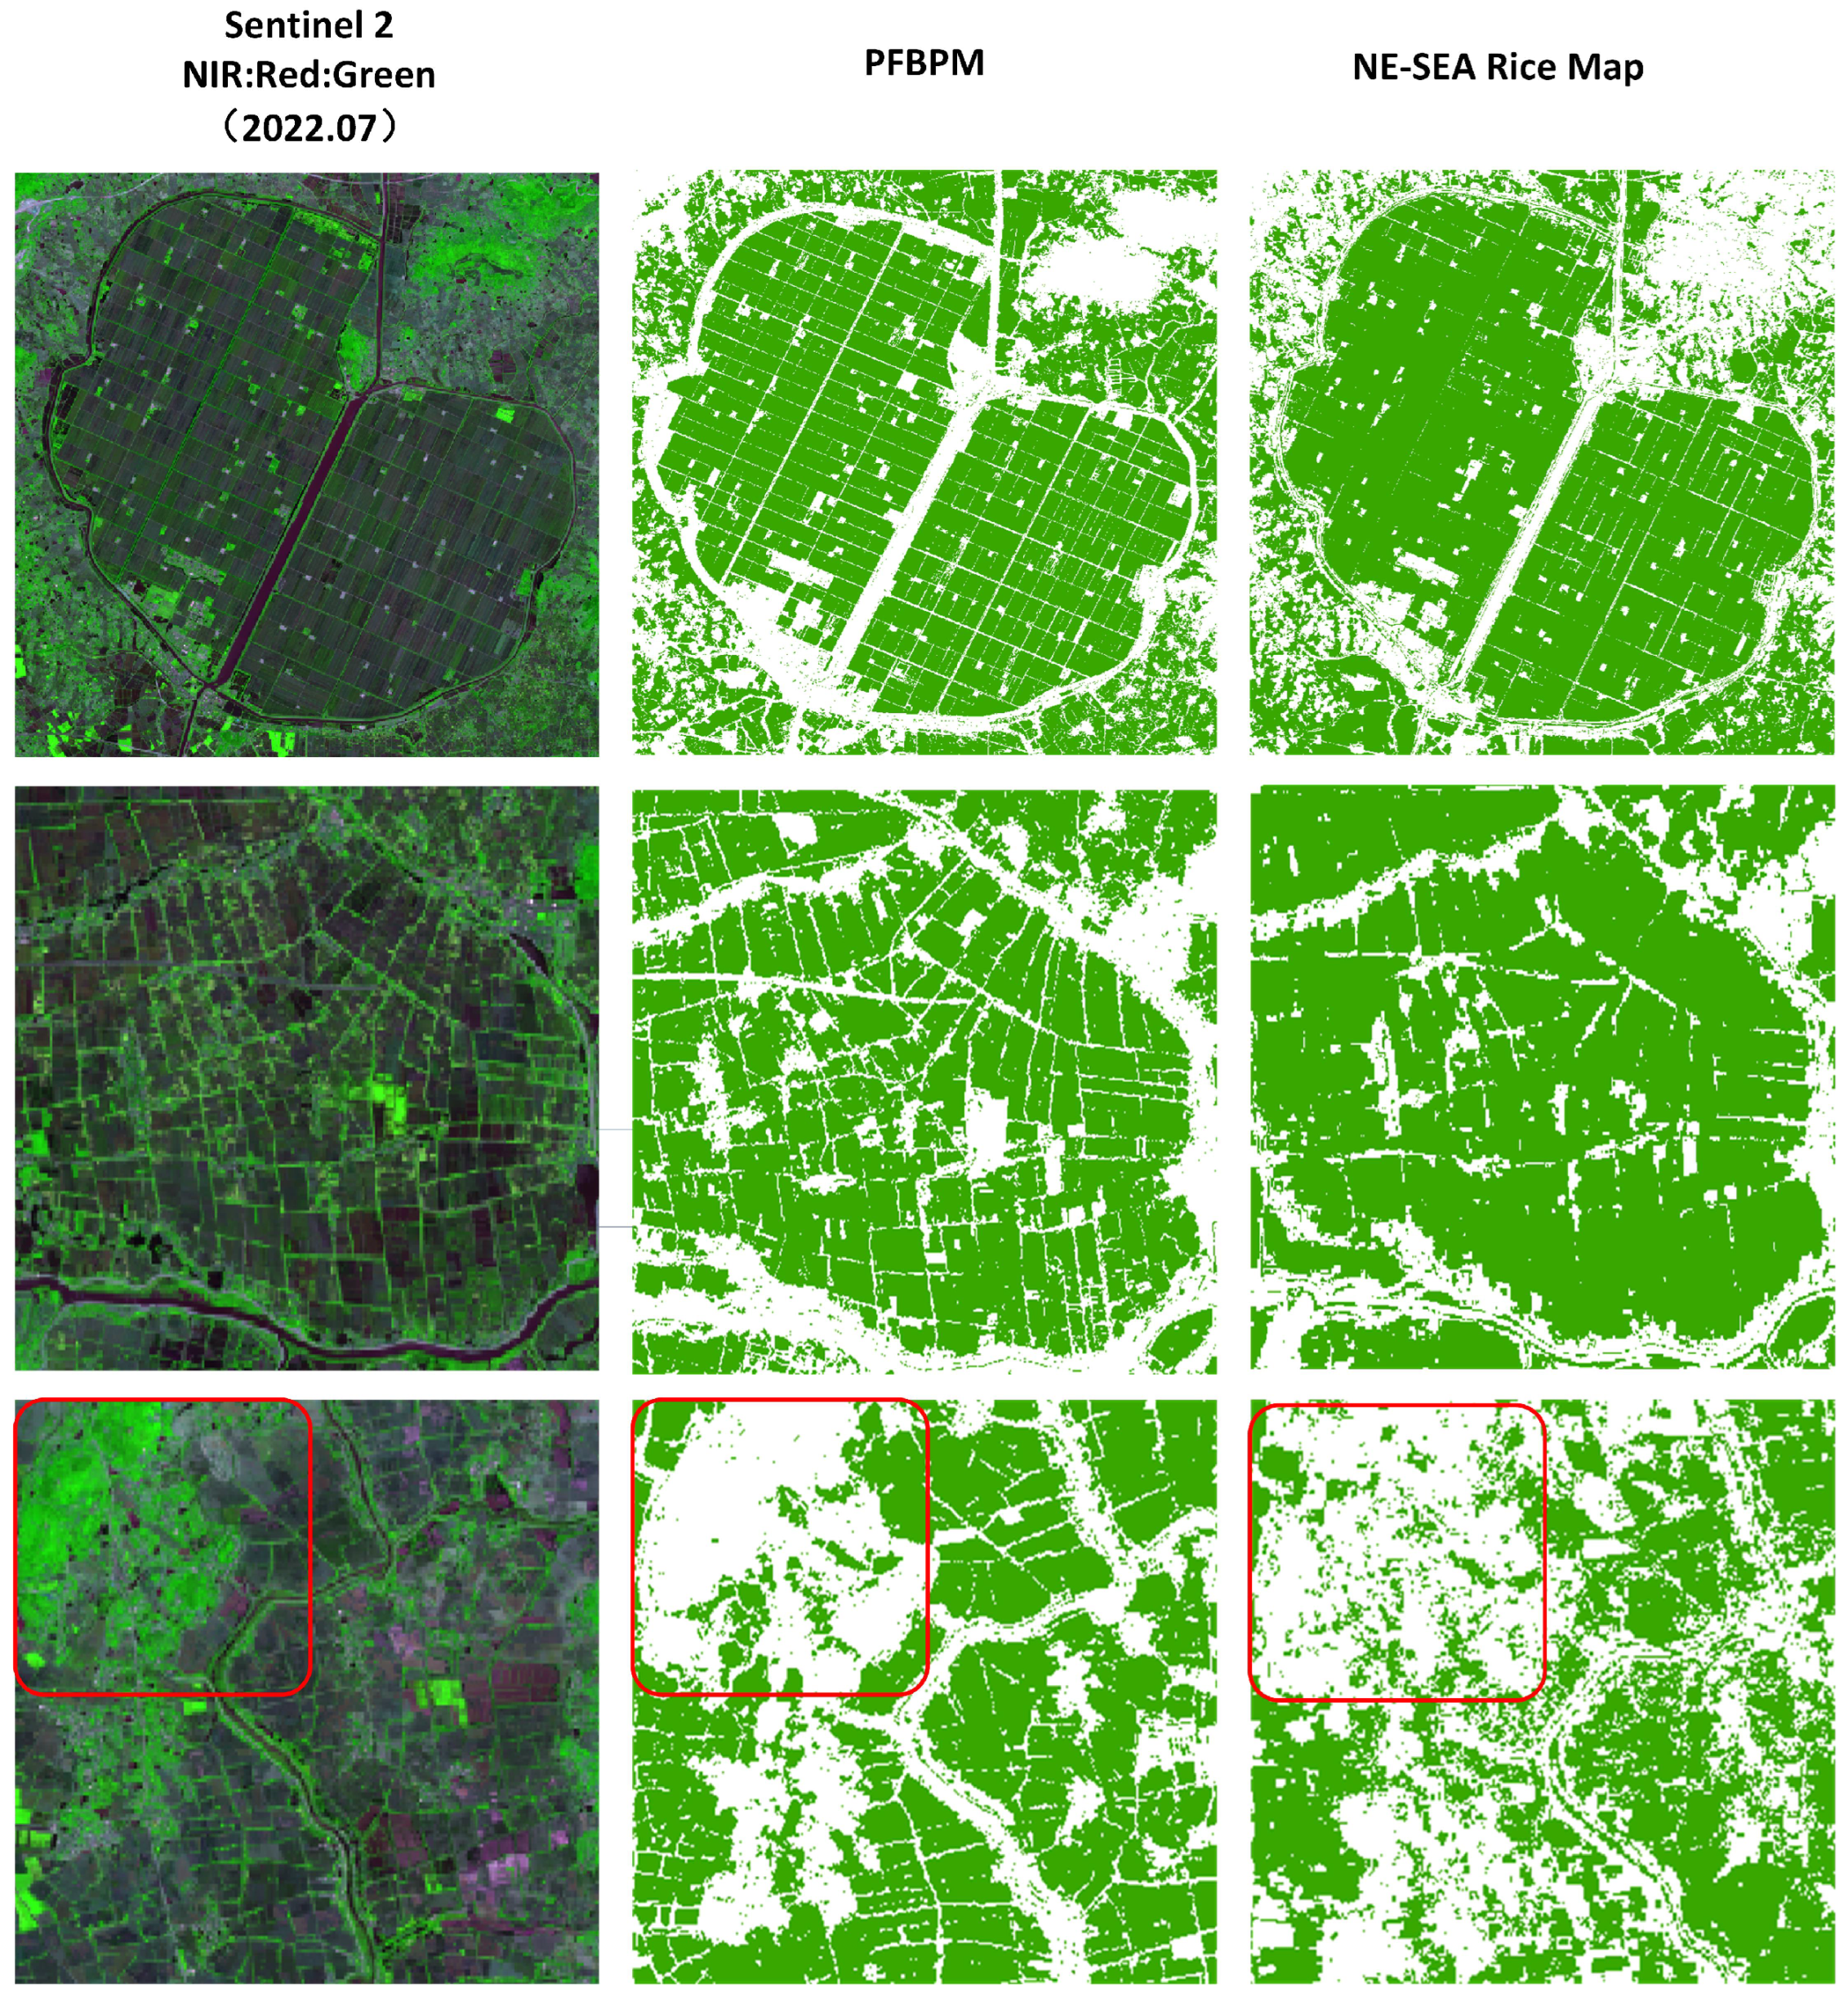
- Another 10 m Rice Mapping Product. Han et al. [8] proposed a 10 m rice-mapping product in Northeast and Southeast Asia by identifying and analyzing the flood signal as the feature. Their proposed algorithm was deployed to generate a rice-mapping result as a comparison reference for our study.
3. Methodology
3.1. Phenology Identification and Index Allocation
3.1.1. Index Selection

3.1.2. Phenological Phase Detection
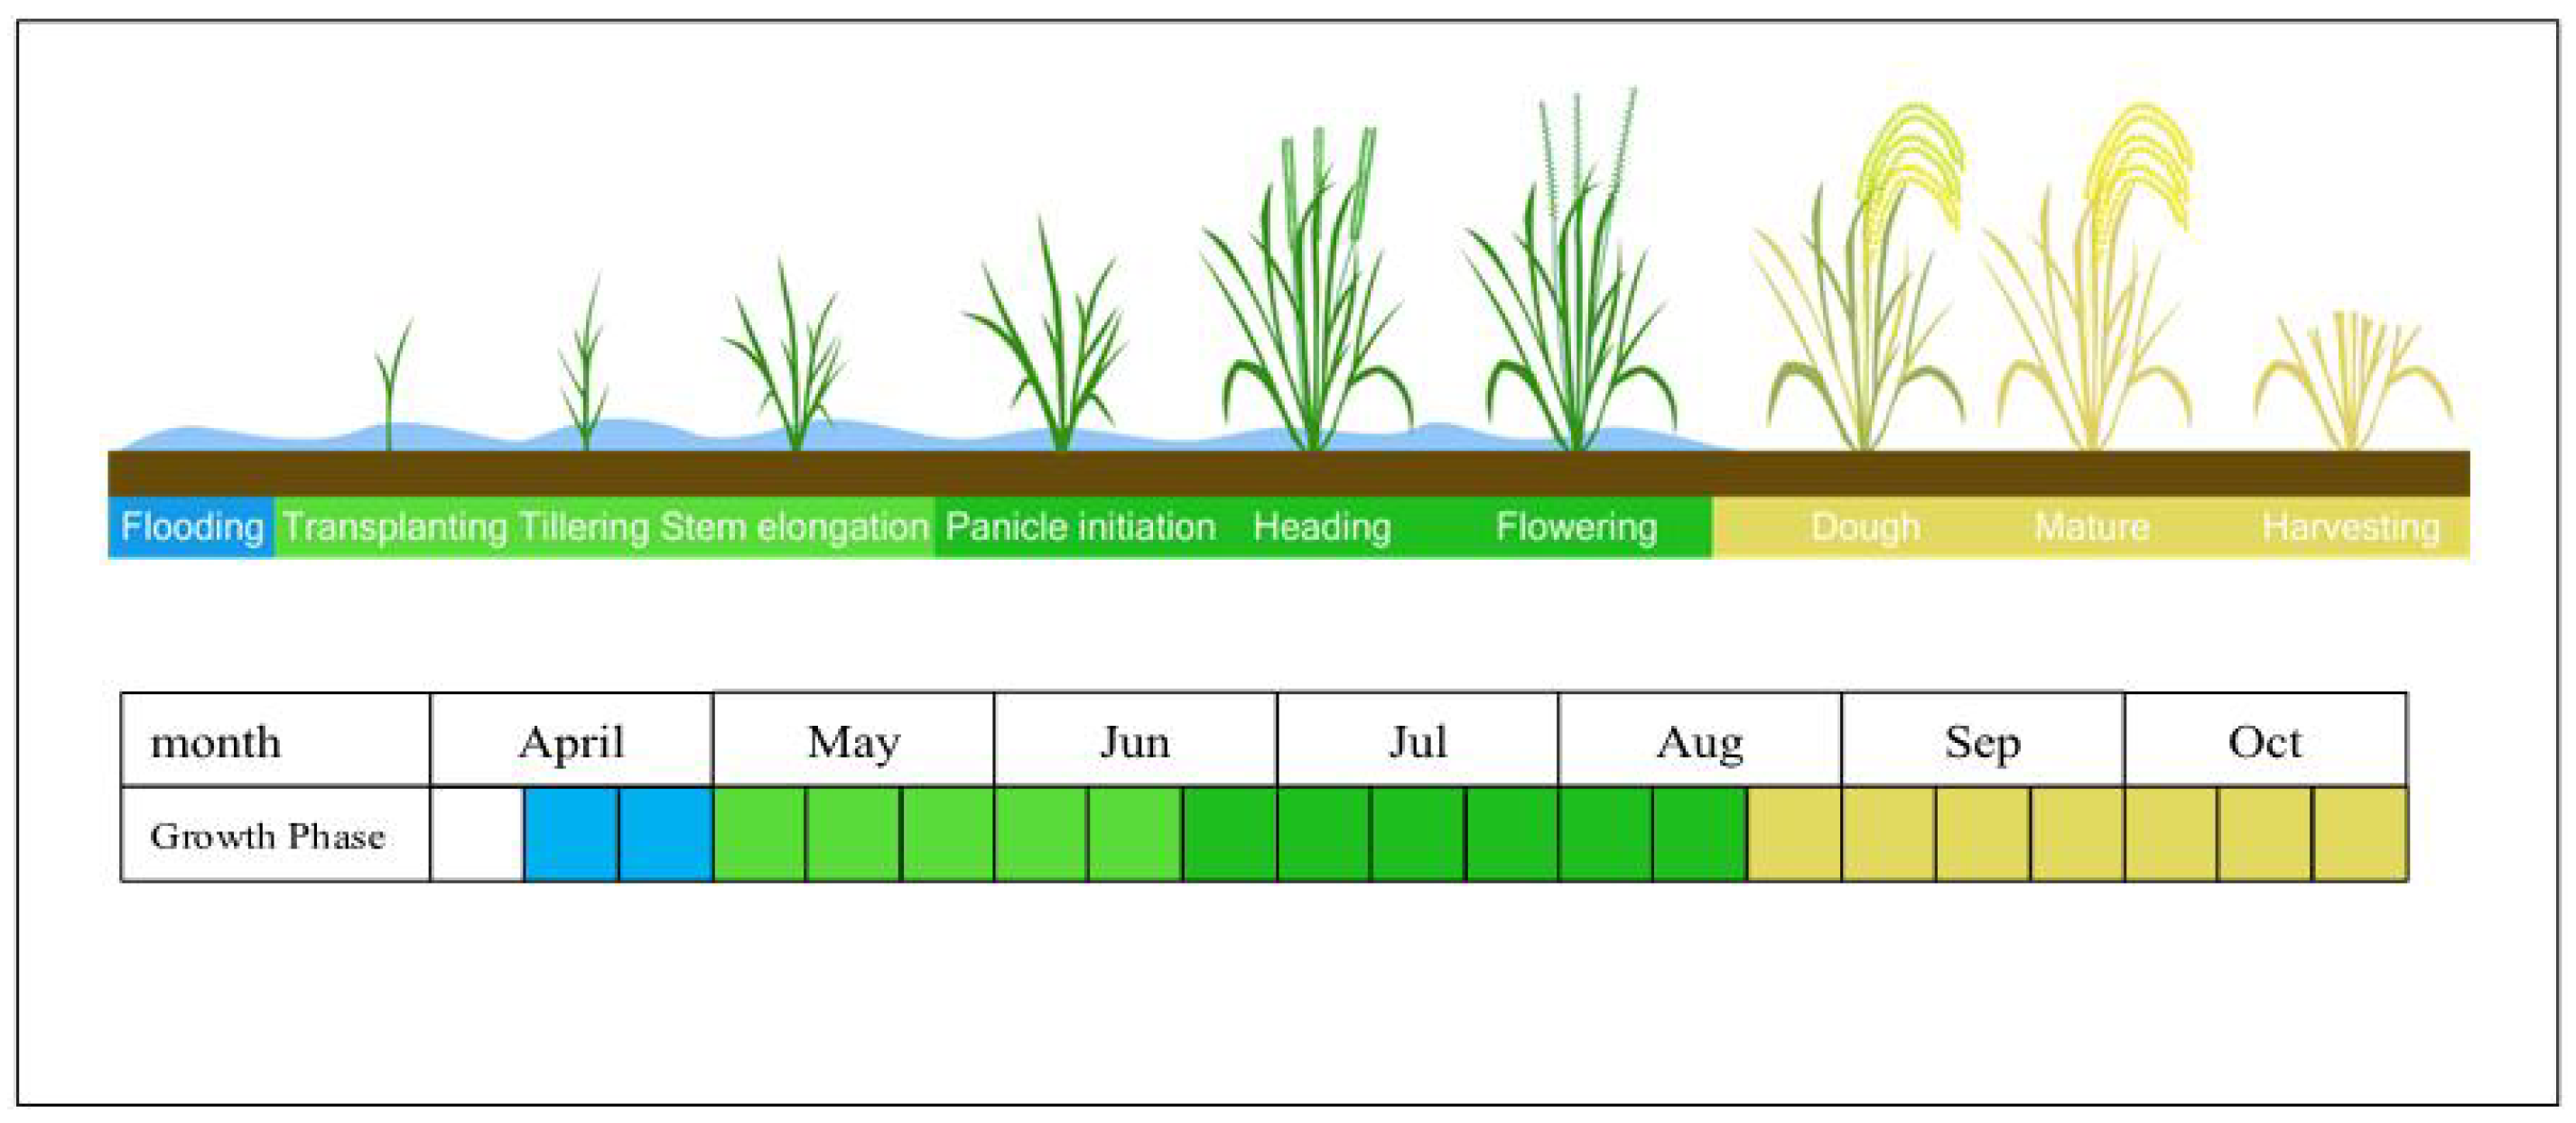
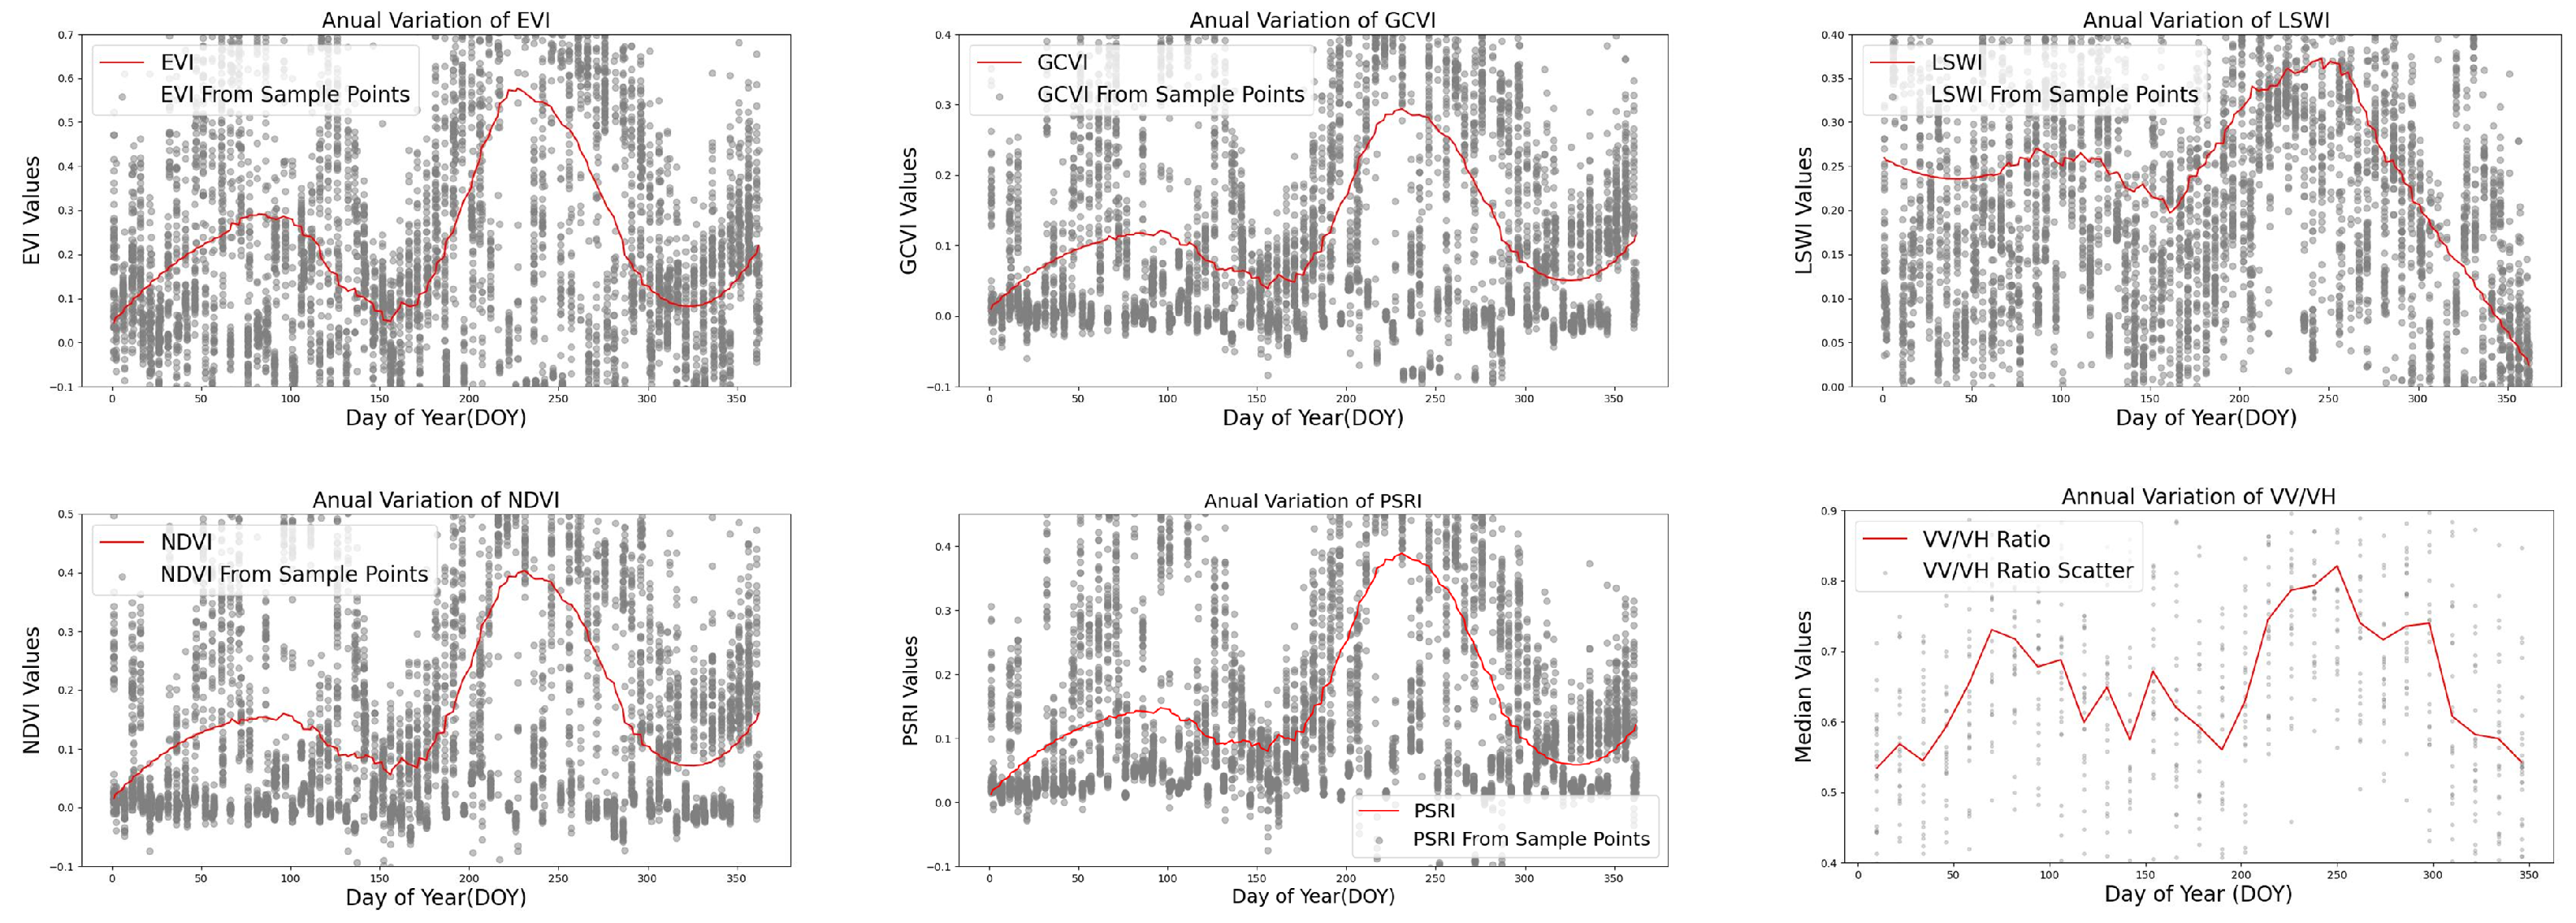
- The Flooding Period. The flooding or transplanting stage is a widely accepted phenological feature for extracting paddy rice. During this stage, moisture levels gradually increase in the planting field. This stage has been extensively verified by many previous studies [25,27]. As shown in Figure 6, LSWI exhibited a sudden increase around DOY 160, indicating the flooding signal of paddy rice. We defined the flooding period as occurring from DOY 160 to 210 to capture this significant and proven feature of paddy rice extraction.
- The Growing Period. After transplanting, paddy rice begins to grow. With the rapid expansion of canopy areas and the rise of chlorophyll signals, vegetation indices that represent greenness growth are relevant in this phase. GCVI was first used, since it was closely related to the chlorophyll and demonstrated effectiveness in tracing rice growth [20]. Also, the EVI value was involved in capturing the canopies’ expansion, and the peak value during this stage has previously been utilized in rice mapping [9,27]. From the annual indices variation curves, the nominated indicators remain high, around DOY 250–260 (heading date). We slightly expanded both sides of these dates to minimize the risk of missing valuable features. Additionally, VV/VH showed a positive gradient and almost reached the peak value during this stage, consistent with previous research [33,37,38], and was therefore included in this period. Though most of the vegetation indices (VIs) have demonstrated high values during this stage, we purposely included our selection above, since others were more representative in different phases.
- The Ripening Period. After the growth phase, paddy rice enters the ripening period, during which it begins to mature, and chlorophyll levels decrease. Here, PSRI and NDVI were used to signify this stage, as they are both clearly related to the maturity of paddy rice. As the rice turns yellow, the PSRI shows an increase [28]. In Figure 6, this occurred around DOY 300. Thus, this period was defined from DOY 280 to 320.
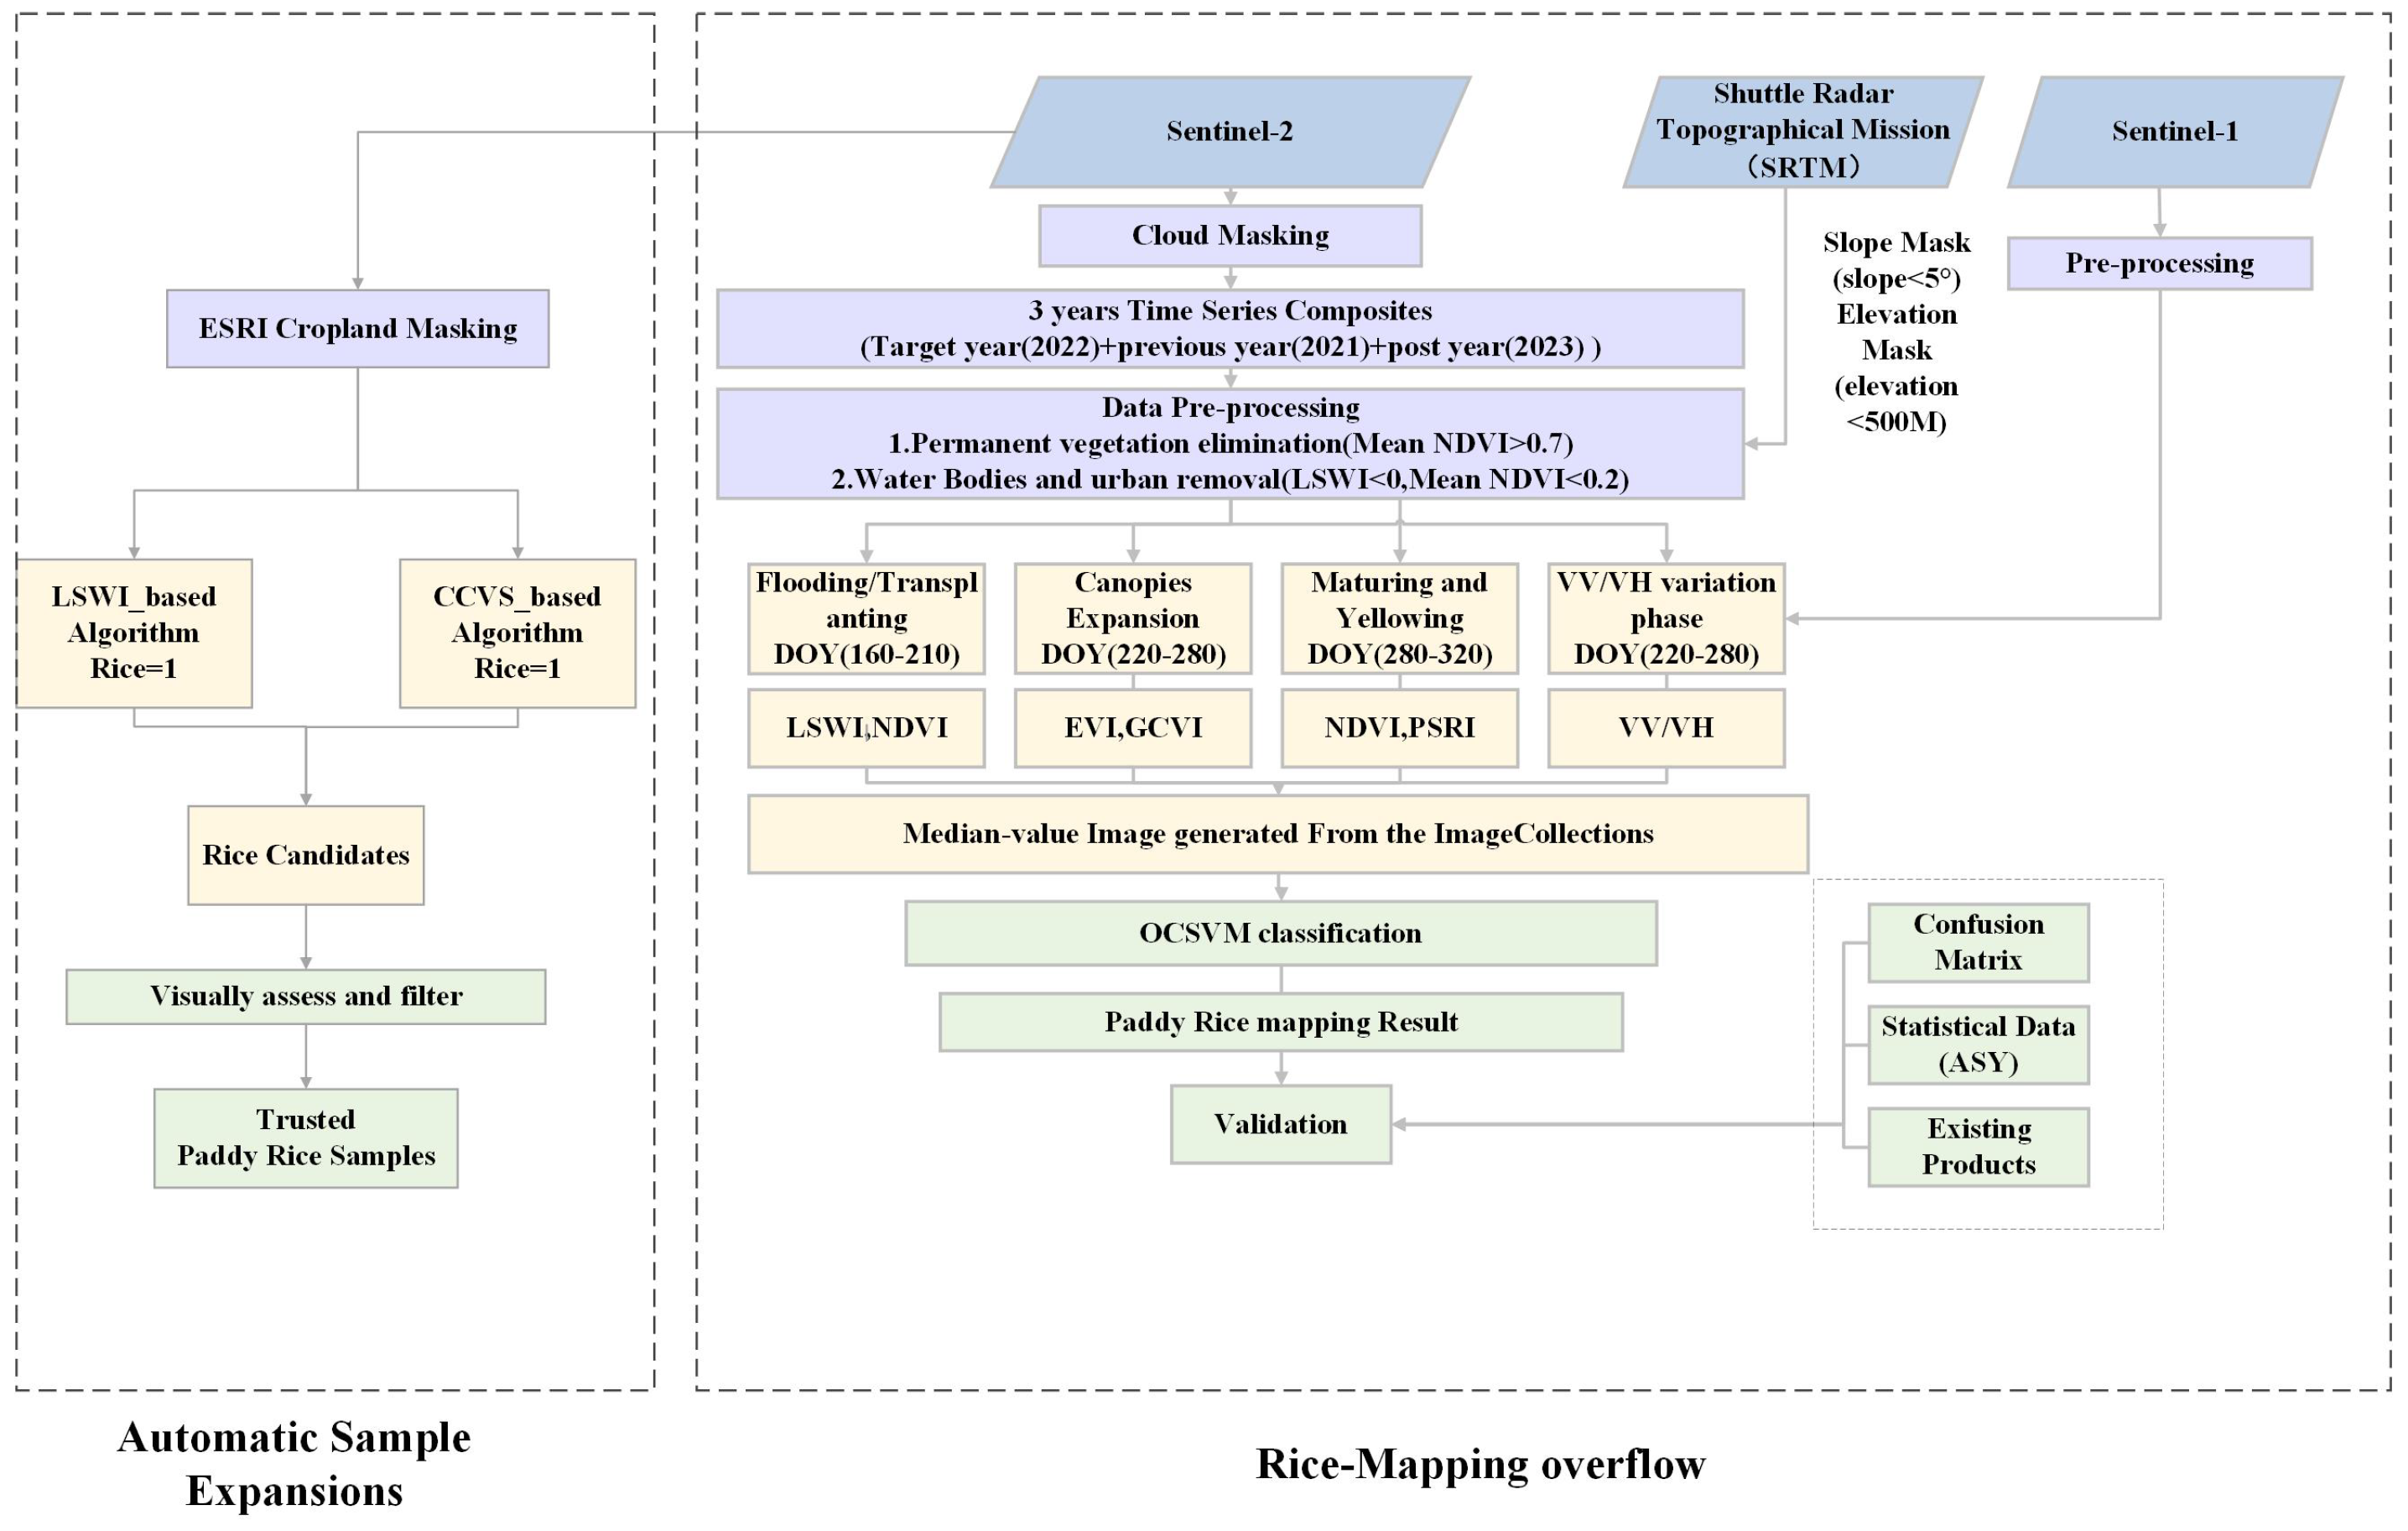
3.2. Rice Sample Expansion
3.3. Phenological Features-Based Paddy Rice Mapping Method
3.3.1. Non-Potential Rice Masking
- Topographical and water bodies exclusions. Areas where NDVI < 0.1 and NDVI < LSWI were identified as permanent water bodies and were masked before proceeding to the next steps [9]. Xin et al. [42] illustrated that paddy rice in China is mainly planted on flat plains in eastern China, due to the terrain being suitable for planting and harvesting. We incorporated DEM data from the NLCD-2000 datasets, calculated the slope of each pixel in our study area, and, following Rossi and Erten [43], excluded regions with slopes greater than 5 degrees to remove potential topographical impacts on our rice classification algorithms.
- Less-likely vegetation area. Areas less likely to support vegetation, such as urban regions, saline and alkaline lands, or sparsely vegetated areas, typically exhibit high reflectance in both the visible and short-wave infrared spectral bands due to low levels of green vegetation. We calculated the maximum NDVI value from all valid observations during the growing season. Areas exhibiting a maximum NDVI value below 0.5 were classified as less-likely vegetation land (LLVL), and a corresponding mask was subsequently generated [44].
- Permanent vegetation masking. Permanent vegetation areas, such as forests, consistently exhibit greenness throughout the year. Unlike croplands, which show fluctuations in reflectance and related indices during crop rotation or harvesting, permanent green areas remain stable in their spectral characteristics. We selected NDVI data from year-round observations, calculated the mean value of good observations, and, based on the study of Fensholt et al. [45], masked pixels with an NDVI_Mean greater than 0.7 as permanent greenness.
3.3.2. Image Composites for Classification
3.4. Classification
3.5. Validation
4. Results
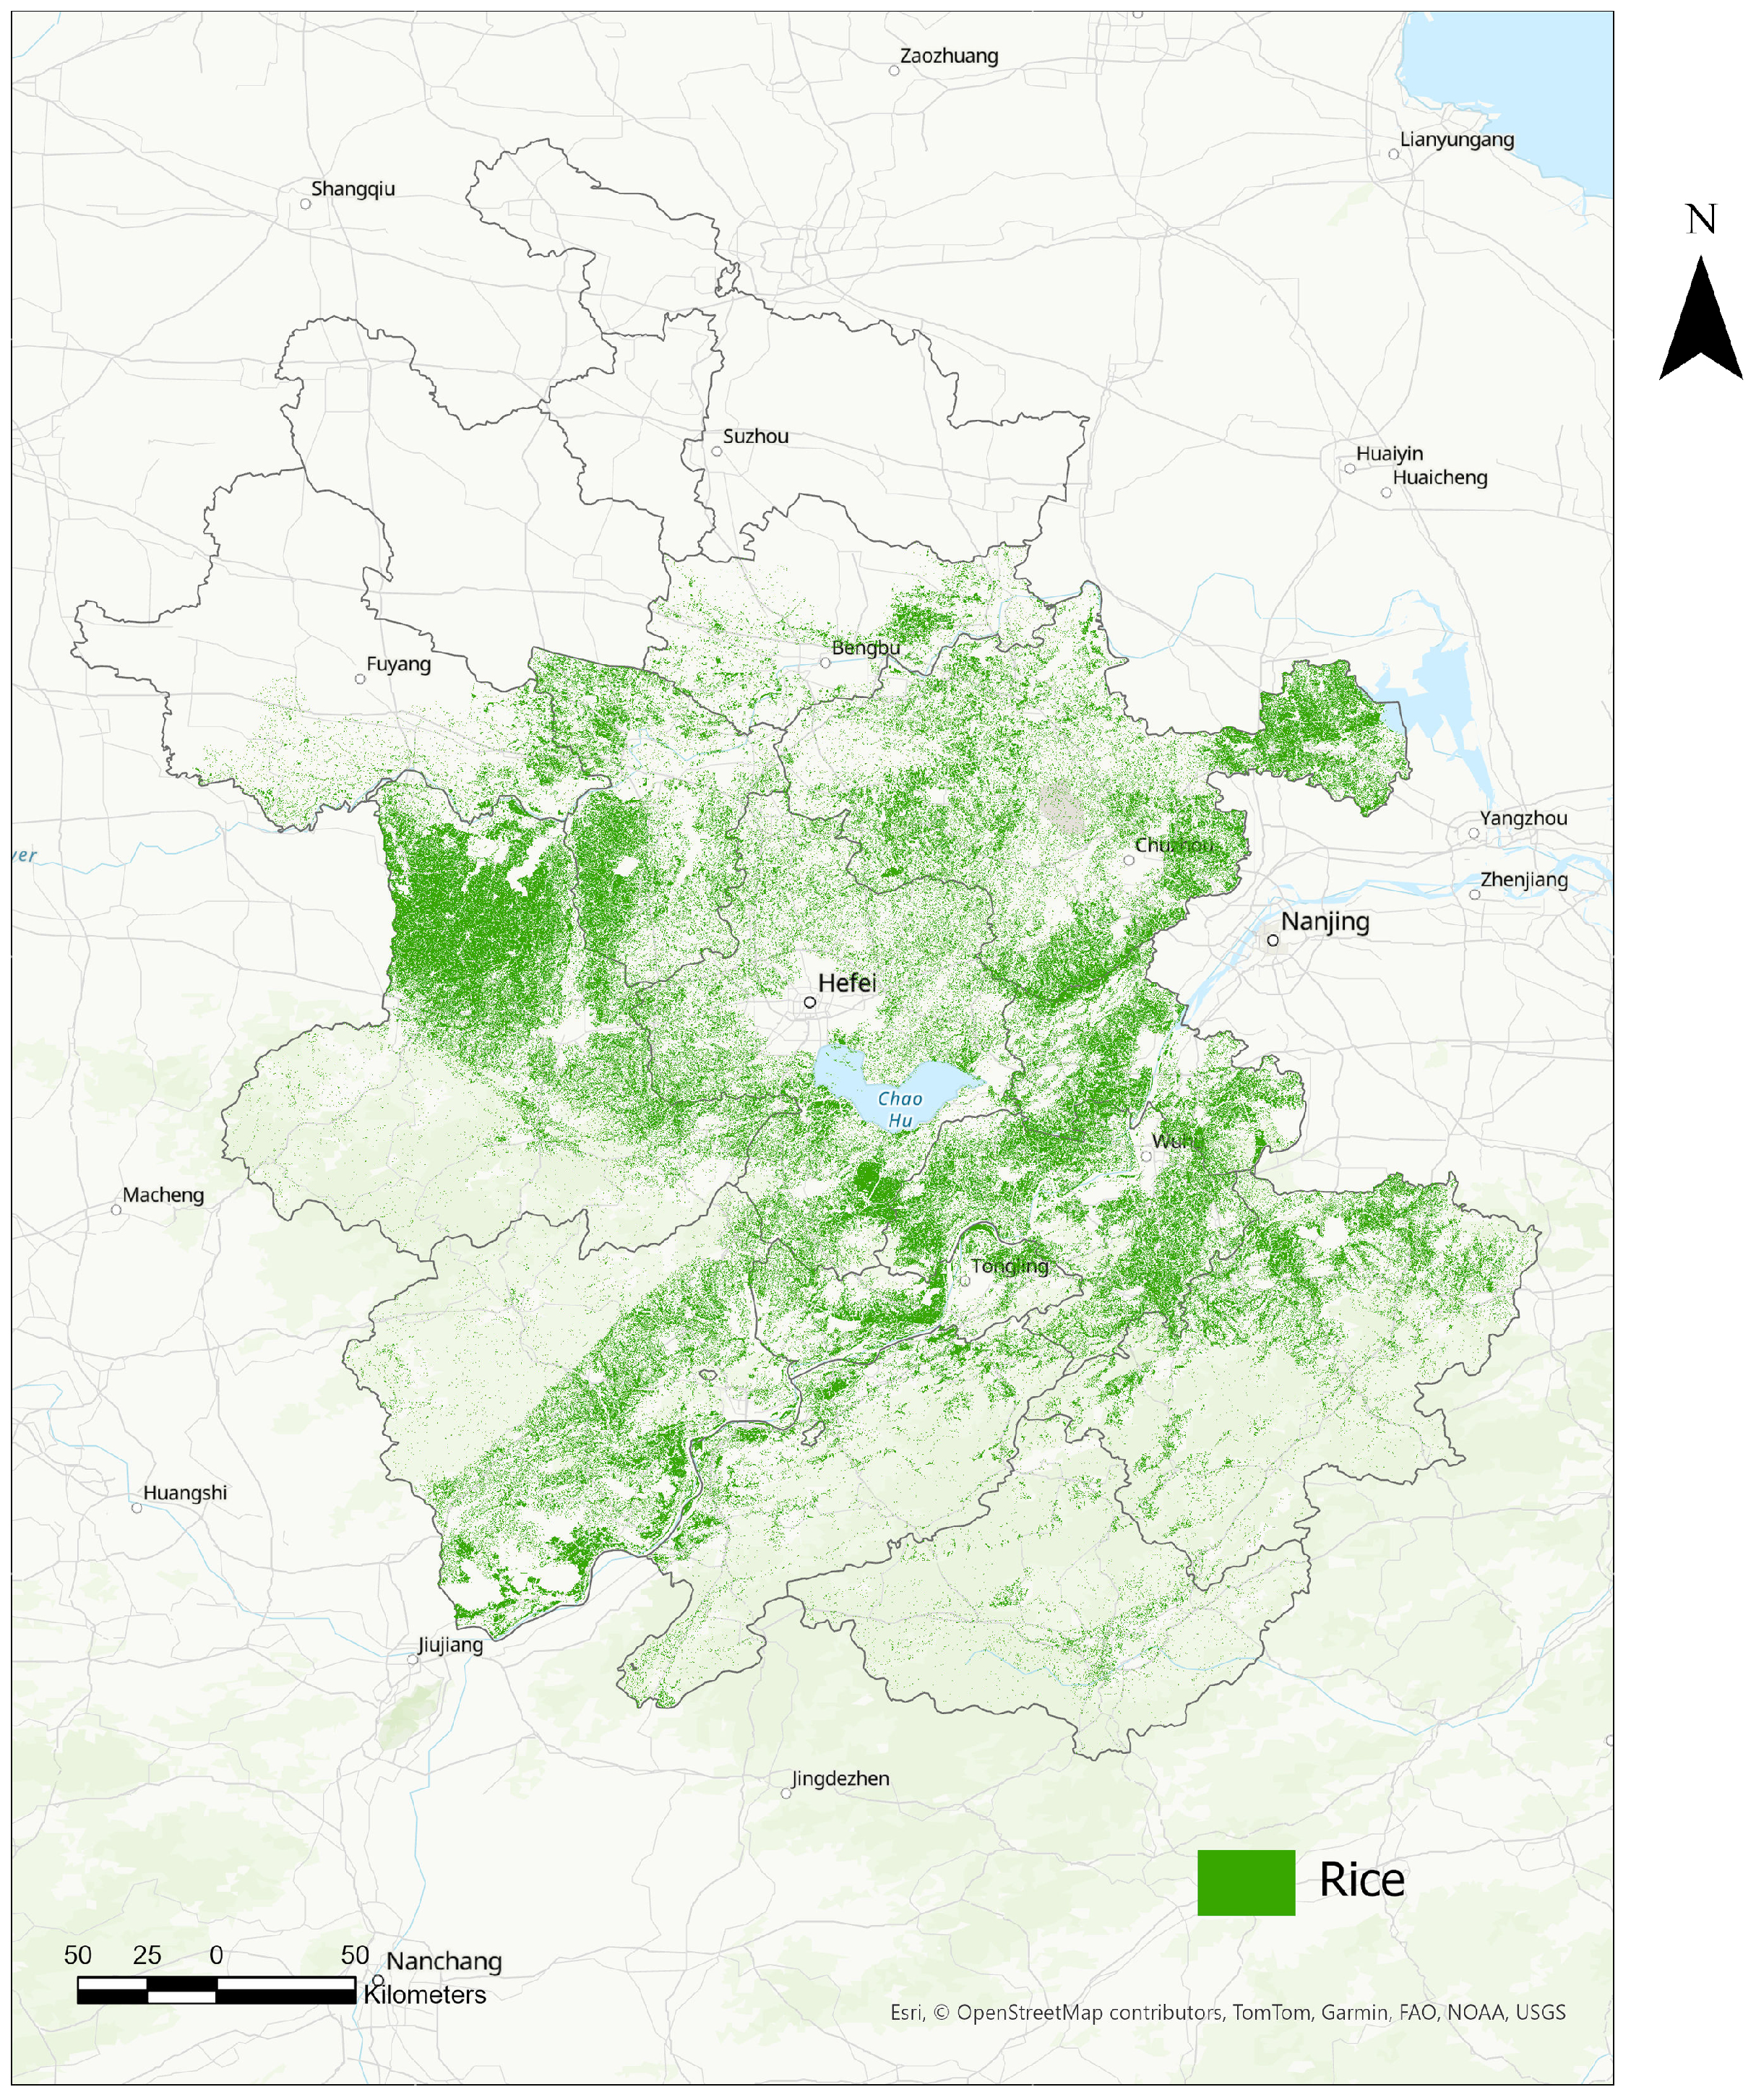
4.1. Rice Mapping Results
4.2. Classification Accuracy
4.2.1. Accuracy Validation from Confusion Matrix
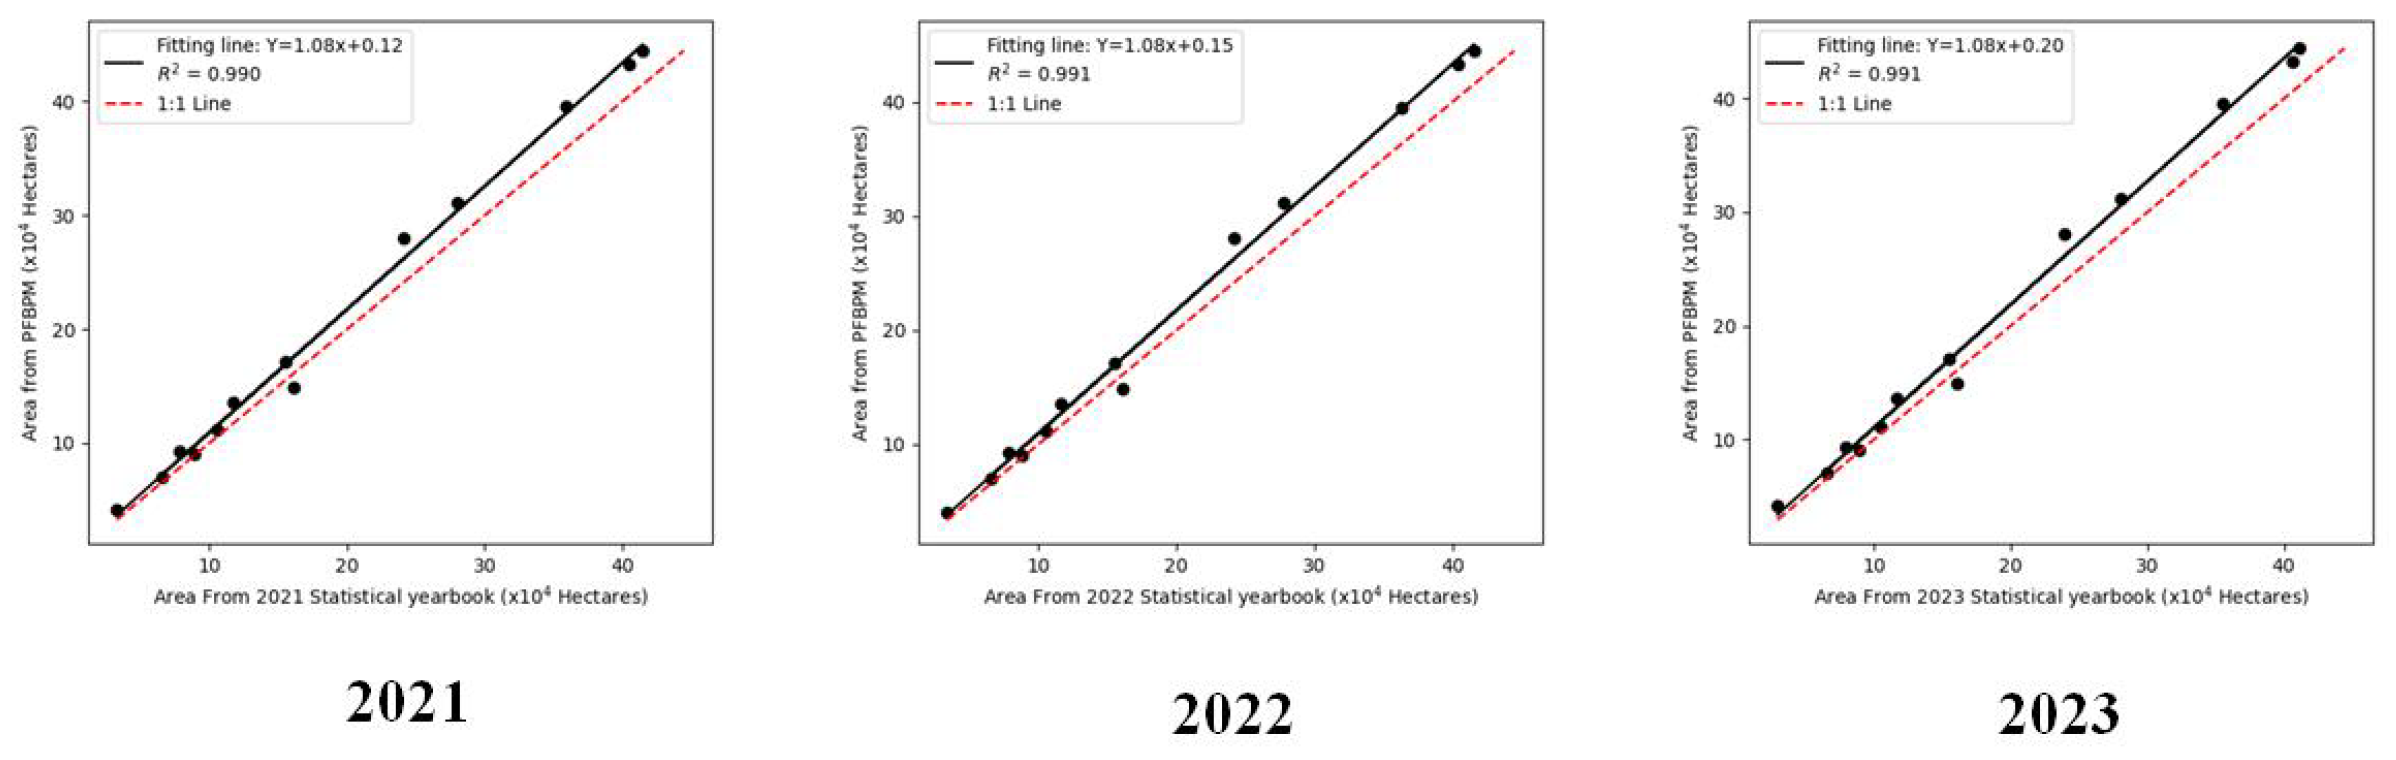
4.2.2. Accuracy Validation from Statistical Data
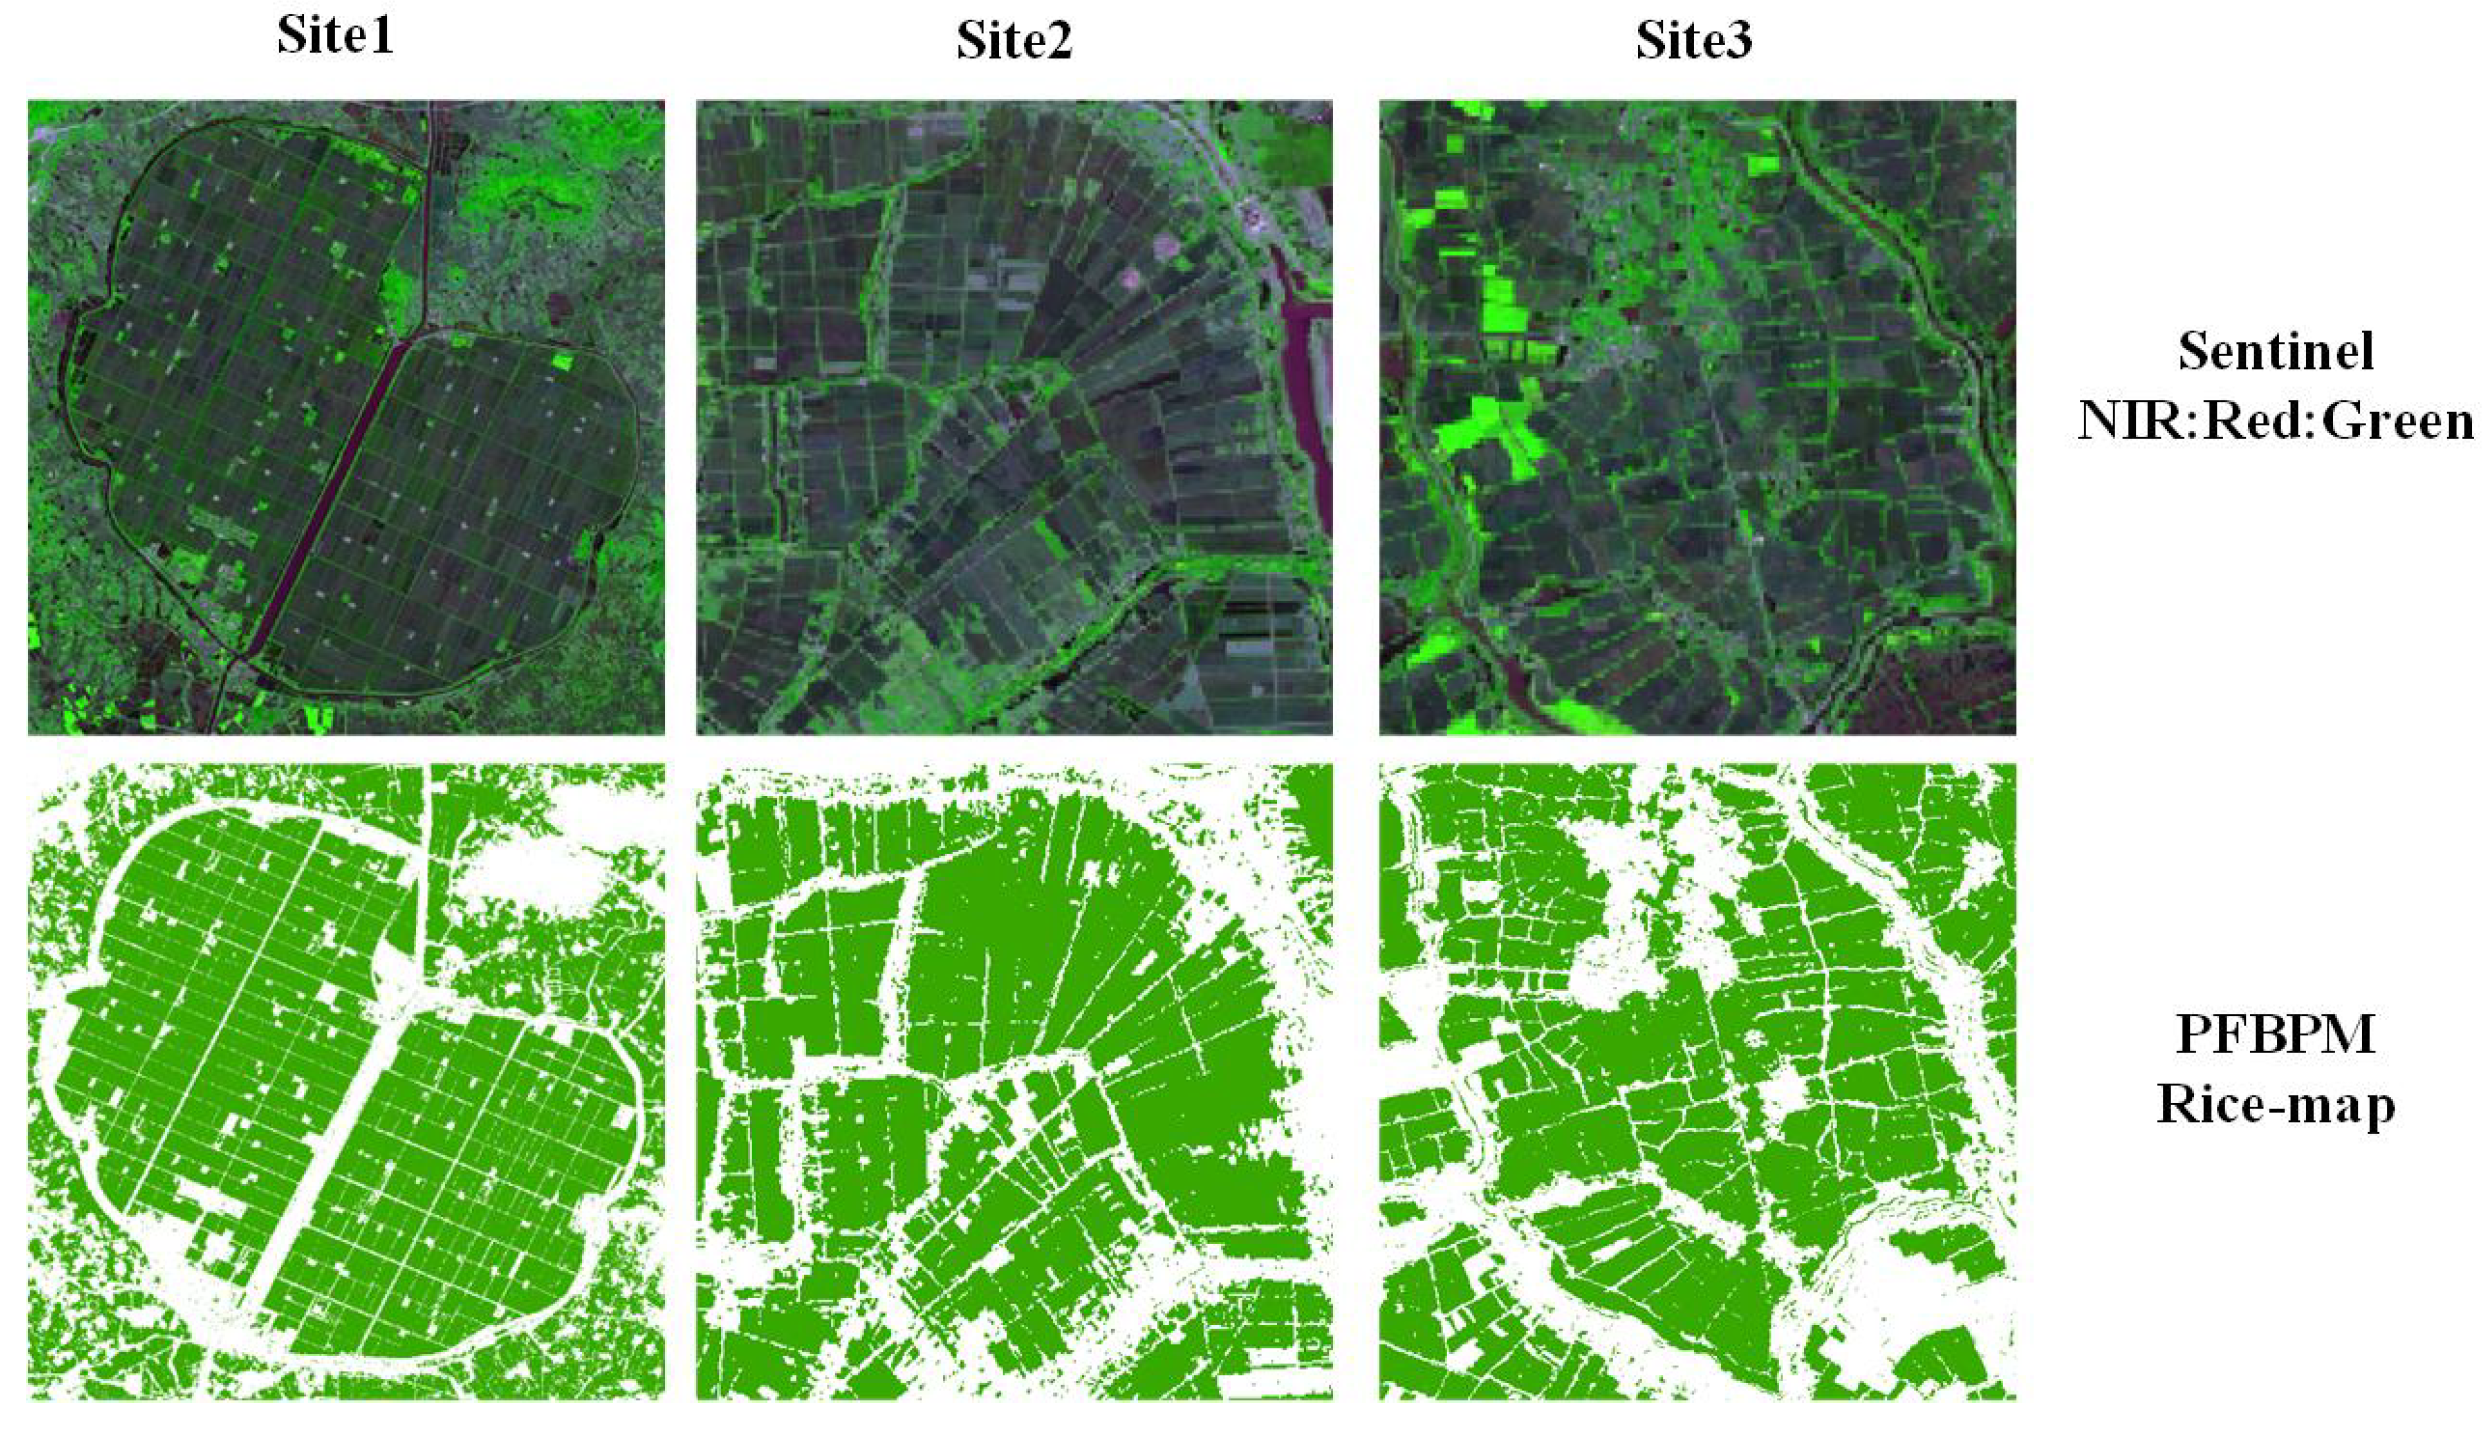
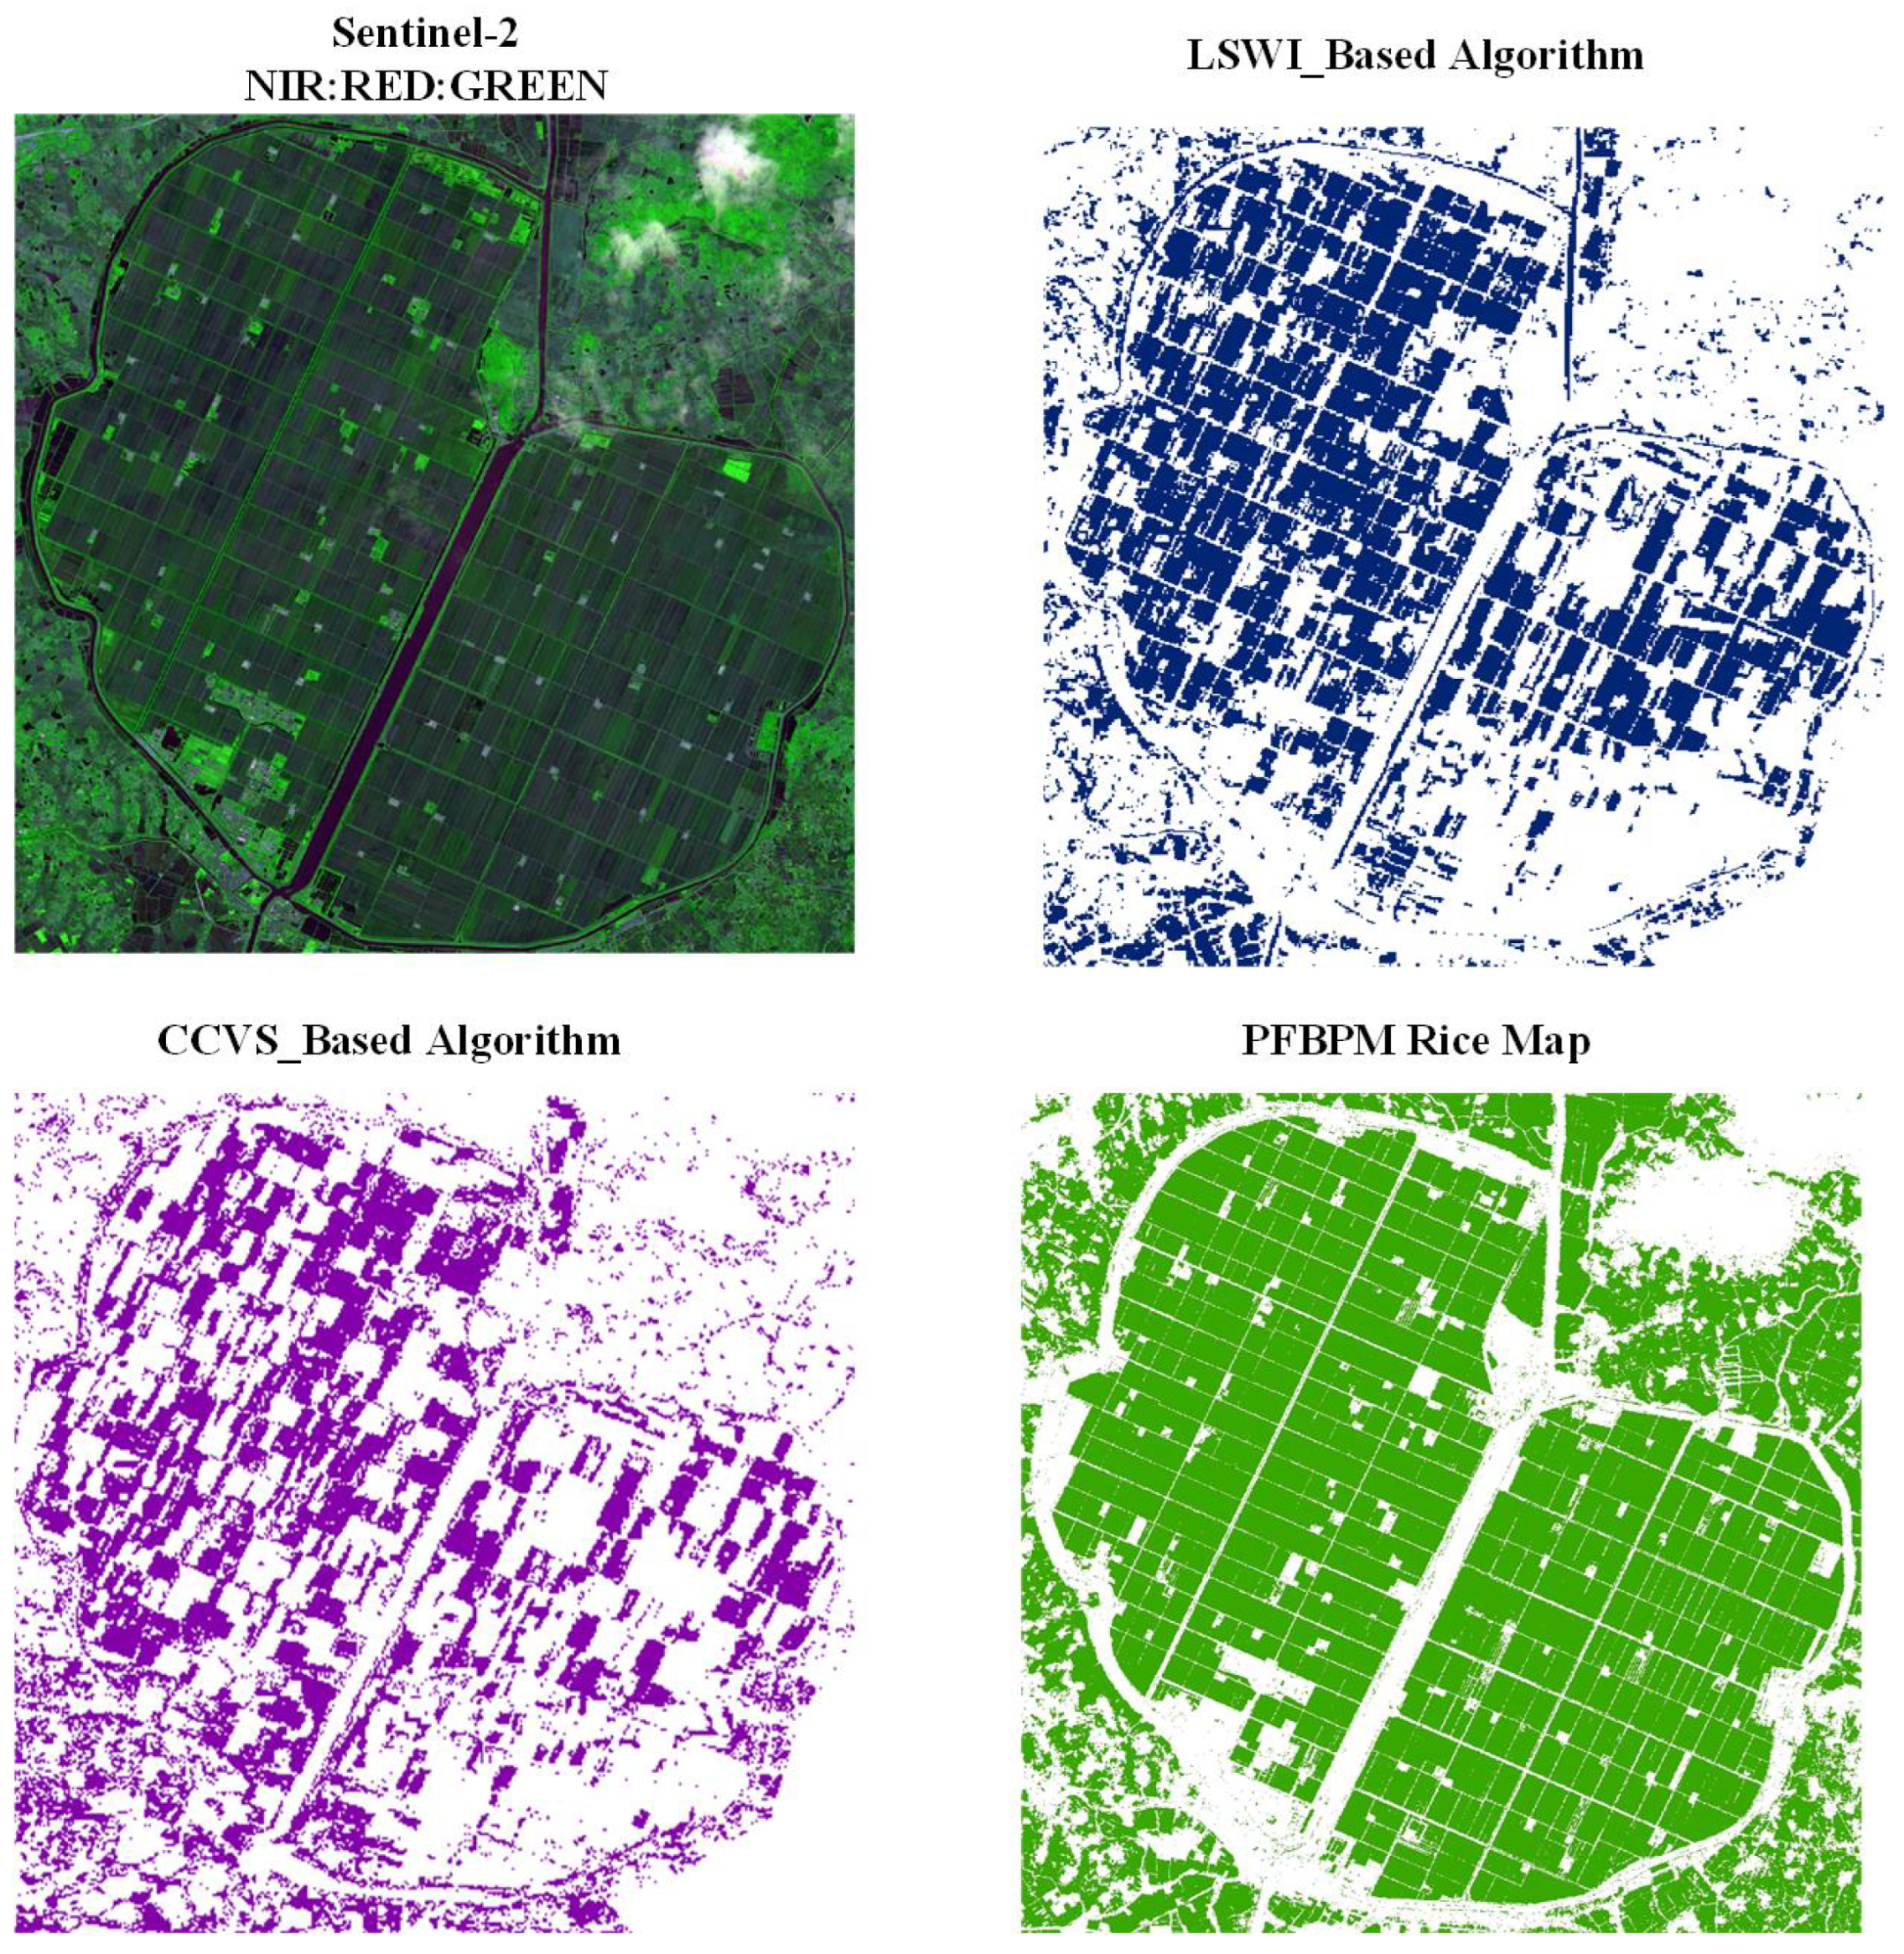
4.2.3. Comparison with Other Rice Mapping Products
5. Discussion
5.1. Phenological Features-Based Paddy Rice Mapping (PFBPM)
5.1.1. The Reliability of PFBPM
5.1.2. Trusted Training Sample Expansion
5.1.3. Image Composite Generation
5.1.4. One-Class Classifier
6. Extensive Implications and Uncertainty Analysis
7. Conclusions
Author Contributions
Funding
Data Availability Statement
Conflicts of Interest
References
- Kamaluddin, A.; Ala, A.; Ali, M.S.S.; Salman, D. The adaptation of rice paddy farmers towards climate change. Am.-Eurasian J. Agric. Environ. Sci. 2012, 12, 967–972. [Google Scholar]
- Nishimura, S.; Yonemura, S.; Sawamoto, T.; Shirato, Y.; Akiyama, H.; Sudo, S.; Yagi, K. Effect of land use change from paddy rice cultivation to upland crop cultivation on soil carbon budget of a cropland in Japan. Agric. Ecosyst. Environ. 2008, 125, 9–20. [Google Scholar] [CrossRef]
- Muthayya, S.; Sugimoto, J.D.; Montgomery, S.; Maberly, G.F. An overview of global rice production, supply, trade, and consumption. Ann. N. Y. Acad. Sci. 2014, 1324, 7–14. [Google Scholar] [CrossRef]
- Fairhurst, T.; Dobermann, A. Rice in the global food supply. World 2002, 5, 3–6. [Google Scholar]
- Epule, E.T.; Peng, C.; Mafany, N.M. Methane emissions from paddy rice fields: Strategies towards achieving a win-win sustainability scenario between rice production and methane emission reduction. J. Sustain. Dev. 2011, 4, 188. [Google Scholar] [CrossRef]
- Xiao, X.; He, L.; Salas, W.; Li, C.; Moore Iii, B.; Zhao, R.; Frolking, S.; Boles, S. Quantitative relationships between field-measured leaf area index and vegetation index derived from VEGETATION images for paddy rice fields. Int. J. Remote. Sens. 2002, 23, 3595–3604. [Google Scholar] [CrossRef]
- Wei, J.; Cui, Y.; Luo, W.; Luo, Y. Mapping paddy rice distribution and cropping intensity in China from 2014 to 2019 with landsat images, effective flood signals, and google earth engine. Remote Sens. 2022, 14, 759. [Google Scholar] [CrossRef]
- Han, J.; Zhang, Z.; Luo, Y.; Cao, J.; Zhang, L.; Cheng, F.; Zhuang, H.; Zhang, J.; Tao, F. NESEA-Rice10: High-resolution annual paddy rice maps for Northeast and Southeast Asia from 2017 to 2019. Earth Syst. Sci. Data 2021, 13, 5969–5986. [Google Scholar] [CrossRef]
- Qiu, B.; Li, W.; Tang, Z.; Chen, C.; Qi, W. Mapping paddy rice areas based on vegetation phenology and surface moisture conditions. Ecol. Indic. 2015, 56, 79–86. [Google Scholar] [CrossRef]
- Zhou, Y.; Xiao, X.; Qin, Y.; Dong, J.; Zhang, G.; Kou, W.; Jin, C.; Wang, J.; Li, X. Mapping paddy rice planting area in rice-wetland coexistent areas through analysis of Landsat 8 OLI and MODIS images. Int. J. Appl. Earth Obs. Geoinf. 2016, 46, 1–12. [Google Scholar] [CrossRef]
- Huang, X.; Liu, J.; Zhu, W.; Atzberger, C.; Liu, Q. The optimal threshold and vegetation index time series for retrieving crop phenology based on a modified dynamic threshold method. Remote Sens. 2019, 11, 2725. [Google Scholar] [CrossRef]
- Yang, H.; Pan, B.; Li, N.; Wang, W.; Zhang, J.; Zhang, X. A systematic method for spatio-temporal phenology estimation of paddy rice using time series Sentinel-1 images. Remote Sens. Environ. 2021, 259, 112394. [Google Scholar] [CrossRef]
- Singha, M.; Dong, J.; Sarmah, S.; You, N.; Zhou, Y.; Zhang, G.; Doughty, R.; Xiao, X. Identifying floods and flood-affected paddy rice fields in Bangladesh based on Sentinel-1 imagery and Google Earth Engine. ISPRS J. Photogramm. Remote Sens. 2020, 166, 278–293. [Google Scholar] [CrossRef]
- Torbick, N.; Chowdhury, D.; Salas, W.; Qi, J. Monitoring rice agriculture across myanmar using time series Sentinel-1 assisted by Landsat-8 and PALSAR-2. Remote Sens. 2017, 9, 119. [Google Scholar] [CrossRef]
- Cai, Y.; Lin, H.; Zhang, M. Mapping paddy rice by the object-based random forest method using time series Sentinel-1/Sentinel-2 data. Adv. Space Res. 2019, 64, 2233–2244. [Google Scholar] [CrossRef]
- Clauss, K.; Yan, H.; Kuenzer, C. Mapping paddy rice in China in 2002, 2005, 2010 and 2014 with MODIS time series. Remote Sens. 2016, 8, 434. [Google Scholar] [CrossRef]
- Zhang, M.; Lin, H.; Wang, G.; Sun, H.; Fu, J. Mapping paddy rice using a convolutional neural network (CNN) with Landsat 8 datasets in the Dongting Lake Area, China. Remote Sens. 2018, 10, 1840. [Google Scholar] [CrossRef]
- Ni, R.; Tian, J.; Li, X.; Yin, D.; Li, J.; Gong, H.; Zhang, J.; Zhu, L.; Wu, D. An enhanced pixel-based phenological feature for accurate paddy rice mapping with Sentinel-2 imagery in Google Earth Engine. ISPRS J. Photogramm. Remote. Sens. 2021, 178, 282–296. [Google Scholar] [CrossRef]
- Zhang, W.; Liu, H.; Wu, W.; Zhan, L.; Wei, J. Mapping rice paddy based on machine learning with Sentinel-2 multi-temporal data: Model comparison and transferability. Remote Sens. 2020, 12, 1620. [Google Scholar] [CrossRef]
- Zhang, C.; Zhang, H.; Tian, S. Phenology-assisted supervised paddy rice mapping with the Landsat imagery on Google Earth Engine: Experiments in Heilongjiang Province of China from 1990 to 2020. Comput. Electron. Agric. 2023, 212, 108105. [Google Scholar] [CrossRef]
- Google. GEE Database:Sentinel-1. 2024. Available online: https://developers.google.com/earth-engine/datasets/catalog/COPERNICUS_S1_GRD (accessed on 10 July 2024).
- Google. GEE Database:Sentinel-2. 2024. Available online: https://developers.google.com/earth-engine/datasets/catalog/sentinel-2 (accessed on 10 July 2024).
- Karra, K.; Kontgis, C.; Statman-Weil, Z.; Mazzariello, J.C.; Mathis, M.; Brumby, S.P. Global land use/land cover with Sentinel 2 and deep learning. In Proceedings of the 2021 IEEE International Geoscience and Remote Sensing Symposium IGARSS, Brussels, Belgium, 11–16 July 2021; pp. 4704–4707. [Google Scholar]
- Xiao, X.; Boles, S.; Liu, J.; Zhuang, D.; Frolking, S.; Li, C.; Salas, W.; Moore, B., III. Mapping paddy rice agriculture in southern China using multi-temporal MODIS images. Remote Sens. Environ. 2005, 95, 480–492. [Google Scholar] [CrossRef]
- Liu, J.; Li, L.; Huang, X.; Liu, Y.; Li, T. Mapping paddy rice in Jiangsu Province, China, based on phenological parameters and a decision tree model. Front. Earth Sci. 2019, 13, 111–123. [Google Scholar] [CrossRef]
- Tian, H.; Wu, M.; Wang, L.; Niu, Z. Mapping early, middle and late rice extent using sentinel-1A and Landsat-8 data in the poyang lake plain, China. Sensors 2018, 18, 185. [Google Scholar] [CrossRef] [PubMed]
- Sukmono, A.; Nugraha, A.L.; Firdaus, H.S. Integration of Leaf Water Content Index (LWCI) and Enhanced Vegetation Index (EVI) for Stress Detection of Rice Plant Using Landsat 8 Satellitte Imagery. KnE Eng. 2019, 398–408. [Google Scholar] [CrossRef]
- Sitokonstantinou, V.; Koukos, A.; Drivas, T.; Kontoes, C.; Papoutsis, I.; Karathanassi, V. A scalable machine learning pipeline for paddy rice classification using multi-temporal sentinel data. Remote Sens. 2021, 13, 1769. [Google Scholar] [CrossRef]
- Merzlyak, M.N.; Gitelson, A.A.; Chivkunova, O.B.; Rakitin, V.Y. Non-destructive optical detection of pigment changes during leaf senescence and fruit ripening. Physiol. Plant. 1999, 106, 135–141. [Google Scholar] [CrossRef]
- Gitelson, A.A.; Gritz, Y.; Merzlyak, M.N. Relationships between leaf chlorophyll content and spectral reflectance and algorithms for non-destructive chlorophyll assessment in higher plant leaves. J. Plant Physiol. 2003, 160, 271–282. [Google Scholar] [CrossRef] [PubMed]
- Saadat, M.; Hasanlou, M.; Homayouni, S. Rice crop mapping using Sentinel-1 time series images (Case study: Mazandaran, Iran). Int. Arch. Photogramm. Remote Sens. Spat. Inf. Sci. 2019, 42, 897–904. [Google Scholar] [CrossRef]
- Mohite, J.; Sawant, S.; Kumar, A.; Prajapati, M.; Pusapati, S.; Singh, D.; Pappula, S. Operational near real time rice area mapping using multi-temporal sentinel-1 sar observations. Int. Arch. Photogramm. Remote Sens. Spat. Inf. Sci. 2018, 42, 433–438. [Google Scholar] [CrossRef]
- Bazzi, H.; Baghdadi, N.; El Hajj, M.; Zribi, M.; Minh, D.H.T.; Ndikumana, E.; Courault, D.; Belhouchette, H. Mapping paddy rice using Sentinel-1 SAR time series in Camargue, France. Remote Sens. 2019, 11, 887. [Google Scholar] [CrossRef]
- Tucker, C.J. Red and photographic infrared linear combinations for monitoring vegetation. Remote Sens. Environ. 1979, 8, 127–150. [Google Scholar] [CrossRef]
- Huete, A.; Didan, K.; Miura, T.; Rodriguez, E.P.; Gao, X.; Ferreira, L.G. Overview of the radiometric and biophysical performance of the MODIS vegetation indices. Remote Sens. Environ. 2002, 83, 195–213. [Google Scholar] [CrossRef]
- Wang, L.; Chen, S.; Peng, Z.; Huang, J.; Wang, C.; Jiang, H.; Zheng, Q.; Li, D. Phenology effects on physically based estimation of paddy rice canopy traits from UAV hyperspectral imagery. Remote Sens. 2021, 13, 1792. [Google Scholar] [CrossRef]
- Nguyen, D.B.; Wagner, W. European rice cropland mapping with Sentinel-1 data: The Mediterranean region case study. Water 2017, 9, 392. [Google Scholar] [CrossRef]
- Dong, J.; Xiao, X.; Menarguez, M.A.; Zhang, G.; Qin, Y.; Thau, D.; Biradar, C.; Moore, B., III. Mapping paddy rice planting area in northeastern Asia with Landsat 8 images, phenology-based algorithm and Google Earth Engine. Remote Sens. Environ. 2016, 185, 142–154. [Google Scholar] [CrossRef]
- Ning, J.; Liu, J.; Kuang, W.; Xu, X.; Zhang, S.; Yan, C.; Li, R.; Wu, S.; Hu, Y.; Du, G.; et al. Spatiotemporal patterns and characteristics of land-use change in China during 2010–2015. J. Geogr. Sci. 2018, 28, 547–562. [Google Scholar] [CrossRef]
- Zekoll, V.; Main-Knorn, M.; Alonso, K.; Louis, J.; Frantz, D.; Richter, R.; Pflug, B. Comparison of masking algorithms for sentinel-2 imagery. Remote Sens. 2021, 13, 137. [Google Scholar] [CrossRef]
- Coluzzi, R.; Imbrenda, V.; Lanfredi, M.; Simoniello, T. A first assessment of the Sentinel-2 Level 1-C cloud mask product to support informed surface analyses. Remote Sens. Environ. 2018, 217, 426–443. [Google Scholar] [CrossRef]
- Xin, F.; Xiao, X.; Dong, J.; Zhang, G.; Zhang, Y.; Wu, X.; Li, X.; Zou, Z.; Ma, J.; Du, G.; et al. Large increases of paddy rice area, gross primary production, and grain production in Northeast China during 2000–2017. Sci. Total Environ. 2020, 711, 135183. [Google Scholar] [CrossRef]
- Rossi, C.; Erten, E. Paddy-rice monitoring using TanDEM-X. IEEE Trans. Geosci. Remote Sens. 2014, 53, 900–910. [Google Scholar] [CrossRef]
- Wang, Q.; Tenhunen, J.D. Vegetation mapping with multitemporal NDVI in North Eastern China transect (NECT). Int. J. Appl. Earth Obs. Geoinf. 2004, 6, 17–31. [Google Scholar] [CrossRef]
- Fensholt, R.; Horion, S.; Tagesson, T.; Ehammer, A.; Ivits, E.; Rasmussen, K. Global-scale mapping of changes in ecosystem functioning from earth observation-based trends in total and recurrent vegetation. Glob. Ecol. Biogeogr. 2015, 24, 1003–1017. [Google Scholar] [CrossRef]
- Xu, X.; Ji, X.; Jiang, J.; Yao, X.; Tian, Y.; Zhu, Y.; Cao, W.; Cao, Q.; Yang, H.; Shi, Z.; et al. Evaluation of one-class support vector classification for mapping the paddy rice planting area in Jiangsu Province of China from Landsat 8 OLI imagery. Remote Sens. 2018, 10, 546. [Google Scholar] [CrossRef]
- Zhang, X.; Yang, G.; Xu, X.; Yao, X.; Zheng, H.; Zhu, Y.; Cao, W.; Cheng, T. An assessment of Planet satellite imagery for county-wide mapping of rice planting areas in Jiangsu Province, China with one-class classification approaches. Int. J. Remote Sens. 2021, 42, 7610–7635. [Google Scholar] [CrossRef]
- Xiao, Y.; Wang, H.; Xu, W. Parameter selection of Gaussian kernel for one-class SVM. IEEE Trans. Cybern. 2014, 45, 941–953. [Google Scholar] [CrossRef] [PubMed]
- López-Andreu, F.J.; Erena, M.; Dominguez-Gómez, J.A.; López-Morales, J.A. Sentinel-2 images and machine learning as tool for monitoring of the common agricultural policy: Calasparra rice as a case study. Agronomy 2021, 11, 621. [Google Scholar] [CrossRef]
- Park, S.; Im, J.; Park, S.; Yoo, C.; Han, H.; Rhee, J. Classification and mapping of paddy rice by combining Landsat and SAR time series data. Remote Sens. 2018, 10, 447. [Google Scholar] [CrossRef]
- Zhang, G.; Xiao, X.; Biradar, C.M.; Dong, J.; Qin, Y.; Menarguez, M.A.; Zhou, Y.; Zhang, Y.; Jin, C.; Wang, J.; et al. Spatiotemporal patterns of paddy rice croplands in China and India from 2000 to 2015. Sci. Total Environ. 2017, 579, 82–92. [Google Scholar] [CrossRef] [PubMed]
- Zhang, M.; Lin, H. Object-based rice mapping using time-series and phenological data. Adv. Space Res. 2019, 63, 190–202. [Google Scholar] [CrossRef]


| Phenology Stage | Indices | Day of Year (DOY) |
|---|---|---|
| The flooding period | LSWI, NDVI | 160–210 |
| The growing period | EVI, GCVI, VV/VH | 220–280 |
| The ripening period | PSRI, NDVI | 280–320 |
| Metric | Formula |
|---|---|
| User’s Accuracy (UA) | |
| Producer’s Accuracy (PA) | |
| Overall Accuracy (OA) | |
| Kappa Coefficient (KC) | and |
| Region | Rice | Others | UA (%) | PA (%) | OA (%) | Kappa (%) | |
|---|---|---|---|---|---|---|---|
| Anhui | Rice | 8420 | 826 | 91 | 94 | 92 | 86 |
| Others | 457 | 8117 | 94 | 90 | 92 | 86 | |
| Hefei | Rice | 2151 | 96 | 95 | 93 | 94 | 89 |
| Others | 143 | 1862 | 92 | 95 | 93 | 89 | |
| Lu’an | Rice | 1524 | 104 | 94 | 98 | 93 | 85 |
| Others | 133 | 1292 | 91 | 92 | 93 | 85 | |
| Chu’zhou | Rice | 1835 | 141 | 93 | 93 | 93 | 86 |
| Others | 127 | 1549 | 92 | 92 | 93 | 86 |
| City | Hefei | Bengbu | Huainan | Chuzhou | Luan | Wuhu | Xuancheng | Anqing |
|---|---|---|---|---|---|---|---|---|
| Yearbook Record | 35.52 | 10.41 | 28.04 | 41.13 | 40.60 | 16.04 | 15.46 | 23.97 |
| Mapping Result | 38.53 | 11.13 | 30.15 | 44.69 | 43.28 | 17.83 | 17.11 | 26.04 |
| Errors(%) | 8.47 | 6.92 | 7.52 | 8.66 | 6.60 | 11.27 | 10.67 | 8.64 |
Disclaimer/Publisher’s Note: The statements, opinions and data contained in all publications are solely those of the individual author(s) and contributor(s) and not of MDPI and/or the editor(s). MDPI and/or the editor(s) disclaim responsibility for any injury to people or property resulting from any ideas, methods, instructions or products referred to in the content. |
© 2024 by the authors. Licensee MDPI, Basel, Switzerland. This article is an open access article distributed under the terms and conditions of the Creative Commons Attribution (CC BY) license (https://creativecommons.org/licenses/by/4.0/).
Share and Cite
Wang, Z.; Sun, X.; Liu, X.; Xu, F.; Huang, H.; Ti, R.; Yu, H.; Wang, Y.; Wei, Y. Improved Paddy Rice Classification Utilizing Sentinel-1/2 Imagery in Anhui China: Phenological Features, Algorithms, Validation and Analysis. Agriculture 2024, 14, 1282. https://doi.org/10.3390/agriculture14081282
Wang Z, Sun X, Liu X, Xu F, Huang H, Ti R, Yu H, Wang Y, Wei Y. Improved Paddy Rice Classification Utilizing Sentinel-1/2 Imagery in Anhui China: Phenological Features, Algorithms, Validation and Analysis. Agriculture. 2024; 14(8):1282. https://doi.org/10.3390/agriculture14081282
Chicago/Turabian StyleWang, Zeling, Xiaobing Sun, Xiao Liu, Feifei Xu, Honglian Huang, Rufang Ti, Haixiao Yu, Yuxuan Wang, and Yichen Wei. 2024. "Improved Paddy Rice Classification Utilizing Sentinel-1/2 Imagery in Anhui China: Phenological Features, Algorithms, Validation and Analysis" Agriculture 14, no. 8: 1282. https://doi.org/10.3390/agriculture14081282
APA StyleWang, Z., Sun, X., Liu, X., Xu, F., Huang, H., Ti, R., Yu, H., Wang, Y., & Wei, Y. (2024). Improved Paddy Rice Classification Utilizing Sentinel-1/2 Imagery in Anhui China: Phenological Features, Algorithms, Validation and Analysis. Agriculture, 14(8), 1282. https://doi.org/10.3390/agriculture14081282