Review

Research on Nondestructive Inspection of Fruits Based on Spectroscopy Techniques: Experimental Scenarios, ROI, Number of Samples, and Number of Features

1
Modern Agricultural Equipment Research Institute, School of Mechanical Engineering, Xihua University, Chengdu 610039, China
2
School of Mechanical Engineering, Xihua University, Chengdu 610039, China
3
Department of Computer Science, University of Aberdeen, Aberdeen AB24 3FX, UK
*
Author to whom correspondence should be addressed.
Agriculture 2024, 14(7), 977; https://doi.org/10.3390/agriculture14070977
Submission received: 22 April 2024 / Revised: 19 June 2024 / Accepted: 21 June 2024 / Published: 23 June 2024
(This article belongs to the Section Digital Agriculture)

Abstract

:
Spectral technology is a scientific method used to study and analyze substances. In recent years, the role of spectral technology in the non-destructive testing (NDT) of fruits has become increasingly important, and it is expected that its application in the NDT of fruits will be promoted in the coming years. However, there are still challenges in terms of dataset collection methods. This article aims to enhance the effectiveness of spectral technology in NDT of citrus and other fruits and to apply this technology in orchard environments. Firstly, the principles of spectral imaging systems and chemometric methods in spectral analysis are summarized. In addition, while collecting fruit samples, selecting an experimental environment is crucial for the study of maturity classification and pest detection. Subsequently, this article elaborates on the methods for selecting regions of interest (ROIs) for fruits in this field, considering both quantitative and qualitative perspectives. Finally, the impact of sample size and feature size selection on the experimental process is discussed, and the advantages and limitations of the current research are analyzed. Therefore, future research should focus on addressing the challenges of spectroscopy techniques in the non-destructive inspection of citrus and other fruits to improve the accuracy and stability of the inspection process. At the same time, achieving the collection of spectral data of citrus samples in orchard environments, efficiently selecting regions of interest, scientifically selecting sample and feature quantities, and optimizing the entire dataset collection process are critical future research directions. Such efforts will help to improve the application efficiency of spectral technology in the fruit industry and provide broad opportunities for further research.

1. Introduction

Fruits are an essential part of our daily life and are rich in nutrients. For example, citrus, which mainly grows in hot and subtropical regions, has become one of the main fruits in the world because it is rich in vitamin C, vitamin B6, dietary fiber, sugar, potassium, calcium, and other advantages [1,2]. With the continuous improvement of China’s national living standards, China’s fruit production has shown an apparent upward trend. According to the data released by the National Bureau of Statistics, it grew from 256,883,500 tons in 2018 to 327,442,800 tons in 2023, with sufficient growth momentum [3].
Fruits are becoming increasingly important in our daily lives, and the research on non-destructive testing (NDT) of fruits is also receiving more attention. The importance of NDT for fruits cannot be ignored. Firstly, NDT helps to ensure the safety and health of fruits. For example, through testing, harmful residues or pests in fruits can be detected promptly, and remedial measures can be taken to protect consumers’ health rights and interests and enhance consumers’ trust in fruits [4]. Secondly, NDT also helps to improve the commercialization level of fruits. For example, by testing fruits’ size, weight, and internal component content, it is possible to screen out fruits with beautiful appearance and good quality and enhance their added value in the market [5]. In addition, non-destructive testing of fruits is crucial for their storage periods [6]. Regular quality testing can ensure that the quality of fruits is effectively maintained during storage. For example, quality testing can promptly identify critical indicators in fruits, such as ripeness, texture, and sugar content, which directly affect the storage period of fruits. Based on the test results, corresponding storage measures can be taken, such as adjusting the storage temperature, humidity, ventilation, and other conditions to extend the storage periods of fruits [7]. Most importantly, NDT is an essential means to ensure the sustainable development of the fruit industry. Only by ensuring that the quality of fruits is stable can we maintain the sustained consumer demand and promote the citrus industry’s healthy development. Therefore, strengthening quality testing and improving fruit quality plays an irreplaceable role in guaranteeing the sustainable development of the fruit industry.
Spectroscopy is a scientific method used to study and analyze states of matter involving light interactions and dispersion. This technique utilizes the properties of substances in terms of absorption, scattering, or emission of light at different wavelengths to obtain information about the composition, structure, and properties of substances. Spectroscopy techniques can be categorized into various types. Some of the common ones include hyperspectral, near-infrared spectroscopy, mid-infrared spectroscopy, Raman spectroscopy, ultraviolet-visible (UV-Vis) spectroscopy, molecular fluorescence spectroscopy, etc. [8]. These spectroscopy techniques have a wide range of applications in fields such as agronomy, medicine, physics, and environmental sciences, providing researchers with tools to gain insight into the properties of substances.
In quality testing, spectroscopy techniques can obtain spectral profiles by measuring light reflected or absorbed at specific wavelengths by agricultural products. These profiles contain spectral characteristics of the substance of interest, such as the soluble solid content (SSC) [9], sugar content [10], and water content [11] of the fruit. By analyzing these features, product quality can be assessed quickly and accurately. Produce with different maturity levels exhibit different characteristics on the spectrum. Spectroscopy techniques can determine the maturity of fruits, vegetables, or other agricultural products to select the appropriate harvest time and improve the quality of the products [12,13]. In pesticide residue detection, spectroscopic technology can identify the unique fingerprints of different pesticides on the spectrum. By collecting spectral data from a sample and comparing it to a library of spectra of known pesticides, the presence of pesticide residues in agricultural products can be detected. Regarding nutrient analysis, spectral technology can detect the nutrients of farm products, such as proteins, fats, and sugars. Since different components exhibit different spectral features at different wavelengths, spectroscopic techniques are analyzed by these features to provide accurate component contents. For example, Choi J.-H. et al. collected spectral data using NIR spectroscopic techniques followed by regression analysis of the sugar content of pears using a partial least squares regression model, which showed that the calibrated relative standard error or predicted relative standard error (rSEC/rSEP) = 0.91–0.92 [14]. The nutrient content of agricultural products directly affects their quality. By analyzing the nutrient content through spectroscopic technology, farmers and producers can implement fine quality control to ensure that the products meet market demands and standards. Regarding disease detection in agricultural products, their tissues show abnormal spectral characteristics when plants are infected with diseases. Spectroscopy can detect these abnormalities and help in the early detection of plant diseases. Spectroscopy techniques can provide information about the type and extent of plant diseases. This helps farmers to take timely measures to reduce the spread of diseases and protect the growth and yield of agricultural products [15]. Overall, applying spectroscopy techniques in these areas provides agriculture with efficient, non-destructive tools that help farmers and producers better manage agricultural products’ production, quality, and safety.
The application of spectroscopic technology in fruit production can effectively improve aspects of production efficiency such as ripeness classification, detection of physicochemical properties, defect detection, pest and disease detection, and other aspects. Many aspects of fruit production can be further developed under the impetus of this technology. This paper reviews the selection of the environment, the selection region of interest, the selection of the number of samples, and the number of spectral features of the experiments of spectroscopic techniques in the process of non-destructive testing of citrus and other fruits. It also analyzes the current problems and prospects for future research to achieve the collection of spectral data of fruit samples in orchard environments, the more efficient selection of the region of interest, and the scientific selection of the number of samples and the number of features.

2. Spectral Imaging Technique

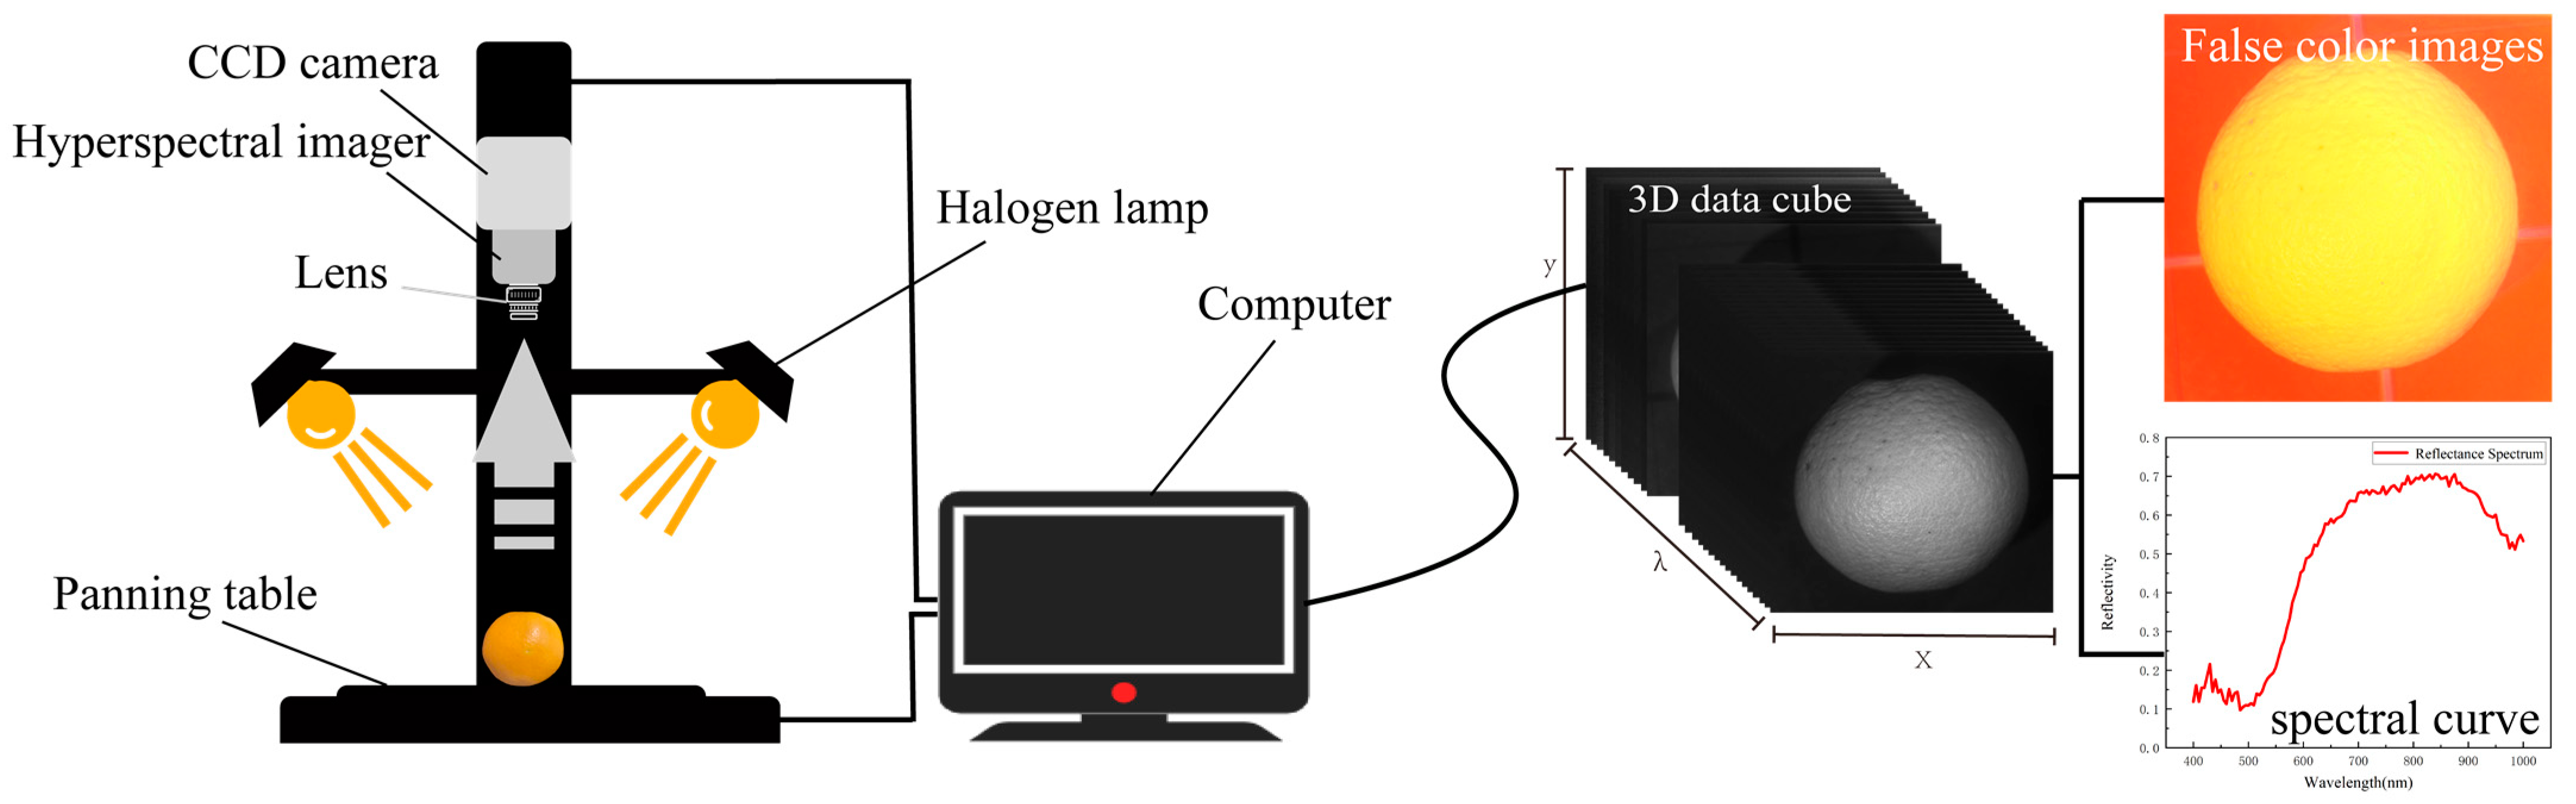
2.1. Principles of Spectroscopy

Spectral imaging technology combines imaging and spectral measurement techniques, simultaneously acquiring image and spectral information to form a “data cube” containing spectral radiation information in two dimensions and wavelength distribution. Figure 1 shows a schematic of a hyperspectral reflectance imaging system based on a laboratory environment. Since traditional single-band photodetection spectrometers are only capable of acquiring specified wavelength or bandwidth photon signals, they provide very little information. In contrast, hyperspectral techniques can provide richer information about the target scene [16].
According to the number of spectral bands and spectral resolution, spectral imaging technology can be roughly divided into three categories: (1) multispectral imaging technology, where the acquired image data has only a few spectral bands, the spectral resolution is generally about 100 nm, and the multispectral imager is usually called a multispectral camera [17]; (2) hyperspectral imaging technology, with dozens of spectral bands, where the spectral resolution is generally about 10 nm [18]; (3) and ultra-spectral imaging technology. Acquired image data usually have several hundred spectral bands, and the spectral resolution is usually below 1 nm [19].
Multi-spectral imaging technology acquires the spectral information of the same target in different bands synchronously by splitting the electromagnetic wave radiation into several narrow spectral bands and scanning it. Multi-spectral imaging technology shows its excellent application value when facing complex and changing external environments and fruits with different shapes. The technology can simultaneously process visible and infrared spectral images to capture the external and internal feature information of fruit, and to realize precise detection and diagnostic research on the growth conditions of fruits [20,21].
Among these three categories, hyperspectral imaging techniques in fruits has been extensively studied [22,23,24]. Hyperspectral imaging combines imaging and spectroscopic techniques to capture continuous spectral data of a specific object and generate spectral images. Imaging technology provides visual information, spectral technology reveals spectral properties, and the integrated approach accurately resolves the composition and chemical properties of substances, providing a basis for analyzing and evaluating target properties. Hyperspectral imaging provides richer spatial, visual, and spectral information than traditional techniques [25].
Ultra-spectral imaging is a technique that utilizes imaging spectrometers to acquire many very narrow, spectrally continuous image data in the visible (400–700 nm), near-infrared (700–2500 nm), mid-infrared (2500–25,000 nm), and thermal-infrared (25,000–100,000 nm) wavelength ranges of the electromagnetic spectrum [26]. This technique has a wide range of applications in remote sensing, medical imaging, agriculture, and environmental monitoring [27]. As it provides detailed spectral information, it helps to identify and analyze the target substance’s chemical composition and structural properties. For example, Antony, M.M. et al. [19] used spectral libraries generated by a hyperspectral imaging system to automatically classify healthy abnormal samples of cabbage.

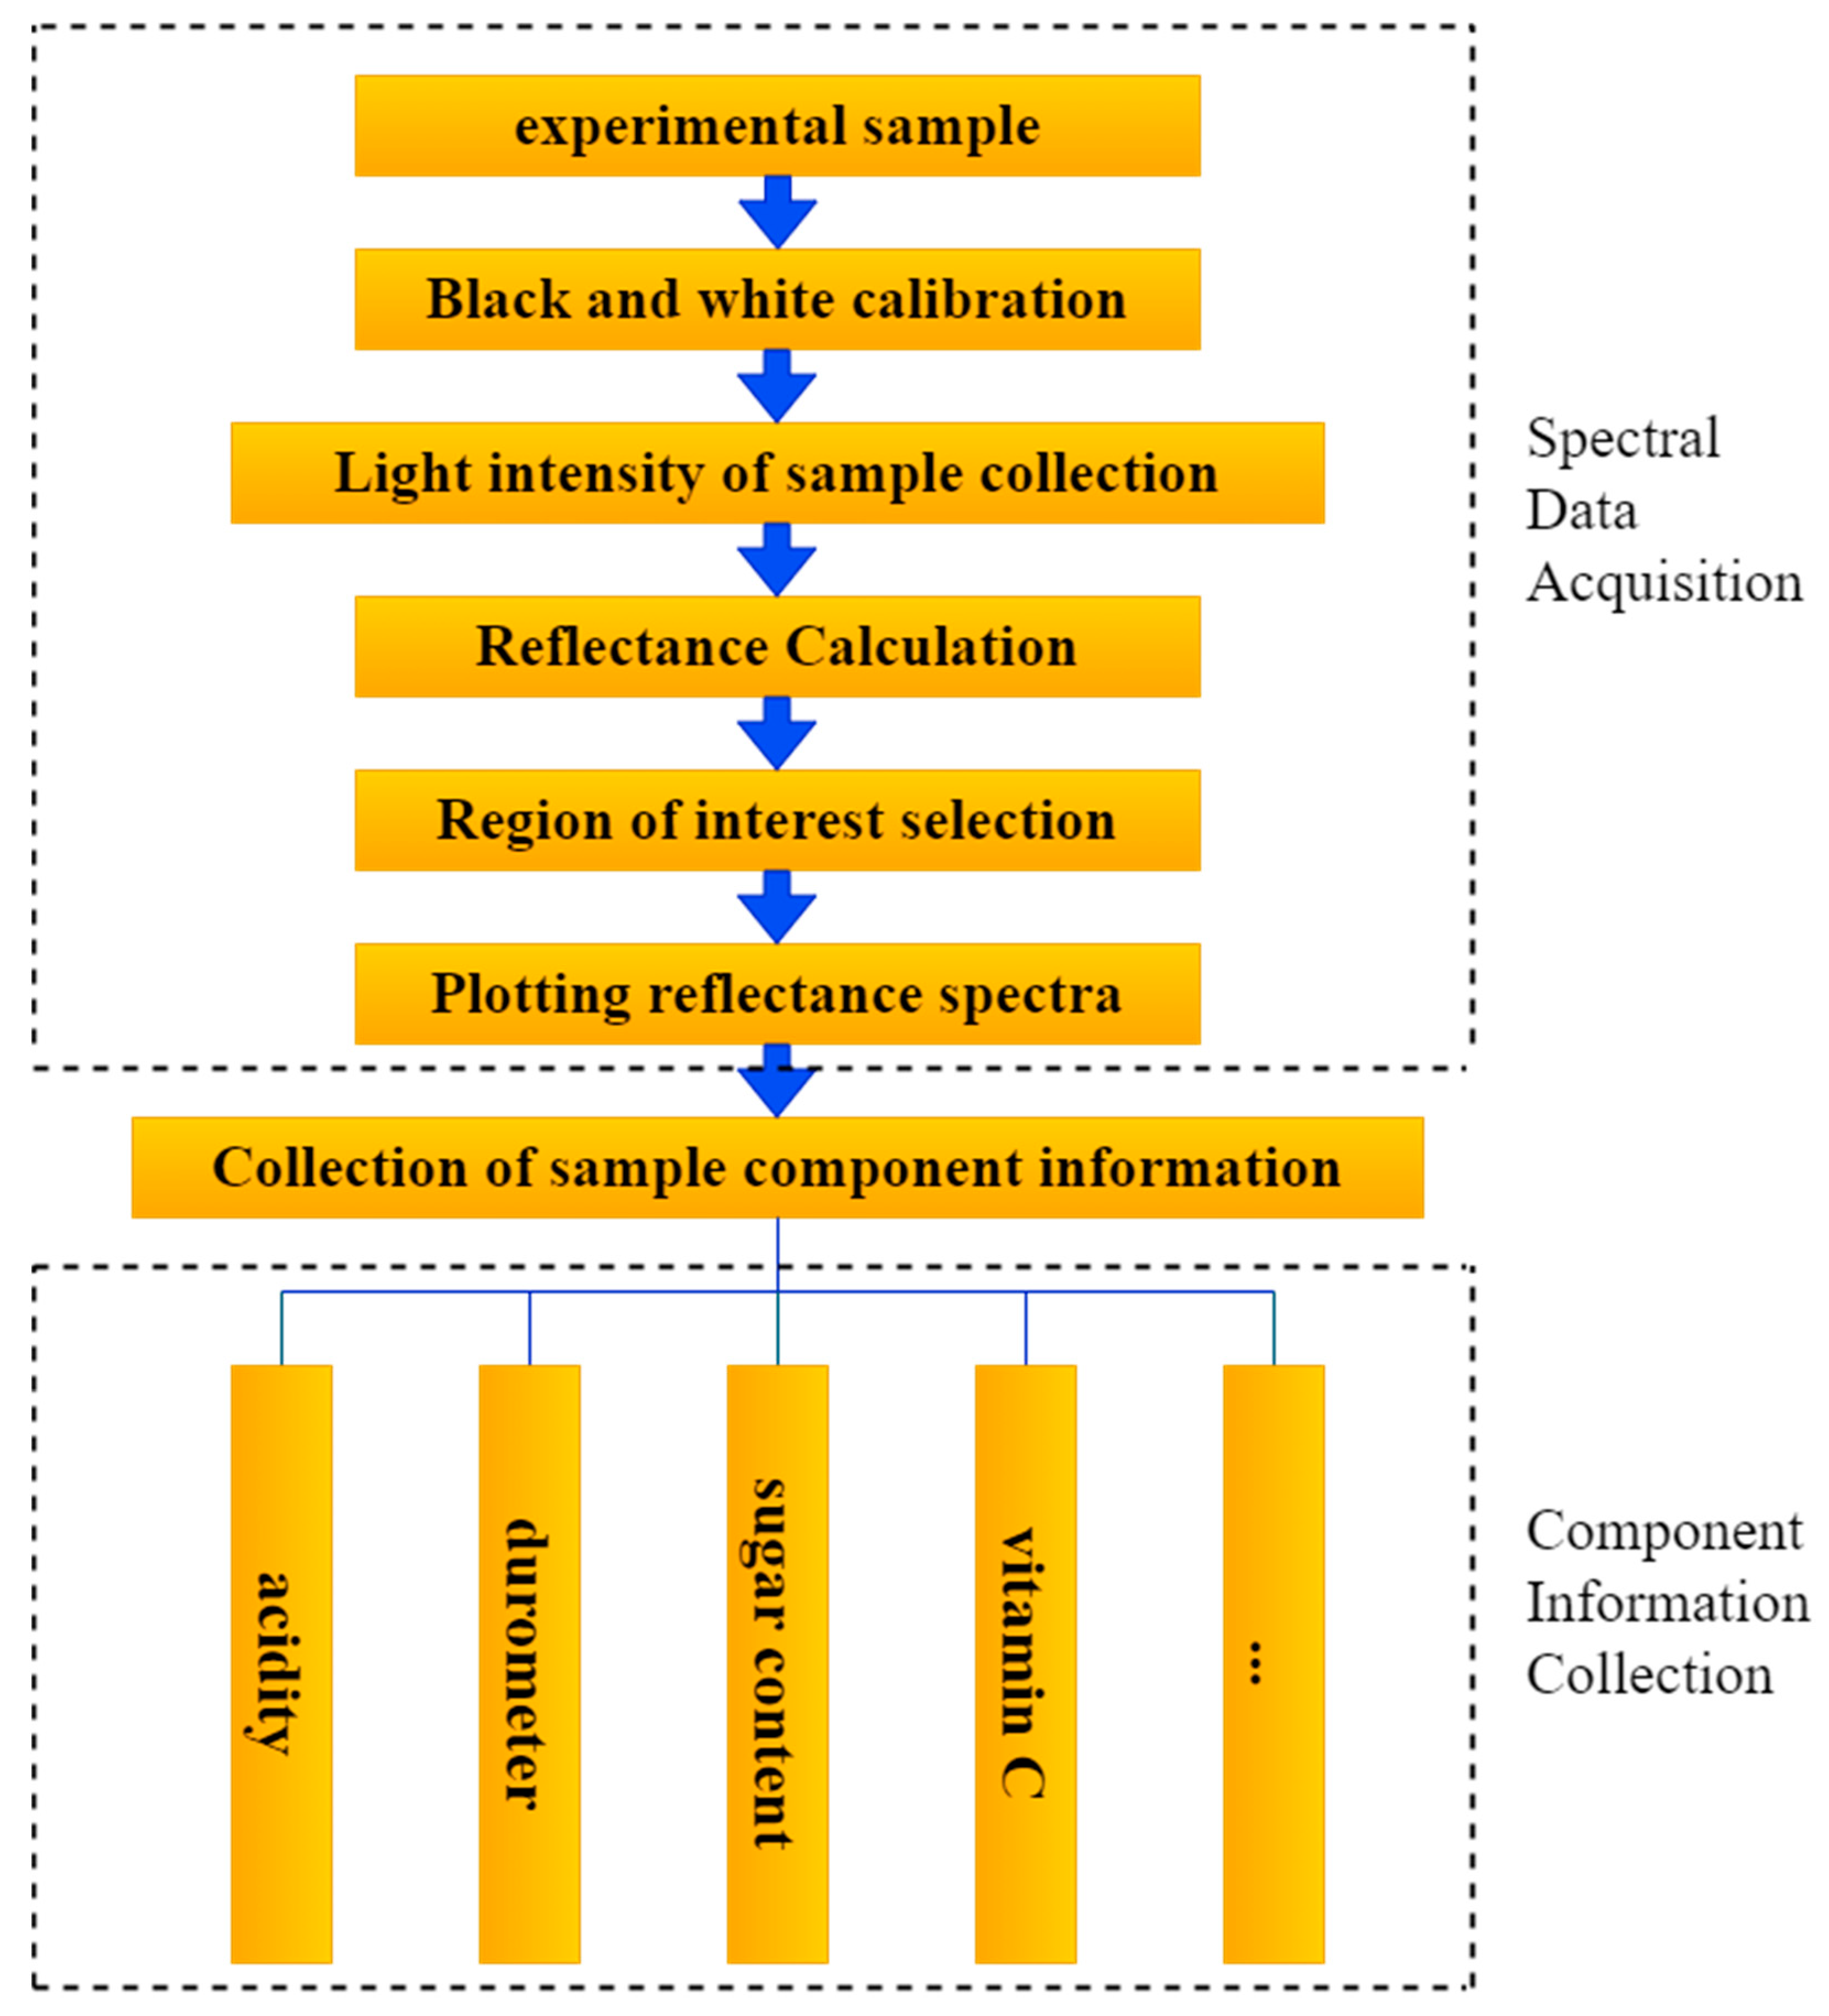
2.2. Spectral Data Acquisition and Processing

In spectral imaging technology, relying solely on spectral and image information for qualitative analysis is insufficient. Although such an analysis can provide some basic information about the object, such as its color, shape, and specific physical properties, this information is usually limited, and it is difficult to reveal the specific characteristics and changing patterns of the object in depth [28]. Quantitative testing is necessary to gain a more comprehensive understanding of the intrinsic qualities of the object under study. Quantitative testing can provide more accurate and detailed data, allowing researchers to analyze the sugar level [29], SSC [30], acidity [31], etc., of an object. This not only helps to improve the accuracy of the analysis, but also provides a solid foundation for further research and applications. Therefore, for spectral and image data, we need to analyze them quantitatively and build corresponding mathematical models to make more accurate predictions about unknown research objects. Such a quantitative approach provides deeper insights and a more reliable scientific basis for quality assessment and research. Therefore, many studies on quantitative analysis of fruits have been carried out by domestic and foreign researchers [32].
In the process of acquiring spectra and images, to minimize the spatial intensity variation of light and the dark current effect of the camera, white light and dark light are used to correct the reflectance of hyperspectral images of all navel orange samples. The calibration formula is shown in Equation (1).
R λ , n = S λ , n D λ , n B λ , n D λ , n
where R denotes the relative reflectance value at wavelength λ, and n is a pixel. S and B represent the sample image and white reference image, respectively, and D is the dark image [33].
After collecting the spectral information of the samples, the region of interest was selected according to the demand using threshold segmentation, point selection, box selection, or global selection, and the reflectance spectral curves in the region of interest can be calculated. Finally, the compositional content information of the samples was collected by a digital refractometer, PH meter, and hardness meter in a laboratory environment, and the common component contents were sugar, acidity, hardness, vitamin C, etc. [34,35]. Figure 2 shows the spectral and component information acquisition steps for the samples.
Spectroscopy is an important aspect of chemical analysis. Qualitative and quantitative analysis of spectroscopic data using chemometric methods is necessary in most cases, and the discriminant or regression models established by chemometric methods are the basis for industrial applications. Spectra reflect information about the interatomic vibrations of functional groups. By analyzing the characteristic spectral lines, it is possible to determine the functional groups contained in the object of study and the corresponding molecular or material information [36]. In the field of spectral analysis, chemometric methods are widely used. As an important aspect of chemical analysis, the qualitative and quantitative analysis of spectral data by chemometric methods is necessary in most cases, and the discriminant or regression models established by chemometric methods are the basis for industrial applications. Spectra reflect information about the interatomic vibrations of functional groups. By analyzing the characteristic spectral lines, it is possible to determine the functional groups contained in the object of study and the corresponding molecular or material information. It is an indirect means of analysis that requires a calibration model with known samples to predict the composition or concentration of unknown samples. Multivariate correction is a statistical technique for modeling relationships between multiple variables, often used when analyzing and interpreting complex data sets. When performing multivariate correction, we rely on information about the components of known samples to construct the correction model [37]. In the model identification phase, we use supervised or unsupervised discriminant analysis methods to build identification models based on spectral data. Supervised discriminant analysis relies on labeled data to train the model to distinguish between different classes. In contrast, unsupervised discriminant analysis does not rely on labeled data, but instead classifies and identifies by discovering the intrinsic structure of the data [38]. For unknown samples, whether it is to determine their composition or concentration or to determine their category, it is necessary to apply the established multivariate correction or recognition model combined with the spectral data of the unknown samples for prediction and recognition.
To construct robust, accurate, reliable, and representative correction or identification models, the spectrometer’s performance is highly required, the samples selected should be fully representative, and the influence of spectral acquisition conditions needs to be considered. Figure 3 depicts the operational flow of chemometric methods in spectral analysis, and these steps are critical for constructing high-quality and robust analytical models. Specifically, determining spectral range requires selecting an appropriate wavelength range based on the properties of the analyzed substance to ensure the capture of critical information [39]. Spectral preprocessing strategies, such as smoothing, denoising, baseline correction, and standard normal transform (SNV), help to improve spectral data quality and consistency [40]. Outlier handling can ensure model robustness through outlier detection and removal techniques. Multivariate correction methods, such as principal component regression (PCR) and partial least squares regression (PLSR), help to establish accurate relationships between independent and dependent variables [41]. Pattern recognition methods, both supervised and unsupervised, are used for sample classification and pattern recognition. Feature wavelength selection through stepwise regression and genetic algorithms (GA) selects the most representative wavelengths, simplifying the model and improving its performance. Spectral data compression, e.g., through principal component analysis (PCA), reduces data dimensionality and computational complexity [42]. Each step, from spectral acquisition to data preprocessing to model building and validation, is critical to ensure the accuracy and reliability of the final model.

3. Experimental Environment

The application of spectroscopic technology in fruit inspection is an important research direction. It can be used to analyze the spectral characteristics of fruits to achieve rapid and accurate detection of fruit quality, ripeness, and nutrient content. Research in this area usually involves both laboratory environments and natural orchard environments. For example, Figure 4a shows the spectral images of peach samples obtained by Li, J. et al. [43] using a hyperspectral instrument in a laboratory environment, and Figure 4b shows visible-near-infrared hyperspectral images of apples measured by Wang, F. et al. [44] using a hyperspectral imager in an orchard environment.

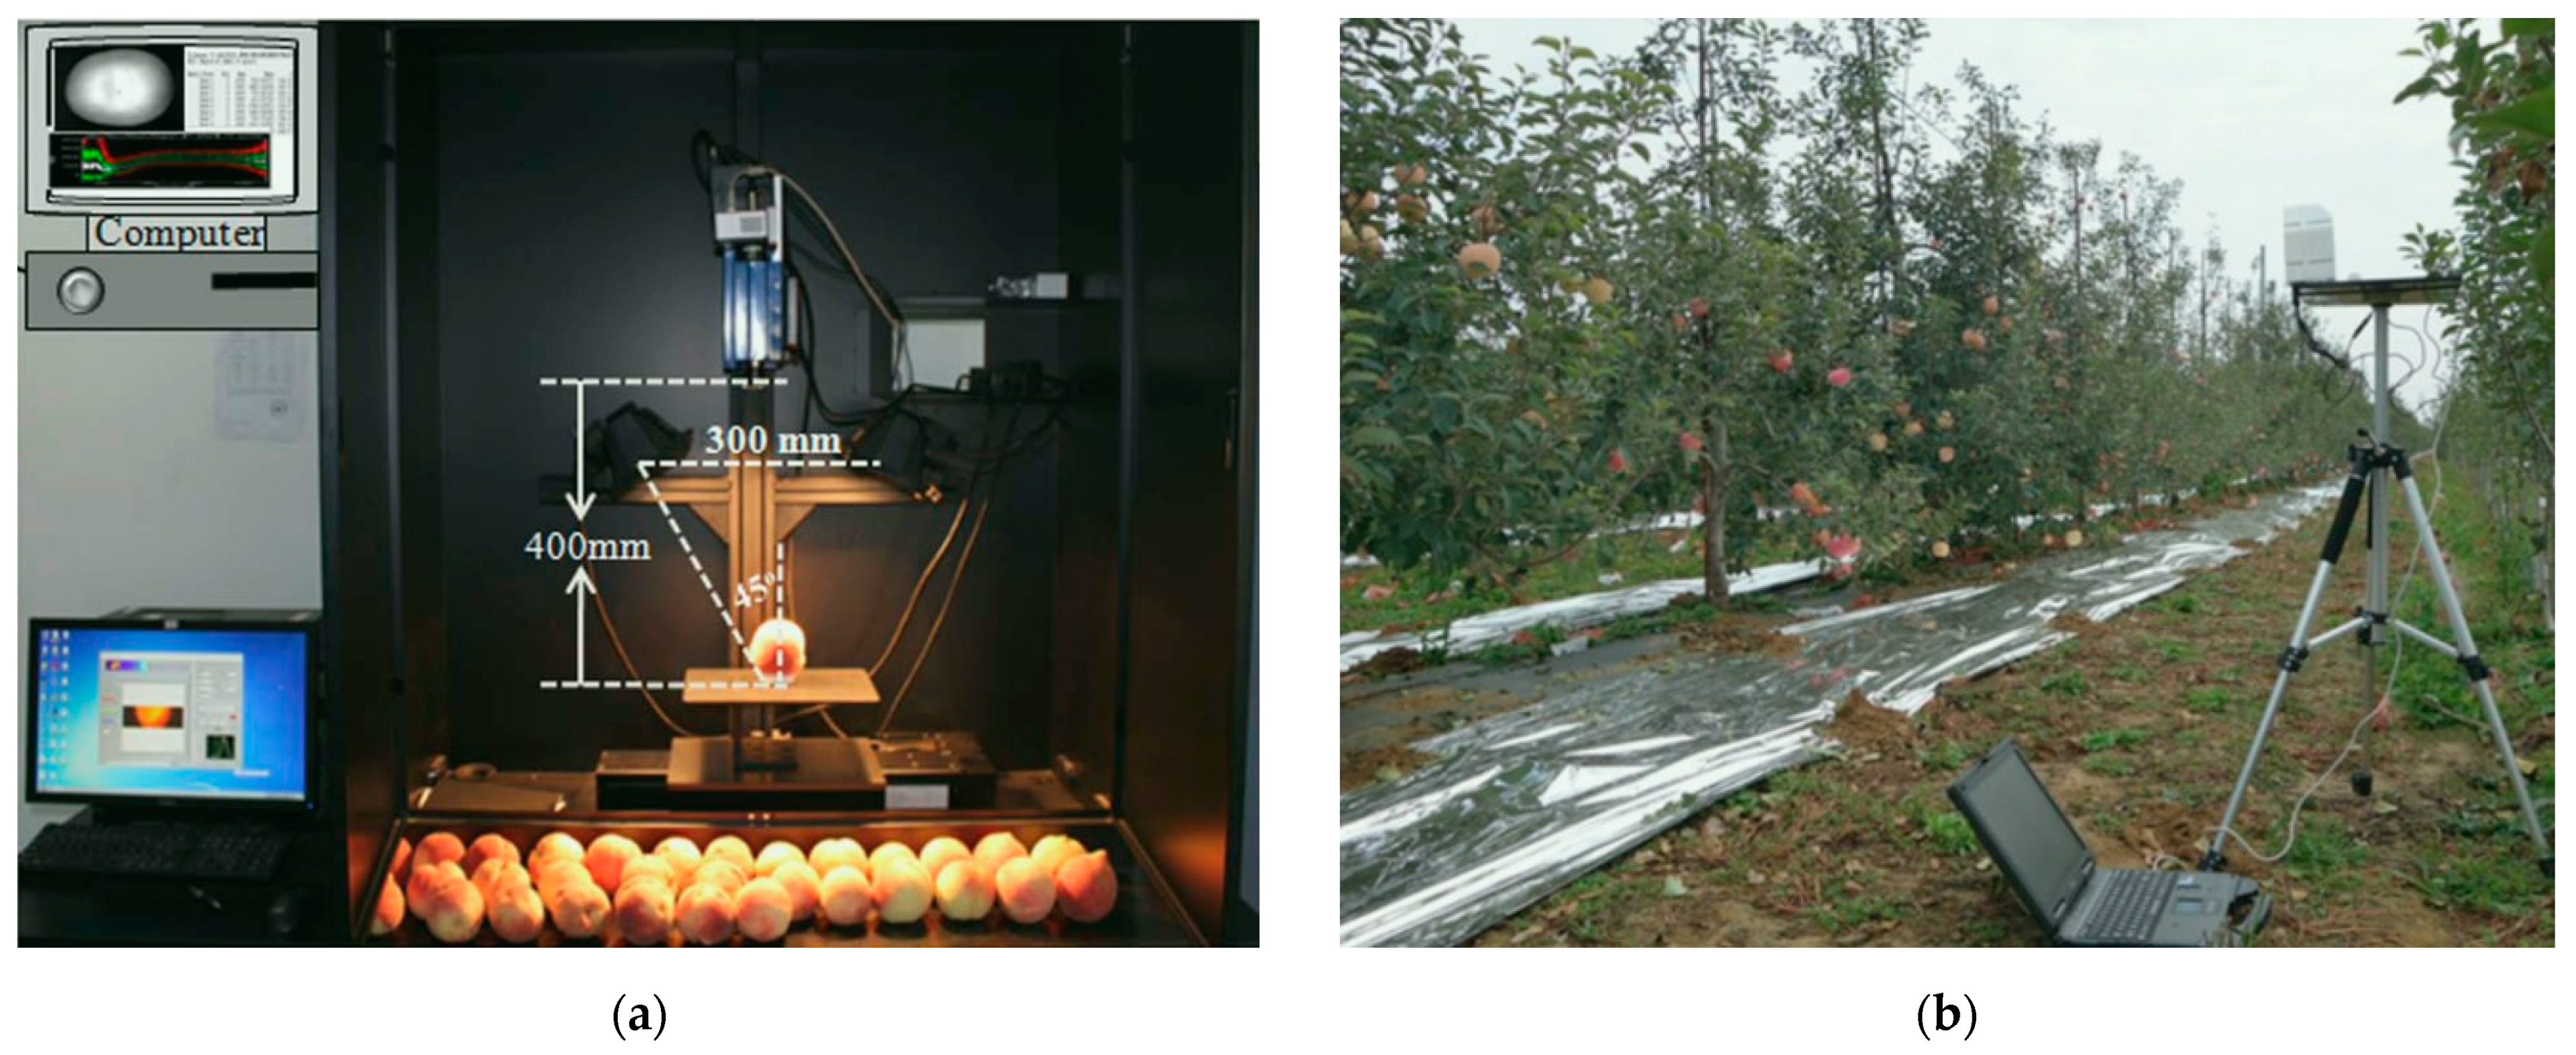
3.1. Laboratory Environment

Researchers have made great strides in the study of citrus in laboratory settings, as shown in Table 1.
We observed the findings. In terms of qualitative analysis, citrus information can be predicted very well, especially regarding defect detection, and up to 100% detection accuracy was achieved. In terms of quantitative analysis, the prediction of the SSC of citrus also showed excellent results.
In addition to citrus fruits, other fruits, such as peaches, bananas, apples, kiwis, etc., have also been studied in terms of non-destructive testing based on spectroscopy techniques under laboratory conditions. All of them have achieved excellent predictive results. As shown in Table 2, researchers from various countries have also conducted studies on defect detection, quantitative analysis, and qualitative analysis of other fruits under laboratory conditions using spectroscopy techniques. Among the indices studied, we found that in terms of quantitative analysis, more studies were conducted on the SSC, brix, hardness, and acidity indices. In light source selection, as with citrus testing, most of the light sources used in their experiments were halogen lamps, only perhaps with slight differences in quantity and wattage. From the results of the study, the performances of their evaluation indices were excellent under laboratory conditions, and it is evident that spectroscopy techniques have matured in this environment for fruit quality detection.
In summary, the use of spectroscopy techniques in a laboratory setting has demonstrated effectiveness in detecting defects in citrus and other fruits, as well as in quantitative analysis and ripeness classification. Researchers can establish highly controlled conditions to ensure the stability and reproducibility of experiments. This environment enables researchers to utilize high-precision spectroscopic instruments for the comprehensive spectroscopic analysis of fruits, yielding accurate data. Moreover, the laboratory can prepare various standard samples for calibrating instruments, verifying model reliability, and conducting model building and optimization.

3.2. Orchard Environment

Laboratory environments are typically artificially controlled and differ from real orchard growing environments. Such differences may lead to significant deviations between the results obtained in the laboratory and the actual application scenarios [66]. In addition, due to the complexity and variability of field environments, laboratory environments often do not fully simulate external influences in the orchards, such as changes in sunlight, wind speed, and temperature. These factors can have an impact on the acquisition of fruit spectra. For example, in the detection of citrus defects, in addition to some post-picking falls, friction injuries, freezing injuries, etc., the samples collected in the laboratory environment do not take into account the effects of pre-picking diseases, insect pests, poor growth, and weather factors. They, therefore, may have significant errors when validated in the orchard environment [67]. In citrus ripeness detection, researchers typically select samples of different ripeness levels for experiments, and the spectral information of the samples can be collected more accurately in the laboratory. However, in the actual application process, to determine the maturity of the samples, the influencing factors in the orchard environment need to be considered, so the researchers need to measure the spectra of the samples in the orchard environment to satisfy the classification of citrus maturity [68]. Currently, recognizing that measuring certain fruits in the laboratory environment may not meet practical application requirements, some researchers have explored fruit quality testing in the orchard environment. Two types of fruits, berries and drupes, are discussed below.

3.2.1. Berries

Berries are a group of small, juicy, colorful, and nutrient-rich fruits that usually includes strawberries, grapes, and blackberries [69]. Shown in Table 3 are the researchers’ studies based on spectroscopic techniques in a berry-growing environment.

3.2.2. Drupes

Drupes are a group of fruits with a hard core in the center and a juicy outer layer, usually including apples, mangoes, and peaches [73]. As shown in Table 4, the researchers collected spectral data in a drupe-growing environment and based their studies on the spectroscopic techniques which were used.
Conducting research in natural orchard environments, which are incredibly complex, allows researchers to be closer to the actual growing environment than they would be in the laboratory. For instance, in an orchard environment, the intensity and angle of the sun’s rays change over time, and the wind can blow branches or leaves. In contrast, the halogen lamps used in studies performed under laboratory conditions are constant, and there is no wind. Field tests can consider more factors related to fruit growth, and real-time monitoring using portable spectroscopic instruments can capture changes in the spectral characteristics of fruit in different locations and at different times, more closely matching the environment in which the fruit is grown. The data obtained in this environment can be used to verify the accuracy of the laboratory model and adjusted and optimized according to the actual situation. Regarding current research, there are relatively few cases of fruit research in the orchard environment. Only for thin-skinned fruits, such as grapes, apples, mangoes, etc., and not for thick-skinned fruits such as citrus, have experiments and studies been carried out in depth [75].
As a result, there are still many uncharted research areas concerning fruits in orchard environments, including incredibly thick-skinned fruits such as citrus. Further research and experiments will help to reveal the complex mechanisms of fruit growth and development in orchard ecosystems, as well as provide a deeper understanding of optimizing orchard management and increasing fruit production by taking into account the complexity of the orchard environment.

4. Selection of Regions of Interest

In acquiring spectral data and images of a sample, the region to be processed is outlined from the image in boxes, circles, ellipses, irregular polygons, etc., known as the region of interest (ROI). ROI selection is mainly performed by various operators and functions commonly used in machine vision software, such as OpenCV, Matlab, etc., to derive the region of interest and to carry out the next step in processing the image. Figure 5a shows the region of interest obtained by threshold segmentation, which is the process of grayscaling the image to binarization [76]. Figure 5b shows the ROI selected by Tian, P. et al. [77] using the manual frame selection method, where they averaged nine ROIs after framing them according to the three different parts of the mango.
Table 5 summarizes several typical methods of region of interest selection that have been used by researchers in spectroscopy-based nondestructive testing of fruit quality studies in the last five years, which will be discussed in the following two subsections.

4.1. Threshold Segmentation

In the acquisition process of hyperspectral images, the images captured contain not only sample information, but also information about the background. The background information is more complicated. For example, in the laboratory environment, it may be the desktop of the experimental platform, the ground, the belt of the conveyor belt, etc., and in the outdoor situation, the background is even more complicated, for example, the soil, the foliage, and the sky. Suppose all the information from the entire image is used as the spectral information of the sample. In that case, the background information would also be considered, causing significant interference in the results of the entire experiment. The threshold segmentation technique is one of the most classical and popular, and one of the most straightforward, image segmentation methods [84]. The key to this technique is finding the appropriate gray level threshold, which is usually selected based on the gray level histogram of the image. It involves dividing the gray level of an image into several parts using one or several thresholds, considering pixels belonging to the same part to be the exact object. This technique dramatically reduces the amount of data and simplifies the steps of analyzing and processing image information. A binary mask image is obtained by separating the samples from the background using thresholding. Then, this binary mask image is applied to obtain the ROI image.
Threshold segmentation is an important step in image analysis. If the segmentation is incorrect, background information may interfere with the ROI, or valuable sample data may be lost. There are more and more researchers using threshold segmentation to extract the regions of interest of samples in recent years, and for quantitative analysis, Shang, M. et al. [45] chose an image with a wavelength of 1655.72 nm as the ROI image in a study of umbilical cord orange full-surface defect detection based on the hyperspectral on-line binning technique. The samples were segmented from the background using simple thresholding to obtain a binary mask image. Using the segmented image, an online sorting experiment was performed with 100% detection accuracy. Luo, W. et al. [50] used hyperspectral imaging (380–1030 nm) to predict the SSC of Nanfeng mandarin, and the samples were separated from the background by threshold segmentation in order to reduce the background interference. After selecting the grayscale image at 850 nm to generate the mask image, all the original images were masked. Except for the Nanfeng mandarin calyx region, the other remaining parts were selected to be defined as ROI. The results showed that the bootstrapping soft shrinkage (BOSS)-competitive adaptive reweighted sampling (CARS)-partial least squares regression (PLSR) model predicted the best results, and could quickly and intuitively evaluate the intrinsic quality of Nanfeng honey orange.
In addition, in other fruits, experts have also conducted significant research. Çetin, N. et al. [85] used hyperspectral technology and machine learning algorithms to evaluate the internal quality parameters of apple fruit. Firstly, the standard deviation of each pixel point was calculated, the samples were thresholded and segmented, and good segmentation results were obtained. The results showed that the potential use of hyperspectral imaging with artificial neural network and decision tree (DT) methods was more effective for hardness, while DT and multiple linear regression (MLR) were more effective for SSC. Li, S. et al. [86], in a study on the ability of hyperspectral imaging combined with multiple regression modeling to detect loquat SSCs under small-sample conditions, utilized ENVI 5.1 software to detect loquat SSCs from the calibrated spectral images to select the entire loquat surface as the ROI and remove the background information. The results showed that a small sample size of hyperspectral images combined with an appropriate regression model can be used for nondestructive detection of loquat SSC. For qualitative analysis, Sharma, S. et al. [87] obtained hyperspectral images of durian fruit flesh using a reflectance-based system for maturity grading assessment at full wavelength (900–1600 nm). The researchers extracted the ROI from each radio-corrected image with the threshold set to 0.5 and then applied a morphological filter to the binary image to extract the sample pixels. The results showed that support vector machine (SVM) and random forest (RF) classifiers can better utilize HSI to differentiate the ripening stages of durian flesh.
In summary, threshold segmentation provides excellent convenience for the acquisition of sample regions of interest, and it is computationally simple and fast, making it an ideal choice for large-scale samples. Additionally, the threshold segmentation method identifies key features in fruits, such as color and texture, which are crucial for studying ripeness, freshness, and intrinsic fruit quality [88]. However, two drawbacks must be considered. Firstly, most of the current literature focuses on segmenting the sample from the background, treating the entire sample as the region of interest. This approach leads to a significant increase in computational time and computational difficulty for subsequent reflectance calculations. Secondly, there are significant differences between the average reflectance of specific parts of particular samples and the whole, such as the reflectance of citrus fruits and the peduncle part. These differences may have a significant impact on the overall prediction or even lead to misclassification. Therefore, although the threshold segmentation method has obvious advantages in terms of acquiring the sample region of interest and identifying key features, its computational time and difficulty need to be considered comprehensively when processing and analyzing large-scale samples [89]. At the same time, the significant differences in reflectance within specific samples should be handled with special care to avoid bias to the overall prediction, and these are areas that need to be focused on and improved in future research and applications.

4.2. Manual Selection

To solve the problem of the high computational time cost of threshold segmentation to extract the region of interest of the samples, some solutions have been proposed by experts in this field. Wang, T. et al. [90], in a study on the determination of soluble solids content (SSC) in Korla pears by using the hyperspectral technique, used ENVI 5.3 to select 10 × 10 pixels of the hyperspectral image containing the spectral information of the entire surface of the balsam pear as the ROI, and the results showed that the SSC of Korla balsam pear was successfully predicted using a combination of clustering and edge influence analysis. Yu, Y. et al. [91], to reduce the cost of nondestructive detection of the SSC of Korla balsam pear, developed a portable nondestructive SSC detector, which rotationally labeled three positions at every 120° on the equatorial line of the pear and obtained the local spectra as the ROI of the samples. The results showed that the developed SSC detector was also effective in the field. Gao, Q. et al. [92], in a study on the evaluation of the soluble solids content, hardness index, and ripeness discrimination of Makino Begonia based on near-infrared hyperspectral imaging, a 20 pixel × 20 pixel area was selected on the upper surface of the fruits at intervals of 120°, with the stems as the center in the binomial image and the equator of the samples as a circle. A region was selected as the region of interest, three regions of interest were selected for each sample, and the average information of all regions of interest was regarded as the corresponding reflection spectrum of the sample. The results of this study showed that the NIR-HSI method is feasible for the quality evaluation of Makino begonia. Garillos-Manliguez, C.A. et al. [93] estimated fruit ripeness by feature splicing of data acquired by visible and hyperspectral imaging systems. During ROI acquisition, nine equally spaced subregions (three in the middle portion, three near the vertices, and three near the shank) were obtained from the spectral image of the bounded ROI. Each subregion had a spatial resolution of 32 × 32 and a spectral resolution of 150. The results showed that, using multimodal inputs coupled with a powerful deep CNN model, it is possible to classify fruit ripeness even at the six-stage level of granularity. Mishra, P. et al. [94], studied the improved prediction of the hardness of mango in the ripening stage using near-infrared spectroscopy supported by interval-partial least squares regression. The region of interest of mango samples was determined by selecting two different points which were distributed in the center of the two flanks, and the results showed that the predictions of the model provided the evolution of hardness throughout the ripening experiments.
In summary, the researchers utilized different shapes to select several regions of interest for samples in various locations. It was found that this method is feasible for selecting regions of interest to predict the component content and ripeness of the samples [95]. This method can effectively reduce the time cost. However, according to current studies, some experts randomly select several regions as the regions of interest of the sample. In contrast, others select several regions based on the parts of the sample. There is a certain degree of randomness and subjectivity in selecting regions of interest using the above two methods. Therefore, selecting representative and scientifically valid regions of interest has become an important focus and challenge in current research. With the continuous development of technology and methods, we can expect more breakthroughs in this field in the future. These advancements will provide more accurate and reliable methods and data support for studying citrus fruits and other fruits.

5. Selection of the Number of Samples and the Number of Spectral Features

Before modeling spectral analysis, the first task was to collect the sample data. The sample data included the sample’s raw spectral data and the sample’s component content information. The number of spectral features depends on the band range of the spectrometer used and the channel spacing, and in some cases, it is also related to the spectral noise [96]. The component content information of the samples depends on the number of samples collected in the experiment; however, the collection of the number of samples is affected by some external factors. Increasing the number of samples or spectral features does not necessarily result in better predictions. In naturally acquired samples, there are many duplicates and anomalous samples, which reduces the modeling speed and may decrease the accuracy of the model. Meanwhile, increasing the number of spectral features may lead to multicollinearity and the curse of dimensionality, which affect the model’s stability, computational efficiency, and generalization ability [97,98].

5.1. Quantitative Analysis

Researchers have conducted many studies on the quantitative analysis of fruits based on spectroscopy techniques using different numbers of samples and different number of spectral features, as shown in Table 6.
Within the field, spectral resolution is a critical parameter in spectral analysis that describes a spectrometer’s ability to distinguish and discriminate between neighboring wavelengths. Many studies have shown that choosing a higher spectral resolution usually results in better predictions. The reason for this is that the reflection information in each band within the wavelength range covered by the spectrometer may be correlated with the component content of the sample. Therefore, researchers tend to narrow the spectral acquisition interval to capture more spectral features. Higher resolution captures more subtle spectral information in the sample and enhances the prediction model’s accuracy and stability. However, this creates two problems. The first problem is that the time cost of acquisition is significantly increased, and the second problem is that the wavelength screening of spectral features becomes complicated at a later stage. Some spectral data dimensionality reduction methods have to be used [115]. At the same time, we have found that some researchers choose larger spectral resolutions. However, fewer spectral bands may not provide enough information, leading to a decrease in the predictive model’s performance [116]. Specifically, a larger spectral resolution means that measurements are made over a larger wavelength interval, which reduces the number of spectral data points collected. In this case, the spectrometer may not be able to capture essential details and characteristic information in the sample, making it difficult for the model to resolve and predict the component content of the sample accurately. In addition, the reduced amount of information may make the model more sensitive to noise in the data, further reducing the generalization ability and stability. Therefore, while a larger spectral resolution may simplify data processing, it typically limits the predictive effectiveness and reliability of the model.
Compared to the selection of the number of spectral features, there is no fixed range for selecting the number of samples [117]. In a study, the choice of sample number can vary from 65 to 800. More samples can cover a broader range of fruit species and variability, resulting in more comprehensive and generalizable findings. However, large sample sizes also increase the complexity of data processing and analysis, requiring more advanced statistical methods and computational techniques [118]. In contrast, smaller sample sizes make data processing and analysis simpler and allow for quicker initial conclusions. However, the limited number of samples may lead to unstable results and make it difficult to assess the performance of spectroscopic techniques under different circumstances accurately. Therefore, to find a suitable balance between time cost, data processing complexity, and detection accuracy, the numbers of spectral features and samples need to be rationally selected. Such a balance helps to improve the comprehensiveness and reliability of the study while enabling a more effective assessment of the performance of spectroscopic techniques in different situations.

5.2. Qualitative Analysis

In addition to the quantitative analysis of fruits, there is also a choice of sample size and the amount of spectral characterization data for expert studies in the qualitative analysis of fruits, which mainly involves damage detection and disease detection. In the damage detection study, Du, X.-L. et al. [119] collected visible/short-wave near-infrared (Vis/SWNIR) diffuse reflectance spectra from 300–1150 nm for analysis. Impact tests were conducted on 840 peach samples using two drop heights of 30 cm and 60 cm to study the variation in total soluble solids (TSS), which showed an R p of 0.89, an RMSEP of 0.40, and a residual predictive deviation (RPD) of 2.94 for TSS. Lee, W.-H. et al. [120] investigated a new NIR technique, ultra-near infrared spectroscopic imaging at 950–1650 nm, for the detection of bruise damage in pear subcutis, and a total of 14 samples were evaluated in this study. The results of the study showed that the optimal threshold band ratio was 92% accurate for the detection of pear bruises. In a disease study, Sankaran, S. et al. [121] collected spectral reflectance data from 100 healthy and 93 Huanglongbing-infected citrus trees for 989 spectral features in the wavelength range of 350–2500 nm using a visible-near-infrared spectral radiometer. This was used to investigate the feasibility of visible-near-infrared spectroscopy for the field detection of Huanglongbing (HLB) in citrus orchards. The results of the study showed that, comparing different classifier models, quadratic discriminant analysis (QDA) consistently resulted in higher average overall classification accuracy with lower false positives and false negatives. Ghooshkhaneh, N.G. et al. [122] used VIS-NIR spectroscopy (400–1100 nm) to identify endophytic fungal diseases in order to collect the reflectance spectra of 540 oranges in three regions: stem end, equatorial end, and stigma end. The results showed that the highest classification accuracy was obtained using a back-propagation neural network classifier with optimal wavelengths in the stigma-end region. Xie, C. et al. [123] used spectral reflectance for detecting citrus black spot (CBS) symptoms, setting the number of early, late, and healthy samples as 163, 163, and 58, respectively, in the training set, and 80, 81, and 28, and the spectra were collected in the range of 451–1010 nm. The results showed that the model correctly classified the diseased samples with accuracies of 99.4% (using the full wavelength) and 100.0% (using selected wavelengths) in the diseased versus healthy group, and for the early samples (early stage of the disease), the correctly classified accuracies were 92.5% (using the full wavelength) and 93.8% (using the selected wavelengths). Tian, X. et al. [124] used image processing methods such as PCA, pseudo-color image transformation technology, and improved watershed segmentation algorithms (IWSA). A total of 132 normal fruits and 168 infested fruits with finger gram spores were prepared, and the feasibility of rot detection was analyzed based on 325–1098 nm hyperspectral transmission images. The results showed that, for the validation set containing 84 decayed and 66 sound fruits, the success rates were 93% and 96% for decayed fruits, 94% for sound fruits, and 94% for all fruits, respectively.
To summarize, in the qualitative analysis of fruit damage and disease based on spectroscopic techniques, unlike quantitative analysis, researchers are faced with the problem of choosing the number of different types of samples because they need to differentiate between several different types of samples, such as early hard spots, cracked spots, poison spots, and healthy samples. This complicates the selection of the number of samples. In this area, we have found that two situations exist. One is where the number of different types of samples is the same, usually to reduce classification bias and improve classification accuracy. The other situation is where the numbers of different types of samples are different, usually because specific categories of samples are more readily available or more critical. However, such an inconsistency may lead to over-representation of spectral features in specific categories, affecting the accuracy and reliability of qualitative analyses. Therefore, rational selection of sample size is essential to improve the comprehensiveness and reliability of the study. If the problem of inconsistent sample size cannot be solved by increasing the sample size, the bias can be corrected by adjusting the classification algorithm. For example, strategies such as resampling methods (oversampling and undersampling), weighted classifiers, data enhancement techniques, integrated learning, and adjusting decision thresholds are used [125]. These methods can balance categories, reduce classification bias, and improve the accuracy and reliability of qualitative analysis [126].

6. Conclusions

Spectroscopy is a core tool for the non-destructive quality testing of fruits. Although there have been some studies on the collection of spectral information from fruit samples, there are still many challenges regarding dataset collection methods. This paper reviews the selection of experimental environments, the selection of regions of interest, and the selection of the number of samples versus the number of spectral features during the spectral dataset collection process for citrus and other fruits. The enormous annual production of fruits limits the possibility of practical application of spectroscopy techniques in orchards. To perform non-destructive quality inspection of fruits more effectively and to improve the efficiency of orchard management, further research on spectroscopy-based inspection of citrus and other fruits in the orchard environment is essential. Overcoming this technical challenge will contribute to the sustainable development of the fruit industry and the optimization of agricultural production. The main findings and conclusions are as follows.
(1) Spectroscopic techniques excel in detecting defects, quantitative analysis, and ripeness classification of fruits such as citrus in a laboratory setting, where researchers can acquire accurate data under highly controlled conditions and calibrate and optimize models with standard samples. However, fewer studies have been conducted in realistic orchard environments with complex research conditions, especially for thick-skinned fruits such as citrus. Further research could help us to understand the mechanisms of fruit growth in orchard ecosystems and optimize orchard management to improve yields.
(2) The threshold segmentation method is simple, fast, and suitable for large-scale sample processing and critical feature identification, but suffers from problems of computational time and difficulty, as well as the challenge of internal reflectance differences within the sample, affecting prediction accuracy. Shape selection methods can reduce the time cost, but there is randomness and subjectivity, and selecting representative and scientific regions of interest is still challenging. Therefore, future research needs to address the computational issues of threshold segmentation methods and find more scientific and representative methods of selecting regions of interest to improve the accuracy and reliability of fruit studies.
(3) The accuracy of spectral analysis depends on the choice of spectral resolution and sample size. Higher resolution provides more accurate results, but increases time costs and complexity. A smaller sample size simplifies the analysis, but may reduce the stability of the results. A balanced choice of spectral features and sample size can help to improve the reliability and comprehensiveness of a study.
Despite some challenges faced by spectroscopy in the field of citrus and other fruit dataset collection, it still has a broad scope for development. It has shown irreplaceable importance in the field of agriculture. In the future, spectroscopy will play a vital role in the study of citrus and other fruits or crops.

Author Contributions

Supervision, review and editing: J.L.; conceptualization, investigation, writing—original draft preparation, review and editing: Q.W.; review and editing: Y.W.; methodology, conceptualization: J.G. All authors have read and agreed to the published version of the manuscript.

Funding

This research received no external funding.

Institutional Review Board Statement

Not applicable.

Data Availability Statement

Not applicable.

Acknowledgments

We thank Fajun Miao and Qiyang Shui for their help with this study.

Conflicts of Interest

The authors declare no conflicts of interest.

References

  1. Richa, R.; Kohli, D.; Vishwakarma, D.; Mishra, A.; Kabdal, B.; Kothakota, A.; Richa, S.; Sirohi, R.; Kumar, R.; Naik, B. Citrus fruit: Classification, value addition, nutritional and medicinal values, and relation with pandemic and hidden hunger. J. Agric. Food Res. 2023, 14, 100718. [Google Scholar] [CrossRef]
  2. Zhao, H.; Dong, Z.; Liu, B.; Xiong, H.; Guo, C.; Lakshmanan, P.; Wang, X.; Chen, X.; Shi, X.; Zhang, F. Can citrus production in China become carbon-neutral? A historical retrospect and prospect. Agric. Ecosyst. Environ. 2023, 348, 108412. [Google Scholar] [CrossRef]
  3. National Bureau of Statistics Home Page. Available online: https://data.stats.gov.cn/easyquery.htm?cn=C01 (accessed on 27 May 2024).
  4. Çetiner, H. Citrus disease detection and classification using based on convolution deep neural network. Microprocess. Microsyst. 2022, 95, 104687. [Google Scholar] [CrossRef]
  5. Chakraborty, S.K.; Subeesh, A.; Dubey, K.; Jat, D.; Chandel, N.S.; Potdar, R.; Rao, N.G.; Kumar, D. Development of an optimally designed real-time automatic citrus fruit grading–sorting machine leveraging computer vision-based adaptive deep learning model. Eng. Appl. Artif. Intell. 2023, 120, 105826. [Google Scholar] [CrossRef]
  6. Valencia-Chamorro, S.A.; Palou, L.; Del Río, M.A.; Pérez-Gago, M.B. Antimicrobial edible films and coatings for fresh and minimally processed fruits and vegetables: A review. Crit. Rev. Food Sci. Nutr. 2011, 51, 872–900. [Google Scholar] [CrossRef] [PubMed]
  7. Zhang, J.; Liang, Y.; He, L.; Kaliaperumal, K.; Tan, H.; Jiang, Y.; Zhong, B.; Zhang, J. Effects of storage time and temperature on the chemical composition and organoleptic quality of Gannan navel orange (Citrus sinensis Osbeck cv. Newhall). J. Food Meas. Charact. 2022, 16, 935–944. [Google Scholar] [CrossRef]
  8. Manso, M.; Carvalho, M.L. Application of spectroscopic techniques for the study of paper documents: A survey. Spectrochim. Acta Part B At. Spectrosc. 2009, 64, 482–490. [Google Scholar] [CrossRef]
  9. Masithoh, R.; Pahlawan, M.; Wati, R. Non-destructive determination of SSC and pH of banana using a modular Vis/NIR spectroscopy: Comparison of Partial Least Square (PLS) and Principle Component Regression (PCR). In Proceedings of the IOP Conference Series: Earth and Environmental Science, Jakarta, Indonesia, 25–26 September 2021; p. 012047. [Google Scholar]
  10. Yang, Y. Prediction of pear sugar content based on near infrared spectroscopy. In Proceedings of the International Conference on Agri-Photonics and Smart Agricultural Sensing Technologies (ICASAST 2022), Zhengzhou, China, 4–6 August 2022; pp. 182–188. [Google Scholar]
  11. Malvandi, A.; Feng, H.; Kamruzzaman, M. Application of NIR spectroscopy and multivariate analysis for Non-destructive evaluation of apple moisture content during ultrasonic drying. Spectrochim. Acta Part A Mol. Biomol. Spectrosc. 2022, 269, 120733. [Google Scholar] [CrossRef]
  12. Lazim, S.; Nawi, M.; Bejo, S.; Shariff, A.; Abdullah, N. Prediction and classification of soluble solid contents to determine the maturity level of watermelon using visible and shortwave near infrared spectroscopy. Int. Food Res. J. 2022, 29, 1372–1379. [Google Scholar] [CrossRef]
  13. Legner, R.; Voigt, M.; Servatius, C.; Klein, J.; Hambitzer, A.; Jaeger, M. A four-level maturity index for hot peppers (Capsicum annum) using non-invasive automated mobile Raman spectroscopy for on-site testing. Appl. Sci. 2021, 11, 1614. [Google Scholar] [CrossRef]
  14. Ar, N.H.; Purwanto, Y.A.; Budiastra, I.W. Prediction of soluble solid content, vitamin C, total acid and firmness in astringent persimmon (Diospyros kaki L.) cv. Rendeu using NIR spectroscopy. In Proceedings of the IOP Conference Series: Materials Science and Engineering, Melbourne, Australia, 12–13 October 2019; p. 012086. [Google Scholar]
  15. Qi, C.; Sandroni, M.; Westergaard, J.C.; Sundmark, E.H.R.; Bagge, M.; Alexandersson, E.; Gao, J. In-field classification of the asymptomatic biotrophic phase of potato late blight based on deep learning and proximal hyperspectral imaging. Comput. Electron. Agric. 2023, 205, 107585. [Google Scholar] [CrossRef]
  16. Badea, M.G.; Brand, L. [17] Time-resolved fluorescence measurements. In Methods in Enzymology; Elsevier: Amsterdam, The Netherlands, 1979; Volume 61, pp. 378–425. [Google Scholar]
  17. Ma, F.; Yuan, M.; Kozak, I. Multispectral imaging: Review of current applications. Surv. Ophthalmol. 2023, 68, 889–904. [Google Scholar] [CrossRef] [PubMed]
  18. Fernández Pierna, J.A.; Vermeulen, P.; Eylenbosch, D.; Burger, J.; Bodson, B.; Dardenne, P.; Baeten, V. Chemometrics in NIR Hyperspectral Imaging: Theory and Applications in the Agricultural Crops and Products Sector. In Comprehensive Chemometrics, 2nd ed.; Brown, S., Tauler, R., Walczak, B., Eds.; Elsevier: Oxford, UK, 2020; pp. 361–379. [Google Scholar]
  19. Antony, M.M.; Sandeep, C.S.; Lim, H.-T.; Matham, M.V. High-Resolution Ultra-Spectral Imager for Advanced Imaging in Agriculture and Biomedical Applications. J. Biomed. Photonics Eng. 2023, 9, 030304. [Google Scholar] [CrossRef]
  20. Abdelsalam, A.M.; Sayed, M.S. Real-time defects detection system for orange citrus fruits using multi-spectral imaging. In Proceedings of the 2016 IEEE 59th International Midwest Symposium on Circuits and Systems (MWSCAS), Abu Dhabi, United Arab Emirates, 16–19 October 2016; pp. 1–4. [Google Scholar]
  21. Gaikwad, S.; Tidke, S. Multi-spectral imaging for fruits and vegetables. Int. J. Adv. Comput. Sci. Appl. 2022, 13, 743–760. [Google Scholar] [CrossRef]
  22. Sun, Y.; Xiao, H.; Tu, S.; Sun, K.; Pan, L.; Tu, K. Detecting decayed peach using a rotating hyperspectral imaging testbed. LWT 2018, 87, 326–332. [Google Scholar] [CrossRef]
  23. Fan, S.; Li, C.; Huang, W.; Chen, L. Detection of blueberry internal bruising over time using NIR hyperspectral reflectance imaging with optimum wavelengths. Postharvest Biol. Technol. 2017, 134, 55–66. [Google Scholar] [CrossRef]
  24. Munera, S.; Blasco, J.; Amigo, J.M.; Cubero, S.; Talens, P.; Aleixos, N. Use of hyperspectral transmittance imaging to evaluate the internal quality of nectarines. Biosyst. Eng. 2019, 182, 54–64. [Google Scholar] [CrossRef]
  25. ElMasry, G.; Sun, D.-W. Principles of Hyperspectral Imaging Technology. In Hyperspectral Imaging for Food Quality Analysis and Control; Sun, D.-W., Ed.; Academic Press: San Diego, CA, USA, 2010; Chapter 1; pp. 3–43. [Google Scholar]
  26. Kravets, V.; Kondrashov, P.; Stern, A. Compressive ultraspectral imaging using multiscale structured illumination. Appl. Opt. 2019, 58, F32–F39. [Google Scholar] [CrossRef] [PubMed]
  27. Garini, Y.; Young, I.T.; McNamara, G. Spectral imaging: Principles and applications. Cytom. Part A 2006, 69A, 735–747. [Google Scholar] [CrossRef]
  28. Othman, N. IR spectroscopy in qualitative and quantitative analysis. In Infrared Spectroscopy-Perspectives and Applications; IntechOpen: London, UK, 2022. [Google Scholar]
  29. Zhang, D.; Xu, L.; Liang, D.; Xu, C.; Jin, X.; Weng, S. Fast prediction of sugar content in Dangshan pear (Pyrus spp.) using hyperspectral imagery data. Food Anal. Methods 2018, 11, 2336–2345. [Google Scholar] [CrossRef]
  30. Zhang, D.; Xu, Y.; Huang, W.; Tian, X.; Xia, Y.; Xu, L.; Fan, S. Nondestructive measurement of soluble solids content in apple using near infrared hyperspectral imaging coupled with wavelength selection algorithm. Infrared Phys. Technol. 2019, 98, 297–304. [Google Scholar] [CrossRef]
  31. Pu, H.; Liu, D.; Wang, L.; Sun, D.-W. Soluble solids content and pH prediction and maturity discrimination of lychee fruits using visible and near infrared hyperspectral imaging. Food Anal. Methods 2016, 9, 235–244. [Google Scholar] [CrossRef]
  32. Patton, M.Q. Qualitative Research & Evaluation Methods: Integrating Theory and Practice; Sage Publications: Thousand Oaks, CA, USA, 2014. [Google Scholar]
  33. Ma, T.; Xia, Y.; Inagaki, T.; Tsuchikawa, S. Non-destructive and fast method of mapping the distribution of the soluble solids content and pH in kiwifruit using object rotation near-infrared hyperspectral imaging approach. Postharvest Biol. Technol. 2021, 174, 111440. [Google Scholar] [CrossRef]
  34. Wu, S.; Li, M.; Zhang, C.; Tan, Q.; Yang, X.; Sun, X.; Pan, Z.; Deng, X.; Hu, C. Effects of phosphorus on fruit soluble sugar and citric acid accumulations in citrus. Plant Physiol. Biochem. 2021, 160, 73–81. [Google Scholar] [CrossRef] [PubMed]
  35. Borba, K.R.; Spricigo, P.C.; Aykas, D.P.; Mitsuyuki, M.C.; Colnago, L.A.; Ferreira, M.D. Non-invasive quantification of vitamin C, citric acid, and sugar in ‘Valência’oranges using infrared spectroscopies. J. Food Sci. Technol. 2021, 58, 731–738. [Google Scholar] [CrossRef] [PubMed]
  36. Brereton, R.G. Chemometrics: Data Analysis for the Laboratory and Chemical Plant; John Wiley & Sons: Hoboken, NJ, USA, 2003. [Google Scholar]
  37. Chu, X.; Huang, Y.; Yun, Y.-H.; Bian, X. Chemometric Methods in Analytical Spectroscopy Technology; Springer: Berlin/Heidelberg, Germany, 2022. [Google Scholar]
  38. Phillips, T.R.; Heaney, C.E.; Benmoufok, E.; Li, Q.; Hua, L.; Porter, A.E.; Chung, K.F.; Pain, C.C. Multi-Output Regression with Generative Adversarial Networks (MOR-GANs). Appl. Sci. 2022, 12, 9209. [Google Scholar] [CrossRef]
  39. Baker, M.J.; Trevisan, J.; Bassan, P.; Bhargava, R.; Butler, H.J.; Dorling, K.M.; Fielden, P.R.; Fogarty, S.W.; Fullwood, N.J.; Heys, K.A. Using Fourier transform IR spectroscopy to analyze biological materials. Nat. Protoc. 2014, 9, 1771–1791. [Google Scholar] [CrossRef] [PubMed]
  40. Yuan, R.; Guo, M.; Li, C.; Chen, S.; Liu, G.; He, J.; Wan, G.; Fan, N. Detection of early bruises in jujubes based on reflectance, absorbance and Kubelka-Munk spectral data. Postharvest Biol. Technol. 2022, 185, 111810. [Google Scholar] [CrossRef]
  41. Khakimov, B.; Gürdeniz, G.; Engelsen, S.B. Trends in the application of chemometrics to foodomics studies. Acta Aliment. 2015, 44, 4–31. [Google Scholar] [CrossRef]
  42. Skov, T.; Honoré, A.H.; Jensen, H.M.; Næs, T.; Engelsen, S.B. Chemometrics in foodomics: Handling data structures from multiple analytical platforms. TrAC Trends Anal. Chem. 2014, 60, 71–79. [Google Scholar] [CrossRef]
  43. Li, J.; Chen, L. Comparative analysis of models for robust and accurate evaluation of soluble solids content in ‘Pinggu’ peaches by hyperspectral imaging. Comput. Electron. Agric. 2017, 142, 524–535. [Google Scholar] [CrossRef]
  44. Wang, F.; Zhao, C.; Yang, H.; Jiang, H.; Li, L.; Yang, G. Non-destructive and in-site estimation of apple quality and maturity by hyperspectral imaging. Comput. Electron. Agric. 2022, 195, 106843. [Google Scholar] [CrossRef]
  45. Shang, M.; Xue, L.; Zhang, Y.; Liu, M.; Li, J. Full-surface defect detection of navel orange based on hyperspectral online sorting technology. J. Food Sci. 2023, 88, 2488–2495. [Google Scholar] [CrossRef]
  46. Li, J.; Rao, X.; Ying, Y. Detection of common defects on oranges using hyperspectral reflectance imaging. Comput. Electron. Agric. 2011, 78, 38–48. [Google Scholar] [CrossRef]
  47. Zhang, H.; Zhang, S.; Dong, W.; Luo, W.; Huang, Y.; Zhan, B.; Liu, X. Detection of common defects on mandarins by using visible and near infrared hyperspectral imaging. Infrared Phys. Technol. 2020, 108, 103341. [Google Scholar] [CrossRef]
  48. Li, P.; Su, G.; Du, G.; Jiang, L.; Dong, Y.; Shan, Y. Portable LWNIR and SWNIR spectroscopy with pattern recognition technology for accurate and nondestructive detection of hidden mold infection in citrus. Microchem. J. 2023, 193, 109203. [Google Scholar] [CrossRef]
  49. Lorente, D.; Escandell-Montero, P.; Cubero, S.; Gómez-Sanchís, J.; Blasco, J. Visible–NIR reflectance spectroscopy and manifold learning methods applied to the detection of fungal infections on citrus fruit. J. Food Eng. 2015, 163, 17–24. [Google Scholar] [CrossRef]
  50. Luo, W.; Zhang, J.; Liu, S.; Huang, H.; Zhan, B.; Fan, G.; Zhang, H. Prediction of soluble solid content in Nanfeng mandarin by combining hyperspectral imaging and effective wavelength selection. J. Food Compos. Anal. 2024, 126, 105939. [Google Scholar] [CrossRef]
  51. Wang, A.; Xie, L. Technology using near infrared spectroscopic and multivariate analysis to determine the soluble solids content of citrus fruit. J. Food Eng. 2014, 143, 17–24. [Google Scholar] [CrossRef]
  52. Wei, X.; He, J.-C.; Ye, D.-P.; Jie, D.-F. Navel orange maturity classification by multispectral indexes based on hyperspectral diffuse transmittance imaging. J. Food Qual. 2017, 2017, 1023498. [Google Scholar] [CrossRef]
  53. Li, P.; Li, S.; Du, G.; Jiang, L.; Liu, X.; Ding, S.; Shan, Y. A simple and nondestructive approach for the analysis of soluble solid content in citrus by using portable visible to near-infrared spectroscopy. Food Sci. Nutr. 2020, 8, 2543–2552. [Google Scholar] [CrossRef]
  54. Qi, H.; Shen, C.; Chen, G.; Zhang, J.; Chen, F.; Li, H.; Zhang, C. Rapid and non-destructive determination of soluble solid content of crown pear by visible/near-infrared spectroscopy with deep learning regression. J. Food Compos. Anal. 2023, 123, 105585. [Google Scholar] [CrossRef]
  55. Gao, S.; Xu, J.-h. Hyperspectral image information fusion-based detection of soluble solids content in red globe grapes. Comput. Electron. Agric. 2022, 196, 106822. [Google Scholar] [CrossRef]
  56. Moghimi, A.; Aghkhani, M.H.; Sazgarnia, A.; Sarmad, M. Vis/NIR spectroscopy and chemometrics for the prediction of soluble solids content and acidity (pH) of kiwifruit. Biosyst. Eng. 2010, 106, 295–302. [Google Scholar] [CrossRef]
  57. Sun, Y.; Wang, Y.; Xiao, H.; Gu, X.; Pan, L.; Tu, K. Hyperspectral imaging detection of decayed honey peaches based on their chlorophyll content. Food Chem. 2017, 235, 194–202. [Google Scholar] [CrossRef]
  58. Rong, D.; Wang, H.; Ying, Y.; Zhang, Z.; Zhang, Y. Peach variety detection using VIS-NIR spectroscopy and deep learning. Comput. Electron. Agric. 2020, 175, 105553. [Google Scholar] [CrossRef]
  59. Sun, Y.; Li, Y.; Pan, L.; Abbas, A.; Jiang, Y.; Wang, X. Authentication of the geographic origin of Yangshan region peaches based on hyperspectral imaging. Postharvest Biol. Technol. 2021, 171, 111320. [Google Scholar] [CrossRef]
  60. Gai, Z.; Sun, L.; Bai, H.; Li, X.; Wang, J.; Bai, S. Convolutional neural network for apple bruise detection based on hyperspectral. Spectrochim. Acta Part A Mol. Biomol. Spectrosc. 2022, 279, 121432. [Google Scholar] [CrossRef]
  61. Rivera, N.V.; Gómez-Sanchis, J.; Chanona-Pérez, J.; Carrasco, J.J.; Millán-Giraldo, M.; Lorente, D.; Cubero, S.; Blasco, J. Early detection of mechanical damage in mango using NIR hyperspectral images and machine learning. Biosyst. Eng. 2014, 122, 91–98. [Google Scholar] [CrossRef]
  62. Ardila, C.E.C.; Ramirez, L.A.; Ortiz, F.A.P. Spectral analysis for the early detection of anthracnose in fruits of Sugar Mango (Mangifera indica). Comput. Electron. Agric. 2020, 173, 105357. [Google Scholar] [CrossRef]
  63. Munawar, A. Rapid and non-destructive detection of insect infestations on intact mango by means of near infrared spectroscopy. In Proceedings of the IOP Conference Series: Earth and Environmental Science, Yinchuan, China, 19–21 September 2019; p. 012037. [Google Scholar]
  64. Chu, X.; Zhang, K.; Wei, H.; Ma, Z.; Fu, H.; Miao, P.; Jiang, H.; Liu, H. A Vis/NIR spectra-based approach for identifying bananas infected with Colletotrichum musae. Front. Plant Sci. 2023, 14, 1180203. [Google Scholar] [CrossRef]
  65. Jie, D.; Zhou, W.; Wei, X. Nondestructive detection of maturity of watermelon by spectral characteristic using NIR diffuse transmittance technique. Sci. Hortic. 2019, 257, 108718. [Google Scholar] [CrossRef]
  66. Lu, R. Multispectral imaging for predicting firmness and soluble solids content of apple fruit. Postharvest Biol. Technol. 2004, 31, 147–157. [Google Scholar] [CrossRef]
  67. Liu, D.; Sun, D.-W.; Zeng, X.-A. Recent advances in wavelength selection techniques for hyperspectral image processing in the food industry. Food Bioprocess Technol. 2014, 7, 307–323. [Google Scholar] [CrossRef]
  68. Cubero, S.; Aleixos, N.; Moltó, E.; Gómez-Sanchis, J.; Blasco, J. Advances in machine vision applications for automatic inspection and quality evaluation of fruits and vegetables. Food Bioprocess Technol. 2011, 4, 487–504. [Google Scholar] [CrossRef]
  69. Kumar, S.; Baghel, M.; Yadav, A.; Dhakar, M.K. Postharvest biology and technology of berries. In Postharvest Biology and Technology of Temperate Fruits; Springer: Berlin/Heidelberg, Germany, 2018; pp. 349–370. [Google Scholar]
  70. Benelli, A.; Cevoli, C.; Ragni, L.; Fabbri, A. In-field and non-destructive monitoring of grapes maturity by hyperspectral imaging. Biosyst. Eng. 2021, 207, 59–67. [Google Scholar] [CrossRef]
  71. Tsakiridis, N.L.; Samarinas, N.; Kokkas, S.; Kalopesa, E.; Tziolas, N.V.; Zalidis, G.C. In situ grape ripeness estimation via hyperspectral imaging and deep autoencoders. Comput. Electron. Agric. 2023, 212, 108098. [Google Scholar] [CrossRef]
  72. Gao, Z.; Shao, Y.; Xuan, G.; Wang, Y.; Liu, Y.; Han, X. Real-time hyperspectral imaging for the in-field estimation of strawberry ripeness with deep learning. Artif. Intell. Agric. 2020, 4, 31–38. [Google Scholar] [CrossRef]
  73. Usall, J.; Casals, C.; Sisquella, M.; Palou, L.; De Cal, A. Alternative technologies to control postharvest diseases of stone fruits. Stewart Postharvest Rev. 2015, 11, 1–6. [Google Scholar]
  74. Wendel, A.; Underwood, J.; Walsh, K. Maturity estimation of mangoes using hyperspectral imaging from a ground based mobile platform. Comput. Electron. Agric. 2018, 155, 298–313. [Google Scholar] [CrossRef]
  75. Wang, H.; Mei, M.; Li, J. Research Progress on Non-Destructive Detection of Internal Quality of Fruits with Large Size and Thick Peel: A Review. Agriculture 2023, 13, 1838. [Google Scholar] [CrossRef]
  76. Tian, X.; Li, J.; Wang, Q.; Fan, S.; Huang, W.; Zhao, C. A multi-region combined model for non-destructive prediction of soluble solids content in apple, based on brightness grade segmentation of hyperspectral imaging. Biosyst. Eng. 2019, 183, 110–120. [Google Scholar] [CrossRef]
  77. Tian, P.; Meng, Q.; Wu, Z.; Lin, J.; Huang, X.; Zhu, H.; Zhou, X.; Qiu, Z.; Huang, Y.; Li, Y. Detection of mango soluble solid content using hyperspectral imaging technology. Infrared Phys. Technol. 2023, 129, 104576. [Google Scholar] [CrossRef]
  78. Rungpichayapichet, P.; Nagle, M.; Yuwanbun, P.; Khuwijitjaru, P.; Mahayothee, B.; Müller, J. Prediction mapping of physicochemical properties in mango by hyperspectral imaging. Biosyst. Eng. 2017, 159, 109–120. [Google Scholar] [CrossRef]
  79. Liu, D.; Wang, E.; Wang, G.; Ma, G. Nondestructive determination of soluble solids content, firmness, and moisture content of “Longxiang” pears during maturation using near-infrared spectroscopy. J. Food Process. Preserv. 2022, 46, e16332. [Google Scholar] [CrossRef]
  80. Xu, M.; Sun, J.; Yao, K.; Cai, Q.; Shen, J.; Tian, Y.; Zhou, X. Developing deep learning based regression approaches for prediction of firmness and pH in Kyoho grape using Vis/NIR hyperspectral imaging. Infrared Phys. Technol. 2022, 120, 104003. [Google Scholar] [CrossRef]
  81. Cevoli, C.; Iaccheri, E.; Fabbri, A.; Ragni, L. Data fusion of FT-NIR spectroscopy and Vis/NIR hyperspectral imaging to predict quality parameters of yellow flesh “Jintao” kiwifruit. Biosyst. Eng. 2024, 237, 157–169. [Google Scholar] [CrossRef]
  82. Xuan, G.; Gao, C.; Shao, Y. Spectral and image analysis of hyperspectral data for internal and external quality assessment of peach fruit. Spectrochim. Acta Part A Mol. Biomol. Spectrosc. 2022, 272, 121016. [Google Scholar] [CrossRef]
  83. Aozora, W.D.; Tantinantrakun, A.; Thompson, A.K.; Teerachaichayut, S. Near infrared hyperspectral imaging for predicting water activity of dehydrated pineapples. Res. Mil. 2022, 12, 1127–1133. [Google Scholar]
  84. Singh, H.K.; Tomar, S.K.; Maurya, P.K. Thresholding Techniques applied for Segmentation of RGB and multispectral images. In Proceedings of the International Journal of Computer Applications®, Online, 7–8 April 2012. [Google Scholar]
  85. Çetin, N.; Karaman, K.; Kavuncuoğlu, E.; Yıldırım, B.; Jahanbakhshi, A. Using hyperspectral imaging technology and machine learning algorithms for assessing internal quality parameters of apple fruits. Chemom. Intell. Lab. Syst. 2022, 230, 104650. [Google Scholar] [CrossRef]
  86. Li, S.; Song, Q.; Liu, Y.; Zeng, T.; Liu, S.; Jie, D.; Wei, X. Hyperspectral imaging-based detection of soluble solids content of loquat from a small sample. Postharvest Biol. Technol. 2023, 204, 112454. [Google Scholar] [CrossRef]
  87. Sharma, S.; Sumesh, K.; Sirisomboon, P. Hyperspectral imaging system for maturity stage classification of durian pulp using bayesian optimized machine learning algorithms. Horticulture 2021, 65, 236–242. [Google Scholar]
  88. Abdullah, S.L.S.; Jamil, N.; Harun, H. Intelligent segmentation of fruit images using an integrated thresholding and adaptive K-means method (TsNKM). J. Teknol. 2016, 78. [Google Scholar]
  89. Bhargavi, K.; Jyothi, S. A survey on threshold based segmentation technique in image processing. Int. J. Innov. Res. Dev. 2014, 3, 234–239. [Google Scholar]
  90. Wang, T.; Li, G.; Dai, C. Soluble Solids Content prediction for Korla fragrant pears using hyperspectral imaging and GsMIA. Infrared Phys. Technol. 2022, 123, 104119. [Google Scholar] [CrossRef]
  91. Yu, Y.; Zhang, Q.; Huang, J.; Zhu, J.; Liu, J. Nondestructive determination of SSC in Korla fragrant pear using a portable near-infrared spectroscopy system. Infrared Phys. Technol. 2021, 116, 103785. [Google Scholar] [CrossRef]
  92. Gao, Q.; Wang, P.; Niu, T.; He, D.; Wang, M.; Yang, H.; Zhao, X. Soluble solid content and firmness index assessment and maturity discrimination of Malus micromalus Makino based on near-infrared hyperspectral imaging. Food Chem. 2022, 370, 131013. [Google Scholar] [CrossRef]
  93. Garillos-Manliguez, C.A.; Chiang, J.Y. Multimodal deep learning and visible-light and hyperspectral imaging for fruit maturity estimation. Sensors 2021, 21, 1288. [Google Scholar] [CrossRef]
  94. Mishra, P.; Woltering, E.; El Harchioui, N. Improved prediction of ‘Kent’mango firmness during ripening by near-infrared spectroscopy supported by interval partial least square regression. Infrared Phys. Technol. 2020, 110, 103459. [Google Scholar] [CrossRef]
  95. Cihan, M.; Ceylan, M. Hyperspectral imaging-based cutaneous wound classification using neighbourhood extraction 3D convolutional neural network. Biomed. Eng. Biomed. Tech. 2023, 68, 427–435. [Google Scholar] [CrossRef]
  96. Riccioli, C.; Pérez-Marín, D.; Garrido-Varo, A. Optimizing spatial data reduction in hyperspectral imaging for the prediction of quality parameters in intact oranges. Postharvest Biol. Technol. 2021, 176, 111504. [Google Scholar] [CrossRef]
  97. Zou, H.; Hastie, T. Regularization and variable selection via the elastic net. J. R. Stat. Soc. Ser. B Stat. Methodol. 2005, 67, 301–320. [Google Scholar] [CrossRef]
  98. Baştanlar, Y.; Özuysal, M. Introduction to machine learning. In miRNomics: MicroRNA Biology and Computational Analysis; Springer: Berlin/Heidelberg, Germany, 2014; pp. 105–128. [Google Scholar]
  99. Li, L.; Li, C.; Fang, J.; Chen, X.; Qin, W.; Zhang, H.; Xu, J.; Jia, B.; Heng, W.; Jin, X. Quantitatively Determine the Iron Content in the Fruit of ‘Huangguan’ Pear Using Near-Infrared Spectroscopy. Horticulturae 2023, 9, 773. [Google Scholar] [CrossRef]
  100. Pratiwi, E.Z.D.; Pahlawan, M.F.; Rahmi, D.N.; Amanah, H.Z.; Masithoh, R.E. Non-destructive evaluation of soluble solid content in fruits with various skin thicknesses using visible–shortwave near-infrared spectroscopy. Open Agric. 2023, 8, 20220183. [Google Scholar] [CrossRef]
  101. Maniwara, P.; Nakano, K.; Ohashi, S.; Boonyakiat, D.; Seehanam, P.; Theanjumpol, P.; Poonlarp, P. Evaluation of NIRS as non-destructive test to evaluate quality traits of purple passion fruit. Sci. Hortic. 2019, 257, 108712. [Google Scholar] [CrossRef]
  102. Xu, S.; Lu, H.; Wang, X.; Ference, C.M.; Liang, X.; Qiu, G. Nondestructive detection of internal flavor in ‘Shatian’ pomelo fruit based on visible/near infrared spectroscopy. Hortscience 2021, 56, 1325–1330. [Google Scholar] [CrossRef]
  103. Serna-Escolano, V.; Giménez, M.J.; Zapata, P.J.; Cubero, S.; Blasco, J.; Munera, S. Non-destructive assessment of ‘Fino’ lemon quality through ripening using NIRS and chemometric analysis. Postharvest Biol. Technol. 2024, 212, 112870. [Google Scholar] [CrossRef]
  104. Guo, Z.; Wang, M.; Agyekum, A.A.; Wu, J.; Chen, Q.; Zuo, M.; El-Seedi, H.R.; Tao, F.; Shi, J.; Ouyang, Q. Quantitative detection of apple watercore and soluble solids content by near infrared transmittance spectroscopy. J. Food Eng. 2020, 279, 109955. [Google Scholar] [CrossRef]
  105. Zhou, C.; Zhang, X.; Liu, Y.; Ni, X.; Wang, H.; Liu, Y. Research on hyperspectral regression method of soluble solids in green plum based on one-dimensional deep convolution network. Spectrochim. Acta Part A Mol. Biomol. Spectrosc. 2023, 303, 123151. [Google Scholar] [CrossRef]
  106. Yao, Y.-n.; Ma, K.; Zhu, J.; Huang, F.; Kuang, L.; Wang, X.; Li, S. Non-destructive determination of soluble solids content in intact apples using a self-made portable NIR diffuse reflectance instrument. Infrared Phys. Technol. 2023, 132, 104714. [Google Scholar] [CrossRef]
  107. Hu, W.; Sun, D.-W.; Blasco, J. Rapid monitoring 1-MCP-induced modulation of sugars accumulation in ripening ‘Hayward’ kiwifruit by Vis/NIR hyperspectral imaging. Postharvest Biol. Technol. 2017, 125, 168–180. [Google Scholar] [CrossRef]
  108. Chen, J.; Bai, T.; Zhang, N.; Zhu, L.; Zhang, X. Hyperspectral detection of sugar content for sugar-sweetened apples based on sample grouping and SPA feature selecting methods. Infrared Phys. Technol. 2022, 125, 104240. [Google Scholar] [CrossRef]
  109. Huang, C.; Cai, J.; Zhou, Y.; El-Seedi, H.R.; Guo, Z. Fusion models for detection of soluble solids content in mandarin by Vis/NIR transmission spectroscopy combined external factors. Infrared Phys. Technol. 2022, 124, 104233. [Google Scholar] [CrossRef]
  110. Wang, J.; Yang, Y.; Li, S.; Zeng, S.; Chi, Q.; Guo, W. Calibration transfer of cross soluble solids content of different kiwifruit cultivars based on Two-stage TrAdaBoost. R2. Postharvest Biol. Technol. 2024, 210, 112783. [Google Scholar] [CrossRef]
  111. Shao, Y.; Ji, S.; Xuan, G.; Wang, K.; Xu, L.; Shao, J. Soluble solids content monitoring and shelf life analysis of winter jujube at different maturity stages by Vis-NIR hyperspectral imaging. Postharvest Biol. Technol. 2024, 210, 112773. [Google Scholar] [CrossRef]
  112. Ma, T.; Zhao, J.; Inagaki, T.; Su, Y.; Tsuchikawa, S. Rapid and nondestructive prediction of firmness, soluble solids content, and pH in kiwifruit using Vis–NIR spatially resolved spectroscopy. Postharvest Biol. Technol. 2022, 186, 111841. [Google Scholar] [CrossRef]
  113. Huang, F.-H.; Liu, Y.-H.; Sun, X.; Yang, H. Quality inspection of nectarine based on hyperspectral imaging technology. Syst. Sci. Control Eng. 2021, 9, 350–357. [Google Scholar] [CrossRef]
  114. Liu, Y.; Zhang, Y.; Jiang, X.; Liu, H. Detection of the quality of juicy peach during storage by visible/near infrared spectroscopy. Vib. Spectrosc. 2020, 111, 103152. [Google Scholar] [CrossRef]
  115. Lu, B.; Liu, N.; Li, H.; Yang, K.; Hu, C.; Wang, X.; Li, Z.; Shen, Z.; Tang, X. Quantitative determination and characteristic wavelength selection of available nitrogen in coco-peat by NIR spectroscopy. Soil Tillage Res. 2019, 191, 266–274. [Google Scholar] [CrossRef]
  116. Dalponte, M.; Bruzzone, L.; Vescovo, L.; Gianelle, D. The role of spectral resolution and classifier complexity in the analysis of hyperspectral images of forest areas. Remote Sens. Environ. 2009, 113, 2345–2355. [Google Scholar] [CrossRef]
  117. Balabin, R.M.; Smirnov, S.V. Variable selection in near-infrared spectroscopy: Benchmarking of feature selection methods on biodiesel data. Anal. Chim. Acta 2011, 692, 63–72. [Google Scholar] [CrossRef]
  118. Cocchi, M.; Biancolillo, A.; Marini, F. Chemometric methods for classification and feature selection. In Comprehensive Analytical Chemistry; Elsevier: Amsterdam, The Netherlands, 2018; Volume 82, pp. 265–299. [Google Scholar]
  119. Du, X.-l.; Li, X.-y.; Liu, Y.; Zhou, W.-h.; Li, J.-l. Genetic algorithm optimized non-destructive prediction on property of mechanically injured peaches during postharvest storage by portable visible/shortwave near-infrared spectroscopy. Sci. Hortic. 2019, 249, 240–249. [Google Scholar] [CrossRef]
  120. Lee, W.-H.; Kim, M.S.; Lee, H.; Delwiche, S.R.; Bae, H.; Kim, D.-Y.; Cho, B.-K. Hyperspectral near-infrared imaging for the detection of physical damages of pear. J. Food Eng. 2014, 130, 1–7. [Google Scholar] [CrossRef]
  121. Sankaran, S.; Mishra, A.; Maja, J.M.; Ehsani, R. Visible-near infrared spectroscopy for detection of Huanglongbing in citrus orchards. Comput. Electron. Agric. 2011, 77, 127–134. [Google Scholar] [CrossRef]
  122. Ghooshkhaneh, N.G.; Golzarian, M.R.; Mollazade, K. VIS-NIR spectroscopy for detection of citrus core rot caused by Alternaria alternata. Food Control 2023, 144, 109320. [Google Scholar] [CrossRef]
  123. Xie, C.; Lee, W.S. Detection of citrus black spot symptoms using spectral reflectance. Postharvest Biol. Technol. 2021, 180, 111627. [Google Scholar] [CrossRef]
  124. Tian, X.; Fan, S.; Huang, W.; Wang, Z.; Li, J. Detection of early decay on citrus using hyperspectral transmittance imaging technology coupled with principal component analysis and improved watershed segmentation algorithms. Postharvest Biol. Technol. 2020, 161, 111071. [Google Scholar] [CrossRef]
  125. Lemaître, G.; Nogueira, F.; Aridas, C.K. Imbalanced-learn: A python toolbox to tackle the curse of imbalanced datasets in machine learning. J. Mach. Learn. Res. 2017, 18, 1–5. [Google Scholar]
  126. Bunkhumpornpat, C.; Sinapiromsaran, K.; Lursinsap, C. DBSMOTE: Density-based synthetic minority over-sampling technique. Appl. Intell. 2012, 36, 664–684. [Google Scholar] [CrossRef]
Figure 1. Schematic diagram of reflectance hyperspectral imaging system.
Agriculture 14 00977 g001
Figure 2. Spectral and component information acquisition steps for samples.
Agriculture 14 00977 g002
Figure 3. Operational procedures for chemometric methods.
Agriculture 14 00977 g003
Figure 4. Experimental environments: (a) laboratory environment; (b) orchard environment.
Agriculture 14 00977 g004
Figure 5. Threshold segmentation: (a) threshold segmentation; (b) manual framing.
Agriculture 14 00977 g005
Table 1. Application of spectroscopic techniques for nondestructive testing of citrus under laboratory conditions.
Ref.Fruit (No. of Samples)Quality ParametersWavelength Range (nm)Light SourceData AnalysisPerformance
[45]Navel oranges (126 samples)Defects975.15–2196.2Two 500 W halogen lampsQCFAccuracy = 100%
[46]Oranges (460 samples)Defects400–1000Two 150 W halogen lampsBR + PCAAccuracy = 93.7%
[47]Citrus (606 samples)Defects400–1000Two 100 W tungsten halogen lampsPCAAccuracy = 96.63%
[48]Citrus (426 samples)Mold
infection
900–170020 W halogen lampPLS-DAAccuracy = 100%
[49]Citrus (117 samples)Detection of fungal infections1000–170010 W halogen light sourceFAAccuracy = 97.8%
[50]Nanfeng mandarin (160 samples)SSC380–1030Two 150 W halogen lampsPLSR R P 2   = 0.956
[51]Citrus (150 samples)SSC200–1100-MLR R p   = 0.893
[52]Navel orange (150 samples)Maturity 390–1055Four 50 W halogen lampsKNNAccuracy = 96%
[53]Citrus (105 samples)SSC600–1100Light source of 12 V/20 WPLS R p   = 0.82
SSC: soluble solid content, PLS-DA: partial least squares discriminant analysis, R p : prediction set correlation coefficient, R P 2 : coefficient of determination in prediction, KNN: k-nearest neighbors, FA: factor analysis, BR: band ratio algorithm, QCF: quadratic curve fitting, MLR: multiple linear regression, PCA: principal component analysis.
Table 2. Application of spectroscopy techniques to non-destructive testing of fruit under laboratory conditions.
Ref.Fruit (No. of Samples)Experimental EnvironmentQuality ParametersWavelength Range (nm)Light SourceData AnalysisPerformance
[54]Pear (279 samples)LaboratorySSC397–1187150 W halogen tungsten lampMLP-CNN-TCN R P 2 = 0.956
[55]Grape (360 samples)LaboratorySSC450–1000Four 50 W halogen lampsPLSR R p   = 0.9762
[56]Kiwifruit (100 samples)LaboratorySSC, PH400–1000A tungsten halogen lamp 300 WPLSR R p   = 0.93, 0.943
[57]Honey peach (300 samples)LaboratoryChlorophyll content400–1000Regulated halogen
tungsten lamp (0–150 W)
PLS R p   = 0.904
[58]Peach (500 samples)LaboratoryFive peach varieties350–820Tungsten halogen lamp (3.5 W)CNNAccuracy = 100%
[59]Peach (200 samples)LaboratoryTwo peach varieties400–2500tungsten halogen lamp (400 W)GSRAccuracy = 99.3%
[60]Apple (60 samples)LaboratoryBruises381–1037Four 75 W tungsten halogen lampsCNNAccuracy = 95.79%
[61]mangoLaboratoryMechanically induced damage650–1100Twelve halogen lamps (20 W)KNNAccuracy = 97.9%
[62]Mango (161 samples)LaboratoryAnthracnose350 –1900Two halogen bulbs
(120 V 400 W)
LDAAccuracy = 91–100%
[63]Mango (40 samples)LaboratoryDisease1000–2500-PCAAccuracy = 99%
[64]Banana (330 samples)LaboratoryColletotrichum species339–1019-CNNAccuracy = 97.37%
[65]Watermelon (200 samples)LaboratoryMaturity200–1110Ten
tungsten halogen lamps
Corrected-RPP (C-RPP)CRR = 88.1%
MLP: multi-layer perceptron, CNN: convolutional neural network, TCN: temporal convolutional neural network, PLSR: partial least squares regression, LDA: linear discriminant analysis, GSR: group sparse representation, CCR: correct classification rate, RPP: ratio of the intensity between peak1 and peak2.
Table 3. Application of spectroscopic techniques for non-destructive testing of berry fruits in an orchard environment.
Ref.Fruit (No. of Samples)Quality ParametersWavelength Range (nm)Light SourceData AnalysisPerformance
[70]Grapes (429 samples)SSC400–1000Clear sky conditions (10:30 a.m. to 12:00 p.m.)PLS R 2 = 0.77
[71]Grapes (90 trees)Sugar content450–1000Clear sky conditions (9:00 a.m. to 14:00 p.m.)Novel autoencoder-based framework R 2   = 0.7
[72]Strawberry (120 samples)Maturity370–1015Overcast skyCNNAccuracy = 98.6%
SSC: soluble solid content, CNN: convolutional neural network, PLS: partial least squares.
Table 4. Application of spectroscopic techniques for the non-destructive detection of drupes in an orchard environment.
Ref.Fruit (No. of Samples)Quality ParametersWavelength Range (nm)Light SourceData AnalysisPerformance
[44]Apple (100 samples)Firmness500–900Natural lightPLSR R V   = 0.783
[44]Apple (100 samples)SSC500–900Natural lightPLSR R V   = 0.901
[44]Apple (100 samples)Starch pattern index500–900Natural lightPLSR R V   = 0.834
[74]Mango (78 samples)Maturity390.9–887.4Clear sky conditionsCNN R C V = 0.64
SSC: soluble solid content, PLSR: partial least squares regression, CNN: convolutional neural network.
Table 5. Applications in the selection of regions of interest for the prediction of quality of different fruits.
Ref.Fruit (No. of Samples)Quality ParametersWavelength Range (nm)Selection Method (ROI)Geometry/ValueData AnalysisPerformance
[78]Mango (160 samples)Firmness,
TSS, TA
450–998Manual framingSquarePLS R p 2 = 0.81, 0.81, 0.5
[79]Apple (118 samples)SSC450–1100Manual framingPoint MNLR R p 2 = 0.953
[80]Grape (240 samples)Firmness,
pH
400.68–1001.61Threshold segmentation0.04LSSVM, PLS R p 2   = 0.9232, 0.9005
[81]Kiwifruit (230 samples)SSC, FF401–1000K-means clustering-PLS R p 2   = 0.914, 0.843
[82]Kiwifruit (150 samples)SSC,
Firmness
400–1000Threshold segmentation0.1MLR R v 2   = 0.841, 0.826
[83]PineappleWater activity935–1720PCA-PLSR R P   = 0.72
TSS: total soluble solids, TA: titratable acidity, MNLR: multivariate nonlinear regression, MCPLS: multi-region combined partial least square, FF: flesh firmness, LSSVM: least squares support vector machine.
Table 6. Selection of the number of samples and the number of features in nondestructive testing by spectroscopy techniques.
Ref.Fruit (No. of Samples)Sample SizeQuality ParametersWavelength Range (nm)Number of FeaturesData AnalysisPerformance
[99]Pear65Iron content900–1700228PLSR R p 2   = 0.753
[100]Dragon fruit,
banana
100SSC400–1000650PLS R p 2   = 0.59,
0.88
[101]Passion fruit240TSS, TA, pulp content (PC)800–1098298PLSR R P   = 0.84, 0.91, 0.99
[102]Pomelo100TSS, acidity detection400–17001300PLSR R p 2   = 0.72, 0.55
[103]Lemon70TSS, TA950–1700212PLSR R p 2 = 0.84, 0.72
[104]Apple663SSC590–1200203PLS R p   = 0.9808
[79]Pear185SSC, firmness, MC833–25002073LSSVM R p = 0.880, 0.826, 0.872
[105]Greengage fruit366sugar content400–1000256PLSR R p   = 0.793
[106]Apple118SSC450–1100650MNLR R 2 = 0.953
[107]Kiwifruit210glucose400–1000600MLP R p   = 0.934
[108]Apple174sugar content900–1750850PLS R p   = 0.916667
[109]Citrus116SSC600–950350PLS R p   = 0.987
[110]Kiwifruit800SSC950–1650434PLSRRPD = 4.386
[111]Winter jujube400SSC400–1000600SVR R v 2   = 0.837
[112]Kiwifruit120SSC600–1100111PLS R c 2 = 0.81
[113]Nectarine480SSC420–1000580LSSVM R p 2   = 0.8146
[114]Peach150SSC350–1150360PLS R p   = 0.819
TSS: total soluble solids, TA: titratable acidity, MC: moisture content, PLSR: partial least squares regression, PLS: partial least squares. MLP: multi-layer perceptron, MNLR: multivariate nonlinear regression, SVR: support vector regression, RPD: residual predictive deviation, LSSVM: least squares support vector machine.
Disclaimer/Publisher’s Note: The statements, opinions and data contained in all publications are solely those of the individual author(s) and contributor(s) and not of MDPI and/or the editor(s). MDPI and/or the editor(s) disclaim responsibility for any injury to people or property resulting from any ideas, methods, instructions or products referred to in the content.

