Article

Deep Learning for Multi-Source Data-Driven Crop Yield Prediction in Northeast China

1
Institute of Smart Agriculture, Jilin Agricultural University, Changchun 130118, China
2
College of Agriculture, Jilin Agricultural University, Changchun 130118, China
3
College of Information Technology, Jilin Agricultural University, Changchun 130118, China
4
Northeast Institute of Geography and Agroecology, Chinese Academy of Sciences, Changchun 130102, China
*
Author to whom correspondence should be addressed.
Agriculture 2024, 14(6), 794; https://doi.org/10.3390/agriculture14060794
Submission received: 29 April 2024 / Revised: 19 May 2024 / Accepted: 21 May 2024 / Published: 22 May 2024
(This article belongs to the Section Digital Agriculture)

Abstract

:
The accurate prediction of crop yields is crucial for enhancing agricultural efficiency and ensuring food security. This study assesses the performance of the CNN-LSTM-Attention model in predicting the yields of maize, rice, and soybeans in Northeast China and compares its effectiveness with traditional models such as RF, XGBoost, and CNN. Utilizing multi-source data from 2014 to 2020, which include vegetation indices, environmental variables, and photosynthetically active parameters, our research examines the model’s capacity to capture essential spatial and temporal variations. The CNN-LSTM-Attention model integrates Convolutional Neural Networks, Long Short-Term Memory, and an attention mechanism to effectively process complex datasets and manage non-linear relationships within agricultural data. Notably, the study explores the potential of using kNDVI for predicting yields of multiple crops, highlighting its effectiveness. Our findings demonstrate that advanced deep-learning models significantly enhance yield prediction accuracy over traditional methods. We advocate for the incorporation of sophisticated deep-learning technologies in agricultural practices, which can substantially improve yield prediction accuracy and food production strategies.

1. Introduction

Agriculture is a cornerstone of the global economy, and ensuring food security and sustainable development represents one of the major challenges today [1,2,3]. As one of the largest food producers in the world, China plays a crucial role in the global food supply [4]. The Northeast region of China, in particular, is not only endowed with extensive arable land but also favorable climatic conditions suitable for the cultivation of various crops, making it a vital food production base within the country [5,6]. Maize, rice, and soybeans are the main crops of this region, and their yields are directly linked to national food security as well as the stability of the agricultural economy and the income levels of farmers [7,8]. Therefore, enhancing the accuracy of yield predictions for these crops is of great significance for formulating scientific agricultural policies and guiding agricultural production.
With the rapid development of remote sensing technology, its application in agriculture, particularly in yield prediction, is becoming increasingly widespread [9,10]. Remote sensing can provide extensive, timely information on land cover, making it easier and more accurate to monitor crop growth [11]. By analyzing remote sensing data, researchers can obtain growth parameters of crops, such as the Leaf Area Index (LAI) and Fraction of Photosynthetically Active Radiation (Fpar), which are crucial for estimating crop yields [12,13]. Additionally, the ability of remote sensing to integrate multi-source data enables researchers to utilize different sensors and wavelengths, enhancing the accuracy of yield predictions [14]. For instance, remote sensing indices like the Normalized Difference Vegetation Index (NDVI), the Enhanced Vegetation Index (EVI), and the Normalized Difference Water Index (NDWI) have been extensively used for monitoring vegetation health and estimating crop yields [15,16]. Recently, the Kernel Normalized Difference Vegetation Index (kNDVI), an advanced version of NDVI, has been proposed. This index addresses the limitations of traditional NDVI, such as the saturation in high biomass areas and non-linear relationships with some biophysical variables (e.g., green biomass) [17,18]. kNDVI uses statistical methods to maximize the extraction of vegetation spectral information, allowing for the more sensitive and precise monitoring of vegetation growth [19]. Studies show that, compared to traditional NDVI, kNDVI has proven to enhance the accuracy of monitoring key parameters like the LAI, Gross Primary Productivity (GPP), and Solar Induced Fluorescence (SIF) [20,21,22]. kNDVI has been extensively researched in various fields, demonstrating its broad potential for application in remote sensing vegetation monitoring and ecological studies. This includes assessing the dynamic responses of vegetation to climate and land use changes in the Inner Mongolia section of the Yellow River Basin in China, as well as studying the spatiotemporal variations and climatic driving factors of vegetation coverage in the Yellow River Basin [23,24]. However, the application of kNDVI in the prediction of yields for various crops is relatively less explored, and this area remains ripe for further investigation and development. Besides vegetation indices, climatic factors such as precipitation (Pr), temperature (Tmmn, Tmmx), and soil moisture (Soil) also play crucial roles in influencing crop growth and yields, and these can also be acquired via remote sensing technologies [25,26]. Therefore, the comprehensive utilization of multi-source remote sensing data is essential for enhancing the accuracy of crop yield predictions. In this regard, many scholars have conducted in-depth research. Li et al. [27] utilized multi-source environmental data to predict wheat yields in China, demonstrating that incorporating NIRv with other environmental factors significantly improves yield prediction accuracy. Chen et al. [28] demonstrated that the integration of climate variables, satellite data, and meteorological indices significantly enhances the accuracy of large-scale maize yield predictions across China. This emphasis on integrating diverse sources of remote sensing data underlines the critical importance of multi-source data for enhancing the precision of yield predictions. However, to fully exploit the potential of such comprehensive data integration, there is a pressing need for more sophisticated methods and approaches that can effectively manage and analyze the complexity of multi-source information.
As computational power and data-processing technologies advance, the application of machine-learning and deep-learning methods in agricultural remote sensing is increasingly gaining attention [29]. These methods can learn complex patterns and relationships from extensive remote sensing data, offering new avenues for crop yield prediction [30]. Traditional machine-learning approaches, such as Random Forest (RF) and Support Vector Machine (SVM), have been widely applied to crop yield estimation and have demonstrated robust performance [31,32]. In recent years, deep-learning technologies, particularly Convolutional Neural Networks (CNN) and Long Short-Term Memory networks (LSTM), have been increasingly applied to crop yield prediction research due to their advantages in handling time-series data [33,34,35]. These deep-learning models are capable of automatically extracting features from remote sensing data and capturing long-term dependencies in time-series data, thereby enhancing the accuracy and robustness of predictions [36]. Many researchers have already employed deep learning for crop yield prediction. For instance, Paudel et al. [37] demonstrated that LSTM models outperform Gradient-Boosted Decision Trees (GBDTs) for soft wheat in Germany and perform comparably in other case studies, highlighting the potential of LSTM to automatically learn features and enhance crop yield predictions. In contrast, the combined CNN-LSTM model effectively processes time-series remote sensing data, enhancing the spatiotemporal accuracy of yield predictions. Zhou et al. [38] employed three models, CNN-LSTM, CNN, and Convolutional LSTM (ConvLSTM), to predict annual rice yield at the county level in Hubei Province, China. The results indicated that the CNN-LSTM model outperformed the other two models in predictive accuracy. Additionally, to further enhance the model performance, many researchers have explored incorporating attention mechanisms into yield prediction models. Attention mechanisms help the model focus on key information within the data, thereby improving prediction outcomes [39,40]. Leveraging recent advancements in deep learning and machine learning, this study aims to harness these technologies to refine the accuracy of crop yield predictions in Northeast China.
This study aims to predict the yields of major crops such as maize, rice, and soybeans in Northeast China by applying multi-source data combined with advanced machine-learning and deep-learning techniques. The key contributions of this study are as follows: (1) it evaluates the effectiveness of the CNN-LSTM-Attention model in predicting yields of maize, rice, and soybean using multi-source data; (2) it introduces the newly proposed kNDVI vegetation index, comparing it with traditional indices like NDVI, EVI, and NDWI to explore their effectiveness and potential value in crop yield prediction; and (3) it provides a comprehensive analysis of the impacts of various environmental and photosynthetically active variables on crop yields, offering valuable insights for precision agriculture. Through this study, we hope to provide more scientific and efficient technological support for precision agriculture, contribute to global food security, and promote sustainable agricultural development. Ultimately, this research enhances our understanding of using remote sensing technology for crop yield prediction and provides data support for relevant agricultural policies.

2. Materials and Methods
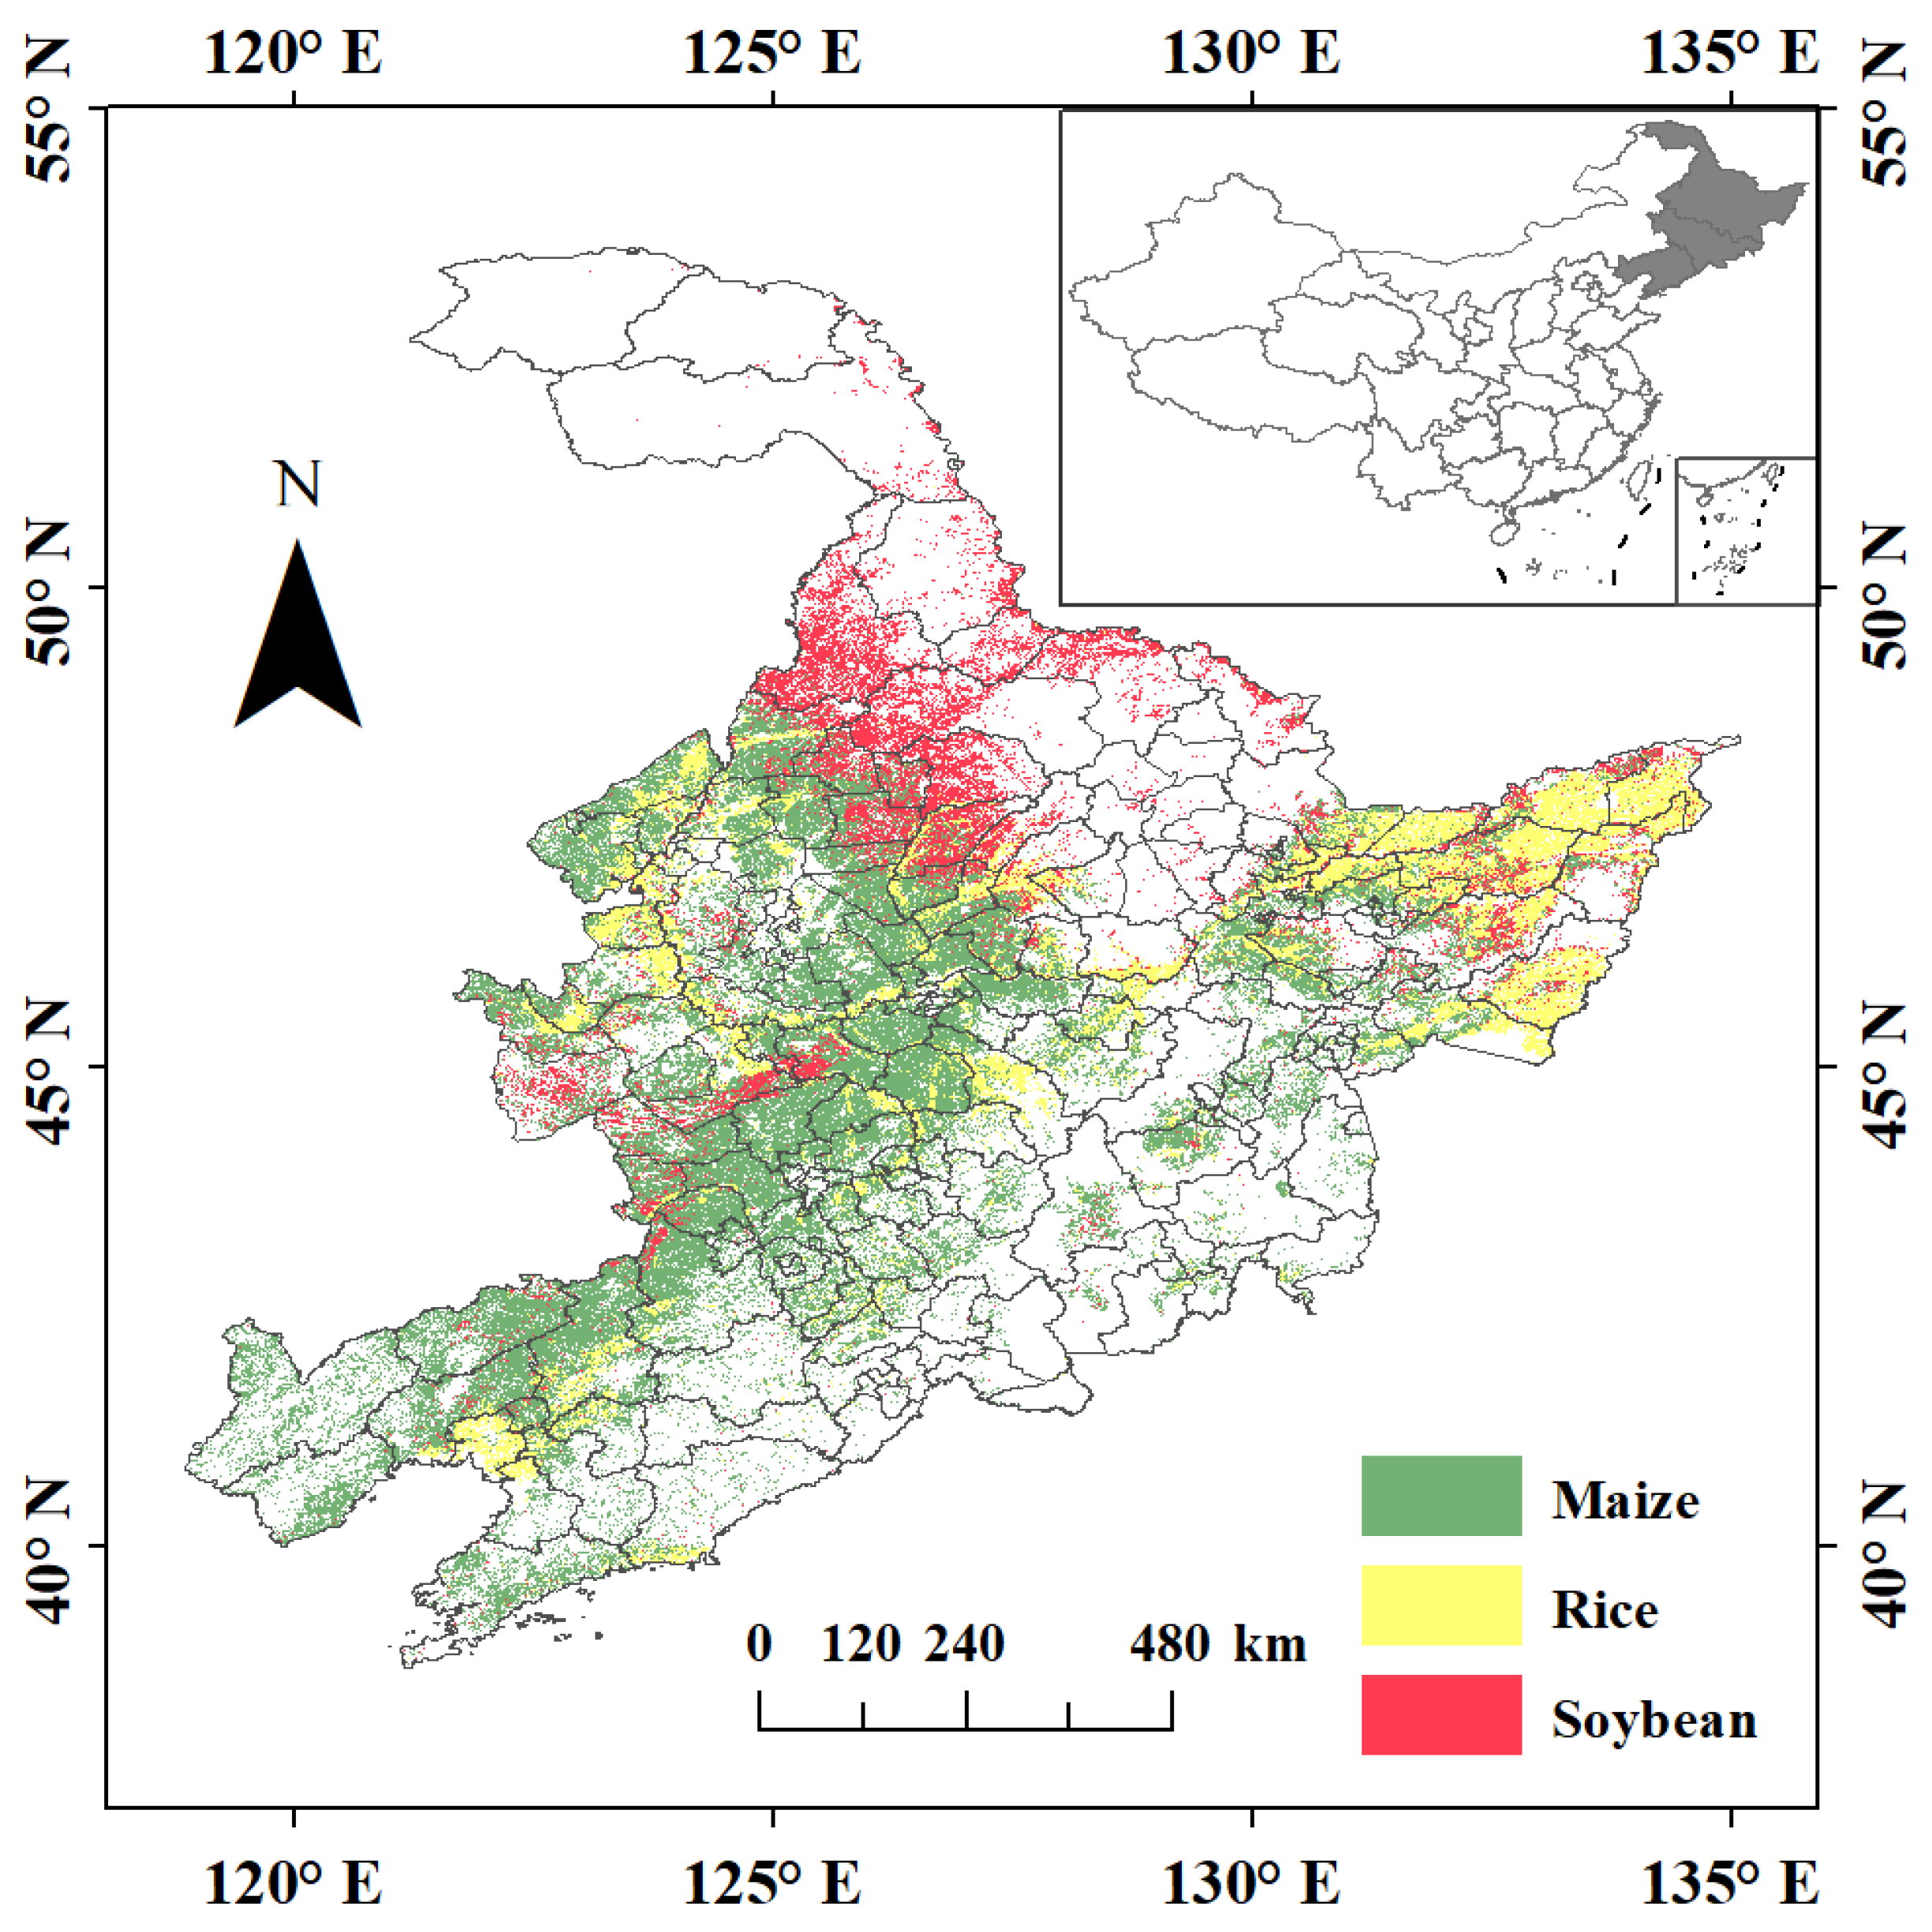
2.1. Study Area

The study area is located in Northeast China, encompassing Heilongjiang, Jilin, and Liaoning provinces, covering an approximate area of 787,000 square kilometers. Geographically, the region is predominantly in the temperate zone, bordering Russia to the north and extending south to the coastlines of the Yellow Sea and the Bohai Sea. Northeast China is renowned for its fertile soil, mild climate, and abundant water resources, making it a crucial grain-producing region in China. Heilongjiang Province, located at the utmost northeast of China, is known for its vast plains and fertile black earth, ranking as one of the primary grain-producing areas in the country. Jilin Province, in the central part of Northeast China, features a terrain that slopes from southeast to northwest and has climatic conditions favorable for the growth of various crops. Liaoning Province, located in the southern part of the region, boasts a relatively mild climate and excellent agricultural production conditions.
Agricultural production in Northeast China is influenced by seasonal climate changes, with the critical growth periods for crops typically extending from spring to autumn. The main crops in the region include maize, rice, and soybeans, with soybeans and maize being traditional crops of advantage. Rice is primarily cultivated in eastern Heilongjiang, western Jilin, and central Liaoning (Figure 1).

2.2. Data

In this paper, we define the growing season for maize, rice, and soybeans in Northeast China as May through October, focusing our analysis on crop growth during this period. Our research employed five key types of data—crop statistics, planting area masks, vegetation indices, environmental variables, and photosynthetically active indices—enabling a comprehensive analysis of the productivity traits and environmental interactions of these three primary crops. In terms of data processing, we first resampled the data to a 500 m resolution and standardized the temporal steps of vegetation indices, environmental variables, and photosynthetically active indices to monthly intervals. Subsequently, all input data were aggregated to average values per county after applying the planting area masks. All these data-processing and analysis tasks were conducted on the Google Earth Engine (GEE) platform. The specifics of the data utilized in this study are detailed in Table 1.

2.2.1. Crop Yield and Planting Area

We obtained yield data for maize, rice, and soybeans from May to October for the years 2014–2020 from the Heilongjiang Provincial Bureau of Statistics (http://tjj.hlj.gov.cn/, accessed on 28 May 2023), Jilin Provincial Bureau of Statistics (http://tjj.jl.gov.cn/, accessed on 28 May 2023), and Liaoning Provincial Bureau of Statistics (https://tjj.ln.gov.cn/tjj/, accessed on 28 May 2023), with units in kg/ha. We collected county-level crop yield data from Jilin Province and city-level crop yield data from Liaoning Province, based on data availability. For Heilongjiang Province, we acquired city-level data for maize and rice yields, and county-level data for soybean yields. We applied three rules to identify and filter outliers: firstly, we excluded yield records that exceeded biophysical plausibility; secondly, we filtered out data points that lay beyond the range of plus or minus two standard deviations from the average yield for the years 2014 to 2020; and, finally, we eliminated discontinuous yield records to ensure the accuracy and reliability of our analysis [41,42].
In this study, the delineation of the planting regions for maize, rice, and soybeans in Northeast China is informed by the research conducted by Xuan et al. [43]. Their study provides a detailed mapping of crop types across the region from 2013 to 2021, employing an innovative approach that combines automatic sampling with tile-based image classification. This methodological framework has been proven to yield highly accurate and reliable crop maps with a 30 m resolution, achieving classification accuracies ranging from 89% to 97%. These maps serve as a crucial resource for analyzing agricultural production patterns and managing food security in this key agricultural area.

2.2.2. Vegetation Indices

Vegetation indices (VIs) are critical metrics derived from remote sensing reflectance measurements, offering insights into vegetation health, vigor, and photosynthetic activity [44]. This study utilizes four notable VIs: NDVI, kNDVI, EVI, and NDWI. These indices were derived from Moderate Resolution Imaging Spectroradiometer (MODIS) satellite data, providing consistent and reliable measurements over large spatial extents.
Among them, the NDVI is widely utilized for its efficacy in estimating vegetation vigor and biomass, relying on the differential reflectance of visible and near-infrared light by vegetation [45]. The EVI further refines this estimation by correcting for distortions from soil background and atmospheric particles, enhancing the vegetation signal [46]. The NDWI is indispensable for indicating plant water content, thereby serving as an indicator for vegetation water stress [47]. The kernel Normalized Difference Vegetation Index (kNDVI) stands out as a pivotal advancement in this study. It refines the classical NDVI by integrating a kernel function, enhancing the index’s responsiveness in high-biomass environments. Unlike NDVI, which is based on the raw difference between near-infrared (NIR) and red reflectance, the kNDVI employs a non-linear statistical model through kernel methods [48,49]. The adoption of the radial basis function (RBF) kernel modifies the interaction between NIR and red spectral bands, incorporating a scale parameter σ to better capture the nuanced variations in vegetation [50]. The kNDVI is mathematically articulated as:
k N D V I = tanh ( N D V I 2 )
This reformulation not only streamlines computational demands but also elevates the granularity with which the index detects vegetative anomalies within dense canopies. The unique adaptation of σ for each pixel, determined by averaging the NIR and red reflectance values, facilitates a customized interpretation of vegetative density [51]. The refined acuity of kNDVI is indispensable for accurately discerning vegetation health and is anticipated to substantially enhance crop yield predictions in the fertile expanses of Northeast China.

2.2.3. Environmental Variables

Complementing the spectral insights from the VIs, this study leveraged a comprehensive suite of environmental variables to capture the complex nature of agro-ecological conditions. We incorporated various environmental metrics, including the Palmer Drought Severity Index (Pdsi), Potential Evapotranspiration (Pet), Precipitation (Pr), Soil Moisture Content (Soil), Minimum and Maximum Temperature (Tmmn and Tmmx), and Vapor Pressure (Vap). These variables were meticulously sourced from the TerraClimate database, renowned for its high-resolution data that consistently portrays accurate monthly climate and environmental conditions across diverse terrestrial landscapes. Pdsi is critical for assessing drought severity and its potential impacts on agricultural output, while Pet evaluates the amount of water potentially lost to soil evaporation and plant transpiration, reflecting the ecosystem’s water needs [52]. Pr directly indicates water input, essential for assessing the water supply available to crops. Soil moisture content is a key determinant of plant-available water, vital for understanding water balance within the crop rhizosphere. The thermal indices, Tmmn and Tmmx, are crucial for regulating plant physiological and developmental activities [53]. Vap, indicating atmospheric moisture levels, has significant implications for plant water usage and stress conditions. The integration of these environmental variables from TerraClimate provides a robust framework for analyzing and interpreting the complex interactions between climatic factors and agricultural productivity [54]. When analyzed alongside VIs, these metrics enable a more nuanced understanding of crop yield variability in response to the changing environmental conditions within Northeast China’s diverse agricultural ecosystems.

2.2.4. Photosynthetically Active Variables
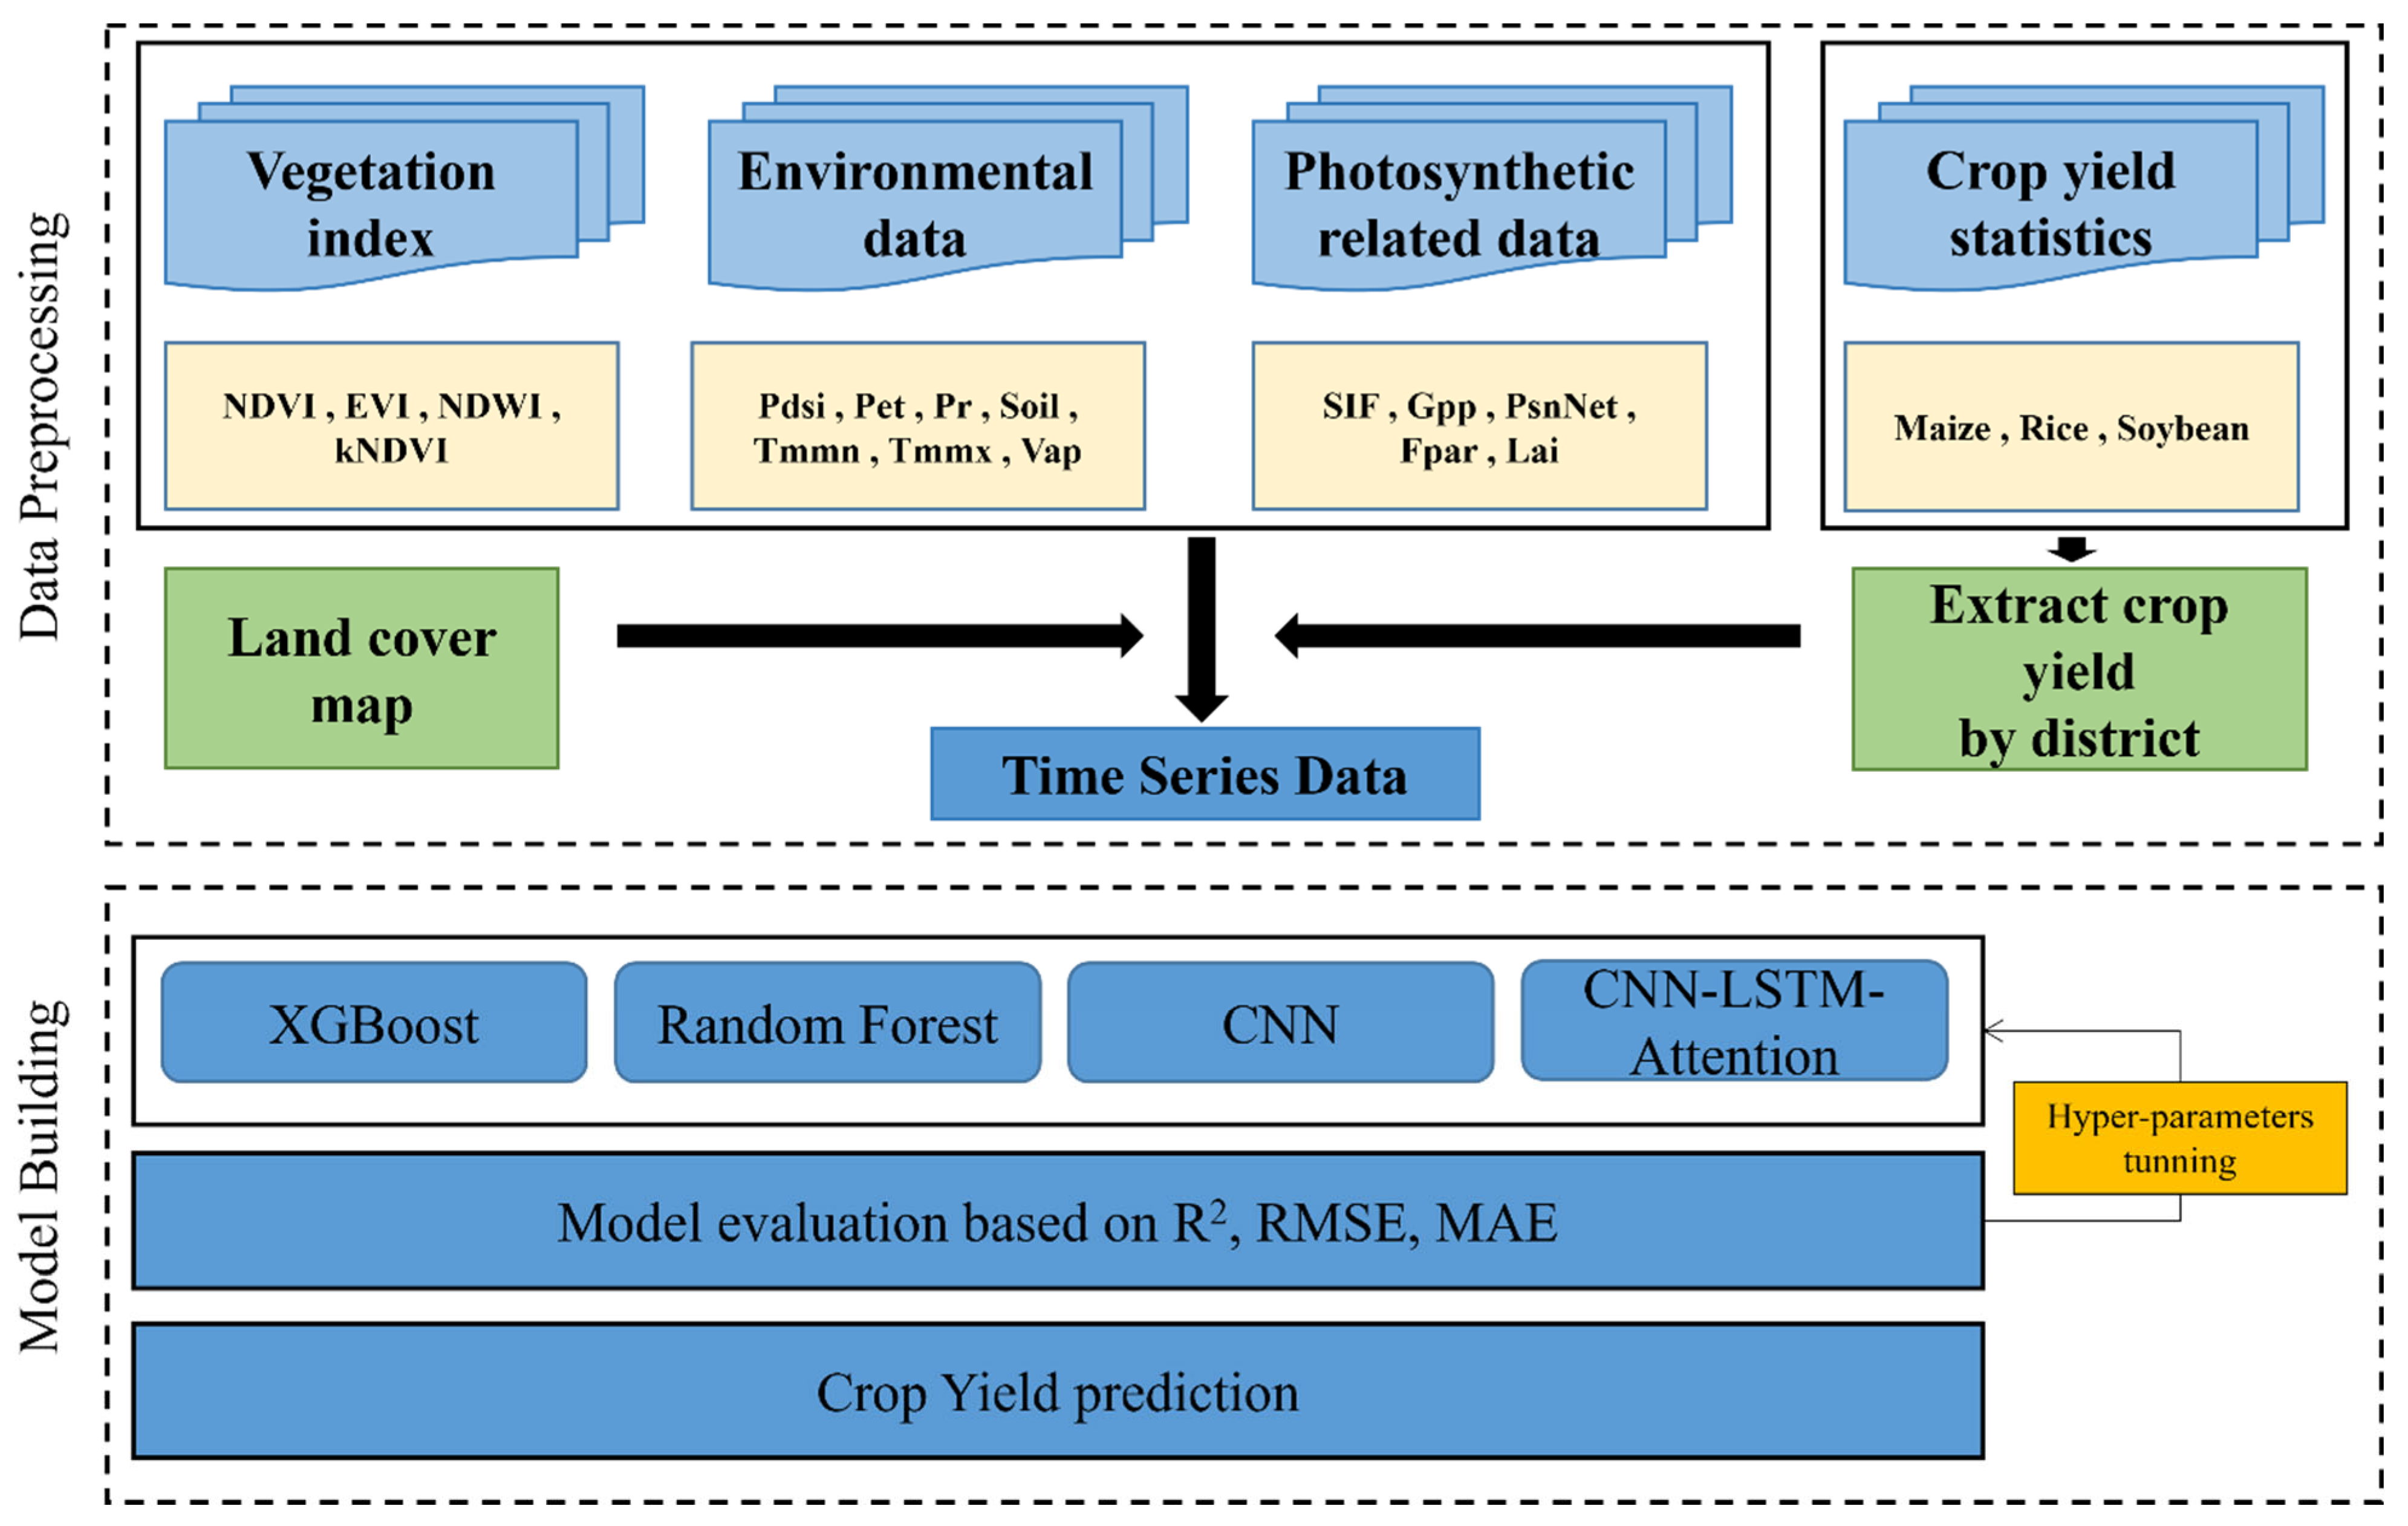
Our dataset integrates several key variables that are instrumental in assessing the photosynthetic efficiency and carbon sequestration capabilities of vegetation. These include SIF, GPP, Net Photosynthesis (PsnNet), Fpar, and LAI.
SIF is a satellite-retrieved measurement that acts as a dependable indicator of photosynthetic activity, making it a valuable tool for crop yield prediction. Recognizing the potential of SIF in agricultural prediction, our study has incorporated an advanced SIF dataset developed by Chen et al. [55] and made accessible via the National Tibetan Plateau Data Center. The precision of this SIF dataset enhances the capacity for accurate crop yield prediction, providing an exceptional tool to link photosynthetic efficiency with agricultural productivity. By undergoing extensive validation with TROPOMI and tower-based SIF observations, and comparisons with other satellite-derived SIF sources like GOME-2 and OCO-2, the dataset’s robustness and reliability for predictive analysis are confirmed. Employing this dataset in predictive models has the potential to significantly improve the understanding of how photosynthetic activity correlates with crop yields. This advance in modeling contributes to broader insights into ecosystem carbon dynamics, aiding efforts toward carbon neutrality and sustainable agricultural practices.
GPP, a measure of the total carbon fixed by plants through photosynthesis, serves as the primary energy source driving terrestrial ecosystems and is crucial for understanding carbon cycling within these systems [56]. PsnNet quantifies the net carbon gain in plants after accounting for respiration losses, providing insights into the actual carbon accumulation in plant biomass, which directly affects crop yield [57]. Fpar indicates the proportion of incoming solar radiation in photosynthetically active wavelengths absorbed by the plant canopy, essential for estimating photosynthetic efficiency and potential growth rates [58]. LAI measures the total one-sided green leaf area per unit ground surface area, playing a critical role in modeling canopy light interception, photosynthesis, and transpiration, all of which are directly related to biomass production and crucial for determining crop yield [59]. These variables, derived from MODIS satellite data, offer a comprehensive view of the photosynthetic activity and health of agricultural crops. Their incorporation into predictive models enhances the accuracy of crop yield predictions and deepens understanding of the impacts of environmental conditions on agricultural productivity. By leveraging these photosynthetically active variables, our study aims to improve the precision of crop yield predictions, thereby contributing to more sustainable and efficient agricultural practices.

2.3. Methodology

2.3.1. Exploratory Data Analysis

Given our study’s focus, we tailored the feature selection process to pinpoint the most pertinent variables for predicting crop yields within the critical growth window. Our dataset spans from May to October, encapsulating the complete growth season for maize, rice, and soybeans. Nonetheless, drawing on agronomic insights and prior studies, we’ve identified July and August as pivotal months for crop development in Northeast China, coinciding with vital physiological phases like flowering and grain filling that are essential for final yield determination [60]. To harness this knowledge, our feature selection honed in on data from these key months. We conducted a correlation analysis to discern the relationship between each variable in this timeframe and the eventual crop yield. Those variables with a significant yield correlation (p-value < 0.05) were flagged as prospective predictors. This strategy helped us to refine our feature set to those with the highest likelihood of influencing yield during these decisive growth stages. By focusing on variables pertinent to July and August, our goal was to distill the data down to the most yield-relevant information, thereby streamlining our dataset’s complexity. This focused approach is in sync with the biological rhythms of crop maturation and aids in forging models that are both more interpretable and effective.
In addition to correlation analysis, we applied the Variance Inflation Factor (VIF) to check for multicollinearity among the identified features. Multicollinearity can skew the variance of regression coefficients, compromising the stability and reliability of models. Typically, a VIF value exceeding 10 signals significant multicollinearity [61]. Having pinpointed variables strongly correlated with yield for the crucial months of July and August, we computed their VIFs. Those exhibiting high VIFs underwent further examination. When multicollinearity was detected, we carefully decided whether to keep or exclude variables, considering their agronomic significance and impact on the model’s accuracy. This step ensured that our final set of features was not only relevant to the critical growth period but also free from severe multicollinearity, thereby enhancing the robustness of our predictive models.

2.3.2. Random Forest

In our study, we employed the Random Forest (RF) model, a robust machine-learning algorithm, for predicting crop yields. The RF model, an ensemble-learning method, constructs multiple decision trees during training and outputs the mean prediction of individual trees for regression tasks. It is particularly suitable for modeling complex agricultural systems due to its ability to handle non-linear relationships and interactions between variables. Our RF model was configured with 200 trees (n_estimators = 200), ensuring improved accuracy and stability. Each tree in the forest is required to have at least four samples in its leaf nodes (min_samples_leaf = 4), which helps prevent overfitting and enhances the model’s generalizability. The model’s reproducibility is ensured by setting the random seed (random_state = 2).

2.3.3. XGBoost

Our research capitalized on the eXtreme Gradient Boosting (XGBoost) algorithm, celebrated for its efficiency and effectiveness in gradient-boosting frameworks. The XGBoost model employed 200 boosting rounds (n_estimators = 200) with a learning rate of 0.1 to control the boosting process. The depth of each regression tree was capped at six levels (max_depth = 6), and the minimum child weight was set to one (min_child_weight = 1), fine-tuning the complexity of tree development. To bolster the model’s robustness and introduce diversity, 80% of the samples (subsample = 0.8) and features (colsample_bytree = 0.8) were randomly selected for the construction of each tree. A consistent random seed (random_state = 2) guaranteed the reproducibility of our results.

2.3.4. CNN

The architecture of our CNN model comprises one-dimensional convolutional layers, designed to extract spatial and temporal features from the input data. The first convolutional layer has 64 filters with a kernel size of 3, followed by a max-pooling layer with a pool size of 2 to reduce the dimensionality. A second convolutional layer with 128 filters and another max-pooling layer further refine the feature extraction. These layers are followed by a flattening layer to transform the two-dimensional output into a one-dimensional array for the subsequent dense layers. The model includes two dense layers with 128 and 64 neurons, respectively, and ReLU activation to introduce non-linearity and aid in learning complex relationships. The final output layer consists of a single neuron for regression, as our objective is to predict a continuous value, the crop yield. The CNN model is compiled with the Adam optimizer, with a learning rate of 0.0006, and Huberloss function, which are standard choices for regression tasks. The model was trained on reshaped input data to include a channel dimension, which is a requirement for convolutional layers. During training, we employed a batch size of 32 and ran the model for 5000 epochs. The model’s performance was monitored on a validation set to prevent overfitting and ensure that it generalizes well to unseen data. The architecture and hyperparameters were selected based on preliminary experiments and cross-validation to optimize the model’s predictive accuracy. By leveraging the CNN model, we aim to capture the intricate patterns in the data that are indicative of crop yield, thus providing a powerful tool for agricultural prediction and management.

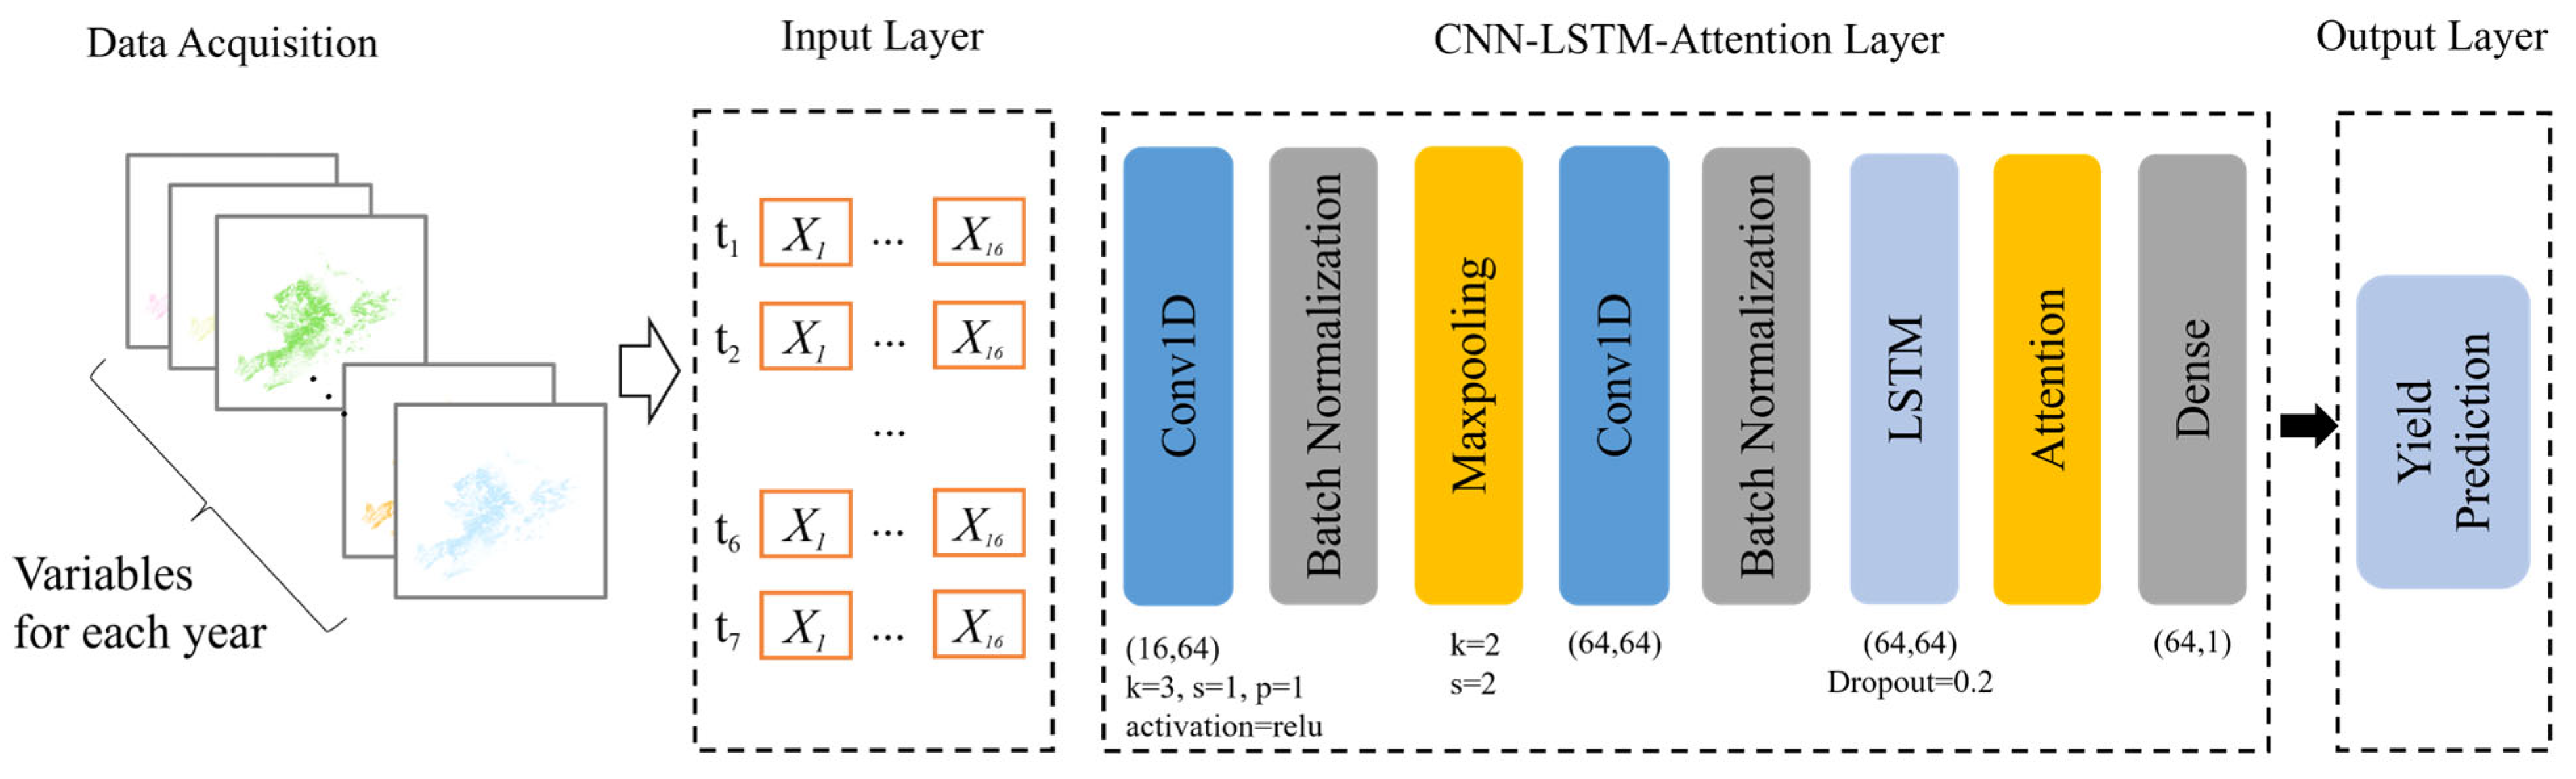
2.3.5. CNN-LSTM-Attention

In our study, we introduced an innovative CNN-LSTM-Attention model designed to predict crop yields by harnessing the temporal patterns inherent in our dataset. This model architecture synergizes the capabilities of CNN for feature extraction, LSTM networks for capturing temporal dependencies, and an attention mechanism to emphasize the most significant features (Figure 2). The model’s first component, the CNN, consists of two convolutional layers, each followed by batch normalization, a ReLU activation function, and max pooling. This setup effectively extracts spatial features from the input data. The output of the CNN layers is then fed into an LSTM layer, which is designed to capture temporal relationships in the data. The LSTM’s hidden states are passed through an attention layer, which assigns weights to different time steps based on their relevance to the target variable. These weights are learned during the training process. The attention mechanism calculates a context vector as a weighted sum of the hidden states, where the weights reflect the importance of each time step. This context vector is then passed through a fully connected layer to produce the final yield prediction. The final output is obtained by applying a fully connected layer to the attention-weighted LSTM output, producing a single continuous value for each input sample, representing the predicted crop yield. The model was trained on our dataset using the Adam optimizer with a learning rate of 0.0006 and a Huberloss function. Training was performed for 5000 epochs with a batch size of 32.
Table 2 provides a detailed overview of the hyperparameters tested and selected for each model during the optimization process. This includes the range of values considered for each hyperparameter and the final values chosen to achieve optimal performance.
Table 3 provides a comprehensive summary of the preliminary experiments conducted to evaluate the effectiveness of different model architectures, the hyperparameter tuning processes employed to optimize model performance, and the cross-validation strategies used to ensure model robustness and generalizability. These steps were critical in identifying the best performing model and ensuring its ability to accurately predict crop yields across diverse datasets.

2.3.6. Performance Evaluation

In our study, the performance of various models, including RF, XGBoost, and CNN-LSTM-Attention, was evaluated using data from 2014 to 2019 for training, and data from 2020 for testing. This approach ensured that the models were assessed on their ability to generalize to new, unseen data. The effectiveness of each model’s crop yield predictions was measured using several key metrics: the coefficient of determination (R-squared, R2) indicates the proportion of variance in the observed crop yields explained by the model; and an R2 value closer to 1 indicates a better fit, meaning that the model can explain a higher proportion of the variance in the yield data. The Root Mean Squared Error (RMSE) quantifies the average magnitude of the prediction errors, with lower RMSE values indicating better model performance. The Mean Absolute Percentage Error (MAPE) expresses the average error as a percentage of the actual values; like RMSE, lower MAPE values signify more accurate predictions. These metrics collectively provide a comprehensive assessment of the models’ accuracy, fitting ability, and error magnitude, enabling us to determine their suitability for agricultural yield prediction. These metrics are expressed as follows:
R 2 = 1 i = 1 n y i y ^ i 2 i = 1 n y i y ¯ 2
R M S E = 1 n i = 1 n y i y ^ i 2
M A P E = 100 % n i = 1 n | ( y i y ^ i ) y i |
where y i is the actual value, y ^ i is the predicted value, y ¯ is the mean of the actual values, and n is the number of observations.
To visually illustrate the integrated framework of multi-source data with machine- and deep-learning models used for crop yield prediction in our study, refer to Figure 3.

3. Results

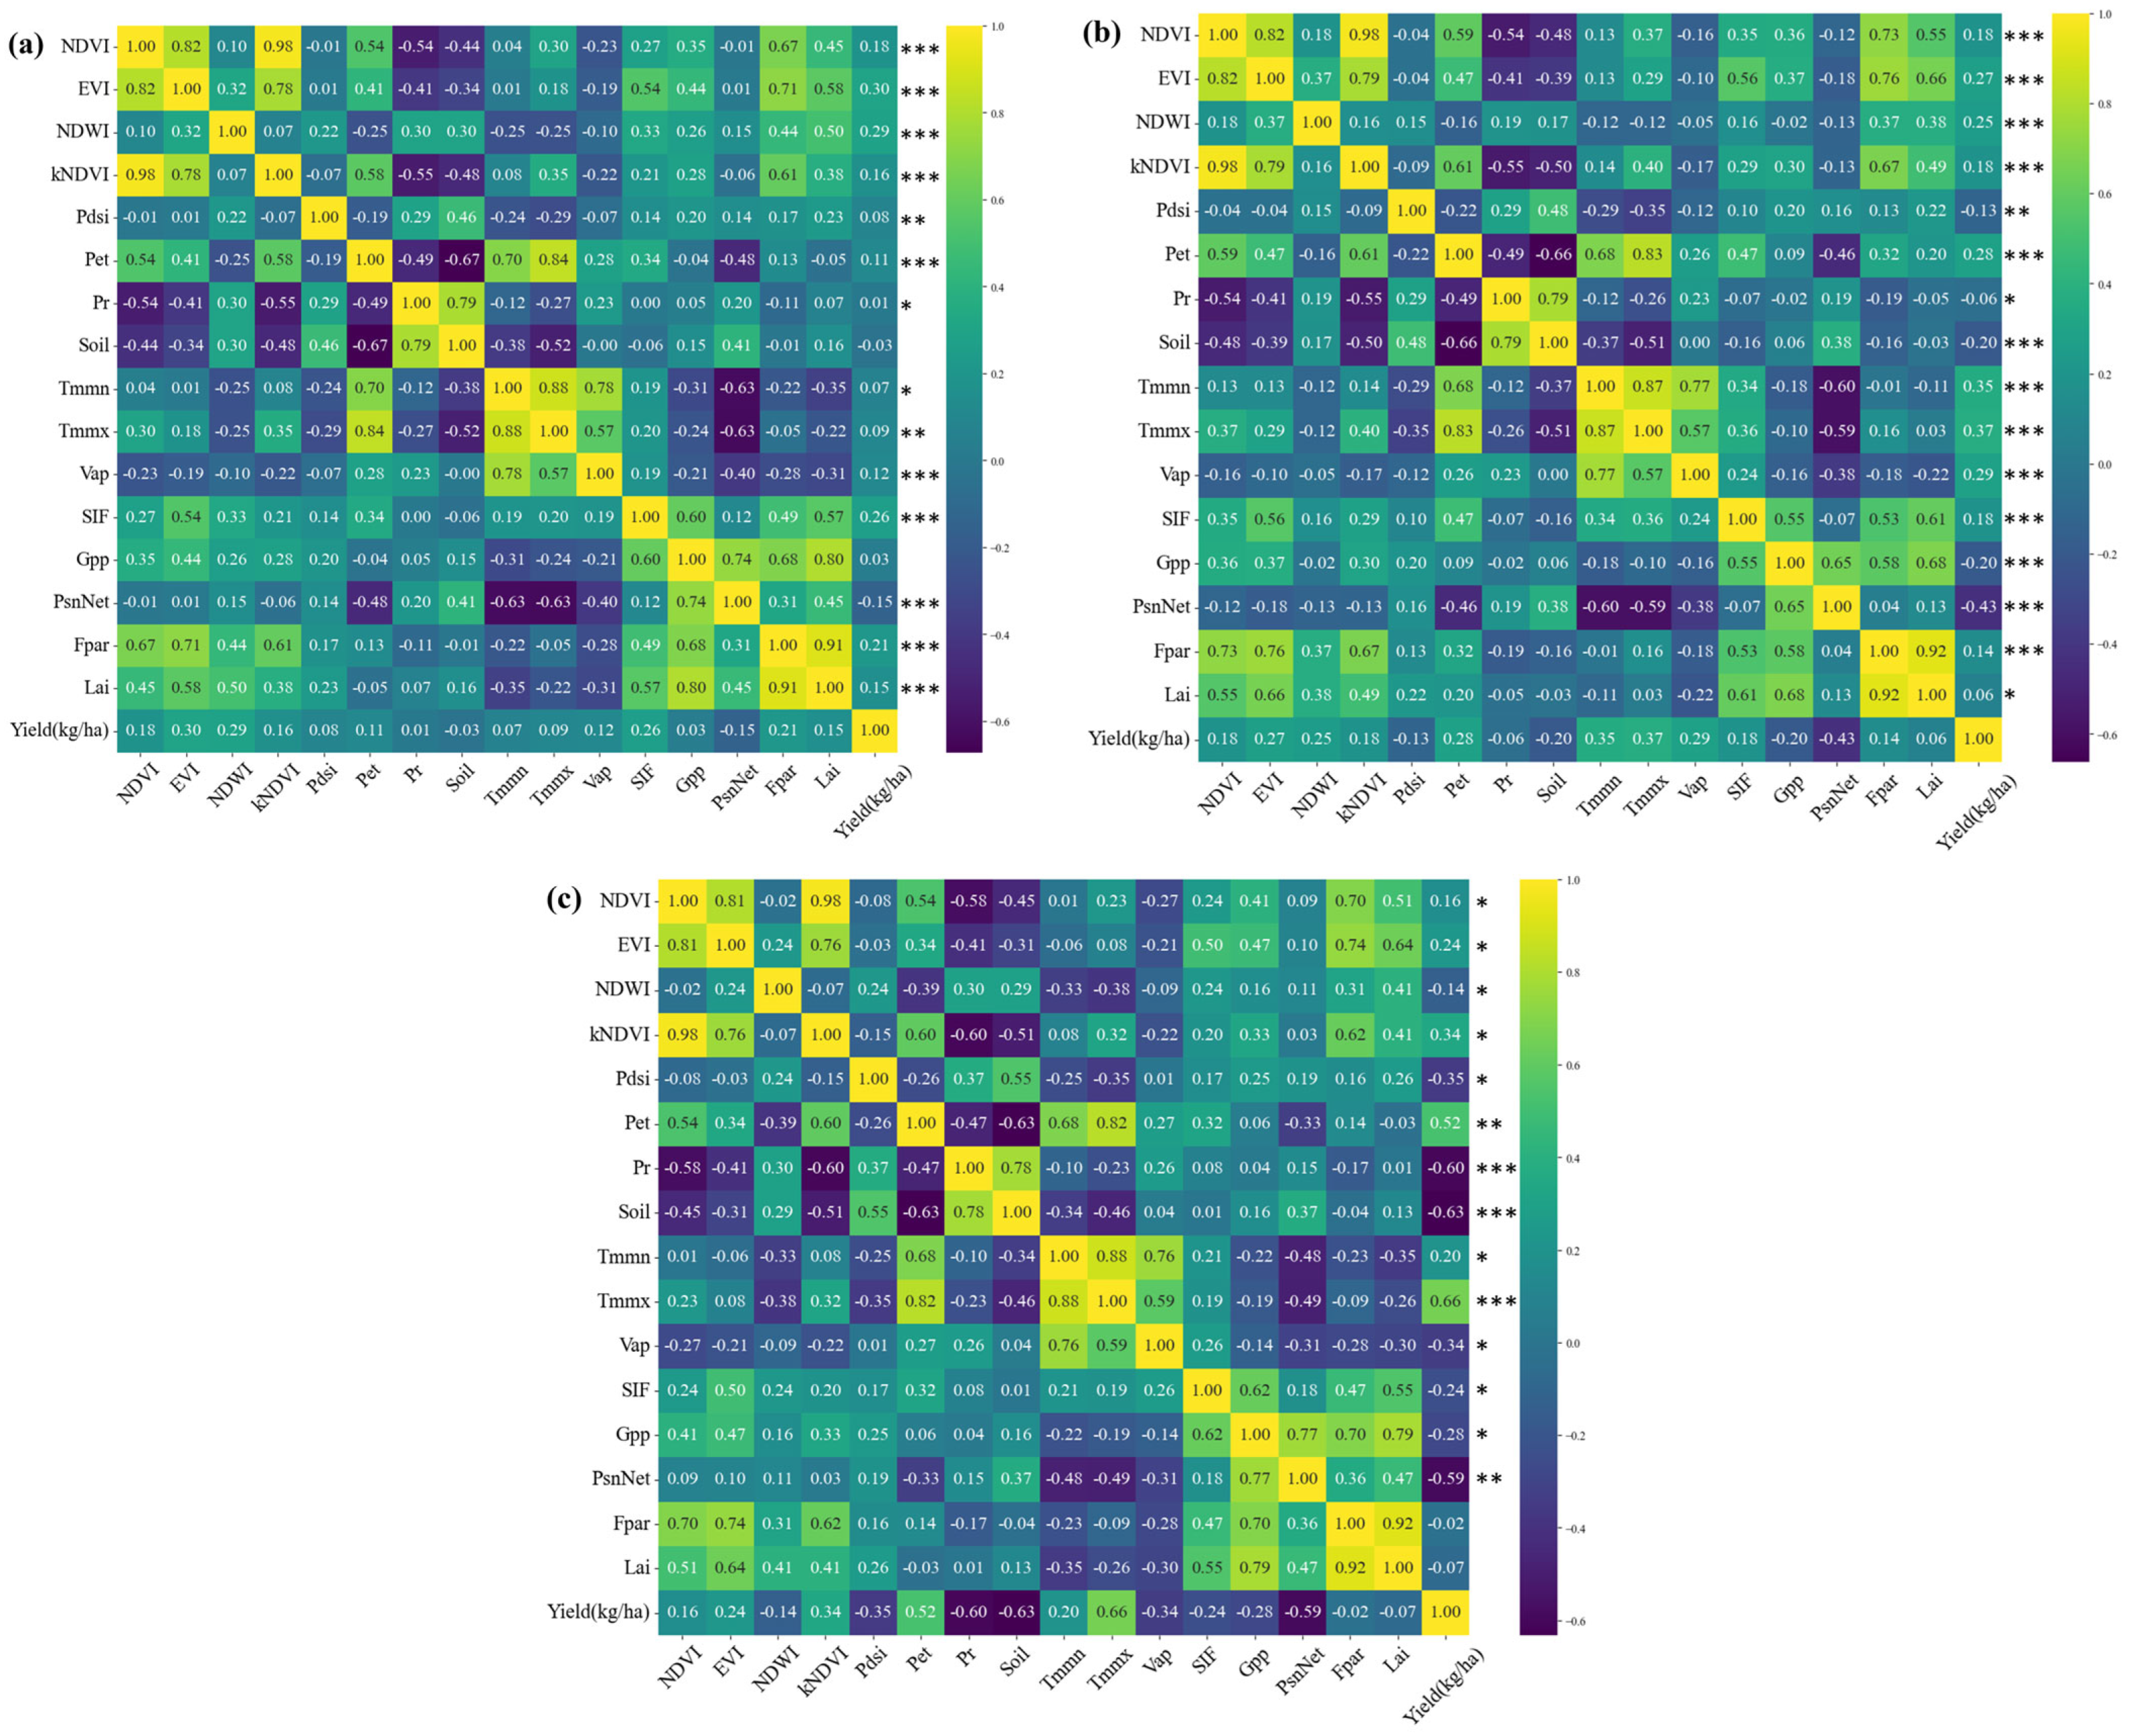
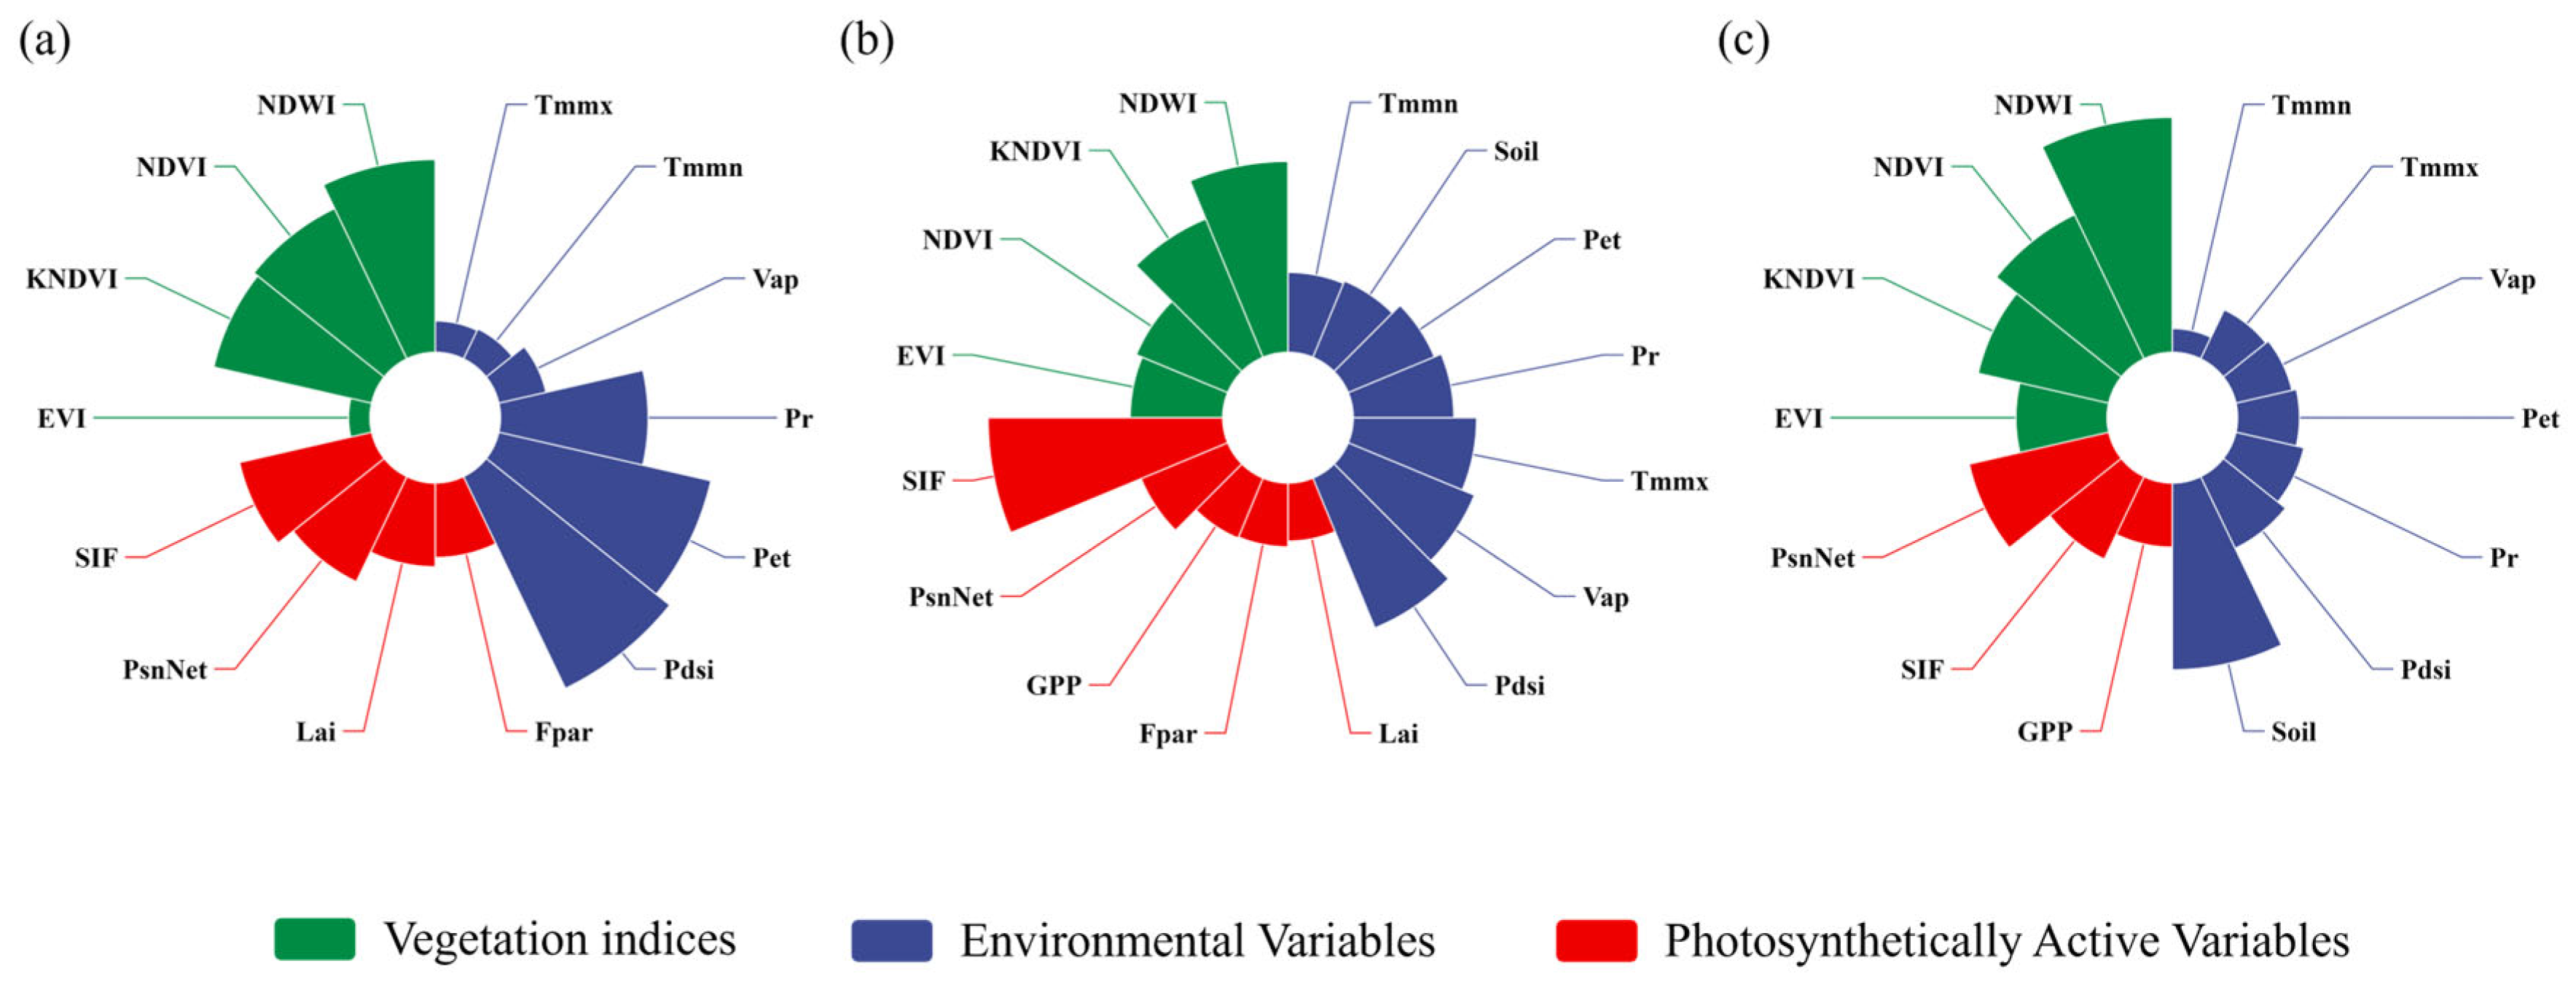
3.1. Input Variable Selection for Different Crops

In our study, we aimed to predict the yields of three major crops—maize, rice, and, soybean—using a combination of vegetation indices, environmental variables, and photosynthetically active variables. The selection of input variables for each crop was informed by an exploratory data analysis, revealing that different combinations of variables have varying impacts on the yield of each crop type.
In the process of selecting input variables for predicting maize yield, our exploratory data analysis yielded informative patterns (Figure 4a). The variables NDVI, EVI, NDWI, and kNDVI were chosen due to their recognized relationships with vegetative health and productivity. Although Soil moisture and GPP did not show statistically significant correlations, and thus were excluded, the remaining environmental and vegetative indices are anticipated to provide a robust framework for our predictive models. Particularly, EVI and NDWI, which are sensitive to canopy structure and water content, respectively, have been included given their strong relevance to crop health and development. Likewise, the thermal condition indicators Tmmn and Tmmx, along with atmospheric humidity as reflected by Vap, were also selected for their potential roles in influencing the phenological stages and water balance, which are vital for crop growth. Furthermore, the inclusion of Solar-Induced Fluorescence (SIF) aims to capitalize on its moderate relationship with yield, which may encapsulate the efficiency of photosynthesis and its direct link to biomass accumulation. Together, these variables constitute a comprehensive set that encompasses the key biophysical and environmental factors likely to influence maize yield. We ultimately selected 14 features and used 3570 maize yield data points for training and testing.
In the development of our rice yield prediction model, we have adopted a comprehensive approach, incorporating a wide spectrum of variables to reflect the multifaceted nature of rice yield determinants (Figure 4b). Recognizing that yield results from an intricate web of influences, we have selected variables known for their critical impact on crop performance. Key Vegetation Indices—NDVI, EVI, NDWI, and kNDVI—are included for their robust associations with vegetative health and canopy robustness. These indices are essential, offering refined perspectives on the rice plant’s vitality and are expected to correlate strongly with yield variability. To address the thermosensitivity of rice, we have integrated thermal variables, including Tmmn and Tmmx, which monitor the temperature extremes. Coupled with Pet, these variables align with the key thermal growth stages and water-use patterns of rice, underpinning the criticality of water management and climatic conditions in rice farming. Reflecting the pivotal role of photosynthesis in crop productivity, SIF stands as an indicator of photosynthetic activity, thereby providing a direct linkage to biomass accumulation. This is complemented by Gpp and PsnNet, which measure the gross and net rates of photosynthesis, respectively, shedding light on the carbon dynamics within the rice plants. The Fpar variable, a measure of the fraction of absorbed photosynthetically active radiation, is included for its ability to estimate photosynthetic efficiency and potential growth. Likewise, Lai is incorporated to quantify the canopy structure, serving as a proxy for biomass and developmental progress. Pr and Pdsi are selected to account for the nuanced effects of water availability and moisture stress, recognizing the deep-seated relationship between water dynamics and rice yield. Similarly, Vap is included to capture the influence of atmospheric humidity on plant transpiration and the resulting implications for crop stress and water balance. By assembling this broad array of predictive variables, our model is geared to robustly predict rice yields, embracing the complex dynamics of rice cultivation. This integrated approach ensures that no critical aspect influencing yield is overlooked, thereby enhancing our model’s capacity to depict the true variance in rice yield across diverse environmental conditions. We ultimately selected 16 features and used 3276 rice yield data points for training and testing.
In forming our soybean yield prediction model, we have taken a selective approach, integrating a variety of variables known to influence yield through different pathways (Figure 4c). Vegetation indices, including NDVI, EVI, NDWI, and kNDVI, were chosen for their direct measures of plant health and vigor, critical for capturing the vitality and greenness of the soybean canopy. The environmental variable Pdsi, along with Tmmn and Vap, was also included to reflect the climatic and moisture conditions pivotal to soybean’s growth stages. Pdsi is particularly relevant for understanding the water stress status, while Tmmn is essential for capturing the cooler end of the temperature range that can influence plant development. Vap, which gauges atmospheric humidity, is integral for accounting for transpiration and the potential water stress in soybean fields. SIF and Gpp were selected for their capacity to reflect the efficiency of photosynthesis, an important indicator of crop health and potential yield. Their measurements serve as proxies for the energy conversion process in soybeans, linking the capture of sunlight to the production of biomass. Among the environmental variables, Pet stands out for indicating the potential evapotranspiration, crucial for water management and stress evaluation in soybean cultivation. It is vital for understanding the water demand and use efficiency of the crop throughout its life cycle. Our model also considers the critical influence of temperature and moisture variables. Tmmx is included for its representation of the upper thermal conditions soybeans experience, which are as essential as the minimum temperatures for physiological processes like flowering and grain filling. While Fpar and Lai are valuable measures related to the crop’s ability to utilize sunlight and its leaf area extent, we chose not to include them in the predictive model. This decision was made to avoid redundancy and ensure that the included variables offer distinct, unambiguous contributions to predicting yield. The integration of these variables into the predictive framework for soybean yield allows us to capture a comprehensive picture of the growth environment and the crop’s response to it. By carefully selecting these factors, we aim to develop a robust model that encapsulates the complex dynamics involved in soybean production. We ultimately selected 14 features and used 5544 soybean yield data points for training and testing.
Following the initial selection of predictive variables, our VIF analysis has identified multicollinearity among the four vegetation indices—NDVI, EVI, NDWI, and kNDVI—across the crops of interest: maize, soybean, and rice. While multicollinearity can often be a concern in predictive modeling, it also reflects the interconnected nature of these indices as indicators of vegetative health. In response, we intend to use all of these indices collectively in various models to capture the full spectrum of vegetative information. Furthermore, we plan to explore the individual contributions of NDVI, EVI, NDWI, and kNDVI in subsequent analyses. Each index will be separately paired with environmental and photosynthetic variables, applying the model that emerges as the most effective. This two-pronged approach is designed to elucidate the distinct impact each vegetative index has on yield prediction when isolated and to understand how they contribute within a comprehensive model that includes a wider range of crop performance predictors.

3.2. Multi-Model Yield Prediction for Diverse Crops

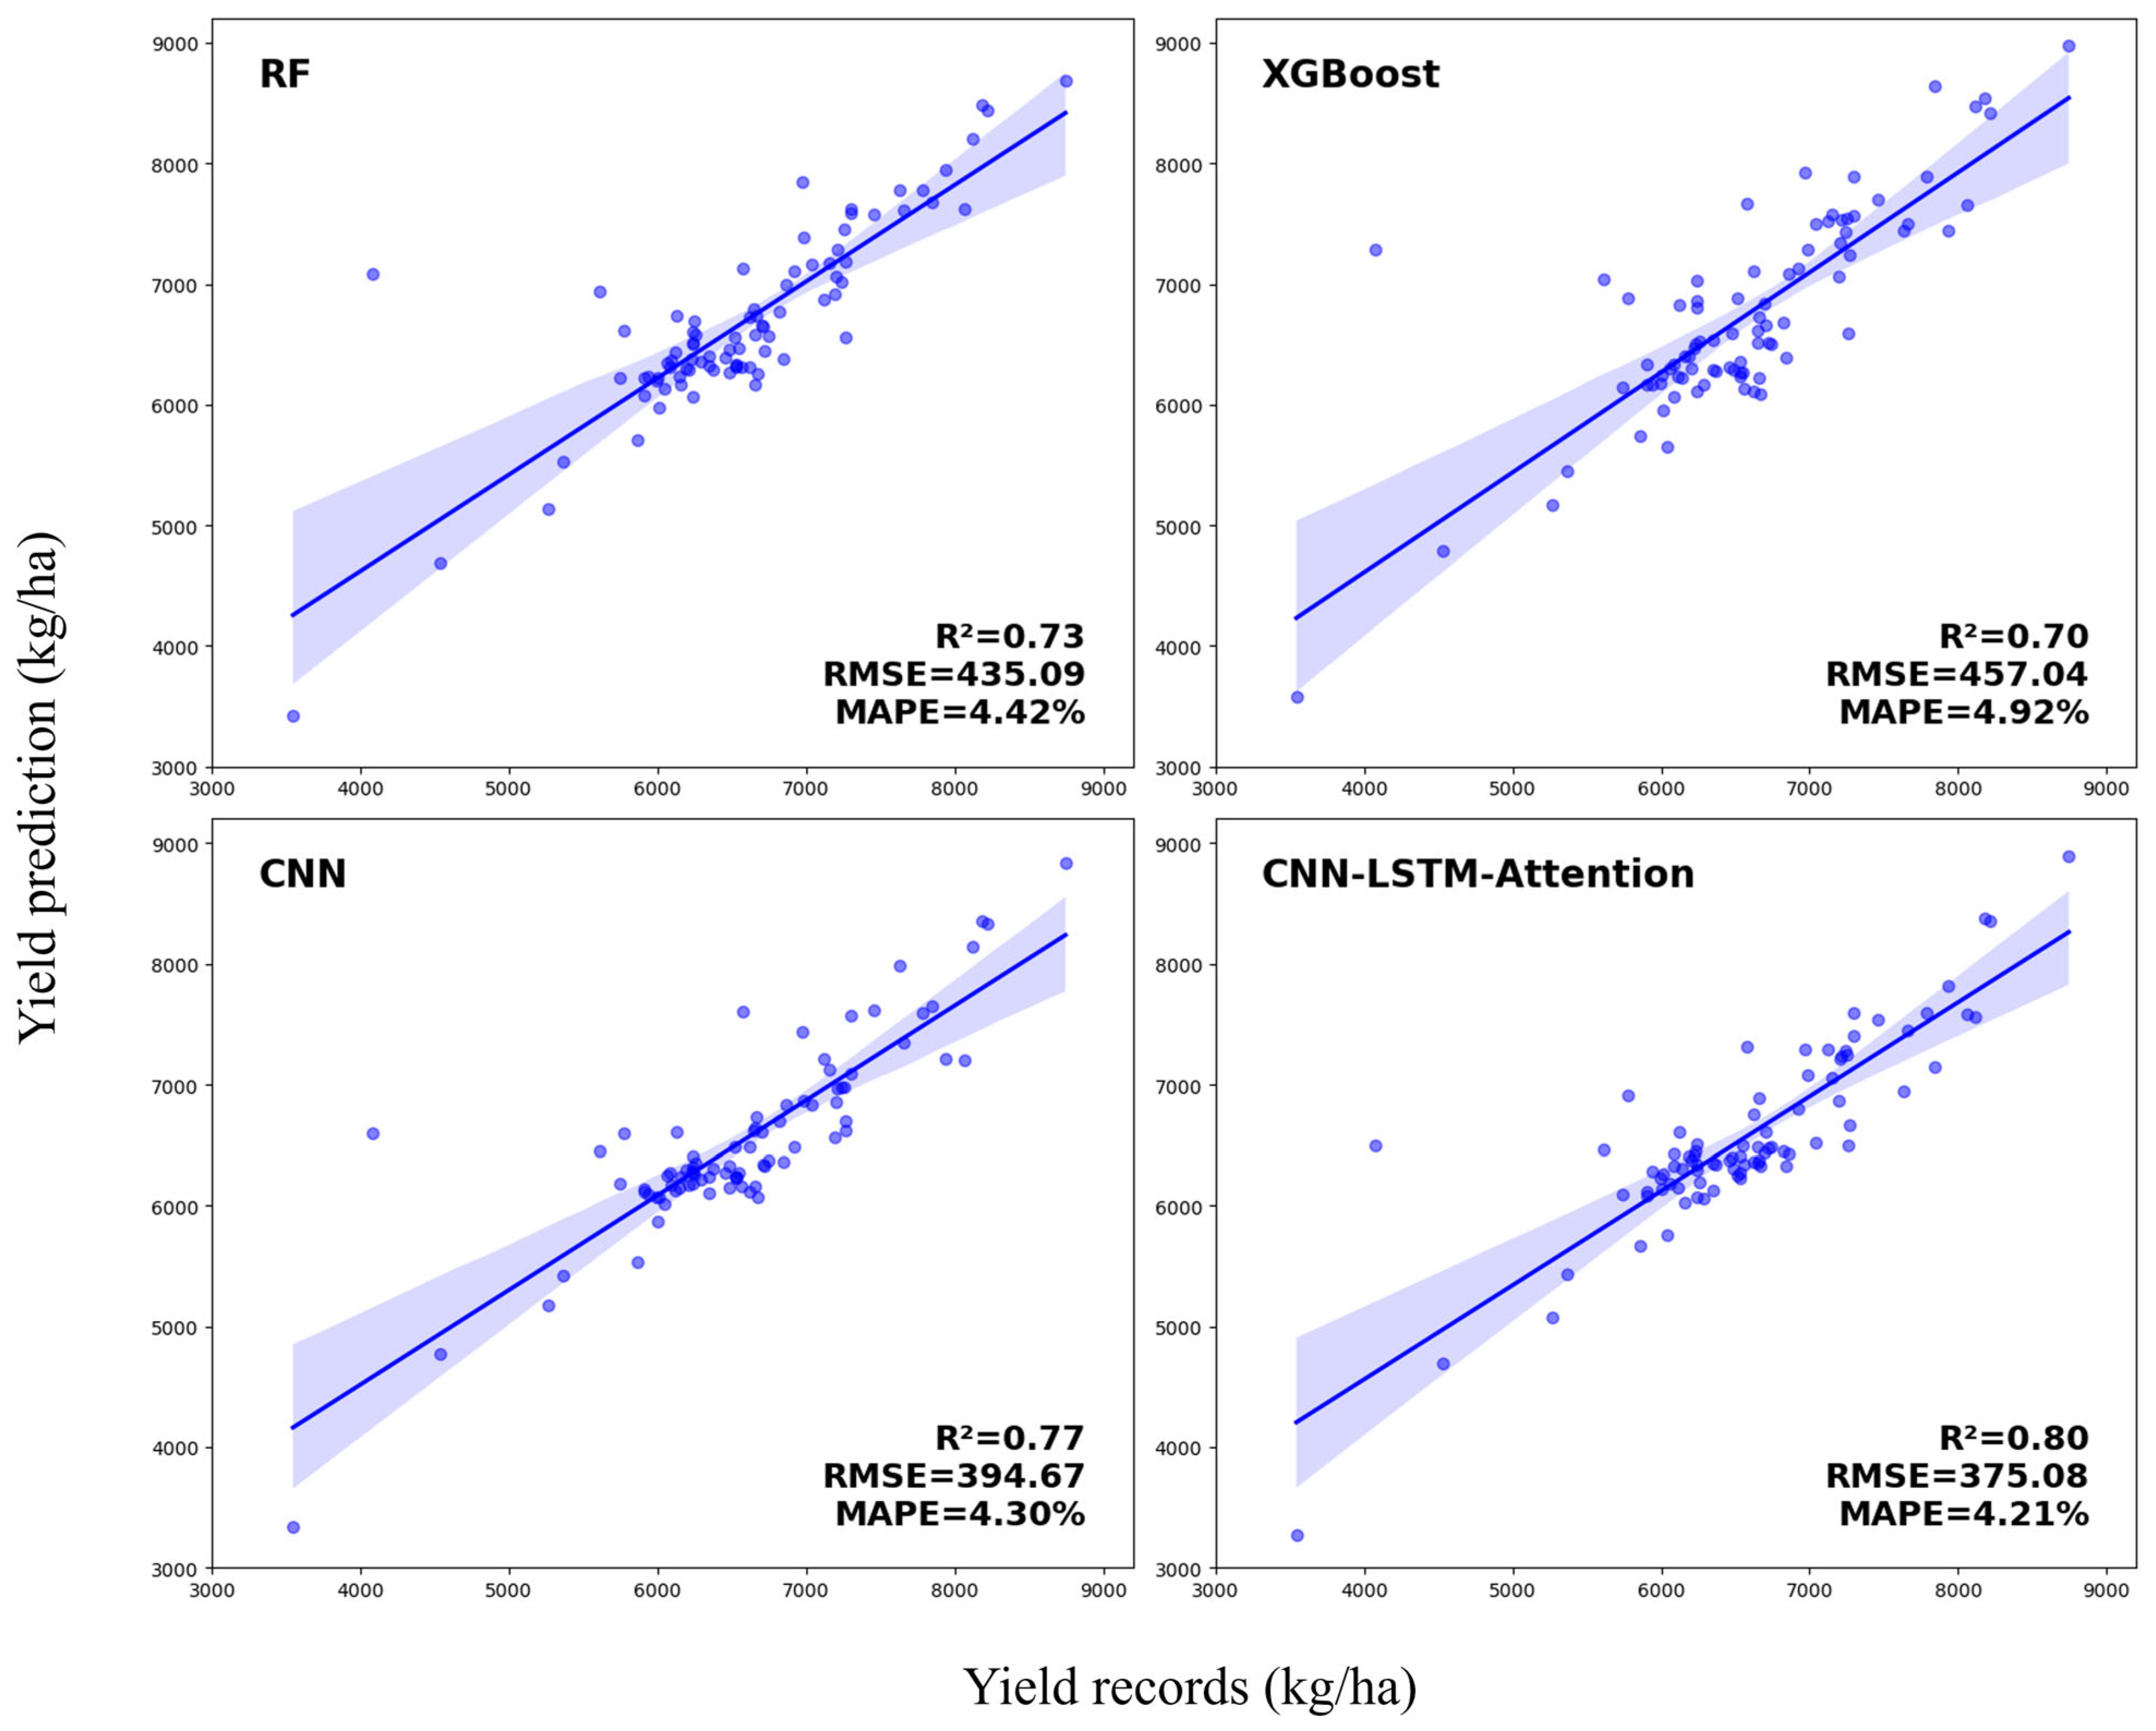
3.2.1. Comparative Yield Prediction Models for Maize

In the quest to enhance the accuracy of crop yield predictions, we deployed and compared several machine-learning models: RF, XGBoost, CNN, and CNN-LSTM-Attention. Each model was trained and tested using a comprehensive dataset incorporating vegetation indices, environmental variables, and photosynthetically active variables. The performance metrics for each model on both the training and testing datasets are summarized in Table 4.
For maize, Figure 5 visually demonstrates the correlation between the observed and predicted yields across models. The RF model, an ensemble-learning approach using a multitude of decision trees, registered an R2 of 0.73. However, the RMSE value of 435.09 kg/ha signifies an appreciable error margin, and the resultant MAPE of 4.42% denotes the average deviation of the predicted yield from the actual values. The XGBoost model, utilizing a gradient-boosting framework, showed a marginally decreased R2 of 0.70, reflecting a slightly lower performance in the yield variance explanation compared to RF. The increase in RMSE to 457.04 kg/ha indicates a reduction in prediction precision. An MAPE of 4.92% further illustrates the comparative limitation of this model in terms of prediction accuracy. The CNN model marked a significant shift towards deep-learning approaches, garnering an R2 of 0.77. This model achieved an RMSE of 394.67 kg/ha, denoting a substantial improvement over the traditional machine-learning techniques. The MAPE of 4.30% further underscored the CNN’s superior predictive accuracy. Our novel CNN-LSTM-Attention model integrates the spatial feature extraction capabilities of CNNs with the temporal processing power of LSTM networks, further refined by an attention mechanism. This ensemble yielded the highest R2 of 0.80, an RMSE of 375.08 kg/ha, and the lowest MAPE of 4.21%, underscoring its exceptional ability to predict maize yield with considerable precision and minimal error. The CNN-LSTM-Attention model’s tighter and more aligned data points along the line of best fit indicate its superior performance in understanding and predicting the complex patterns of maize yield in Northeast China. The blue shaded areas represent confidence intervals, which are notably narrower for the CNN-LSTM-Attention model, emphasizing the model’s consistency and reliability in yield prediction.

3.2.2. Comparative Yield Prediction Models for Rice

For rice (Figure 6), the RF model exhibited an R2 of 0.62, with an RMSE of 658.52 kg/ha and an MAPE of 6.38%. While demonstrating a moderate understanding of yield variance, there remains room for enhancement in precision. In contrast, the XGBoost model improved the R2 to 0.67 and reduced the RMSE to 612.10 kg/ha. The MAPE concurrently decreased to 6.12%, indicating a trend towards enhanced prediction accuracy. Progressing to the CNN model, a notable uplift in model performance was observed. An R2 of 0.70, coupled with an RMSE of 585.40 kg/ha and an MAPE of 5.59%, denotes a superior predictive capability, signifying the model’s efficacy in capturing complex data characteristics. The CNN-LSTM-Attention model demonstrated the highest predictive accuracy among the evaluated models. It achieved an R2 of 0.76, substantiating its robustness in explaining the yield variability. The model also recorded the lowest RMSE of 519.07 kg/ha and an MAPE of 4.67%, signifying the highest precision and lowest average error in yield predictions.

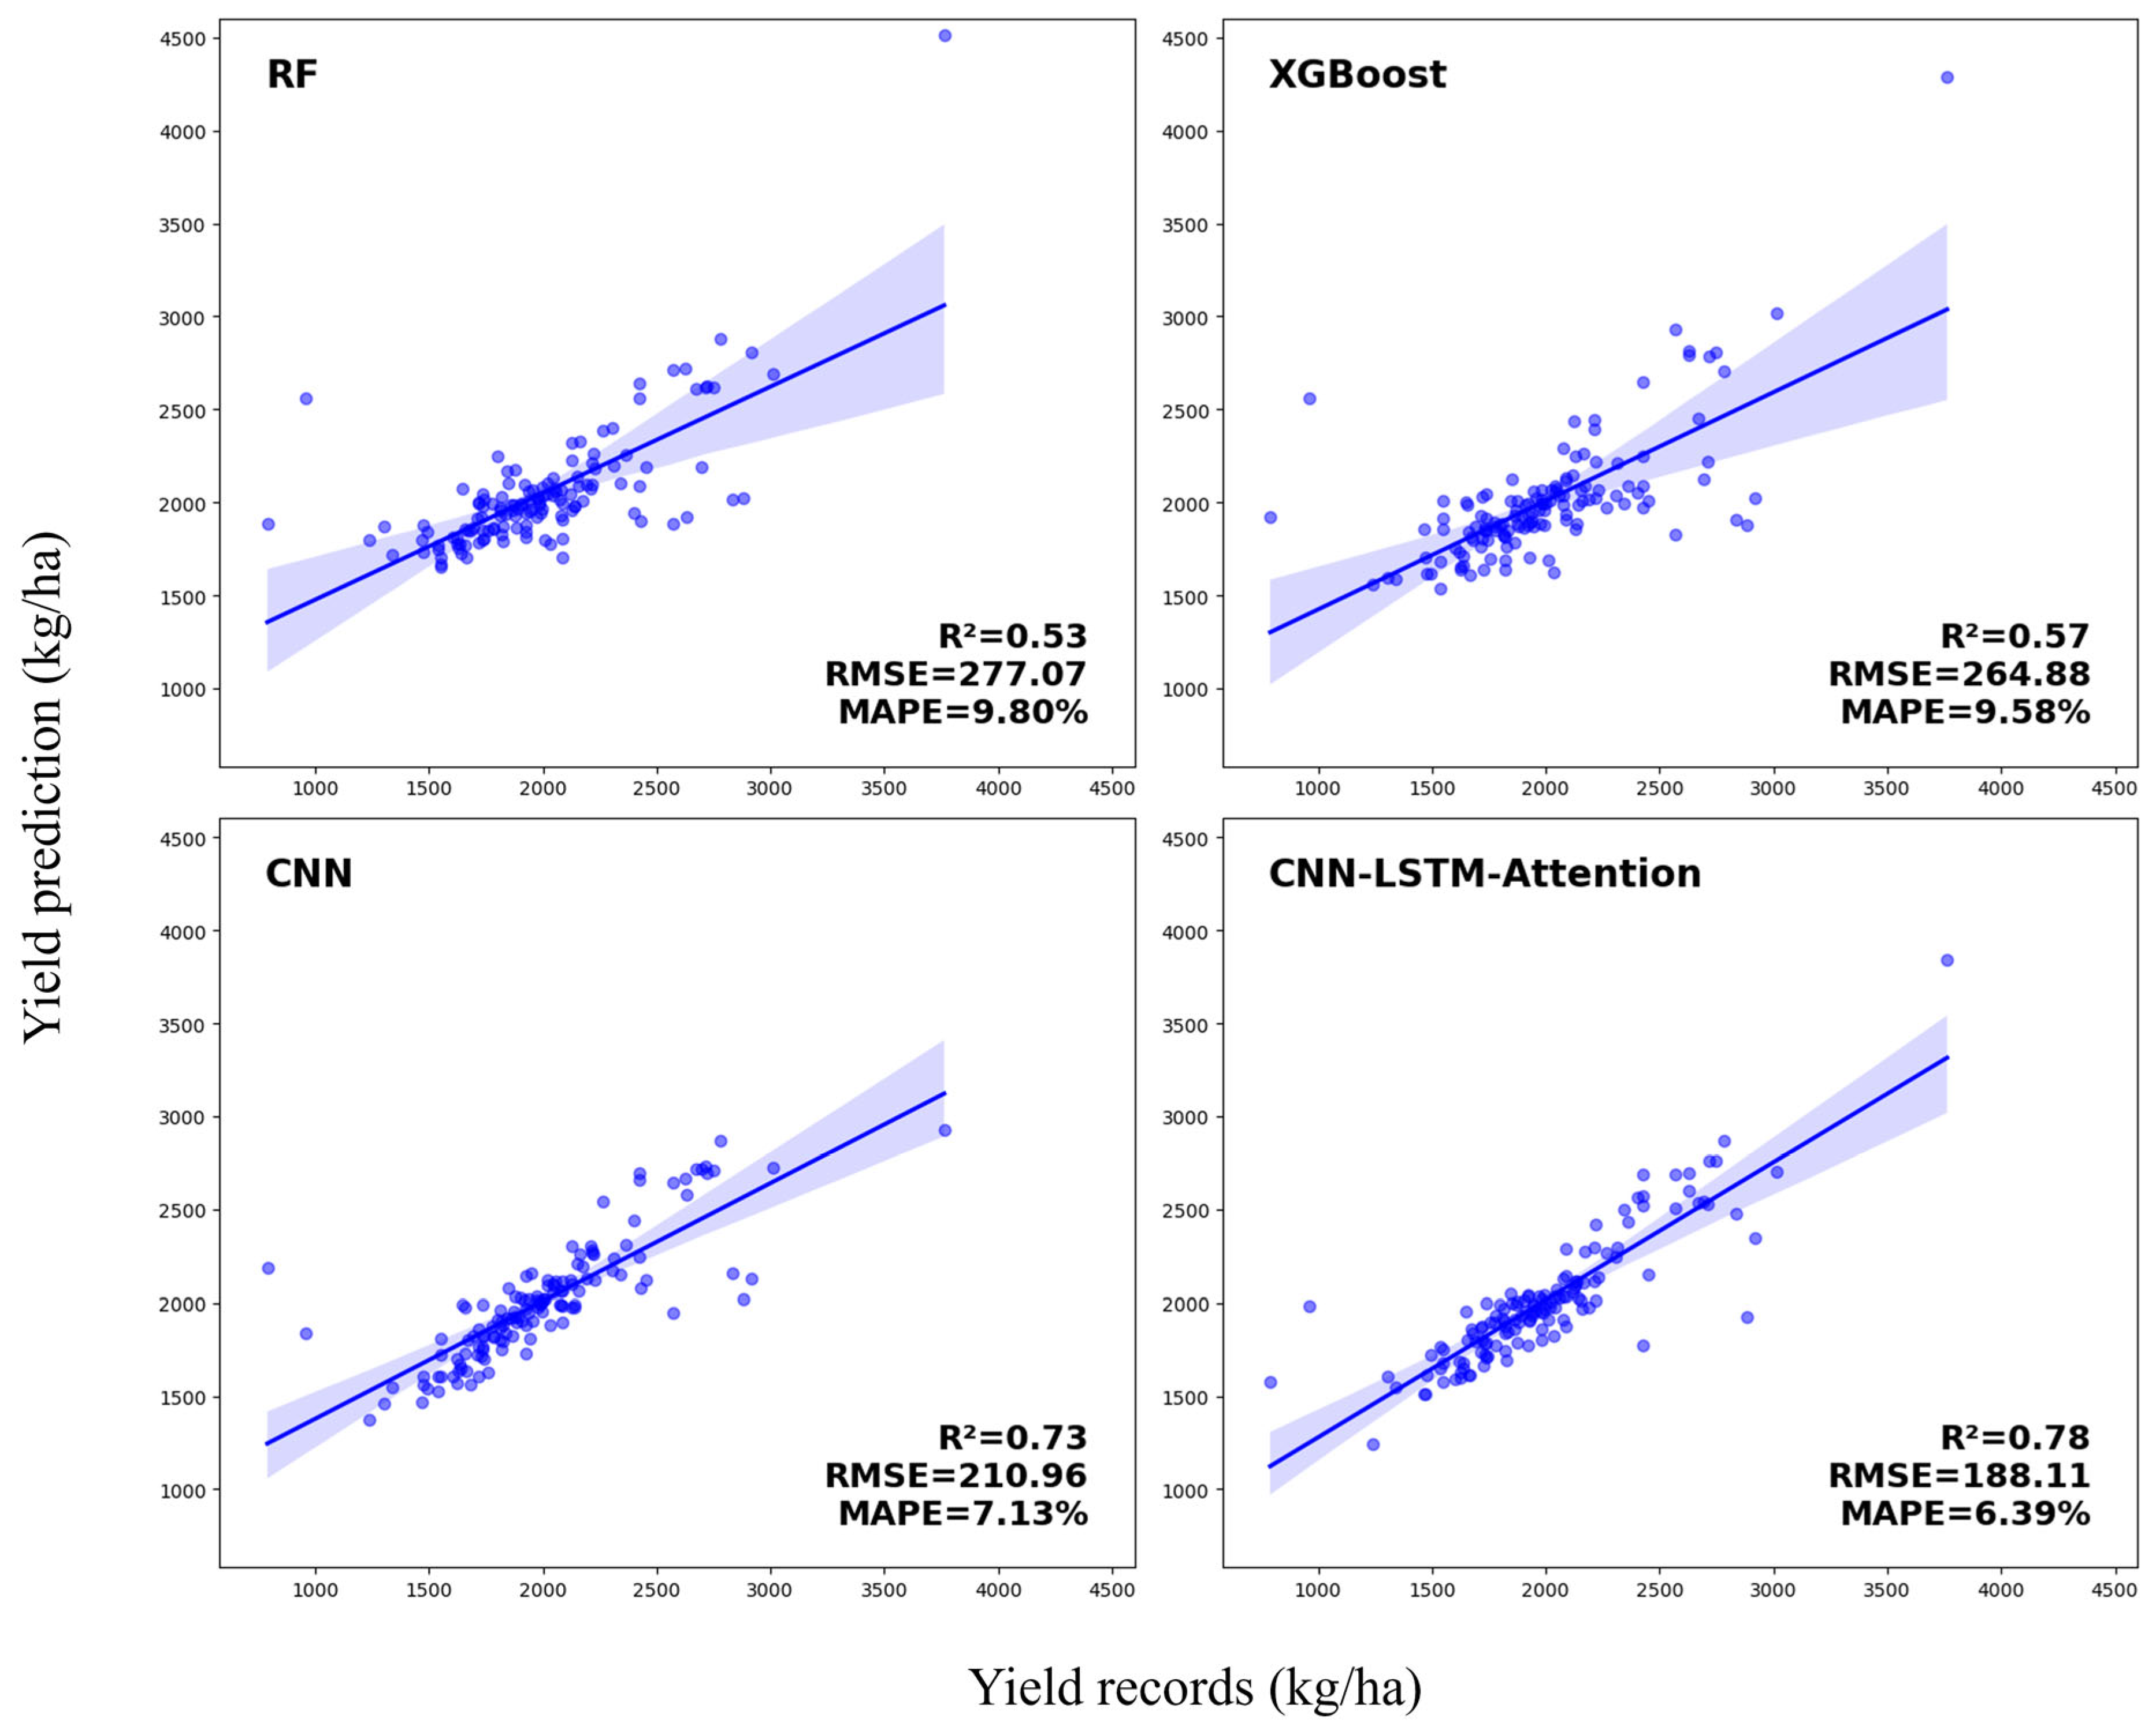
3.2.3. Comparative Yield Prediction Models for Soybean

The comparative performance of four analytical models was examined for their accuracy in predicting soybean yields (Figure 7). The RF model registered an R2 of 0.53, an RMSE of 277.07, and an MAPE of 9.80%, denoting a moderate explanatory power. The XGBoost model yielded a slightly enhanced performance with an R2 of 0.57, an RMSE of 264.88, and an MAPE of 9.58%, suggesting incremental improvements in yield prediction. A notable leap in precision was observed with the CNN model, which achieved an R2 of 0.73, an RMSE of 210.96, and an MAPE of 7.13%, reflecting its stronger predictive capabilities. The CNN-LSTM-Attention model emerged as the most accurate, evidenced by the highest R2 of 0.78, lowest RMSE of 188.11, and an MAPE of 6.39%, highlighting its advanced capacity for yield prediction. The findings clearly indicate the superior prediction accuracy of the CNN-LSTM-Attention model, suggesting its efficacy for enhanced yield prediction protocols in precision agriculture.

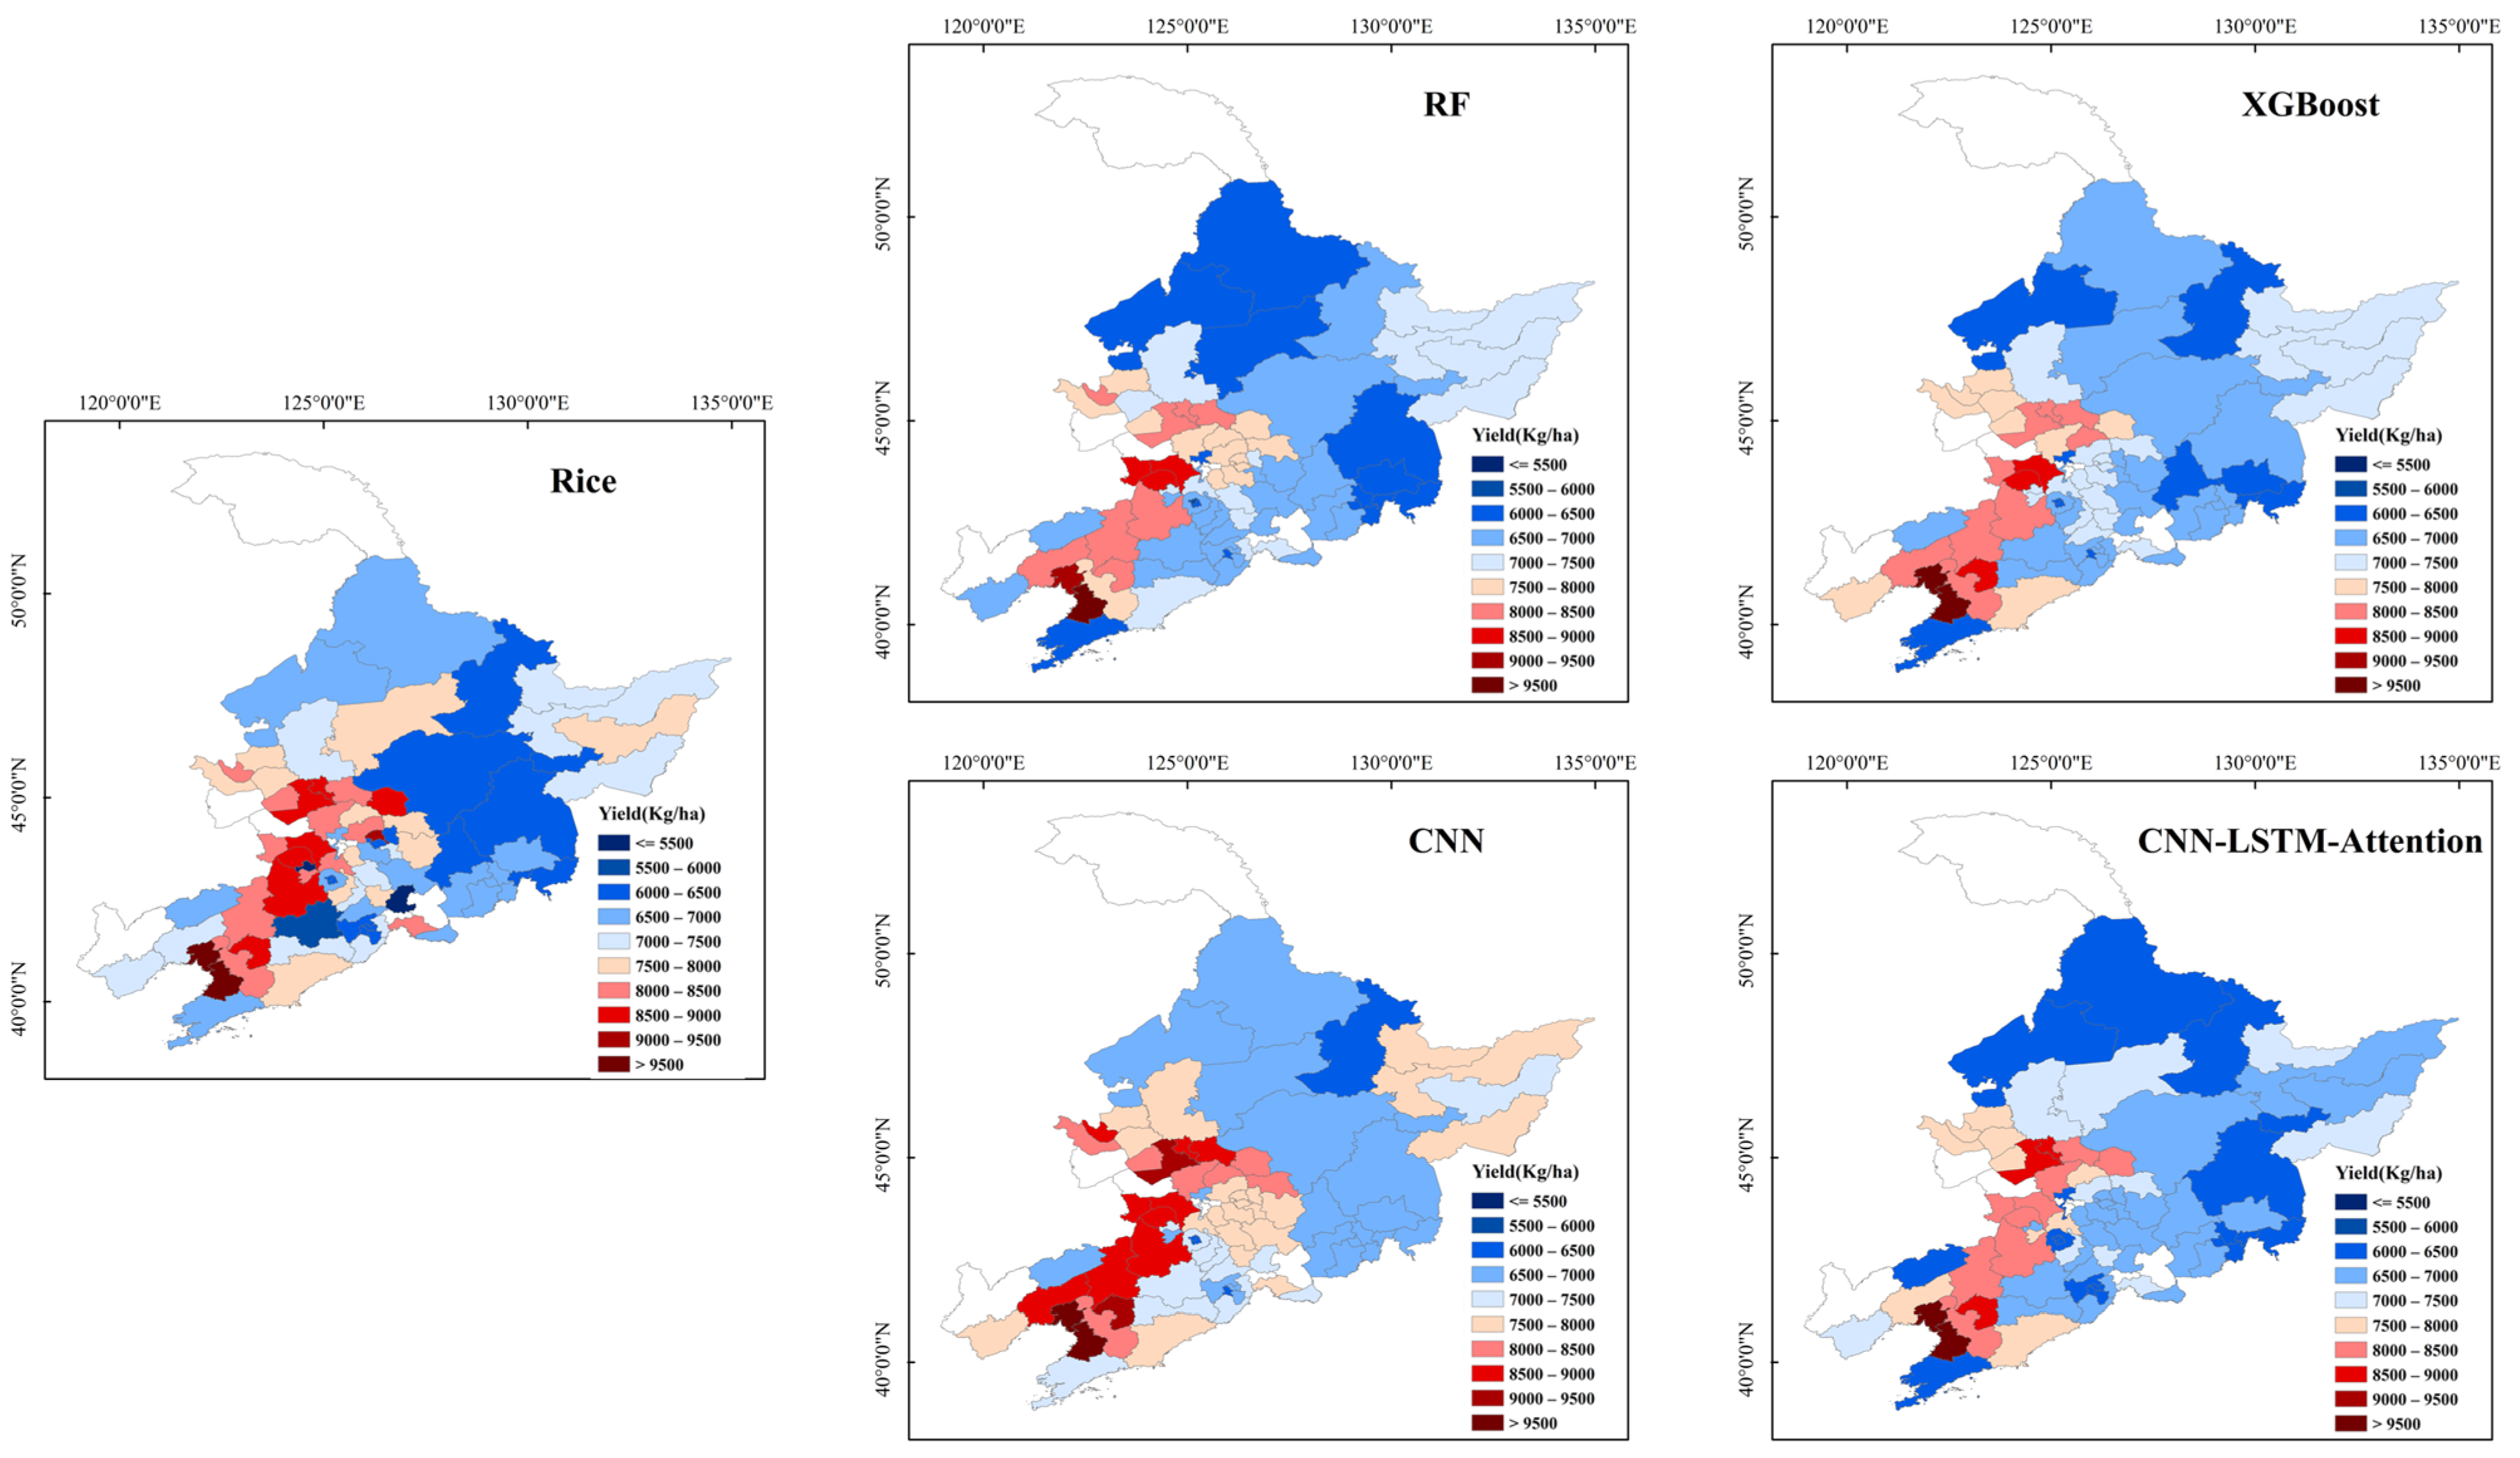
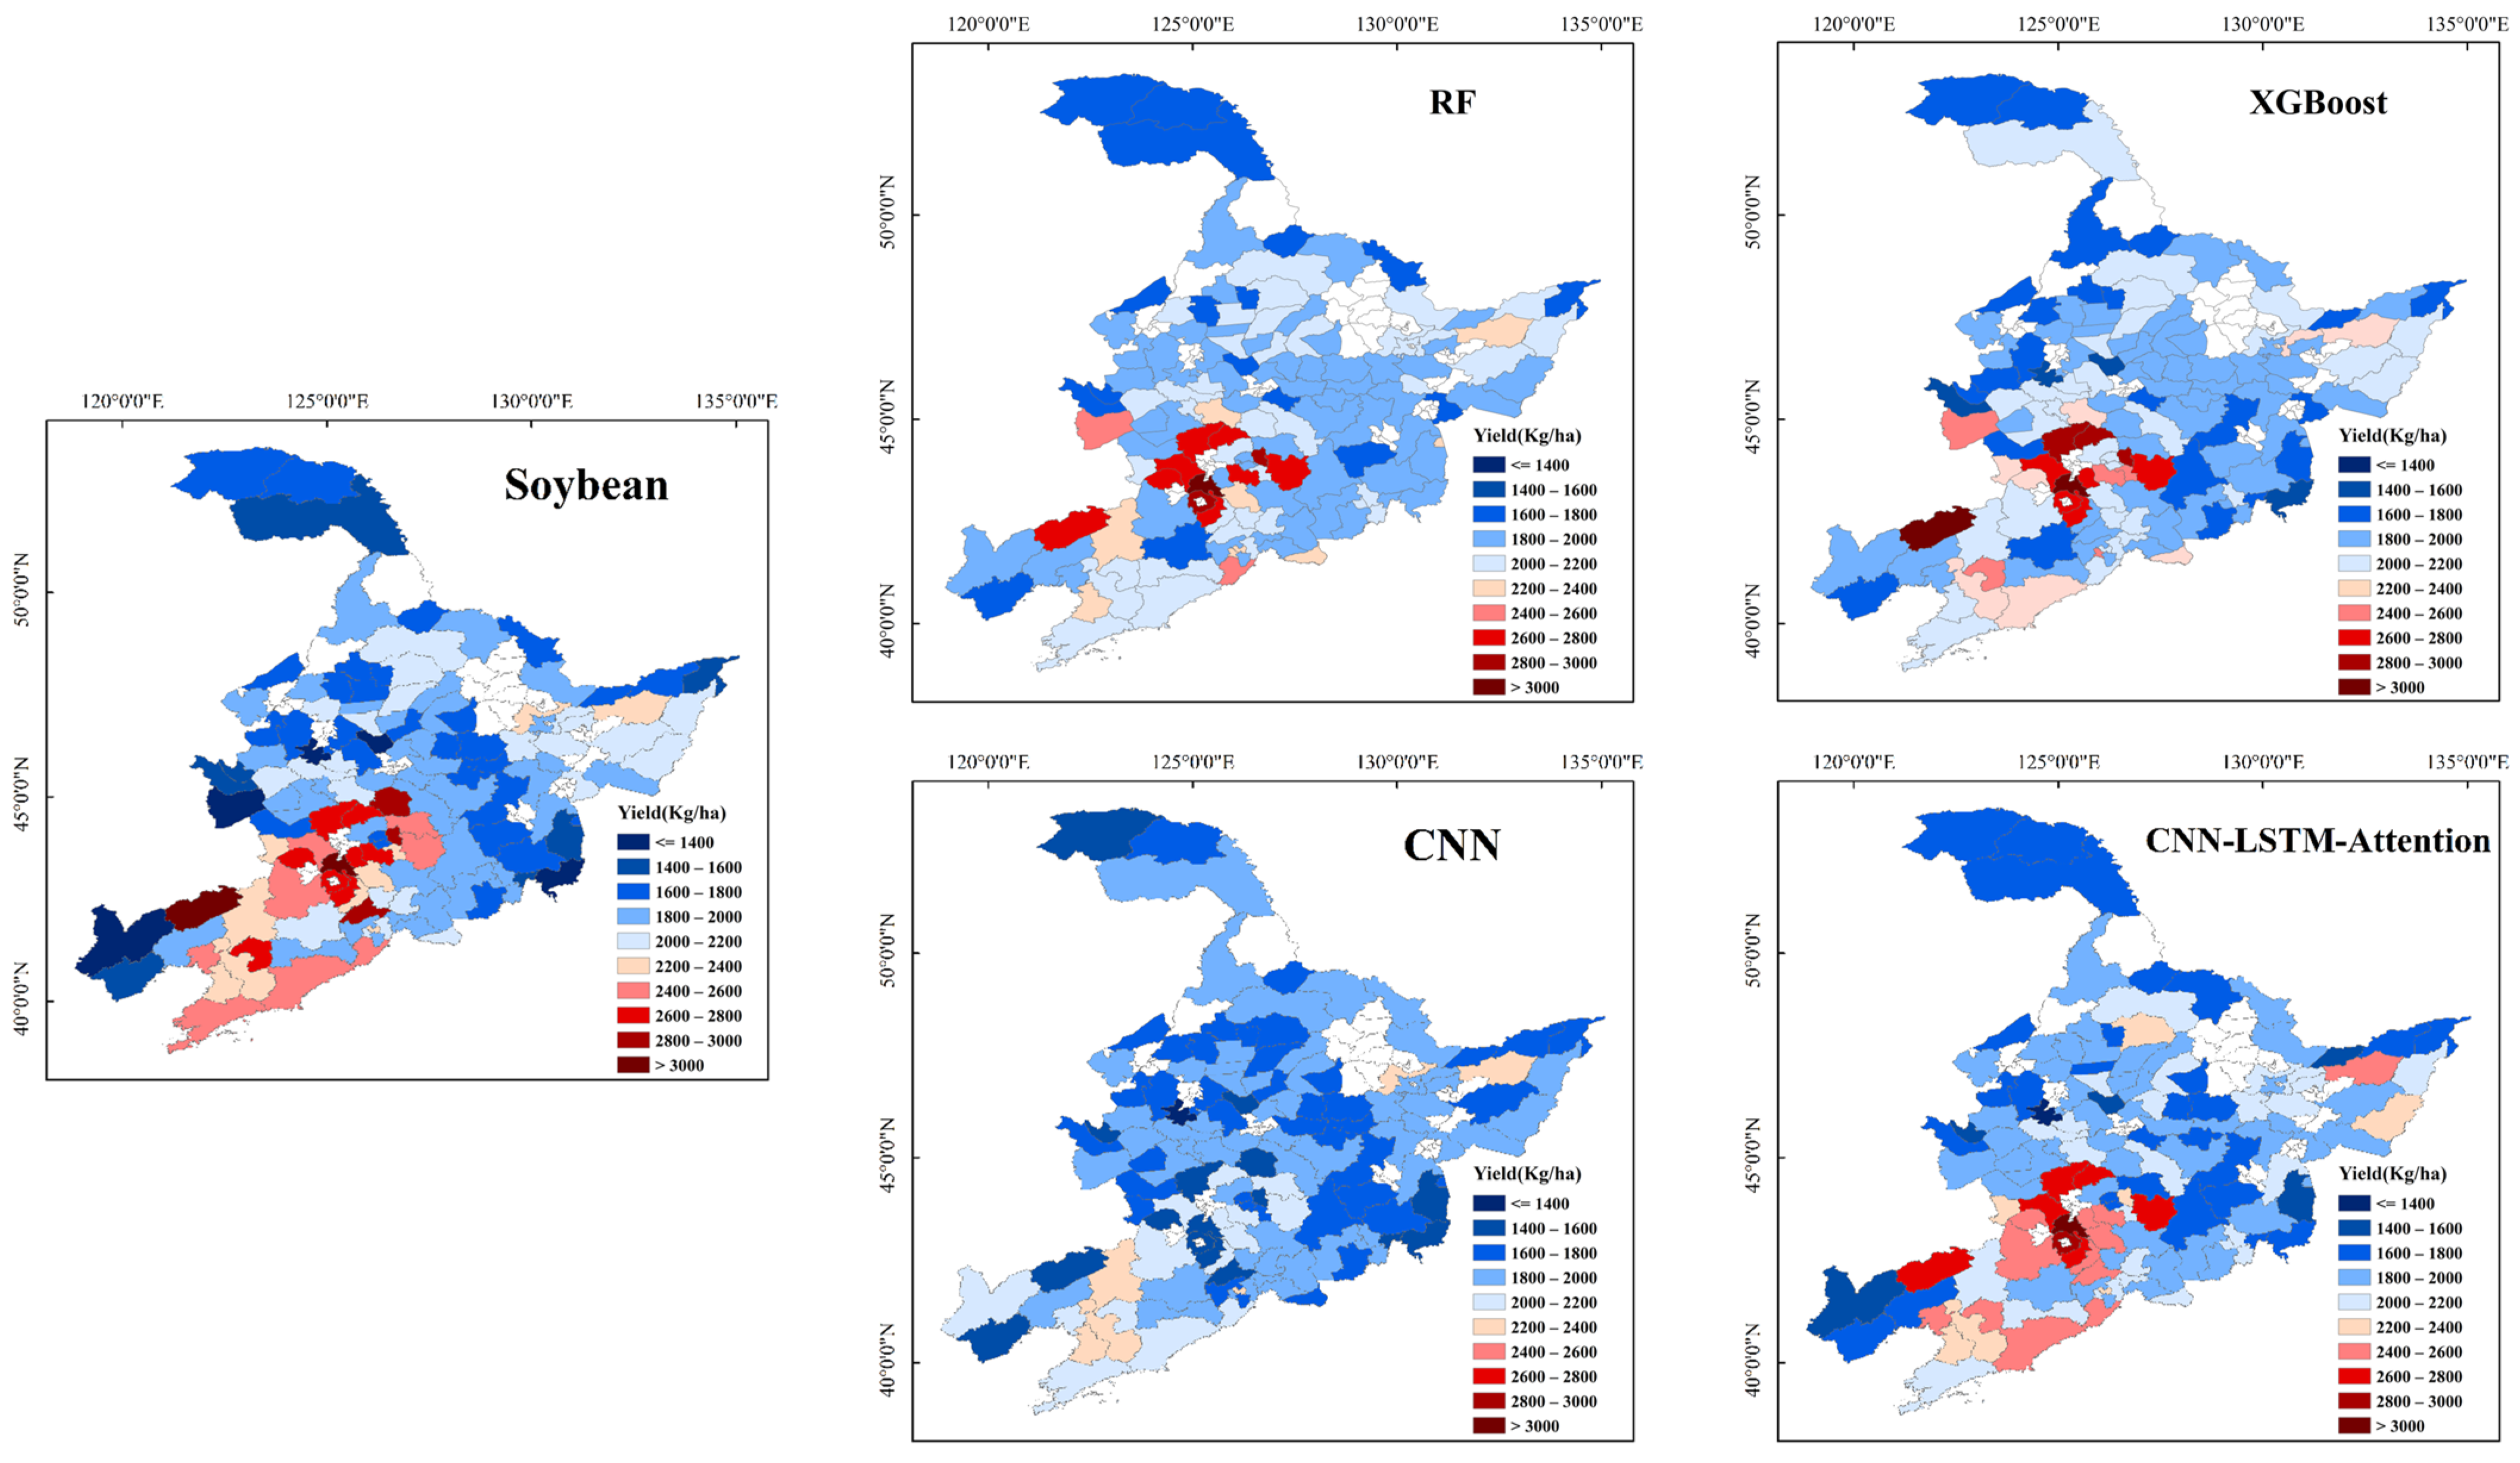
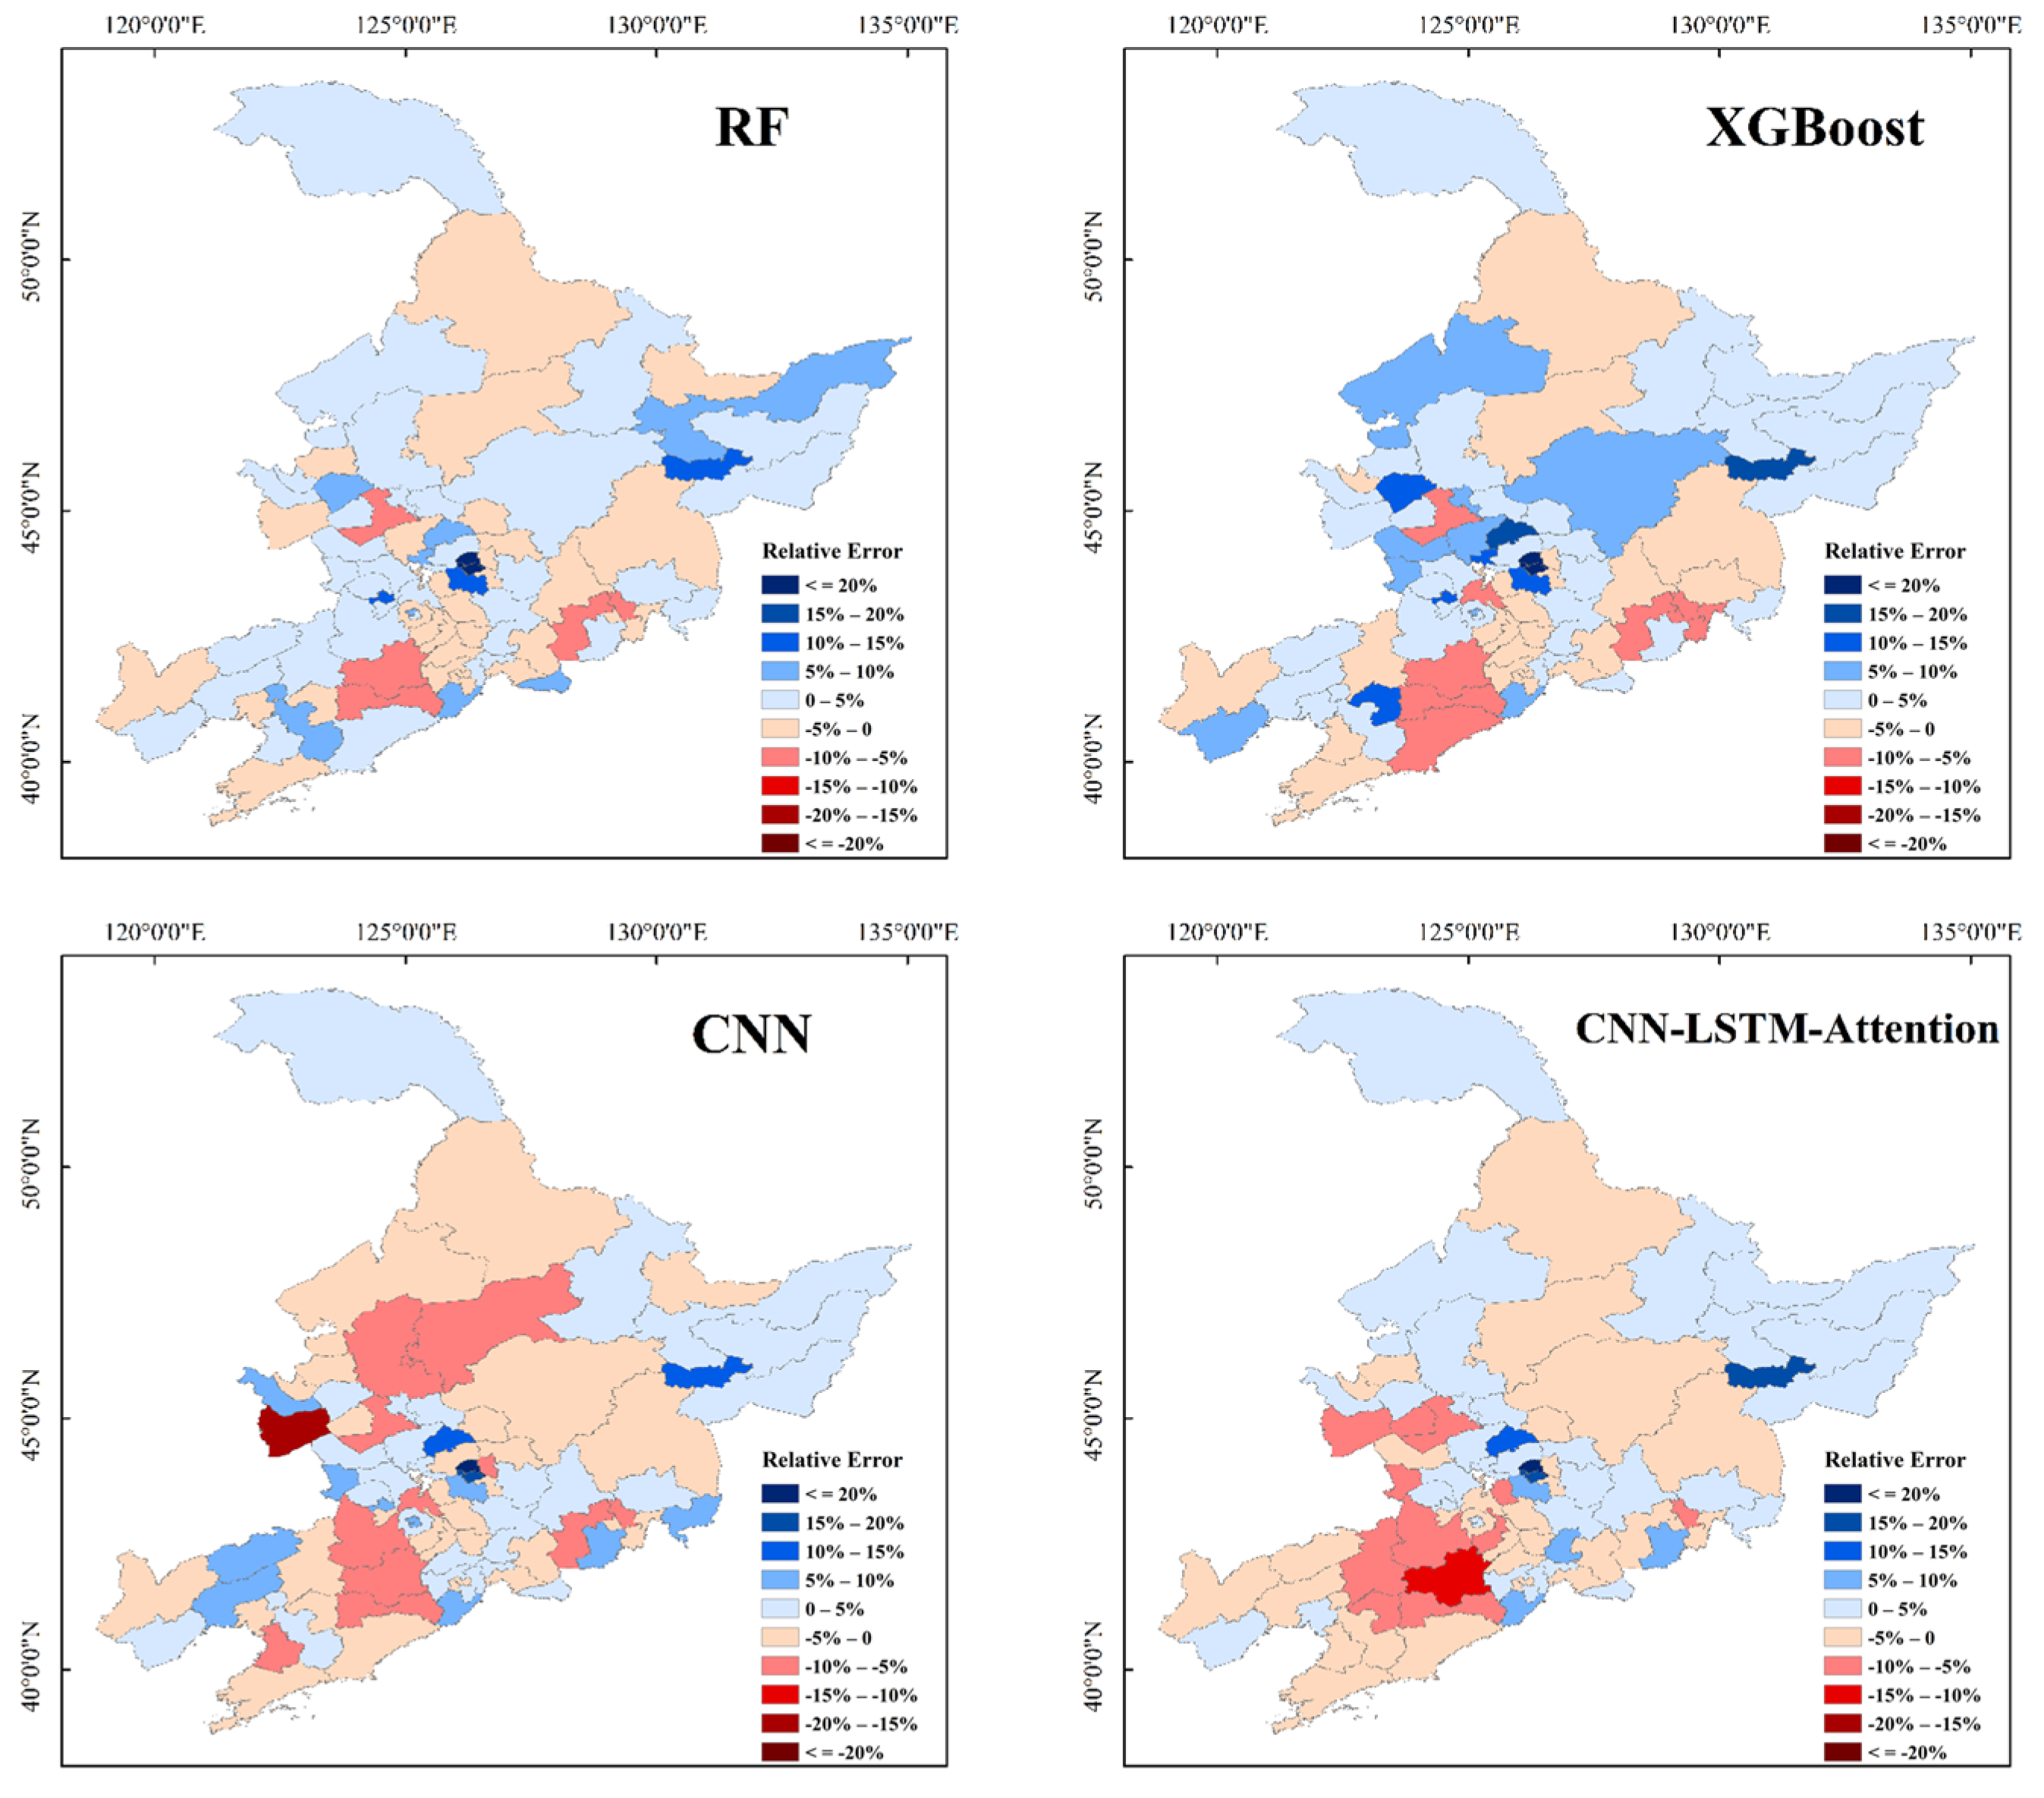
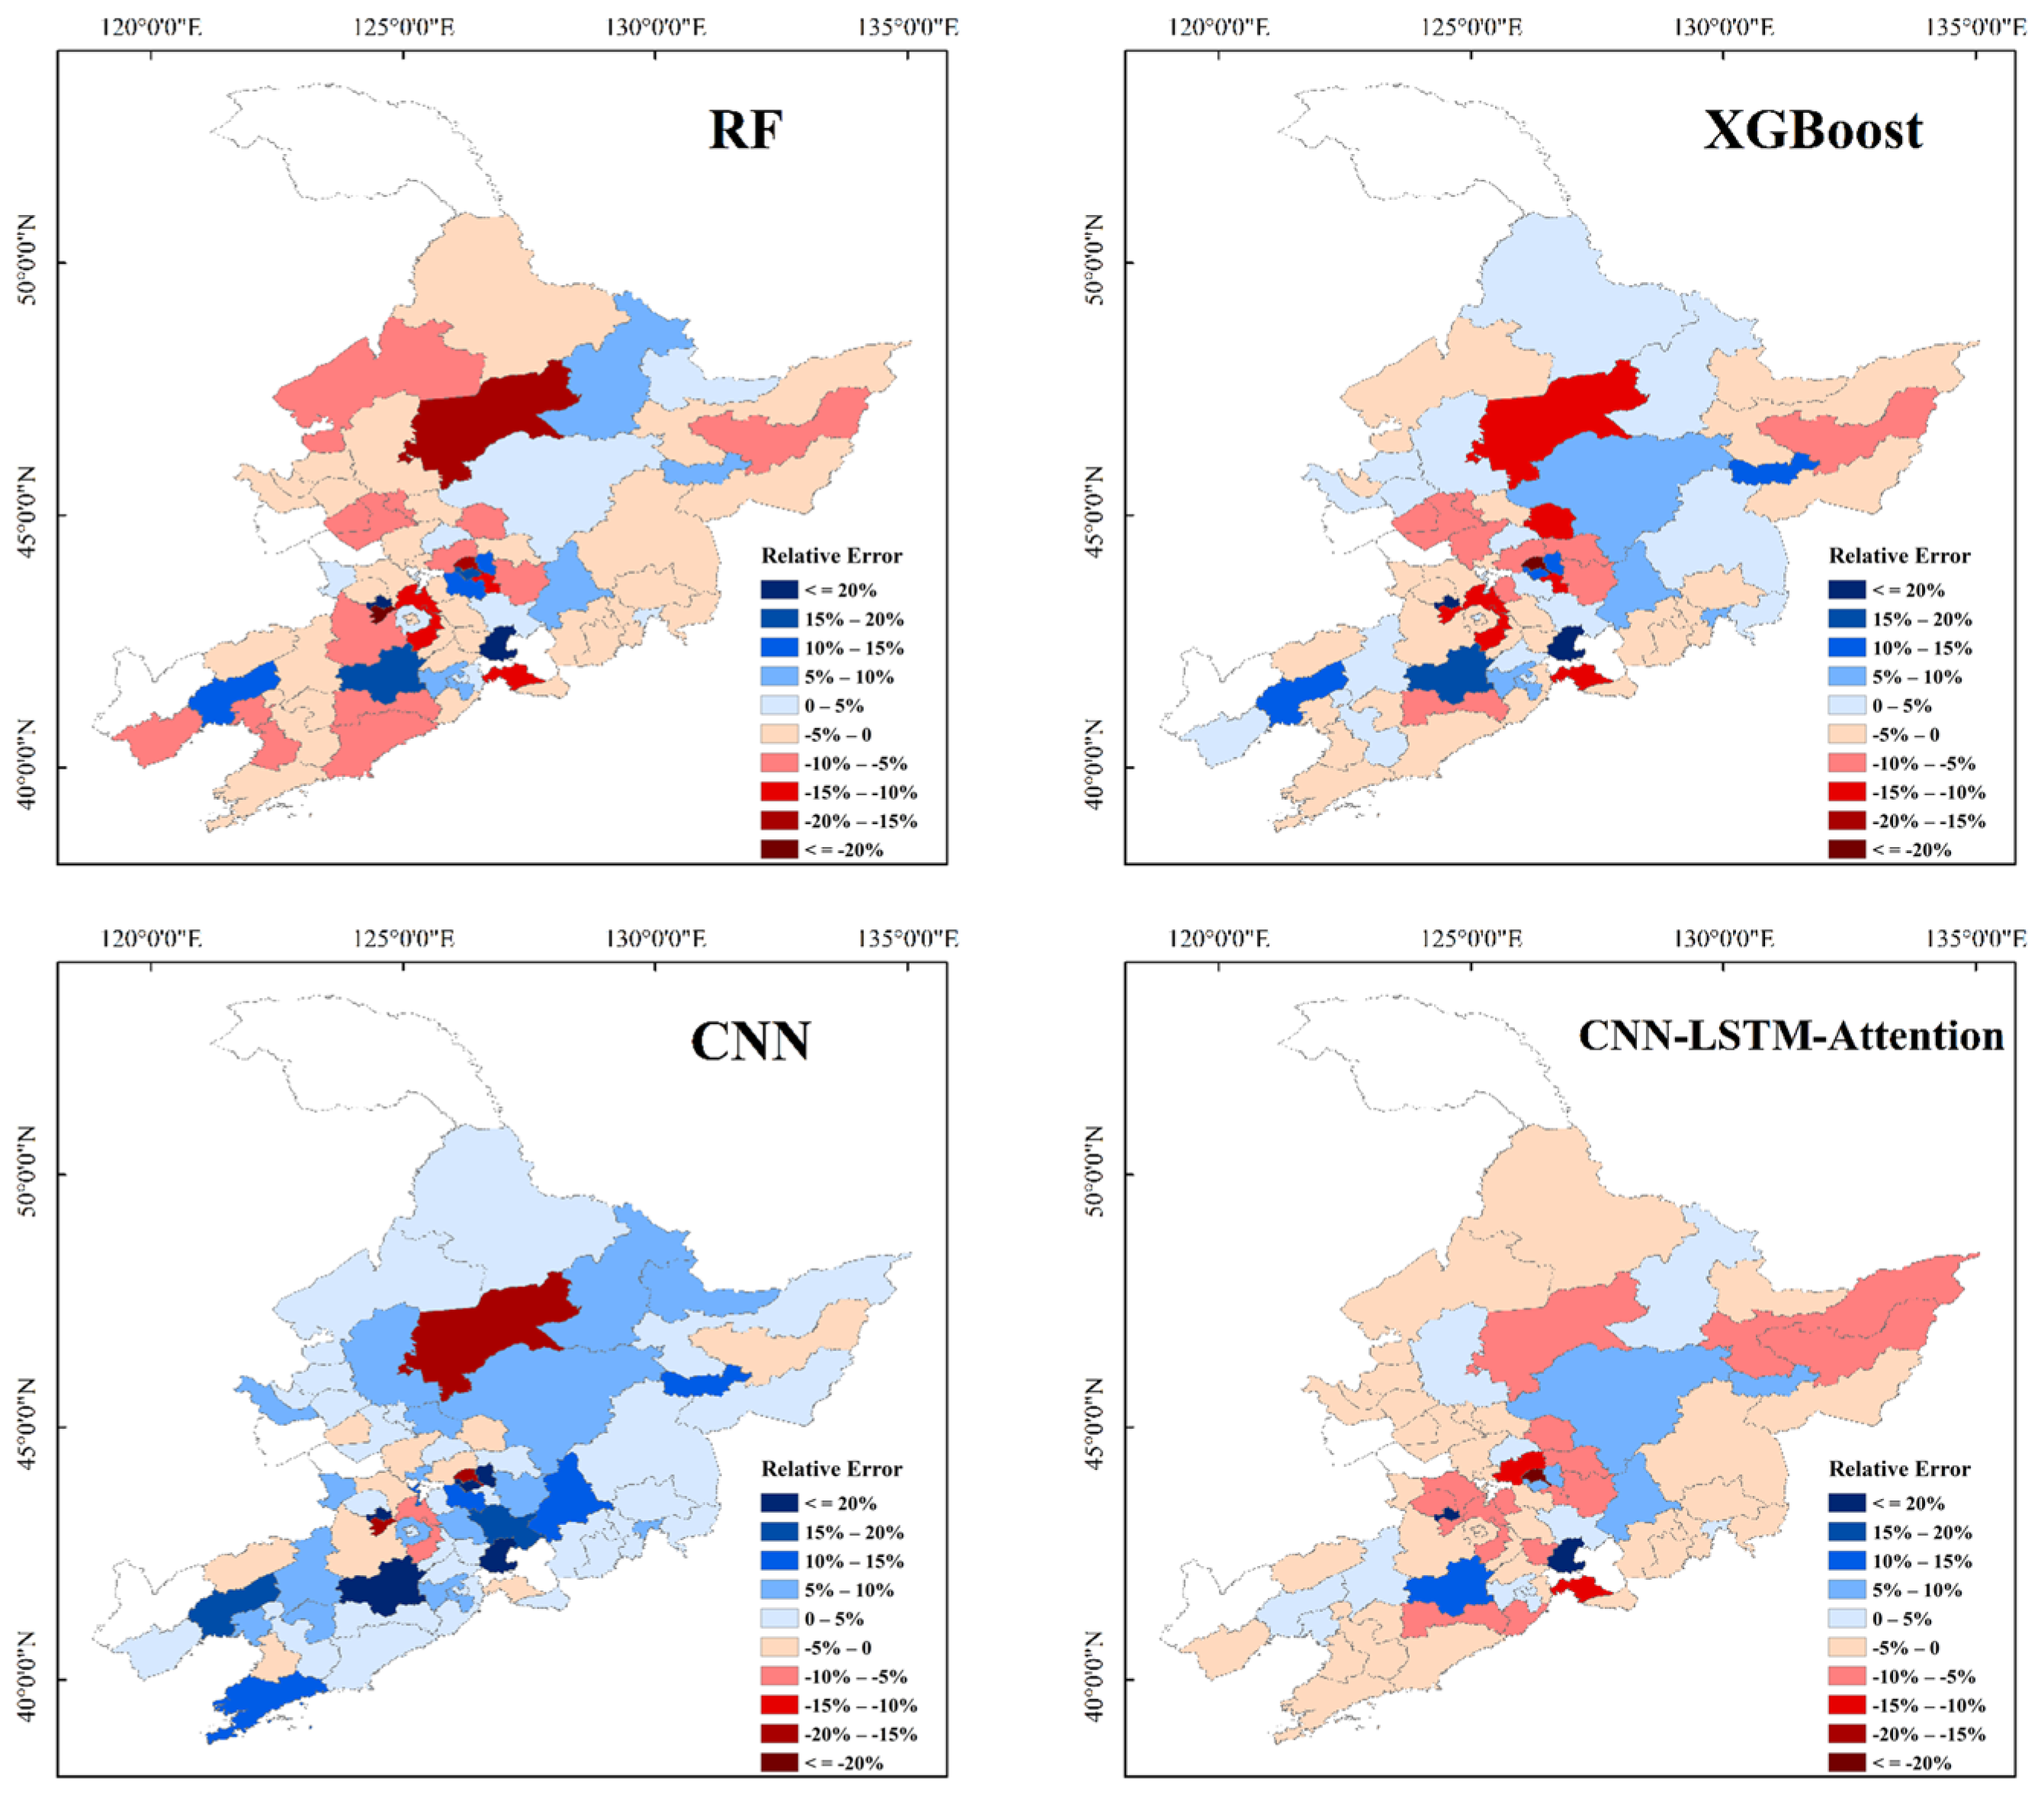
3.3. Spatial Patterns in Yield Prediction for the Three Crop Types

Figure 8, Figure 9 and Figure 10 depict the spatial patterns of predicted crop yields for three crops in 2020 under four different models, aligning closely with official statistics, particularly for the CNN and CNN-LSTM-Attention models. For maize (Figure 8), the RF and XGBoost models concentrated high yields primarily in central regions, spreading to the southwest and northeast. The CNN model exhibited a similar trend, with a slightly more pronounced distribution of high-yield predictions in these central areas. However, the CNN-LSTM-Attention model revealed a distinct spatial pattern with a more heterogeneous distribution of yields, likely due to its ability to integrate temporal factors and focus on features most influential for yield prediction. For rice (Figure 9), the RF model predicted a more uniform distribution in the southern regions, while the XGBoost model suggested a more dispersed distribution of medium to high yields in the area. The CNN model presented a pattern contrasting localized high-yield predictions, potentially indicating its nuanced data-processing capability to capture intensive rice-planting areas or more favorable growth conditions. In contrast, the CNN-LSTM-Attention model suggested a more uniform distribution of higher yields across a broader area. For soybean (Figure 10), the spatial distribution of yields featured high-yield areas mainly concentrated in the southern and central parts of the study area due to the use of city-level data in Liaoning Province and county-level data in the other two provinces. The RF model’s predictions for the highest yields were mostly centered in the central region. The XGBoost model, on the other hand, marked a notable shift in high-yield areas, extending further east. Meanwhile, the CNN model presented a significant redistribution of yield predictions, with lower yields clearly concentrated in the northern regions and higher yields scattered across the south. The CNN-LSTM-Attention model portrayed a more refined spatial pattern, revealing an expanded area of high-yield predictions covering central and eastern regions. By integrating sequential data with attention mechanisms, this model can capture temporal trends and subtle location-specific influences that affect yield outcomes.
Figure 11, Figure 12 and Figure 13 illustrate the relative errors in crop yield predictions for the three studied crops across the research area in 2020. For maize (Figure 11), the areas where the yield was overpredicted by 5–10% under the four models were predominantly in the southwestern region. Compared to the RF and XGBoost models, the CNN model improved the accuracy of yield predictions; yet, some counties still had errors exceeding 15%. The CNN-LSTM-Attention model displayed the most balanced error distribution, with the majority of counties falling below the 10% error threshold. In the case of rice (Figure 12), the RF model showed large variations in error, with some areas, particularly in the north, exceeding 20%. Although the XGBoost model reduced the number of high-error regions compared to the RF model, several central counties still had errors greater than 10%. The CNN model significantly reduced the areas with higher relative errors, keeping most counties’ errors within the −5% to +15% range. Notably, the CNN-LSTM-Attention model provided the most consistent low-error predictions, especially reducing errors in central areas, with the vast majority of regions showing errors below 10%. For soybean (Figure 13), the RF, XGBoost, and CNN models all performed poorly, with the CNN-LSTM-Attention model showing some improvement; yet, errors in certain areas still exceeded 20%.

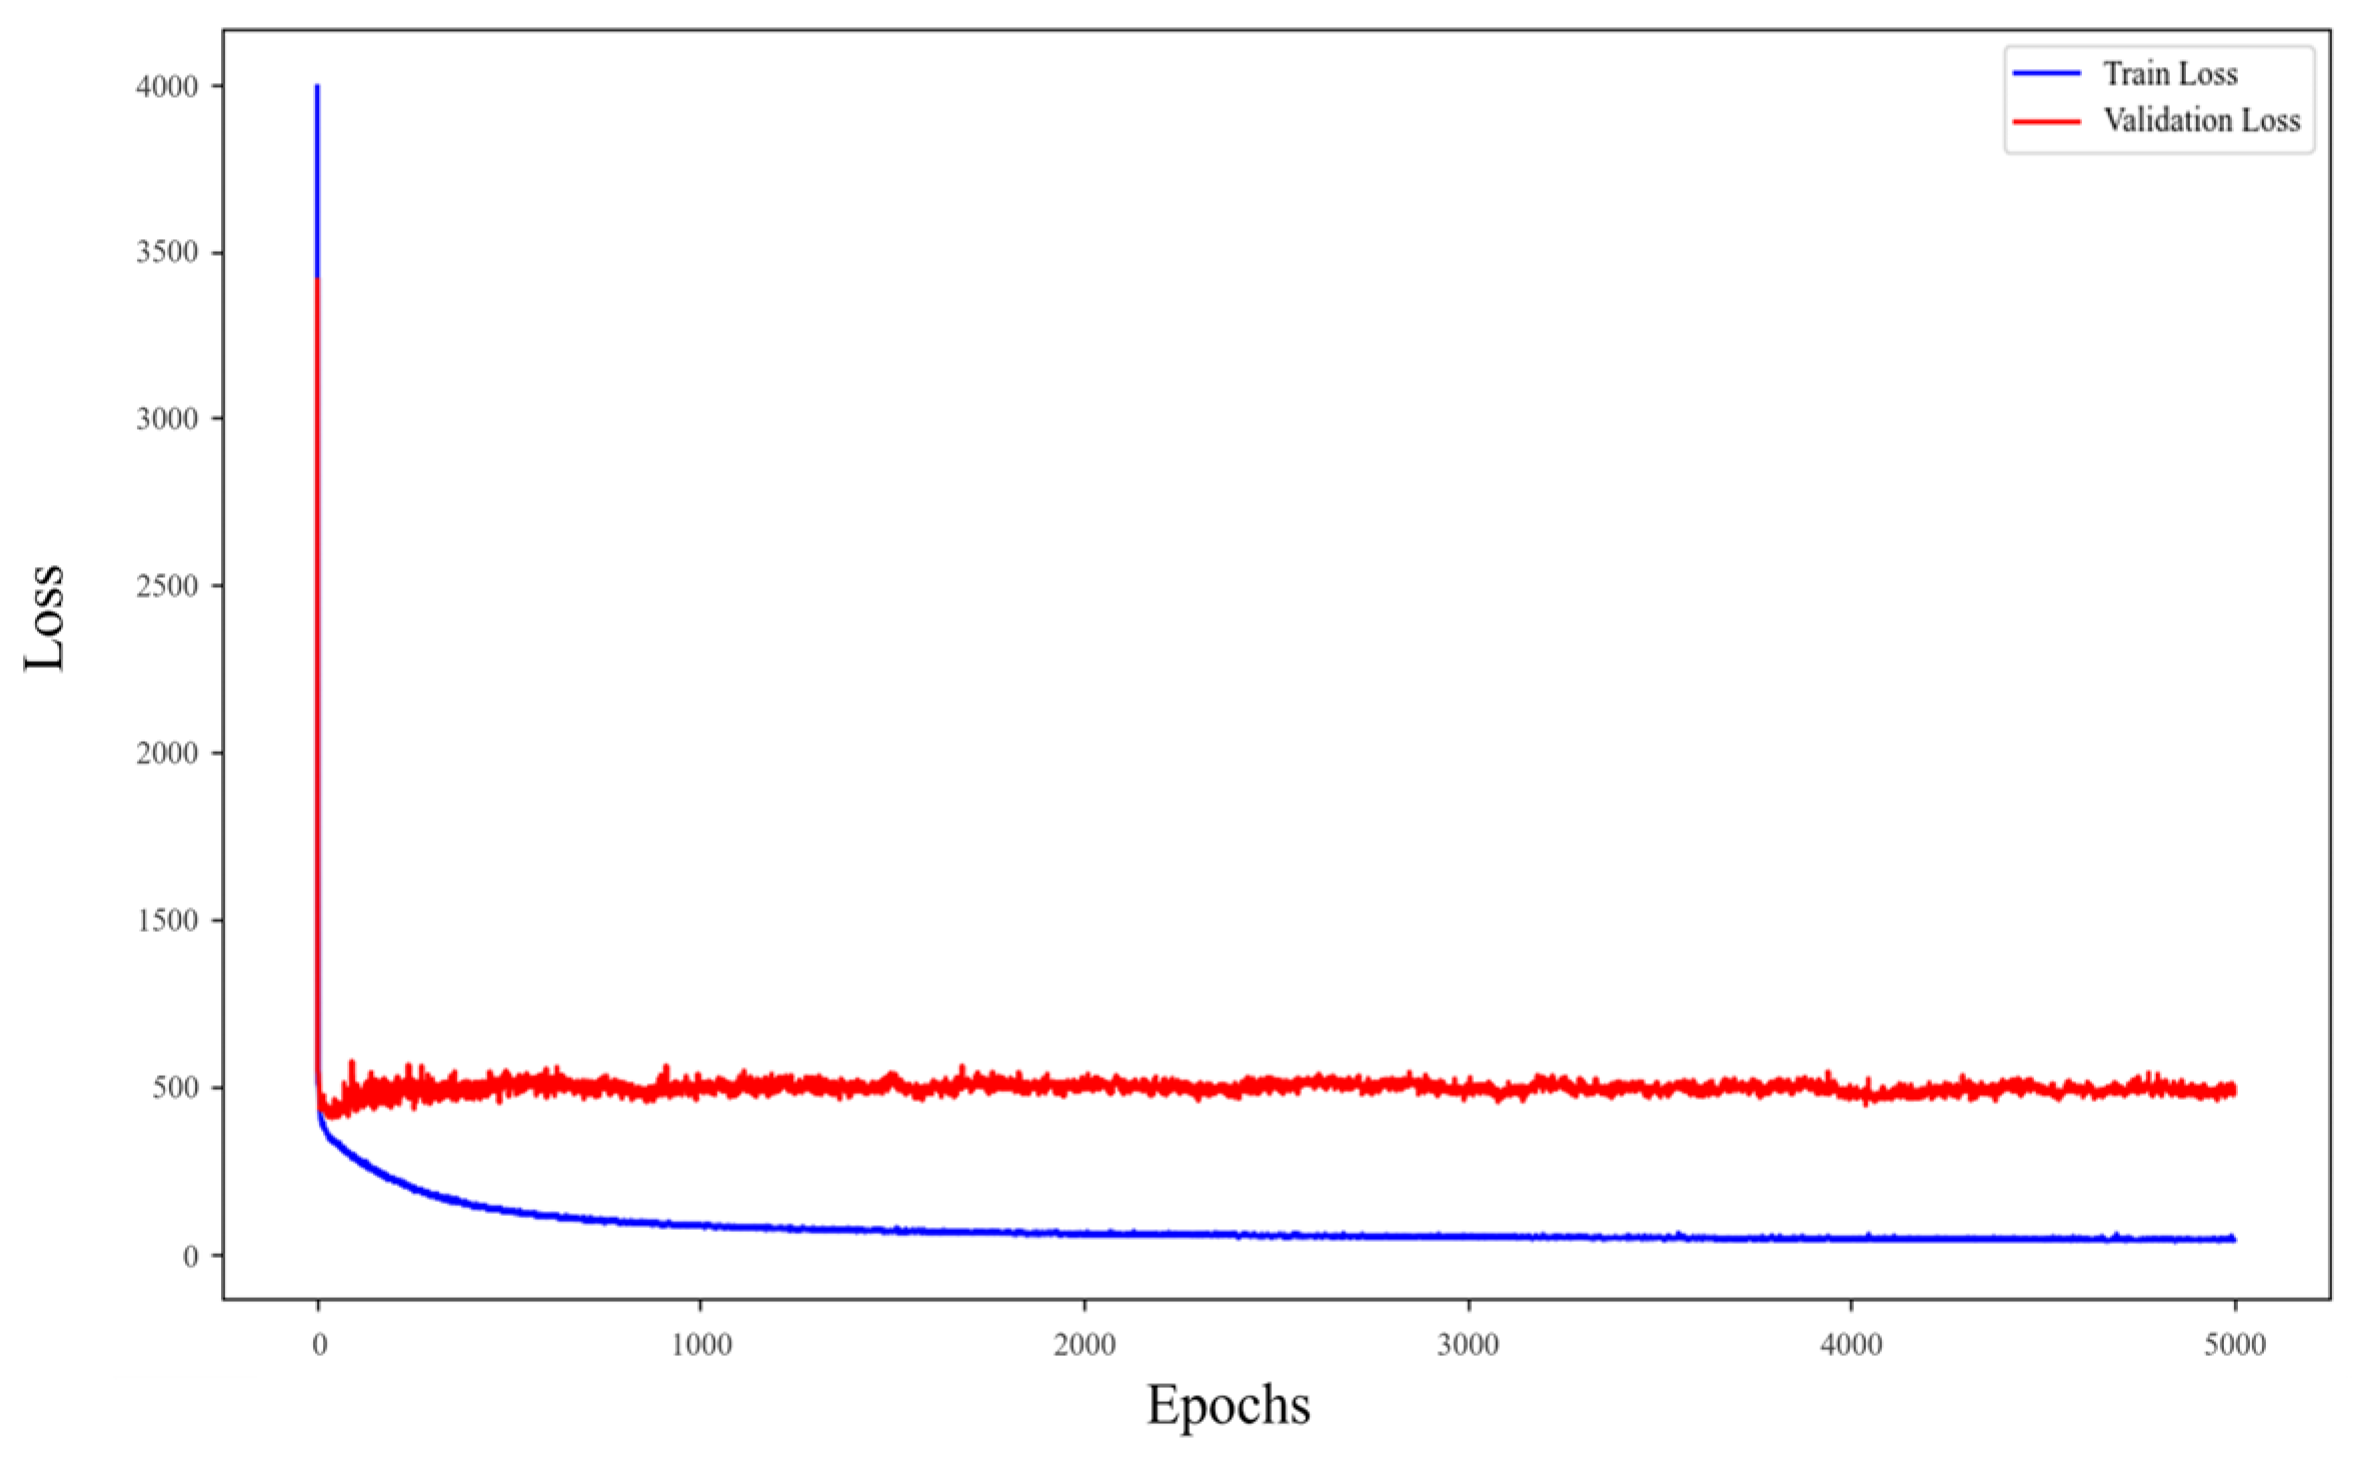
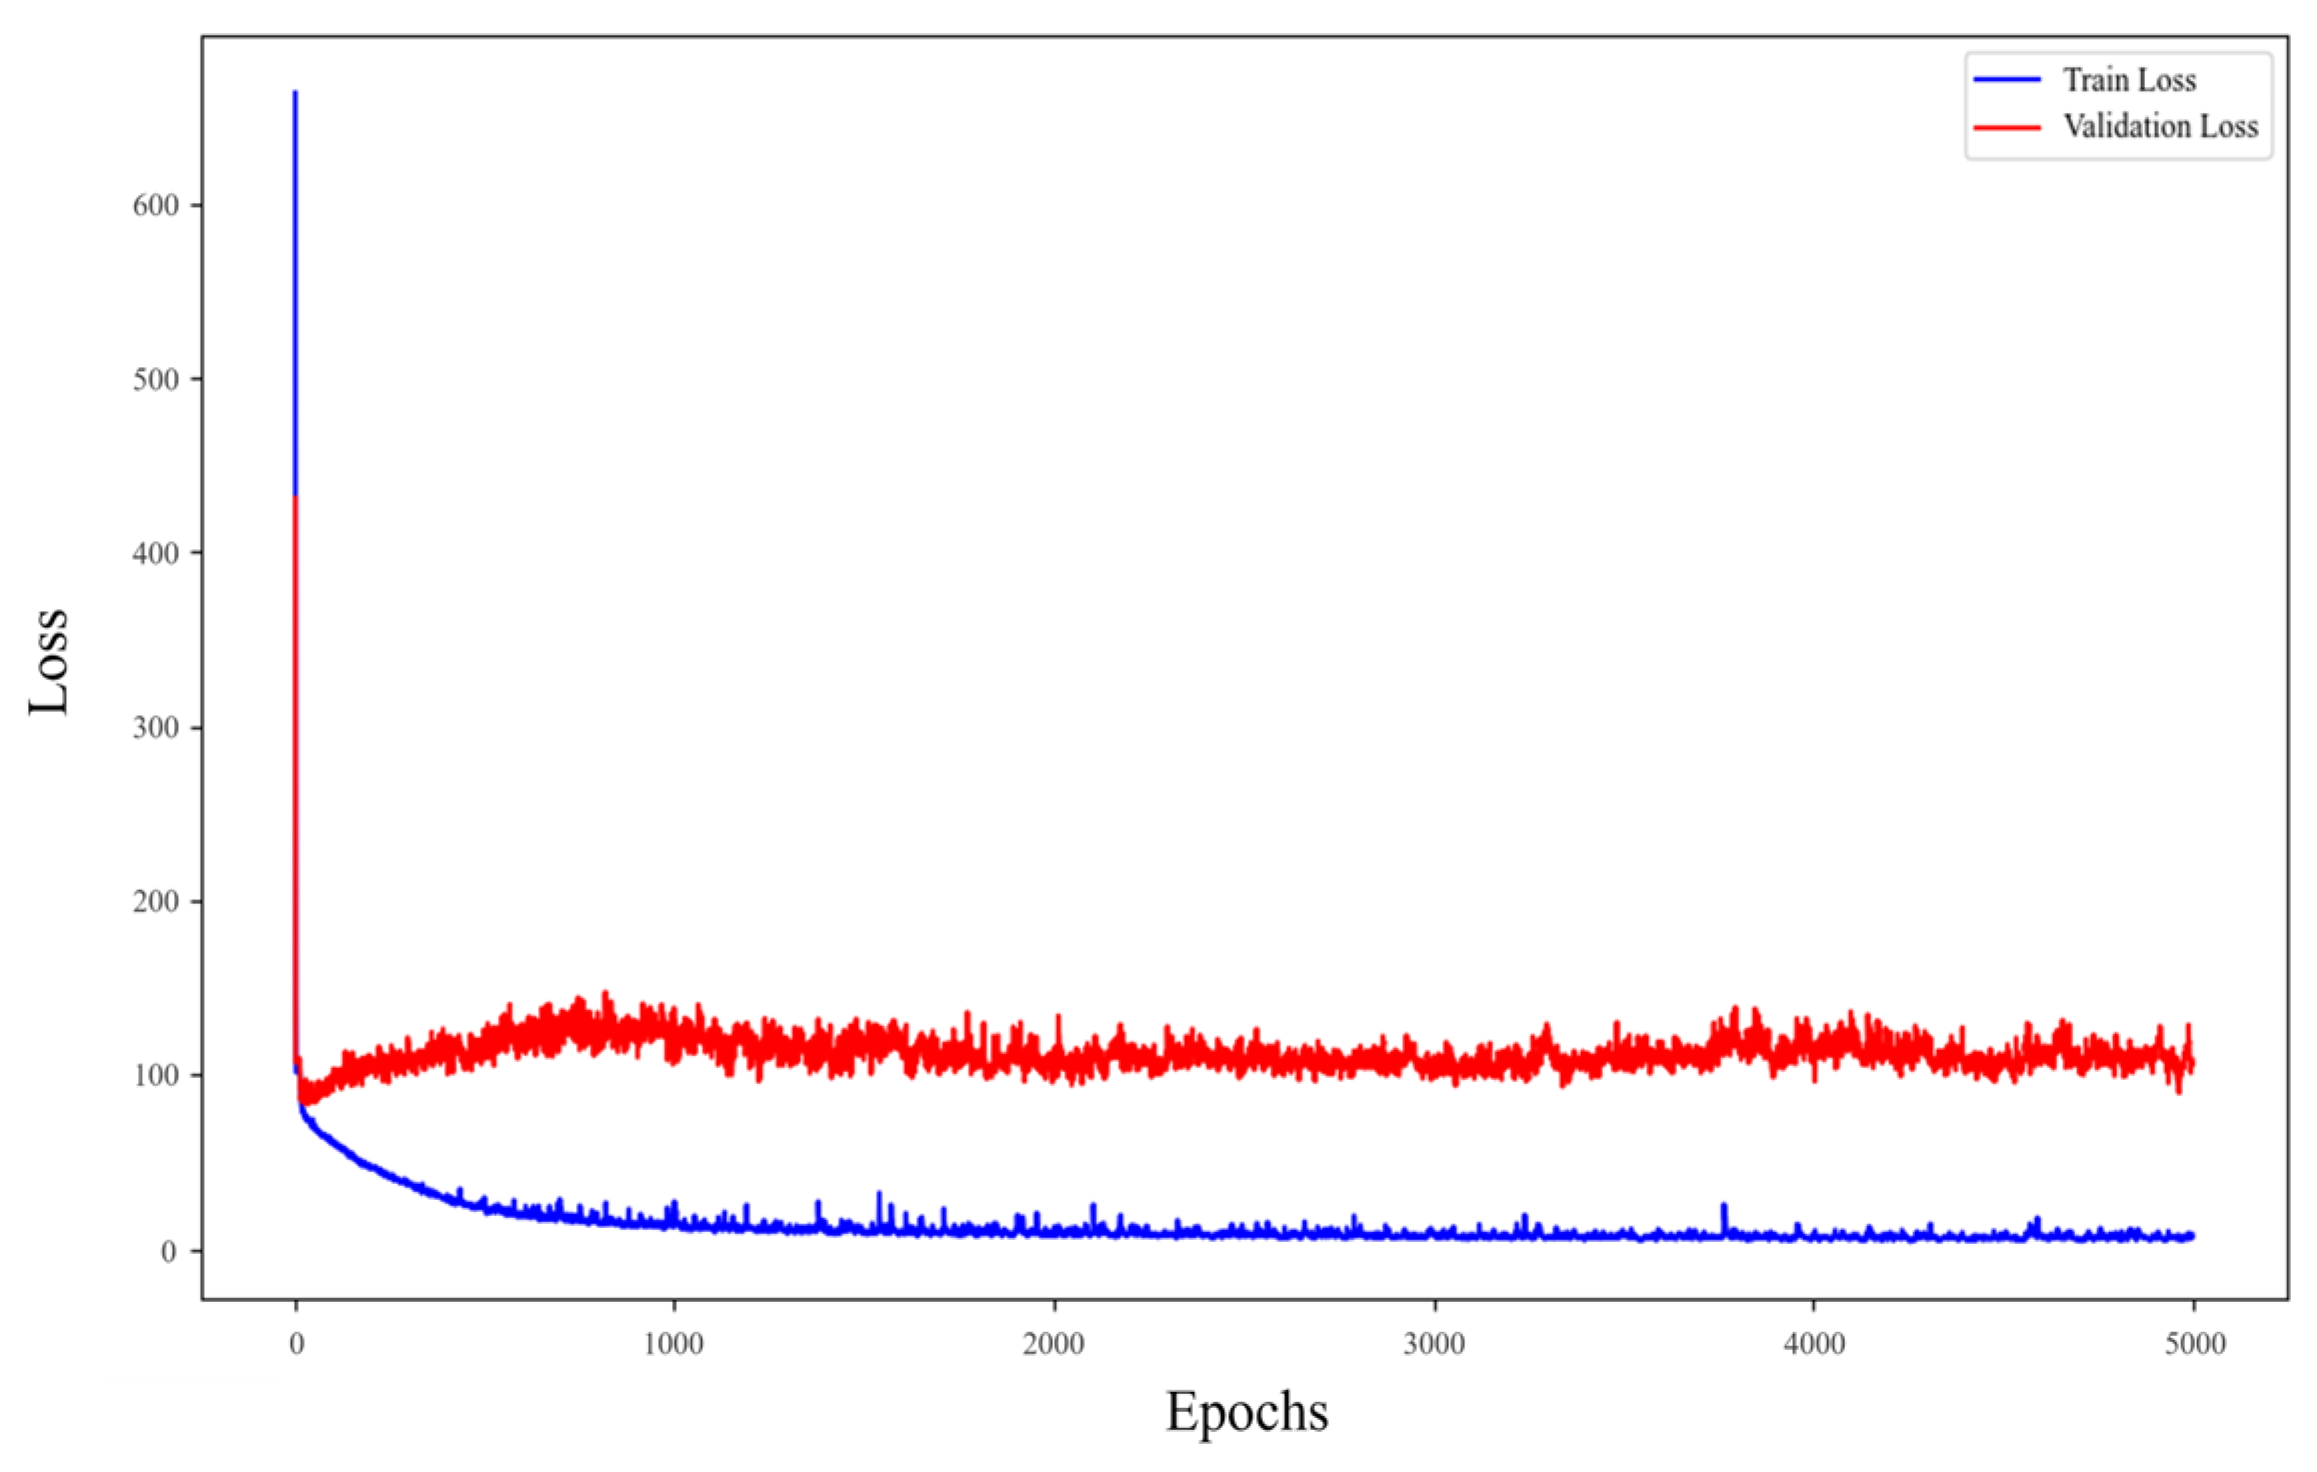
3.4. Training and Validation Loss Analysis for CNN-LSTM-Attention Model

We present the training and validation loss curves for the CNN-LSTM-Attention model applied to maize, rice, and soybean yield prediction. The analysis of these loss curves provides insights into the model’s training process and its generalization performance.
Figure 14 shows the training and validation loss curves for the CNN-LSTM-Attention model applied to maize yield prediction. The analysis of these curves provides insights into the model’s training process and its generalization performance. The training loss (blue curve) decreases rapidly during the initial epochs, indicating that the model is quickly learning and fitting the training data. The validation loss (red curve) also decreases initially but stabilizes at a higher level than the training loss. After the initial drop, the training loss continues to decrease gradually and stabilizes at a relatively low level, indicating a good fit on the training data. The validation loss exhibits more fluctuations but remains relatively stable, suggesting that the model maintains a consistent performance on the validation data.
Figure 15 shows the training and validation loss curves for the CNN-LSTM-Attention model applied to rice yield prediction. The CNN-LSTM-Attention model effectively captures the learning patterns from the training data and generalizes well to the validation data, making it suitable for rice yield prediction. The fluctuations in the validation loss may be attributed to the inherent variability in the validation dataset or the complex nature of predicting crop yields.
Figure 16 presents the training and validation loss curves for the CNN-LSTM-Attention model applied to soybean yield prediction. The training loss remains consistently lower than the validation loss throughout the epochs, which is expected as the model is optimized on the training data. The relative proximity of the training and validation loss curves, despite the fluctuations in the validation loss, indicates that the model has good generalization capabilities and is not overfitting the training data.

3.5. Importance of Predictor Variables in Yield Prediction

Leveraging the SHapley Additive exPlanations (SHAP) analysis to assess the contribution of each indicator, the wind rose plots articulate the importance of a variety of vegetative indices, environmental variables, and photosynthetically active variables in predicting the yields of maize (Figure 17a), rice (Figure 17b), and soybean (Figure 17c). These visualizations succinctly capture how each factor weighs into the predictive models, offering an intuitive representation of their respective impacts on crop yield prediction.
In the prediction of maize yield, our analysis has delineated a spectrum of indicators, each contributing uniquely to the predictive models. Vegetation indices such as NDVI and kNDVI emerged as significant, reflecting the vital role of plant health and vigor in yield outcomes. NDWI, another vegetation index, also stands out, indicating the relevance of the water content in the canopy to the crop’s productivity. Among environmental variables, Pdsi, which indicates drought severity, and Pet, representing evapotranspiration, were prominent. These factors highlight the sensitivity of the maize yield to water-related stress and energy balance within the crop’s environment. Pr further underscores the dependency on water availability. Temperature indicators, Tmmn and Tmmx, although comparatively less dominant, still play a critical role, signifying the impact of thermal conditions on maize growth cycles. Photosynthetically active variables present a nuanced influence, with SIF and PsnNet providing insights into the photosynthetic performance and efficiency of maize crops. Variables like Fpar and Lai, which reflect the fraction of absorbed photosynthetically active radiation and leaf area index, respectively, offer additional perspective on the canopy structure and function.
In the domain of rice yield prediction, the SHAP analysis identified both vegetation indices and environmental variables as critical contributors to the model’s output. NDVI and EVI, indicative of vegetation health and vigor, are among the key vegetative indices that stand out, emphasizing the strong link between vegetation properties and rice productivity. NDWI and kNDVI, which reflect the water content in vegetation and a modified version of NDVI, respectively, emerge as particularly influential, highlighting the rice crop’s sensitivity to water availability and its status within the plant system. Pdsi, a measure of drought stress, alongside Pet and Pr, related to evapotranspiration and precipitation, underscore the critical impact of water balance and hydrological conditions on rice yields. Soil moisture, an important factor for rice, given its typically paddy-based cultivation, is also recognized for its importance. Temperature extremes, represented by Tmmn and Tmmx, along with vapor pressure, play significant roles, pointing to the influence of climate on rice phenology and growth periods. Among photosynthetically active variables, SIF stands out, suggesting the crucial role of active photosynthesis in determining yield. Other indicators such as GPP, PsnNet, Fpar, and Lai also contribute insights, relating to the plant’s photosynthetic capacity and energy absorption efficiency, essential for biomass accumulation and the eventual yield.
For soybean yield prediction, vegetation indices such as NDVI are notable for their impact, reflecting the crucial role of plant health in yield prediction. NDWI, which is associated with the water content in plants, surfaced as a particularly important indicator, underscoring the crop’s responsiveness to water stress and availability. kNDVI and EVI are also identified as meaningful contributors, offering insights into the physiological and structural aspects of the soybean crop that correlate with the yield potential. Soil moisture emerges as a substantial environmental variable, highlighting the dependency of soybean yield on soil water content. While other climatic factors such as Pdsi, Pet, and Pr, related to drought stress, evapotranspiration, and precipitation, respectively, are recognized, their influence is comparatively moderate. Temperature measures, including Tmmn and Tmmx, alongside vapor pressure, have a presence in the analysis, pointing to the effects of thermal conditions on soybean development and maturation. In terms of photosynthetically active variables, PsnNet, which relates to the net photosynthetic rate, is identified among the factors, indicating the relevance of photosynthetic efficiency and carbon assimilation in determining yield outcomes. SIF and GPP, both reflective of photosynthetic activity, are also part of the suite of influential indicators, albeit with a more moderate impact.

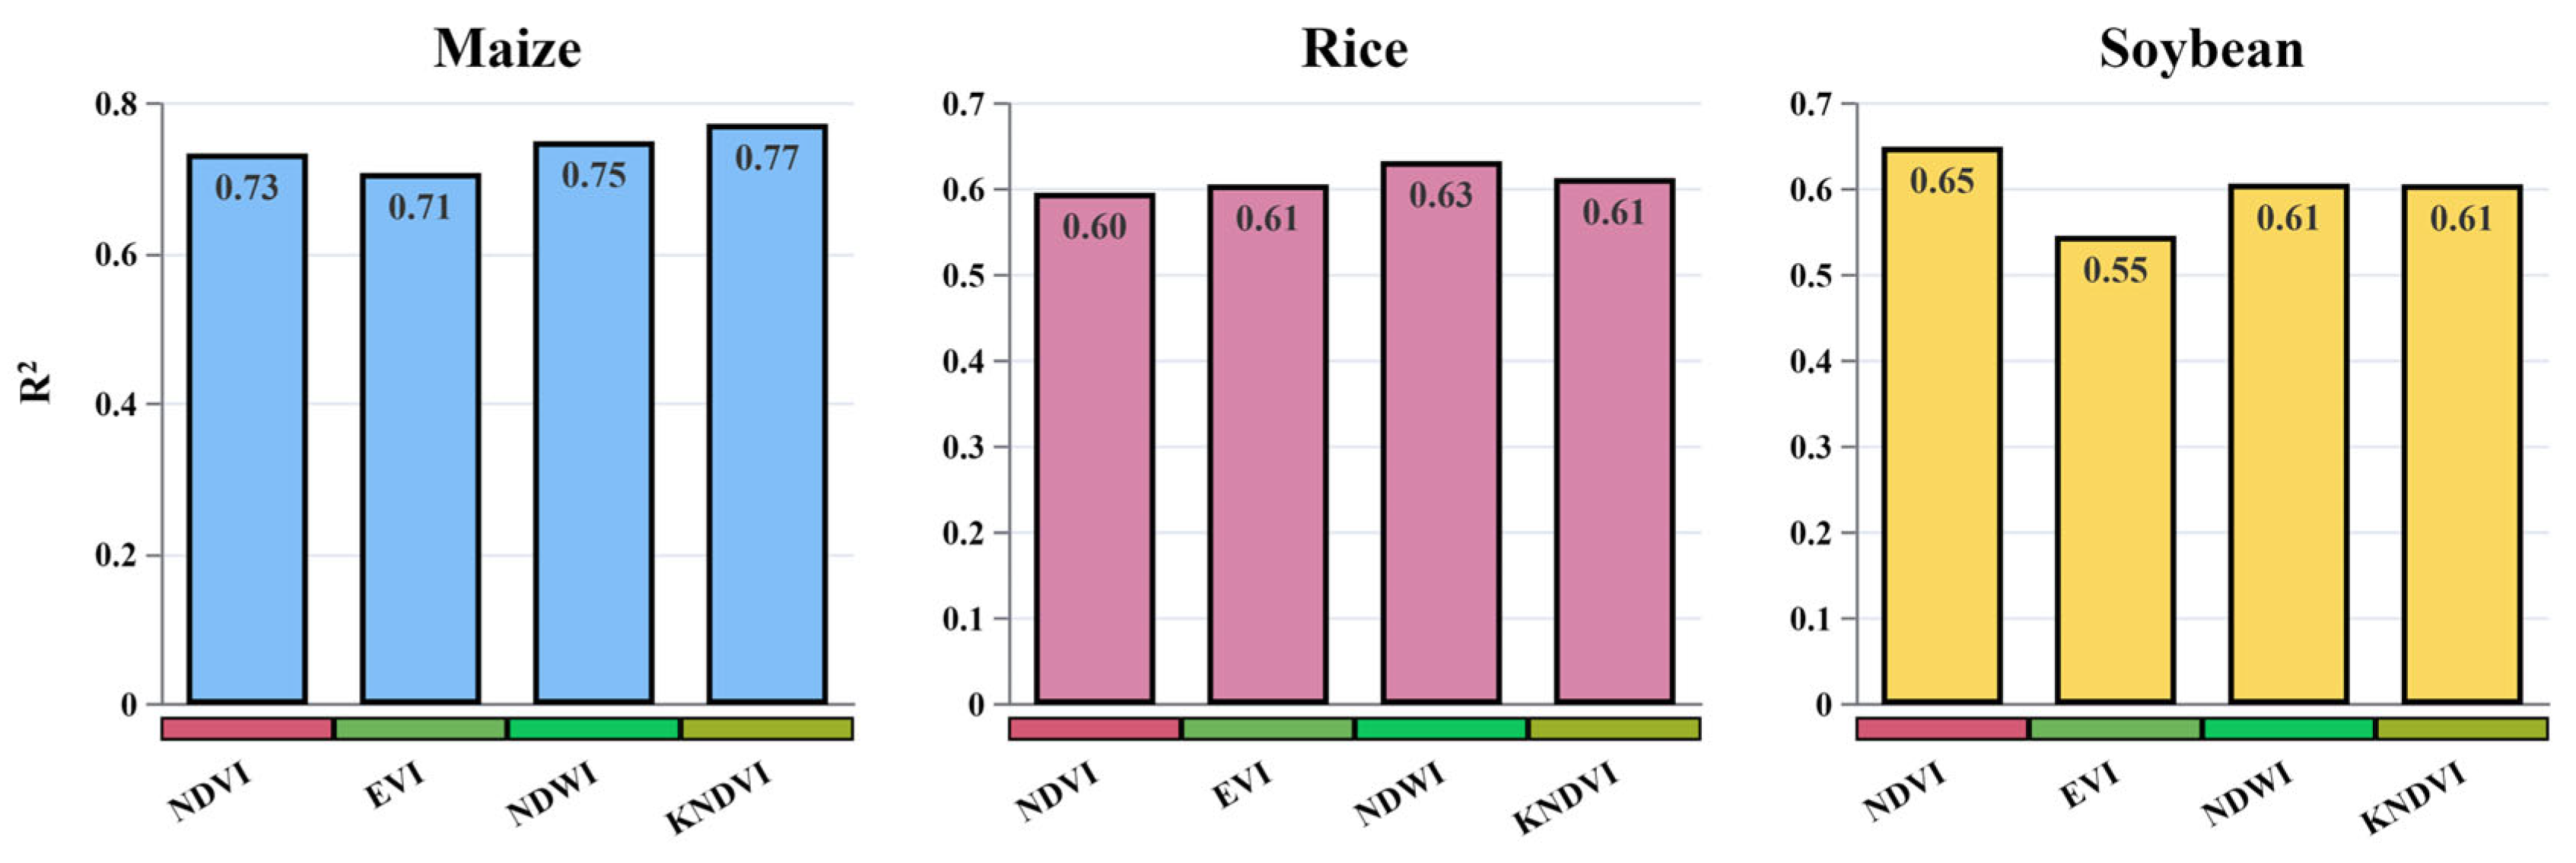
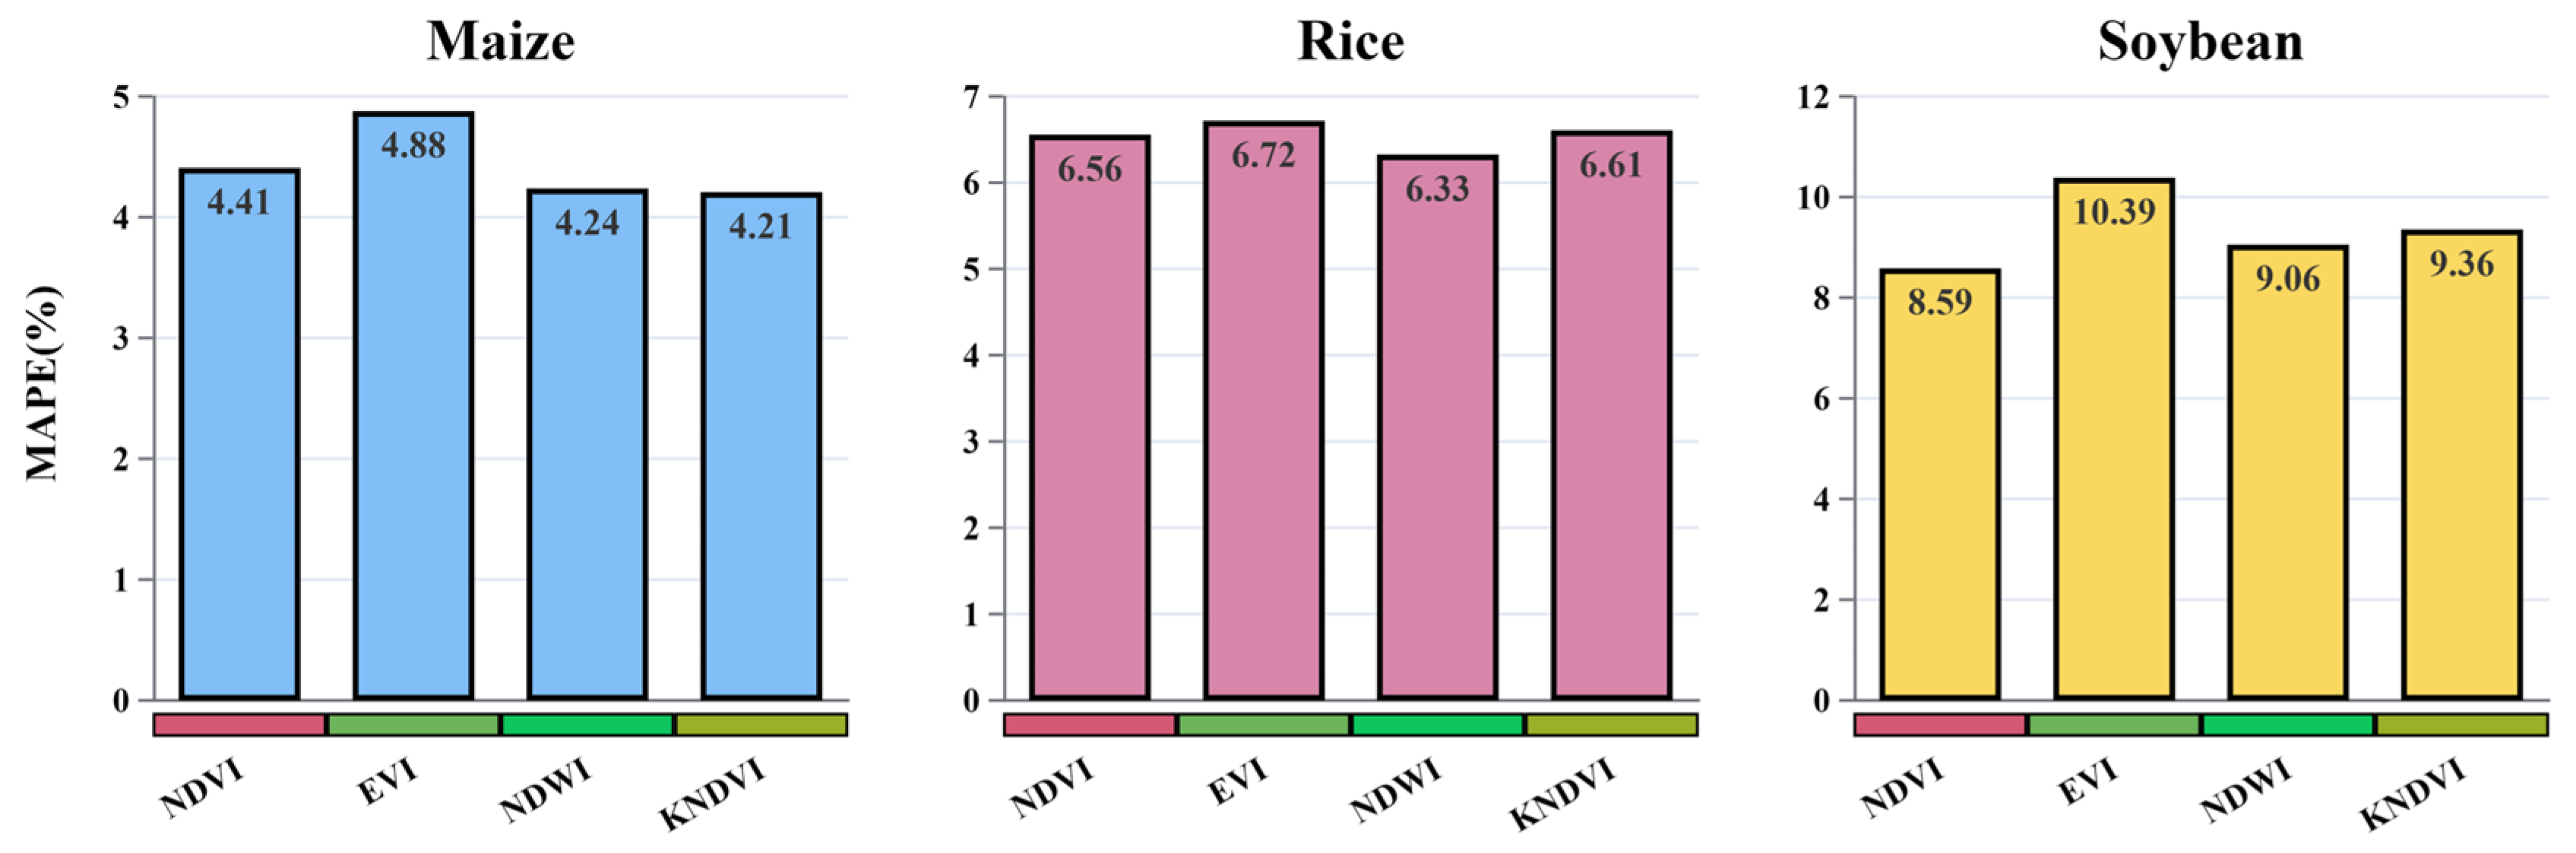
3.6. Analysis of Vegetation Indices in Crop Yield Prediction

In assessing crop yield predictions for maize, rice, and soybean, the study employs a nuanced approach by utilizing individual vegetation indices as part of the input feature set within the CNN-LSTM-Attention model. Each index (NDVI, EVI, NDWI, and kNDVI) is individually analyzed along with a range of non-vegetation-related predictors to determine its unique contribution to the model’s predictive accuracy (Figure 18, Figure 19 and Figure 20). This methodology allows for an examination of how each vegetation index, when considered alongside environmental variables and photosynthetically active variables, can influence yield prediction outcomes.
The experimental results clearly show that using various vegetation indices in combination with the CNN-LSTM-Attention model significantly enhances the accuracy of crop yield predictions for maize, rice, and soybean. Specifically, for maize, kNDVI achieved an R2 value of 0.77, followed closely by NDWI with 0.75. For rice and soybean, while kNDVI still performed well with R2 values of 0.61, NDVI and NDWI also demonstrated considerable predictive power. From the perspective of RMSE, kNDVI achieved lower RMSE values in the predictions for maize and soybean, demonstrating its stability and accuracy in prediction. However, for rice, NDWI exhibited a lower RMSE, highlighting once again the specific response of different crops to vegetation indices. Regarding MAPE values, although the differences among various vegetation indices across the three crops were not significant, kNDVI still exhibited relatively lower error rates in the predictions for maize and soybean, further validating its potential in enhancing prediction accuracy.

4. Discussion

In this study, we deployed four distinct models to predict the yields of three crops, among which the CNN-LSTM-Attention model outperformed the others. The model’s attention component adds an additional layer of precision by identifying and focusing on the most influential time steps across the input sequence. This enables the model to prioritize crucial information during crucial phenological stages, which can significantly vary among crops like maize, rice, and soybean, each with its unique growth dynamics and environmental sensitivities. In contrast, more traditional approaches such as the RF and XGBoost models, while robust in their own right, are constrained by their inability to process sequential data effectively [62,63]. Similarly, the standalone CNN model, even with their prowess in pattern recognition, cannot encapsulate the temporal sequence as effectively [64,65]. It is the CNN-LSTM-Attention model’s synthesis of convolution with temporal sequence processing and targeted attention that underlines its superiority. This synergy adeptly handles the non-linearities and complex interactions within multi-source agricultural data, consistent with the findings of Zhou et al. [66] and Sun et al. [67]. Moreover, the addition of the attention layer allows the model to dynamically weigh the importance of different time steps, further enhancing its predictive power. This targeted attention helps in capturing critical growth periods and environmental stress factors more accurately. Current research, including studies by Qiao et al. [68] and Tian et al. [69], has demonstrated that attention mechanisms significantly improve the performance of deep-learning models by focusing on the most relevant parts of the input data. This capability is particularly beneficial in agricultural yield prediction, where the temporal and spatial variability of environmental factors plays a crucial role in determining crop outcomes. Consequently, our model not only provides a higher accuracy in yield predictions but also enhances our understanding of the temporal influence of different VIs, and environmental and photosynthetic factors on crop yield. Furthermore, the model’s strength is evidenced in its performance metrics, consistently achieving higher R2 values and lower error rates across the three crop types. These findings reinforce the notion that future predictive models must integrate multidimensional data-processing capabilities to handle the complexities of agricultural systems effectively.
The significance of various predictors across models for maize, rice, and soybean yield prediction presents a rich tapestry of interactions. Vegetation indices such as NDVI and kNDVI emerge as central across all crops, reflecting the foundational role of plant vigor in yield formation [70]. NDWI’s particular relevance to rice underscores the crop’s dependency on adequate water conditions, a finding aligned with the crop’s paddy cultivation [71]. For soybean, soil moisture holds substantial weight, signifying the sensitivity of this legume to soil–water dynamics, which could influence key physiological processes, from germination to pod filling [72]. Environmental variables tell a story of the climatic impact, with Pdsi indicating the stress levels that can drastically affect crop performance. Temperature variables, while having a varied influence, are universally acknowledged as vital due to their direct effect on plant metabolic rates and developmental stages. However, their impact is crop-specific, influenced by each crop’s unique temperature thresholds and resilience to heat or cold stress [73,74]. Photosynthetically active variables like SIF bring to light the role of active biomass production in the yield potential. The analysis reveals that, while GPP and PsnNet may not be the most prominent predictors when considered individually, they are nonetheless integral to understanding the overall photosynthetic efficiency and health of the crop canopy [75]. Viewed through the capabilities of the CNN-LSTM-Attention model, the distinct contributions of each variable become clear, illustrating how the model dissects and elevates the significance of time-sensitive variables throughout the crops’ growing seasons. This model’s analytical strength lies in its sophisticated handling of intricate data layers, offering a deeper comprehension of the factors that drive yields.
The introduction of kNDVI as an advanced vegetative index in yield prediction models represents a promising development in precision agriculture. kNDVI’s capacity to adjust traditional NDVI readings to account for variations in environmental conditions allows for a more accurate representation of crop vigor, especially under diverse and fluctuating agricultural settings [48]. kNDVI significantly enhances the mitigation of saturation issues associated with NDVI in high-biomass scenarios, thereby improving the sensitivity to variations in crop stress conditions. It enhances the detection of subtle variations in canopy structure and photosynthetic activity, which are critical for an accurate yield estimation. Current research, including studies by Wang et al. [76] and Xu et al. [77], has demonstrated that kNDVI significantly improves the precision of yield predictions by incorporating factors such as SIF and temperature variability. These studies highlight kNDVI’s ability to provide more reliable assessments of crop health and productivity, reinforcing its value in advanced agricultural monitoring systems. The findings of this study underscore the robust correlation of kNDVI with yield across all crop types, affirming its efficacy as a predictive factor. Its ability to mitigate the saturation effects often seen in NDVI when dealing with high-biomass regions makes kNDVI particularly valuable for assessing crop productivity in areas of dense vegetation [78]. Moreover, kNDVI’s potential goes beyond a mere correlation with yield. It offers a refined sensitivity to physiological changes within the crops, which could be critical in the early detection of stress or vigor that traditional indices might overlook [49]. The CNN-LSTM-Attention model’s success in integrating kNDVI attests to its capacity to enhance yield prediction accuracy. This success is evident in the improved model performance metrics when kNDVI is included, affirming its role in strengthening the predictive framework. As agricultural practices evolve towards data-driven decision making, sophisticated indices such as kNDVI play an increasingly critical role. It holds the promise of unlocking new dimensions of crop monitoring, which can lead to more informed management decisions, ultimately fostering higher yields and more sustainable farming practices. Future research may delve into optimizing kNDVI’s application in yield models or exploring its utility in monitoring other aspects of crop health, thus broadening the horizons for its application in smart farming solutions.

5. Conclusions

This study has conducted an extensive evaluation of the CNN-LSTM-Attention model’s efficacy in predicting the yields of maize, rice, and soybean in Northeast China, comparing its performance against traditional models like RF, XGBoost, and standalone CNN. The investigation centered around leveraging a robust integration of multi-source data, including vegetation indices, environmental variables, and photosynthetically active parameters, across different crop types. The findings demonstrate that the CNN-LSTM-Attention model significantly outperformed other models, showcasing its superior ability in capturing both spatial and temporal complexities inherent in agricultural data. This model’s integration of advanced neural network architectures effectively harnessed the nuanced interplays between various predictors and yield outcomes, leading to more accurate and reliable predictions. The high performance of the CNN-LSTM-Attention model underlines the potential of using sophisticated machine-learning frameworks to enhance the precision of agricultural prediction. Vegetation indices such as NDVI and kNDVI have emerged as crucial for all models, affirming their importance in capturing the physiological state of crops. Similarly, the influence of environmental factors varied across crop types, revealing intricate dependencies on climatic conditions. This nuanced understanding facilitates more informed agricultural management strategies, potentially leading to optimized resource allocation and improved crop management practices. In conclusion, this research contributes significantly to the field of agricultural sciences, providing compelling evidence of the advantages of employing advanced deep-learning techniques in crop yield prediction. It paves the way for further technological integration into agricultural practices, aiming to meet the increasing demands of global food production and sustainability challenges.

Author Contributions

Conceptualization, J.L. (Jian Lu) and J.L. (Jian Li); methodology, J.L. (Jian Lu) and H.F.; software, J.L. (Jian Lu) and H.F.; validation, J.L. (Jian Lu), H.F. and Z.L.; formal analysis, J.L. (Jian Lu) and X.T.; investigation, J.L. (Jian Lu) and Y.S.; resources, J.L. (Jian Lu) and X.T.; data curation, J.L. (Jian Lu) and J.L. (Jian Li); writing—original draft preparation, J.L. (Jian Lu) and J.L. (Jian Li); writing—review and editing, J.L. (Jian Lu), Z.L. and J.L. (Jian Li); visualization, J.L. (Jian Lu) and X.N.; supervision, Z.L. and H.C.; project administration, Z.L. and H.C.; funding acquisition, J.L. (Jian Li). All authors have read and agreed to the published version of the manuscript.

Funding

This research was funded by the Changchun Science and Technology Development Program, grant number 21ZGN26, and by the Jilin Province Science and Technology Development Program, grant number 20230508026RC.

Institutional Review Board Statement

Not applicable.

Data Availability Statement

The datasets generated and analyzed during the current study are available from the corresponding author upon reasonable request. These datasets are not publicly accessible as they are subject to ongoing research and contain information that has not yet been fully disseminated.

Conflicts of Interest

The authors declare no conflicts of interest.

References

  1. Barakat, S.; Cochrane, L.; Vasekha, I. The humanitarian-development-peace nexus for global food security: Responding to the climate crisis, conflict, and supply chain disruptions. Int. J. Disaster Risk Reduct. 2023, 98, 104106. [Google Scholar] [CrossRef]
  2. Loizou, E.; Karelakis, C.; Galanopoulos, K.; Mattas, K. The role of agriculture as a development tool for a regional economy. Agric. Syst. 2019, 173, 482–490. [Google Scholar] [CrossRef]
  3. Luo, J.; Hu, M.; Huang, M.; Bai, Y. How does innovation consortium promote low-carbon agricultural technology innovation: An evolutionary game analysis. J. Clean. Prod. 2023, 384, 135564. [Google Scholar] [CrossRef]
  4. Li, M.; Jia, N.; Lenzen, M.; Malik, A.; Wei, L.; Jin, Y.; Raubenheimer, D. Global food-miles account for nearly 20% of total food-systems emissions. Nat. Food 2022, 3, 445–453. [Google Scholar] [CrossRef]
  5. Xin, F.; Xiao, X.; Dong, J.; Zhang, G.; Zhang, Y.; Wu, X.; Li, X.; Zou, Z.; Ma, J.; Du, G.; et al. Large increases of paddy rice area, gross primary production, and grain production in Northeast China during 2000–2017. Sci. Total Environ. 2020, 711, 135183. [Google Scholar] [CrossRef]
  6. Niu, Y.; Xie, G.; Xiao, Y.; Liu, J.; Wang, Y.; Luo, Q.; Zou, H.; Gan, S.; Qin, K.; Huang, M. Spatiotemporal Patterns and Determinants of Grain Self-Sufficiency in China. Foods 2021, 10, 747. [Google Scholar] [CrossRef]
  7. You, N.; Dong, J.; Huang, J.; Du, G.; Zhang, G.; He, Y.; Yang, T.; Di, Y.; Xiao, X. The 10-m crop type maps in Northeast China during 2017–2019. Sci. Data 2021, 8, 41. [Google Scholar] [CrossRef]
  8. Anderson, K.; Strutt, A. Food security policy options for China: Lessons from other countries. Food Policy 2014, 49, 50–58. [Google Scholar] [CrossRef]
  9. Muruganantham, P.; Wibowo, S.; Grandhi, S.; Samrat, N.H.; Islam, N. A Systematic Literature Review on Crop Yield Prediction with Deep Learning and Remote Sensing. Remote Sens. 2022, 14, 1990. [Google Scholar] [CrossRef]
  10. Maimaitijiang, M.; Sagan, V.; Sidike, P.; Hartling, S.; Esposito, F.; Fritschi, F.B. Soybean yield prediction from UAV using multimodal data fusion and deep learning. Remote Sens. Environ. 2020, 237, 111599. [Google Scholar] [CrossRef]
  11. Lv, Z.; Huang, H.; Li, X.; Zhao, M.; Benediktsson, J.A.; Sun, W.; Falco, N. Land Cover Change Detection with Heterogeneous Remote Sensing Images: Review, Progress, and Perspective. Proc. IEEE 2022, 110, 1976–1991. [Google Scholar] [CrossRef]
  12. Zhuo, W.; Fang, S.; Gao, X.; Wang, L.; Wu, D.; Fu, S.; Wu, Q.; Huang, J. Crop yield prediction using MODIS LAI, TIGGE weather forecasts and WOFOST model: A case study for winter wheat in Hebei, China during 2009–2013. Int. J. Appl. Earth Obs. Geoinf. 2022, 106, 102668. [Google Scholar] [CrossRef]
  13. Leolini, L.; Bregaglio, S.; Ginaldi, F.; Costafreda-Aumedes, S.; Di Gennaro, S.F.; Matese, A.; Maselli, F.; Caruso, G.; Palai, G.; Bajocco, S.; et al. Use of remote sensing-derived fPAR data in a grapevine simulation model for estimating vine biomass accumulation and yield variability at sub-field level. Precis. Agric. 2023, 24, 705–726. [Google Scholar] [CrossRef]
  14. Zhai, W.; Li, C.; Cheng, Q.; Ding, F.; Chen, Z. Exploring Multisource Feature Fusion and Stacking Ensemble Learning for Accurate Estimation of Maize Chlorophyll Content Using Unmanned Aerial Vehicle Remote Sensing. Remote Sens. 2023, 15, 3454. [Google Scholar] [CrossRef]
  15. Naghdyzadegan Jahromi, M.; Zand-Parsa, S.; Razzaghi, F.; Jamshidi, S.; Didari, S.; Doosthosseini, A.; Pourghasemi, H.R. Developing machine learning models for wheat yield prediction using ground-based data, satellite-based actual evapotranspiration and vegetation indices. Eur. J. Agron. 2023, 146, 126820. [Google Scholar] [CrossRef]
  16. Wang, J.; Wang, P.; Tian, H.; Tansey, K.; Liu, J.; Quan, W. A deep learning framework combining CNN and GRU for improving wheat yield estimates using time series remotely sensed multi-variables. Comput. Electron. Agric. 2023, 206, 107705. [Google Scholar] [CrossRef]
  17. Amin, E.; Pipia, L.; Belda, S.; Perich, G.; Graf, L.V.; Aasen, H.; Van Wittenberghe, S.; Moreno, J.; Verrelst, J. In-season forecasting of within-field grain yield from Sentinel-2 time series data. Int. J. Appl. Earth Obs. Geoinf. 2024, 126, 103636. [Google Scholar] [CrossRef]
  18. Camps-Valls, G.; Campos-Taberner, M.; Moreno-Martínez, Á.; Walther, S.; Duveiller, G.; Cescatti, A.; Mahecha, M.D.; Muñoz-Marí, J.; García-Haro, F.J.; Guanter, L.; et al. A unified vegetation index for quantifying the terrestrial biosphere. Sci. Adv. 2021, 7, eabc7447. [Google Scholar] [CrossRef]
  19. Zheng, Z.; Schmid, B.; Zeng, Y.; Schuman, M.C.; Zhao, D.; Schaepman, M.E.; Morsdorf, F. Remotely sensed functional diversity and its association with productivity in a subtropical forest. Remote Sens. Environ. 2023, 290, 113530. [Google Scholar] [CrossRef]
  20. Wang, Q.; Moreno-Martínez, Á.; Muñoz-Marí, J.; Campos-Taberner, M.; Camps-Valls, G. Estimation of vegetation traits with kernel NDVI. ISPRS J. Photogramm. Remote Sens. 2023, 195, 408–417. [Google Scholar] [CrossRef]
  21. Chen, Z.; Zhang, X.; Jiao, Y.; Cheng, Y.; Zhu, Z.; Wang, S.; Zhang, H. Investigating the spatio-temporal pattern evolution characteristics of vegetation change in Shendong coal mining area based on kNDVI and intensity analysis. Front. Ecol. Evol. 2023, 11, 1344664. [Google Scholar] [CrossRef]
  22. Sun, Y.; Zhang, S.; Tao, F.; Aboelenein, R.; Amer, A. Improving Winter Wheat Yield Forecasting Based on Multi-Source Data and Machine Learning. Agriculture 2022, 12, 571. [Google Scholar] [CrossRef]
  23. Liu, T.; Zhang, Q.; Li, T.; Zhang, K. Dynamic Vegetation Responses to Climate and Land Use Changes over the Inner Mongolia Reach of the Yellow River Basin, China. Remote Sens. 2023, 15, 3531. [Google Scholar] [CrossRef]
  24. Feng, X.; Tian, J.; Wang, Y.; Wu, J.; Liu, J.; Ya, Q.; Li, Z. Spatio-Temporal Variation and Climatic Driving Factors of Vegetation Coverage in the Yellow River Basin from 2001 to 2020 Based on kNDVI. Forests 2023, 14, 620. [Google Scholar] [CrossRef]
  25. Cao, J.; Zhang, Z.; Luo, Y.; Zhang, L.; Zhang, J.; Li, Z.; Tao, F. Wheat yield predictions at a county and field scale with deep learning, machine learning, and google earth engine. Eur. J. Agron. 2021, 123, 126204. [Google Scholar] [CrossRef]
  26. Joshi, A.; Pradhan, B.; Chakraborty, S.; Behera, M.D. Winter wheat yield prediction in the conterminous United States using solar-induced chlorophyll fluorescence data and XGBoost and random forest algorithm. Ecol. Inform. 2023, 77, 102194. [Google Scholar] [CrossRef]
  27. Li, L.; Wang, B.; Feng, P.; Li Liu, D.; He, Q.; Zhang, Y.; Wang, Y.; Li, S.; Lu, X.; Yue, C.; et al. Developing machine learning models with multi-source environmental data to predict wheat yield in China. Comput. Electron. Agric. 2022, 194, 106790. [Google Scholar] [CrossRef]
  28. Chen, X.; Feng, L.; Yao, R.; Wu, X.; Sun, J.; Gong, W. Prediction of Maize Yield at the City Level in China Using Multi-Source Data. Remote Sens. 2021, 13, 146. [Google Scholar] [CrossRef]
  29. Liu, Y.; Wang, S.; Wang, X.; Chen, B.; Chen, J.; Wang, J.; Huang, M.; Wang, Z.; Ma, L.; Wang, P.; et al. Exploring the superiority of solar-induced chlorophyll fluorescence data in predicting wheat yield using machine learning and deep learning methods. Comput. Electron. Agric. 2022, 192, 106612. [Google Scholar] [CrossRef]
  30. Cheng, E.; Zhang, B.; Peng, D.; Zhong, L.; Yu, L.; Liu, Y.; Xiao, C.; Li, C.; Li, X.; Chen, Y.; et al. Wheat yield estimation using remote sensing data based on machine learning approaches. Front. Plant Sci. 2022, 13, 1090970. [Google Scholar] [CrossRef]
  31. Zhao, Y.; Xu, D.; Li, S.; Tang, K.; Yu, H.; Yan, R.; Li, Z.; Wang, X.; Xin, X. Comparative Analysis of Feature Importance Algorithms for Grassland Aboveground Biomass and Nutrient Prediction Using Hyperspectral Data. Agriculture 2024, 14, 389. [Google Scholar] [CrossRef]
  32. Fei, S.; Hassan, M.A.; Xiao, Y.; Su, X.; Chen, Z.; Cheng, Q.; Duan, F.; Chen, R.; Ma, Y. UAV-based multi-sensor data fusion and machine learning algorithm for yield prediction in wheat. Precis. Agric. 2023, 24, 187–212. [Google Scholar] [CrossRef]
  33. Kang, Y.; Ozdogan, M.; Zhu, X.; Ye, Z.; Hain, C.; Anderson, M. Comparative assessment of environmental variables and machine learning algorithms for maize yield prediction in the US Midwest. Environ. Res. Lett. 2020, 15, 064005. [Google Scholar] [CrossRef]
  34. Tian, H.; Wang, P.; Tansey, K.; Zhang, J.; Zhang, S.; Li, H. An LSTM neural network for improving wheat yield estimates by integrating remote sensing data and meteorological data in the Guanzhong Plain, PR China. Agric. For. Meteorol. 2021, 310, 108629. [Google Scholar] [CrossRef]
  35. Garibaldi-Márquez, F.; Flores, G.; Mercado-Ravell, D.A.; Ramírez-Pedraza, A.; Valentín-Coronado, L.M. Weed Classification from Natural Corn Field-Multi-Plant Images Based on Shallow and Deep Learning. Sensors 2022, 22, 3021. [Google Scholar] [CrossRef]
  36. Nevavuori, P.; Narra, N.; Lipping, T. Crop yield prediction with deep convolutional neural networks. Comput. Electron. Agric. 2019, 163, 104859. [Google Scholar] [CrossRef]
  37. Paudel, D.; de Wit, A.; Boogaard, H.; Marcos, D.; Osinga, S.; Athanasiadis, I.N. Interpretability of deep learning models for crop yield forecasting. Comput. Electron. Agric. 2023, 206, 107663. [Google Scholar] [CrossRef]
  38. Zhou, S.; Xu, L.; Chen, N. Rice Yield Prediction in Hubei Province Based on Deep Learning and the Effect of Spatial Heterogeneity. Remote Sens. 2023, 15, 1361. [Google Scholar] [CrossRef]
  39. Zhu, Y.; Wu, S.; Qin, M.; Fu, Z.; Gao, Y.; Wang, Y.; Du, Z. A deep learning crop model for adaptive yield estimation in large areas. Int. J. Appl. Earth Obs. Geoinf. 2022, 110, 102828. [Google Scholar] [CrossRef]
  40. Wang, Y.; Zhang, Z.; Feng, L.; Ma, Y.; Du, Q. A new attention-based CNN approach for crop mapping using time series Sentinel-2 images. Comput. Electron. Agric. 2021, 184, 106090. [Google Scholar] [CrossRef]
  41. Cao, J.; Zhang, Z.; Tao, F.; Zhang, L.; Luo, Y.; Zhang, J.; Han, J.; Xie, J. Integrating Multi-Source Data for Rice Yield Prediction across China using Machine Learning and Deep Learning Approaches. Agric. For. Meteorol. 2021, 297, 108275. [Google Scholar] [CrossRef]
  42. Lu, J.; Fu, H.; Tang, X.; Liu, Z.; Huang, J.; Zou, W.; Chen, H.; Sun, Y.; Ning, X.; Li, J. GOA-optimized deep learning for soybean yield estimation using multi-source remote sensing data. Sci. Rep. 2024, 14, 7097. [Google Scholar] [CrossRef] [PubMed]
  43. Xuan, F.; Dong, Y.; Li, J.; Li, X.; Su, W.; Huang, X.; Huang, J.; Xie, Z.; Li, Z.; Liu, H.; et al. Mapping crop type in Northeast China during 2013–2021 using automatic sampling and tile-based image classification. Int. J. Appl. Earth Obs. Geoinf. 2023, 117, 103178. [Google Scholar] [CrossRef]
  44. Modica, G.; Messina, G.; De Luca, G.; Fiozzo, V.; Praticò, S. Monitoring the vegetation vigor in heterogeneous citrus and olive orchards. A multiscale object-based approach to extract trees’ crowns from UAV multispectral imagery. Comput. Electron. Agric. 2020, 175, 105500. [Google Scholar] [CrossRef]
  45. Stamatiadis, S.; Taskos, D.; Tsadila, E.; Christofides, C.; Tsadilas, C.; Schepers, J.S. Comparison of passive and active canopy sensors for the estimation of vine biomass production. Precis. Agric. 2010, 11, 306–315. [Google Scholar] [CrossRef]
  46. Gao, Y.; Mas, J.F.; Navarrete, A. The improvement of an object-oriented classification using multi-temporal MODIS EVI satellite data. Int. J. Digit. Earth 2009, 2, 219–236. [Google Scholar] [CrossRef]
  47. Moreno, A.; Maselli, F.; Chiesi, M.; Genesio, L.; Vaccari, F.; Seufert, G.; Gilabert, M.A. Monitoring water stress in Mediterranean semi-natural vegetation with satellite and meteorological data. Int. J. Appl. Earth Obs. Geoinf. 2014, 26, 246–255. [Google Scholar] [CrossRef]
  48. Gu, Z.; Chen, X.; Ruan, W.; Zheng, M.; Gen, K.; Li, X.; Deng, H.; Chen, Y.; Liu, M. Quantifying the direct and indirect effects of terrain, climate and human activity on the spatial pattern of kNDVI-based vegetation growth: A case study from the Minjiang River Basin, Southeast China. Ecol. Inform. 2024, 80, 102493. [Google Scholar] [CrossRef]
  49. Smith, T.; Boers, N. Author Correction: Reliability of vegetation resilience estimates depends on biomass density. Nat. Ecol. Evol. 2024. [Google Scholar] [CrossRef]
  50. Wang, X.; Biederman, J.A.; Knowles, J.F.; Scott, R.L.; Turner, A.J.; Dannenberg, M.P.; Köhler, P.; Frankenberg, C.; Litvak, M.E.; Flerchinger, G.N.; et al. Satellite solar-induced chlorophyll fluorescence and near-infrared reflectance capture complementary aspects of dryland vegetation productivity dynamics. Remote Sens. Environ. 2022, 270, 112858. [Google Scholar] [CrossRef]
  51. Mahaut, L.; Choler, P.; Denelle, P.; Garnier, E.; Thuiller, W.; Kattge, J.; Lemauviel-Lavenant, S.; Lavorel, S.; Munoz, F.; Renard, D.; et al. Trade-offs and synergies between ecosystem productivity and stability in temperate grasslands. Glob. Ecol. Biogeogr. 2023, 32, 561–572. [Google Scholar] [CrossRef]
  52. Dai, A.; Zhao, T.; Chen, J. Climate Change and Drought: A Precipitation and Evaporation Perspective. Curr. Clim. Chang. Rep. 2018, 4, 301–312. [Google Scholar] [CrossRef]
  53. Cheng, M.; Jiao, X.; Jin, X.; Li, B.; Liu, K.; Shi, L. Satellite time series data reveal interannual and seasonal spatiotemporal evapotranspiration patterns in China in response to effect factors. Agric. Water Manag. 2021, 255, 107046. [Google Scholar] [CrossRef]
  54. Li, L.; Zeng, Z.; Zhang, G.; Duan, K.; Liu, B.; Cai, X. Exploring the Individualized Effect of Climatic Drivers on MODIS Net Primary Productivity through an Explainable Machine Learning Framework. Remote Sens. 2022, 14, 4401. [Google Scholar] [CrossRef]
  55. Chen, X.; Huang, Y.; Nie, C.; Zhang, S.; Wang, G.; Chen, S.; Chen, Z. A long-term reconstructed TROPOMI solar-induced fluorescence dataset using machine learning algorithms. Sci. Data 2022, 9, 427. [Google Scholar] [CrossRef] [PubMed]
  56. Gao, Y.; Jia, J.; Lu, Y.; Yang, T.; Lyu, S.; Shi, K.; Zhou, F.; Yu, G. Determining dominating control mechanisms of inland water carbon cycling processes and associated gross primary productivity on regional and global scales. Earth-Sci. Rev. 2021, 213, 103497. [Google Scholar] [CrossRef]
  57. Tan, K.P.; Kanniah, K.D.; Cracknell, A.P. On the upstream inputs into the MODIS primary productivity products using biometric data from oil palm plantations. Int. J. Remote Sens. 2014, 35, 2215–2246. [Google Scholar] [CrossRef]
  58. Tan, C.; Wang, D.; Zhou, J.; Du, Y.; Luo, M.; Zhang, Y.; Guo, W. Remotely Assessing Fraction of Photosynthetically Active Radiation (FPAR) for Wheat Canopies Based on Hyperspectral Vegetation Indexes. Front. Plant Sci. 2018, 9, 776. [Google Scholar] [CrossRef] [PubMed]
  59. Vaesen, K.; Gilliams, S.; Nackaerts, K.; Coppin, P. Ground-measured spectral signatures as indicators of ground cover and leaf area index: The case of paddy rice. Field Crops Res. 2001, 69, 13–25. [Google Scholar] [CrossRef]
  60. Zhao, J.; Guo, J.; Mu, J. Exploring the relationships between climatic variables and climate-induced yield of spring maize in Northeast China. Agric. Ecosyst. Environ. 2015, 207, 79–90. [Google Scholar] [CrossRef]
  61. Chen, X.; Chen, J.; Jia, X.; Somers, B.; Wu, J.; Coppin, P. A Quantitative Analysis of Virtual Endmembers’ Increased Impact on the Collinearity Effect in Spectral Unmixing. IEEE Trans. Geosci. Remote Sens. 2011, 49, 2945–2956. [Google Scholar] [CrossRef]
  62. Parmezan, A.R.S.; Souza, V.M.A.; Batista, G.E.A.P.A. Evaluation of statistical and machine learning models for time series prediction: Identifying the state-of-the-art and the best conditions for the use of each model. Inf. Sci. 2019, 484, 302–337. [Google Scholar] [CrossRef]
  63. Thirumal, S.; Latha, R. Automated Rice Crop Yield Prediction using Sine Cosine Algorithm with Weighted Regularized Extreme Learning Machine. In Proceedings of the 2023 7th International Conference on Intelligent Computing and Control Systems (ICICCS), Madurai, India, 17–19 May 2023; pp. 35–40. [Google Scholar]
  64. Canizo, M.; Triguero, I.; Conde, A.; Onieva, E. Multi-head CNN–RNN for multi-time series anomaly detection: An industrial case study. Neurocomputing 2019, 363, 246–260. [Google Scholar] [CrossRef]
  65. Liu, P.; Liu, J.; Wu, K. CNN-FCM: System modeling promotes stability of deep learning in time series prediction. Knowl.-Based Syst. 2020, 203, 106081. [Google Scholar] [CrossRef]
  66. Zhou, W.; Song, C.; Liu, C.; Fu, Q.; An, T.; Wang, Y.; Sun, X.; Wen, N.; Tang, H.; Wang, Q. A Prediction Model of Maize Field Yield Based on the Fusion of Multitemporal and Multimodal UAV Data: A Case Study in Northeast China. Remote Sens. 2023, 15, 3483. [Google Scholar] [CrossRef]
  67. Sun, Z.; Li, Q.; Jin, S.; Song, Y.; Xu, S.; Wang, X.; Cai, J.; Zhou, Q.; Ge, Y.; Zhang, R.; et al. Simultaneous Prediction of Wheat Yield and Grain Protein Content Using Multitask Deep Learning from Time-Series Proximal Sensing. Plant Phenomics 2022, 2022, 9757948. [Google Scholar] [CrossRef]
  68. Qiao, M.; He, X.; Cheng, X.; Li, P.; Zhao, Q.; Zhao, C.; Tian, Z. KSTAGE: A knowledge-guided spatial-temporal attention graph learning network for crop yield prediction. Inf. Sci. 2023, 619, 19–37. [Google Scholar] [CrossRef]
  69. Tian, H.; Wang, P.; Tansey, K.; Han, D.; Zhang, J.; Zhang, S.; Li, H. A deep learning framework under attention mechanism for wheat yield estimation using remotely sensed indices in the Guanzhong Plain, PR China. Int. J. Appl. Earth Obs. Geoinf. 2021, 102, 102375. [Google Scholar] [CrossRef]
  70. Zhao, Y.; He, J.; Yao, X.; Cheng, T.; Zhu, Y.; Cao, W.; Tian, Y. Wheat Yield Robust Prediction in the Huang-Huai-Hai Plain by Coupling Multi-Source Data with Ensemble Model under Different Irrigation and Extreme Weather Events. Remote Sens. 2024, 16, 1259. [Google Scholar] [CrossRef]
  71. Soriano-González, J.; Angelats, E.; Martínez-Eixarch, M.; Alcaraz, C. Monitoring rice crop and yield estimation with Sentinel-2 data. Field Crops Res. 2022, 281, 108507. [Google Scholar] [CrossRef]
  72. Wijewardana, C.; Reddy, K.R.; Bellaloui, N. Soybean seed physiology, quality, and chemical composition under soil moisture stress. Food Chem. 2019, 278, 92–100. [Google Scholar] [CrossRef] [PubMed]
  73. de Borja Reis, A.F.; Moro Rosso, L.; Purcell, L.C.; Naeve, S.; Casteel, S.N.; Kovács, P.; Archontoulis, S.; Davidson, D.; Ciampitti, I.A. Environmental Factors Associated With Nitrogen Fixation Prediction in Soybean. Front. Plant Sci. 2021, 12, 675410. [Google Scholar] [CrossRef] [PubMed]
  74. Di Mauro, G.; Cipriotti, P.A.; Gallo, S.; Rotundo, J.L. Environmental and management variables explain soybean yield gap variability in Central Argentina. Eur. J. Agron. 2018, 99, 186–194. [Google Scholar] [CrossRef]
  75. Kira, O.; Wen, J.; Han, J.; McDonald, A.J.; Barrett, C.B.; Ortiz-Bobea, A.; Liu, Y.; You, L.; Mueller, N.D.; Sun, Y. A scalable crop yield estimation framework based on remote sensing of solar-induced chlorophyll fluorescence (SIF). Environ. Res. Lett. 2024, 19, 044071. [Google Scholar] [CrossRef]
  76. Wang, C.; Liu, L.; Zhou, Y.; Liu, X.; Wu, J.; Tan, W.; Xu, C.; Xiong, X. Comparison between Satellite Derived Solar-Induced Chlorophyll Fluorescence, NDVI and kNDVI in Detecting Water Stress for Dense Vegetation across Southern China. Remote Sens. 2024, 16, 1735. [Google Scholar] [CrossRef]
  77. Xu, M.; Guo, B.; Zhang, R. A Novel Approach to Detecting the Salinization of the Yellow River Delta Using a Kernel Normalized Difference Vegetation Index and a Feature Space Model. Sustainability 2024, 16, 2560. [Google Scholar] [CrossRef]
  78. Hou, X.; Zhang, B.; Chen, J.; Zhou, J.; He, Q.-Q.; Yu, H. Response of Vegetation Productivity to Greening and Drought in the Loess Plateau Based on VIs and SIF. Forests 2024, 15, 339. [Google Scholar] [CrossRef]
Figure 1. Map of the study area and the planting regions for maize, rice, and soybeans in 2020.
Agriculture 14 00794 g001
Figure 2. Network structure of the CNN-LSTM-Attention model for crop yield prediction.
Agriculture 14 00794 g002
Figure 3. Comprehensive framework for crop yield prediction integrating multi-source data with machine- and deep-learning models.
Agriculture 14 00794 g003
Figure 4. The selected key variables for maize (a), rice (b), and soybean (c). Note: one asterisk (*), double asterisks (**), and threefold asterisks (***) indicate a correlation coefficient (r) with statistical significance levels of p-value < 0.05, 0.01, and 0.001, respectively.
Agriculture 14 00794 g004
Figure 5. Model performance in 2020 for maize yield prediction. The solid line is the fitted trend line, and the shaded area indicates the confidence interval.
Agriculture 14 00794 g005
Figure 6. Model performance in 2020 for rice yield prediction.
Agriculture 14 00794 g006
Figure 7. Model performance in 2020 for soybean yield prediction.
Agriculture 14 00794 g007
Figure 8. The official census yields of maize in 2020 and spatial pattern of yield predictions for 2020 by RF, XGBoost, CNN, and CNN-LSTM-Attention.
Agriculture 14 00794 g008
Figure 9. The official census yields of rice in 2020 and spatial pattern of yield predictions for 2020 by four models.
Agriculture 14 00794 g009
Figure 10. The official census yields of soybean in 2020 and spatial pattern of yield predictions for 2020 by four models.
Agriculture 14 00794 g010
Figure 11. Mean errors of maize yield prediction in 2020 by RF, XGBoost, CNN, and CNN-LSTM-Attention.
Agriculture 14 00794 g011
Figure 12. Mean errors of rice yield prediction in 2020 by four models.
Agriculture 14 00794 g012
Figure 13. Mean errors of soybean yield prediction in 2020 by four models.
Agriculture 14 00794 g013
Figure 14. Training and validation loss curves for the CNN-LSTM-Attention model applied to maize.
Agriculture 14 00794 g014
Figure 15. Training and validation loss curves for the CNN-LSTM-Attention model applied to rice.
Agriculture 14 00794 g015
Figure 16. Training and validation loss curves for the CNN-LSTM-Attention model applied to soybean.
Agriculture 14 00794 g016
Figure 17. Variable importance as derived from SHAP analysis of the CNN-LSTM-Attention model for maize (a), rice (b), and soybean (c).
Agriculture 14 00794 g017
Figure 18. R2 values for crop yield prediction models for maize, rice, and soybean in 2020.
Agriculture 14 00794 g018
Figure 19. RMSE for crop yield prediction models for maize, rice, and soybean in 2020.
Agriculture 14 00794 g019
Figure 20. MAPE for crop yield prediction models for maize, rice, and soybean in 2020.
Agriculture 14 00794 g020
Table 1. Sources of data.
Data TypeVariablesTime
Coverage
Spatial
Resolution
Data
Source
Crop statisticsYield data for maize, rice, and soybeans (kg/ha)2014–2020County/City LevelProvincial Statistics Bureaus
Planting areaCrop type maps2014–2021 30 mhttps://doi.org/10.6084/m9.figshare.20411424.v1 (accessed on 15 June 2023).
Vegetation indicesNDVI, EVI, NDWI, kNDVI2014–2020500 mMODIS
Environmental variablesPdsi, Pet, Pr, Soil, Tmmn, Tmmx, Vap2014–20214 kmTerraClimate
Photosynthetically active indicesSIF2014–20220.05°https://data.tpdc.ac.cn/
(accessed on 23 June 2023).
GPP, PsnNet, Fpar, LAI2014–2023500 mMODIS
Table 2. Hyperparameters tested and selected for each model.
ModelHyperparameterRange/Values TestedSelected Value
Random Forestn_estimators100, 200, 300200
min_samples_leaf1, 2, 44
random_stateFixed value2
XGBoostn_estimators100, 200, 300200
max_depth3, 6, 96
subsample0.6, 0.8, 10.8
colsample_bytree0.6, 0.8, 10.8
min_child_weight1, 3, 51
random_stateFixed value2
CNNfilters32, 64, 12864, 128
kernel_size3, 5, 73
pool_size2, 32
dense_layers1, 22
dense_neurons64, 128128, 64
learning_rate0.0001, 0.0006, 0.0010.0006
loss_functionMSE, MAE, HuberlossHuberloss
batch_size16, 32, 6432
epochs1000, 3000, 50005000
CNN-LSTM-Attentionfilters32, 64, 12864, 128
lstm_units50, 100, 150100
attention_size10, 50, 10050
learning_rate0.0001, 0.0006, 0.0010.0006
loss_functionMSE, MAE, HuberlossHuberloss
batch_size16, 32, 6432
epochs1000, 3000, 50005000
Table 3. Summary of preliminary experiments, hyperparameter tuning, and cross-validation processes.
Experiment TypeDescriptionResults
Preliminary ExperimentsInitial tests to determine the effectiveness of different model architectures (RF, XGBoost, CNN, and CNN-LSTM-Attention)CNN-LSTM-Attention showed the best performance with the highest R2 score.
Hyperparameter TuningGrid search and random search methods applied to identify the best hyperparameters for each modelOptimal hyperparameters were identified and listed in Table 2.
Cross-validationFive-fold cross-validation to evaluate the model performance and prevent overfittingStable and high R2 scores were achieved across all folds, indicating good generalization.
Table 4. Training and testing performance metrics for different crop models.
Crop TypeModelTraining DatasetTesting Dataset
R2RMSE
(kg/ha)
MAPE
(%)
R2RMSE
(kg/ha)
MAPE
(%)
MaizeRF0.75392.254.20%0.73435.094.42%
XGBoost0.74400.184.30%0.70457.044.92%
CNN0.80350.123.90%0.77394.674.30%
CNN-LSTM-Attentiom0.85320.453.70%0.80375.084.21%
RiceRF0.70610.306.00%0.62658.526.38%
XGBoost0.72580.245.80%0.67612.106.12%
CNN0.75550.125.40%0.70585.405.59%
CNN-LSTM-Attentiom0.80510.055.00%0.76519.074.67%
SoybeanRF0.60250.209.00%0.53277.079.80%
XGBoost0.62240.108.80%0.57264.889.58%
CNN0.75200.157.00%0.73210.967.13%
CNN-LSTM-Attentiom0.80180.106.50%0.78188.116.39%
Disclaimer/Publisher’s Note: The statements, opinions and data contained in all publications are solely those of the individual author(s) and contributor(s) and not of MDPI and/or the editor(s). MDPI and/or the editor(s) disclaim responsibility for any injury to people or property resulting from any ideas, methods, instructions or products referred to in the content.

