Article

Does Addressing Rural Energy Poverty Contribute to Achieving Sustainable Agricultural Development?

1
Agricultural Information Institute, Chinese Academy of Agricultural Sciences, Beijing 100081, China
2
Institute of Agricultural Economics and Development, Jiangsu Academy of Agricultural Sciences, Nanjing 210014, China
3
Division of Graduate Studies Administration, China Foreign Affairs University, Beijing 100091, China
*
Author to whom correspondence should be addressed.
These authors contributed equally to this work.
Agriculture 2024, 14(6), 795; https://doi.org/10.3390/agriculture14060795
Submission received: 16 April 2024 / Revised: 18 May 2024 / Accepted: 19 May 2024 / Published: 22 May 2024
(This article belongs to the Section Agricultural Economics, Policies and Rural Management)

Abstract

:
Promoting sustainable agricultural development is pivotal to realizing sustainable development goals. This study initially constructs a comprehensive indicator to delineate the landscape of agricultural sustainable development (ASD) across China. While ASD in China demonstrates an upward trajectory, it remains relatively low and exhibits disparities across regions. Ensuring food security with minimal energy consumption in agriculture is particularly critical for China, and fostering access to affordable and clean energy services in rural areas is essential for expediting the transition to sustainable agriculture. This study investigates the impact of rural energy poverty (REP) on ASD across 30 Chinese provinces from 2000 to 2017, revealing that the eradication of REP yields tangible benefits for ASD. Furthermore, considering regional disparities, the elimination of REP significantly enhances ASD, particularly in non-major grain-producing areas compared to major grain-producing regions. These findings underscore the imperative of integrating efforts to alleviate energy poverty with initiatives aimed at advancing ASD. Such integration is indispensable for driving the overarching transition toward sustainable agriculture.

1. Introduction

China has made remarkable strides in agricultural productivity since the implementation of reforms and its opening up. A series of agricultural reforms, including household production responsibility, the establishment of rural markets, regional self-sufficiency, and market orientation, have been instrumental in driving this progress [1]. Since 2003, the government has implemented measures such as the removal of relevant taxes and the issuance of supportive policies aimed at enhancing agricultural productivity and improving the welfare of rural residents [2,3]. These initiatives have injected fresh momentum into agricultural development, leading to a significant increase in total agricultural value-added from CNY 101.8 billion in 1978 to CNY 8308.5 billion in 2021, representing an impressive annual average growth rate of 10.7% (China Statistical Yearbook, CSY, 2022). Moreover, total grain output has seen a substantial increase, reaching 65 million tons in 2020, more than double the output recorded in 1978 [4].
While China has achieved significant agricultural output growth, it has also faced serious environmental challenges and ecological pressures due to the extensive production methods adopted in recent decades. Agricultural sustainable development (ASD) not only includes the development of agriculture and farmers’ income but also aims at promoting efficient energy use, reducing pollution, and adopting ecological agricultural production methods [5]. Moreover, the utilization of resources needs to be effective, which means achieving maximum yields with the minimum input of arable land, irrigation, and labor. Prioritizing ASD is crucial for achieving a balance between economic growth and ecological benefits [6,7]. However, the increased input of factors such as fertilizers, pesticides, and fossil fuels, considered the main drivers of Chinese agricultural growth [8], has led to significant resource wastage and environmental pollution [9]. Achieving ASD is crucial for agriculture-related sustainable development goals (SDGs). Specifically, SDG1 and SDG2 are directly linked to agricultural development. SDG1 focuses on eradicating poverty, and rural poverty is a significant aspect of global poverty. Enhancing agricultural productivity and income can directly reduce poverty among rural populations, who primarily depend on farming for their livelihoods. SDG2 aims to end hunger, achieve food security, improve nutrition, and promote sustainable agriculture. Increasing agricultural productivity and sustainability ensures a stable food supply, improves food security, and supports nutrition goals. This involves adopting practices that increase yields while preserving natural resources.
The use of agricultural chemical fertilizers, for example, has surged from 8840 thousand tons in 1978 to 5.2 million tons in 2021 (CSY, 2022), contributing significantly to agricultural non-point source pollution. Moreover, the scarcity of natural resources, with China’s average levels of arable land and freshwater being only half and one-third of the global average, respectively, has further exacerbated the issue. Furthermore, the low efficiency of resource utilization has resulted in agricultural chemical oxygen demand (COD), nitrogen, and phosphorus accounting for 49.8%, 46.5%, and 67.2% of total pollutant emissions, respectively [10]. These pollutants are directly discharged and inadequately recycled, making the agricultural sector the largest COD emitter in China, accounting for 17% of total greenhouse gas emissions. The shortage of resources and low environmental carrying capacity impose significant pressure on sustainable agricultural development [11].
Energy poverty significantly impacts agricultural sustainable development (ASD). Agriculture relies heavily on energy, necessitating electricity for irrigation, mechanization, processing, and storage of agricultural products. Insufficient energy access hampers farmers’ ability to efficiently plant, harvest, and process agricultural goods, resulting in decreased yields and potential crop losses, thereby jeopardizing sustainable development. In rural areas, biomass fuels like firewood and straw are commonly used for cooking and heating. Energy poverty-induced shortages in biomass fuel supply and higher fuel prices can escalate living costs for rural households, undermining their sustainability. Moreover, energy poverty can constrain the diversity of rural livelihoods. The lack of electricity and fuel can hinder farmers from pursuing supplementary income-generating activities related to agriculture, increasing their dependence on farming and reducing their resilience to sustainable development.
China’s agricultural development heavily relies on energy supply, which is a key factor contributing to its unsustainable mode. Energy is indispensable for various processes in agricultural production [12]. Direct energy consumption encompasses coal, gas, diesel, and electricity used for farm mechanization, irrigation, harvesting, transportation, and storage [13]. Additionally, there is indirect energy consumption within the agricultural sector, notably from agrochemicals, including the overuse of fertilizers and pesticides. Moreover, the low efficiency of energy utilization exacerbates agriculture’s dependence on energy consumption [14]. Compounded by severe energy poverty issues, agricultural production in China relies more on traditional energy sources than renewable, clean energy [15]. This heavy reliance on traditional energy consumption exerts significant pressure on agricultural sustainable development (ASD) in China.
According to a study by Lin and Wang [16], approximately 18.9% of the population in China experiences energy poverty. The excessive dependence on traditional energy sources and the inadequate availability of renewable energy in many countries have constrained opportunities for agricultural sustainable development (ASD). Therefore, eliminating energy poverty is not only crucial for improving people’s well-being but also essential for ensuring economic sustainability [17]. Since 2017, China has implemented the Rural Revitalization Strategy, leading to the adoption of effective measures aimed at lifting rural populations out of energy poverty. The government has intensified efforts in energy infrastructure construction and the promotion of clean energy [18]. For instance, rural electricity consumption has increased significantly, from 242.1 billion kWh in 2000 to 971.7 billion kWh in 2020, as reported by the National Bureau of Statistics of China (NBSC).
Existing literature has extensively explored factors influencing agricultural sustainable development (ASD), including economic development levels, infrastructure investment [14], technological innovation [19,20], human capital [21], rural financial inclusion [22], and farmers’ perception of sustainability [23,24]. However, there appears to be an underestimation of the impact of rural energy poverty (REP) on ASD, highlighting the need for more in-depth research in this area. Understanding the relationship between REP and ASD is crucial for policymakers to recognize the significance of mitigating REP to promote ASD.
This study aims to contribute to the literature in three key aspects. Firstly, it employs the Improved Entropy Method (IEM) to establish a comprehensive ASD index, providing an overarching view of China’s ASD based on a dataset covering 30 provinces from 2000 to 2017. Secondly, this study investigates the impact of REP eradication on ASD through multiple estimations, exploring the underlying mechanisms. This not only enhances comprehension of the link between REP and ASD but also offers theoretical and empirical support for policy formulation to advance ASD. Thirdly, adopting the perspective of regional grain output nature, this study conducts a regional heterogeneity analysis, comparing the effect of REP eradication on ASD between major grain-producing areas and non-major grain-producing areas. This analysis aims to provide insights for the government to devise targeted policies conducive to achieving ASD in different regions.
Studying the relationship between energy poverty and agricultural sustainability in China holds significant global implications. First, as one of the most populous countries globally, China’s energy use and agricultural development significantly impact global resource consumption and environmental effects. A thorough understanding of the link between energy poverty and agricultural sustainability in China can offer policy guidance and serve as a valuable reference for other developing nations. Second, China’s energy consumption and agricultural activities have substantial environmental implications. Research on energy poverty and agricultural sustainability in China can help identify effective ways to reduce environmental pollution and carbon emissions, contributing to global environmental protection efforts.
The remainder of this study is organized as follows: Section 2 presents a review of the existing literature. Section 3 constructs a comprehensive index of ASD and analyzes the index. Section 4 presents the model, methodology, and data. Section 5 reports and analyzes the empirical results. Section 6 provides further discussion. Section 7 concludes this study and draws policy implications.

2. Literature Review

2.1. Agricultural Sustainable Development and Its Measurement

Sustainable development, as advocated by the World Commission on Environment and Development (WECD) in 2017, is defined as “development that meets the needs of the present without compromising the ability of future generations to meet their own needs” [25]. Similarly, agricultural development should not come at the expense of future generations. Depletion of natural resources and ecological degradation pose significant threats to agricultural sustainable development (ASD). A sustainable agricultural model aligns with environmental carrying capacity while fulfilling present-day living and production demands [14,26]. Enhancing the protection and utilization of resources, steadily improving agricultural quality and sustainability, and gradually establishing a green development support system are essential aspects of ASD. These efforts contribute to maintaining a balance between human needs and agricultural conservation [27,28].
Scholars have conducted extensive studies to measure agricultural sustainable development (ASD). Koohafkan et al. [29] propose that ASD encompasses the sovereignty of food, energy, and technology. Veisi et al. [30] developed a hierarchical network, employing indicators such as government policies, natural resources, agricultural production systems, and farmers’ behaviors using the Analytic Hierarchy Process (AHP) method. Indeed, while numerous scholars have attempted to measure agricultural sustainable development (ASD), there is a lack of a universally unified method. Consequently, conducting a comprehensive evaluation of ASD holds significant value in developing an integrated understanding of the actual agricultural condition. Such an approach can help researchers and policymakers gain insights into the multifaceted nature of agricultural sustainability, facilitating informed decision-making and effective interventions aimed at promoting sustainable agricultural practices.

2.2. Studies on the Influencing Factors of Agricultural Sustainable Development

The influencing factors of agricultural sustainable development (ASD) have garnered significant attention from researchers across various countries and regions. Hu et al. [6] assess sustainable agriculture and rural development in the Beijing–Tianjin–Hebei region of China and identify that irrational land expansion and industrial development can detrimentally impact ASD. Employing a qualitative research approach, Piao et al. [31] determine that agricultural technology training and access to financial support can enhance ASD. Zhang et al. [32] utilize provincial panel data from 1997 to 2019 to evaluate ASD in China, revealing that limited arable land is a primary constraint on ASD, while agricultural, industrial agglomeration, and industrial structure upgrading can promote ASD. The impact of agricultural industrial structure on ASD is also affirmed by Liu et al. [14]. Chopra et al. [33] employ Mean Group class estimators to investigate the drivers of sustainable agriculture in the Association of Southeast Asian Nations (ASEAN), finding that forest area and natural resources have a negative impact on ASD, whereas renewable energy consumption has a positive one. Specifically, a 1.37% and 1.54% decline in agricultural productivity is caused by a 1% increase in natural resource rents and forest area, respectively, while if renewable energy increases by one percent, agricultural productivity significantly increases by 0.67%. Yang et al. [34] ascertain that ASD can be effectively improved through strengthening agricultural production infrastructure construction and human capital investment. However, they also observe that public investment in agricultural research and development may adversely affect ASD. Hessari and Oweis [35] conclude that supplementary irrigation can mitigate water scarcity caused by insufficient rainfall and drought, thereby ensuring adequate water supply for crop production and promoting sustainable development. Conducting a survey of agricultural enterprises, Pan et al. [36] discovered that enterprise policies concerning environmental management can incentivize the adoption of green technology and stimulate green innovation, resulting in the production of more green agricultural products and the achievement of agricultural sustainable development. The positive effect of environmental protection policies on ASD is further corroborated by Niyigaba et al. [37], who arrived at similar findings in Rwanda. Moreover, Liu et al. [14] find that technological improvement and increased public investments in agriculture positively influence agricultural eco-efficiency. Additionally, technological capital and climate change have been identified as important factors affecting ASD [38]. Shu et al. [39] integrated water and land into the nexus analysis and found that the increasing agricultural virtual land and water resources embodied in the grain trade limit the sustainable development of the North China Plain. Feng et al. [40] find that the improvement of irrigation efficiency and mechanization can contribute to the decrease in agricultural CO2 emissions per hectare. Yang and Solangi [41] conclude that economic viability, policy, governance, and environmental effects emerge as the most important factors for sustainable development in China.

2.3. Studies on the Nexus of Rural Energy Poverty and Agricultural Sustainable Development

Given the pivotal role of energy in driving economic growth, energy-related issues have long been a focal point for scholars, particularly energy poverty and its correlation with the economy [17,42,43,44]. As per the United Nations Development Program (UNDP), energy poverty refers to the inadequacy of energy services characterized by environmental friendliness and good quality. Wang et al. [45] conducted a comprehensive assessment of energy poverty and found it to have a detrimental effect on the economy. Acharya and Sadath [46] measure energy poverty in India and demonstrate that economic growth decelerates with an increase in energy poverty. Amin et al. [47] also assert that energy poverty impedes economic growth and social progress.
Against the backdrop of “big country, smallholder farmers”, energy poverty is closely intertwined with agricultural production in China [48,49]. Energy input serves as a significant catalyst for agricultural growth [50] and directly influences agricultural productivity [51]. Some researchers contend that energy poverty exacerbates agricultural productivity declines as higher energy prices stifle agricultural production [52]. Farming operations are impacted by energy poverty, potentially leading to decreased crop yields or even crop failure [53]. Some scholars argue that the introduction of renewable energy targets and incentives for businesses to invest in renewable energy sources is important for agricultural sustainable development [54]. Azam et al. [55] find that a 1% increase in renewable energy would increase agricultural productivity. However, there appears to be a paucity of studies focusing on the nexus between rural energy poverty (REP) and agricultural sustainable development (ASD).

2.4. Literature Gaps

Many researchers have assessed the state of agricultural sustainable production in China and evaluated ASD by constructing composite indices at the national level. However, few studies have comprehensively measured ASD from multiple perspectives using provincial datasets, which would provide a meaningful supplement to the existing indicator system. Regarding the nexus between energy poverty and sustainable development, existing literature typically investigates the correlation between energy poverty and economic growth or between energy poverty and agricultural production. Few studies delve into the influence of rural energy poverty (REP) on agricultural sustainable development (ASD). Given the heightened priority placed on ASD, investigating the impact of REP on ASD and exploring the influencing channels are of paramount importance for policy formulation aimed at achieving sustainable agricultural development.

3. Agricultural Sustainable Development Index Construction

China’s agricultural achievements have ensured national food security and laid a solid foundation for stable development. However, the extensive agricultural production pattern has also led to severe environmental and ecological problems. Therefore, achieving sustainable agricultural growth is crucial to improving people’s livelihoods and environmental quality. To date, scholars have used various methods to estimate agricultural sustainable growth, such as the Agricultural Total Factor Productivity (AGTFP), the Inequality-adjusted Human Development Index (HDI), and the Inclusive Wealth Index. However, these indexes often focus on limited aspects of agricultural sustainable growth. This study proposes a comprehensive index to proxy agricultural sustainable development (ASD) from multiple perspectives.
ASD aims to conserve energy, reduce pollution, and develop in a high-quality and high-efficiency manner. Accordingly, the index is composed of three indicators (see Table 1): agricultural growth and farmers’ welfare, agricultural environmental effect, and agricultural resource input and return. Data for various indicators are retrieved from the National Bureau of Statistics of China (NBSC) for 30 provinces, excluding Taiwan, Hong Kong, Macau, and Tibet, due to data availability. (1) Agricultural Growth and Farmers’ Welfare: This indicator reflects the trend of agricultural growth and farmers’ living standards. It comprises two indicators (agricultural growth rate and farmers’ quality of life) and four measurements. (2) Agricultural Environmental Effect: This indicator assesses the relationship between agriculture and the environment. It comprises two indicators (agricultural input intensity and agricultural greenhouse effect) and four measurements. (3) Agricultural Resource Input and Return: This indicator represents the situation of agricultural resource usage and its return. It is measured in two dimensions (agricultural resource utilization and agricultural productivity) and four specific sub-indexes.
After the construction of the indicator system, the ASD index is measured by IEM. This is an effective method to assign objective weights to the indicators and obtain a comprehensive index [15,56,57]. The calculating process is as follows:
First, we normalize the ASD indicators to eliminate the inconsistency of indicators in different dimensions:
X i j = X i j min ( X 1 j ,   ,   X n j ) max X 1 j ,   ,   X n j min ( X 1 j ,   ,   X n j )
X i j = max X 1 j ,   ,   X n j X i j max X 1 j ,   ,   X n j min ( X 1 j ,   ,   X n j )
where i = 1, …, n, indicates the 30 provinces and j = 1, …, m, indicates the indicators. X i j is the normalized value. X max is the maximum value, and X min is the minimum value. The indicator is a positive or negative one based on the property of the indicator assigned to benefit or cost. The normalization methods for positive indicators are shown in Equation (1), and the negative indicators in Equation (2).
Second, we calculate the ratio of the standardized value of an indicator to the information entropy:
e j = k i = 1 n X i j i = 1 n X i j l n ( X i j i = 1 n X i j )
where k = 1 ln n > 0 ;   e j 0. We define X i j i = 1 n X i j as p i j .
Third, the ASD index in China is gauged on the basis of Equation (3) as follows:
A S D i = j = 1 m 1 e j j = 1 m 1 e j   · p i j
The ASD index calculation results range from 0 to 1, where a higher ASD value indicates a higher level of sustainable agricultural development and a lower value indicates the opposite.
After establishing the ASD indicator system, the ASD index is obtained for each province in the sample. According to the results illustrated in Figure 1, the overall ASD index is generally lower than 0.6, which is at a relatively low level. The ASD index shows a decreasing trend from 2000 to 2009 and then gradually increases from then on to 2017. As for the sub-indexes, agricultural growth and farmers’ welfare show a gradual upward trend, which means agricultural growth and farmers’ welfare have been rising slowly. The agricultural environmental effect is decreasing rapidly in this period, indicating that the environmental burden of agricultural production is reducing. Agricultural resource input and return show an obvious ascending trend, denoting that agricultural resource efficiency and productivity have been improving rapidly. The reason that the ASD index is not high is that the development of cities and industries has been given so many priorities by the Chinese government in recent decades. Rapid urbanization has attracted a large quantity of finance, talent, and resources to the cities. Although China has begun to implement the Rural Revitalization Strategy and construct an ecological civilization, there is still quite a long way to go to fill the rural–urban gaps and restore the natural ecological environment. Figure 2 depicts the ASD indexes of the 30 provinces in 2017 and their changes during the sample period. In 2017, the top five provinces were Zhejiang, Beijing, Jiangsu, Heilongjiang, and Fujian, with the indexes reaching 0.591, 0.580, 0.569, 0.558, and 0.548, respectively. In contrast, Yunnan, Guizhou, Ningxia, Shanxi, and Gansu are at the lowest level of ASD, where the indexes are only 0.313, 0.310, 0.309, 0.288, and 0.269, respectively. Compared to 2000, Tianjin, Anhui, Xinjiang, and Zhejiang made great progress in 2017.
To obtain a clear and overall trend of China’s ASD, the spatial map of ASD is presented in Figure 3. By comparing the four maps, it can be obviously seen that the overall ASD shows a significant upward trend. Also, ASD is not balanced across the regions, showing a significant strengthening trend from the west to the east. The five provinces with the lowest level of ASD are all situated in central and western China and inland. ASD is much higher in the Eastern region, and this is because although the cities and industry consume large amounts of energy, which may deteriorate the environment and inhibit sustainable growth, a sound economic foundation and a higher level of clean technology may help to mitigate the negative situation. Additionally, the superior geographical and economic advantages in Eastern regions are strong and play a role in feeding agriculture and rural areas, providing a solid material base for ASD. On the contrary, there are a lot of difficulties to overcome in the Western region. The spreading mountains and valleys are making the natural environment much more severe. Meanwhile, the infrastructure is lagging behind, making it hard to find the flow of factors and the exchange of technologies. Moreover, a large proportion of rural people relying on agriculture reside in remote and isolated areas, and their motivation to adopt modern and green technologies is not strong. The spatial map of the three sub-indexes, i.e., agricultural growth and farmers’ welfare, agricultural environmental effect, and agricultural resource input and return, are also provided in Figure A1, Figure A2, and Figure A3, respectively. The trends of the three sub-indexes show the same characteristics as the index of agricultural sustainable development.

4. Model and Data

4.1. Equation Specification

According to the above studies, in order to empirically check the impact of REP on ASD in China, REP is the independent variable, and ASD is the dependent variable. Economic growth, the inflow of foreign direct investment (FDI), urbanization, and agricultural R&D are often identified as key factors affecting ASD, according to previous literature [12,34,58,59]. The multivariate regression framework will be constructed as follows:
A S D i t = f R E P i t , P G D P i t , F D I i t , U R i t , R D i t
where A S D i t represents the level of ASD in 30 provinces in China; R E P i t indicates the rural energy poverty; P G D P i t denotes gross domestic product per capita; F D I i t denotes the inflow of FDI; U R i t indicates the urbanization rate; R D i t denotes the intensity of research investment, measured by dividing agricultural R&D by total agricultural value added.
The natural logarithm processing is employed for all the variables except A S D i t and R E P i t . The reason for taking the logarithm of the data is to reduce the range of variability in the variables and prevent heteroscedasticity. The equation is illustrated in Equation (6):
A S D i t = β 0 + β 1 R E P i , t + β 2 l n P G D P i t + β 3 l n F D I i t + β 4 l n U R i t + β 5 l n R D i t + ε i t
where β 0 β 5 represent the estimated coefficients; β 0 represents the intercept term; ε i t is the random disturbance term.

4.2. Data Source

Considering data availability, this study uses a balanced panel dataset of 30 Chinese provinces covering 2000–2017 (Tibet, Hong Kong, Macao, and Taiwan are excluded). For the research variables, ASD is calculated in Section 3. The data for REP are obtained from the work of Li et al. [60]. To empirically analyze the mechanism of the impacts of REP on ASD, the data of sub-indexes of REP are also obtained by referring to Li et al. [60], i.e., rural energy service availability, rural energy consumption cleanliness, and rural energy management completeness. The trend of the comprehensive REP index and the three sub-indexes is depicted in Figure 4. REP shows an apparent growing trend, which means that REP in China has greatly alleviated. For the sub-indexes, rural energy service availability shows the fastest growth during 2000–2017 compared to the other two indexes. This implies that energy usage in agricultural production and rural living has increased remarkably. In addition, rural energy consumption cleanliness shows no significant change, and rural energy management completeness shows relatively obvious fluctuations. For the control variables, the data are obtained from the China Statistical Yearbook and the China Statistical Yearbook on Science and Technology. The descriptive statistics of all the variables are presented in Table 2 by using Stata17 software (StataCorp, Lakeway Drive, TX, USA).

5. Results of the Empirical Analysis

5.1. Benchmark Regression

This study assesses the impact of REP on ASD in China by estimating Equation (6). Table 3 illustrates the results of the regression of pooled ordinary least squares (OLSs), fixed effect (FE), random effect (RE), panel corrected standard errors (PCSE), and feasible generalized least squares (FGLS). In order to choose the benchmark regression, it is necessary to test the applicability of the methods. Although conventional panel estimations like pooled OLS and RE have unbiased and consistent estimated coefficients, they are not BLUE (i.e., the best linearly biased estimators). Therefore, we use FE to make further estimations. FE can solve the unobservable regional or temporal heterogeneity under the strict exogenous assumption [61]. However, as economic integration and communications among the regions become closer, there may be a cross-sectional correlation among the sample units. Thus, this study deploys the Pesaran cross-sectional dependence (CD) test [62], the Friedman test [63], and the Frees test [64] for the cross-sectional dependence test. Table 4 illustrates the main test results. The p-value of the test results is significant at the 1% level, indicating that we cannot accept the null hypothesis about no cross-sectional independence. In this case, the FE model may lead to inconsistent and biased results. To solve the problem, we utilized PCSE and FGLS to investigate the impact of REP on ASD. Since FGLS regression is more effective [65,66], this study takes the FGLS as the benchmark regression.
The benchmark regression reveals a noteworthy finding: a 1% decrease in rural energy poverty (REP) corresponds to a 0.027% increase in agricultural sustainable development (ASD) in China. This underscores the significant contribution of addressing rural energy poverty to the advancement of agricultural sustainability. Despite this positive correlation, rural energy poverty remains pervasive in rural areas, where access to clean fuels and efficient energy facilities is limited. Environmentally friendly energy sources are often inadequate for rural residents, leading to a reliance on traditional biomass fuels such as coal. These fuels are characterized by low energy density and high pollution levels. Moreover, traditional agricultural practices persist in China, with smallholders remaining the primary agricultural operators. These practices often involve a scattered distribution of agricultural activities. Addressing these challenges and transitioning to more sustainable energy sources and agricultural practices will be crucial for further enhancing agricultural sustainability in China.
The prevalence of rough and scattered farming methods in China has resulted in extensive biomass energy usage throughout the agricultural production process, encompassing activities such as seedling raising, sowing, irrigation, fertilizing, and harvesting. However, the adoption of clean energy in agricultural production is hindered by the small-scale nature of production. To address this challenge, the Chinese government has implemented various initiatives to promote energy popularization and increase renewable energy coverage in the agricultural sector. These efforts include providing financial subsidies and offering tax incentives to encourage the use of renewable energy sources. In 2019 alone, China invested approximately USD 83.4 billion in renewable energy, accounting for approximately 30% of global investment in this sector, according to data from the United Nations Environment Programme. China also boasts considerable technical expertise in renewable energy, positioning itself as a leader in global markets. Furthermore, the eradication of energy poverty has been incorporated into China’s long-term development plans. The development of rural energy infrastructure, particularly the expansion of renewable energy supply and consumption, is not only essential for China to achieve its commitments to carbon peak and carbon neutrality on the global stage but also imperative for driving economic and social sustainability domestically. By addressing rural energy poverty, agricultural production in China can become more efficient, productive, and environmentally friendly, contributing to overall sustainable development efforts.
Regarding the control variables, economic growth is conducive to improving ASD as the coefficient of lnPGDP is strongly positive, which is also intuitive. The development of the economy will provide more factors and resources for the agricultural sector, making agricultural production more efficient and improving the ecological green level. The result is consistent with Chen et al. [67]. It enlightens that continuous economic development is vital to achieving agro-ecological green benefits. The coefficient on lnFDI is negative at a 1% significant level, meaning that FDI in China is detrimental to ASD. As a matter of fact, foreign investment in China mainly flows into the energy-intensive secondary industry and urban areas rather than the agricultural sector and rural areas. Thus, FDI will be harmful to achieving ASD if the current situation is not changed [68]. Urbanization exerts a significant inhibitory effect on ASD, as a 1% rise in lnUR causes a 0.103% decrease in ASD. The result coincides with Liu et al. [69] and Raihan et al. [70]. Factors and resources are extracted from the rural areas with the migration from rural areas to cities, such as labor forces and capital. Under the fast urbanization of China, a large number of women, children, and the elderly have been left behind in the countryside to engage in agricultural production. It is more difficult for these people to embrace new technologies and adopt clean production models. Also, they tend to be unwilling to adopt new agricultural technologies. Agricultural R&D investment intensity has a positive effect on ASD. R&D input is the source of total factor productivity growth. This proves that higher agricultural R&D expenditure stimulates input-use efficiency in agriculture. This finding implies that R&D investment and the promotion of green agricultural technologies are important strategic choices for China to achieve ASD.

5.2. Robustness Tests

In this section, the robustness test is carried out to verify the reliability of the estimated parameters and solve the potential endogeneity problems. The independent variable, i.e., REP, is replaced by rural electricity consumption. The estimation results are presented in Table 5. Obviously, the results are basically consistent with the benchmark regression, in which the directions and significances of the core independent variables are similar. The results indicate that the benchmark results are robust and reliable.

6. Further Discussion

6.1. The Mechanism Analysis of the Impact of Rural Energy Poverty on Agricultural Sustainable Development

In this section, we further analyze the heterogeneous influencing channels of REP on ASD. Specifically, the impacts of three sub-indexes of REP, i.e., rural energy service availability, rural energy consumption cleanliness, and rural energy management completeness on ASD, are assessed by estimating Equation (6) with the FGLS estimator (see Table 6).
Rural energy service availability denotes the affordability of energy services for rural residents and the energy supply capacity for agricultural production. Rural energy consumption cleanliness shows the upgrading of rural energy structures and refers to the transition of energy consumption from traditional energy to clean and modern energy. Rural energy management completeness represents the level of rural energy management. The results suggest that rural energy service availability has a significant adverse effect on ASD, as indicated by the significantly negative coefficient. This variable primarily measures the availability of energy consumption for agricultural production and rural residential living, including rural electricity consumption. This adverse effect may stem from the fact that while improved rural energy service availability signifies a reduction in energy poverty, it may also indicate increased energy consumption in the agricultural sector and rural areas. The heavy reliance on energy in agriculture contradicts the goal of achieving low energy consumption as part of ASD objectives.
Although the coefficients for rural energy consumption cleanliness are statistically insignificant, they exhibit a negative relationship with ASD. Rural energy consumption cleanliness reflects the transition of rural residents from traditional and non-renewable energy sources to clean and renewable energy alternatives. The negative impact observed suggests that rural communities in China continue to depend heavily on traditional fossil fuels, highlighting the need to optimize and upgrade the rural energy consumption structure to align with ASD goals.
The last two columns of Table 7 depict the effect of rural energy management completeness on ASD. A 1% increase in rural energy management completeness corresponds to a 0.018% increase in ASD. Rural energy management completeness reflects the expansion of energy administration and the development of relevant agencies in rural areas. The robust development of rural energy management completeness in recent years has attracted more capital into agricultural energy sectors and strengthened supervision, thereby promoting ASD.
Improving energy consumption efficiency can significantly enhance agricultural sustainability. For example, better management institutions tend to facilitate the construction of energy infrastructure, particularly in remote rural areas. Additionally, in rural regions, investments in natural gas infrastructure have been prioritized, with its widespread adoption expected to facilitate the transition to sustainable agriculture.

6.2. Regional Heterogeneity Analysis across Different Regions

Based on the analysis, it is evident that alleviating REP contributes to improving ASD in China. However, due to significant variations in climatic, geographical, and socioeconomic conditions across regions, the impact of REP on ASD may differ. In the heterogeneity analysis, the sample is divided into major grain-producing areas and non-major grain-producing areas to effectively examine the variability of the impact. This differentiation is important because the energy needs and agricultural practices may differ significantly between these regions, leading to varying effects on sustainable development. By employing FGLS, the effects of REP on ASD are examined in both regions, and the results are compared with those obtained from FE (see Table 7). The estimation results for the subpanels align with those of the full sample. However, REP exhibits a more pronounced effect on ASD in non-major grain-producing areas compared to major grain-producing areas. Specifically, the absolute value of the coefficient on REP in non-major grain-producing areas is nearly five times higher than that in major grain-producing areas.
Indeed, the ASD landscape in major grain-producing areas differs significantly from that in non-major grain-producing areas. Major grain-producing areas benefit from favorable agricultural conditions, ensuring an ample food supply. To sustain and enhance agricultural productivity, these regions impose restrictions on land use, limiting large-scale industrialization and urbanization. Major grain-producing areas play a pivotal role in national grain production, contributing a substantial portion of total grain output and sown area. Given the imperative of meeting food demands, major grain-producing areas heavily rely on energy-intensive agricultural practices. Energy consumption for agricultural machinery, particularly irrigation systems, has increased substantially over the years. However, reliance on traditional fossil fuels persists, impeding efforts towards ASD. Despite being the nation’s breadbasket, major grain-producing areas face challenges in swiftly improving soil and water conservation, land utilization efficiency, and pollution control. As rural energy poverty ameliorates, its incremental impact on ASD appears to diminish in major grain-producing areas. The entrenched reliance on traditional energy sources, coupled with the complexities of agricultural sustainability, poses formidable obstacles to rapid progress in these regions.

7. Conclusions and Policy Implications

This study first builds up a comprehensive index to evaluate the level of ASD. Then, the link between REP and ASD is tested based on a panel dataset of 30 Chinese provinces from 2000 to 2017. Also, the mechanism of impact is investigated by using three sub-indexes of REP. Also, the paper investigates the heterogeneous impact between major grain-producing areas and non-major grain-producing areas. The conclusions are as follows:
(1)
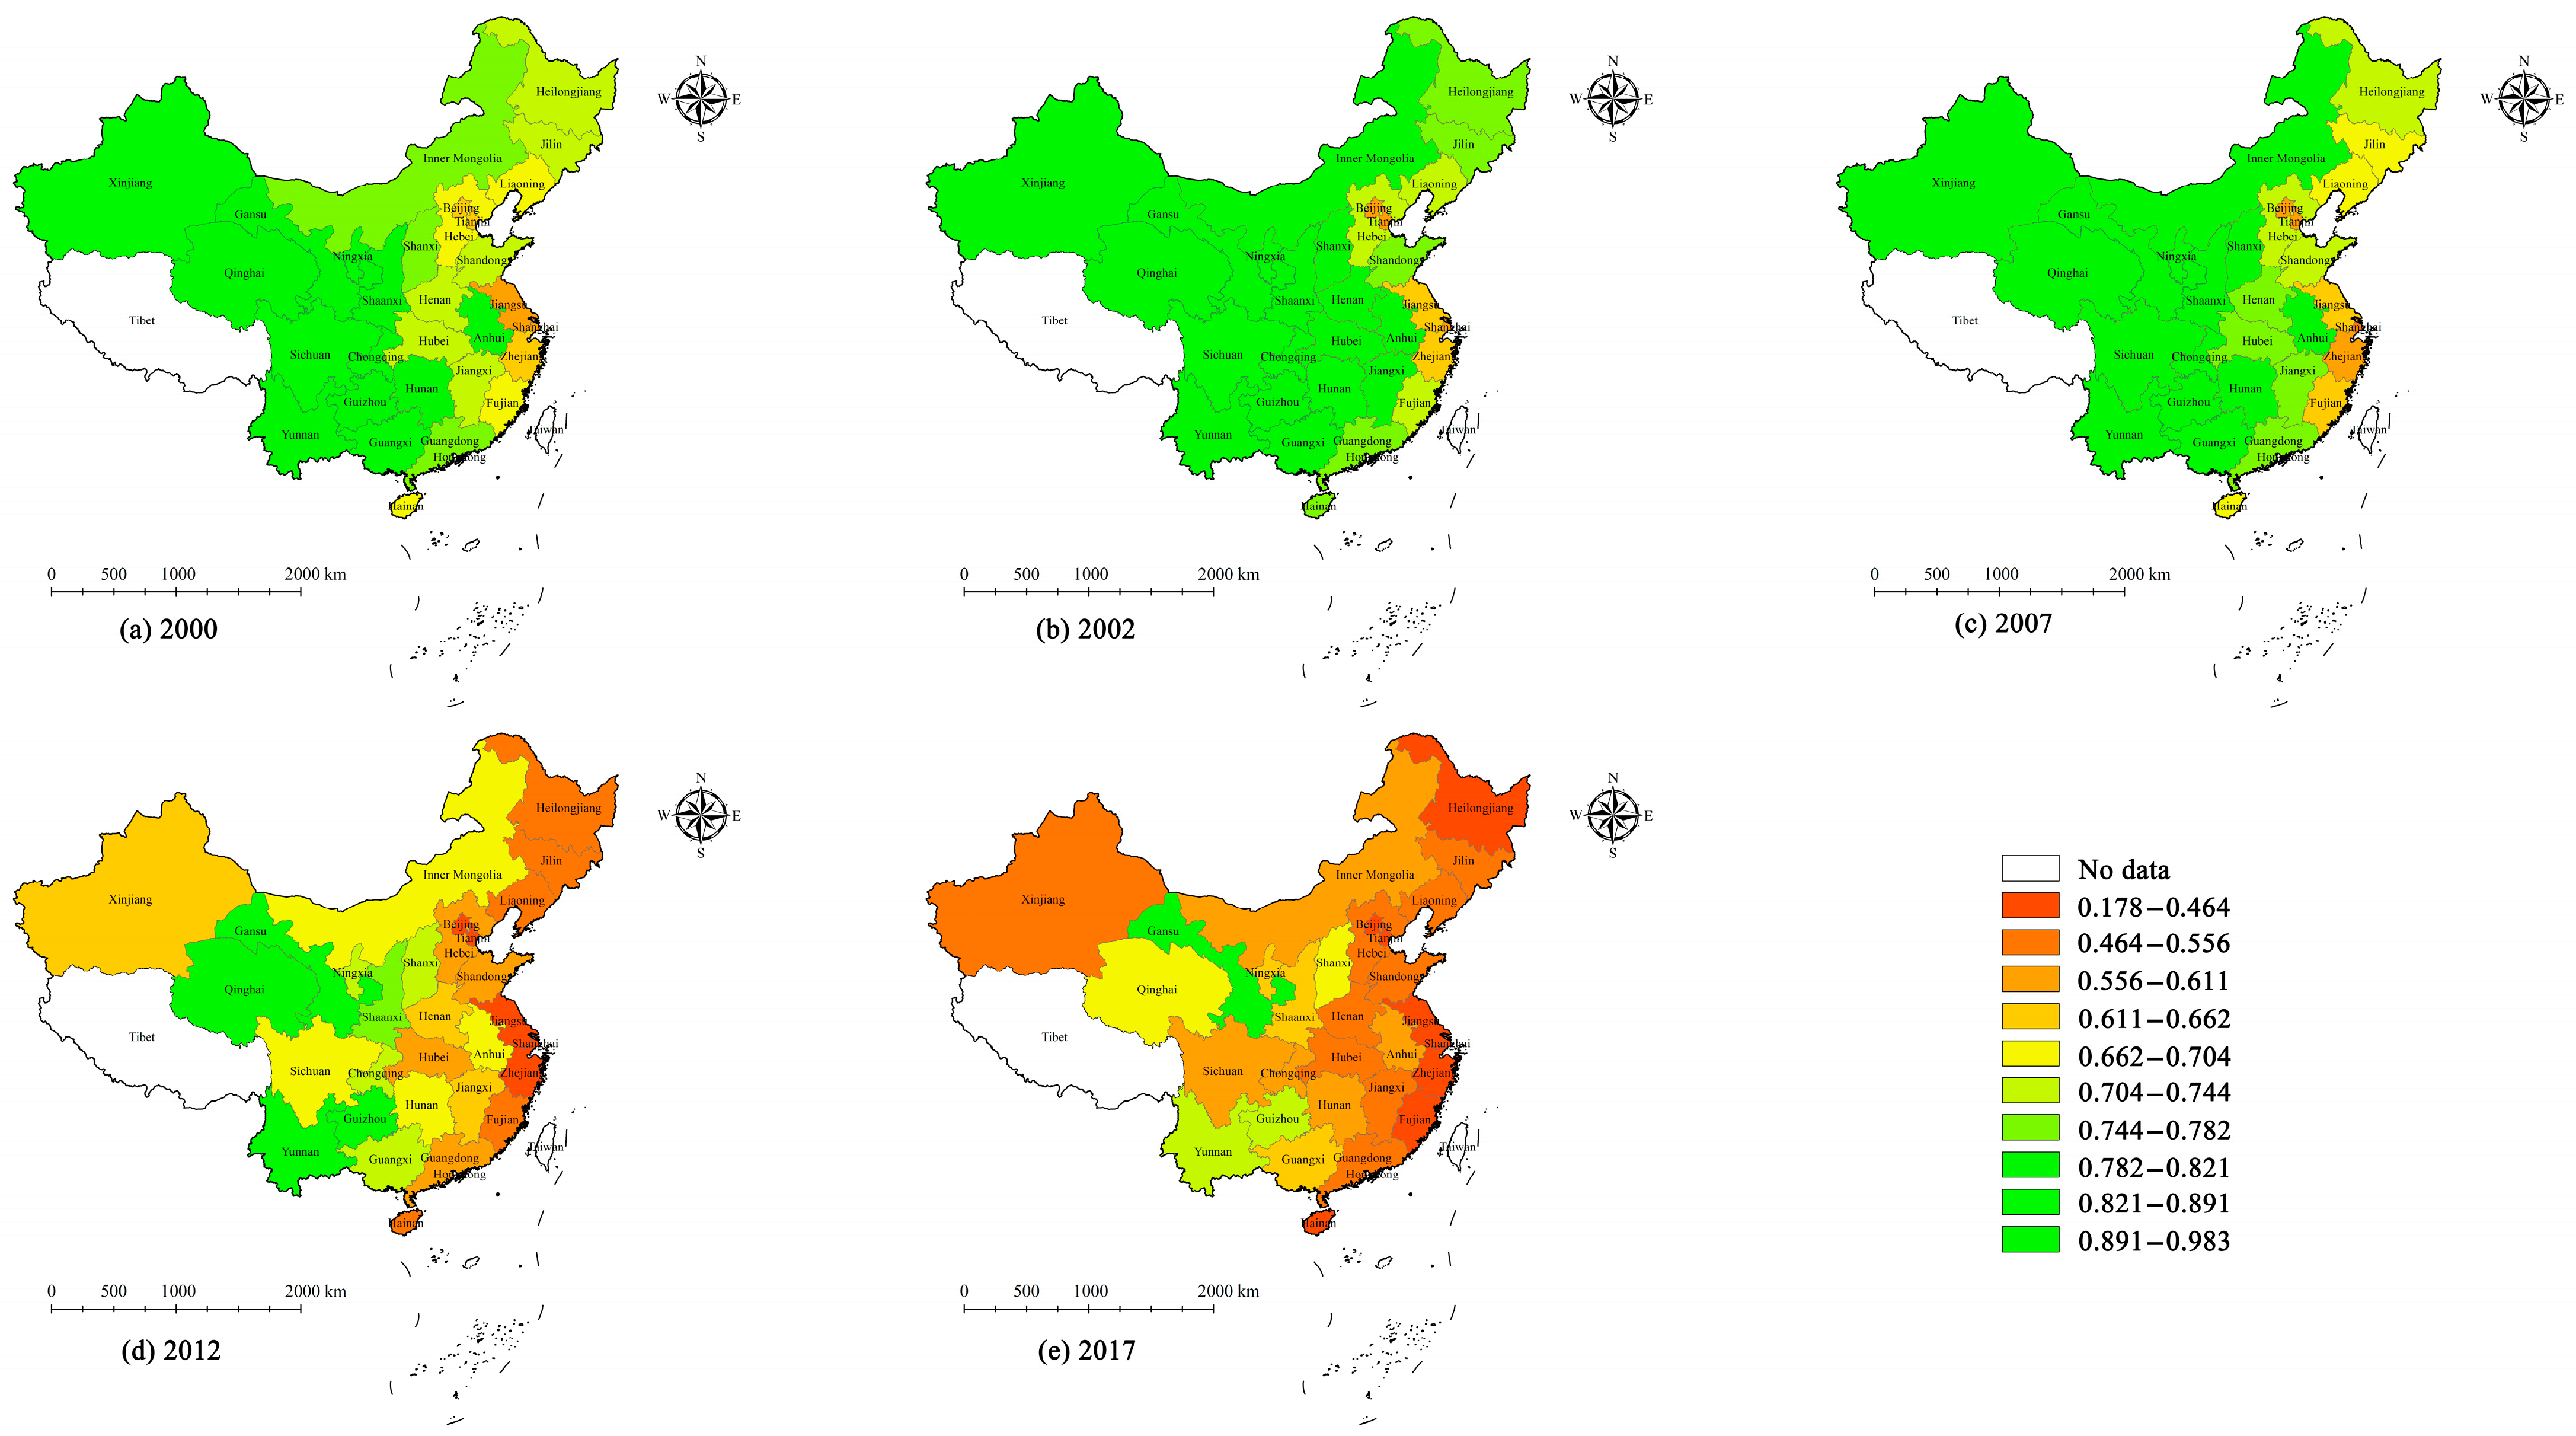
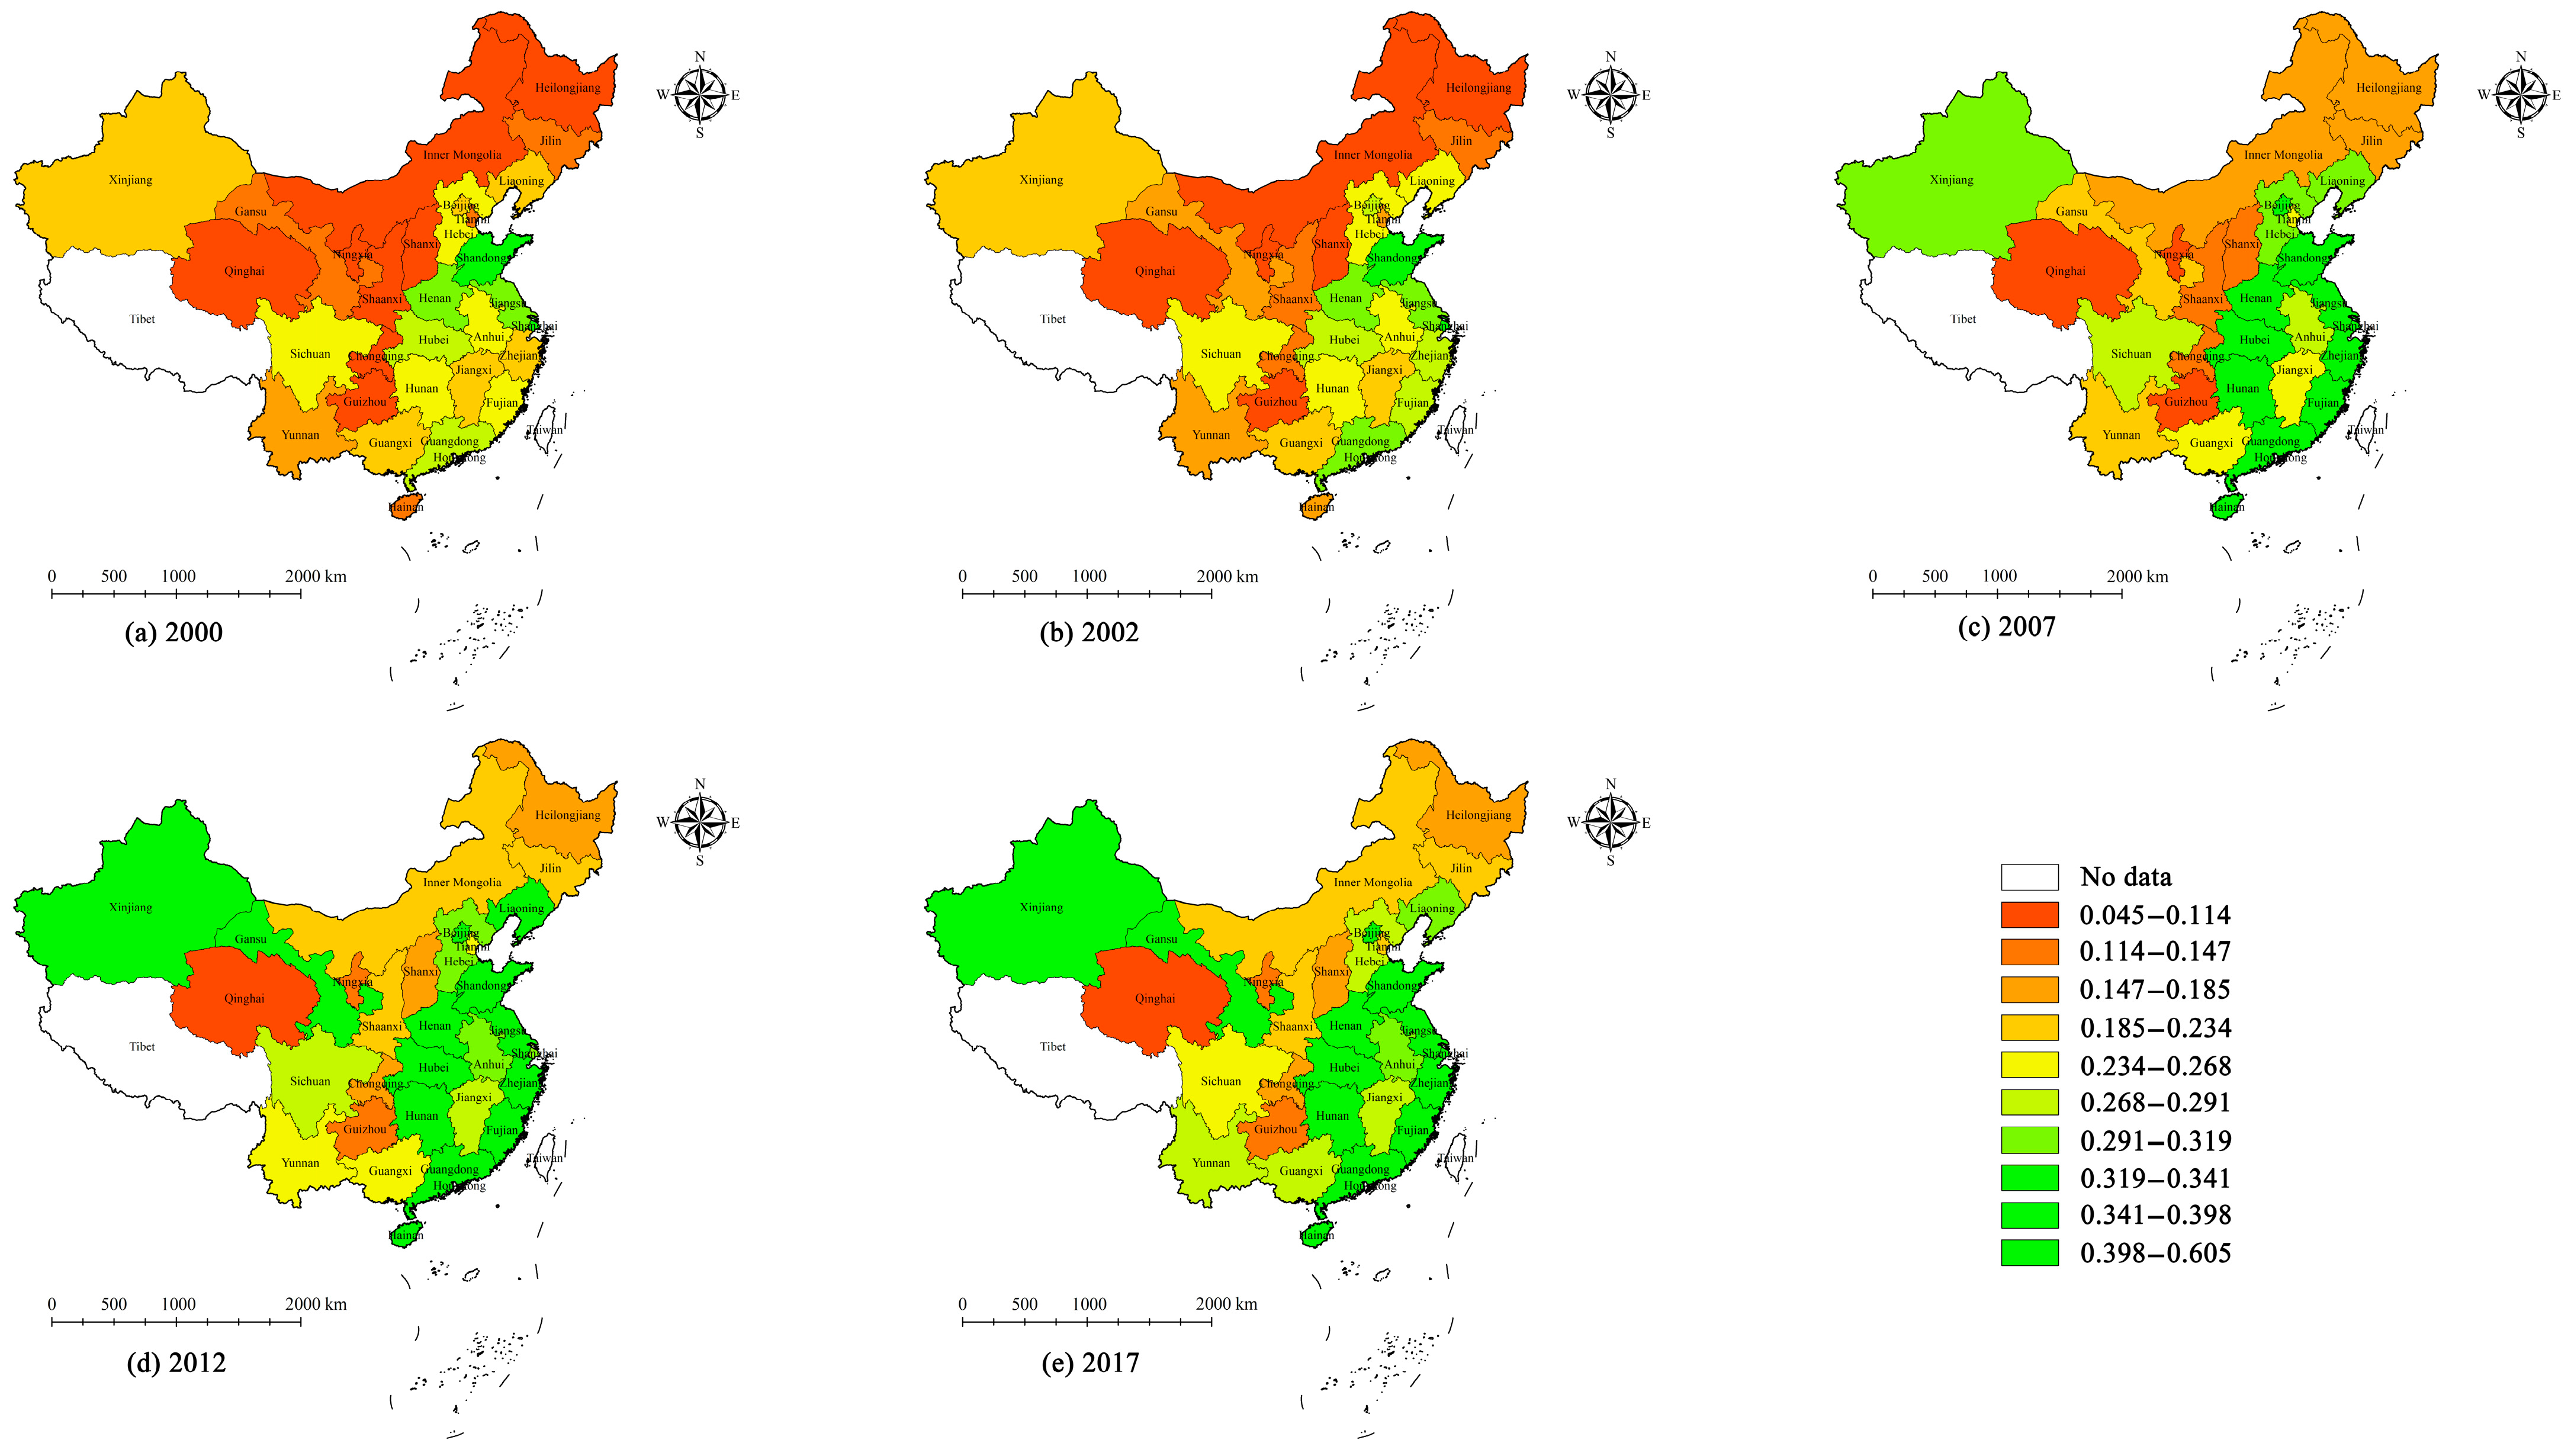
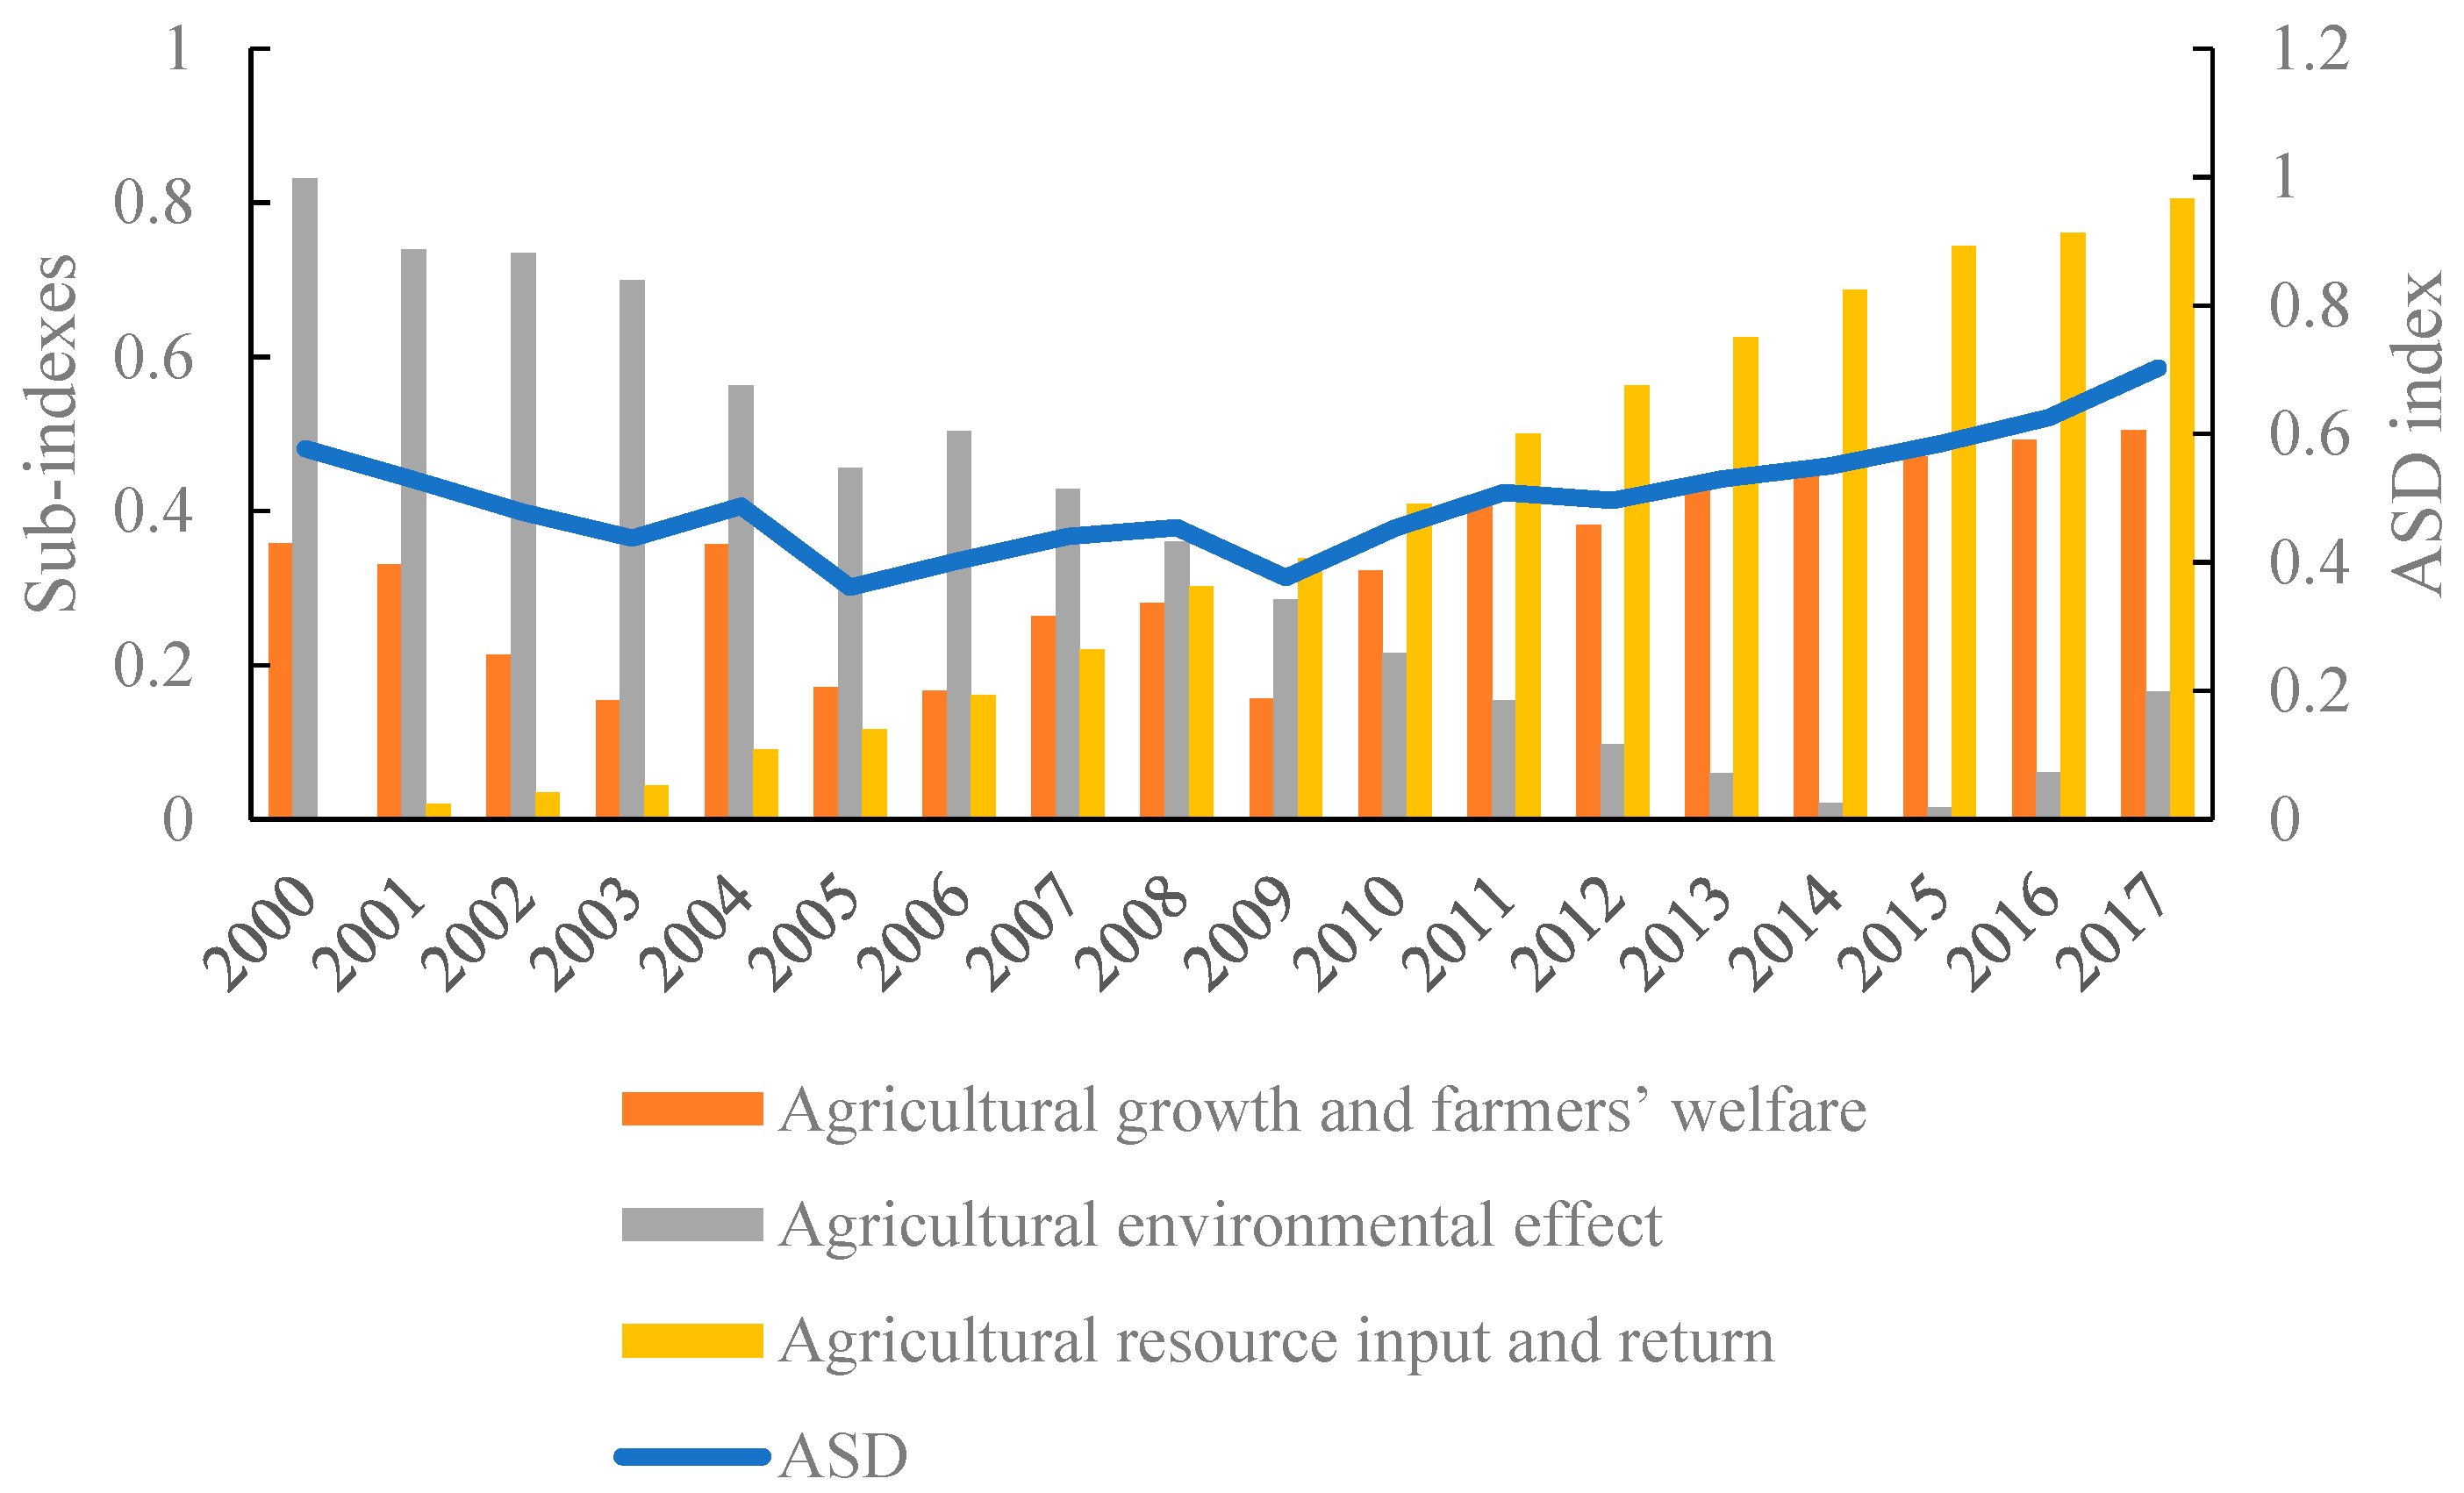
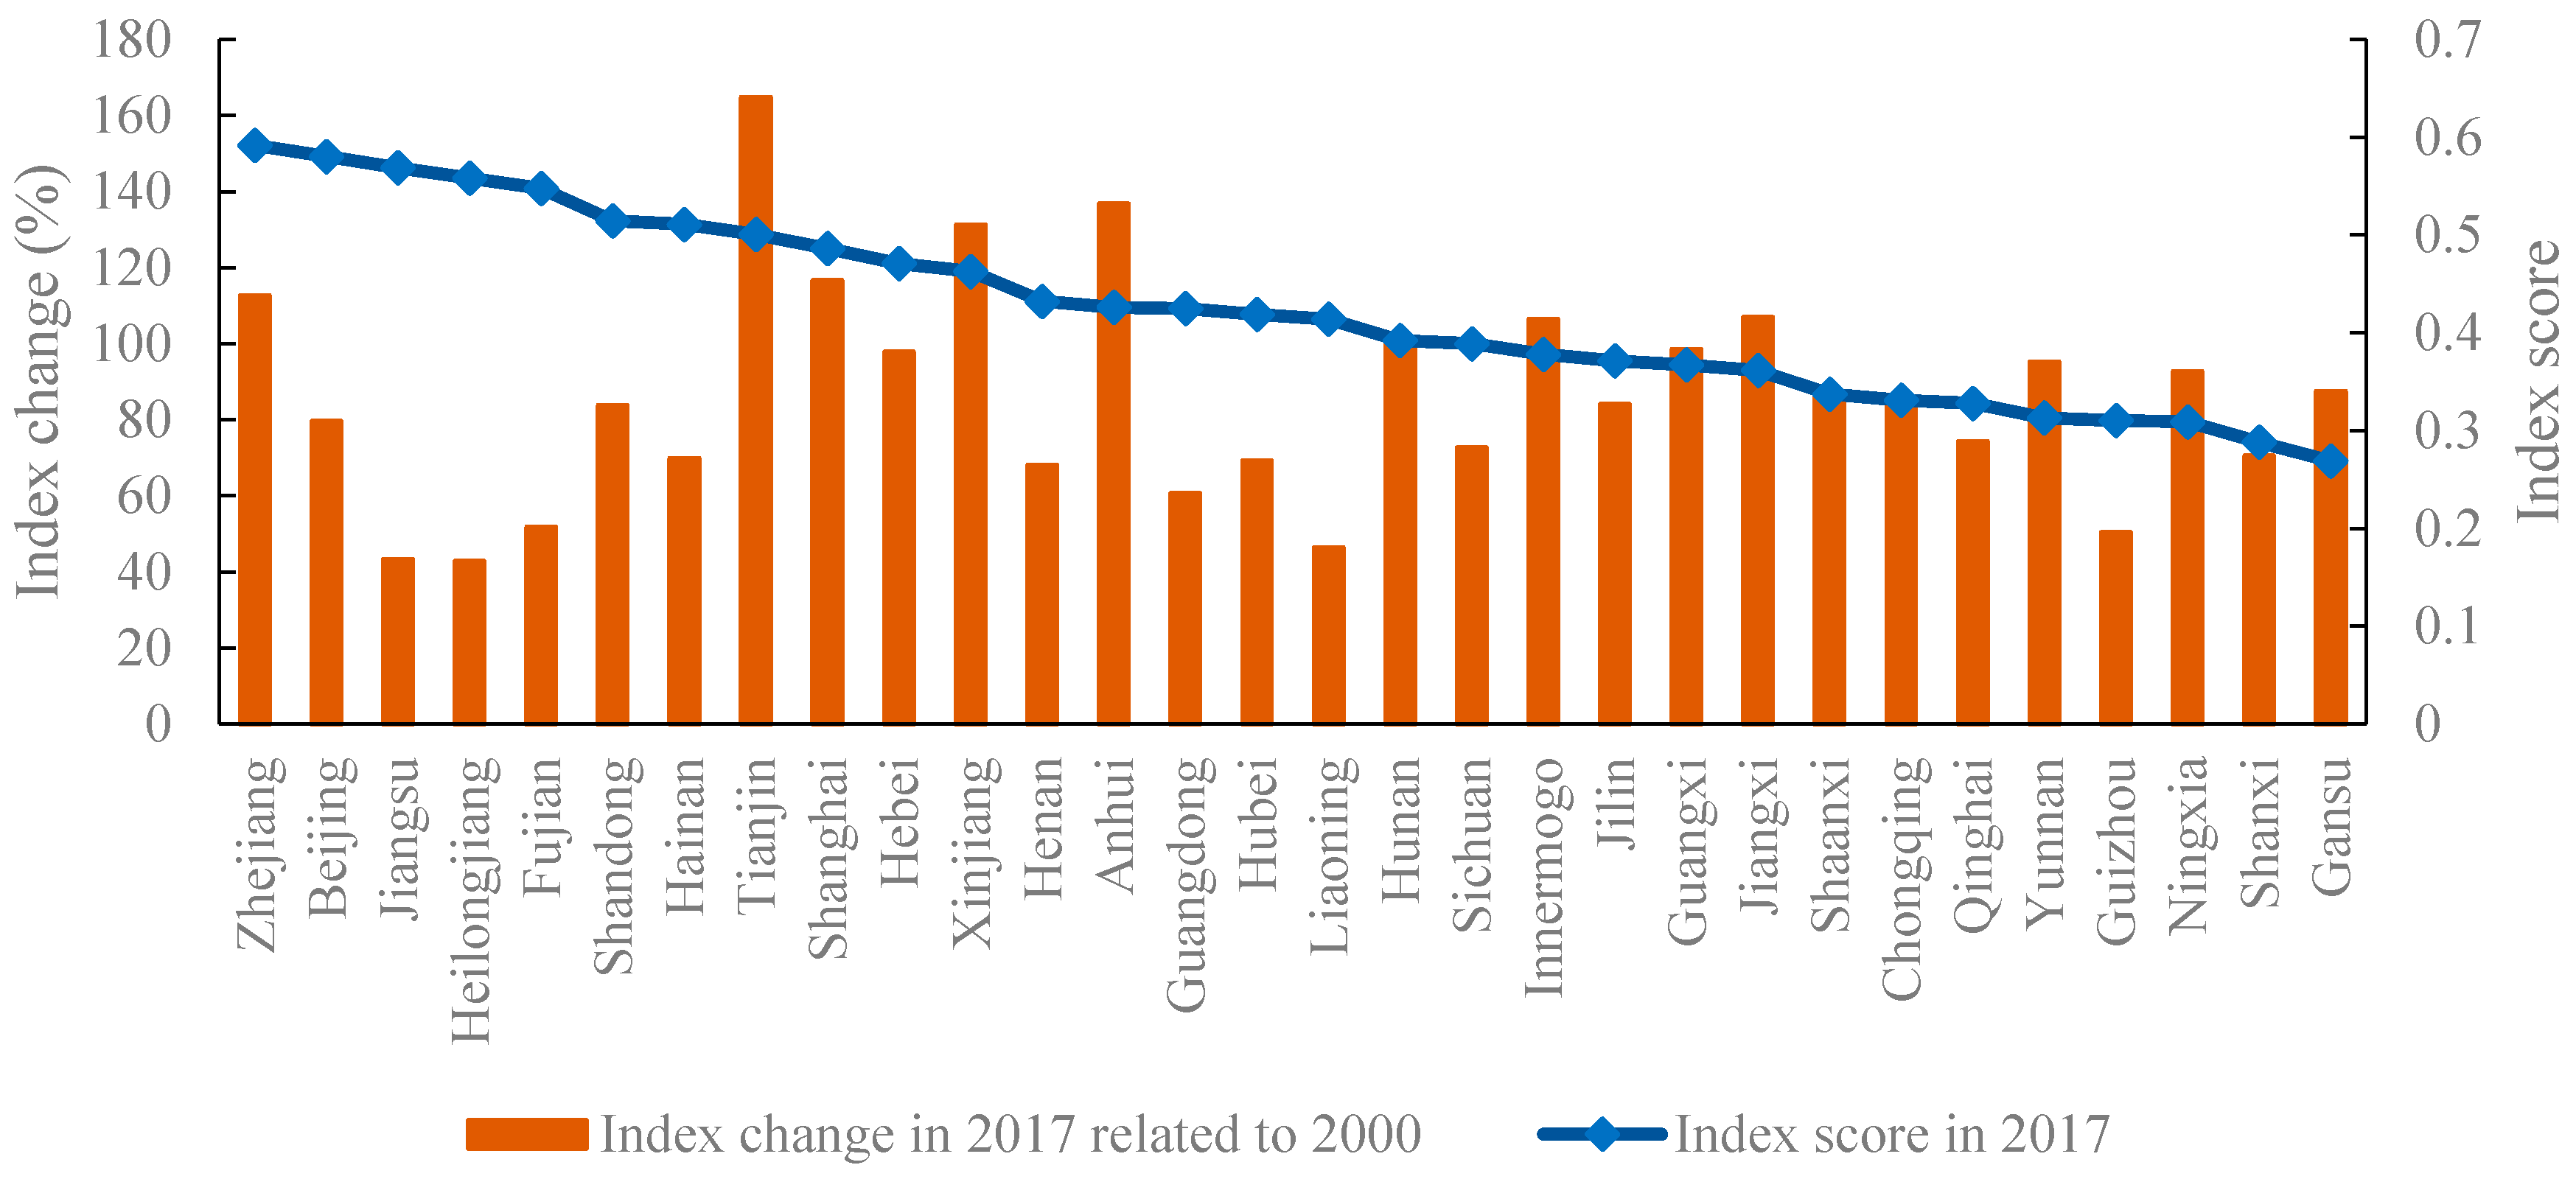
ASD in China is at a relatively low level but shows a rising trend during the whole period. Also, it is showing a significant strengthening trend from the west to the east.
(2)
The results of the empirical analysis imply that the improved REP affects ASD positively, as an increase in REP by one standard deviation promotes ASD by 0.027%. Furthermore, the mechanism analysis indicates that rural energy service availability exerts a negative impact on ASD, while rural energy management completeness plays a positive role in improving ASD.
(3)
Through the heterogeneity analysis, the eradication of REP has a greater effect on ASD in the non-major grain-producing areas than in the major grain-producing areas, as the absolute values of the coefficients are 0.053 in the non-major grain-producing areas and 0.012 in the major grain-producing areas.
Overall, this study sheds light on the critical role of alleviating rural energy poverty in enhancing agricultural sustainability in China. By providing empirical evidence and insights into the mechanisms at play, this study offers valuable implications for policymakers and stakeholders seeking to promote sustainable development in the agricultural sector. The conclusions support policy implications as follows: First, to fully tap into the potential for improving agricultural sustainable development (ASD), it is imperative to craft policies conducive to efficient, sustainable, and environmentally friendly agricultural practices. Strengthening laws and regulations relevant to ASD is paramount to ensuring compliance and accountability. Tailored policies, sensitive to the unique agricultural conditions of each region, are necessary for effective intervention. Promoting coordinated regional development is essential to addressing disparities in ASD. The pronounced imbalances among regions underscore the challenge of resource mismatches. Western regions, with their expansive landmass and rich agricultural resources, should receive focused attention to alleviate pressure on land resources in the east. Simultaneously, dismantling regional and institutional barriers is critical to enabling the smooth flow of resources and factors. Introducing innovative agricultural technologies and management practices in Western regions can unlock their agricultural potential more effectively.
Second, recognizing the positive impact of alleviating rural energy poverty (REP) on agricultural sustainable development (ASD), further efforts to eradicate REP in China hold significant promise for advancing ASD. Given the significant negative influence of rural energy service availability on ASD, it becomes imperative to establish a new energy consumption framework that prioritizes cleanliness and efficiency. While the coefficient of Rural Energy Consumption Cleanliness (REST) may not be statistically significant, its observed inhibitory effect on ASD underscores the need for a transformation in rural energy consumption patterns. Therefore, there is a pressing need to enhance rural energy infrastructure, particularly focusing on natural gas facilities, to facilitate greater adoption of clean and renewable energy sources in both agricultural activities and rural households. Additionally, bolstering rural energy management practices and increasing financial investments in this sector are critical steps that warrant heightened attention to further promote ASD.
Third, agricultural production in major grain-producing areas is vital for national food security, yet its growth in recent years has come at a considerable ecological cost. Achieving a balance between food production and ecological preservation is imperative for these regions. To this end, the government should prioritize the development of modern, efficient energy technologies in agricultural production. Additionally, promoting the scientific use of agricultural inputs, such as fertilizers, pesticides, and agricultural films, is essential to minimize energy consumption and environmental impact. Conversely, non-major grain-producing areas deserve increased attention, as the alleviation of rural energy poverty (REP) has a notably larger positive impact on agricultural sustainable development (ASD) in these regions. Encouraging research and development efforts to identify alternative methods for alleviating the ecological burden of major grain-producing areas through improved REP in non-major grain-producing areas is crucial. By addressing energy poverty and promoting sustainable practices, these regions can play a significant role in advancing ASD while mitigating ecological pressures in major grain-producing areas.

Author Contributions

Conceptualization, methodology, and writing—original draft, J.W.; Writing—review & editing and visualization, X.S.; Writing—review & editing, S.Z.; Visualization, data curation and funding acquisition, X.Z. All authors have read and agreed to the published version of the manuscript.

Funding

This research was funded by the National Natural Science Foundation of China (72103081), the Basic Research Fund for Central Public Research Institutes of the Chinese Academy of Agricultural Sciences (JBYW-AII−2024-14), and the Science and Technology Innovation Project of the Chinese Academy of Agricultural Sciences (CAAS-ASTIP-2024-AII).

Institutional Review Board Statement

Not applicable.

Data Availability Statement

Data will be made available on request.

Conflicts of Interest

The authors declare no conflict of interest.

Appendix A

Figure A1. Spatial distribution of agricultural growth and farmers’ welfare index from 2000 to 2017.
Agriculture 14 00795 g0a1
Figure A2. Spatial distribution of agricultural environmental effect index from 2000 to 2017.
Agriculture 14 00795 g0a2
Figure A3. Spatial distribution of agricultural resource input and return index from 2000 to 2017.
Agriculture 14 00795 g0a3

References

  1. Shen, Z.; Baležentis, T.; Chen, X.; Valdmanis, V. Green growth and structural change in Chinese agricultural sector during 1997–2014. China Econ. Rev. 2018, 51, 83–96. [Google Scholar] [CrossRef]
  2. Huang, J.K.; Wang, X.B.; Rozelle, S. The subsidization of farming households in China’s agriculture. Food Policy 2013, 41, 124–132. [Google Scholar] [CrossRef]
  3. Wang, X.; Shen, Y. The effect of China’s agricultural tax abolition on rural families’ incomes and production. China Econ. Rev. 2014, 29, 185–199. [Google Scholar] [CrossRef]
  4. Yang, Z.; Li, J.; Han, C.; Liu, H. The evolution path of China’s grain production base and the influencing factors. Res. Agric. Mod. 2019, 40, 36–43. [Google Scholar]
  5. Liu, Y.; Sun, D.; Wang, H.; Wang, X.; Yu, G.; Zhao, X. An evaluation of China’s agricultural green production: 1978–2017. J. Clean. Prod. 2020, 243, 118483. [Google Scholar] [CrossRef]
  6. Hu, S.; Yang, Y.; Zheng, H.; Mi, C.; Ma, T.; Shi, R. A framework for assessing sustainable agriculture and rural development: A case study of the Beijing-Tianjin-Hebei region, China. Environ. Impact Assess. Rev. 2022, 97, 106861. [Google Scholar] [CrossRef]
  7. Yanhua, H.; Jianguo, W.; Guohua, Z.; Bingbing, Z. Discussion on rural sustainability and rural sustainability science. Acta Geogr. Sin. 2020, 75, 736–752. [Google Scholar]
  8. Su, Y.; He, S.; Wang, K.; Shahtahmassebi, A.R.; Zhang, L.; Zhang, J.; Zhang, M.; Gan, M. Quantifying the sustainability of three types of agricultural production in China: An emergy analysis with the integration of environmental pollution. J. Clean. Prod. 2020, 252, 119650. [Google Scholar] [CrossRef]
  9. Khanal, U.; Wilson, C.; Rahman, S.; Lee, B.L.; Hoang, V.-N. Smallholder farmers’ adaptation to climate change and its potential contribution to UN’s sustainable development goals of zero hunger and no poverty. J. Clean. Prod. 2021, 281, 124999. [Google Scholar] [CrossRef]
  10. Shen, Z.; Wang, S.; Boussemart, J.-P.; Hao, Y. Digital transition and green growth in Chinese agriculture. Technol. Forecast. Soc. Chang. 2022, 181, 121742. [Google Scholar] [CrossRef]
  11. Han, Z.; Han, C.; Shi, Z.; Li, J.; Luo, E. Rebuilding the crop-livestock integration system in China—Based on the perspective of circular economy. J. Clean. Prod. 2023, 393, 136347. [Google Scholar] [CrossRef]
  12. Li, M.; Zhang, K.; Alamri, A.M.; Ageli, M.M.; Khan, N. Resource curse hypothesis and sustainable development: Evaluating the role of renewable energy and R&D. Resour. Policy 2023, 81, 103283. [Google Scholar] [CrossRef]
  13. Gan, Y.; Liang, C.; Chai, Q.; Lemke, R.L.; Campbell, C.A.; Zentner, R.P. Improving farming practices reduces the carbon footprint of spring wheat production. Nat. Commun. 2014, 5, 5012. [Google Scholar] [CrossRef]
  14. Liu, D.; Zhu, X.; Wang, Y. China’s agricultural green total factor productivity based on carbon emission: An analysis of evolution trend and influencing factors. J. Clean. Prod. 2021, 278, 123692. [Google Scholar] [CrossRef]
  15. Zhao, J.; Jiang, Q.; Dong, X.; Dong, K. Assessing energy poverty and its effect on CO2 emissions: The case of China. Energy Econ. 2021, 97, 105191. [Google Scholar] [CrossRef]
  16. Lin, B.; Wang, Y. Does energy poverty really exist in China? From the perspective of residential electricity consumption. Energy Policy 2020, 143, 111557. [Google Scholar] [CrossRef]
  17. Churchill, S.A.; Smyth, R.; Farrell, L. Fuel poverty and subjective wellbeing. Energy Econ. 2020, 86, 104650. [Google Scholar] [CrossRef]
  18. Dong, K.; Dong, X.; Jiang, Q.; Zhao, J. Assessing energy resilience and its greenhouse effect: A global perspective. Energy Econ. 2021, 104, 105659. [Google Scholar] [CrossRef]
  19. Deng, H.; Jin, Y.; Pray, C.; Hu, R.; Xia, E.; Meng, H. Impact of public research and development and extension on agricultural productivity in China from 1990 to 2013. China Econ. Rev. 2021, 70, 101699. [Google Scholar] [CrossRef]
  20. Rahman, S.; Salim, R. Six Decades of Total Factor Productivity Change and Sources of Growth in Bangladesh Agriculture (1948–2008). J. Agric. Econ. 2013, 64, 275–294. [Google Scholar] [CrossRef]
  21. Wang, M.; Xu, M.; Ma, S. The effect of the spatial heterogeneity of human capital structure on regional green total factor productivity. Struct. Chang. Econ. Dyn. 2021, 59, 427–441. [Google Scholar] [CrossRef]
  22. Hu, Y.; Liu, C.; Peng, J. Financial inclusion and agricultural total factor productivity growth in China. Econ. Model. 2021, 96, 68–82. [Google Scholar] [CrossRef]
  23. Laurett, R.; Paço, A.; Mainardes, E.W. Sustainable Development in Agriculture and its Antecedents, Barriers and Consequences—An Exploratory Study. Sustain. Prod. Consum. 2021, 27, 298–311. [Google Scholar] [CrossRef]
  24. Li, M.; Wang, J.; Zhao, P.; Chen, K.; Wu, L. Factors affecting the willingness of agricultural green production from the perspective of farmers’ perceptions. Sci. Total Environ. 2020, 738, 140289. [Google Scholar] [CrossRef] [PubMed]
  25. Struik, P.C.; Kuyper, T.W. Sustainable intensification in agriculture: The richer shade of green. A review. Agron. Sustain. Dev. 2017, 37, 39. [Google Scholar] [CrossRef]
  26. DeClerck, F.; Jones, S.; Attwood, S.; Bossio, D.; Girvetz, E.; Chaplin-Kramer, B.; Enfors, E.; Fremier, A.; Gordon, L.; Kizito, F.; et al. Agricultural ecosystems and their services: The vanguard of sustainability? Curr. Opin. Environ. Sustain. 2016, 23, 92–99. [Google Scholar] [CrossRef]
  27. Bullock, J.M.; Dhanjal-Adams, K.L.; Milne, A.; Oliver, T.H.; Todman, L.C.; Whitmore, A.P.; Pywell, R.F. Resilience and food security: Rethinking an ecological concept. J. Ecol. 2017, 105, 880–884. [Google Scholar] [CrossRef]
  28. Kazemi, H.; Klug, H.; Kamkar, B. New services and roles of biodiversity in modern agroecosystems: A review. Ecol. Indic. 2018, 93, 1126–1135. [Google Scholar] [CrossRef]
  29. Koohafkan, P.; Altieri, M.A.; Gimenez, E.H. Green agriculture: Foundations for biodiverse, resilient and productive ag-ricultural systems. Int. J. Agric. Sustain. 2012, 10, 61–75. [Google Scholar] [CrossRef]
  30. Veisi, H.; Liaghati, H.; Alipour, A. Developing an ethics-based approach to indicators of sustainable agriculture using analytic hierarchy process (AHP). Ecol. Indic. 2016, 60, 644–654. [Google Scholar] [CrossRef]
  31. Piao, R.S.; Silva, V.L.; del Aguila, I.N.; Jiménez, J.d.B. Green Growth and Agriculture in Brazil. Sustainability 2021, 13, 1162. [Google Scholar] [CrossRef]
  32. Zhang, H.; Zhang, J.; Song, J. Analysis of the threshold effect of agricultural industrial agglomeration and industrial structure upgrading on sustainable agricultural development in China. J. Clean. Prod. 2022, 341, 130818. [Google Scholar] [CrossRef]
  33. Chopra, R.; Magazzino, C.; Shah, M.I.; Sharma, G.D.; Rao, A.; Shahzad, U. The role of renewable energy and natural resources for sustainable agriculture in ASEAN countries: Do carbon emissions and deforestation affect agriculture productivity? Resour. Policy 2022, 76, 102578. [Google Scholar] [CrossRef]
  34. Yang, H.; Wang, X.; Bin, P. Agriculture carbon-emission reduction and changing factors behind agricultural eco-efficiency growth in China. J. Clean. Prod. 2022, 334, 130193. [Google Scholar] [CrossRef]
  35. Hessari, B.; Oweis, T. Conjunctive use of green and blue water resources in agriculture: Methodology and application for supplemental irrigation*. Irrig. Drain. 2021, 70, 1193–1208. [Google Scholar] [CrossRef]
  36. Pan, C.; Jiang, Y.; Wang, M.; Xu, S.; Xu, M.; Dong, Y. How Can Agricultural Corporate Build Sustainable Competitive Advantage through Green Intellectual Capital? A New Environmental Management Approach to Green Agriculture. Int. J. Environ. Res. Public Health 2021, 18, 7900. [Google Scholar] [CrossRef]
  37. Niyigaba, J.; Sun, J.Y.; Peng, D.; Uwimbabazi, C. Agriculture and Green Economy for Environmental Kuznets Curve Adoption in Developing Countries: Insights from Rwanda. Sustainability 2020, 12, 10381. [Google Scholar] [CrossRef]
  38. Adom, P.K.; Amoani, S. The role of climate adaptation readiness in economic growth and climate change relationship: An analysis of the output/income and productivity/institution channels. J. Environ. Manag. 2021, 293, 112923. [Google Scholar] [CrossRef]
  39. Shu, J.; Bai, Y.; Chen, Q.; Weng, C.; Zhang, F. Dynamic simulation of the water-land-food nexus for the sustainable agricultural development in the North China Plain. Sci. Total Environ. 2024, 912, 168771. [Google Scholar] [CrossRef] [PubMed]
  40. Feng, M.; Chen, Y.; Li, Z.; Duan, W.; Zhu, Z.; Liu, Y.; Zhou, Y. Optimisation model for sustainable agricultural development based on water-energy-food nexus and CO2 emissions: A case study in Tarim river basin. Energy Convers. Manag. 2024, 303, 118174. [Google Scholar] [CrossRef]
  41. Yang, Z.; Solangi, Y.A. Analyzing the relationship between natural resource management, environmental protection, and agricultural economics for sustainable development in China. J. Clean. Prod. 2024, 450, 141862. [Google Scholar] [CrossRef]
  42. Cheng, Z.; Tani, M.; Wang, H. Energy poverty and entrepreneurship. Energy Econ. 2021, 102, 105469. [Google Scholar] [CrossRef]
  43. Nie, P.; Li, Q.; Sousa-Poza, A. Energy poverty and subjective well-being in China: New evidence from the China Family Panel Studies. Energy Econ. 2021, 103, 105548. [Google Scholar] [CrossRef]
  44. Primc, K.; Slabe-Erker, R.; Majcen, B. Energy poverty: A macrolevel perspective. Sustain. Dev. 2019, 27, 982–989. [Google Scholar] [CrossRef]
  45. Wang, K.; Wang, Y.-X.; Li, K.; Wei, Y.-M. Energy poverty in China: An index based comprehensive evaluation. Renew. Sustain. Energy Rev. 2015, 47, 308–323. [Google Scholar] [CrossRef]
  46. Acharya, R.H.; Sadath, A.C. Energy poverty and economic development: Household-level evidence from India. Energy Build. 2019, 183, 785–791. [Google Scholar] [CrossRef]
  47. Amin, A.; Liu, Y.; Yu, J.; Chandio, A.A.; Rasool, S.F.; Luo, J.; Zaman, S. How does energy poverty affect economic development? A panel data analysis of South Asian countries. Environ. Sci. Pollut. Res. 2020, 27, 31623–31635. [Google Scholar] [CrossRef]
  48. Ozturk, I. The dynamic relationship between agricultural sustainability and food-energy-water poverty in a panel of selected Sub-Saharan African Countries. Energy Policy 2017, 107, 289–299. [Google Scholar] [CrossRef]
  49. Shi, H.; Xu, H.; Gao, W.; Zhang, J.; Chang, M. The impact of energy poverty on agricultural productivity: The case of China. Energy Policy 2022, 167, 113020. [Google Scholar] [CrossRef]
  50. Talukder, B.; Vanloon, G.W.; Hipel, K.W. Energy efficiency of agricultural systems in the southwest coastal zone of Bangladesh. Ecol. Indic. 2019, 98, 641–648. [Google Scholar] [CrossRef]
  51. Nabavi-Pelesaraei, A.; Abdi, R.; Rafiee, S.; Shamshirband, S.; Yousefinejad-Ostadkelayeh, M. Resource management in cropping systems using artificial intelligence techniques: A case study of orange orchards in north of Iran. Stoch. Environ. Res. Risk Assess. 2016, 30, 413–427. [Google Scholar] [CrossRef]
  52. Parton, W.J.; Gutmann, M.P.; Ojima, D. Long-term Trends in Population, Farm Income, and Crop Production in the Great Plains. BioScience 2007, 57, 737–747. [Google Scholar] [CrossRef]
  53. Ali, A.; Rahut, D.B.; Behera, B. Factors influencing farmers’ adoption of energy-based water pumps and impacts on crop productivity and household income in Pakistan. Renew. Sustain. Energy Rev. 2016, 54, 48–57. [Google Scholar] [CrossRef]
  54. Wang, S.; Yang, L. Mineral resource extraction and resource sustainability: Policy initiatives for agriculture, economy, energy, and the environment. Resour. Policy 2024, 89, 104657. [Google Scholar] [CrossRef]
  55. Azam, A.; Shafique, M.; Rafiq, M.; Ateeq, M. Moving toward sustainable agriculture: The nexus between clean energy, ICT, human capital and environmental degradation under SDG policies in European countries. Energy Strat. Rev. 2023, 50, 101252. [Google Scholar] [CrossRef]
  56. He, P.; Baiocchi, G.; Hubacek, K.; Feng, K.; Yu, Y. The environmental impacts of rapidly changing diets and their nutritional quality in China. Nat. Sustain. 2018, 1, 122–127. [Google Scholar] [CrossRef]
  57. Wang, B.; Zhao, J.; Dong, K.; Jiang, Q. High-quality energy development in China: Comprehensive assessment and its impact on CO2 emissions. Energy Econ. 2022, 110, 106027. [Google Scholar] [CrossRef]
  58. Amoako, S.; Andoh, F.K.; Asmah, E.E. Structural change and energy use in Ghana’s manufacturing and agriculture sectors. Energy Rep. 2022, 8, 11112–11121. [Google Scholar] [CrossRef]
  59. Song, Y.; Zhang, B.; Wang, J.; Kwek, K. The impact of climate change on China’s agricultural green total factor. Technol. Forecast. Soc. Chang. 2022, 185, 122054. [Google Scholar] [CrossRef]
  60. Li, J.; Gao, M.; Luo, E.; Wang, J.; Zhang, X. Does rural energy poverty alleviation really reduce agricultural carbon emissions? The case of China. Energy Econ. 2023, 119, 106576. [Google Scholar] [CrossRef]
  61. Hamilton, B.H.; Nickerson, J.A. Correcting for Endogeneity in Strategic Management Research. Strat. Organ. 2003, 1, 51–78. [Google Scholar] [CrossRef]
  62. Pesaran, M.H.; Schuermann, T.; Weiner, S.M. Modeling Regional Interdependencies Using a Global Error-Correcting Macroeconometric Model. J. Bus. Econ. Stat. 2004, 22, 129–162. [Google Scholar] [CrossRef]
  63. Friedman, M. The Use of Ranks to Avoid the Assumption of Normality Implicit in the Analysis of Variance. J. Am. Stat. Assoc. 1937, 32, 675–701. [Google Scholar] [CrossRef]
  64. Frees, E.W. Longitudinal and Panel Data: Analysis and Applications in the Social Sciences; Cambridge University Press: Cambridge, UK, 2004. [Google Scholar]
  65. Marques, A.C.; Fuinhas, J.A. Are public policies towards renewables successful? Evidence from European countries. Renew. Energy 2012, 44, 109–118. [Google Scholar] [CrossRef]
  66. Stock, J.H.; Watson, M.W. Introduction to Econometrics; Addison Wesley Boston: Boston, MA, USA, 2003. [Google Scholar]
  67. Chen, Z.; Sarkar, A.; Rahman, A.; Li, X.; Xia, X. Exploring the drivers of green agricultural development (GAD) in China: A spatial association network structure approaches. Land Use Policy 2022, 112, 105827. [Google Scholar] [CrossRef]
  68. Cai, J.; Zheng, H.; Vardanyan, M.; Shen, Z. Achieving carbon neutrality through green technological progress: Evidence from China. Energy Policy 2023, 173, 113397. [Google Scholar] [CrossRef]
  69. Liu, B.; Tian, C.; Li, Y.; Song, H.; Ma, Z. Research on the effects of urbanization on carbon emissions efficiency of urban agglomerations in China. J. Clean. Prod. 2018, 197, 1374–1381. [Google Scholar] [CrossRef]
  70. Raihan, A.; Tuspekova, A. Nexus between economic growth, energy use, agricultural productivity, and carbon dioxide emissions: New evidence from Nepal. Energy Nexus 2022, 7, 100113. [Google Scholar] [CrossRef]
Figure 1. ASD index and three sub-indexes from 2000 to 2017.
Agriculture 14 00795 g001
Figure 2. ASD index by province and index change.
Agriculture 14 00795 g002
Figure 3. Spatial distribution of ASD index from 2000 to 2017.
Agriculture 14 00795 g003
Figure 4. REP index and sub-indexes, 2000–2017.
Agriculture 14 00795 g004
Table 1. Indicators for measuring China’s ASD index.
Primary IndexesSecondary IndexesMeasurementProperty
Agricultural growth and farmers’ welfareAgricultural growth ratePer capita agricultural value-added growth Benefit
Proportion of agricultural value added to the gross domestic product (GDP)Benefit
Farmers’ livesRural residents’ disposable incomeBenefit
Ratio of rural residents’ net income to urban residents’Benefit
Agricultural environmental effectAgricultural input intensityPure equivalent chemical fertilizer application on the unit planting areaCost
Pesticide application in unit planting areaCost
Agricultural plastic film application on the unit planting areaCost
Agricultural greenhouse effectAgricultural carbon emissionsCost
Agricultural resource input and returnAgricultural resource utilizationAgricultural mechanical power on the unit planting areaBenefit
Effective irrigation areaBenefit
Agricultural productivityAgricultural value added of unit planting areaBenefit
Agricultural value added per agricultural workerBenefit
Table 2. The summary of variable descriptive statistics.
VariablesUnitObsMeanStd. Dev.MinMax
ASD-5400.30840.09550.15590.5919
REP-5400.71800.14130.37920.9721
PGDPCNY 10 thousand 5402.90532.27570.274213.6203
FDIUSD 10 thousand 540524,930.2662,402.614953,575,956
UR%54049.347014.982123.289.6
RDCNY 10 thousand540478,328.1921,18948547,412,398
Notes: ASD denotes the index of agricultural sustainable development. REP denotes rural energy poverty. PGDP denotes gross domestic product per capita; FDI denotes the inflow of FDI; UR denotes the urbanization rate; RD denotes the intensity of research investment. The following are the same.
Table 3. Benchmark regression results.
VariablesPooled OLSREFEPCSEFGLS
REP0.126 ***
(0.039)
0.126 ***
(0.022)
0.127 ***
(0.024)
0.037 **
(0.016)
0.027 ***
(0.004)
lnPGDP0.140 ***
(0.018)
0.140 ***
(0.006)
0.142 ***
(0.007)
0.098 ***
(0.009)
0.103 ***
(0.002)
lnFDI−0.002
(0.006)
−0.002
(0.003)
−0.004
(0.003)
−0.002
(0.002)
−0.002 ***
(0.000)
lnUR−0.183 ***
(0.061)
−0.183 ***
(0.024)
−0.185 ***
(0.027)
−0.056 **
(0.024)
−0.103 ***
(0.006)
lnRD0.019 ***
(0.002)
0.019 ***
(0.002)
0.020 ***
(0.003)
0.006 **
(0.002)
0.004 ***
(0.001)
Constant0.612 ***
(0.207)
0.612 ***
(0.097)
0.629 ***
(0.117)
0.374 ***
(0.090)
0.575 ***
(0.024)
R20.6420.6420.8290.861-
N540540540540540
Notes: ** and *** indicate significance at the 5% and 1% levels, respectively. The value in the parentheses represents the standard deviation.
Table 4. Results of the cross-sectional dependence tests.
TestsStatisticsp-Values
Pesaran CD test15.851 ***0.0000
Friedman test95.478 ***0.0000
Frees test7.918 ***0.0000
Notes: *** indicates significance at the 1% level.
Table 5. Results of the robustness regression.
VariablesPooled OLSREFEPCSEFGLS
lnELEC0.027 ***
(0.008)
0.027 ***
(0.005)
0.048 ***
(0.006)
0.014 ***
(0.005)
0.013 ***
(0.002)
lnPGDP0.120 ***
(0.017)
0.120 ***
(0.007)
0.111 ***
(0.008)
0.093 ***
(0.011)
0.091 ***
(0.003)
lnFDI−0.008
(0.006)
−0.008 ***
(0.003)
−0.007 ***
(0.003)
−0.004 ***
(0.002)
−0.005 ***
(0.001)
lnUR−0.160 ***
(0.056)
−0.160 ***
(0.024)
−0.182 ***
(0.026)
−0.062 **
(0.024)
−0.077 ***
(0.008)
lnRD0.016 ***
(0.003)
0.016 ***
(0.002)
0.018 ***
(0.003)
0.004 *
(0.002)
0.003 ***
(0.001)
Constant0.622 ***
(0.197)
0.622 ***
(0.098)
0.586 ***
(0.113)
0.418 ***
(0.097)
0.507 ***
(0.032)
R20.5650.5650.8370.778-
N540540540540540
Notes: *, **, and *** indicate significance at the 10%, 5%, and 1% levels, respectively. The value in the parentheses represents the standard deviation. ELEC denotes rural electricity consumption.
Table 6. Impacts of sub-indexes of REP on ASD.
VariablesFEFGLSFEFGLSFEFGLS
RESA−1.026 ***
(0.178)
−0.264 ***
(0.040)
RECC −0.032
(0.094)
−0.008
(0.019)
REMC 0.162 ***
(0.025)
0.018 *
(0.008)
lnPGDP0.134 ***
(0.007)
0.084 ***
(0.004)
0.142 ***
(0.007)
0.086 ***
(0.004)
0.139 ***
(0.007)
0.090 ***
(0.003)
lnFDI−0.008 ***
(0.003)
−0.004 ***
(0.001)
0.008 ***
(0.003)
−0.004 ***
(0.001)
−0.004
(0.003)
−0.001 ***
(0.000)
lnUR−0.181 ***
(0.027)
−0.121 ***
(0.008)
−0.199 ***
(0.028)
−0.059 ***
(0.010)
−0.166 ***
(0.027)
−0.082 ***
(0.008)
lnRD0.018 ***
(0.003)
0.004 ***
(0.001)
0.019 ***
(0.003)
0.004 ***
(0.001)
0.022 ***
(0.003)
0.007 ***
(0.001)
Constant0.944 ***
(0.111)
0.764 ***
(0.034)
0.840 ***
(0.113)
0.477 ***
(0.040)
0.579 ***
(0.116)
0.482 ***
(0.027)
R20.830-0.819-0.834-
N540540540540540540
Notes: * and *** indicate significance at the 10% and 1% levels, respectively. The value in the parentheses represents the standard deviation. RESA denotes rural energy service availability. RECC denotes rural energy consumption and cleanliness. REMC denotes rural energy management completeness.
Table 7. Regression results for major and non-major grain-producing areas.
VariablesMajor Grain-Producing AreasNon-Major Grain-Producing Areas
FEFGLSFEFGLS
REP0.042
(0.033)
0.012 *
(0.007)
0.213 ***
(0.032)
0.053 ***
(0.004)
lnPGDP0.146 ***
(0.010)
0.126 ***
(0.006)
0.163 ***
(0.010)
0.063 ***
(0.002)
lnFDI−0.027 ***
(0.006)
−0.009 ***
(0.001)
0.000
(0.003)
−0.003 ***
(0.000)
lnUR−0.075 **
(0.036)
−0.142 ***
(0.010)
−0.302 ***
(0.039)
0.007
(0.006)
lnRD0.013 ***
(0.004)
0.001
(0.001)
0.021 ***
(0.003)
0.009 ***
(0.000)
Constant0.663 ***
(0.158)
0.877 ***
(0.043)
0.918 ***
(0.169)
0.108 ***
(0.019)
R20.849-0.843-
N216216324324
Notes: *, **, and *** indicate significance at the 10%, 5%, and 1% levels, respectively. The value in the parentheses represents the standard deviation. The major grain-producing areas are represented by data for 13 provinces (Liaoning, Hebei, Shandong, Jilin, Inner Mongolia, Jiangxi, Hunan, Sichuan, Henan, Hubei, Jiangsu, Anhui, and Heilongjiang), and the non-major grain-producing areas are represented by data for 17 provinces (Beijing, Chongqing, Fujian, Gansu, Guangdong, Guangxi, Guizhou, Hainan, Ningxia, Qinghai, Shaanxi, Shanghai, Shanxi, Tianjin, Xinjiang, Yunnan, and Zhejiang).
Disclaimer/Publisher’s Note: The statements, opinions and data contained in all publications are solely those of the individual author(s) and contributor(s) and not of MDPI and/or the editor(s). MDPI and/or the editor(s) disclaim responsibility for any injury to people or property resulting from any ideas, methods, instructions or products referred to in the content.

