Article

Online Detection of Dry Matter in Potatoes Based on Visible Near-Infrared Transmission Spectroscopy Combined with 1D-CNN

1
Chinese Academy of Agricultural Mechanization Sciences Group Co., Ltd., Beijing 100083, China
2
Key Laboratory of Agricultural Products Processing Equipment, Ministry of Agriculture and Rural Affairs, Beijing 100083, China
3
College of International Education, Beijing University of Agriculture, Beijing 102206, China
*
Author to whom correspondence should be addressed.
Agriculture 2024, 14(5), 787; https://doi.org/10.3390/agriculture14050787
Submission received: 16 December 2023 / Revised: 26 April 2024 / Accepted: 29 April 2024 / Published: 20 May 2024

Abstract

:
More efficient resource utilization and increased crop utilization rate are needed to address the growing demand for food. The efficient quality testing of key agricultural products such as potatoes, especially the rapid testing of key nutritional indicators, has become an important strategy for ensuring their quality and safety. In this study, visible and near infrared (Vis/NIR) transmittance spectroscopy (600–900 nm) was used for the online analysis of multiple quality parameters in potatoes. The study concentrated on comparing three one-dimensional convolutional neural network (1D-CNN) models, specifically, the fine-tuned DeepSpectra, the fine-tuned 1D-AlexNet, and classic CNN, with UVE-PLS (uninformative variable elimination–partial least squares) models. These models utilized spectral data for the real-time detection of dry matter (DM) content in potatoes. To address the challenges posed by limited data from Vis/NIR, this study strategically implemented data augmentation techniques. This approach significantly enhanced the robustness and generalization capabilities of the models. The 1D-AlexNet and DeepSpectra models achieved 0.934 and 0.913 R2P and 0.0603 and 0.0695 g/100 g RMSEP for DM, respectively. Compared to UVE-PLS, the R2P value improved by 21.31% (0.770 to 0.934) for the 1D-AlexNet model and 18.64% (0.770 to 0.913) for the DeepSpectra model. The RMSEP value was reduced by 47.31% (0.114 to 0.0603) for 1D-AlexNet, and 39.30% (0.114 to 0.0695) for the DeepSpectra model. As a result, this study would be helpful for researching the online Vis/NIR transmission determination of potato DM using deep learning. These results highlighted the immense potential of employing specific spectral features in deep-learning models for a more precise and efficient online assessment of agricultural quality. This advancement provided some insight and reference for further contributing to the evolution of more targeted and efficient quality assessment methods in agricultural products.

1. Introduction

Potatoes, rich in starch, dry matter, and other nutrients, play a critical role as food crops and industrial raw materials in over 150 countries [1]. According to the GB/T 31784-2015 [2], dry matter (DM), starch (SC), and reducing sugar (RS) serve as key nutritional indicators. However, traditional nutrient determination methods, including physical, chemical, and enzymatic techniques, are often time-consuming, labor-intensive, and expensive, requiring specialized training and facilities.
To address these challenges, fast and effective methods must be developed for the real-time determination of nutrition content in potatoes. Researchers have utilized the properties of light, sound, and electricity to form a series of emerging sensing and detection technologies, including machine vision, near-infrared spectroscopy, and hyperspectral imaging [3]. Among the aforementioned non-destructive techniques, Vis/NIR spectroscopy serves as one of the most commonly used techniques due to its lack of contact, rapid response rate, and low operating cost [4,5,6]. The effectiveness of Vis/NIR spectroscopy in determining sugar [6,7], starch [8,9], and dry matter [10,11] content in agricultural products highlights its potential for determining potato quality.
Short-wavelength near-infrared spectroscopy (over a wavelength region of 750–950 nm), used in partial transmittance optical geometry, was assessed as a means of estimating the dry matter concentration of potato tubers by P. P. Subedi. A prediction accuracy of R2 of 0.85 with a root mean square error of prediction (RMSEP) of 1.52% was achieved for intact whole tubers [11]. Rady A M aimed to extract the primary wavelengths related to the prediction of glucose and sucrose for potato tubers and investigated the potential of classification of potatoes based on sugar levels important to the frying industry. Prediction models showed a strong correlation with the R (RPD) correlation coefficient (ratio of reference standard deviation to the root mean square error of the model) values for whole tubers, with glucose values as high as 0.81 (1.70) [12]. Wang et al. [13] used a localized transmission spectroscopy acquisition system for the rapid detection of potato dry matter, starch, and reducing sugar content. The coefficients of determination of the prediction model validation set were 0.878, 0.865, and 0.888, and the root mean square errors of the validation set were 0.449%, 0.930%, and 0.0167%, respectively. Tang et al. [14] established a near-infrared spectroscopy (NIRS) assay for the high-throughput analysis of sweet potato root quality, including total starch, amylose, amylopectin, the ratio of amylopectin to amylose, soluble sugar, crude protein, total flavonoid content, and total phenolic content. Eight optimal equations were developed with an excellent coefficient of determination for calibration (R2C) of 0.95–0.99, validation (R2V) of 0.89–0.96, and RPD of 6.33–11.35. The internal quality inspection of a single sample could be accomplished with high accuracy, satisfying the requirements of non-damage inspection. However, these studies were based on static testing, which has not been able to solve the industrial demand for online real-time detection and grading of internal quality.
Vis/NIR spectroscopy combined chemometrics have been extensively investigated, with the most prevalent methods typically employing classical machine-learning techniques such as PLS regression, a time-proven standard in the field [15,16]. However, PLS performance heavily relies on the chosen data preprocessing technique for each dataset. As a result, diverse approaches have often been used in the literature, resulting in a trial-and-error approach. A practical method for one dataset may negatively affect the analysis of another, even if assessing the same substance, leading to unexpectedly inferior results [17]. Therefore, adopting a deep-learning approach offers a promising solution to address this issue. To the best of our knowledge, a notable gap exists in the literature regarding the non-destructive and online detection of DM content by deep learning in potatoes, requiring the establishment of efficient and effective methods for the simultaneous online detection of multiple potato nutrients. Addressing this gap is critical for advancing the potato industry in China.
In this research, fine-tuned state-of-the-art deep-learning-based methods were applied to detect dry matter in potatoes using Vis/NIR spectroscopy. The specific objectives involved (1) adopting added random Gaussian noise to expand data before model calibration strategically. (2) This study also adopted 1D-CNNs and UVE-PLS to rapidly and accurately complete the online potato DM evaluation and (3) performed a visualization wavelength contribution for DM prediction.

2. Materials and Methods

2.1. Sample Preparation

Given that the Favorita potato variety is the most widely distributed potato variety in China [18], this study specifically selected Favorita potatoes from a farmer’s market in Chaoyang, Beijing, China, for analysis. All potatoes were thoroughly cleaned and stored for a standardized 24 h period at room temperature before experimentation to ensure that external factors such as dust, temperature, humidity, and storage duration did not affect the research findings, followed by spectral analysis. To maintain consistency, 100 potato samples were selected that were free from defects such as insect damage or mechanical injuries on their surfaces to create dependable quantitative prediction models for dry matter content.

2.2. Vis/NIR Spectroscopy System

The potato acquisition system for Vis/NIR transmission spectroscopy consisted of a delivery module, a light source module, spectral acquisition module, control module, and data analysis module. A 100 W halogen lamp was used vertically as a light source on the sample. The system used a USB2000+ spectrometer (OceanOptics, Orlando, FL, USA), which had a scanning wavelength range of 350–1000 nm and spectral resolution of 1 nm. The spectrometer was positioned in a black box and controlled by custom-built software. The software was installed on a 12th Gen Intel (R) Core (TM) i9-12900K CPU @3.20 GHz (32G RAM) system (Intel Corporation, Santa Clara, CA, USA). Two blue conveyor belts (v-belt), controlled by a PLC system, were used to place the potatoes (Figure 1). In Figure 1b,c, the dashed box emphasizes the spectral acquisition module, containing the spectrometer and associated optics crucial for capturing and analyzing the light sample. The green arrow shows the direction of sample movement within the system. The blue arrows signify a detailed explanation or an expanded view of the spectral acquisition module.
Before spectral analysis, the system was warmed up for 30 min to prevent any possible impact on the experimental results caused by system instability. Following energy stabilization of the light source, the dark light source was calibrated and spectral analysis of the samples was conducted. The home-built software controlled the conveyor belt to sequentially drive the potatoes through a spectral acquisition module. Once the potato arrived at the detection position, an in-place sensor triggered the acquisition of the transmission spectra of the potatoes. As light passed through the interior of the potatoes, it carried internal quality information to the spectrometer, which received the spectral signals. The integration time for spectrum acquisition was 25 ms, and the online inspection speed of the samples was approximately 5 samples per second. Each sample was repeatedly measured 10 times, and the average of 10 measurements was used to determine the raw Vis/NIR spectrum of the samples.

2.3. Functional Components

The functional components detection of the potato samples involved several active steps. The edible portion of the potatoes was peeled, and the peeled potatoes were then crushed immediately. Finally, the crushed potato samples were analyzed for DM content, utilizing a direct drying method [19]. The SC was measured by the acid hydrolysis method [20], and the RS content was measured using the 3.5-dinitrosalicylic acid colorimetric method [21]. Testing was performed twice for each sample to ensure accuracy.

2.4. Data Augmentation of Spectra

Samples were actively engaged in data-driven training to achieve the exceptional performance of the CNN model in this study. This technique allowed the neural network to learn the intrinsic characteristics of the sample data and for the categories to be differentiated in-depth, which enhanced the model’s robustness and minimized overfitting. However, due to practical experimental constraints, collecting a significant amount of data at once often poses a challenge, which can be detrimental to deep-learning models [22].
In this study, this issue was addressed by strategically expanding our experimental samples before model calibration. Data augmentation techniques were implemented to increase the diversity of the sample data, and random Gaussian noise was added to the original spectra, increasing the total number of spectra from 100 to 1000. This method effectively expanded datasets, providing a more robust foundation for training the CNNs and improving the generalization performance and robustness of the network [23,24].

2.5. UVE-PLS Model

The PLS approach was established around 50 years ago by Herman Wold for the modeling of complicated data. This approach can analyze data with strongly collinear (correlated), noisy, and numerous X-variables, and simultaneously model several response variables [25]. The spectral bands related to the maximum and minimum of beta-coefficient values can present the most important wavelengths [26]. Uninformative variable elimination by PLS (UVE-PLS) [27] can remove uninformative variables in multivariate data, i.e., those not containing more information than random noise.

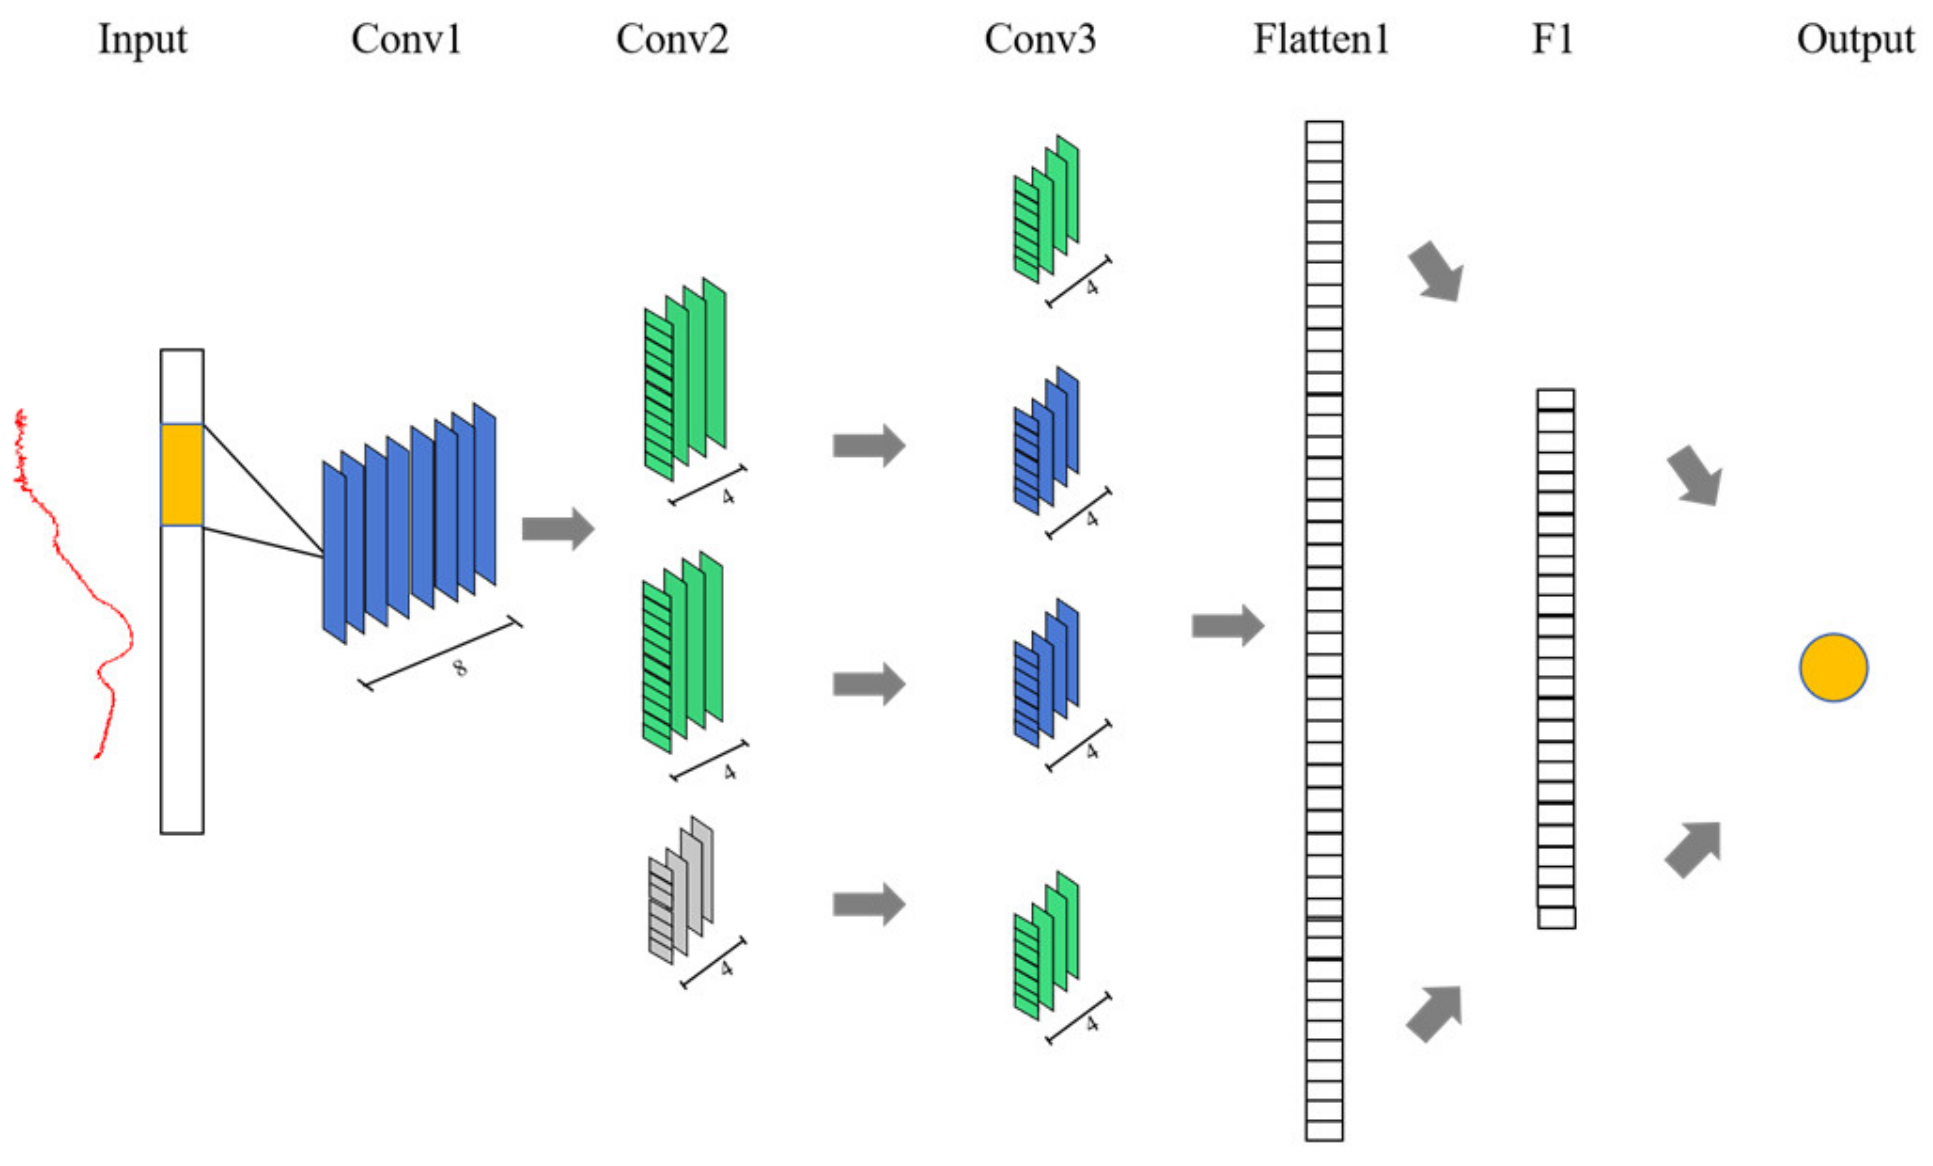
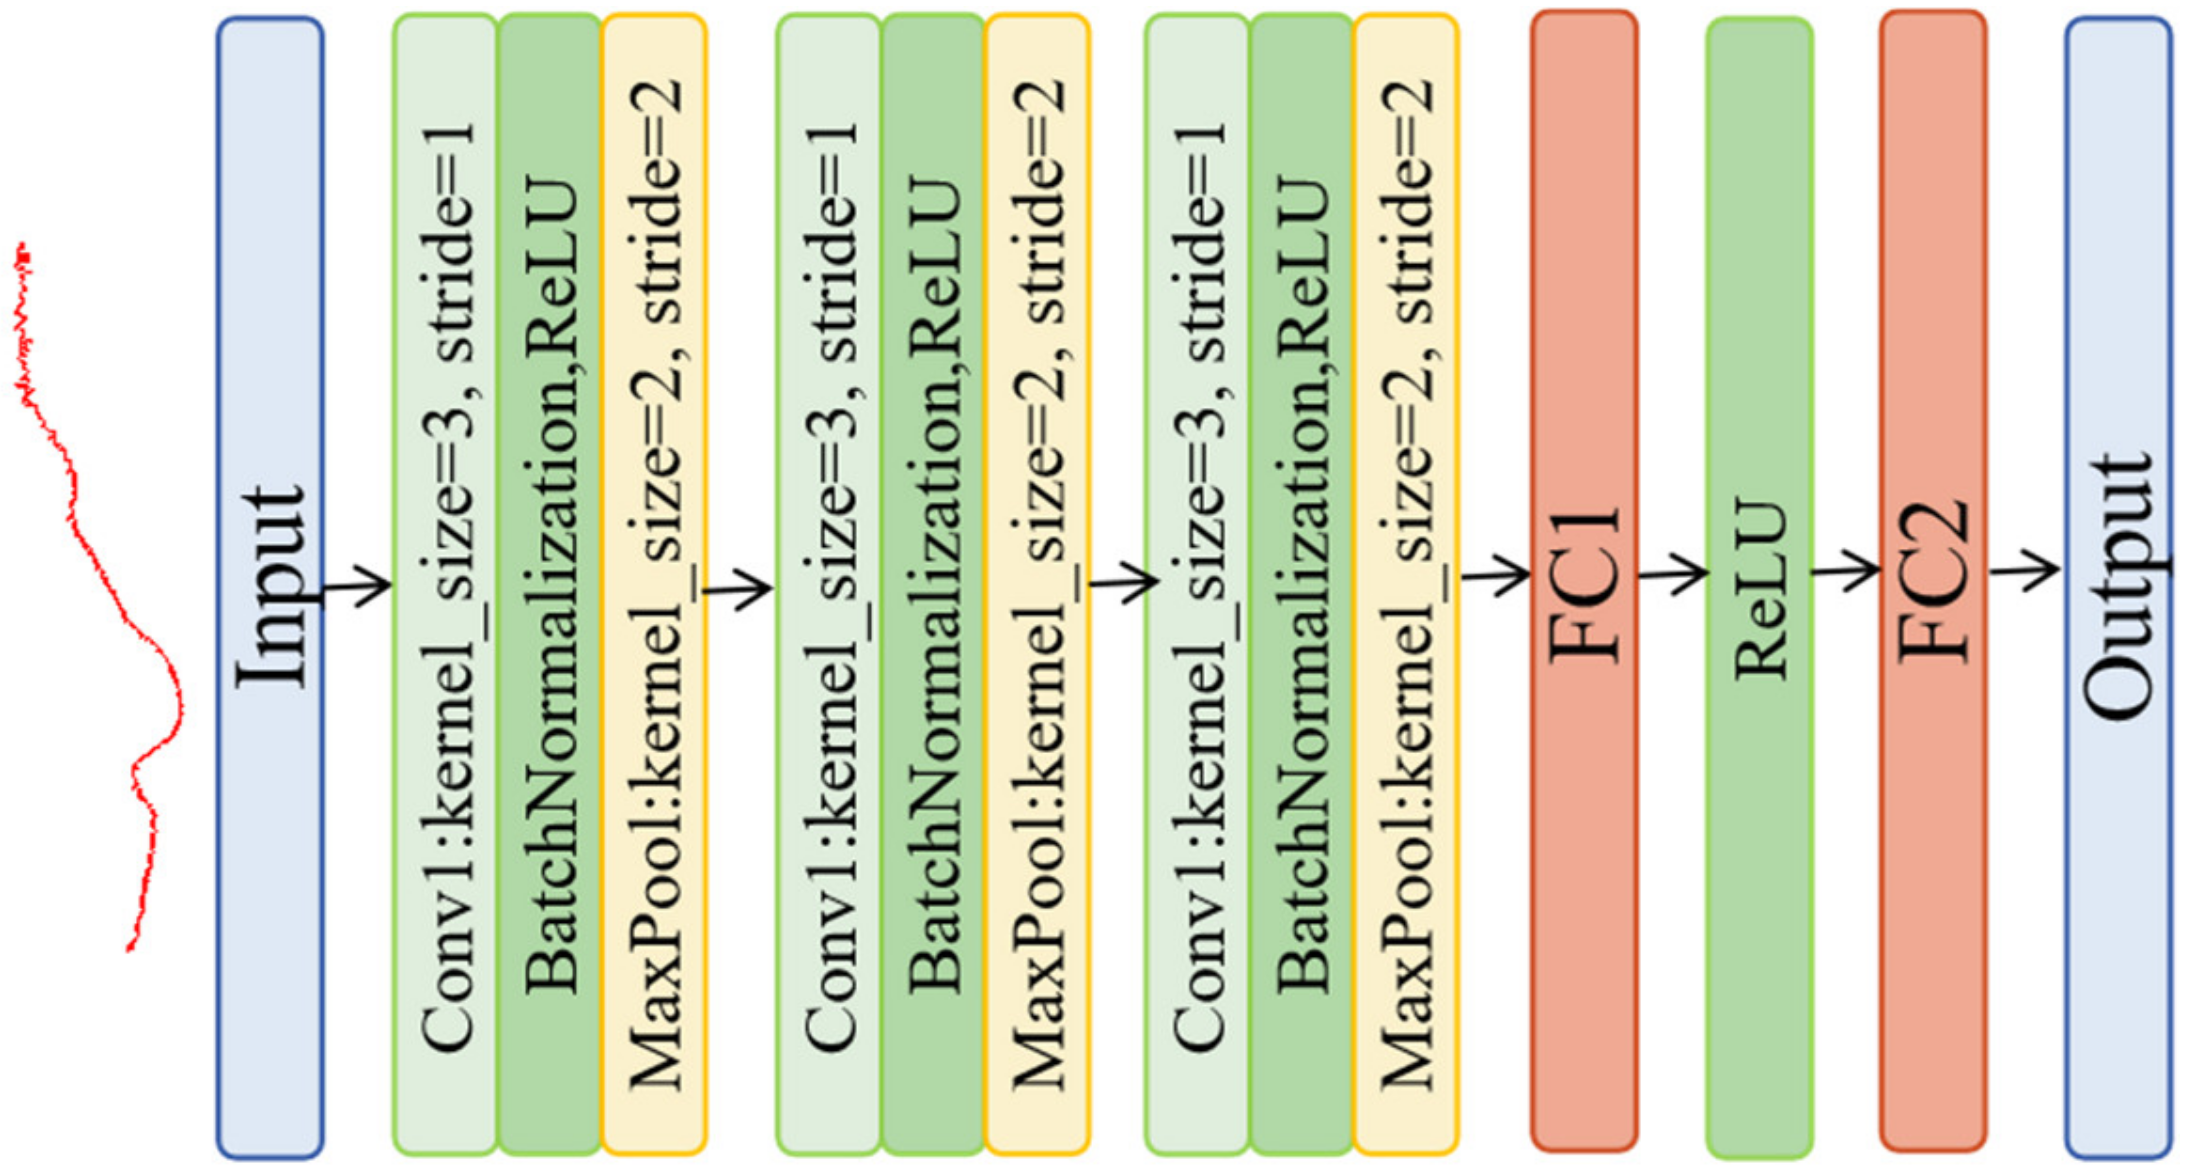
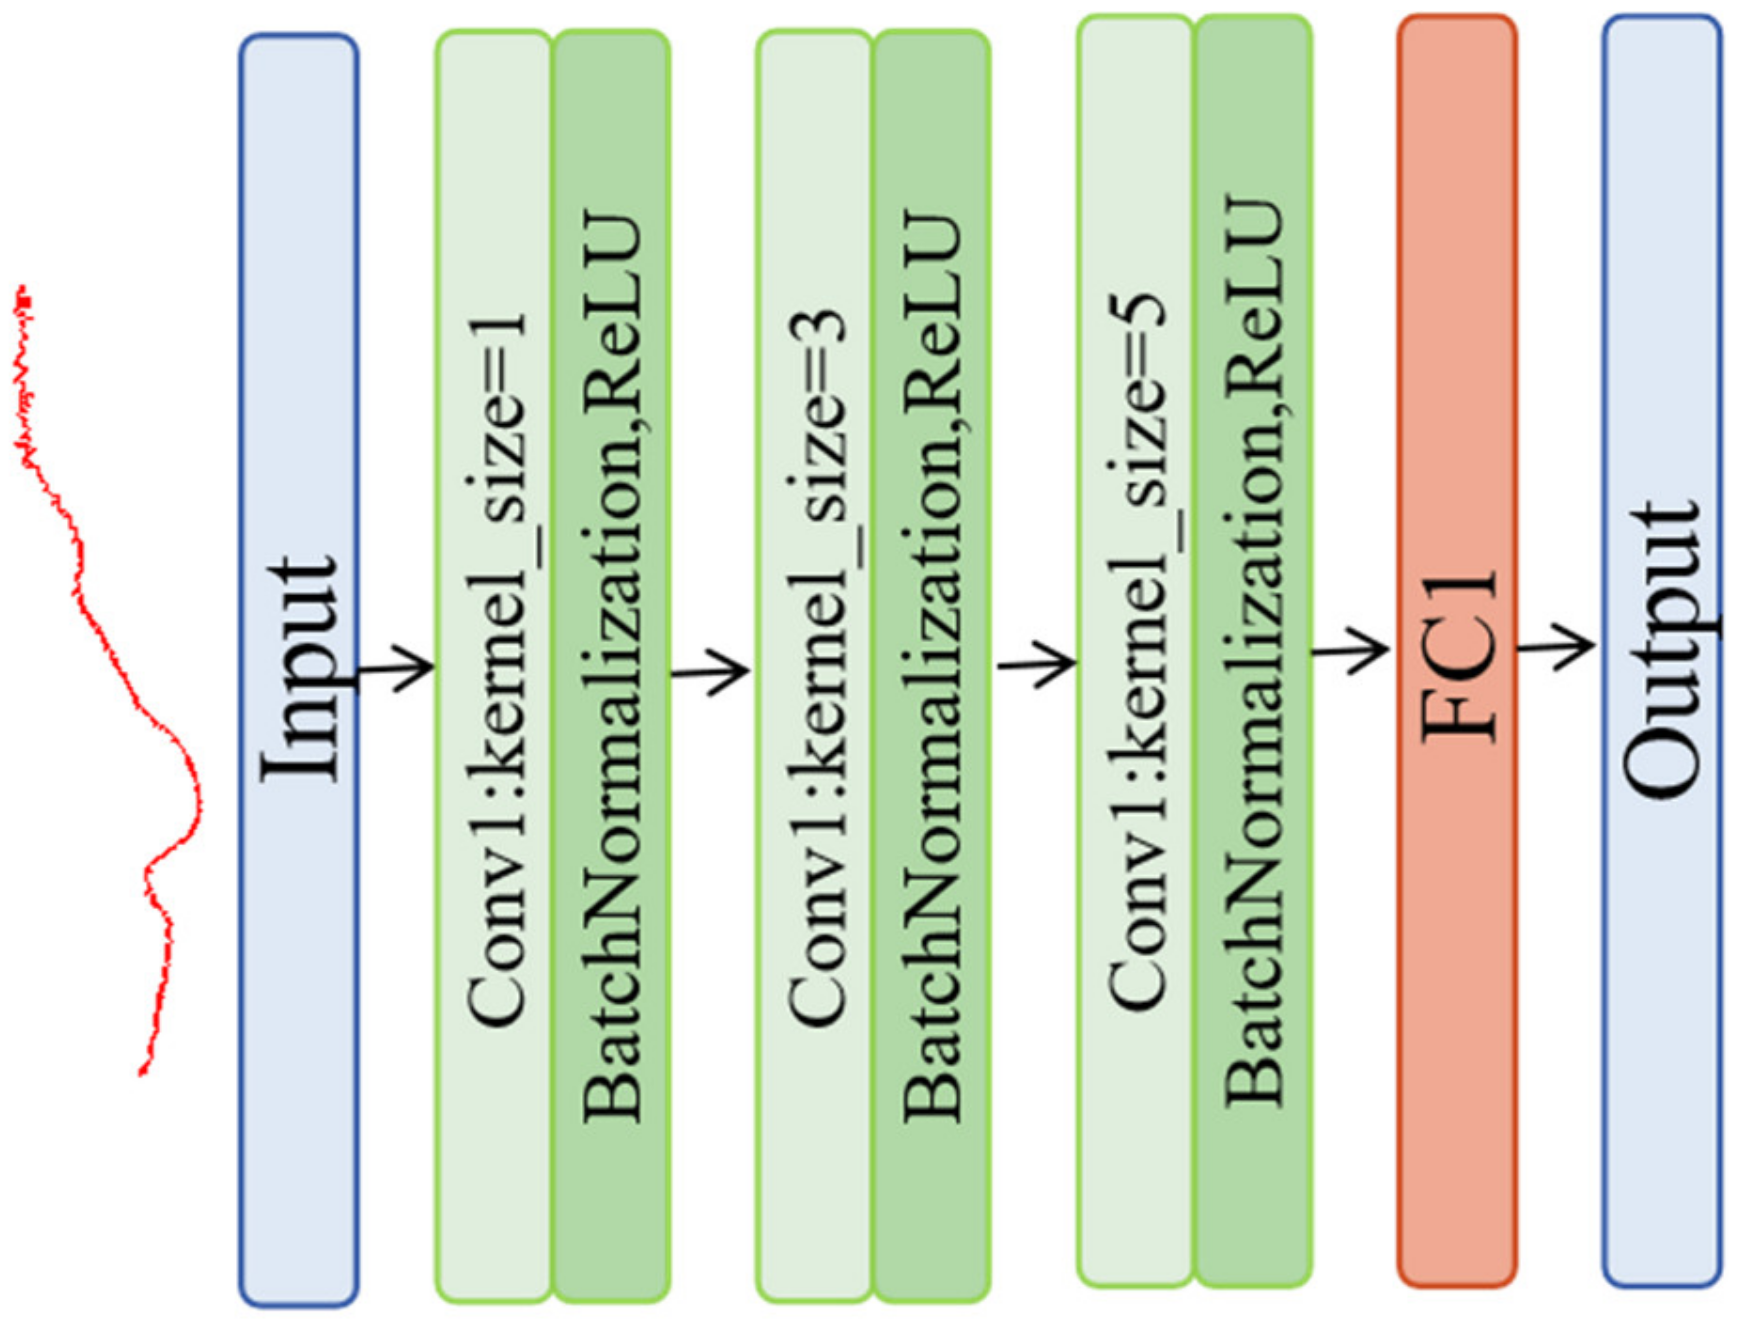
2.6. Convolution Neural Network

DeepSpectra [28], a robust deep-learning architecture developed for spectral analysis, contains the Inception model. Figure 2 displays the framework of DeepSpectra. This model consists of three convolutional layers, with the last two convolutional layers incorporating a connection in parallel, followed by a flattened layer, a fully connected layer, and an output layer. A convolution kernel of larger size possesses a broader receptive field, enabling it to effectively capture more global features. Nevertheless, employing several large convolution kernels can result in a rapid increase in the number of parameters [29,30]. As a solution, a strategy was adopted where a smaller kernel was utilized for the initial convolution layer, while a larger kernel was chosen for the subsequent convolution layer. This study used five-point (5-pts) kernel sizes for the first two convolutional layers and 11-pts for the third layer, and the stride sizes were 3-pts and 1-pts for the convolutional layers [28]. DeepSpectra has demonstrated a dropout value of 0.5 for DM.
This study adopted a fine-tuned 1D-AlexNet architecture, which was comprised of three convolutional stages with one-dimension layers, each supplemented with batch normalization (BN) and ReLU activation for efficient feature extraction (Figure 3). This study also integrated max pooling layers to reduce dimensionality and transition to fully connected layers to map the extracted features to outputs [31]. The kernel_size was 3, the stride was 1 of the convolutional layers, and the kernel_size was 2, where the stride was 2 of the MaxPool layers. The 1D-AlexNet model had a dropout value of 0.1.
This study introduced a classic CNN for data processing (Figure 4), which was comprised of three layers. In the first layer, Conv1, one-dimensional convolution was implemented using 16 channels, each with a kernel size of 1, which was enhanced with batch normalization and ReLU activation. This layer was designed to capture distinctive features in the input data. In the second layer, the channels count was increased to 32 with a kernel size of 3, thereby advancing the feature refinement process. In this layer, batch normalization and ReLU activation were also integrated. In the third and final convolutional layer, the feature extraction capability with 64 channels and a kernel size of 5 was escalated and continued with batch normalization and ReLU. The network culminated with a fully connected layer, where the high-dimensional features extracted by the preceding layers were mapped to a single output tailored for tasks such as classification and detection. The classic CNN has shown a dropout value of 1.
All spectral data are standardized and all target labels are normalized before input. To prevent overfitting and reduce the need to set an exact number of epochs, early stopping, and L2 regularization were used. The optimizer was AdamW, the learning rate was 0.0001, and the weight_decay was 0.0001. The model was trained for 100 epochs. For the objective function, the mean squared error (MSE) and L2 regularization were used to minimize the sum of squares loss and prevent overfitting.

2.7. GRAD-CAM

Understanding why a model makes a certain prediction can be as crucial as the prediction’s accuracy in many applications. However, the highest accuracy for large modern datasets is often achieved by complex models that even experts struggle to interpret, such as ensemble or deep-learning models, creating a tension between accuracy and interpretability. Gradient-weighted class activation mapping (GRAD-CAM) has been used in the field of computer vision, particularly in CNNs, to provide visual explanations for decisions made by CNNs in tasks such as image classification and object detection. Essentially, this approach backpropagates the signal from the output layer to the convolutional layers to understand which parts contribute most to the output decision. The gradient of the target (i.e., class, object) can be computed with respect to the feature maps of a convolutional layer. These gradients can be global-average-pooled to obtain the neuron importance weights, and the feature maps of the convolutional layer can be combined with these weights to generate a heatmap [32].

2.8. Statistical Analysis

In this study, the Gaussian filtering preprocessing, standardization, and normalization were employed to analyze the data and subsequently the 1D-CNN models and UVE-PLS prediction of the nutritional quality components of the potato samples. Finally, the three 1D-CNN models were compared to the UVE-PLS prediction of the nutritional quality components of potato samples.
In this study, potatoes were mixed and then divided into datasets. The spectral data were randomly divided into two groups: the calibration set and the prediction set by an 8:2 ratio (random scale factor of 42 for 1D-CNNs and 0 for UVE-PLS). The utilized evaluation metrics consisted of R-squared (R2), mean absolute error (MAE), and root mean square error (RMSE). RMSE measured the square root of the average of the squared differences (errors) between predicted and actual values, while a smaller RMSE indicated more accurate model predictions. MAE calculated the average absolute discrepancy between the predicted and actual values, while a smaller MAE indicated more accurate model predictions. R2 quantified the fraction of variance that the model accounted for on a scale of 0 to 1, where higher values (closer to 1) indicated the greater explanatory effectiveness of the model.
The experiments in this study were conducted on a Windows 10 operating system, using the Python programming language in the PyCharm platform. All models and chemometric procedures used throughout this work were implemented based on Python 3.9.

3. Results and Discussion

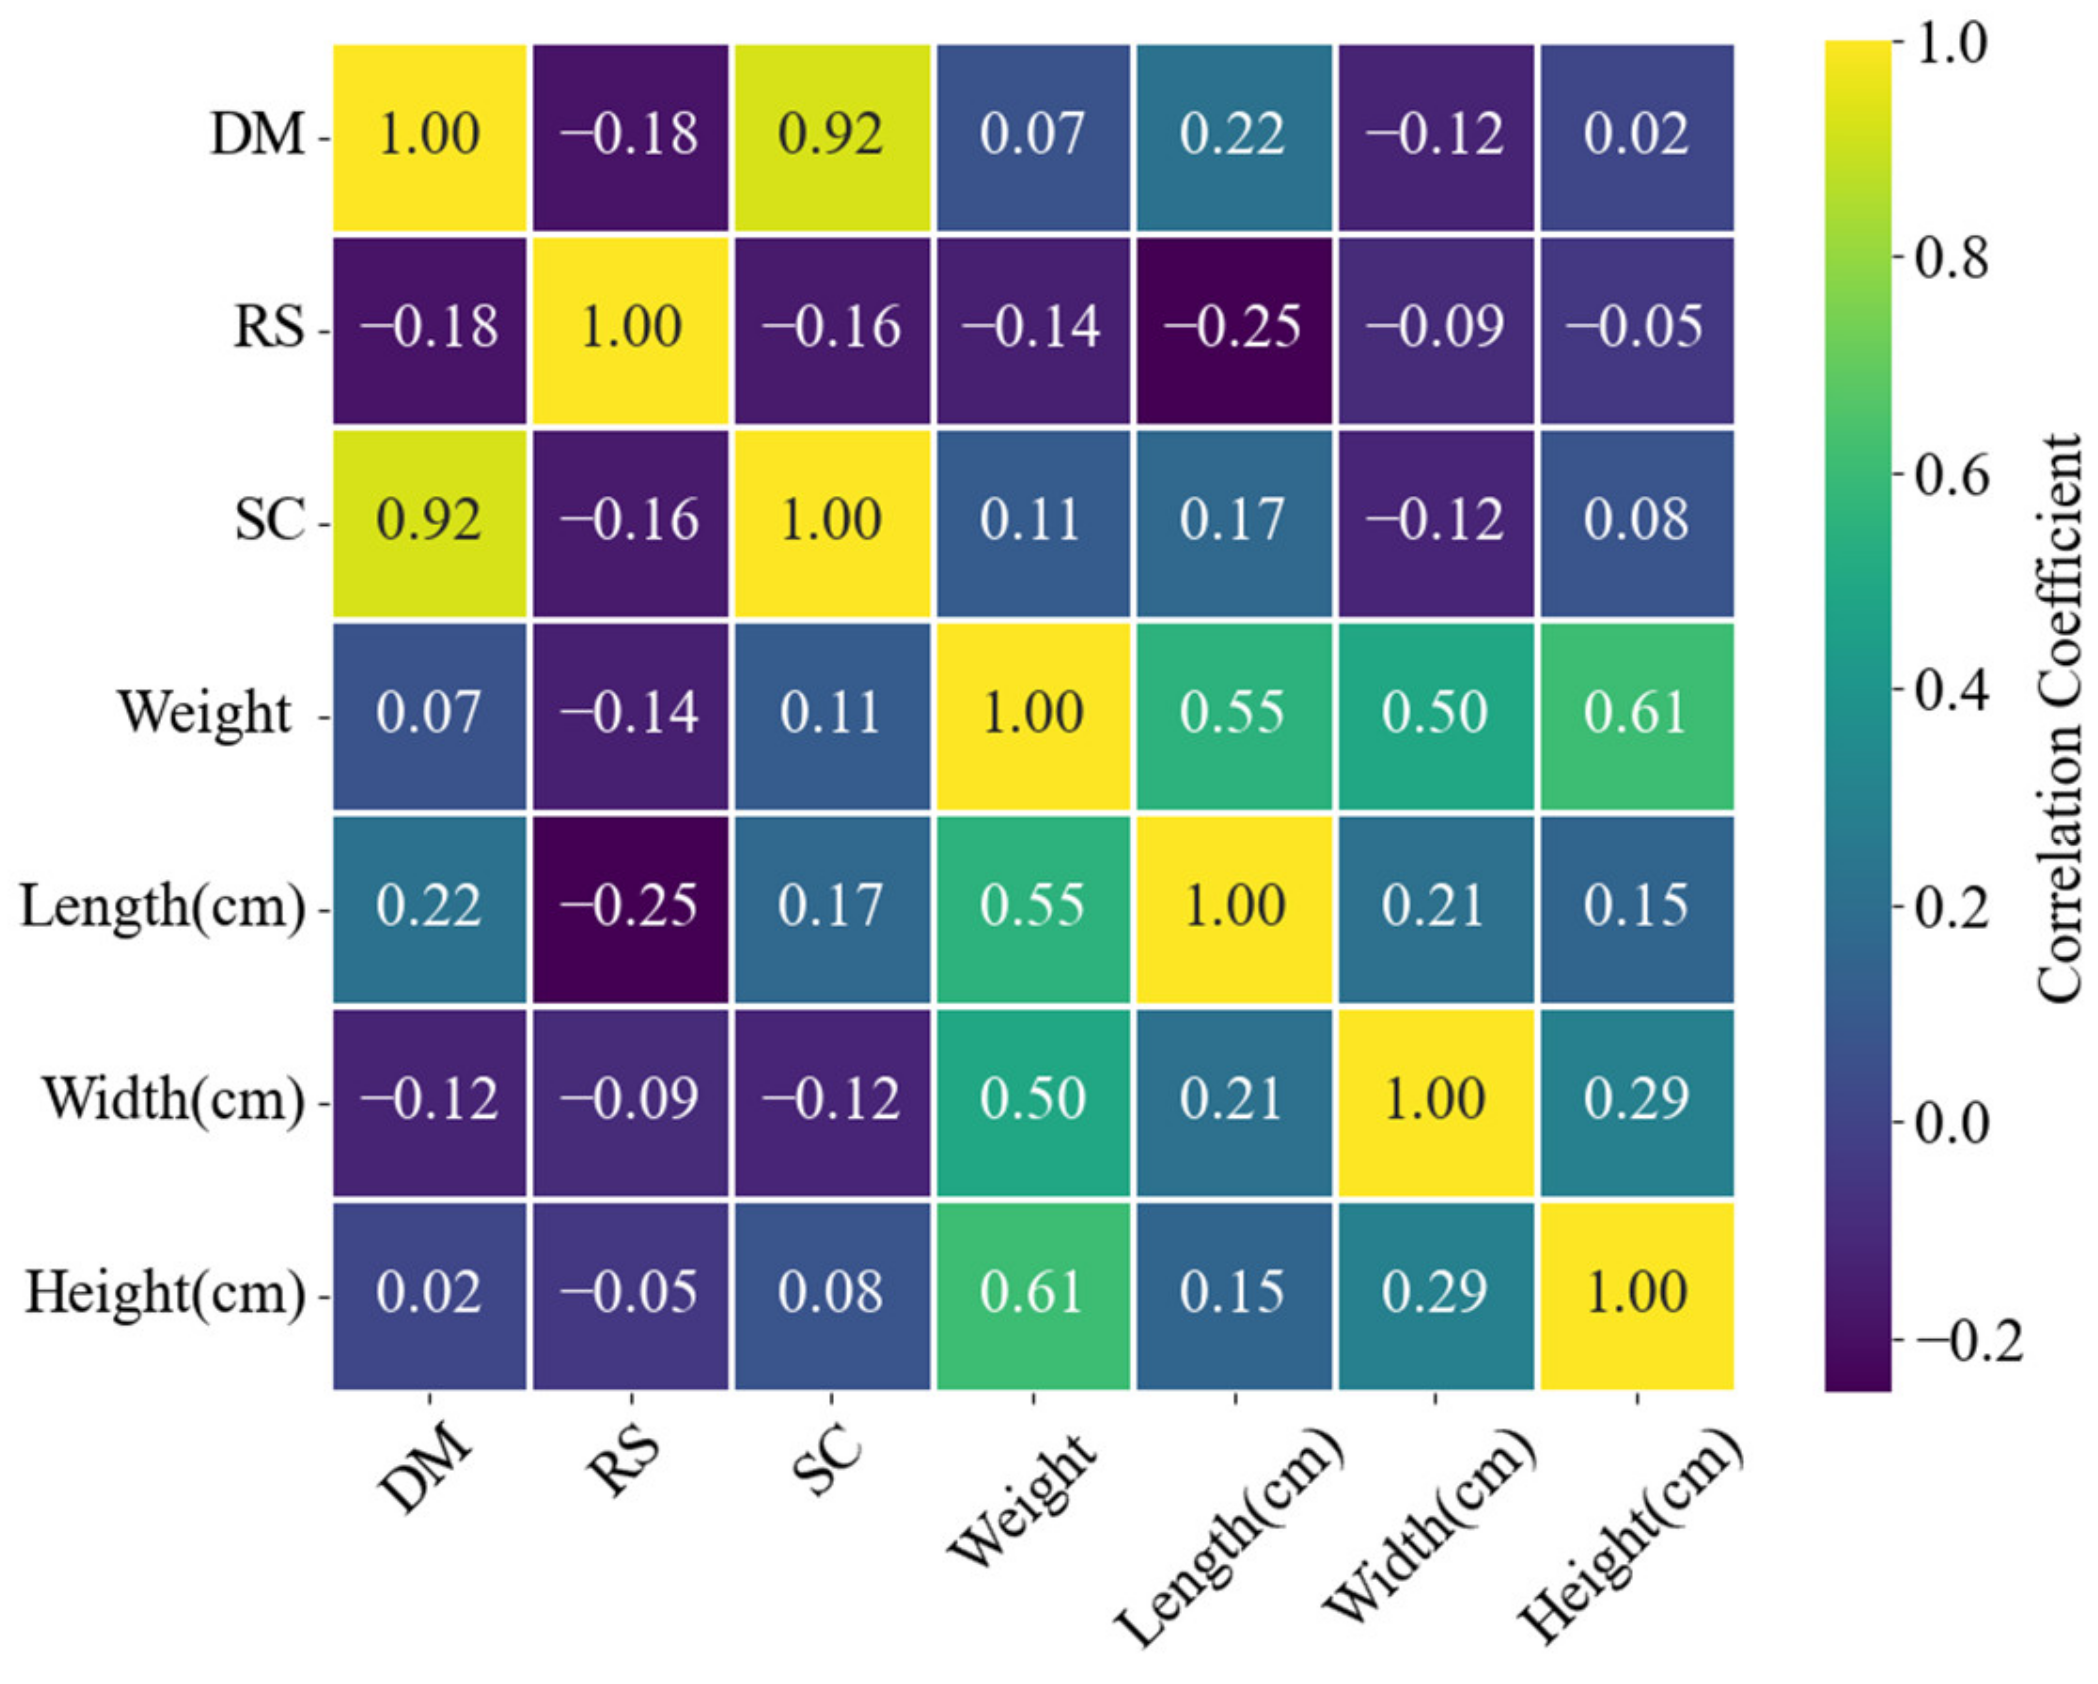
3.1. Analyzing the Determination of the Standard Physical and Chemical Values of Potatoes

Table 1 displays statistical results of the compositional and physical characteristics in potatoes, indicating that the reference DM values were in the range of 13.10–20.38 g/100 g, the reference SC was in the range of 9.20–17.91 g/100 g, and RS was in the range of 0.090–1.17 g/100 g, respectively. The dimensions of the samples varied, with widths ranging from 51.5 to 80.0 mm, heights from 42.0 to 68.0 mm, and lengths from 47.0 to 105.0 mm. Their weight ranged between 159.14 and 326.95 g.
This was conducted to determine the Pearson’s correlation coefficient between the variables compositional and physical characteristics. Figure 5 shows the results of the Pearson’s correlation coefficient, which revealed some interesting insights. The results indicated a strong positive linear relationship (0.92) between DM and SC, suggesting that an increase in dry matter content proportionally increased starch content. However, there was a weak negative linear relationship (−0.18) between DM and RS, indicating a slight tendency for the reducing sugars to decrease as the dry matter content increased. Similarly, a weak negative linear relationship (−0.16) was observed between SC and RS. This suggested that SC and RS varied more independently with each other than DM and SC. However, it should be acknowledged that this observed relationship may not be universally applicable across different environmental conditions or developmental stages of tubers.

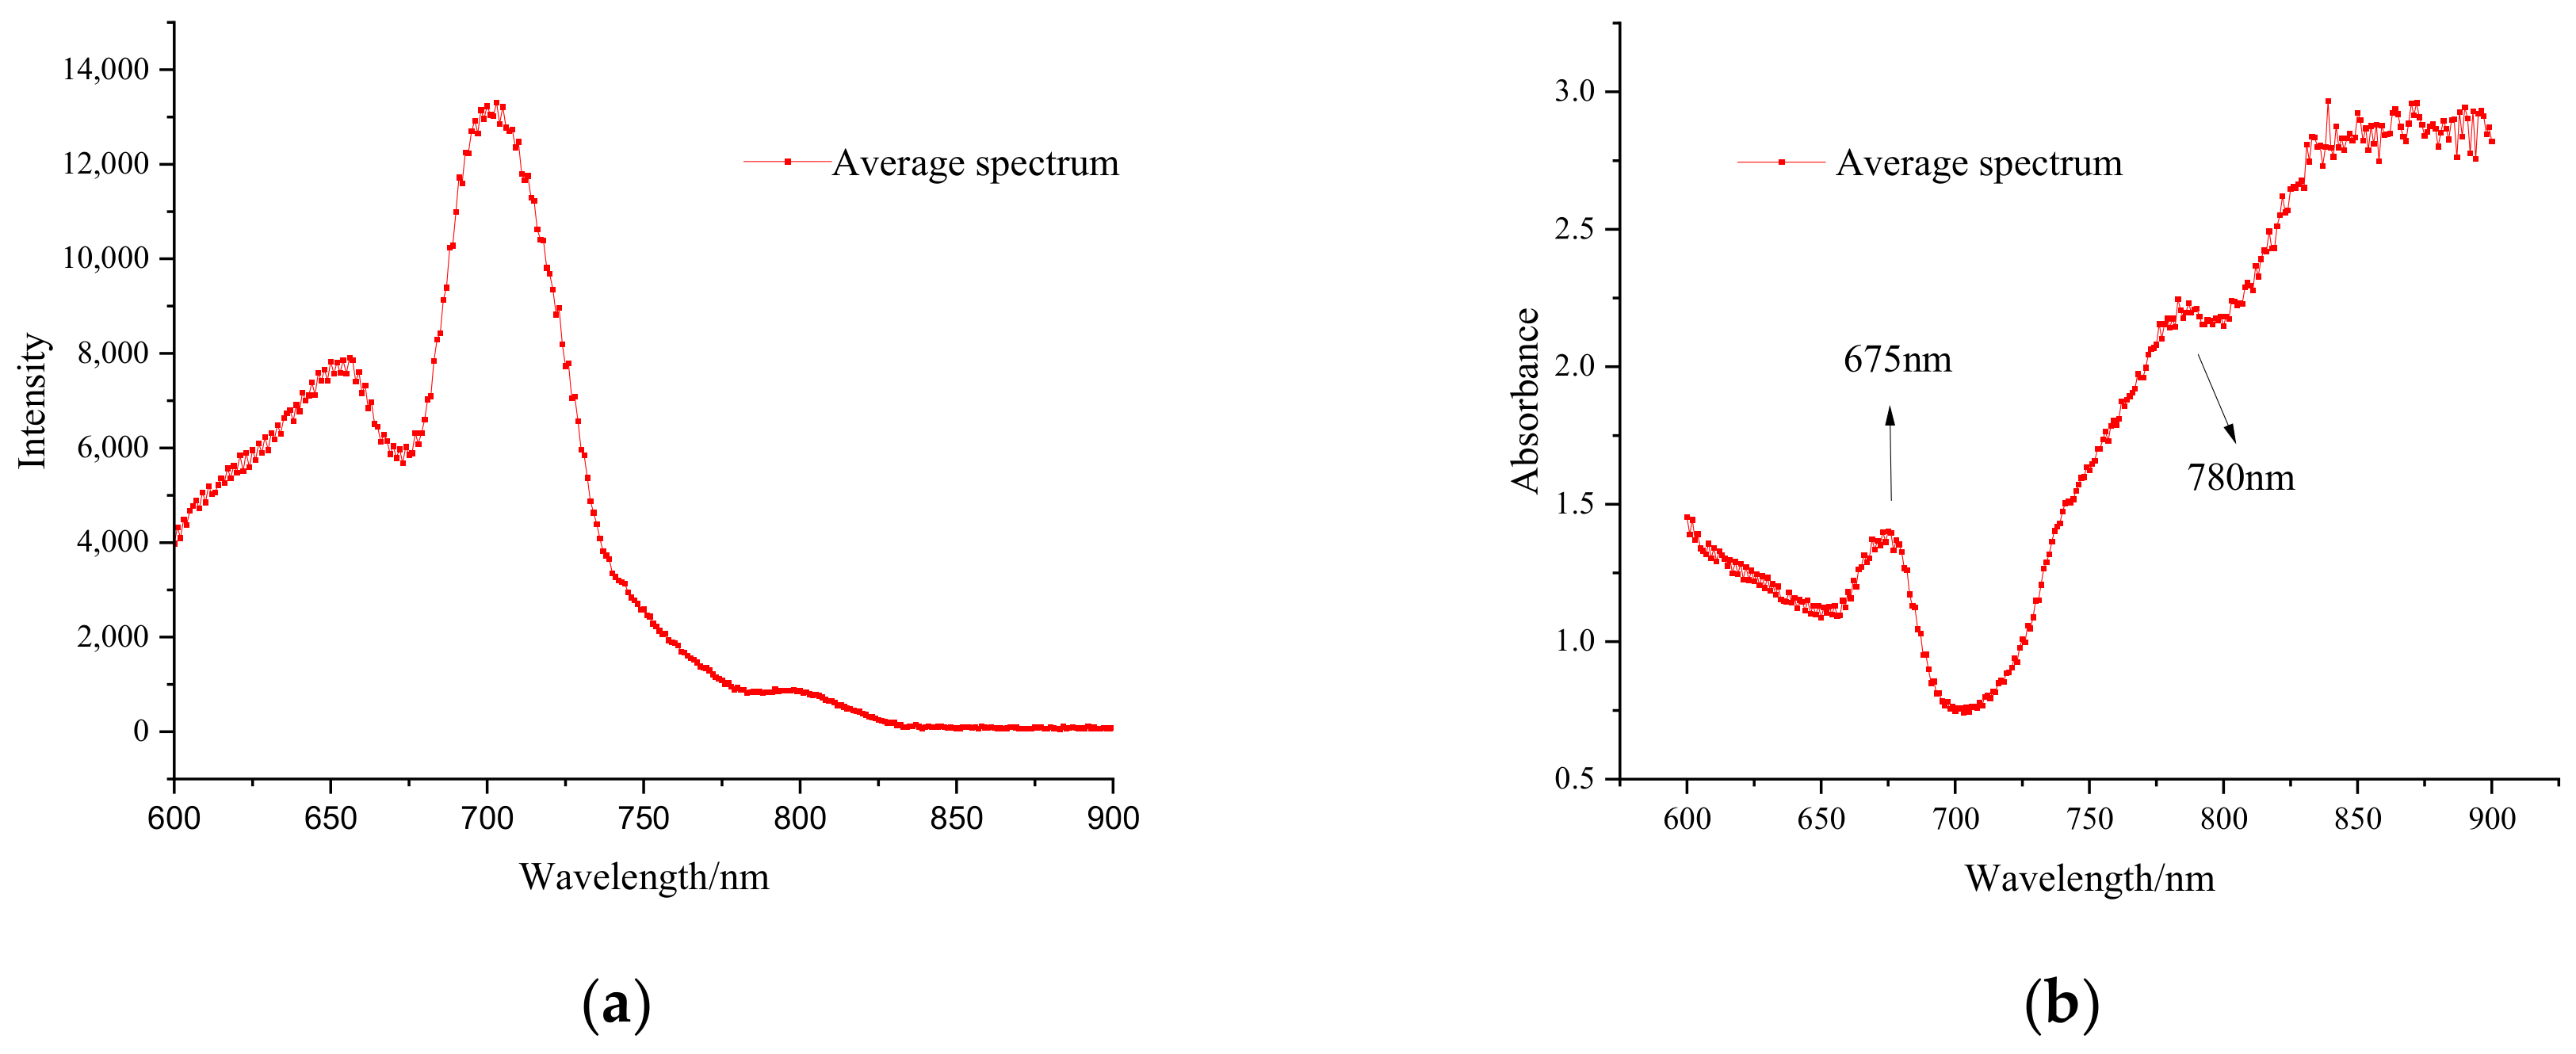
3.2. Analysis of the Visible/Near-Infrared Spectra of the Potatoes

The transmission spectrum (Figure 6a) of the potato was transformed into an absorbance spectrum, and the transformed spectral curve is shown in Figure 6b. Prominent transmission band peaks were observed between 600 and 850 nm, specifically, major transmission peaks were observed around 625–675, 675–725, and 780–810 nm. Major absorbance peaks found around 675 nm were the chlorophyll absorption peak [7,33], and the absorbance of the 675–700 nm spectrum gradually decreased with the weakening effect of chlorophyll on the spectra, demonstrating a small range of variation in the 700–900 nm range. Another absorbance peak normally attributed to the OH functional groups was found near 780 nm [34].

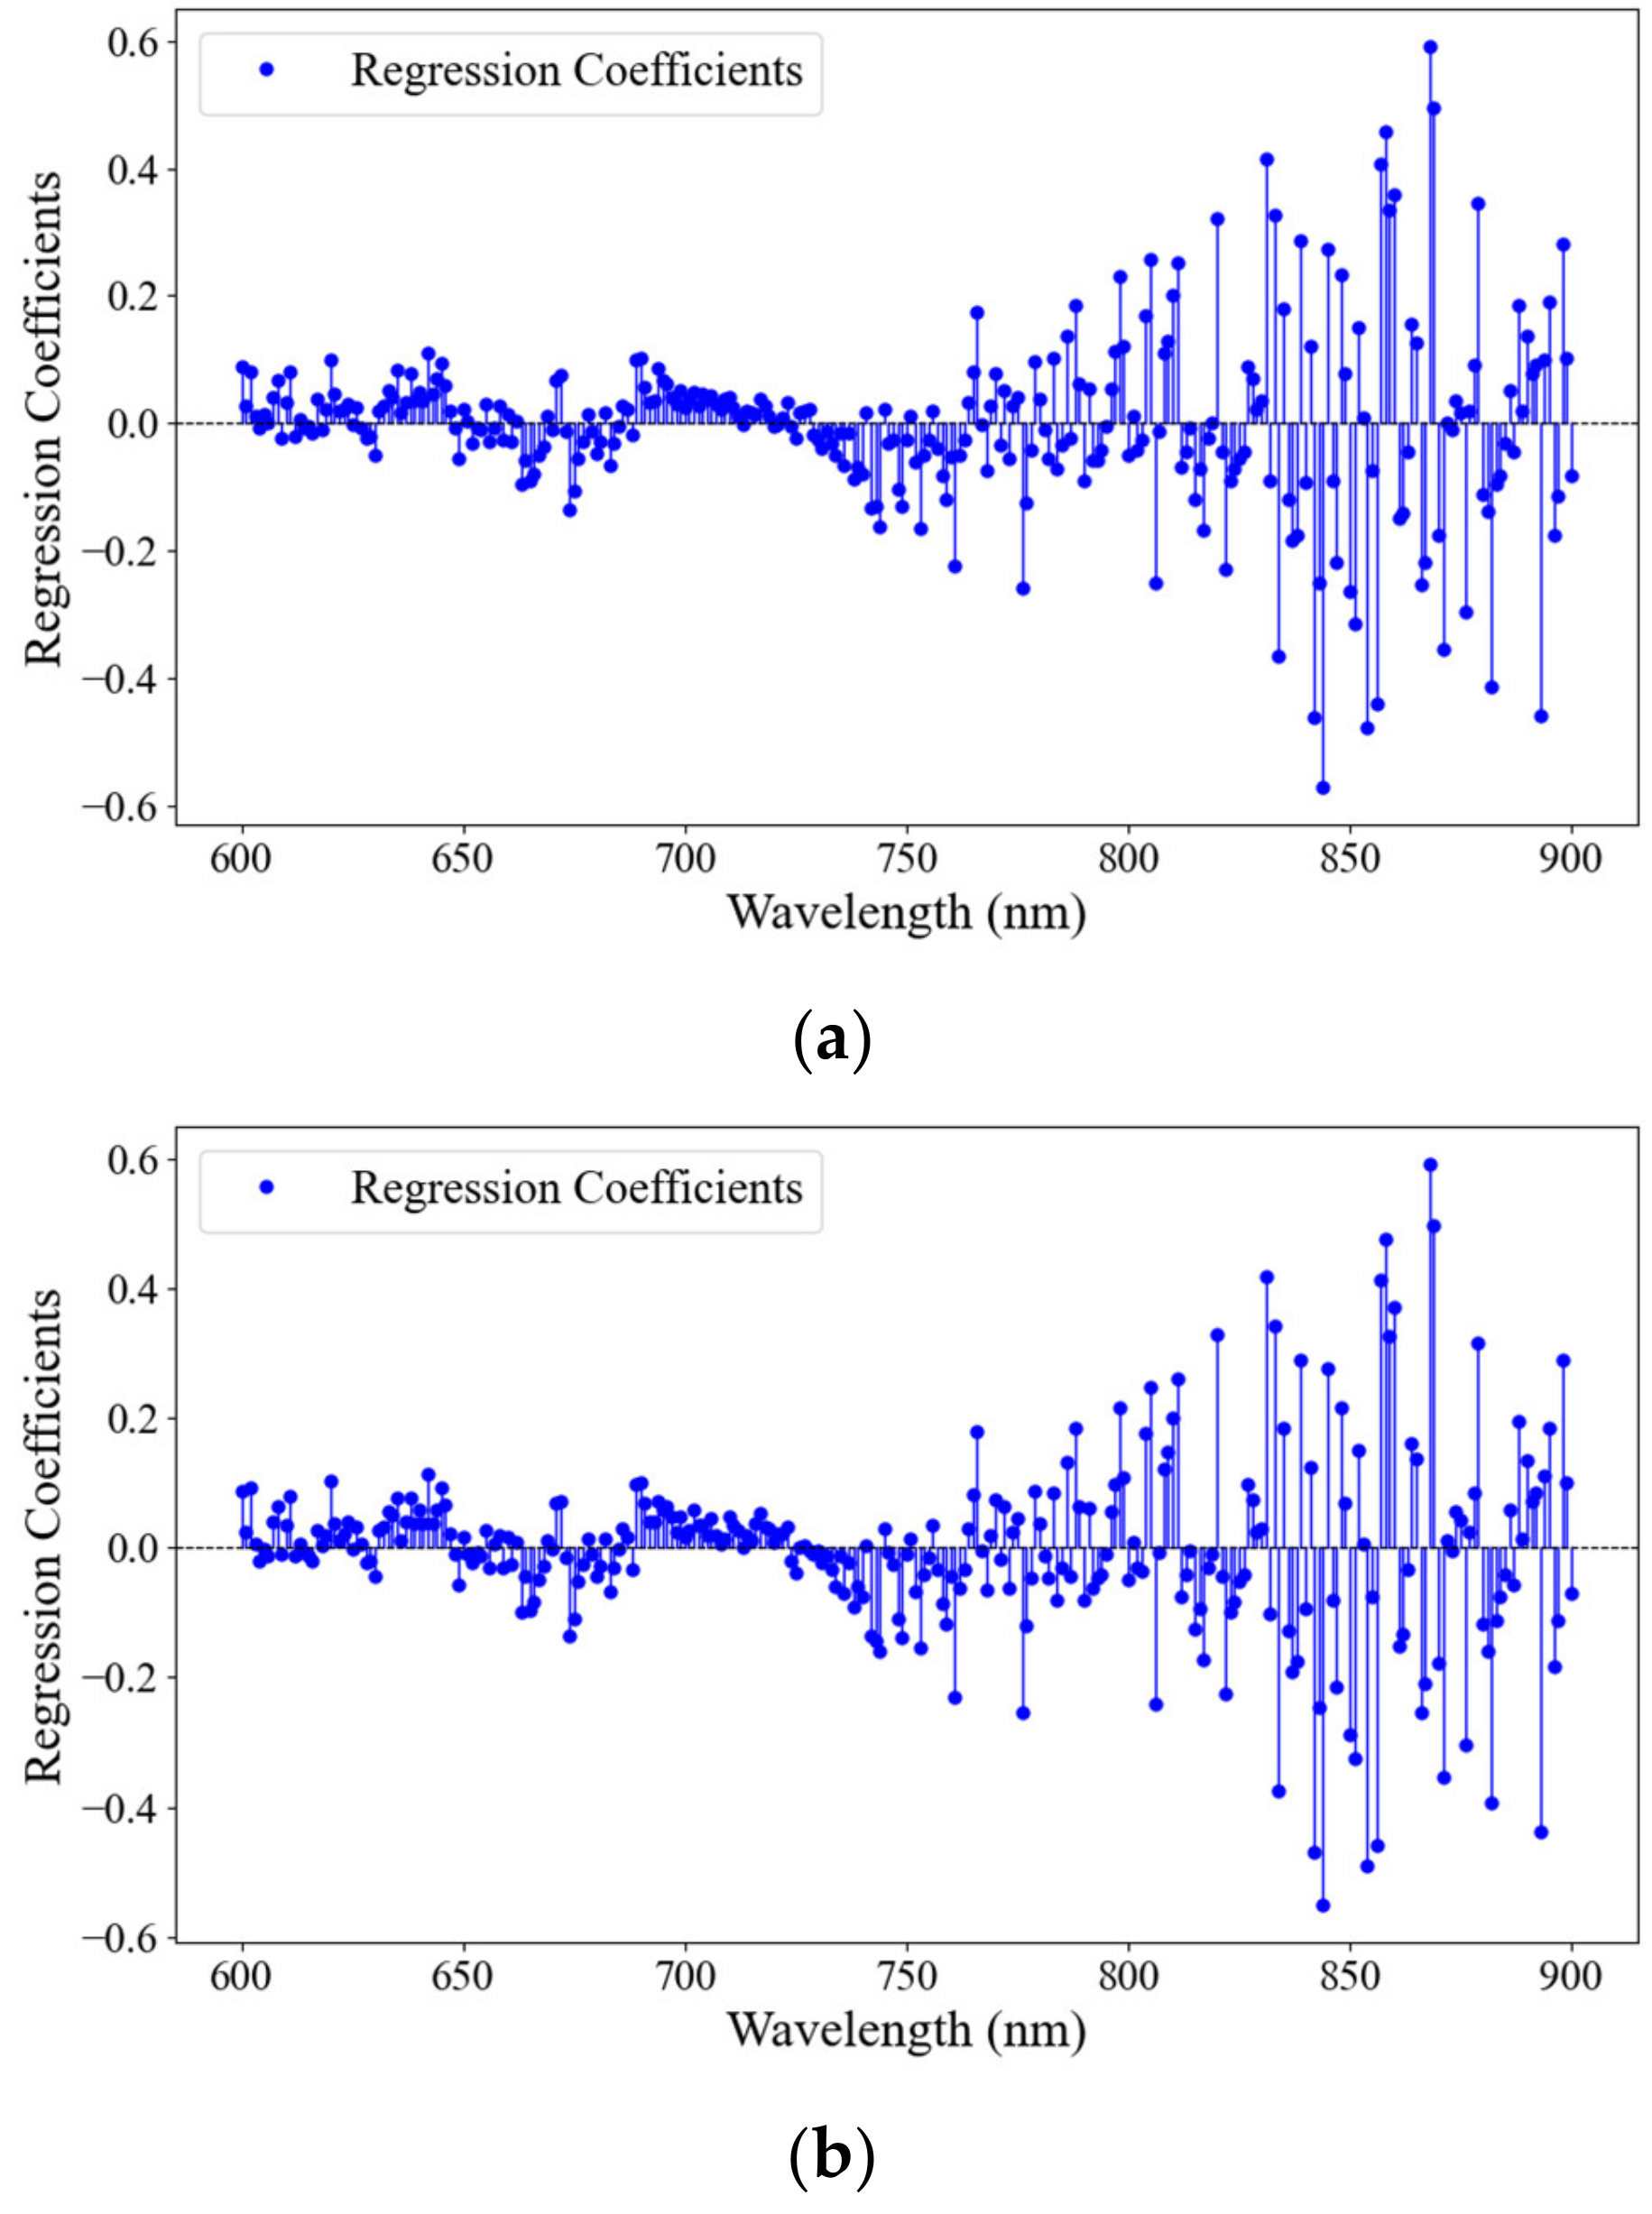
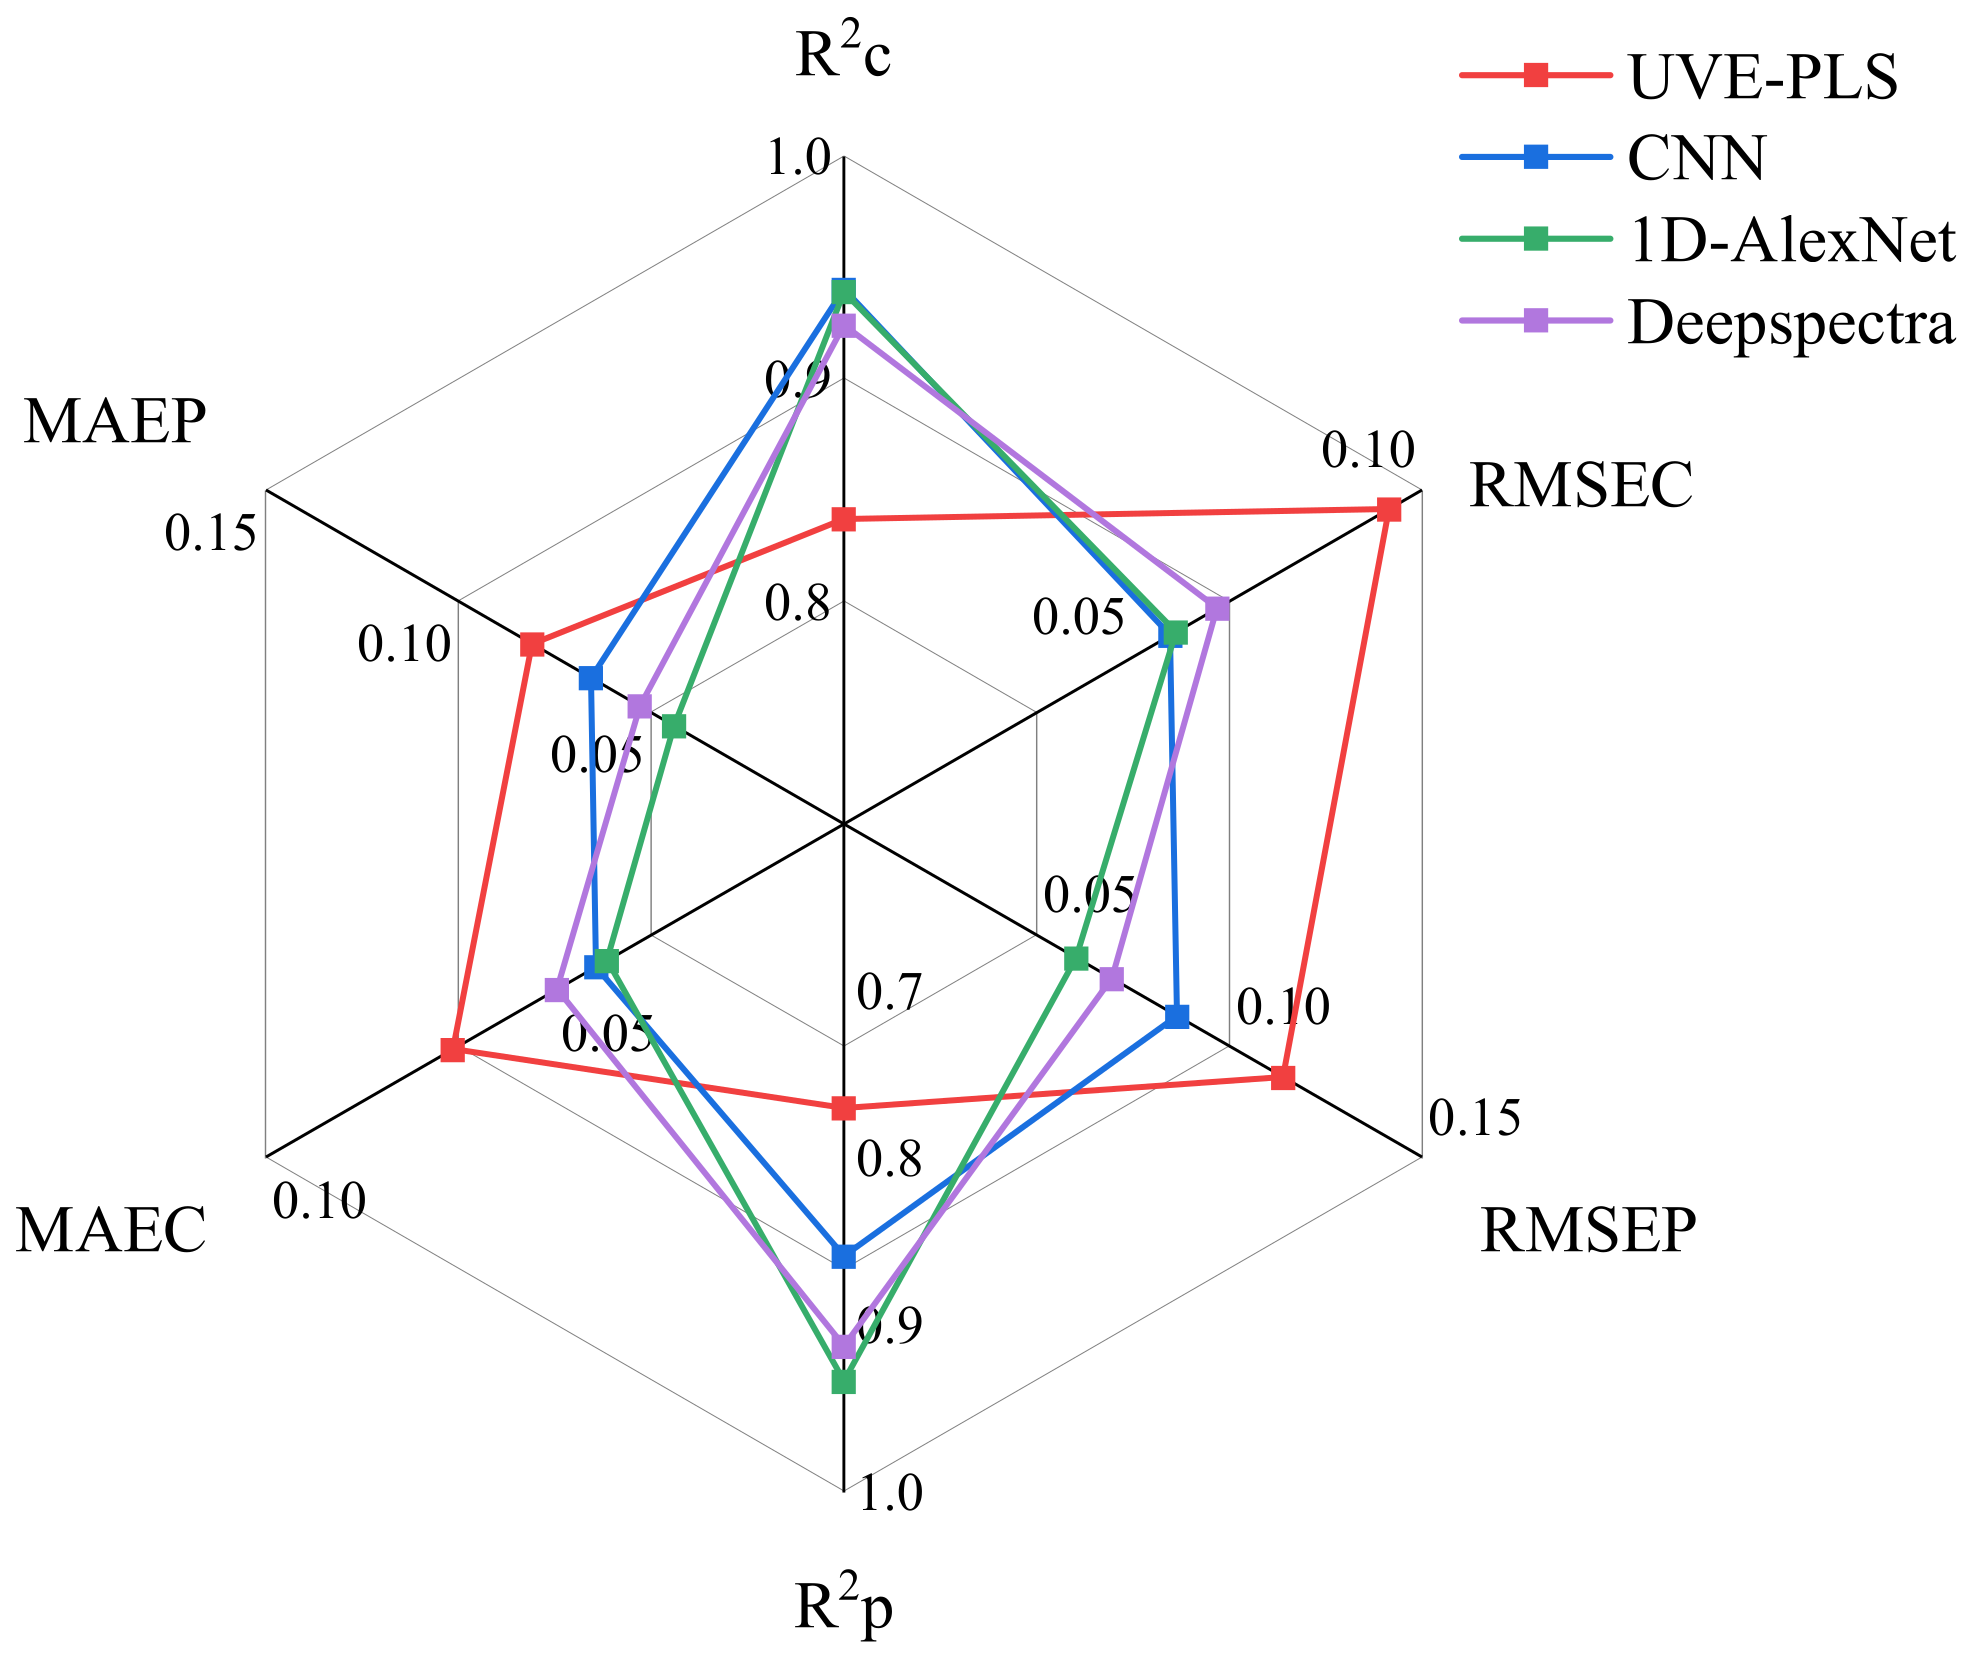
3.3. NIRS Modeling of Quality Components

Table 2 shows the results of a UVE-PLS model applied to predict the DM contents in potatoes using spectral data in the 600–900 nm wavelength range (dataset I for the raw spectral data and dataset II for the augmented spectral data). Table 2 showed improvements in the model’s predictive capabilities with the augmentation of the spectral data. Specifically, dataset I demonstrated R2C = 0.626 and RMSEC = 0.140 g/100 g; however, the model’s fit on validation data was poor (R2P = 0.552), accompanied by a high error rate (RMSEP = 0.171 g/100 g). By contrast, dataset II exhibited a better calibration fit (R2C = 0.837) and a reduced error (RMSEC = 0.0943 g/100 g), alongside a notably improved validation fit (R2P = 0.770) with a lower error rate (RMSEP = 0.114 g/100 g).
Overall, these results indicated that spectral data augmentation contributed positively to the model’s accuracy in predicting the DM content in potatoes, as evidenced by the improved fit and reduced error rates in both the calibration and prediction phases. Specifically, for DM predictions, the augmentation led to an improvement of 0.211 for R2C and R2P showed an improvement of 0.217. Additionally, the RMSEC decreased by 0.0459 g/100 g, and RMSEP had a reduction of 0.0567 g/100 g. In related research, the addition of data augmentation to the PLS model has shown significant benefits. Compared to the PLS model without data augmentation, the model with data augmentation improved from 0.63 to 0.88 in identifying vegetable oil species in oil admixtures for food analysis [35]. This improvement serves as a robust example supporting the efficacy of data augmentation techniques in enhancing analytical accuracy, reinforcing the positive outcomes observed in our own experiments with DM content prediction in potatoes.
The data augmentation significantly improved the model’s ability to fit and predict the data. Both the RMSEC and RMSEP values were lower in dataset II for DM, indicating that the augmented data led to more accurate predictions. The improvement in model performance was more pronounced in the prediction set, suggesting that the augmented data helped with model generalization. In conclusion, augmenting the spectral data appeared to have a positive impact on the UVE-PLS model’s performance for predicting DM content in potatoes. This improved both the fit of the training data and the predictive accuracy of prediction data, thereby enhancing the overall reliability of the model’s predictions. The presence of identical characteristic wavelengths for DM content prediction in potatoes before and after data augmentation, specifically near 840 and 870 nm, presented an interesting aspect for analysis within the context of PLS regression coefficients (Figure 7). The identical characteristic wavelengths across datasets implied that these regions were critical for the model’s predictive capability, irrespective of data augmentation. Despite these improvements, it should be noted that the R2P values for DM in both datasets were not very high, indicating some limitations in the model’s predictive ability.
The deep-learning model was randomly run five times to test its robustness, with the training samples and test samples remaining unchanged. To enhance comprehension and facilitate a clear comparison of the overall parameters, a spider diagram was generated to illustrate the average performance from five runs of the employed UVE-PLS and 1D-CNN models (Figure 8). In the DM prediction, the analytical results suggested that the 1D-AlexNet model exhibited superior calibration with the better R2c (0.940), which denoted a robust model fit to the calibration data. This was complemented by its minimal RMSEC (0.0574 g/100 g) and MAEC (0.0410 g/100 g) values, indicating high precision in the calibration set. Meanwhile, 1D-AlexNet showed a good performance in the prediction set, with an R2P value of 0.934 and an RMSEP value of 0.0603 g/100 g, denoting its efficacious generalization capability. Additionally, DeepSpectra demonstrated substantial predictive accuracy with an R2P value of 0.913 and an RMSEP value of 0.0695 g/100. The consistency of the observed trends across various metrics for the calibration set and prediction set reinforced the robustness of the models, suggesting their versatility in the calibration and prediction sets of the potato online testing capabilities. The classic CNN model achieved an R2P value of 0.859, which underscored its potential predictive validity. However, UVE-PLS, while exhibiting reasonable calibration and prediction results, was surpassed by the CNN models in most metrics. Compared to UVE-PLS, the R2P value improved by 21.31% (0.770 to 0.934) and the RMSEP value was reduced by 47.31% (0.114 to 0.0603) of 1D-AlexNet. The R2P value improved by 18.64% (0.770 to 0.913) and the RMSEP value was reduced by 39.30% (0.114 to 0.0695) compared to DeepSpectra. The R2P value improved by 11.62% (0.770 to 0.859) and the RMSEP value was reduced by 18.81% (0.114 to 0.0865) compared to the classic CNN model.
The spectral data of the calibration and prediction sets were read into the initialization network for iterative training, while the spectral data of the prediction set were used to evaluate the accuracy of 1D-AlexNet and DeepSpectra. The modeling results of five runs are shown in Table 3. The results indicate that the prediction rate of the 1D-AlexNet model had the lowest rate of 0.914 and the highest rate of 0.954, and the prediction rate of the DeepSpectra model had the lowest rate of 0.903 and the highest rate of 0.930. The difference between the lowest rate and the highest rate was only 0.040 and 0.027 for 1D-AlexNet and DeepSpectra, respectively, indicating that the models were relatively robust. Furthermore, the 1D-AlexNet and DeepSpectra results in this study were superior to those obtained using the Vis/NIR PLS models with R2P values of 0.878 and an RMSEV of 0.449% based on the diffuse reflectance principle in off-line conditions, respectively [13]. Compared to the results obtained in off-line conditions, the performance of 1D-AlexNet and DeepSpectra in this research showed the possibility of using the online system for measuring the DM of potatoes. These results were possibly due to the fact that the transmission mode in this study was better than the diffuse reflectance mode, which possibly carried less sample information and showed negative effects on the accuracies [16]. Consequently, this served as a promising and accessible method when combined with Vis/NIR and deep learning for the online detection of agricultural product quality.
Understanding the reason behind a model’s prediction may be just as crucial as its accuracy in practical applications [36]. The essential bands for 1D-AlexNet to predict DM are marked by GRAD-CAM analysis in Figure 9. The more effective wavelengths were between 730 and 900 nm, which were recommended for good DM prediction [8,37]. In a previous study, the optimal wavelength range within short-wave NIR spectroscopy for DM assessment was expected to encompass the water-related peaks at around 840 and 870 nm [38]. In this study, in particular, 780–800 and 830–900 nm are more helpful for predicting DM content. This indicated the crucial role of these wavelengths in predicting the DM within the samples, which was possibly due to the following reasons: (1) The wavelengths with high weight values were mostly in the near-infrared range, avoiding the influence of surface color variations and internal pigment absorption on the model. (2) Wavelengths near 780 nm were attributed to the OH functional groups; wavelengths near 840 nm provided absorption information for the combined bands of C–H3, C–H2, and C–H; and wavelengths near 870 nm were possibly relative to the third overtone of C–H [13], exhibiting a strong correlation with DM.

4. Conclusions

This comprehensive study demonstrated the significant potential of deep-learning methods for enhancing the efficiency and accuracy of nutrient detection in potatoes, explicitly focusing on DM using an online Vis/NIR transmission spectroscopy technique. The accuracy and efficiency offered by the DeepSpectra, 1D-AlexNet, and classic CNN models, especially the 1D-AlexNet and DeepSpectra model, suggested a significant advancement in agricultural product assessment, enhancing the production and quality control processes.
Data augmentation techniques, including the addition of Gaussian noise, were utilized to expand the limited sample size for practical deep-learning model training. The 1D-AlexNet model showed an R2P value of 0.934 and an RMSEP value of 0.0603 g/100 g. Compared to UVE-PLS, the R2P value improved by 21.31% (0.770 to 0.934) and the RMSEP value was reduced by 47.31% (0.114 to 0.0603). Additionally, the DeepSpectra models achieved 0.913 and 0.0695 g/100 g RMSEP for DM. Compared to UVE-PLS, the R2P value improved by 18.64% (0.770 to 0.913) and the RMSEP value was reduced by 39.30% (0.114 to 0.0695). Thus, this study may assist the online Vis/NIR transmission determination research of DM in potatoes using deep learning.
These findings underscored the potential of using specific spectral features in deep-learning models for more precise and efficient agricultural quality online assessment. This advancement provided some insight and reference for further development in contributing to the evolution of more targeted and efficient quality assessment methods in agricultural products. Although these results are encouraging, additional research is still needed to focus on a larger number of potato samples and cultivars with a wide range of DM values to develop an accurate and robust online sorting system.

Author Contributions

Y.G. and L.Z.: methodology; Z.L. and Y.C.: original draft preparation; Y.H. and C.L.: validation; H.L. and Z.D.: review and editing. All authors have read and agreed to the published version of the manuscript.

Funding

The authors would like to thank the National Potato Industry Technical System Project (CARS-10-P23) and Key Laboratory of Agro-Products Primary Processing, Ministry of Agriculture and Rural Affairs of China (KLAPPP2022-01).

Institutional Review Board Statement

Not applicable.

Data Availability Statement

The data presented in this study are available on request from the corresponding author.

Conflicts of Interest

Authors Yalin Guo, Lina Zhang, Zhenlong Li, Chengxu Lv, Huangzhen Lv, and Zhilong Du were employed by the company Chinese Academy of Agricultural Mechanization Sciences Group Co., Ltd. However, the Chinese Academy of Agricultural Mechanization Sciences Group Co., Ltd. did not contribute financially, nor in the optimization, analysis of the results, or writing of the paper. Therefore, there is no conflict of interest in relation with the company Chinese Academy of Agricultural Mechanization Sciences Group Co., Ltd. The remaining authors declare that the research was conducted in the absence of any commercial or financial relationships that could be construed as a potential conflict of interest.

References

  1. Lal, K.; Tiwari, R.K.; Jaiswal, A.; Luthra, S.K.; Singh, B.; Kumar, S.; Gopalakrishnan, S.; Gaikwad, K.; Kumar, A.; Paul, V.; et al. Combinatorial interactive effect of vegetable and condiments with potato on starch digestibility and estimated in vitro glycemic response. J. Food Meas. Charact. 2022, 16, 2446–2458. [Google Scholar] [CrossRef]
  2. GB/T 31784-2015; Code of Practice for Grading and Inspecting of Commercial Potatoes. Ministry of Agriculture: Beijing, China, 2015.
  3. Guo, Z.; Wang, X.; Song, Y.; Zou, X.; Cai, J. Advances in sensing and monitoring technology for quality deterioration of fruits and vegetables. Smart Agric. 2021, 3, 14–28. [Google Scholar]
  4. Alfatni, M.S.M.; Shariff, A.R.M.; Abdullah, M.Z.; Marhaban, M.H.B.; Ben Saaed, O.M. The application of internal grading system technologies for agricultural products-Review. J. Food Eng. 2013, 116, 703–725. [Google Scholar] [CrossRef]
  5. Wang, H.; Peng, J.; Xie, C.; Bao, Y.; He, Y. Fruit quality evaluation using spectroscopy technology: A review. Sensors 2015, 15, 11889–11927. [Google Scholar] [CrossRef] [PubMed]
  6. Li, J.; Wang, Q.; Xu, L.; Tian, X.; Xia, Y.; Fan, S. Comparison and optimization of models for determination of sugar content in pear by portable Vis-NIR spectroscopy coupled with wavelength selection algorithm. Food Anal. Methods 2019, 12, 12–22. [Google Scholar] [CrossRef]
  7. Martins, J.A.; Rodrigues, D.; Cavaco, A.M.; Antunes, M.D.; Guerra, R. Estimation of soluble solids content and fruit temperature in ‘Rocha’ pear using Vis-NIR spectroscopy and the SpectraNet-32 deep learning architecture. Postharvest Biol. Technol. 2023, 199, 112281. [Google Scholar] [CrossRef]
  8. He, H.-J.; Wang, Y.; Wang, Y.; Ou, X.; Liu, H.; Zhang, M. Towards achieving online prediction of starch in postharvest sweet potato [Ipomoea batatas (L.) Lam] by NIR combined with linear algorithm. J. Food Compos. Anal. 2023, 118, 105220. [Google Scholar] [CrossRef]
  9. Lu, P.; Li, X.; Janaswamy, S.; Chi, C.; Chen, L.; Wu, Y.; Liang, Y. Insights on the structure and digestibility of sweet potato starch: Effect of postharvest storage of sweet potato roots. Int. J. Biol. Macromol. 2020, 145, 694–700. [Google Scholar] [CrossRef] [PubMed]
  10. de Freitas, S.T.; Guimarães, T.; Vilvert, J.C.; Amaral, M.H.P.D.; Brecht, J.K.; Marques, A.T.B. Mango dry matter content at harvest to achieve high consumer quality of different cultivars in different growing seasons. Postharvest Biol. Technol. 2022, 189, 111917. [Google Scholar] [CrossRef]
  11. Subedi, P.P.; Walsh, K.B. Assessment of potato dry matter concentration using short-wave near-infrared spectroscopy. Potato Res. 2009, 52, 67–77. [Google Scholar] [CrossRef]
  12. Rady, A.M.; Guyer, D.E. Evaluation of sugar content in potatoes using NIR reflectance and wavelength selection techniques. Postharvest Biol. Technol. 2015, 103, 17–26. [Google Scholar] [CrossRef]
  13. Wang, F.; Li Y-y Peng Y-k Yang B- Li, L.; Liu, Y.-c. Multi-Parameter Potato Quality Non-Destructive Rapid Detection by Visible/Near-Infrared Spectra. Spectrosc. Spectr. Anal. 2018, 38, 3736–3742. [Google Scholar]
  14. Tang, C.; Jiang, B.; Ejaz, I.; Ameen, A.; Zhang, R.; Mo, X.; Wang, Z. High-throughput phenotyping of nutritional quality components in sweet potato roots by near-infrared spectroscopy and chemometrics methods. Food Chem. X 2023, 20, 100916. [Google Scholar] [CrossRef]
  15. Tian, H.; Xu, H.; Ying, Y. Can light penetrate through pomelos and carry information for the non-destructive prediction of soluble solid content using Vis-NIRS? Biosyst. Eng. 2022, 214, 152–164. [Google Scholar] [CrossRef]
  16. Zheng, Y.; Cao, Y.; Yang, J.; Xie, L. Enhancing model robustness through different optimization methods and 1-D CNN to eliminate the variations in size and detection position for apple SSC determination. Postharvest Biol. Technol. 2023, 205, 112513. [Google Scholar] [CrossRef]
  17. Martins, J.; Guerra, R.; Pires, R.; Antunes; Panagopoulos, T.; Brázio, A.; Afonso, A.; Silva, L.; Lucas, M.; Cavaco, A. SpectraNet-53: A deep residual learning architecture for predicting soluble solids content with VIS–NIR spectroscopy. Comput. Electron. Agric. 2022, 197, 106945. [Google Scholar] [CrossRef]
  18. Zhang, H.; Li, Z.; Wang, X. Analysis of the Characteristics of Potato Varieties and Industrial Distribution in China. China Potato 2022, 36, 78–85. [Google Scholar]
  19. GB 5009.3-2016; National Food Safety Standard—Determination of Moisture in Foods. Ministry of Agriculture: Beijing, China, 2016.
  20. GB 5009.9-2016; National Food Safety Standard—Determination of Starch in Foods. Ministry of Agriculture: Beijing, China, 2016.
  21. Zhu, H.; Shi, Y.; Zhang, Q.; Chen, Y. Determination of reducing sugars in potato by colorimetric method of 3,5-dinitrosalicylic acid (DNS). China Potato 2005, 19, 14–17. [Google Scholar]
  22. Wang, S.; Tian, H.; Tian, S.; Yan, J.; Wang, Z.; Xu, H. Evaluation of dry matter content in intact potatoes using different optical sensing modes. J. Food Meas. Charact. 2023, 17, 2119–2134. [Google Scholar] [CrossRef]
  23. Jiang, H.; Deng, J.; Zhu, C. Quantitative analysis of aflatoxin B1 in moldy peanuts based on near-infrared spectra with two-dimensional convolutional neural network. Infrared Phys. Technol. 2023, 131, 104672. [Google Scholar] [CrossRef]
  24. Ma, D.; Shang, L.; Tang, J.; Bao, Y.; Fu, J.; Yin, J. Classifying breast cancer tissue by Raman spectroscopy with one-dimensional convolutional neural network, Spectrochim. Acta Part A-Mol. Biomol. Spectrosc. 2021, 256, 119732. [Google Scholar] [CrossRef] [PubMed]
  25. Wold, H. Soft modelling, the basic design and some extensions. In Systems under Indirect Observations; Joreskog, K.-G., Wold, H., Eds.; North-Holland: Amsterdam, The Netherlands, 1982; Volumes I–II. [Google Scholar]
  26. Sun, M.; Zhang, D.; Liu, L.; Wang, Z. How to predict the sugariness and hardness of melons: A near-infrared hyperspectral imaging method. Food Chem. 2017, 218, 413–421. [Google Scholar] [CrossRef] [PubMed]
  27. Centner, V.; Massart, D.L.; de Noord, O.E.; de Jong, S.; Vandeginste, B.G.M.; Sterna, C. Elimination of uninformative variables for multivariate calibration. Anal. Chem. 1996, 68, 3851–3858. [Google Scholar] [CrossRef] [PubMed]
  28. Zhang, X.; Lin, T.; Xu, J.; Luo, X.; Ying, Y. DeepSpectra: An end-to-end deep learning approach for quantitative spectral analysis. Anal. Chim. Acta 2019, 1058, 48–57. [Google Scholar] [CrossRef] [PubMed]
  29. Szegedy, C.; Liu, W.; Jia, Y.; Sermanet, P.; Reed, S.; Anguelov, D.; Erhan, D.; Vanhoucke, V.; Rabinovich, A. Going deeper with convolutions. In Proceedings of the 2015 IEEE Conference on Computer Vision and Pattern Recognition (CVPR), Boston, MA, USA, 7–12 June 2015; IEEE: Piscataway, NJ, USA, 2015; pp. 1–9. [Google Scholar]
  30. Yu, G.; Li, H.; Li, Y.; Hu, Y.; Wang, G.; Ma, B.; Wang, H. Multiscale DeepSpectra Network: Detection of Pyrethroid Pesticide Residues on the Hami Melon. Foods 2023, 12, 1742. [Google Scholar] [CrossRef] [PubMed]
  31. Krizhevsky, A.; Sutskever, I.; Hinton, G.E. ImageNet Classification with Deep Convolutional Neural Networks. In Advances in Neural Information Processing Systems; Pereira, F., Burges, C.J.C., Bottou, L., Weinberger, K.Q., Eds.; Curran Associates, Inc.: Lake Tahoe, NV, USA, 2012; Volume 25. [Google Scholar]
  32. Selvaraju, R.R.; Cogswell, M.; Das, A.; Vedantam, R.; Parikh, D.; Batra, D. Grad-cam: Visual explanations from deep networks via gradient-based localization. In Proceedings of the IEEE International Conference on Computer Vision, Venice, Italy, 22–29 October 2017; pp. 618–626. [Google Scholar]
  33. McGlone, V.A.; Martinsen, P.J.; Clark, C.J.; Jordan, R.B. On-line detection of brownheart in Braeburn apples using near infrared transmission measurements. Postharvest Biol. Technol. 2005, 37, 142–151. [Google Scholar] [CrossRef]
  34. Huang, Y. Research and Application of Spatially Resolved Spectroscopy Based on Multi-Channel Hyperspectral Imaging System. Ph.D. Thesis, Nanjing Agricultural University, Nanjing, China, 2018. [Google Scholar]
  35. Georgouli, K.; Osorio, M.T.; Martinez Del Rincon, J.; Koidis, A. Data Augmentation in Food Science: Synthesising Spectroscopic Data of Vegetable Oils for Performance Enhancement. J. Chemom. 2018, 32, e3004. [Google Scholar] [CrossRef]
  36. Scott, M.; Lundberg, S.-I.L. Authors Info & Claims. A Unified Approach to Interpreting Model Predictions. In Proceedings of the 31st Conference on Neural Information Processing Systems (NIPS 2017), Long Beach, CA, USA, 4–9 December 2017. [Google Scholar]
  37. Subedi, P.P.; Walsh, K.B. Assessment of avocado fruit dry matter content using portable near infrared spectroscopy: Method and instrumentation optimisation. Postharvest Biol. Technol. 2020, 161, 111078. [Google Scholar] [CrossRef]
  38. Golic, M.; Walsh, K.; Lawson, P. Short-wavelength near-infrared spectra of sucrose, glucose, and fructose with respect to sugar concentration and temperature. Appl. Spectrosc. 2003, 57, 139–145. [Google Scholar] [CrossRef]
Figure 1. Vis/NIR transmission spectroscopy systems: (a) three-dimensional figure; (b) cutaway view; (c) light source module and spectral acquisition module. (1) Vis/NIR spectrometer; (2) probe; (3) sample; (4) tray; (5) light source; (6) computer.
Agriculture 14 00787 g001
Figure 2. Structure of the DeepSpectra model.
Agriculture 14 00787 g002
Figure 3. The structure of the 1D-AlexNet model.
Agriculture 14 00787 g003
Figure 4. Structure of the CNN model.
Agriculture 14 00787 g004
Figure 5. Histograms and correlation plots for the different parameters.
Agriculture 14 00787 g005
Figure 6. Average Vis/NIR transmission spectrum and absorbance spectrum of the Vis/NIR spectra of all samples: (a) transmission spectrum; (b) absorbance spectrum.
Agriculture 14 00787 g006
Figure 7. Regression coefficients of the PLS model developed for the DM content prediction using wavelength ranges of 600–900 nm in the potatoes ((a): DM for the raw spectral data; (b): DM for the augmented spectral data).
Agriculture 14 00787 g007
Figure 8. Dry matter predictive performance of the four models for the quality components. R2C, coefficient determination of calibration; R2P, coefficient determination of prediction; RMSEC, root mean standard error of calibration; RMSEP, root mean square error of prediction; MAEC, mean absolute error of calibration; MAEP, mean absolute error of prediction.
Agriculture 14 00787 g008
Figure 9. Weight values of the 1D-AlexNet model developed for the DM content prediction using wavelength ranges of 600–900 nm in the potatoes.
Agriculture 14 00787 g009
Table 1. Statistical results of compositional and physical characteristics in potatoes.
IndexesMinMaxMeanStd
DM (g/100 g)13.1020.3816.041.71
SC (g/100 g)9.2017.9112.381.82
RS (g/100 g)0.0901.170.480.21
Weight (g)159.14326.95237.4339.06
Length (mm)47.0105.085.310.93
Width (mm)51.580.065.15.0
Height (mm)42.068.054.05.4
Table 2. Results of the UVE-PLS model developed for the DM content prediction using wavelength ranges of 600–900 nm in the potatoes (dataset I: raw spectral data; dataset II: augmented spectral data).
ParametersDatasetLVsCalibrationPrediction
R2CRMSEC (g/100 g)R2PRMSEP (g/100 g)
DMI100.6260.1400.5520.171
II100.8370.09430.7700.114
Table 3. Results of the calibration and prediction sets following five parallel runs of the DeepSpectra model developed for DM contents using wavelength ranges of 600–900 nm in potatoes.
ParametersSerial No.CalibrationPrediction
R2CRMSEC (g/100 g)MAEC (g/100 g)R2PRMSEP (g/100 g)MAEP (g/100 g)
1D-AlexNet10.9590.04780.03490.9540.05090.0387
20.9400.05740.04370.9300.06260.0482
30.9220.06550.04630.9200.06670.0475
40.9160.06780.04610.9140.06930.0478
50.9570.04840.03390.9510.05220.0377
DeepSpectra10.9360.05930.04610.9300.06250.0478
20.9270.06350.04770.9100.07080.0533
30.9220.06550.05020.9100.07100.0532
40.9250.06440.05070.9130.06970.0539
50.9100.07040.05340.9030.07340.0564
Disclaimer/Publisher’s Note: The statements, opinions and data contained in all publications are solely those of the individual author(s) and contributor(s) and not of MDPI and/or the editor(s). MDPI and/or the editor(s) disclaim responsibility for any injury to people or property resulting from any ideas, methods, instructions or products referred to in the content.

