Article

Remote Sensing Identification and Rapid Yield Estimation of Pitaya Plants in Different Karst Mountainous Complex Habitats

1
Karst Institute, School of Geographic and Environments Sciences, Guizhou Normal University, Guiyang 550001, China
2
State Engineering Technology Institute for Karst Desertification Control, Guiyang 550001, China
3
School of Earth Sciences and Resources, China University of Geosciences, Beijing 100083, China
*
Author to whom correspondence should be addressed.
Agriculture 2023, 13(9), 1742; https://doi.org/10.3390/agriculture13091742
Submission received: 5 July 2023 / Revised: 29 August 2023 / Accepted: 30 August 2023 / Published: 1 September 2023

Abstract

:
The Pitaya industry is a specialty fruit industry in the mountainous region of Guizhou, China. The planted area in Guizhou reaches 7200 ha, ranking first in the country. At present, Pitaya planting lacks efficient yield estimation methods, which has a negative impact on the Pitaya downstream industry chain, stymying the constant growing market. The fragmented and complex terrain in karst mountainous areas and the capricious local weather have hindered accurate crop identification using traditional satellite remote sensing methods, and there is currently little attempt made to tackle the mountainous specialty crops’ yield estimation. In this paper, based on UAV (unmanned aerial vehicle) remote sensing images, the complexity of Pitaya planting sites in the karst background has been divided into three different scenes as complex scenes with similar colors, with topographic variations, and with the coexistence of multiple crops. In scenes with similar colors, using the Close Color Vegetation Index (CCVI) to extract Pitaya plants, the accuracy reached 92.37% on average in the sample sites; in scenes with complex topographic variations, using point clouds data based on the Canopy Height Model (CHM) to extract Pitaya plants, the accuracy reached 89.09%; and in scenes with the coexistence of multiple crops, using the U-Net Deep Learning Model (DLM) to identify Pitaya plants, the accuracy reached 92.76%. Thereafter, the Pitaya yield estimation model was constructed based on the fruit yield data measured in the field for several periods, and the fast yield estimations were carried out and examined for three application scenes. The results showed that the average accuracy of yield estimation in complex scenes with similar colors was 91.25%, the average accuracy of yield estimation in scenes with topographic variations was 93.40%, and the accuracy of yield estimation in scenes with the coexistence of multiple crops was 95.18%. The overall yield estimation results show a high accuracy. The experimental results show that it is feasible to use UAV remote sensing images to identify and rapidly estimate the characteristic crops in the complex karst habitat, which can also provide scientific reference for the rapid yield estimation of other crops in mountainous regions.

1. Introduction

The karst regions account for about 12% of the global surface [1]. Guizhou is located in the central area of the karst region of southwest China, one of the three largest karst regions in the world [2,3,4,5]. In total, 92.5% of the province is covered by mountains and hills [3]. The complex and diverse ecological environment of Guizhou is rich in agricultural resources. Under the influence of both climate change and human activities, the spatial and temporal differences in crop cultivation structure in karst regions are significant [6,7]. Rapid investigation of a crop cultivation area, efficient identification of crop types, and accurate estimation of crop production value are prerequisites for high-quality monitoring and scientific management of agricultural sites in mountainous areas. The deep integration of karst mountain agriculture development with multi-source remote sensing technology and spatial information technology is of great significance to grasp the current situation of mountain agriculture planting in a timely and accurate manner and improve the level and precision of mountain agriculture planting monitoring.
As the advantageous industry in the Guizhou mountainous region, the specialty fruit industry has played an important role in the construction of ecological civilization and helped the increase in local farmers’ income and the integrated development of the major industries. In 2020, China’s Pitaya planting area reached more than 20,000 ha, while the Guizhou planting area reached 7200 ha, ranking first in the country [8]. The market capacity of Pitaya is estimated to grow to 2–3 million tons in the next 5–10 years [9].
To better suit the constantly growing market, the purpose of implementing rapid yield estimation of Pitaya is to better manage and plan Pitaya planting activities. By accurately estimating yields, local farmers can better control costs, arrange sales plans, and better adapt to market demand. In addition, rapid yield estimates can also help growers take timely measures to increase yield and improve the production process. The Chinese Pitaya planting area is extensive, and the rapid estimation of Pitaya is very important to improve the yield efficiency and quality of Pitaya growers so as to enhance their competitiveness and market position.
Despite being an important part of the specialty fruit industry in Guizhou province, local Pitaya plantations are still in a more traditional stage. Pitaya plant monitoring and yield estimation still largely rely on manual execution, with low efficiency and high cost expenditure, which present a negative impact on the overall development of the Pitaya industry. However, intelligent remote sensing monitoring and yield estimation of Pitaya are able to provide a reference for scientific planning of the Pitaya industry’s layout and for industrial upgrading and transformation. Remote sensing yield estimation is based on remote sensing technology and digital image processing technology, which are able to quickly and accurately obtain the information of large areas of farmland and realize the accurate measurement of crop types, growth conditions, and the coverage degree of different farmlands. Therefore, compared with the traditional yield estimation method, remote sensing yield estimation has the advantages of high efficiency, low cost, and high accuracy, and it is a more advanced and reliable production estimation method. At present, there is no Pitaya estimation method based on remote sensing technology, so it is particularly necessary to develop a Pitaya estimation method based on remote sensing.
In recent years, remote sensing technology has reached the practical stage, and it has been widely used in crop yield estimation with its advantages of wide coverage, fast updating speed, and non-destructive detection [10]. Liu et al. (2022) proposed a novel deep learning adaptive crop model (DACM) to accomplish adaptive high-precision yield estimation in large areas, which emphasized adaptive learning of the spatial heterogeneity of crop growth based on fully extracting crop growth information; the results showed that the DACM achieved an average root mean squared error (RMSE) of 4.406 bushels·acre−1 (296.304 kg·ha−1), with an average coefficient of determination (R2) of 0.805 [11]. Wang et al. (2020) developed an NPP-based rice yield estimation model, with HI (harvest index) being a changing parameter, and the accuracy of the proposed method was tested over the Jiangsu Province, southeast China, which showed that the rice HI increased linearly in the study area. Compared with yield estimation with a fixed harvest index, yield estimations using a changing HI were greatly improved [12]. He et al. (2023) proposed a novel yield evaluation method for integrating multiple spectral indexes and temporal aggregation data, and the results showed that the normalized moisture difference index (NMDI) was the index most sensitive to yield estimation [13]. Liu et al. (2016) established a remote sensing yield estimation model for complex mountainous areas based on ZY-3 satellite remote sensing images and concluded that the model constructed by NDVI had the best fit with the actual yield [14]. These studies mainly focused on vegetation indices and spectral data obtained by remote sensing technology for large-scale crop yield estimation; the most common observation method used NDVI and EVI indices to estimate biomass, crop yield, and other factors to reflect crop growth characteristics. However, former studies have usually focused on concentrated bulk crops grown in large-scale farmland. There are currently few studies on high-precision plant extraction and high-precision yield estimation for crops with large planting gaps, such as Pitaya.
Traditional satellite remote sensing yield estimation is applicable to large-scale cropland. However, crops in karst mountainous complex habitats are small and scattered, and they are easily affected by bad weather (e.g., cloudy and rainy), so that satellite remote sensing data cannot be obtained as accurate ground information in time or effectively; thus, the traditional satellite remote sensing method is generally ineffective.
The rapid development of UAV remote sensing technology has avoided the shortages of satellite remote sensing yield estimation and can be applied to small-scale cropland [15]. UAV remote sensing estimation mainly imitates satellite remote sensing estimation methods, but it has the advantages of low cost, high spatial resolution, real time, and low atmospheric disturbance, which provide a new technical means for remote sensing crop estimation on a small scale [16,17,18,19,20]. For example, Chen et al. (2019) have compared human-engineered features (namely, histogram of oriented gradients (HOG), local binary pattern (LBP), and scale-invariant feature transform (SIFT)) with features extracted using a pre-trained Alex-net model for detecting palm trees in high-resolution images obtained by UAV [21]. Sothe et al. (2020) obtained the classification of 14 tree species in a subtropical forest area of Southern Brazil by UAV data [22]. Al-Ruzouq et al. (2023) proposed a fixed-wing UAV system equipped with an optical (red–green–blue) camera used to capture very high spatial resolution images over urban and agricultural areas in an arid environment [23]. Wang (2015) referenced the form of NDVI and put forward a new vegetation index, VDVI (visible-band difference vegetation index), by using UAV data; the total extraction precision was 91.5%, and the kappa coefficient was 0.8256 [24]. From the above studies, it can be found that there are many studies on UAV image recognition, while there are fewer studies on further application of the recognition results. There are some studies that have discussed the identification and estimation of corps in a single scene, but there are few studies on identification and estimation in multiple scenes.
The development of agriculture in karst mountainous areas is highly limited by the topography, small habitat environment, and climate, and it is difficult for traditional satellites to acquire data that meet the accuracy requirements due to the influence of clouds, rain, and fog. Low-altitude UAV remote sensing has flexible periodicity and timelines for crop growth data collection and monitoring. In this paper, we used UAV as a means of remote sensing data collection, and we took Pitaya, a special but important crop of the karst mountains, as the research object. We established a knowledge base of remote sensing recognition features of Pitaya, designed remote sensing recognition algorithms and models of crop recognition based on deep learning, classified mountain agriculture according to the composition of complex backgrounds, and constructed technical methods for plant extraction and yield estimation in complex scenes of similar colors, terrain changes, and the coexistence of multiple types of crops. The technical method of yield estimation proposed in this study is able to improve the utilization rate of mountain agricultural resources information and provide decision support, scientific support, and technological support for the development of modern mountainous agriculture in the karst area.

2. Materials and Methods
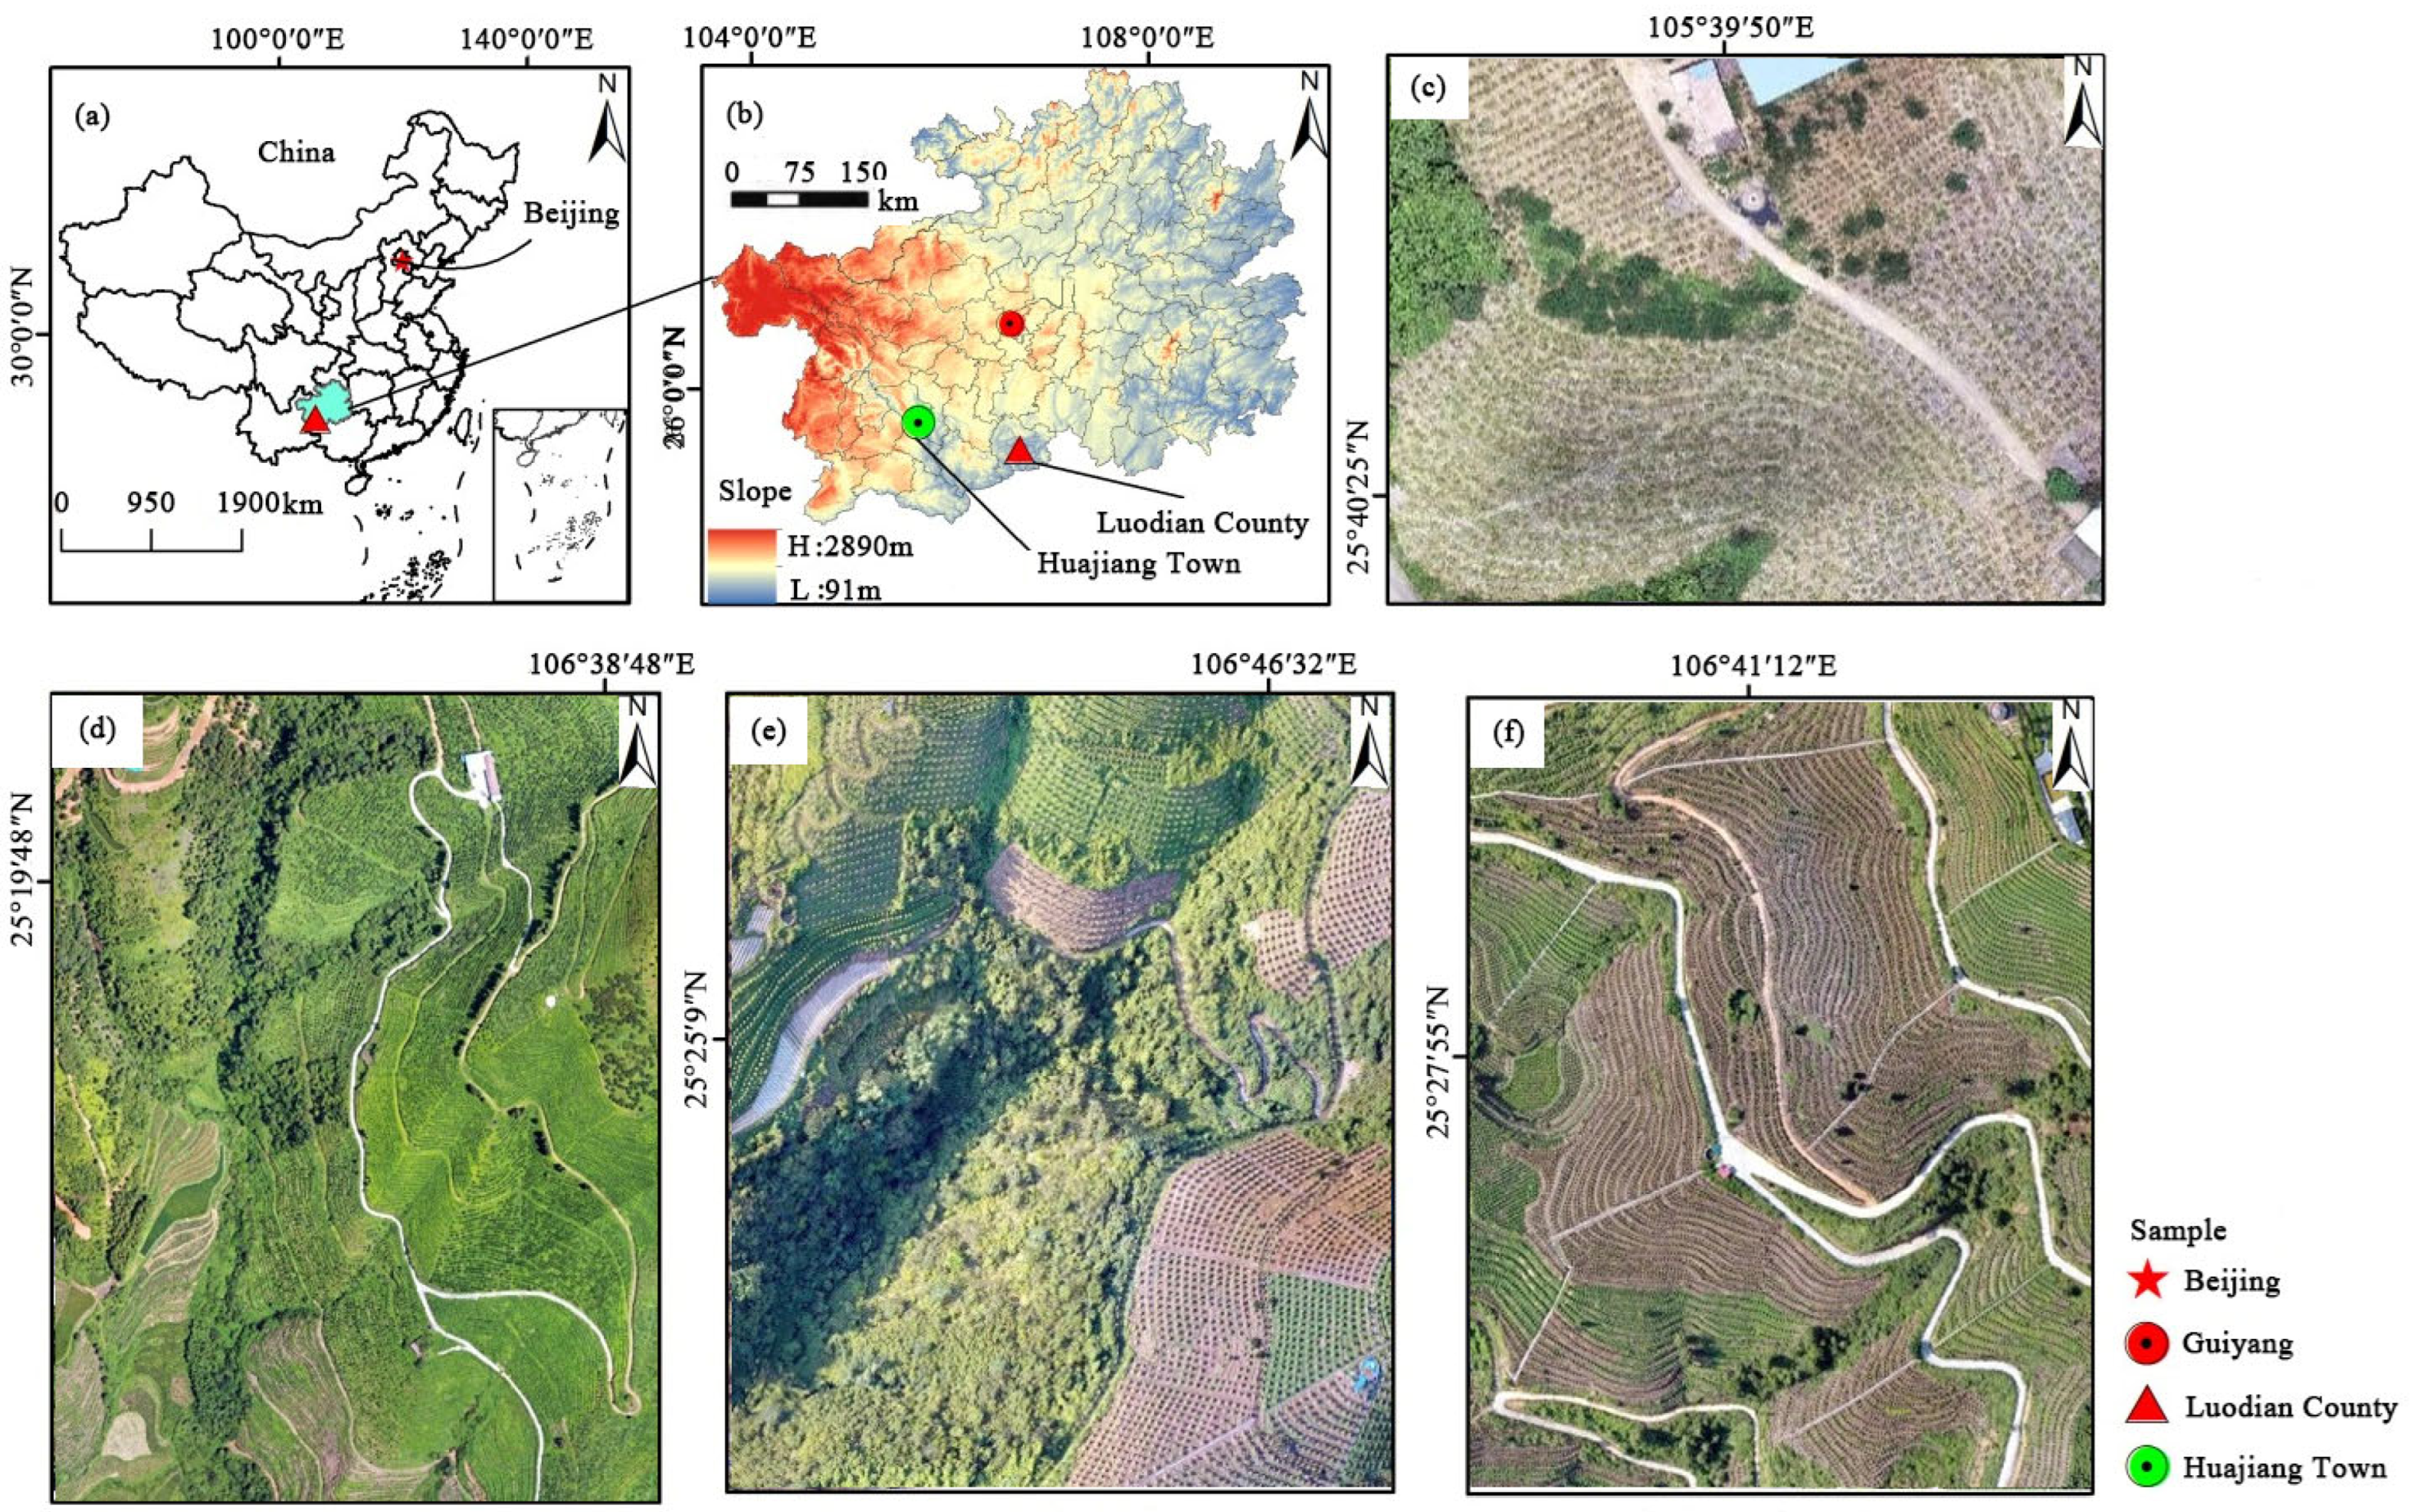
2.1. Study Area

In this study, the total four sample sites are located in Huajiang town and Luodian County of southern Guizhou Province (Figure 1a,b). One of the sample sites is located in Huajiang town; it is named the Guanling Pitaya planting demonstration area (25°39′13″ N–25°41′00″ N, 105°36′30″ E–105°46′30″ E). Three of the sample sites are located in Luodian County; they are named the Sunshine Orchard (25°40′31.40″ N, 105°39′50.87″ E), the Xinzhongsheng Pitaya Planting Base (25°24′23″ N, 106°47′25.52″ E), and the Langdang Pitaya planting base (25°25′15.84″ N, 106°47′29.79″ E) (Figure 1c–f).
The general topography of Luodian County is high in the north and low in the south, with a stepped descent, and the elevation of the county is mostly between 300 and 1000 m. Typical karst mountains, gullies, and ravines account for 85.75% of the total area, and hills and basins are distributed among each other [25]. The climate in this area is a subtropical monsoon climate, featuring an early spring, a long summer, a late autumn, and a short winter, with 1350–1520 h of sunshine, an average annual temperature of 20 °C, an average annual rainfall of 1335 mm, and a frost-free period of 335 days. The rivers in the county belong to the Red River system of the Pearl River Basin, with a total length of 482 km and an average annual runoff of 1.778 × 10⁹ m3. The soil is mostly sandy red soil and red brown soil [26]. Luodian County is known as the “natural greenhouse,” and it is the ideal place to plant Pitaya.
The Huajiang demonstration area is of typical karst landscape, too [27]. The climate is hot and dry, with an annual rainfall of 1120 mm; May to October is the frequent period of precipitation, accounting for 83% of the total annual precipitation. The average annual temperature is 18.4 °C, and the soil type is mainly brownish yellow lime soil and black lime soil. The high mountains and steep slopes in the territory cause frequent soil erosion, resulting in infertile land and serious stone desertification [28]. In order to alleviate the intensification of stone desertification, and, at the same time, to bring economic benefits, the local government vigorously promoted the development of the Pitaya fruit industry according to local conditions [29].

2.2. Materials and Pre-Processing

2.2.1. Materials

(a)
UAV remote sensing data. Remote sensing data were acquired using DJI Mavic 2 Pro (Manufactured by DJ Innovations, Shenzhen, China) platforms carrying visible lens loads with 20 million effective sensor pixels. The remote sensing data were acquired on 15 July 2022, 13 August 2022, 9 September 2022, and 18 October 2022, respectively. The images of the Red Heart Pitaya Tourism Park were acquired on 14 July 2022, 14 August 2022, 7 September 2022, and 17 October 2022. The aerial video was taken during the summer fruiting period. The shooting time was 12:00–12:40 pm, with clear light, moderate wind, and sunlight close to vertical ground, which minimized crop shadows during the shooting process. The route was planned using Altizure-v3.9.5 software. The topography of the Pitaya planting area was obviously undulating, so the route and side overlap were set to 80%, and the flight height was 60 m (pixel size 1.48 cm × 1.48 cm) to ensure data validity (Figure 2 and Table 1).

2.2.2. Data Pre-Processing

(a)
Remote sensing data processing process. Data stitching was completed by using Pix4D Mapper software. The main steps include: (1) aerial segment screening: the software automatically implements orthographic correction, eliminating fuzzy or redundant aerial segments; (2) high-precision splicing: image stitching according to the automatically generated control points; (3) air three encryption: according to the flight point cloud control point, it controls the point encryption in the room, obtains the elevation and plane position of the encryption point, and generates a digital surface model accordingly. The data products included digital orthophoto (DOM), digital surface model (DSM), high-precision point cloud, and so on. The spatial resolution of the data products was 5 cm, and the derived product Digital Elevation Model (DEM) was obtained by ENVI LiDAR processing with a spatial resolution of 0.5 m. The data processing is shown in Figure 3.
(b)
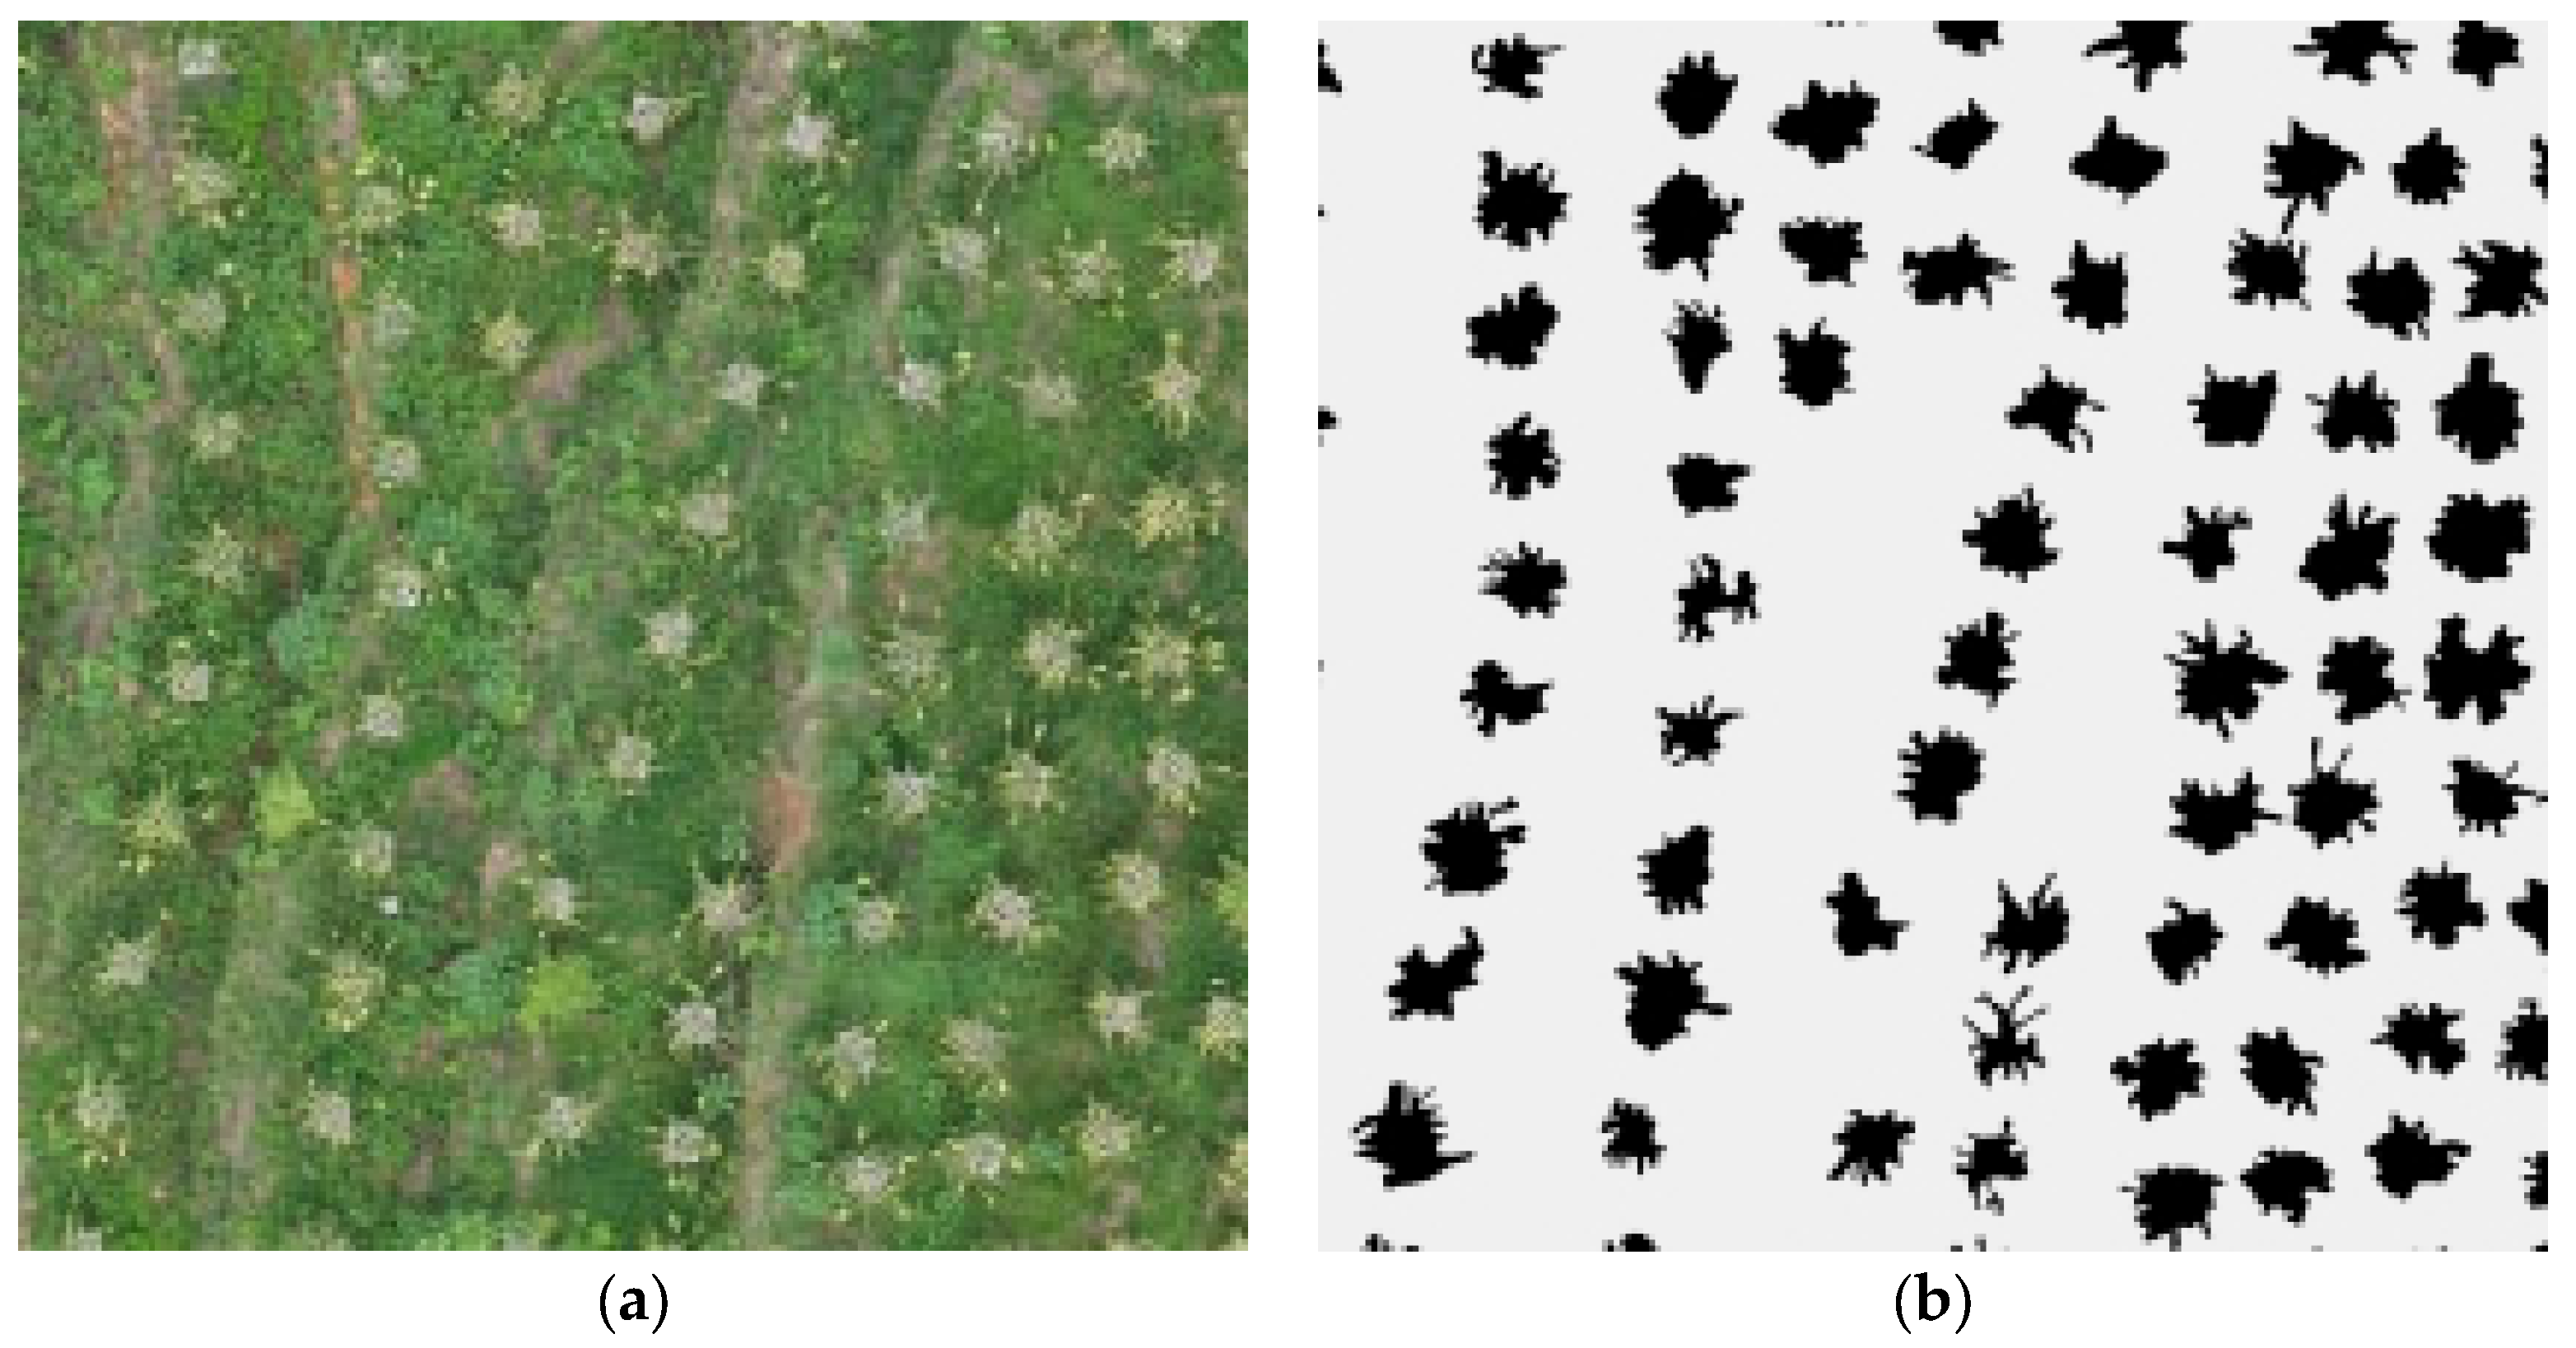
Image spectral information enhancement. Crop plant recognition based on UAV visible band images is an essential process for separating target features from the background based on images, i.e., image binarization segmentation. The target feature is the Pitaya plants, while the background features are the weeds, soil, terraces, rocks, and other areas, excluding the Pitaya plants. Image enhancement techniques facilitate the separation of target features and the background. In this paper, we use the decorrelation stretching method for image enhancement processing, the principle of which lies in the principal component transformation, which expands the coupling of image information with extremely strong correlation in each band by stretching the principal component information of RGB image bands, so that the image color saturation can be increased. The colors of the correlated areas are highlighted more vividly, and the darker area parts become brighter. The processing effect figure is shown in Figure 4a–d. From the processed images in the study area, we have divided out three similar color scenes, two complex topographic variation scenes, and one multiple crop coexistence scene, to implement the experiment.

2.3. Methodological Approach

2.3.1. Research Flow Chart

The technical route of the research is as follows: (1) Choose four research areas: Sunshine Orchard, Xinzhongsheng Pitaya Planting Base, Guangdong Pitaya Planting Demonstration Area, and Langdang Pitaya planting base; (2) manually collect data on the yield of Pitaya fruit and collect RGB images of UAV from four research areas; (3) construct a rapid yield estimation empirical model based on the number of Pitaya fruit plants; (4) divide the spliced drone images into three types of scenes: complex scenes with similar colors, complex terrain variation scenes, and complex scenes with multiple crop species coexisting; (5) for different complex scenarios, use different models to extract dragon fruit plants and obtain the number of dragon fruit plants; and (6) based on the model of rapid yield estimation and the extracted number of plants, complete the rapid yield estimation of Pitaya fruit. See Figure 5.
Figure 3. UAV low-altitude remote sensing data processing process; (a) Data collection; (b) Data processing.
Agriculture 13 01742 g003
Figure 4. Decorrelated stretching enhancement image. (a) Sunshine Orchard; (b) Xinzhongsheng Pitaya Planting Base; (c) Guanling Pitaya planting demonstration area; (d) Langdang Pitaya planting base.
Agriculture 13 01742 g004
Figure 5. Flow chart of this study.
Agriculture 13 01742 g005

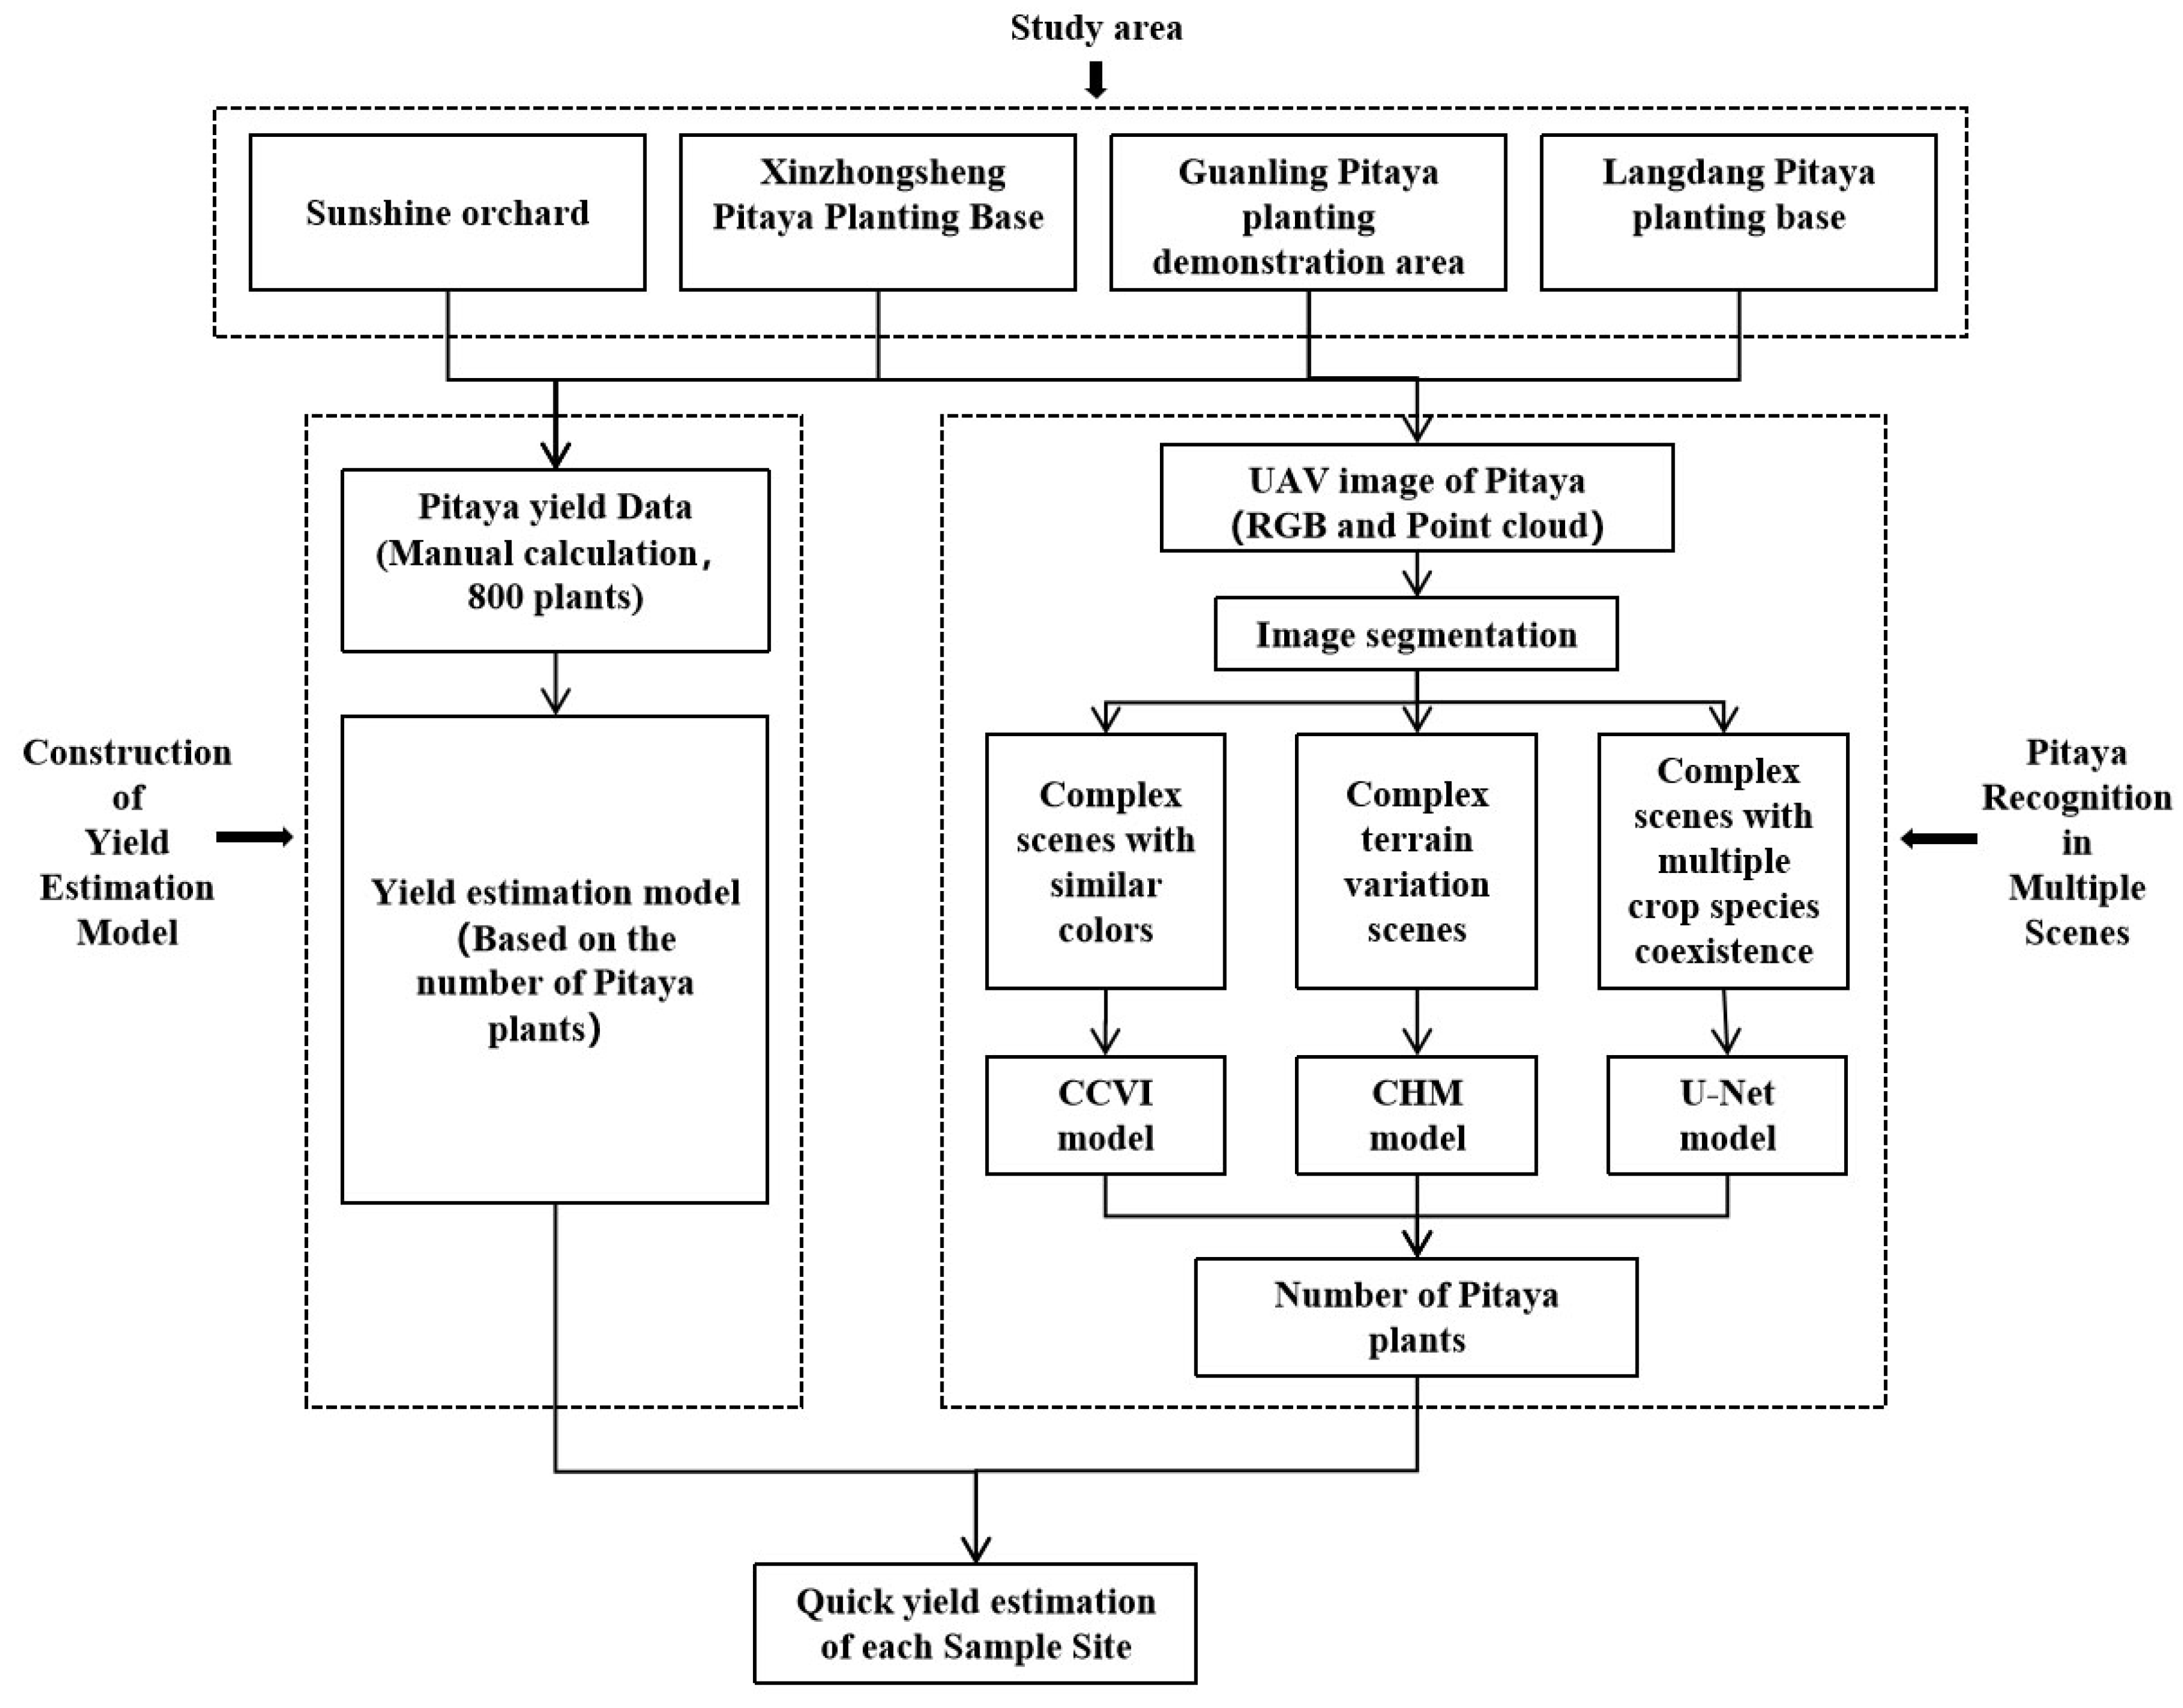
2.3.2. Remote Sensing Identification Method for Pitaya Plants in Complex Habitats

(1)
CCVI (Close Color Vegetation Index). For similar color complex scenes, use CCVI [30] for vegetation extraction. Close color complex scenes are remote sensing application scenes that possess similar color interference, such as wild weeds. In order to highlight the color difference between plants and weeds, combined with the numerical relationship between them in R, G, and B reflectance, the CCVI of similar color vegetation index based on visible light red, green, and blue 3 bands is constructed based on the principle of color addition by plants to R and G reflectance, calculated as the following equation:
C C V I = 3.60 R + 1.66 G 2 1.96 I
where R, G, and B represent the red, green, and blue bands, respectively. The density partitioning of the gray space after CCVI extraction is performed, and the binarization calculation of the gray space of Pitaya plants and weeds is performed using the bipartite histogram and the maximum class variance threshold extraction method to obtain the binarized gray space containing the target features and background values; then, the Pitaya plants are extracted.
(2)
CHM (Canopy Height Model). For complex topographic variation scenes, we use point cloud data to extract plants based on CHM (Canopy Height Model) [31,32]. CHM segmentation is a kind of raster image segmentation method, which mainly includes a watershed algorithm and a water injection algorithm. CHM segmentation removes noise from the original point cloud data and then performs a filtering process on the point cloud data, i.e., point cloud classification, and divides it into ground points and non-ground points. The ground point generates a digital elevation model (DEM) and the non-ground point generates a digital surface model (DSM), and the difference between them is used to calculate the Canopy Height Model (CHM). The generation of CHM is actually the establishment of the difference model between DSM and DEM to represent the height, location, and surface size of objects on the ground with the following equation:
C H M = D S M D E M
CHM-based plant extraction is a process of fixing the point location at the maximum value of local brightness and gradually decreasing along the edge direction. Combined with the actual measurement data of plant height of sample plants, the plant CHM is established, and the threshold range is set to obtain the CHM segmentation-based Pitaya plants.
(3)
U-Net Deep Learning Model. Plant extraction is performed using U-Net deep learning [33] for complex scenes with the coexistence of multiple crops. Multi-crop coexistence complex scenes consist of multiple crops and have multiple crop interpretation requirements. In these scenes, different crop types are able to be effectively recognized by constructing target samples for deep learning recognition.
The U-Net network model is an important semantic segmentation method in deep learning methods; it is a new Fully Convolutional Networks (FCN) segmentation model proposed by Çiçek et al. (2016) [34]. In the U-Net network, the down sampling part consists of 5 nodes, and the up sampling part consists of 4 nodes. Each layer consists of a convolutional layer, a pooling layer, and an activation function; the down sampling convolves and pools the image to extract the image features, and the up sampling precisely locates the recognition target and recovers the image size. The U-Net network model is shown in Figure 6.
In Figure 6, the bars indicate the feature map, and the top number represents the number of channels; the blue bars represent multichannel features; the gray bars represent duplicate multichannel features; the purple arrows indicate 3 × 3 convolution for feature extraction; the gray arrows indicate jump links for feature fusion; the red arrows indicate pooling for dimensionality reduction; the green arrows indicate up sampling for image size recovery; and the orange arrows indicate 1 × 1 convolution, which is used for outputting the results. Using the constructed Pitaya crop samples, the U-Net network model architecture learning samples are extracted to achieve efficient remote sensing recognition of Pitaya under complex scenes of multi-class crop coexistence based on U-Net deep learning.

2.3.3. Evaluation of the Accuracy of Pitaya Plant Identification

We use the detection rate (R), correct rate (P), and overall accuracy (F) to evaluate the accuracy of Pitaya plant identification.
(1)
The detection rate (R) calculation formula is as Equation (3):
R = T P N r
where TP is the number of correctly identified plants and Nr is the actual number of plants.
(2)
The accuracy rate (P) is calculated by Equation (4):
P = T P N c
where TP is the number of correctly identified plants and Nc is the number of identified plants.
(3)
The overall precision (F) is calculated as Equation (5):
F = R + P 2
where R is the detection rate and P is the accuracy rate.

2.3.4. Pitaya Yield Estimation Model

The average yield of single plants was used to estimate the yield of the featured crops in color similar scenes, terrain variation scenes, and coexistence of multiple crops scenes, respectively. The calculation method is shown in Equation (6):
I = N × ( m 1 × Y 1 + m 2 × Y 2 + m 3 × Y 3 )
where I is the yield, N is the number of individual plants of the crop, m1 is the average number of large fruits per plant, m2 is the average number of medium fruits per plant, m3 is the average number of small fruits per plant, Y1 is the average weight of large fruits, Y2 is the average weight of medium fruits, and Y3 is the average weight of small fruits.

3. Results

3.1. Complex Scenes with Similar Colors Pitaya Plant Recognition

3.1.1. CCVI Calculation

Using the band calculation tool of ENVI software [7,14,29,30], a remote sensing data processing platform, the similar color vegetation index model was used to calculate the CCVI (Close Color Vegetation Index) of the three sample plots (segment from Sunshine Orchard, Xinzhongsheng Pitaya Planting Base, and Langdang Pitaya planting base) containing Pitaya plants and weeds to obtain the color gray space, as shown in Figure 7a–c, for example.

3.1.2. CCVI Plant Identification

The grayscale spatial distribution of plants and weeds was obtained by grayscale density segmentation, and the maximum between-cluster variance method (OSTU method) [35] was used to binarize the grayscale of plants and weeds. Because the CCVI index was calculated in image elements, the binarization results showed some discontinuous fragmented patches and patch hollow phenomenon, and it used the processing methods of convolution filtering and cluster analysis to remove the fragmented patches and fill the patch hollow area. The three sample plots and the corresponding extraction results were obtained, as shown in Figure 8, for example.

3.1.3. Evaluation of the Accuracy of CCVI Plant Identification

Among the three sample areas, sample area 2 had the best extraction results, while sample area 1 and sample area 3 were affected by the topography, and the accuracy of digital orthophoto (DOM) was impaired, which caused the variation of DN values and resulted in a small number of missing extraction plants. On the other hand, because wild weeds and plants did not completely cover the whole sample area, there was some bare soil and a few field canyons, and the bare soil and field canyons were mistakenly treated as plants in the calculation of the index, which caused some over extraction errors. The actual number of Pitaya plants in the three sample areas, the CCVI index extracted plants, and the correct rate were obtained through human–machine interaction, respectively, as shown in Table 2.
Comparing the actual number of plants and the number of extracted plants in the three sample plots, the over extraction 14 plants were extracted from Sunshine Orchard, the over extraction 5 plants were extracted from Xinzhongsheng, and 10 plants were missed from Langdang; the overall precision, detection rate, and accuracy rate were all greater than 90%, which met the general requirements of extraction precision.

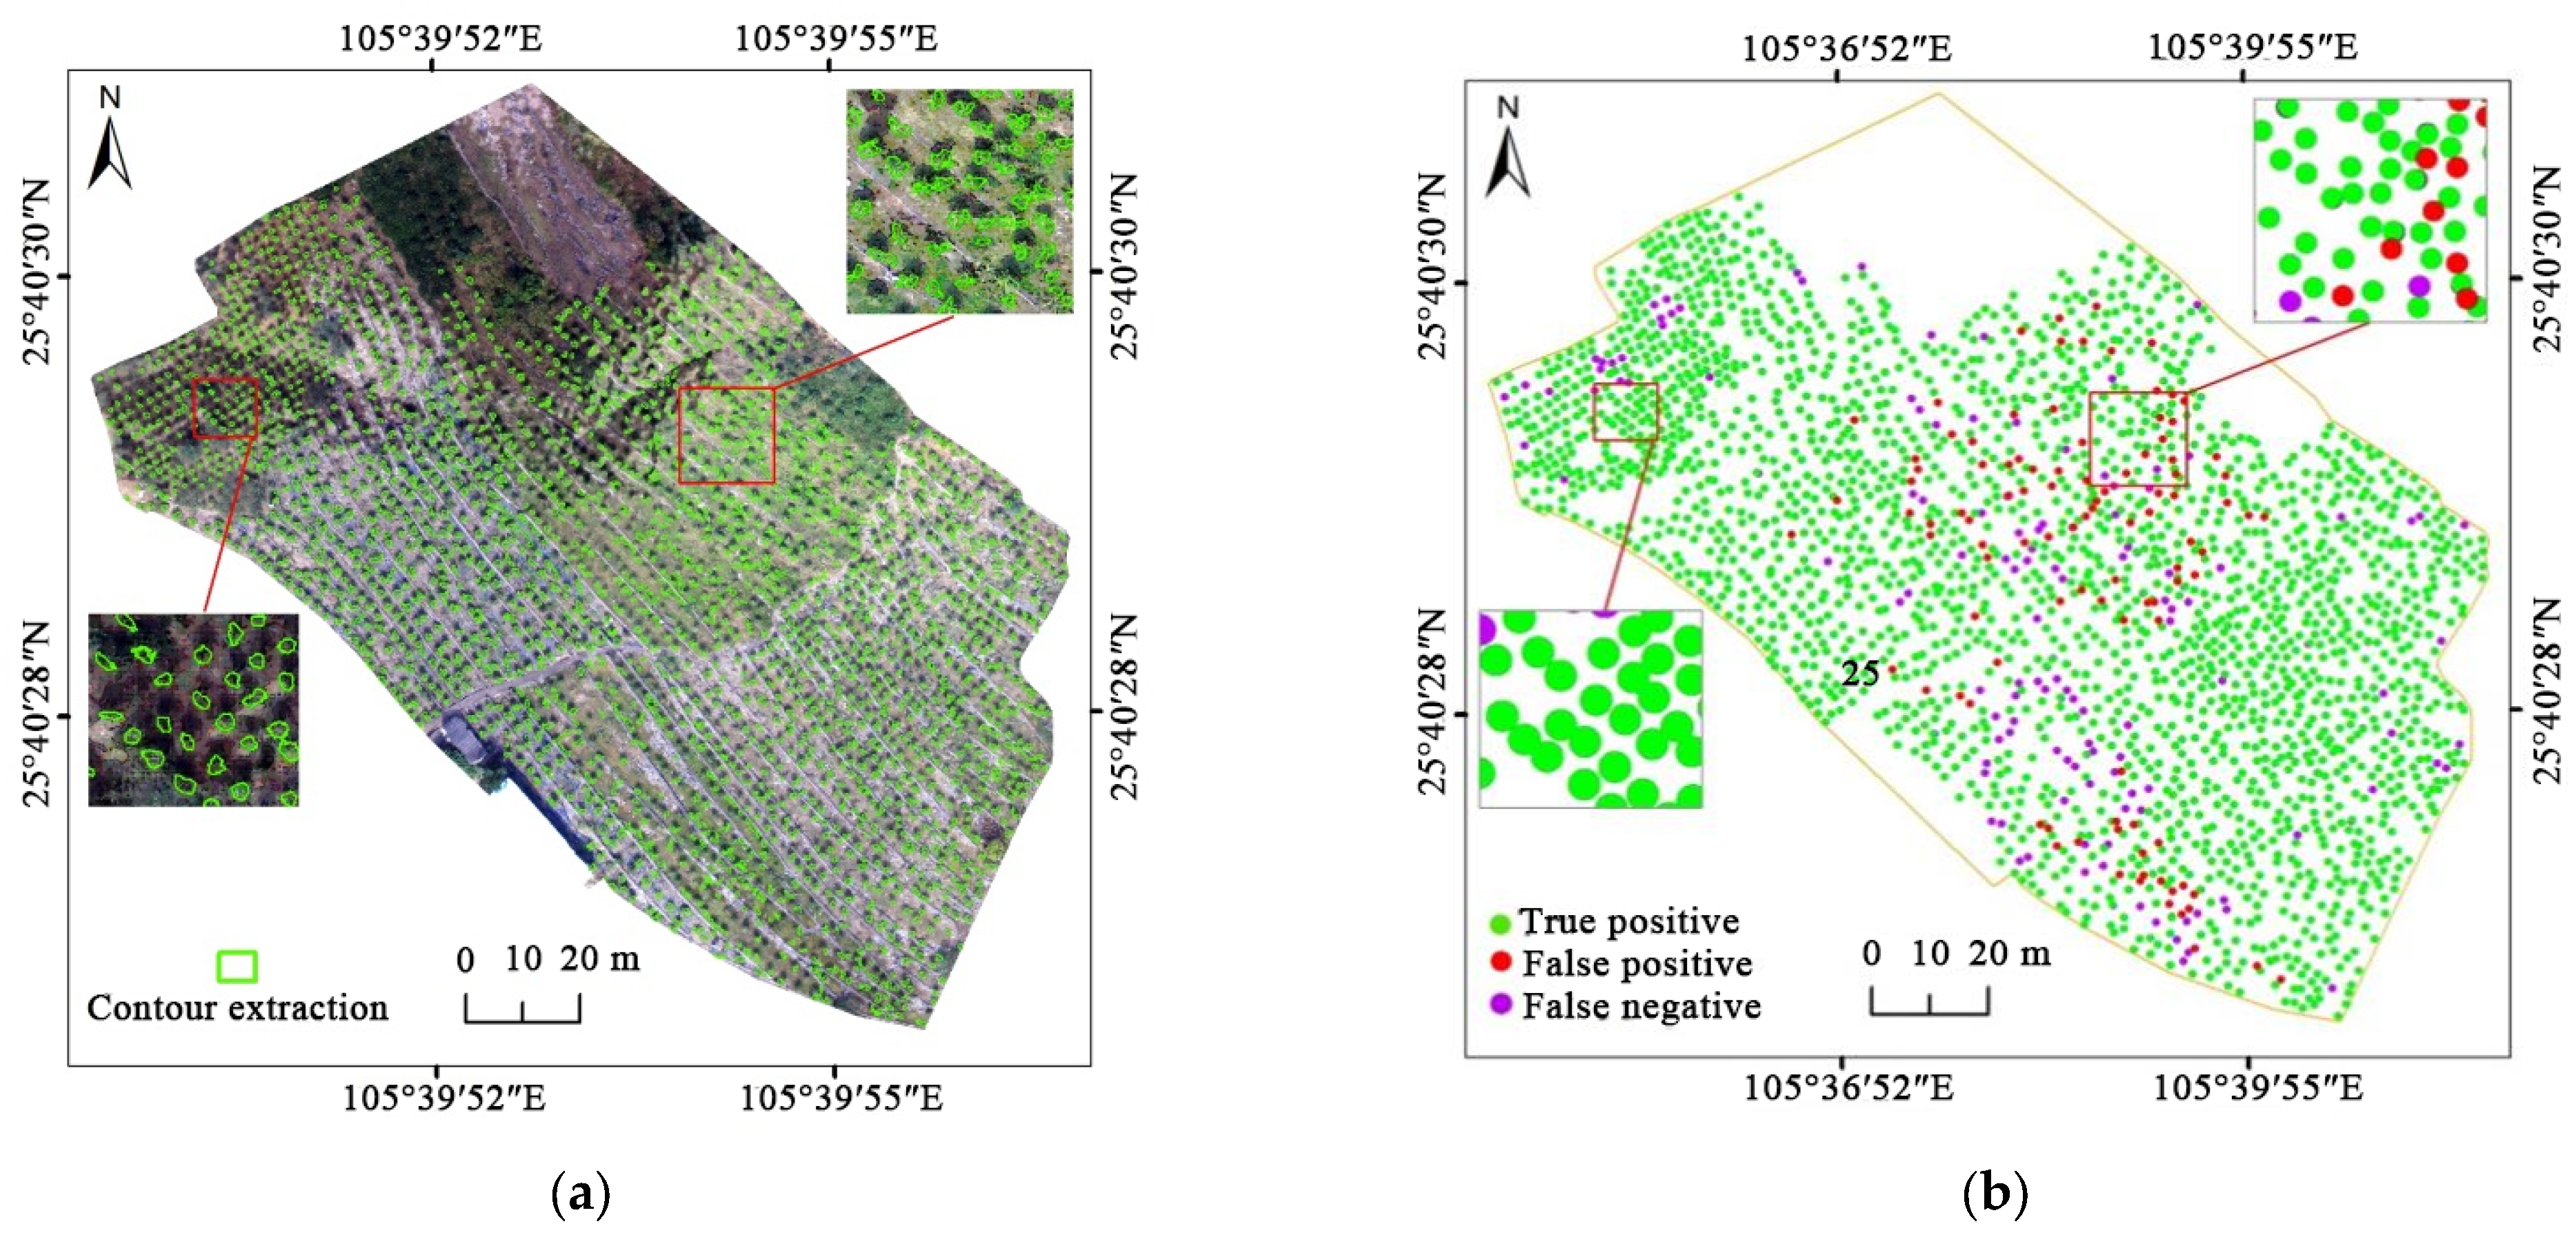
3.2. Identification of Pitaya Plants in Complex Terrain Variation Scenes

3.2.1. Point Cloud Characteristics of Pitaya Plants

The CHM (Canopy Height Model) was used to identify Pitaya plants in complex terrain variation scenes of the two sample plots (segment from Sunshine Orchard and Guanling Pitaya planting demonstration area). Two separate plants, two plants with branches crossing each other, and plants next to wild weeds were selected as samples, and the point cloud morphology of Pitaya plants under different growth environments was extracted by combining visible image data. The results are shown in Figure 9.
In Figure 9a–c, the separate Pitaya plants each have independent structural features, and there is no mutual interference with each other, which is good for separation. In Figure 9d–f, the branches of two Pitaya plants cross each other, and there is confusion of point clouds when acquiring. In Figure 9g–i, the point cloud data of wild weeds and Pitaya are plotted, and the point cloud data of Pitaya are obviously higher than those of weeds; the point cloud of weeds is close to the ground in space, which will not affect the extraction of Pitaya. In summary, the point cloud data distribution of Pitaya has an obvious spatial hierarchy, and the method of extracting single wood can be applied to the extraction of Pitaya plants.

3.2.2. Pitaya Recognition Based on CHM Segmentation and Accuracy Analysis

A watershed algorithm for CHM segmentation [31,32] was used to consider the image of the Pitaya canopy surface as a topological landscape in geodesy, and the gray value of each pixel in the image represents the elevation of that point. Each local minimal value and its influence area is called the catchment basin, which is the Pitaya canopy, and the boundary of the catchment basin forms the watershed, which is the Pitaya canopy boundary (Figure 10).
Figure 9. Point cloud morphology of Pitaya under different growth environments: (ac) Original image 1~3; (df) Point cloud rendering picture 1~3; (gi) Point cloud sample1~3.
Agriculture 13 01742 g009
Figure 10. Identification of Pitaya plants based on CHM segmentation.
Agriculture 13 01742 g010
The identified Pitaya plant canopy points were combined with the visually identified Pitaya plant location points to finally obtain their identification accuracy (Table 3).

3.3. Identification of Pitaya Plants in Complex Scenes with Multiple Crop Species Coexistence

In complex habitats with multiple crop types coexisting and large topographic undulations, resulting in the diminished significance of spectral feature differences, point clouds are difficult to distinguish crops. This study uses the U-Net deep learning network model to identify Pitaya plants in complex scenes with multiple crop species coexistence of the sample plots (segment from Langdang Pitaya planting base).

3.3.1. Recognition Sample Training and Analysis

Construction of the training sample set. In order to realize the differentiation of data, the differentiation model is obtained by training the U-Net deep learning network. The training sample set was established by combining samples of multiple landscapes and multiple influencing factors [36,37], and then the samples were binarized to establish a large number of sample sets with high richness and high accuracy (Figure 11).
Sample set slicing. Due to the special structure of down sampling and up sampling of the U-Net network model, though it does not limit the size of the image, the sample set with too large a size will bring a negative impact on the network training time. The slicing of the sample set can better reduce the training time and improve the model efficiency. During training, we divided the regional sample set into 224 × 224 sample slices and selected 100 slices containing Pitaya plants in the sample slices to construct the training sample data.
Sample set classification. The sample data were classified into the training set, the validation set, and the test set, with the proportion of the training set being 60%, the proportion of the validation set being 20%, and the proportion of the test set being 20%. The training set was used to fit the data samples for the model and to debug the parameters in the network; the validation set was used to see whether the effect of model training proceeds in a bad direction, which was reflected in the training process; and the test set was used to evaluate the generalization ability of the final model. The division of the original data into three datasets prevented the model from being overfitted. The training process of Pitaya plant samples is shown in Figure 12.

3.3.2. Analysis of Recognition Results and Accuracy

Using the U-Net deep learning network model, recognition samples of multiple crops were constructed for deep learning recognition extraction, and the results of Pitaya plant extraction are shown in Figure 13.
The segmentation results of the U-Net model of the sample were analyzed, and the accuracy of the detection rate, the correct rate, and the overall accuracy reached more than 90% (Table 4).

3.4. Yield Estimation Model Construction and Accuracy Verification

3.4.1. Yield Estimation Model Construction

Five batches of, in total, 800 sets of yield data were obtained by actual measurement, and the average weights of large, medium, and small fruits of a single plant were measured as 402.33 g, 274.73 g, and 203.12 g, respectively. The model of Pitaya yield estimation is:
I = N × ( 0.19 × 402.33 + 2.22 × 274.73 + 2.69 × 203.12 )
where I is the yield and N is the number of individual plants of the crop.

3.4.2. Yield Estimation in Different Habitats

(1)
Fast estimation of yield in complex scenes of similar colors
Under the conditions of complex scenes with similar colors, such as wild weed interference, the number of extracted plants in the three sample areas was obtained using CCVI. This was combined with the Pitaya estimation model to obtain the estimated yield results of the three sample sites, as shown in Table 5.
From the results, it can be seen that the total accuracy of the estimated yield results compared to the actual results of the three batches at different locations were 91.34%, 88.19%, and 94.24%, all with high precision.
(2)
Rapid yield estimation under complex scenes of terrain variation
Under the conditions of complex scenes with terrain variation, the CHM was used to obtain the number of extracted plants in the two sample sites and combined with the Pitaya estimation model to obtain the estimated yield results of the two sample sites, as shown in Table 6.
From the results, it can be seen that the total precision of the estimated yield results compared to the actual results of the sample site are 91.99%, and 94.80%, respectively, all of which have a high degree of precision.
(3)
Rapid yield estimation under complex scenes of multi-crop coexistence
Under the conditions of complex scenes with multi-crop coexistence, the U-Net deep learning model was used to obtain the number of extracted Pitaya plants in the sample site. Combined with the yield estimation model, the Pitaya yield estimation results of the sample site were obtained, as shown in Table 7.
From the results, it can be seen that the total precision of the estimated Pitaya yield results compared to the actual results of the sample site is 95.18%, which has a high degree of precision.

4. Discussion

The terrain is fragmented and complex in karst mountainous areas, causing farmlands in karst mountainous areas to become small and scattered, which means they are not easily revealed on traditional satellite remote sensing pictures. The subtropical monsoon climate in Guizhou Province exacerbates the situation because traditional satellite remote sensing is easily affected by clouds and rain. So, because it is generally ineffective for crops identification in karst mountainous areas to use traditional satellite remote sensing methods, yield estimation is even harder to realize. In this article, we explored the use of UAV remote sensing to increase plants extraction precision, and proposed a new model for yield estimation of the special plant Pitaya. The accuracy of the methods promoted in this article show high accuracy, but their applicability is still an issue that deserves further exploration.

4.1. The Use of UAV Remote Sensing

Low-altitude UAV remote sensing has flexible periodicity and timelines for crop growth data collection and monitoring. Based on UAV remote sensing images, this study used multiple identification methods and remote sensing software to accurately identify individual Pitaya plants and successfully established a Pitaya yield estimation model based on fruit production data of sample plants measured in the field for multiple periods to perform rapid yield estimation for three application scenes. However, UAV remote sensing technology is still in a stage of continuous development, and high-quality image acquisition is affected by various factors [16]. For example, UAVs are limited by their battery capacity, and it may take several flights to complete aerial photography within one region; as such, it is necessary to consider the influence of flight time and spatial resolution, overlap settings, load, etc. [38]. Reducing the flight altitude is one way to improve the spatial resolution of the image, but it could lead to a reduction in ground coverage and an increase in flight time. Increasing the degree of overlap can improve the image stitching effect, but it will also increase the flight time [39]. So, a reasonable flight mission needs to be tailored according to the research needs and field conditions.

4.2. Precision of Identifying Plants in the Images or Similar

In the complex terrain of karst mountains, multiple identification methods are used for accurate identification of Pitaya plants in different scenes. In scenes where Pitaya plants mix with wild plants of the same color, the average accuracy of Pitaya identification based on the CCVI (Close Color Vegetation Index) method reached 92.37%; in scenes of complex terrain variation, the average accuracy of Pitaya identification based on the CHM reached 89.09%; and in scenes where multiple crops coexist, the average total accuracy of Pitaya identification based on the U-Net deep learning model reached 92.76%. As the numbers indicate, the overall accuracy of the methods promoted in this article is high, hence proving the effectiveness and necessity of the application of different methods for complex karst region crop identification using remote sensing. Compared with previous studies, in which the identification of bulk crops is mainly distributed in plain areas [40,41,42], this study firstly targeted the broken and scattered planting areas of characteristic crops in karst complex areas and originally implemented crop identification methods divided according to different background scenarios. By dividing the study area into small areas of different scenarios, we improved the scope limitation of crop identification research and fixed the inapplicability of normal methods caused by complex surface variation and fragmentation in karst areas. Compared with existing studies [30,31,43,44,45,46,47,48,49,50,51], this broadens the scope of UAV in surface parameter inversion, too.

4.3. The Yield Estimation Model and Its Applicability

There are currently few studies on yield estimation of Pitaya using remote sensing, and there is no unified standard yield estimation model yet. In this study, we propose a new method using multi-period field-collected yield data in several sample areas to construct a yield estimation model. This model fills the gap in the yield estimation research of characteristic crops in karst complex areas and expands the further application of crop characteristics extracted by UAV, though the applicability of this model to areas other than karst terrain needs further verification. The next step of this study is to collect yield data from Pitaya plants in multiple regions, expand the test area, so as to explore regional differences in the yield estimation of Pitaya, and improve the applicability of the model. Secondly, in this study, the obtained yield estimation model was limited to the peak production period of Pitaya. Further consideration could be given to obtaining image data of multiple Pitaya production periods for many years and collecting yield data for the same period to explore a yield estimation model applicable to different Pitaya production periods, and then improving the accuracy of the Pitaya yield estimation model.

5. Conclusions

This study, based on UAV remote sensing data, uses various identification methods and remote sensing software to realize the identification of Pitaya plants with high accuracy in different complex scenes, and establishes a new Pitaya yield estimation model based on Pitaya yield. The main findings are as follows:
(1)
The application of different identification methods and remote sensing software can accurately identify individual Pitaya plant in complex scenes of karst background. The total precision is high, which demonstrates the effectiveness and necessity of using UAV remote sensing data to divide different scenes and of implementing multiple methods to realize the identification of specialty crops in complex karst areas.
(2)
Based on fruit production data of sample plants measured in the field and the identified Pitaya plants, a rapid yield estimation model for three different scenes was constructed. The yield estimation results show high accuracy, which implicates the effectiveness of the rapid yield estimation model constructed in this study.
(3)
This study has preliminarily proven that it is feasible to use UAV remote sensing images for single Pitaya plant identification and, therefore, to implement rapid yield estimation.

Author Contributions

Conceptualization, R.P. and Z.Z.; Methodology, R.P.; Validation, R.P.; Formal analysis, M.Z.; Investigation, R.P. and R.L.; Resources, Z.Z. and Y.L.; Data curation, D.H. and Y.L.; Writing—original draft preparation, R.L., Y.L. and D.H.; Writing—review and editing, R.P., Z.Z. and R.L. All authors have read and agreed to the published version of the manuscript.

Funding

This research was funded by the “100” level Talents Project of Guizhou Provincial high-level innovative talents training plan, grant number [2016] 5674, the Guizhou Provincial Science and Technology Foundation, grant number ZK [2021]-194, the Guizhou graduate education innovation program, grant number YJSCXJH [2020]103, the Guizhou Province Science and Technology Support Project, grant number [2023] General-176, and The Science and Technology Program of Guizhou Province, grant number 2020 1Z031.

Institutional Review Board Statement

Not applicable.

Data Availability Statement

Not applicable.

Conflicts of Interest

The authors declare no conflict of interest.

References

  1. Sweeting, M.M. Karst in China: Its Geomorphology and Environment; Springer: Berlin/Heidelberg, Germany, 1995; pp. 1–5. [Google Scholar]
  2. Hartmann, A.; Goldscheider, N.; Wagener, T.; Lange, J.; Weiler, M. Karst water resources in a changing world: Review of hydrological modeling approaches. Rev. Geophys. 2015, 52, 218–242. [Google Scholar] [CrossRef]
  3. Yuan, D.; Jiang, Y.; Shen, L. Modern Karstology; Science Press: Beijing, China, 2016. [Google Scholar]
  4. Song, T.Q.; Peng, W.X.; Du, H.; Wang, K.; Zeng, F. Occurrence, spatial-temporal dynamics and regulation strategies of karst rocky desertification in south-west China. Acta Ecol. Sin. 2014, 34, 5328–5341. [Google Scholar]
  5. Wang, S.; Yan, Y.; Fua, Z.; Chen, H. Rainfall-runoff characteristics and their threshold behaviors on a karst hillslope in a peak-cluster depression region. J. Hydrol. 2022, 605, 127370. [Google Scholar] [CrossRef]
  6. Hu, L.; Xiong, K.N.; Xiao, S.Z.; Zhu, H.B. Man-Land Elationship and Its Control in Guizhou Karst Area. J. Guizhou Univ. 2014, 31, 117–121. [Google Scholar]
  7. Wang, L.Y.; Zhou, Z.F.; Zhao, X.; Kong, J.; Zhang, S. Spatiotemporal Evolution of Karst Rocky Desertification Abandoned Cropland Based on Farmland-parcels Time-series Remote Sensing. J. Soil. Water Conserv. 2020, 34, 92–99. [Google Scholar]
  8. Peng, R.W.; Zhou, Z.F.; Huang, D.H.; Li, Q.X.; Hu, L.W. Evaluation of Pitaya Planting Suitability in Mountainous Areas Based on Multi-Factor Analysis. Chin. J. Agric. Resour. Reg. Plan. 2022, 43, 179–188. [Google Scholar]
  9. Guizhou Provincial Government Work Report. 2019. Available online: http://www.guizhou.gov.cn/ (accessed on 1 February 2023).
  10. Ordoez, J. Ensuring Agricultural Sustainability through Remote Sensing in the Era of Agriculture 5.0. Appl. Sci. 2021, 11, 5911. [Google Scholar]
  11. Zhu, Y.L.; Sensen, W.; Qin, M.J.; Fu, Z.Y.; Gao, Y.; Wang, Y.Y.; Du, Z.H. A deep learning crop model for adaptive yield estimation in large areas. J. Appl. Earth Obs. Geoinf. 2022, 110, 102828. [Google Scholar] [CrossRef]
  12. Wang, F.; Wang, F.; Hu, J.; Xie, L.L.; Yao, X.P. Rice yield estimation based on an NPP model with a changing harvest index. IEEE J. Sel. Top. Appl. Earth Obs. Remote Sens. 2020, 13, 2953–2959. [Google Scholar] [CrossRef]
  13. He, Y.H.; Qiu, B.W.; Cheng, F.F.; Chen, C.C.; Sun, Y.; Zhang, D.S.; Lin, L.; Xu, A.Z. National Scale Maize Yield Estimation by Integrating Multiple Spectral Indexes and Temporal Aggregation. Remote Sens. 2023, 15, 414. [Google Scholar] [CrossRef]
  14. Liu, M.Q. Study on Yield Estimation Model of Interplanting Tobacco in Complex Mountainous Area Based on Remote sensing Image No.3 of Resource. Master’s Thesis, Shandong Agricultural University, Tai’an, China, 2016. [Google Scholar]
  15. Fu, H.; Wang, C.; Cui, G.; Wei, S.; Lang, Z. Ramie Yield Estimation Based on UAV RGB Images. Sensors 2021, 21, 669. [Google Scholar] [CrossRef] [PubMed]
  16. Yan, L.; Liao, X.H.; Zhou, C.H.; Fan, B.Q.; Gong, J.Y.; Cui, P.; Zheng, Y.Q.; Tan, X. The Impact of UAV Remote Sensing Technology on the Industrial Development of China. J. Geo-Inf. Sci. 2019, 21, 476–495. [Google Scholar]
  17. Liao, X.H.; Zhou, C.H.; Su, F.Z.; Lu, H.Y.; Yue, H.Y.; Hou, J.P. The Mass Innovation Era of UAV Remote Sensing. J. Geo-Inf. Sci. 2016, 18, 1439–1447. [Google Scholar]
  18. Su, J.; Coombes, M.; Liu, C.; Zhu, Y.C.; Song, X.Y.; Fang, S.B.; Guo, L.; Chen, W.H. Machine Learning-Based Crop Drought Mapping System by UAV Remote Sensing RGB Imagery. Unmanned Syst. 2020, 8, 71–83. [Google Scholar] [CrossRef]
  19. Deng, J.Z.; Ren, G.S.; Lan, Y.B.; Huang, H.S.; Zhang, Y.L. Low altitude unmanned aerial vehicle remote sensing image processing based on visible band. J. South. China Agric. Univ. 2016, 37, 16–22. [Google Scholar]
  20. Gao, Y.G.; Ling, Y.H.; Wen, X.L.; Jan, W.B.; Gong, Y.S. Vegetation information recognition in visible band based on UAV images. Trans. Chin. Soc. Agric. Eng. 2020, 36, 178–189. [Google Scholar]
  21. Chen, Z.Y.; Liao, I.Y. Evaluation of Feature Extraction Methods for Classification of Palm Trees in UAV Images. In Proceedings of the 2019 International Conference on Computer and Drone Applications (IConDA), Kuching, Malaysia, 19–21 December 2019. [Google Scholar]
  22. Sothe, C.; Rosa, L.; Almeida, C.M.; Gonsamo, A.; Schimalski, M.B.; Castro, J.D.B.; Feitosa, R.Q.; Dalponte, M.; Lima, C.L.; Liesenberg, V.; et al. Evaluating a convolutional neural network for feature extraction and tree species classification using UAV-Hyperspectral images. Remote Sens. Spat. Inf. Sci. 2020, 3, 196–199. [Google Scholar] [CrossRef]
  23. Al-Ruzouq, R.; Gibril, M.B.A.; Shanableh, A. Self-adaptive Image Segmentation Optimization for Hierarchal Object-based Classification of Drone-based Images. IOP Conf. Ser. Earth Environ. Sci. 2020, 540, 012090. [Google Scholar] [CrossRef]
  24. Wang, X.Q.; Wang, M.M.; Wang, S.Q.; Wu, Y. Extraction of vegetation information from visible unmanned aerial vehicle images. Trans. Chin. Soc. 2015, 31, 152–159. [Google Scholar]
  25. Brief Introduction of Luodian County. 2020. Available online: http://www.gzluodian.gov.cn/ (accessed on 1 February 2023).
  26. Overview of Natural Resources in Luodian County. 2019. Available online: http://www.gzluodian.gov.cn/ (accessed on 1 February 2023).
  27. Zhao, Y.L.; Zhao, J.; Li, Y.; Xue, Q.Y. Research progress of Huajiang Karst Gorge in Guizhou Province. J. Guizhou Norm. Univ. Nat. Sci. 2022, 40, 1–10+132. [Google Scholar]
  28. Overview of Natural Resources in Huajiang Town. 2020. Available online: http://www.guanling.gov.cn/ (accessed on 1 February 2023).
  29. Zhao, X.; Zhou, Z.F.; Wang, L.Y.; Luo, J.C.; Sun, Y.W.; Liu, W.; Wu, T.J. Extraction and Analysis of Cultivated Land Experiencing Rocky Desertification in Karst Mountain Areas Based on Remote Sensing—A Case Study of Beipanjiang Town and Huajiang Town in Guizhou Province. Trop. Geogr. 2020, 40, 289–302. [Google Scholar]
  30. Zhu, M.; Zhou, Z.F.; Zhao, X.; Huang, D.H.; Jang, Y.; Wu, Y.; Cui, L. Recognition and Extraction Method of Single Pitaya Plant in Plateau-Canyon Areas Based on UAV Remote Sensing. Trop. Geogr. 2019, 039, 502–511. [Google Scholar]
  31. YING, L.J.; Zhou, Z.F.; Huang, D.H.; Sang, M.J. Extraction of individual plant of Pitaya in Karst Canyon Area based on point cloud data of UAV image matching. Acta Agric. Zhejian Gensis 2020, 32, 1092–1102. [Google Scholar]
  32. Birdal, A.C.; Avdan, U.; Türk, T. Estimating tree heights with images from an unmanned aerial vehicle. Geomat. Nat. Haz Risk 2017, 8, 1144–1156. [Google Scholar] [CrossRef]
  33. Falk, T.; Mai, D.; Bensch, R.; Çiçek, Ö.; Abdulkadir, A.; Marrakchi, Y.; Böhm, A.; Deubner, J.; Jäckel, Z.; Seiwald, K.; et al. U-Net: Deep learning for cell counting, detection, and morphometry. Nat. Methods 2019, 16, 67. [Google Scholar] [CrossRef]
  34. Özgün, Ç.; Ahmed, A.; Soeren, S.L.; Thomas, B.; Olaf, R. 3D U-Net: Learning dense volumetric segmentation from sparse annotation. In Medical Image Computing and Computer—Assisted Intervention; Springer: Berlin/Heidelberg, Germany, 2016; Volume 9901, pp. 424–432. [Google Scholar]
  35. Otsu, N. A threshold selection method from gray-level histograms. Automatica 1978, 11, 23–27. [Google Scholar] [CrossRef]
  36. Sezgin, M. Survey over image thresholding techniques and quantitative performance evaluation. J. Electron. Imaging 2004, 13, 146–168. [Google Scholar]
  37. Li, Z.X.; Yan, Z.K.; Zhang, X. Discussion on Key Technology and Application of UAV Surveying Data Processing. Bull. Surv. Mapp. 2017, S1, 36–40. [Google Scholar]
  38. Liao, X.H.; Huan, Y.H.; Xu, C.C. Views on the study of low-altitude airspace resources for UAV applications. ACTA Geograph. Sin. 2021, 76, 2607–2620. [Google Scholar]
  39. Huang, D.H.; Zhou, Z.F.; Peng, R.W.; Zhu, M.; Yin, L.J.; Zhang, Y.; Xiao, D.N.; Li, Q.X.; Hu, L.W.; Huang, Y.Y. Challenges and main research advances of low-altitude remote sensing for crops in southwest plateau mountains. J. Guizhou Norm. Univ. Nat. Sci. 2021, 39, 51–59. [Google Scholar]
  40. Zhao, L.C.; Li, Q.Z.; Chang, Q.R.; Shang, J.L.; Du, X.; Liu, J.G.; Dong, T.F. In-season crop type identification using optimal feature knowledge graph. Remote Sens. Spat. Inf. Sci. 2022, 194, 250–266. [Google Scholar] [CrossRef]
  41. Niu, X.Y.; Zhang, L.Y.; Han, W.T.; Shao, G.M. Fractional Vegetation Cover Extraction Method of Winter Wheat Based on UAV Remote Sensing and Vegetation Index. Trans. Chin. Soc. Agric. Mach. 2018, 49, 212–221. [Google Scholar]
  42. Yamashita, M.; Toyoda, H.; Tanaka, Y. Light environment and Lai Monitoring in Rice Community by Ground and UAV Based Remote Sensing. Remote Sens. Spat. Inf. Sci. 2020, 43, 1085–1089. [Google Scholar] [CrossRef]
  43. Dai, J.G.; Xue, J.L.; Zhao, Q.Z. Extracting cotton seedling information from UAV visible light remote sensing image. J. Agric. Eng. 2020, 36, 63–71. [Google Scholar]
  44. Zhao, J.; Yang, H.B.; Lan, Y.B.; Lu, L.Q.; Jia, P.; Li, Z.M. Extraction Method of Summer Corn Vegetation Coverage Based on Visible Light Image of Unmanned Aerial Vehicle. Trans. Chin. Soc. Agric. Mach. 2019, 050, 232–240. [Google Scholar]
  45. Bai, X.Y.; Sirui, Z.; Li, C.J. A carbon neutrality capacity index for evaluating carbonsink contributions. Environ. Sci. Environ. Sci. Ecotechnol. 2023, 10, 37. [Google Scholar]
  46. Xiao, B.Q.; Bai, X.Y.; Zhao, C.W. Responses of carbon and water use efficiencies to climate and land use changes in China’s karst areas. J. Hydrol. 2023, 617, 128968. [Google Scholar] [CrossRef]
  47. Li, C.J. High-resolution mapping of the global silicate weathering carbon sink and its long-term changes. Glob. Change Biol. 2022, 28, 4377–4394. [Google Scholar] [CrossRef]
  48. Lian, X.; Bai, X.Y.; Zhao, C.W.; Li, Y.B.; Tan, Q.; Luo, G.J.; Wu, L.H.; Chen, F.; Li, C.J.; Ran, C. High-resolution datasets for global carbonate and silicate rock weathering carbon sinks and their change trends. Earth’s Future 2022, 10, e2022EF002746. [Google Scholar]
  49. Li, C.J.; Pete, S.; Bai, X.Y. Effects of carbonate minerals and exogenous acids on carbon flux from the chemical weathering of granite and basalt. Global Planet. Change 2023, 221, 104053. [Google Scholar] [CrossRef]
  50. Shi, T.; Yang, T.M.; Hang, Y.; Li, X.; Liu, Q.; Yang, Y.J. Key Technologies of Monitoring High Temperature Stress to Rice by Portable UAV Multi Spectral Remote Sensing. Chin. J. Agrometeorol. 2020, 41, 597–604. [Google Scholar]
  51. Zhou, Q.; Robson, M. Automated rangeland vegetation cover and density estimation using ground digital images and a spectral-contextual classifier. Int. J. Remote Sens. 2001, 22, 3457–3470. [Google Scholar] [CrossRef]
Figure 1. The study sample area location diagram; (a) Study area location; (b) Study area location; (c) Guanling Pitaya planting demonstration area; (d) Sunshine Orchard; (e) Langdang Pitaya planting base; (f) Xinzhongsheng Pitaya Planting Base.
Agriculture 13 01742 g001
Figure 2. Pitaya data acquisition; (a) Data collection; (b) Data processing; (c) Pitaty images collected by UAV; (d) Manual measurement of yield data.
Agriculture 13 01742 g002
Figure 6. U-Net network model architecture.
Agriculture 13 01742 g006
Figure 7. The grayscale space calculated by the CCVI model; (a) Sample plot 1 (Sunshine Orchard); (b) Sample plot 2 (Xinzhongsheng Pitaya Planting Base); (c) Sample plot 3 (Langdang Pitaya planting base).
Agriculture 13 01742 g007
Figure 8. Results of CCVI extraction in three sample areas (example).
Agriculture 13 01742 g008
Figure 11. Construction of training sample set (example): (a) Original image; (b) Sample illustration of U-Net model.
Agriculture 13 01742 g011
Figure 12. Training process of Pitaya plant samples; (0–17) Example of sample sections.
Agriculture 13 01742 g012
Figure 13. Pitaya plant extraction results; (a) Raw images; (b) Extraction results.
Agriculture 13 01742 g013
Table 1. Parameters of the DJI Mavic 2 Pro UAV.
UAV Indicator NamesIndicator Information
Aircraft typeDJI Mavic 2 Pro
Maximum flight time31 min (25 km/h Uniform flight)
Maximum hover time29 min
Hover accuracyVertical: ±0.1 m; level: ±0.3 m
Maximum horizontal flight speed72 km/h
Camera pixel20 million effective pixels
Maximum photo resolution5472 × 3648
Experimental flight height60 m
Image pixel size obtained by experiment1.48 cm × 1.48 cm
Flight plan completion speed60 min/km2
Table 2. Extraction eigenvalues and accuracy validation of CCVI.
Statistical IndicatorsSample Site 1Sample Site 2Sample Site 3
Real number of plants/Nr178189176
Number of identification/Nc192194166
Leak Identification/FN71516
Error Identification/FP14510
Correct identification/TP171174160
Detection rate/R (%)96.07 92.0690.9
Accuracy rate/P (%)89.0689.7096.39
Overall precision/F (%)92.56590.8893.65
Table 3. Recognition accuracy based on CHM segmentation.
Statistical IndicatorsSample Site 1Sample Site 2
Real number of plants/Nr245199
Number of identification/Nc235192
Leak Identification/FN3125
Error Identification/FP2118
Correct identification/TP214174
Detection rate/R (%)87.3587.44
Accuracy rate/P (%)91.0690.63
Overall precision/F (%)89.1789.00
Table 4. Recognition accuracy based on U-Net model segmentation.
Statistical IndicatorsSample Site 1
Real number of plants/Nr1202
Number of identification strains/Nc1226
Leak Identification/FN38
Error Identification/FP62
Correct identification/TP1126
Detection rate/R (%)93.68
Accuracy rate/P (%)91.84
Overall precision/F (%)92.76
Table 5. Fast yield estimation results and accuracy for complex scenes with similar colors.
Statistical IndicatorsSample Site 1Sample Site 2Sample Site 3
Identification plants number192.00 194.00 166.00
Estimated yield (kg)236.69 239.15 204.63
Measured yield of the first batch (kg)218.45 218.45 212.21
Second batch measured yield (kg)222.66 215.64 185.54
The third batch of measured yield (kg)207.47 198.65 195.65
Estimated yield precision (first batch) (%)92.30%91.34%96.43%
Estimated yield precision (second batch) (%)94.07%90.17%90.67%
Estimated yield precision (third batch) (%)87.66%83.06%95.61%
Total precision (%)91.34%88.19%94.24%
Table 6. Fast yield estimation results and accuracy for complex terrain change scenes.
Statistical IndicatorsSample Site 1Sample Site 2
Identification plants number235192
Estimated yield (kg)289.69 236.69
Measured yield of the first batch (kg)312.11257.45
Second batch measured yield (kg)300.12242.73
The third batch of measured yield (kg)334.45224.77
Estimated yield precision (first batch) (%)92.82%91.93%
Estimated yield precision (second batch) (%)96.53%97.51%
Estimated yield precision (third batch) (%)86.62%94.97%
Total precision (%)91.99%94.80%
Table 7. Rapid yield estimation results and accuracy for complex scenes of multi-crop coexistence.
Statistical IndicatorsSample Site 1
Identification plants number1226
Estimated yield (kg)1511.33
Measured yield of the first batch (kg)1641.15
Second batch measured yield (kg)1495.23
The third batch of measured yield (kg)1599.24
Estimated yield precision (first batch) (%)92.09%
Estimated yield precision (second batch) (%)98.93%
Estimated yield precision (third batch) (%)94.50%
Total precision (%)95.18%
Disclaimer/Publisher’s Note: The statements, opinions and data contained in all publications are solely those of the individual author(s) and contributor(s) and not of MDPI and/or the editor(s). MDPI and/or the editor(s) disclaim responsibility for any injury to people or property resulting from any ideas, methods, instructions or products referred to in the content.

