Article

Investigating the Impacts of Wastewaters on Lettuce (Lactuca sativa) Seed Germination and Growth

by
Liam P. Reynolds
,
Vitória F. C. Leme
and
Paul C. Davidson
*
Department of Agricultural and Biological Engineering, University of Illinois at Urbana Champaign, Champaign, IL 61801, USA
*
Author to whom correspondence should be addressed.
Agriculture 2024, 14(4), 608; https://doi.org/10.3390/agriculture14040608
Submission received: 1 March 2024 / Revised: 5 April 2024 / Accepted: 9 April 2024 / Published: 12 April 2024
(This article belongs to the Special Issue Innovative Hydroponic Systems for Sustainable Agriculture)

Abstract

:
There is an opportunity for agriculture to utilize the many different waste streams in our world and capitalize on what would otherwise be viewed as waste products. Hydrothermal liquefaction (HTL) is an emerging technology for converting wet biomass to bio-crude oil, while aquaponics is a practice tracing back to indigenous communities around the world; both technologies have the potential to sustainably provide the necessary nutrients for crop growth. Food systems worldwide are actively transitioning to address the many challenges of climate change in a sustainable and efficient manner. Urban agriculture (UA) has the potential to generate localized crops in densely populated areas year-round, but has its challenges, involving high capital requirements, especially for vertical farming and controlled-environment agriculture, and being energy intensive due to artificial lighting and fossil fuel-based synthetic fertilizers. This study investigated the potential for aquaponic and HTL effluents to be used in hydroponic systems through a seed germination screening experiment. Buttercrunch lettuce (Lactuca sativa L.) seeds were placed in Ziploc plastic bags on paper towels saturated with the wastewater treatments for 10 days while their total length of growth was routinely measured from the tip of the root to the tip of the cotyledons. The Chicago High School for Agricultural Sciences (CHSAS) aquaponic effluent with a 5.8× times higher nitrate concentration and 4.25× higher ammonia concentration outperformed the Bevier aquaponic effluent and improved any other source water it was combined with. Results also showed that seed germination was not inhibited in the presence of 2–8% solutions of hydrothermal liquefaction aqueous phase (HTL-AP), which performed on par with standard hydroponic fertilizer; solutions of a higher percentage, though, may lead to inhibitory effects in plants, and those of a lower percentage may not provide enough nutrients in the proper forms to sustain plant growth. However, the nutrient analyses revealed that there is still much to investigate regarding the combination of wastewaters to provide a complete, well-rounded, and sustainable source for hydroponic crop production.

1. Introduction

Nontraditional farming techniques including hydroponics, aquaponics, urban indoor controlled-environment agriculture (CEA) operations, and vertical farming have the potential not to replace but to supplement and reduce strain on the existing food supply chain. In addition, these nontraditional farming techniques may assist in increasing consumer awareness of the links between the food supply chain and human health [1]. However, the current global agriculture industry in developed nations is facing increasing pressure to increase food production while supporting a wider variety of food sources produced locally, sustainably, and consistently [2]. There are widespread food insecurities and nutrient deficiencies globally that will only be exacerbated by agricultural losses due to extreme weather events and shifting climates from the increased emissions of greenhouse gases [3]. There are many market and non-market benefits to urban agriculture (UA) [1,4,5,6,7,8,9,10,11,12]. The most promising benefits relating to food security and food supply chain improvements are reduced food miles, as the food is produced closer to the consumer; increased yields per area, due to vertical and year-round farming; and improved distribution efficiencies, including reduced packaging and spoilage [12]. This paper will address another prospective benefit of UA by focusing on increasing its sustainability, specifically through the valorization of organic waste for nutrient recycling in urban ecosystems. With the eventual goal of creating a closed-loop urban system, various forms of urban ‘waste’, whether it is the composting of crop residue or other solid waste, irrigation with nutrient-dense wastewaters, or the conversion of organics to biofuels, can and have been sustainably utilized in many urban farming operations [1,11,12].
Hydrothermal liquefaction (HTL) is an emerging process that has shown potential in converting wet biomass into a renewable and sustainable fuel source in the form of bio-crude oil [13]. Gollakota et al. [13] summarize HTL as “the thermochemical conversion of biomass into liquid fuels by processing in a hot, pressurized water environment for sufficient time to break down the solid biopolymeric structure to mainly liquid components”. Jesse and Davidson [14] point out that, although this bio-crude oil is the main product of HTL, the aqueous-phase byproduct of HTL—or Hydrothermal Liquefaction Aqueous Phase (HTL-AP)—has the potential for use in crop production systems. HTL-AP has irrigation potential due to the destruction of pathogens by the high temperatures and pressures associated with HTL, while essential plant nutrients (i.e., N-P-K) remain [15,16,17]. Jesse and Davidson [14] additionally point out there may still be heavy metal contamination in addition to potential genetic material or pharmaceutical residues in HTL-AP, depending on the origin of the feedstock. They determined that both raw and various treated HTL-AP, by means of physical filtration, meet US EPA guidelines for wastewater reuse for crop irrigation in terms of heavy metals and E. coli and coliforms. However, in another study, Jesse et al. [18] demonstrated that diluted HTL-AP source waters alone are not a sufficient source of nitrogen and phosphorus for the hydroponic production of lettuce (Lactuca sativa L.); with nitrogen specifically, it was present in raw HTL-AP, but only 0.03% was in the plant-available form of nitrate. This lower concentration of plant-available nitrogen led to lower biomass production, which in turn led to a concentration of arsenic that exceeded the maximum concentration allowable under the US Department of Agriculture due to lower total biomass. Ultimately, the arsenic was more concentrated in the plant tissue because it was distributed across less biomass. Therefore, although HTL-AP has some potential for irrigation use as a nutrient source, it must be supplemented with sufficient nutrients to minimize the concentration of metalloids while also maximizing yields.
A potentially sustainable source of these supplemental nutrients can be found in aquaponics, a highly engineered water-based agriculture system, utilizing internal nutrient recycling from fish effluent, through the co-cultivation of fish with plants in hydroponic sub-systems [19]. Aquaponics may be a sustainable nutrient source because the production method is based on the concepts of minimal water use and nutrient reuse through recirculating aquaculture systems (RAS), leading to minimal impact on environmental water quality compared to traditional agricultural production methods [20]. Additionally, incorporating aquaponics into urban food production systems provides both a source of protein as well as fresh produce; aquaponics has also been shown to positively impact community and economic development in urban areas [21]. Aquaponics is not without its own needs for supplemental nutrient sources, often in the form of chemical fertilizers, but work has been done in researching plant growth-promoting microorganisms (PGPMs) to alleviate this supplementation by emphasizing PGPMs in system design [19,22].
For this study, aquaponic effluent was used as an important supplemental source of micronutrients and PGPMs for hydroponic systems. Previous research by Goddek et al. [23] found that aquaponic sludge processed via anaerobic digestion positively increased plant growth compared to aerobic digestate as well as the control system. It was hypothesized that this was due to increased ammonium, dissolved organic matter, humic acid, and PGP rhizobacteria and fungi. Carvalho et al. [24] found that, although hydroponic systems with both wastewater and chemical fertilizers as nutrient sources were no different than the positive control, the system with wastewater as the sole nutrient source required additional nutrient supplementation. Egbuikwem et al. [25] also determined that there was a positive indication for the reuse of mixed wastewater in hydroponics. They confirmed a need to further investigate the benefits and limitations of such water.
When utilizing nutrient analysis and spectroscopy to determine what makes a viable nutrient source, there have been few studies investigating the impacts of various nutrients and compounds on the actual germination of seeds as opposed to the growth of crops after successful germination. The work of Arancon et al. [26] investigated the effects of soaking lettuce and tomato seeds in various concentrations of compost teas before analyzing differences in germination. They found that germination percentage increased linearly with compost-tea concentration and that soaked trials outperformed unsoaked trials. Ahmed et al. [27] determined that nitrogen nanobubbles had a significant positive effect on both germination percentage and hypocotyl length for lettuce seeds. This aligns with the compost tea results, as compost tea is largely composed of carbon and nitrogen species. The impact of certain micronutrients as well as biological treatments, comparable to PGPMs, were studied by Postic et al. [28]. They determined that the biological treatment had the largest positive impact on germination percentage, followed by the mixed treatment and then the Zinc and Boron treatments.
The standard germination characteristics of L. sativa are well known and have been utilized for many different experimental designs [23,24,25,26,27,28,29,30,31]. The temperature should be maintained between 18–25 ℃, with different day and night temperatures acceptable. Moisture should not be a limiting factor; therefore, adequate irrigation volume should be provided to maintain a relative humidity of at least 60%. L. sativa can be germinated in the presence or absence of light over the course of 6–10 days. The United States Federal minimum germination percentage for lettuce is 80%, although the controls in any experiment should have at least a 90% germination rate.
The overall objective of this study is to further investigate the effects of mixed wastewaters, namely HTL-AP, chemical fertilizers, and aquaponic effluent sources, on the initial germination of buttercrunch lettuce seeds. The specific objectives of this study are to:
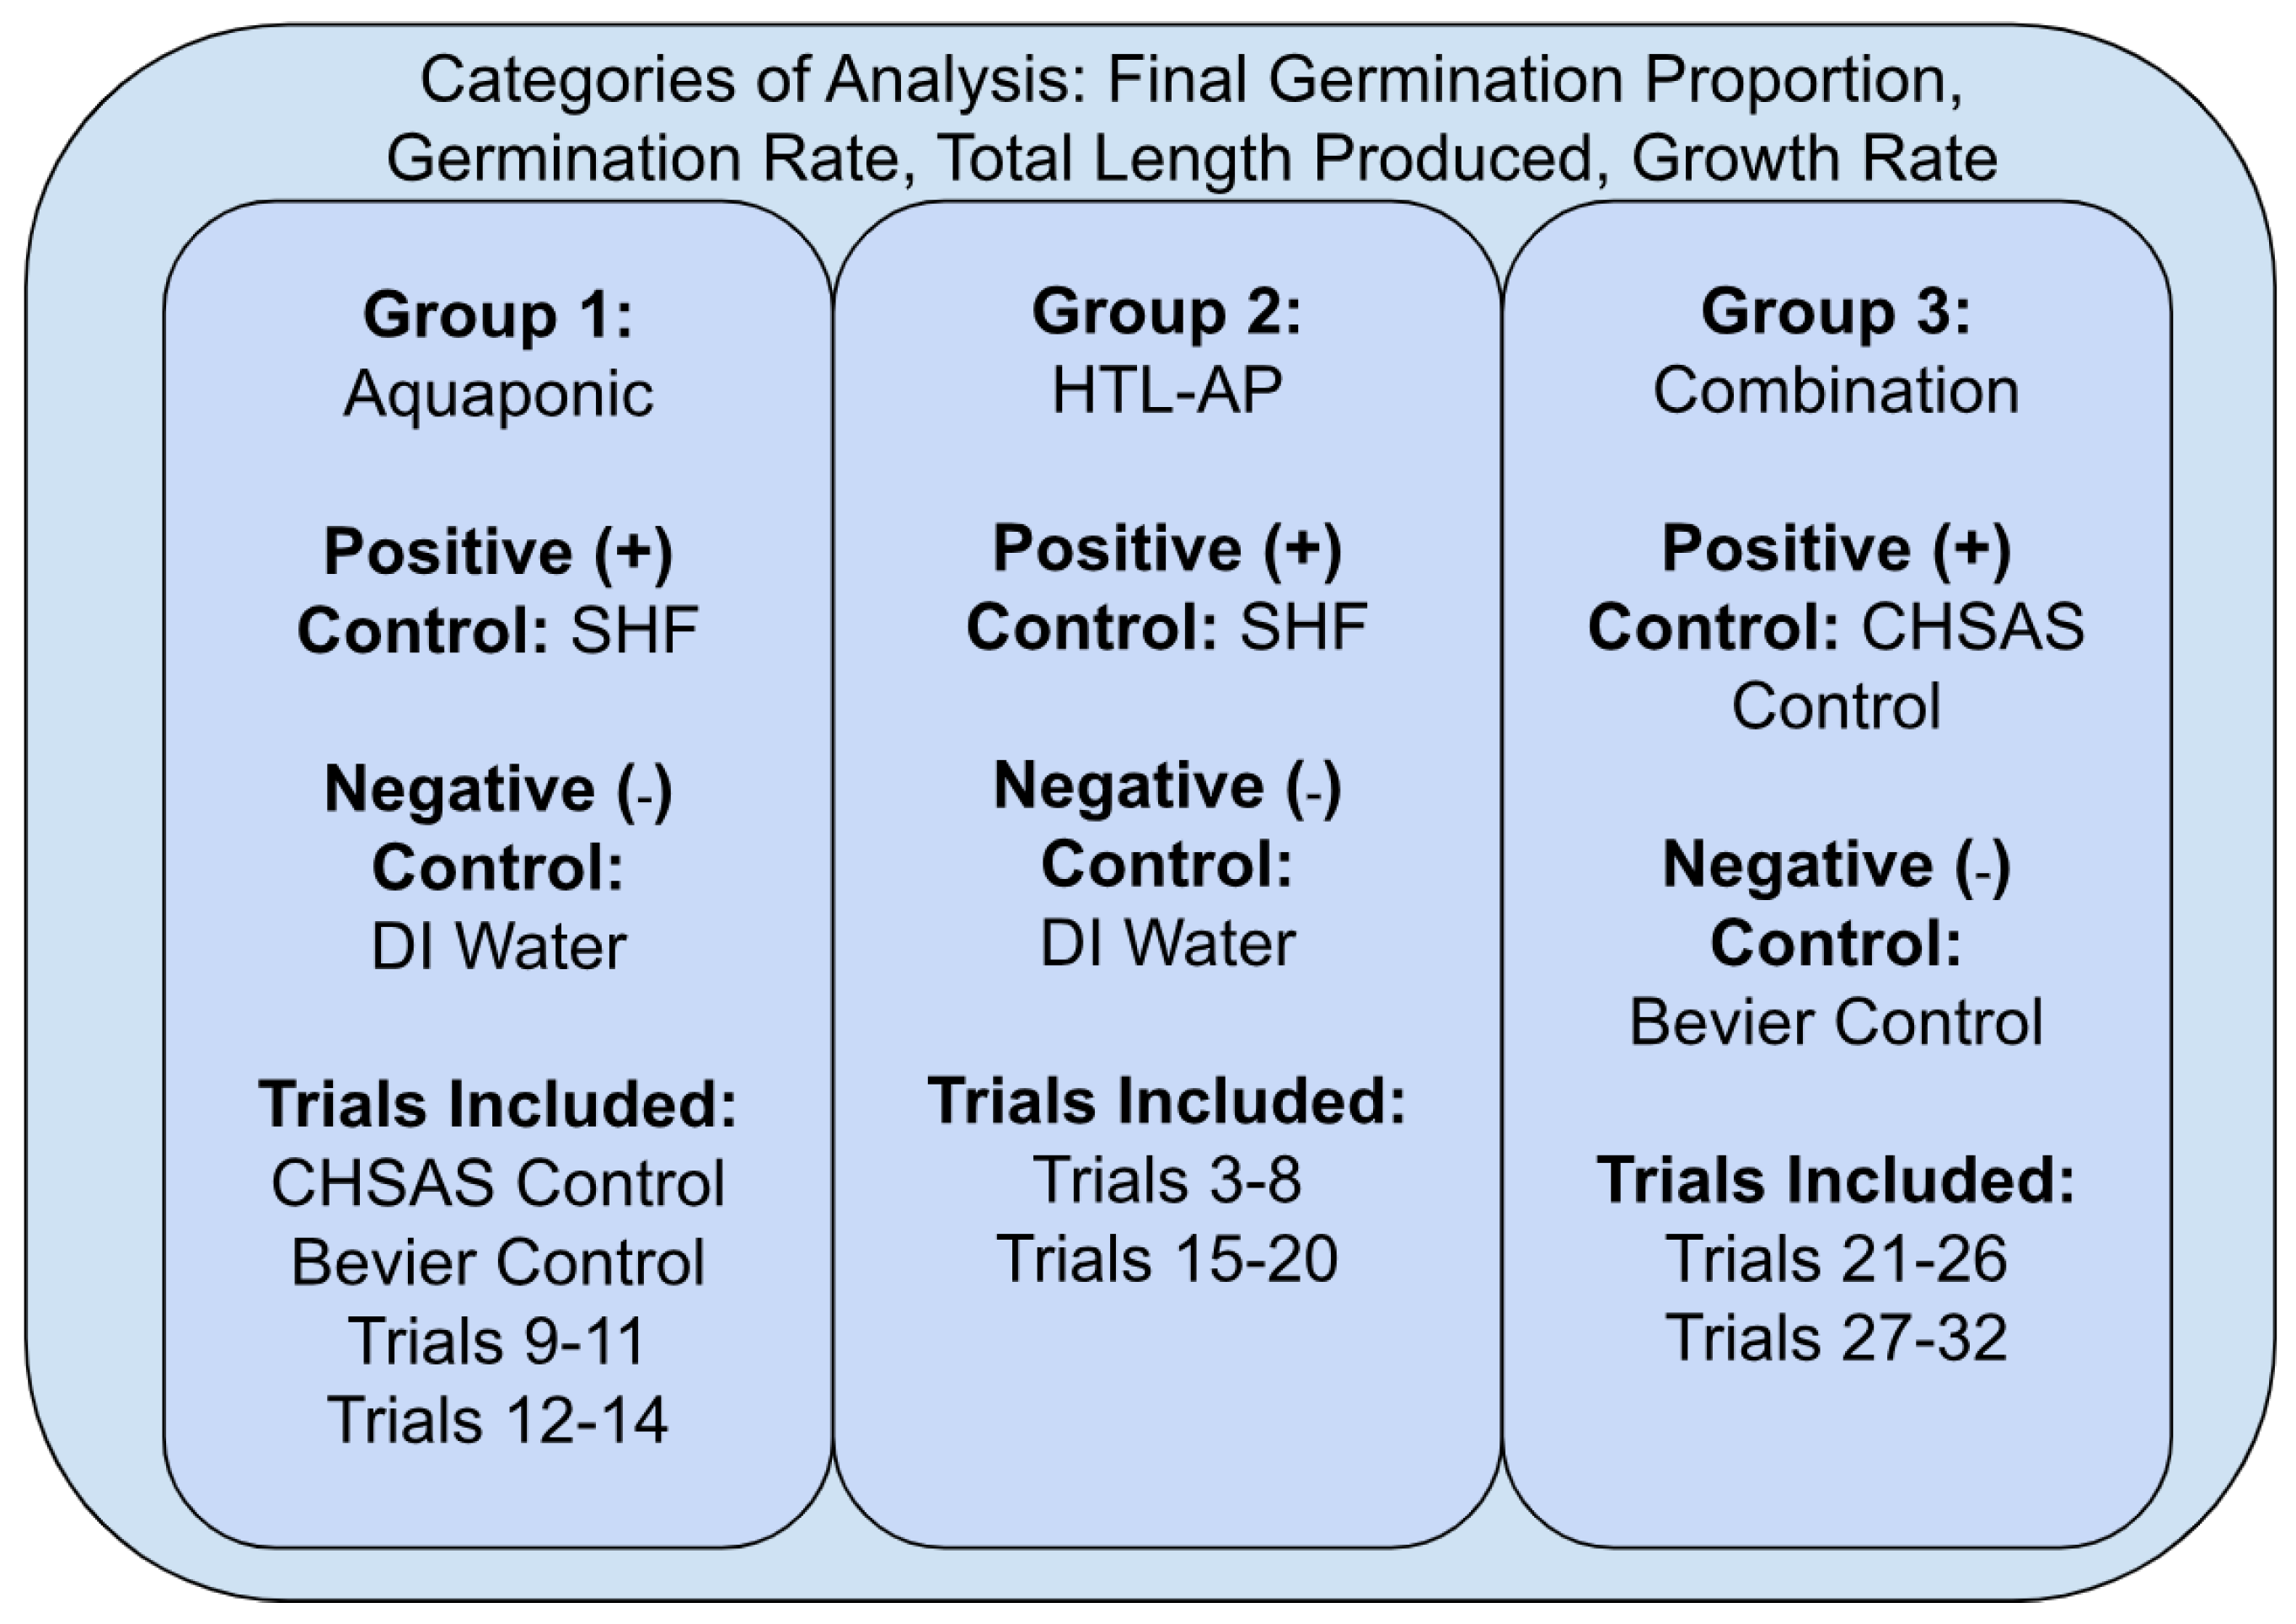
  • Assess the final germination proportion, germination rate, total length of growth, and growth rate of lettuce seeds in the presence of wastewater treatments.
  • Characterize each wastewater to provide context for the impact on seed germination and initial growth period.
  • Propose, using the results from Objectives 1 and 2, an expanded experimental design for growing lettuce to full maturity in the presence of select wastewaters.

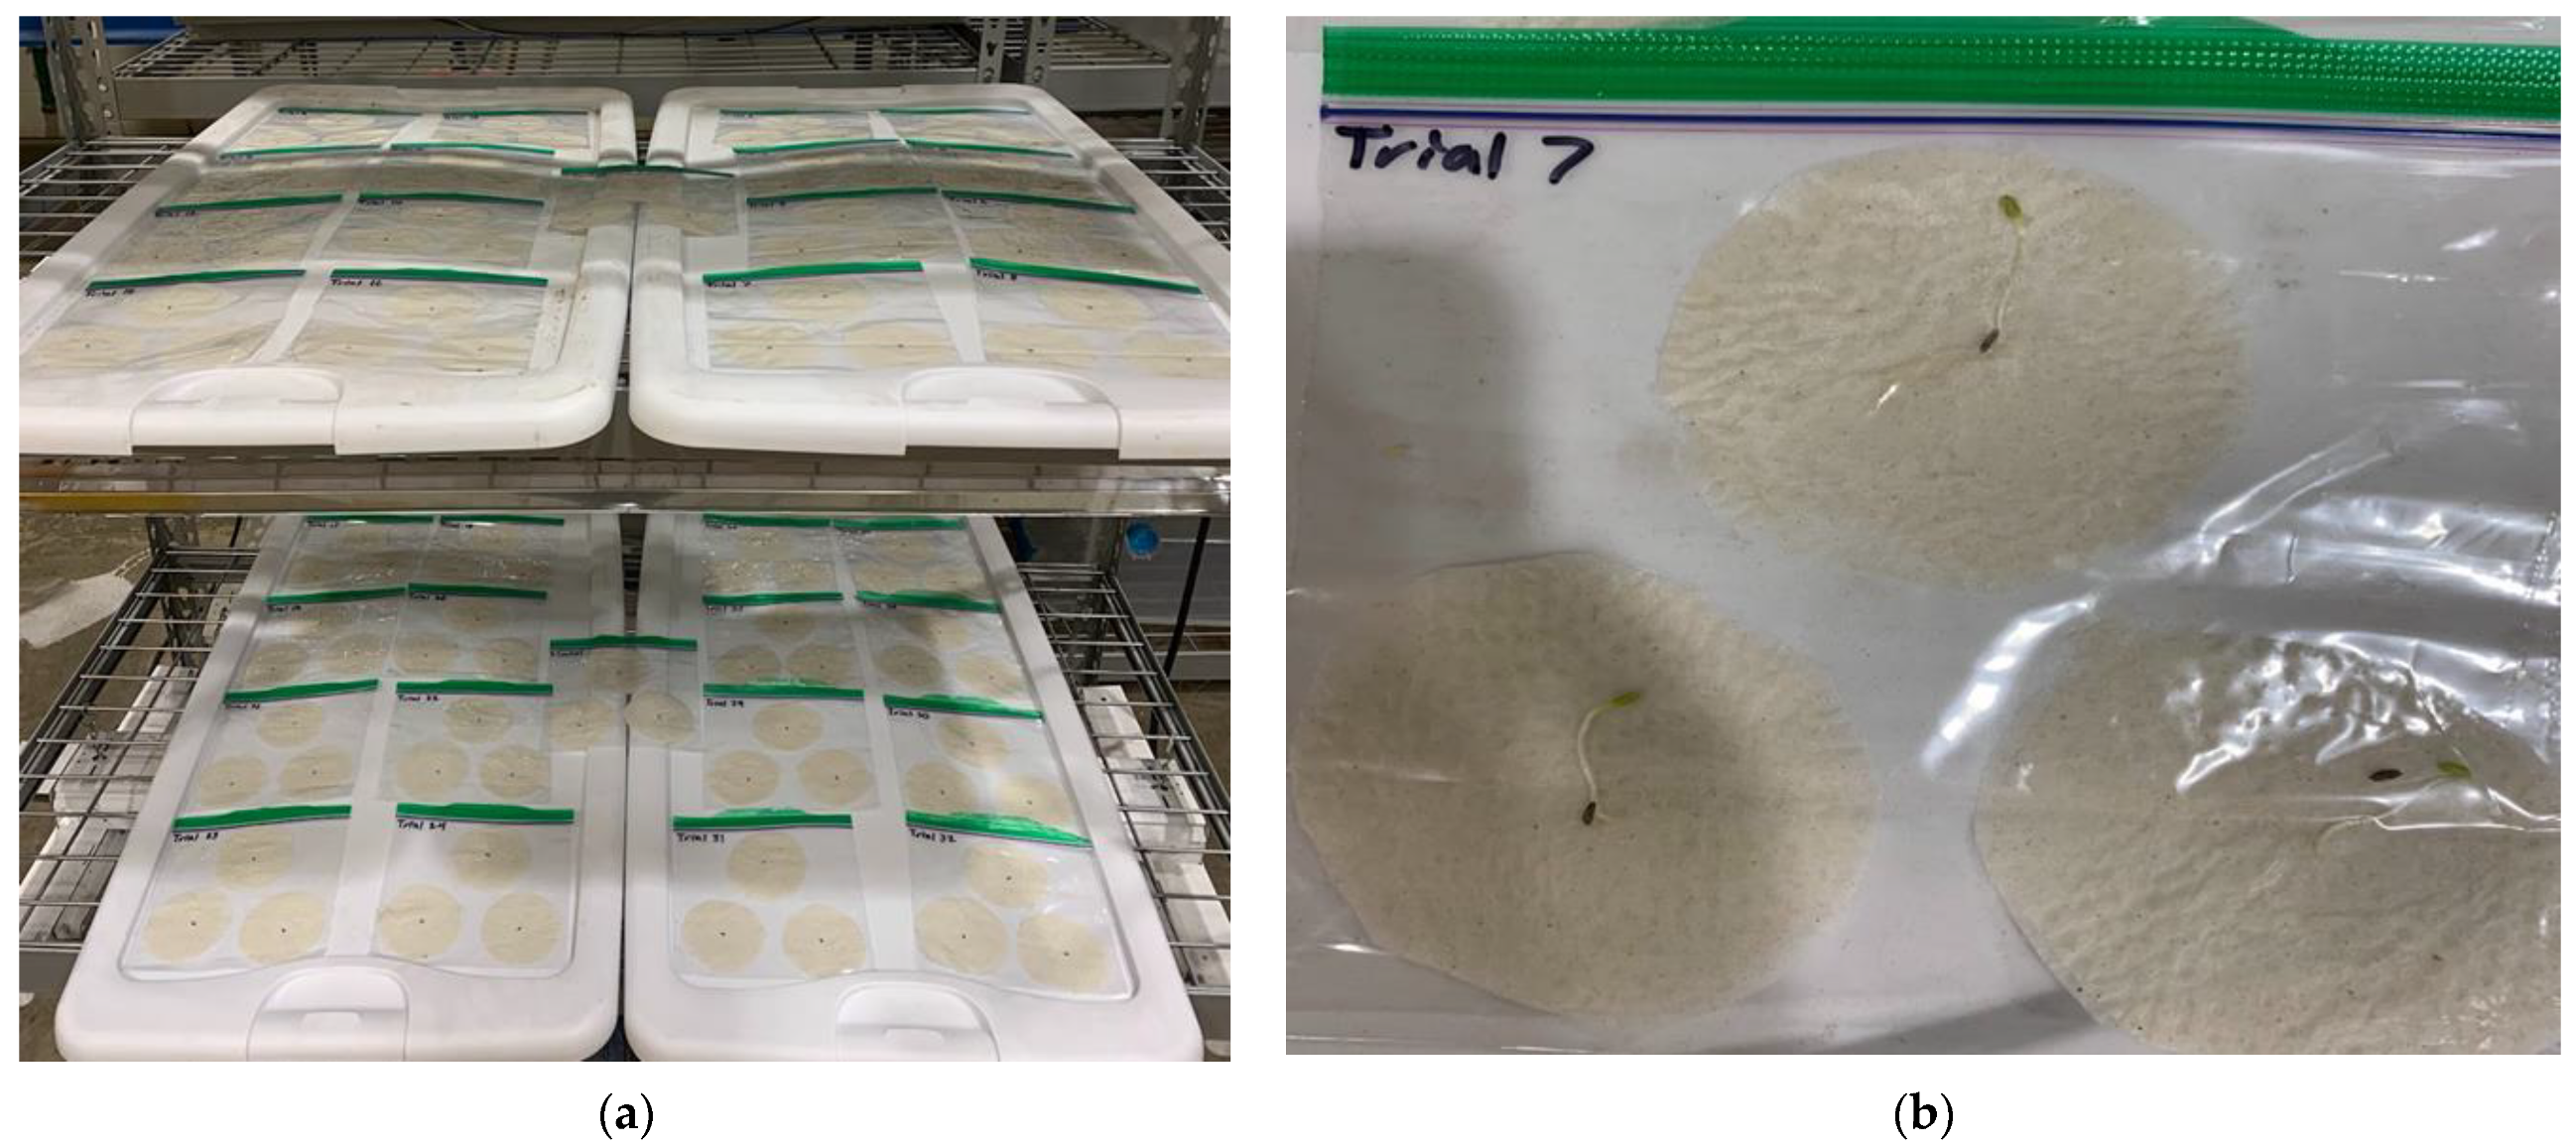
2. Materials and Methods

This study investigated three different source wastewaters (HTL-AP, aquaponic effluent from CHSAS, and aquaponic effluent from Bevier Café) and two controls (a positive control containing standard hydroponic fertilizer (SHF) and a negative control of deionized (DI) water). Although these three wastewaters are not representative of all agro-industrial wastewaters, wastewater is inherently heterogeneous based on the feedstock and operating system. The primary purpose of utilizing these three wastewaters was to investigate the impact of naturally occurring PGPMs of the aquaponic effluents on the toxic properties of HTL-AP. Table 1 below provides details of the various source waters, including how they were created or collected.
Not counting the two control trials, a total of 32 different combinations of the various wastewaters were created as pictured in Table 2. Trials 1 and 2 were the “CHSAS control” and “Bevier control” as these trials contained 100% of their respective aquaponic effluents. The remaining trials (Trials 3–32) were raw (100%) wastewater or combinations chosen to align with those found in the literature, as well as previously unexplored combinations. Specifically, the HTL-AP concentrations were higher and lower than the concentration of 2.5% used by Jesse et al. [18], to investigate the range of its known inhibitory effects on the full plant growth cycle. Furthermore, aquaponics effluent supplemented with synthetic fertilizer is common in industry [19]. Finally, perhaps the synthetic nutrients or the PGPMs in the aquaponics effluents could serve to supplement the HTL-AP (Trials 21–32) with the needed form of N or provide the microorganisms necessary to make them bioavailable to plants, respectively.
The germination conditions and experimental setup fall within the ranges and methods commonly utilized in seed germination tests for phytotoxicity [25,28,29,30,31]. The trials were observed and measured for a period of 10 days, where each trial contained a buttercrunch lettuce seed inside of a Ziploc (San Diego, CA, USA) plastic sandwich bag with a 5.1 cm diameter circle of 2-ply paper towel for each seed, in triplicate. Each paper towel circle was saturated with 1 mL of the corresponding wastewater, to ensure moisture was not limiting, before placing the seeds inside and sealing the bags. All of the labeled bags were then placed on two levels of a metal shelving rack, with an overhead cover (absence of light), inside the Hydraulics Lab of the Agricultural Engineering Sciences Building (AESB; Urbana, IL, USA), where they were maintained at 21.1 ℃ for 10 days as seen in Figure 1 below. The day the trials were prepared and placed in the lab was considered Day 0. Since this study was conducted in a shared lab space, a sign was placed by the lights to ensure they were turned off when the lab was not actively in use. To account for the remaining amount of intermittent fluorescent light coming in, the plastic bags were randomly returned to different positions after measurements were taken each day. Starting on Day 1, each trial was checked daily for the number of seeds germinated, the average root length of each trial via triplicate, and the occurrence of cotyledon emergence; this process was repeated for 10 days. Pictures were also taken of the trials each day to note observances of any rotting, mold, or un-germinated seeds, as seen in Figure 1. The radicals and stem growth often occurred in non-linear shapes, which could not be adjusted to ease measurement taking as to minimize the risk of contamination and physical damage to the seedlings. The growth was measured on the outside of the Ziploc bag from the tip of the radical to the bottom of the cotyledons with a ruler.
These source waters and their combinations were chosen to serve as a broad screening experiment to identify the trials that outperformed the positive controls (raw wastewaters without dilution or supplementation, or the standard hydroponic fertilizer) and those that underperformed the negative control (deionized water). These experimental combinations were then analyzed to identify the ideal water characteristics for future wastewater growth experiments and identify any potential inhibitory water characteristics that may hinder future experiments. Each source water was characterized to provide a baseline understanding. The characterization included measurements for ammonia nitrogen (NH3-N), nitrate nitrogen (NO3-N or NO3), and chemical oxygen demand (COD) following HACH methods 10072, 8038, 8039, and 8000, respectively. For each measurement, at least triplicates were analyzed. Nitrate nitrogen and ammonia nitrogen readings were performed using a HACH DR/2010 spectrophotometer (Loveland, CO, USA), while a HACH DR/3900 (Loveland, CO, USA) was used for the COD measurements. The pH was measured with a standard 3-point calibration using the Accumet AE150 machine by Fisher Scientific (Hampton, NH, United States). The electrical conductivity (EC) was measured using the PCTSTestr 50 m by Oakton (Vernon Hills, IL, United States). The results are presented as the average of the readings with their respective standard deviations.
The parameters in Table 3 were measured to evaluate the effects of the various wastewater combinations on the initial germination and growth of buttercrunch lettuce (L. sativa var. capitata) seeds. The final germination proportion [29] was calculated per trial by simply dividing the number of seeds that successfully germinated by the total number of seeds in each trial. The germination rate [30] is calculated as the weighted average number of seeds germinated on a given day, weighted by the number of days until germination. The total length of growth [31], from the tip of the root to the tip of the cotyledons, was measured and the growth rates were also calculated. Once all of the viable seeds—seeds that did indeed germinate at some point during the experiment—germinated for a given trial, that trial was considered “fully germinated”. For example, if a trial only had to out of the three seeds germinate, the day of the cotyledon emergence for the second seed is recorded as the day of full germination.
Statistical analyses consisted of two-tailed Student’s t-tests with unequal variance to determine significant differences in performance as regards the germination rate and the total length produced. Average performance in each category of analysis was compared relative to the control waters.

3. Results

All treatments were compared relative to the four raw source waters: the negative control of deionized (DI) water, the positive control of SHF, the CHSAS aquaponic control without dilution or supplementation, and the Bevier aquaponic control also without dilution or supplementation. The trials were compared using four primary parameters; final germination proportion, germination rate, total length produced, and growth rates. For data analysis purposes, the trials were split into three distinct groupings in every category: (1) aquaponics, which consisted of the four raw source waters and Trials 9–14; (2) HTL-AP, which consisted of the positive (SHF) and negative (DI) controls along with Trials 3–8 and 15–20; and (3) combinations, which consisted of the two aquaponic source waters (CHSAS and Bevier) as well as Trials 21–32, which is illustrated below in Figure 2.

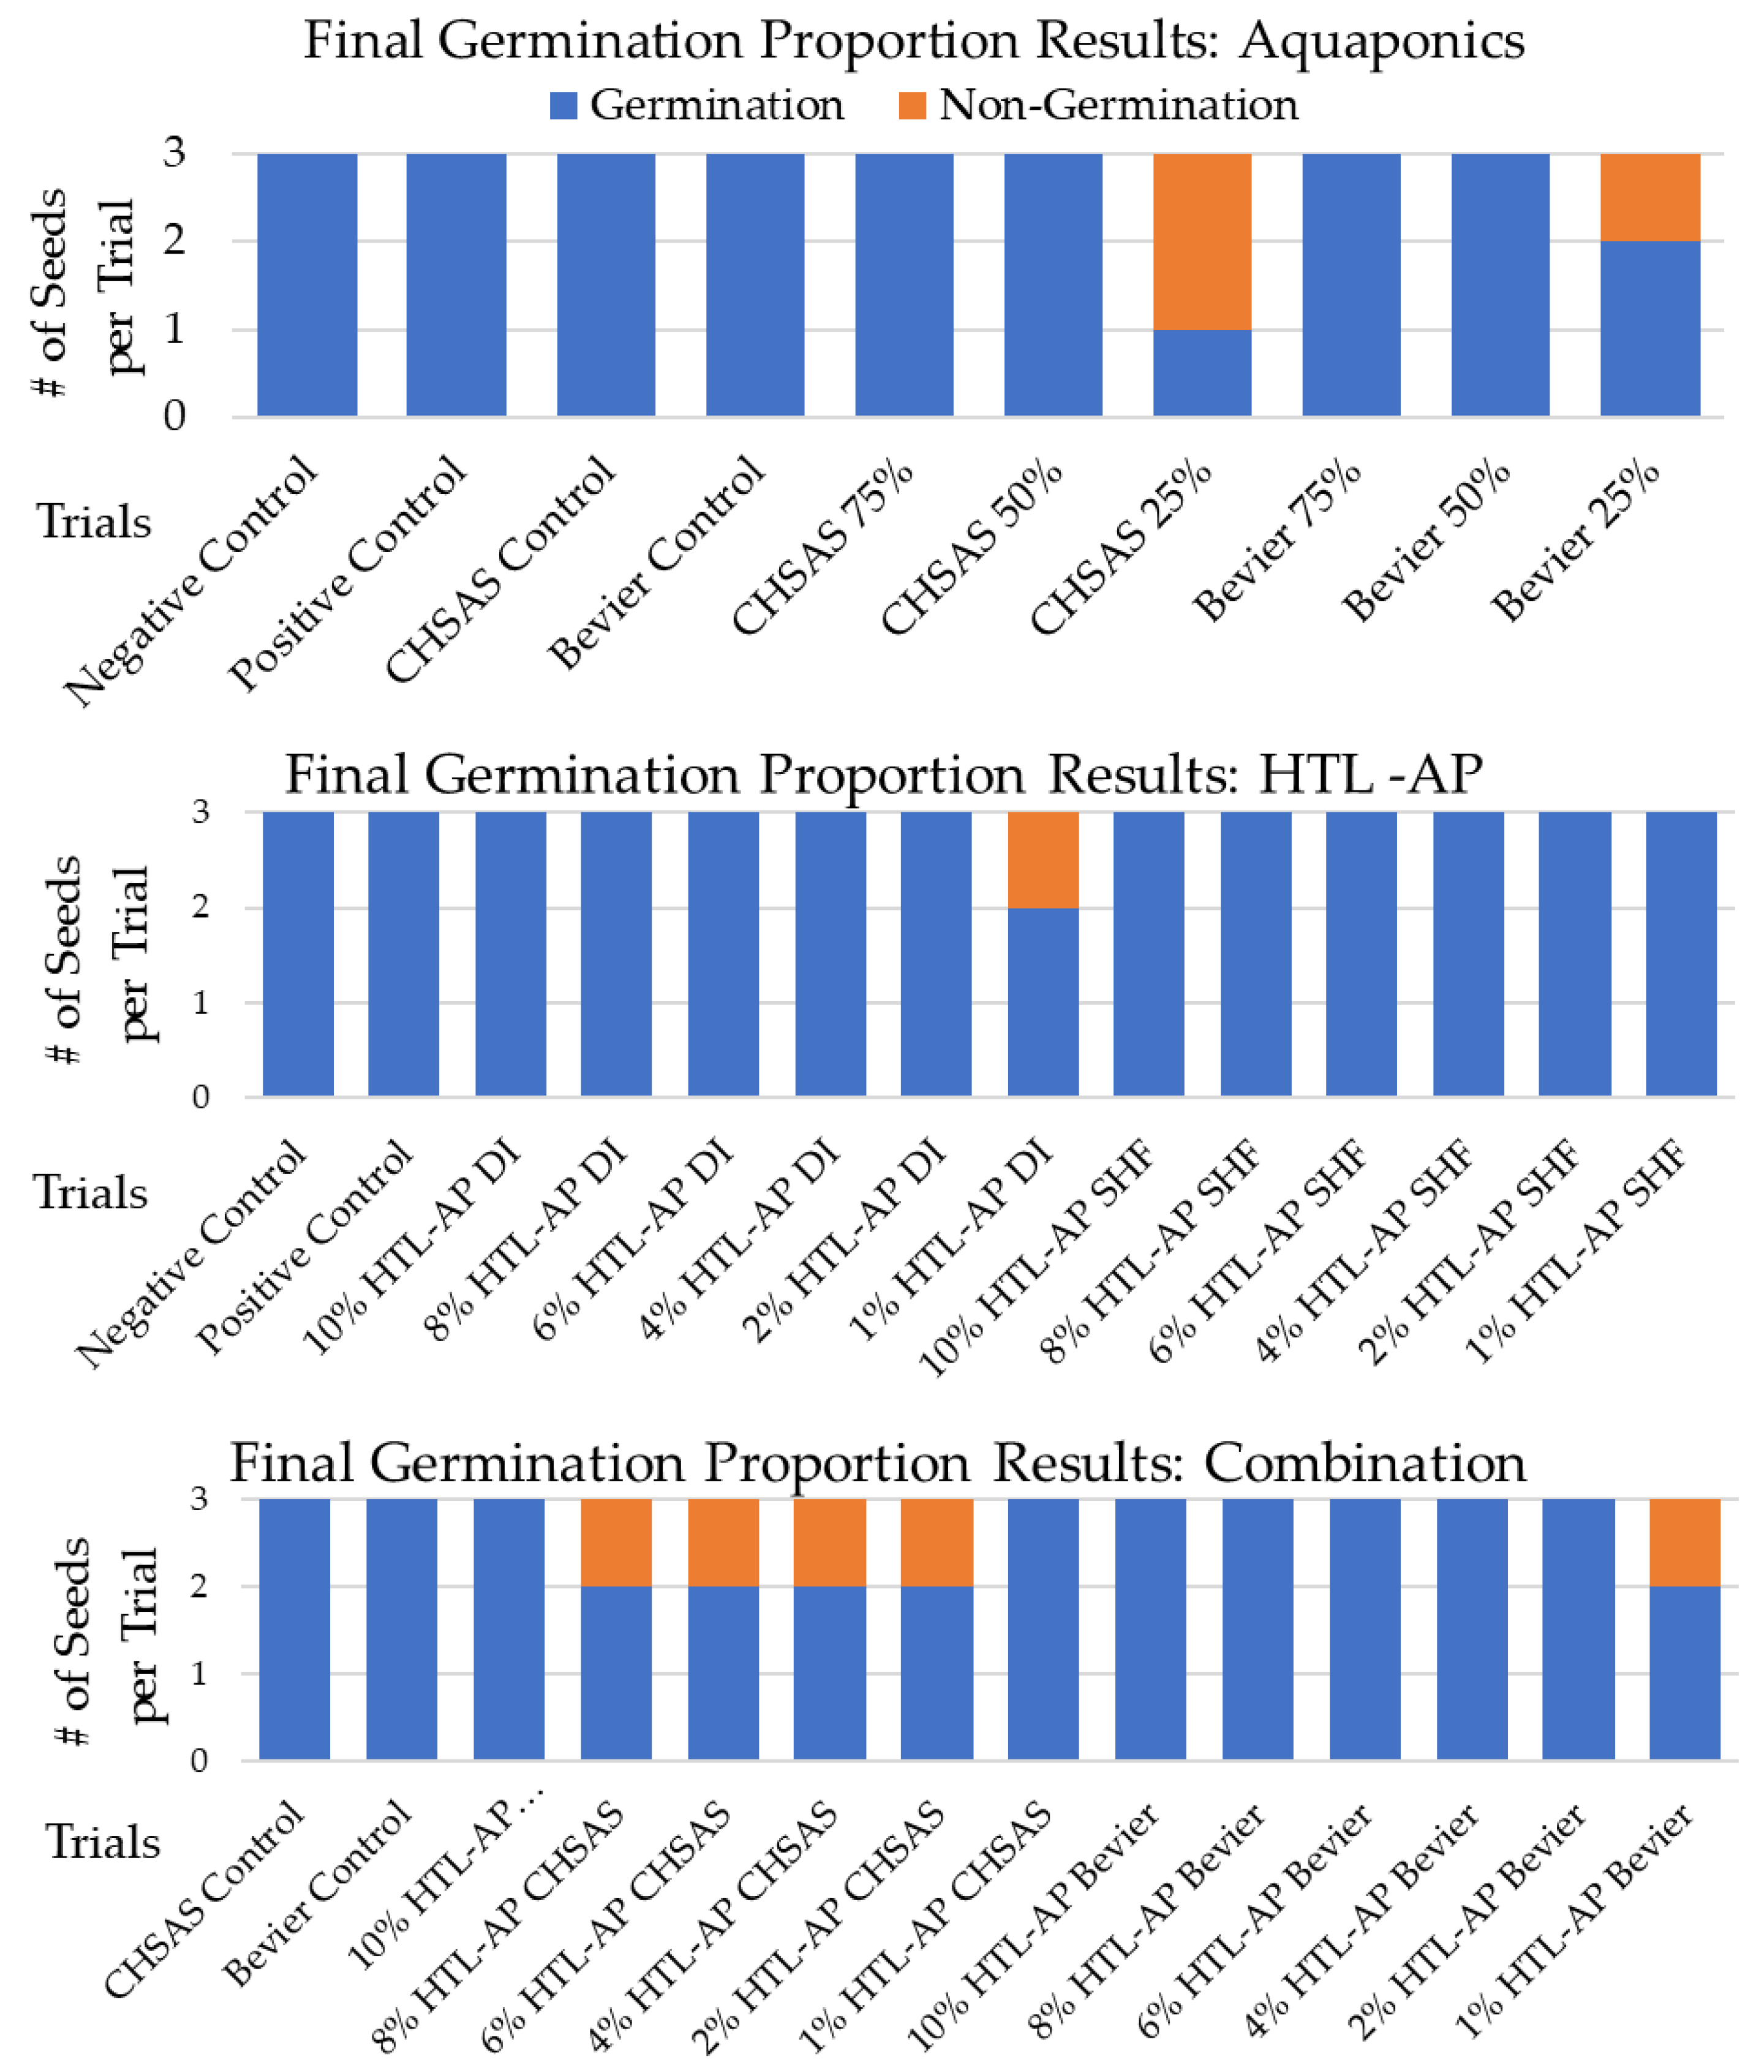
3.1. Final Germination Proportion

The goal with seed germination is to maximize the percentage of germination, because any non-germinated seeds are lost products and must be replaced. Due to differences in seed genetics and viability, it is expected that 100% germination is unlikely, however, all of the raw source waters (DI, SHF, 100% CHSAS, and 100% Bevier) achieved 100% germination. Figure 3 presents the number of seeds that successfully germinated on the y-axis and specific trial tested on the x-axis. Therefore, there were no significant inhibitory effects on germination for the source waters (Figure 3). Any decrease in germination percentage relative to these controls indicates there is likely some inhibitory compound or compounding inhibitory effects in trials that did not achieve the desired germination percentage. In the first data grouping, neither of the 25% aquaponic waters mixed with SHF matched the SHF control germination percentage. On the other hand, both the 75% and the 50% aquaponic waters mixed with SHF matched the controls at 100% germination.
When it came to the second and third groupings of data, all four trials where the raw source waters were mixed to create a 10% HTL-AP dilution matched the controls, at 100% germination. On the other side of the spectrum, only two of the four HTL-AP trials that were diluted to make a 1% concentration matched the controls at 100% germination, the SHF and CHSAS mixtures, while the 1% DI and Bevier trials did not achieve 100% germination. If the CHSAS trials that were mixed with HTL-AP to create 8%, 6%, 4%, and 2% HTL-AP solutions were discarded, then all trials where source waters were mixed with HTL-AP to create 8%, 6%, 4%, and 2% solutions would have matched the controls at 100% germination. Therefore, either these trials had a higher than normal percentage of non-viable seeds, or there is a compounding inhibitory effect of CHSAS mixed with HTL-AP; the latter reasoning is less likely than the former as the 10% and 1% HTL-AP in the CHSAS trials matched the controls at 100% germination.

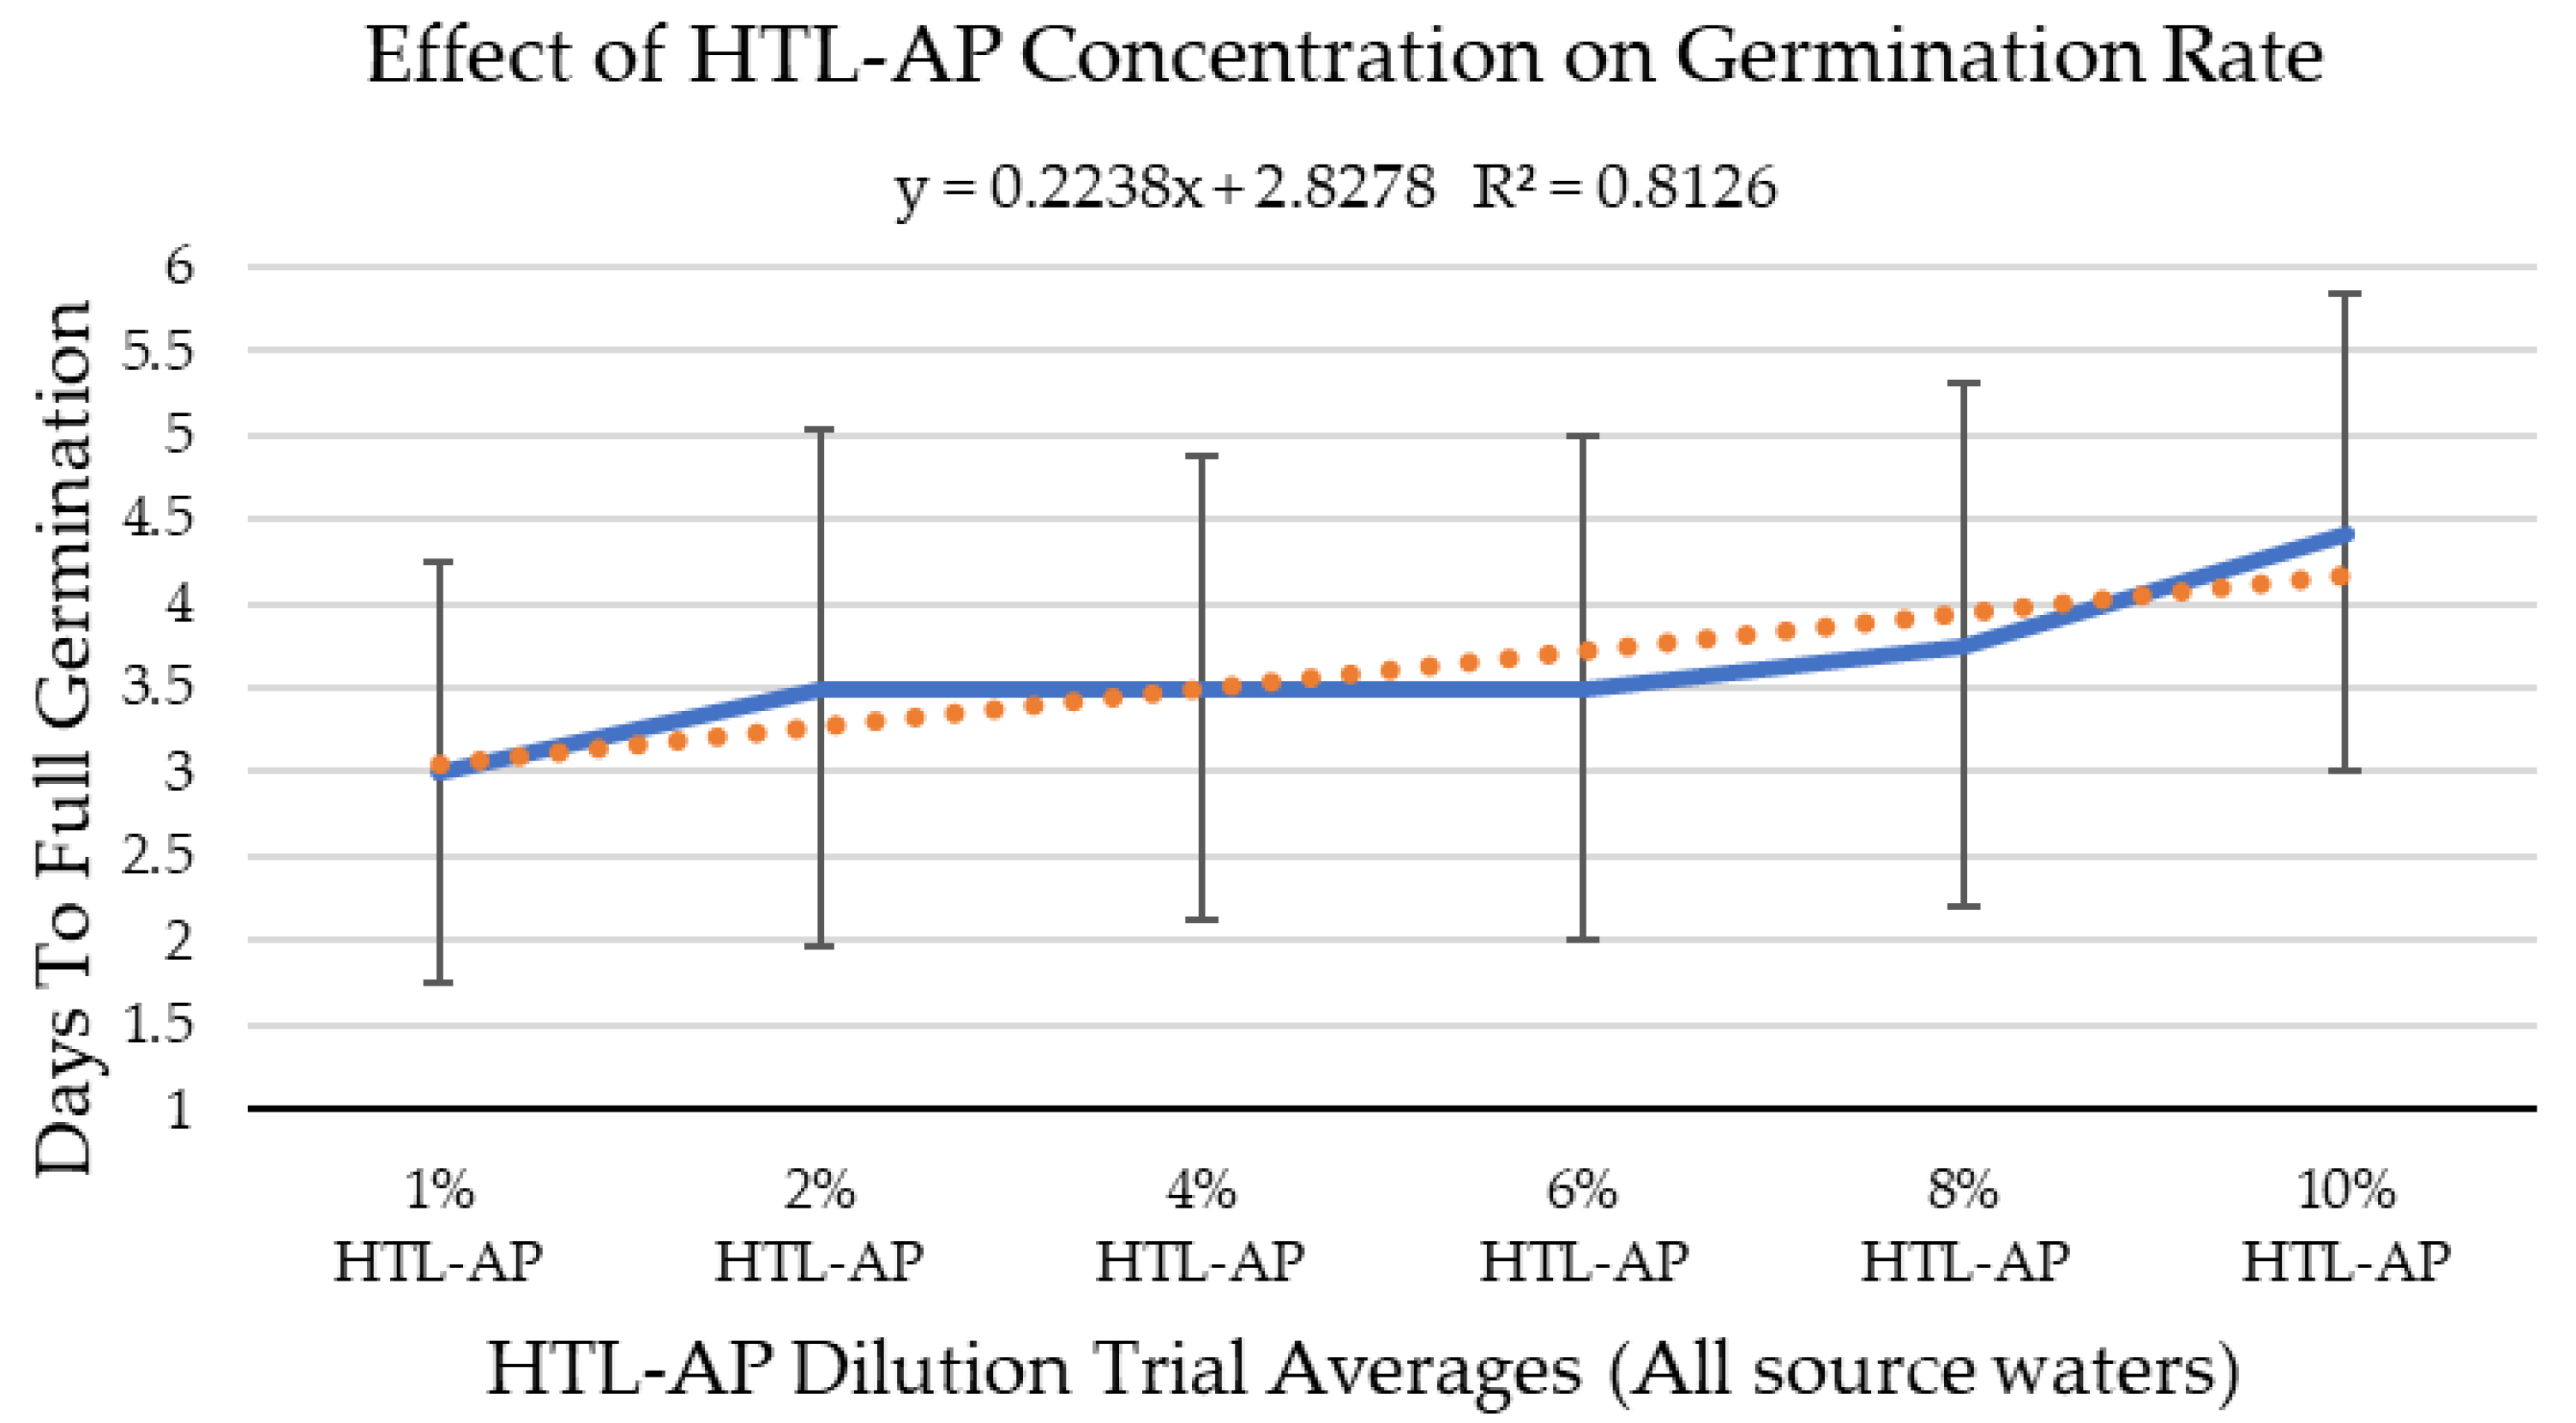
3.2. Germination Rate

To minimize the production time of hydroponic crops, it is important to have a quick turnaround time from the initial imbibing of water into the seed to the emergence of the cotyledon(s), indicating successful germination. In this study, the negative control (DI) took 3.33 days on average to achieve germination, while the positive control (SHF) took 3.67 days. The CHSAS control took 3.67 days on average to achieve germination, while the Bevier control only took 3 days. The 75% CHSAS matched the positive control time to germination, while the 50% and 25% CHSAS trials matched, or were even faster than, the negative control time until germination. The 25% Bevier mixture germinated faster than the positive control (SHF) did, but still took longer to germinate than the negative control (DI). The 75% and 50% Bevier mixtures took longer to germinate than the positive control as well as the Bevier control did.
In the second and third groupings of data regarding the HTL-AP with DI trials, the 8% through 2% solutions matched or did better than the positive control, taking 3.67 days or fewer to germinate fully. Compared to the HTL-AP with SHF trials, only the 1% dilution did better than the positive control. Regarding the combination trials, the 6%, 2%, and 1% HTL-AP solutions with CHSAS did better than the positive and negative controls, while the 8% and 4% HTL-AP solutions with Bevier only matched the positive control, at 3.67 days until full germination. Statistically, there was a significant difference between the averages across all combination groups of the 1% and 10% HTL-AP solutions. A Student’s two-tailed t-test with unequal variance reveals that, on average, the 1% HTL-AP solutions were significantly faster to germinate than the 10% HTL-AP solutions were. This same t-test was used to compare the rest of the HTL-AP dilution averages with those of all of the various source waters, but no significant difference was found. There is a strong (R2 = 0.8126) trend between increasing HTL-AP concentration and increasing time to full germination, as pictured below in Figure 4. The error bars in this figure indicate that further trials and larger data sets are needed to confirm and refine the model; however, the days to full germination can be estimated as
Days to Full Germination = 0.2238 × [HTL-AP] + 2.8278
for buttercrunch lettuce seeds utilizing a concentration of 1–10% HTL-AP in the source water.

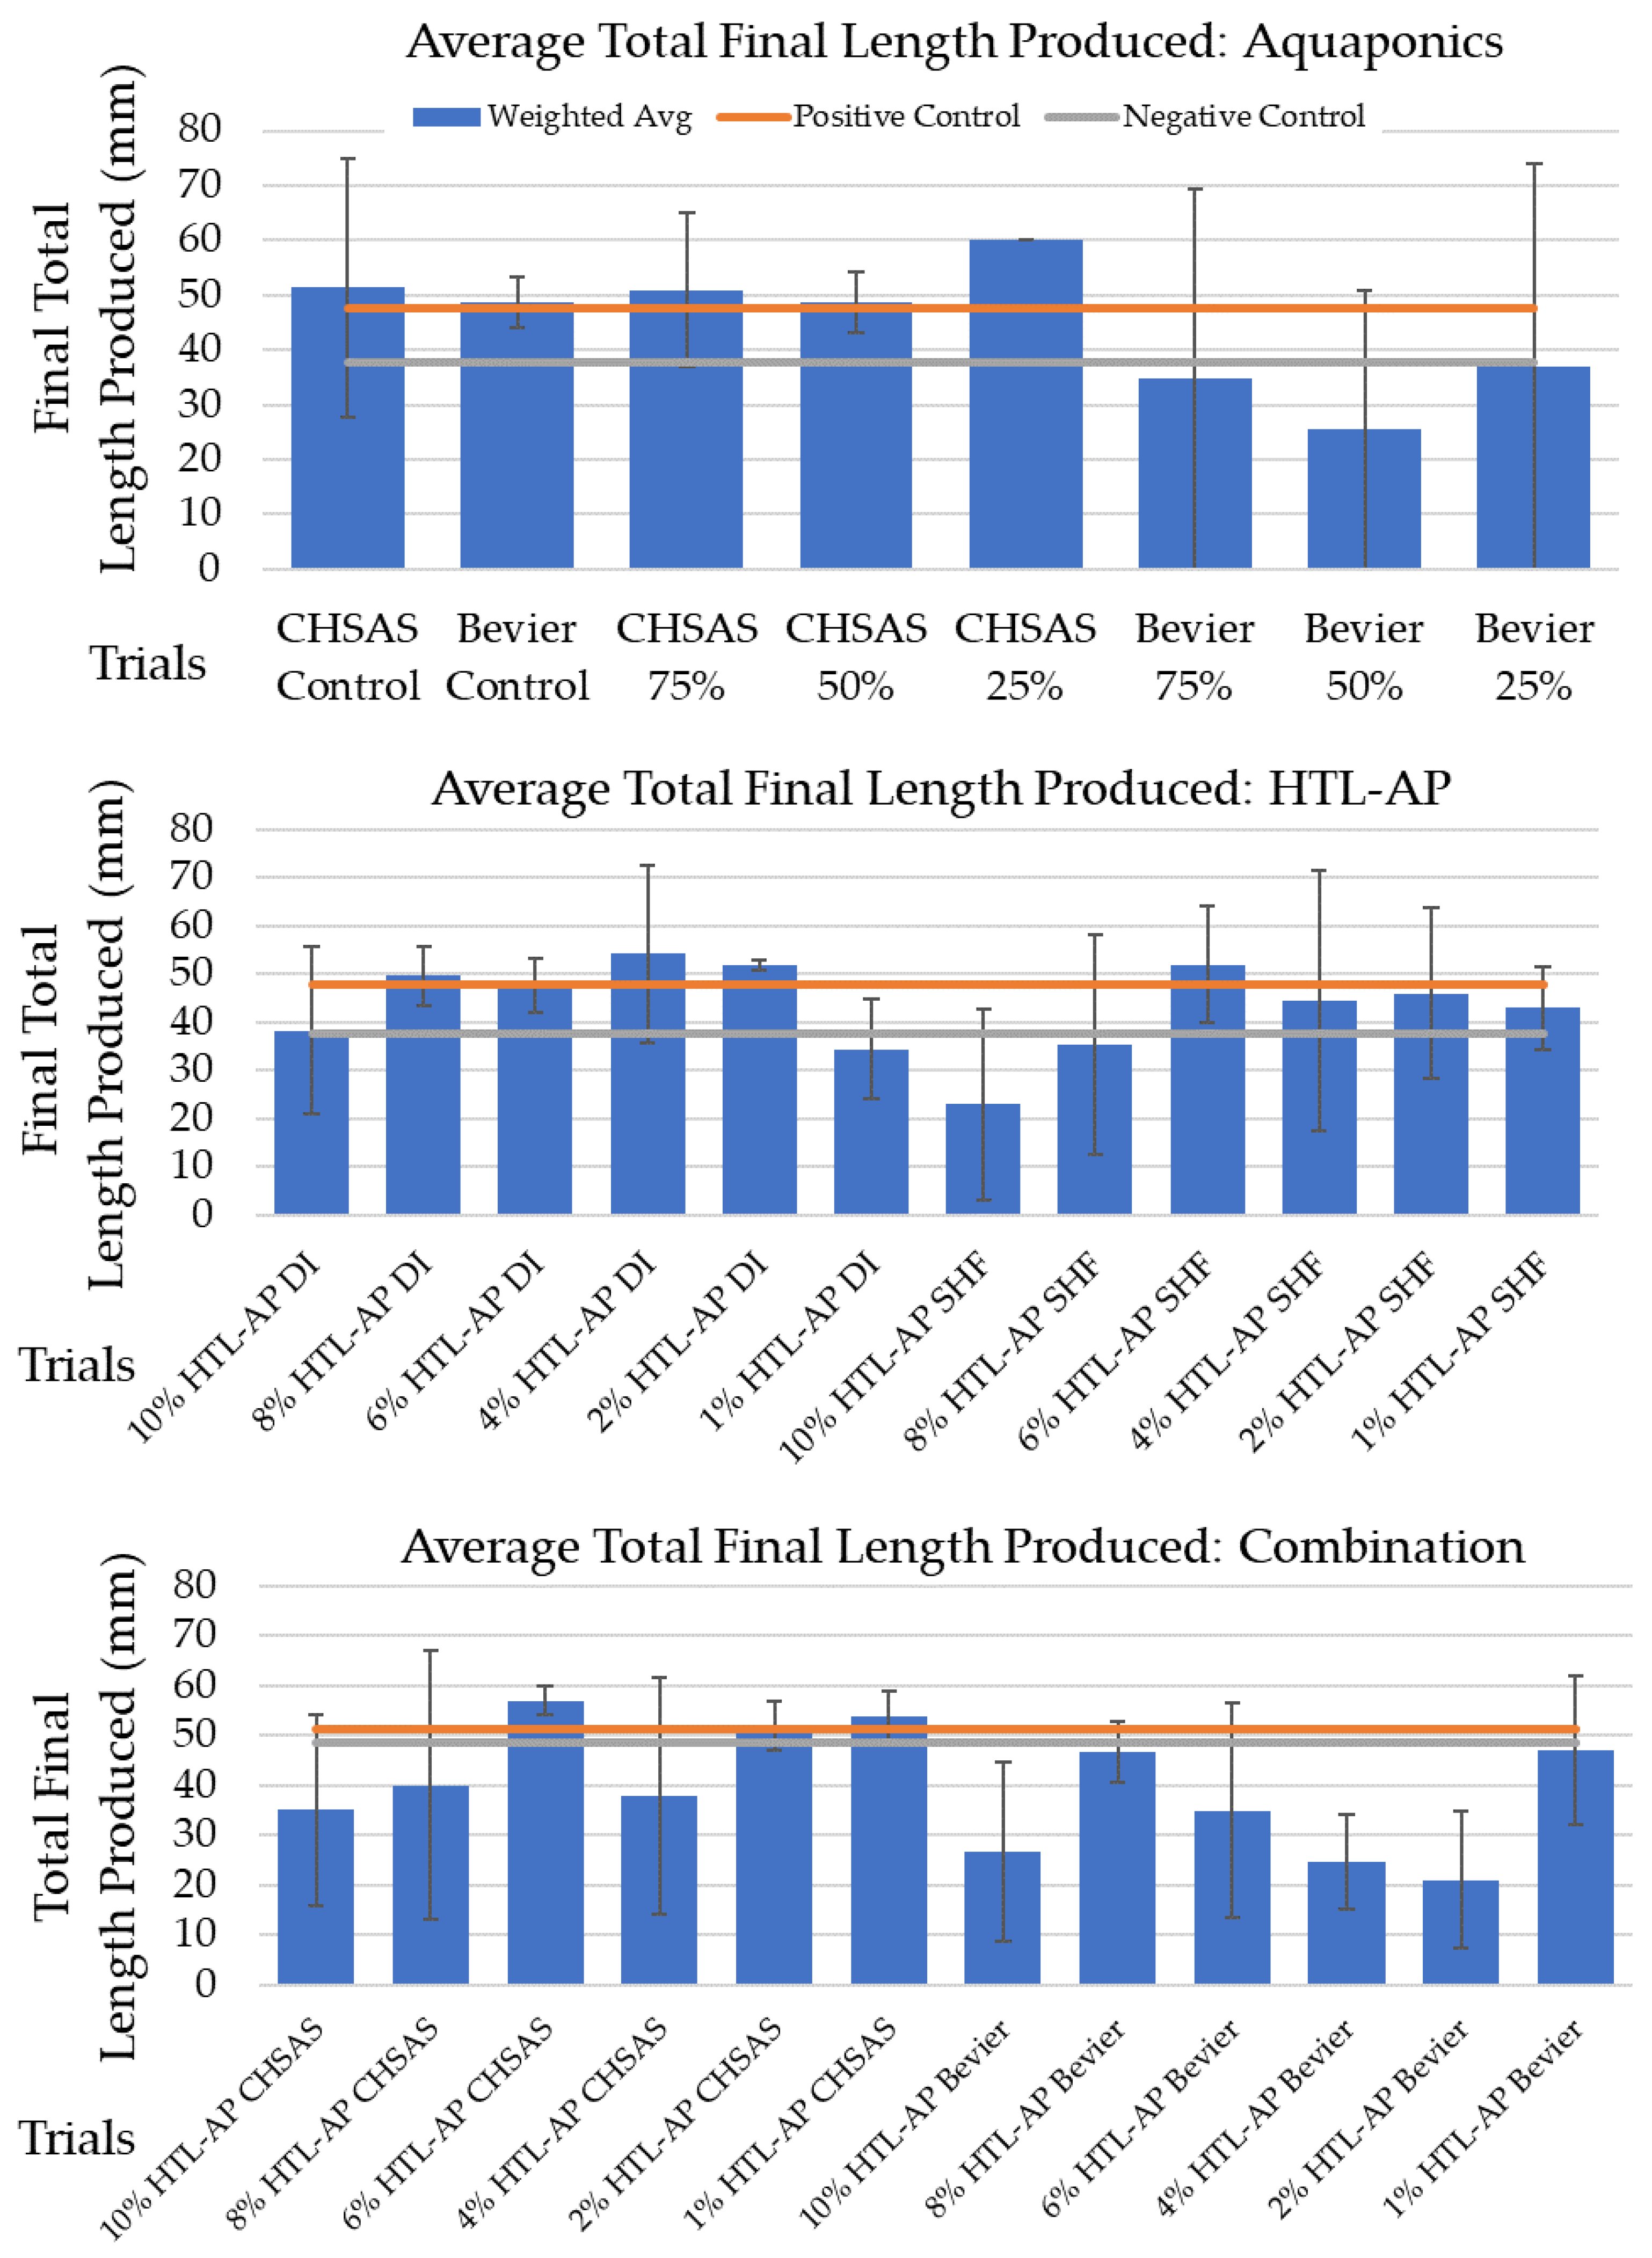
3.3. Total Length Produced
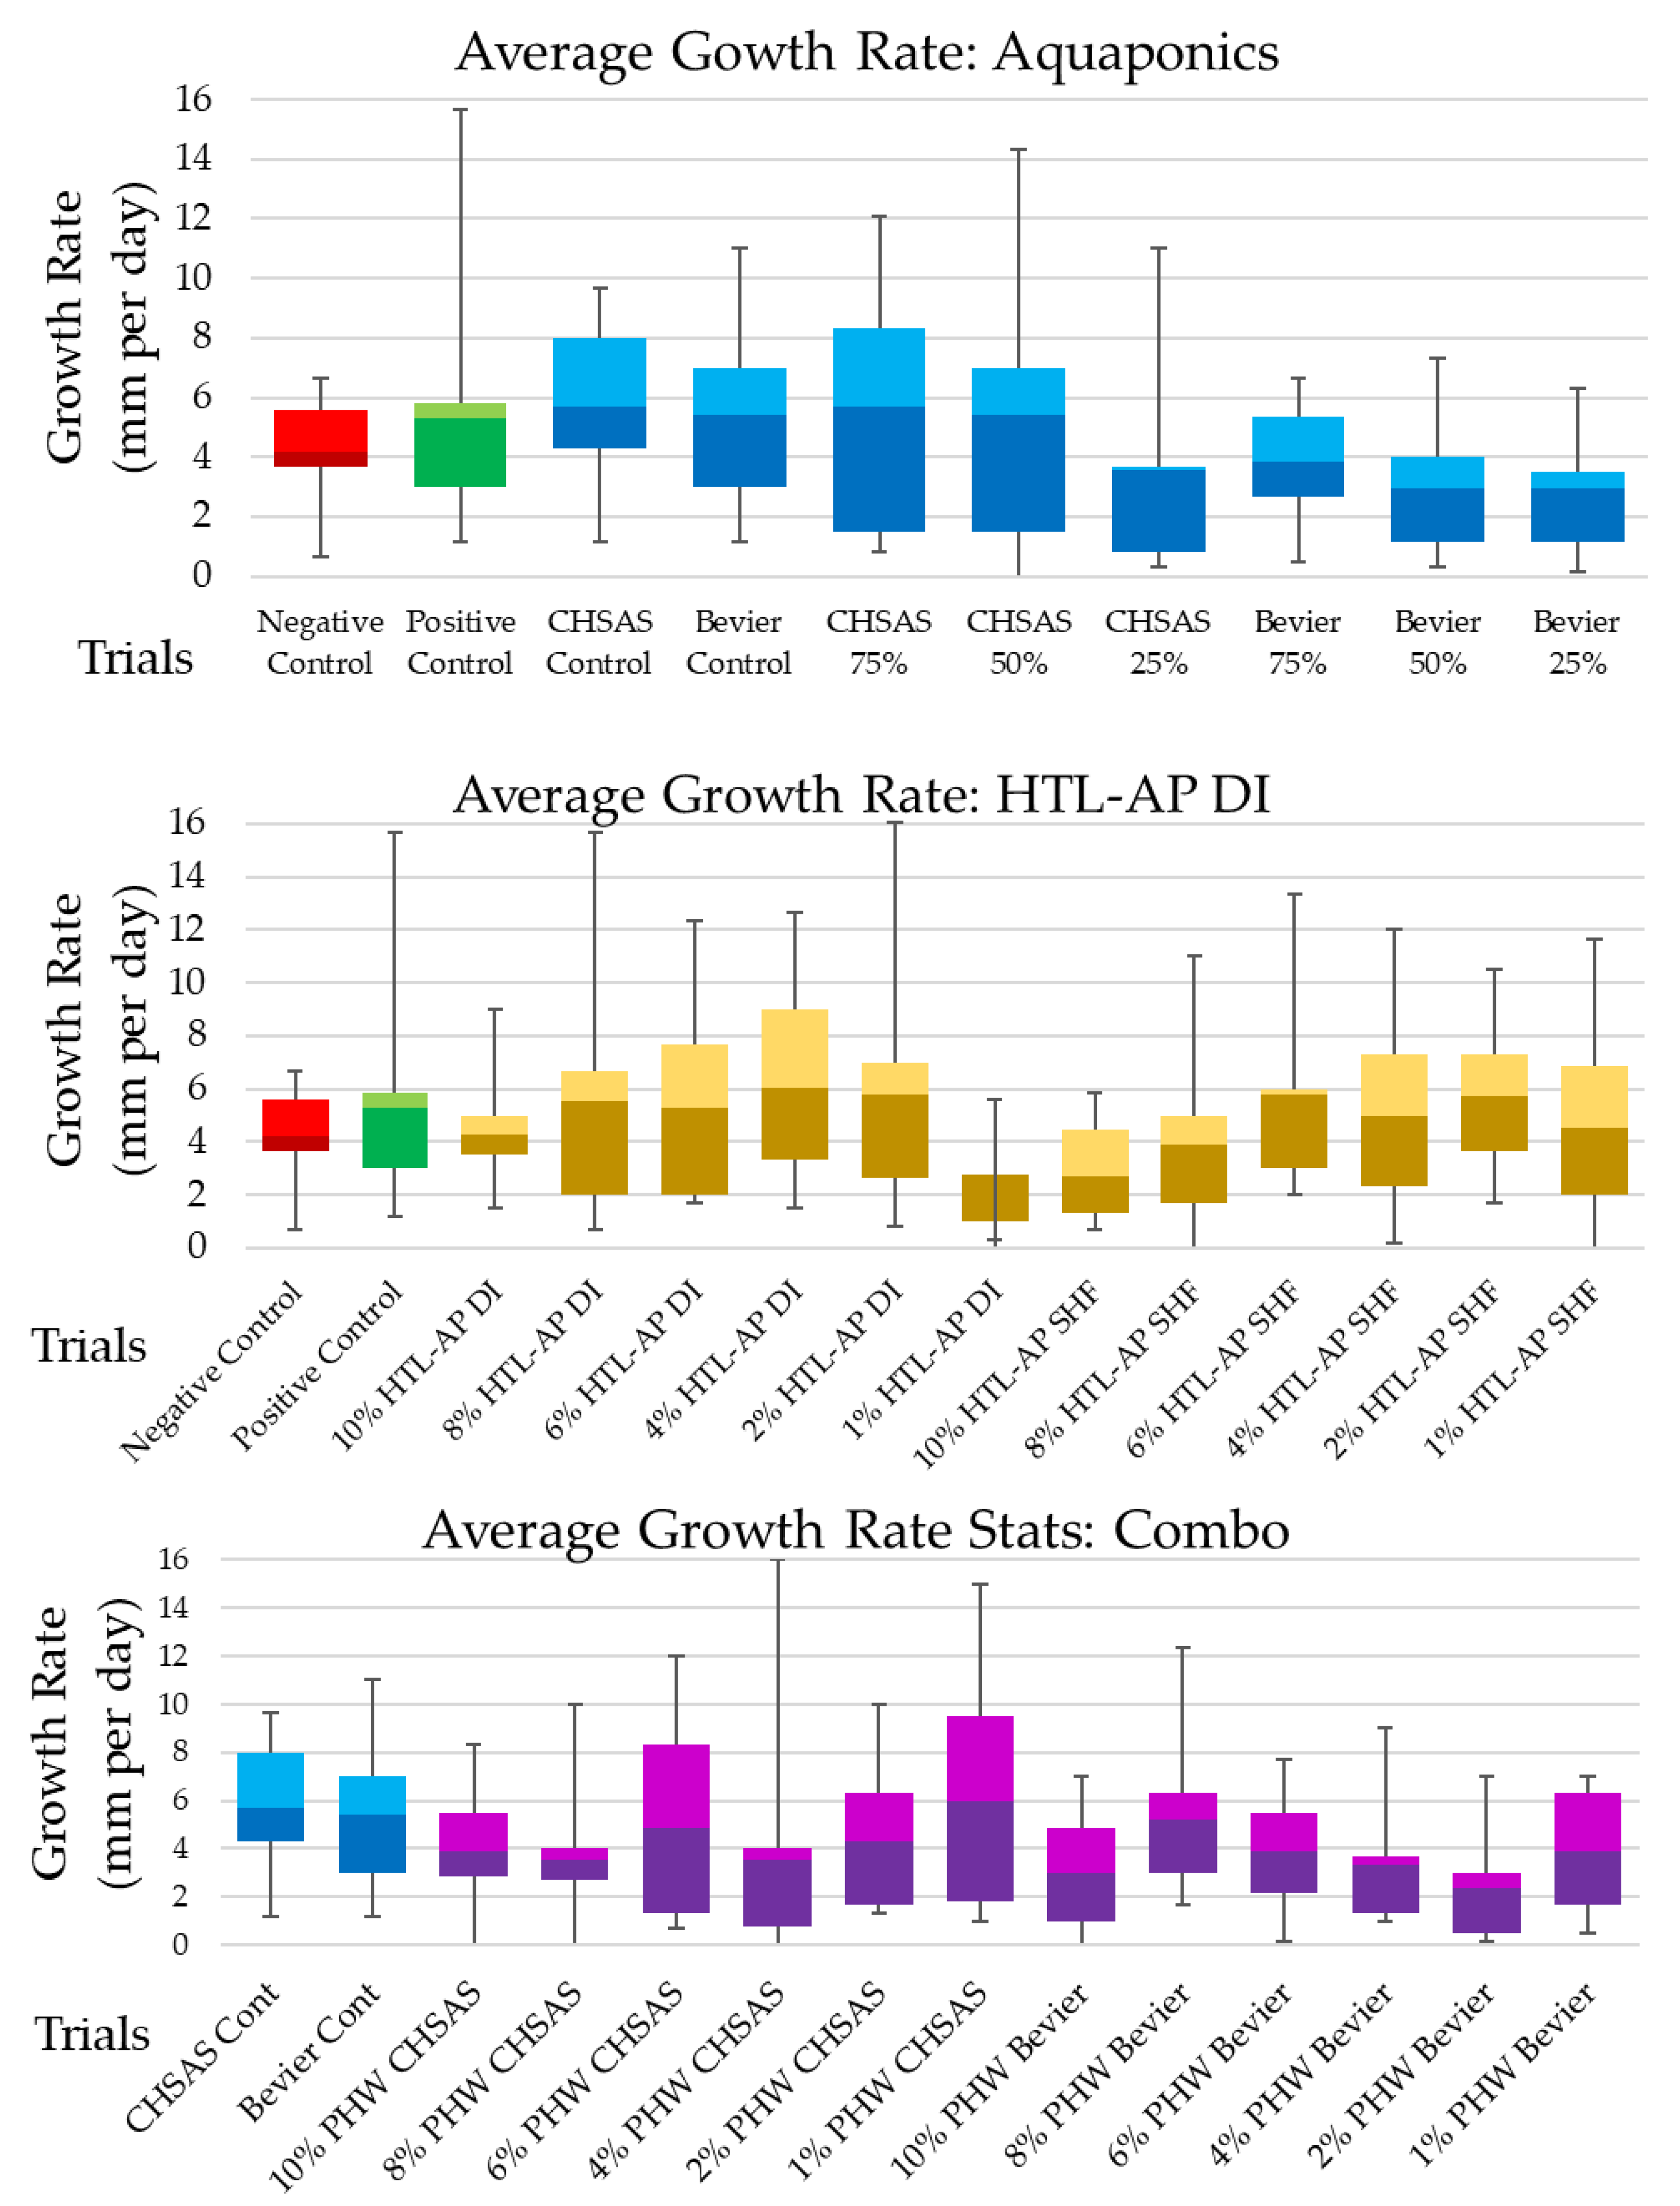
Once a seed has germinated, to get as much marketable product as possible for many crops, including leafy greens, the total length produced needs to be maximized as well. In the first grouping of data with the controls, the positive control averaged 47.67 mm of growth over the 10-day growth period while the negative control averaged 37.67 mm of growth. Both the unmodified CHSAS and the Bevier source waters (100% aquaponic effluent) surpassed the positive control by producing over 47.67 mm of total growth on average, perhaps due to the presence of PGMPs in the aquaponic source waters. All of the CHSAS trials diluted with SHF also surpassed the positive control; however, all of the Bevier trials diluted with SHF underperformed the negative control, meaning they averaged less than 37.67 mm of total growth.
Regarding the second and third groupings of data, the 8%, 6%, 4%, and 2% HTL-AP with DI trials surpassed or matched the positive control in total growth, while the 1% mixture underperformed compared to the negative control and the 10% mixture achieved a total growth in between that of the positive and negative controls. On the other hand, only the 6% HTL-AP with SHF trial surpassed the positive control, while the higher HTL-AP concentrations, 10% and 8%, underperformed compared to the positive control, and the total growth of the 4%, 2%, and 1% fell between that of the positive and negative controls. The 6%, 4%, and 2% solutions with both DI and SHF are viable combinations for performing similarly to the controls regarding the total length of growth. Regarding the HTL-AP and aquaponics combinations, only the 6%, 2%, and 1% HTL-AP with CHSAS trials outperformed the positive control, while all other HTL-AP with CHSAS trials, as well as all HTL-AP with Bevier trials, underperformed relative to the negative control. Interestingly, when comparing the total length of growth for the Bevier control to the Bevier mixed with SHF trials, the unmodified Bevier water did significantly better in total growth as verified by a Student’s two-tailed t-test with unequal variance. Along these lines, there is also a significant difference between the CHSAS trials supplemented with SHF, and the Bevier trials supplemented with SHF; the CHSAS trials were statistically better verified by the same t-test. Additionally, the HTL-AP trials diluted with DI water also did statistically better than the HTL-AP trials diluted with Bevier aquaponic water. The Total Length Produced Results are summarized below in Figure 5.

3.4. Growth Rates

To produce a viable crop product quickly, the initial growth rates of seedlings are important to ensure initial transplanting is a success. The positive control had an average growth rate of 5.3 mm/day, while the negative control had an average growth rate of 4.19 mm/day. Both aquaponic controls had a higher average growth rate than the positive control, with CHSAS coming in at 5.7 mm/day and Bevier coming in at 5.41 mm/day. In the first grouping of data, the 75% and 50% CHSAS mixed with SHF trials also outperformed the positive control in terms of growth rates. However, the 25% CHSAS with SHF trial, as well as all of the Bevier mixtures with SHF, underperformed relative to the negative control in terms of growth rates.
Regarding the second grouping of trials, the 8–2% HTL-AP with DI mixtures surpassed the average growth rate of the positive control, while only the 6% and 2% HTL-AP with SHF mixtures surpassed the average growth rate of the positive control. The 10% HTL-AP with DI along with the 4% and 1% HTL-AP with SHF mixtures had average growth rates that were in between the positive and negative control growth rates. Below in Figure 6, a roughly bell-shaped curve skews towards the center-right for both the HTL-AP mixed with DI trials, as well as the HTL-AP mixed with SHF trials, although the bell shape flattens out on the right side for the latter. Regarding the last grouping of data, there was not much of a discernable trend in the data, as only the 1% HTL-AP mixed with CHSAS outperformed both of the aquaponic controls. The rest of the HTL-AP trials mixed with CHSAS and Bevier had lower average growth rates than either of the aquaponic controls, although it should be noted that the 6% and 2% HTL-AP mixed with CHSAS trials, as well as the 8% HTL-AP with Bevier trials, had average growth rates in between those of the positive and negative controls but not those of the two aquaponic controls.

4. Discussion

This study provides foundational data on the impact of HTL-AP and aquaponics wastewaters on lettuce seed germination. It should be noted that in future studies, it is recommended to have a larger sample size. Perhaps triplicates of the Ziploc plastic bags can be used, which would provide a total of nine seeds per trial. This should be done for each combination of effluents, as the maximum of three data points in this study, assuming successful germination, can only indicate trends to a certain extent of statistical significance. Further, with this small sample size, it is difficult to determine if the inhibitory effects are due to low seed viability or source water toxicity. Table 4 highlights the key findings in each of the categories of analysis for source waters relative to the four controls.

4.1. Final Germination Proportion

In the first data grouping, the underperformance of the lower percentages of aquaponic waters is possibly due to a lack of nutrients, as not enough aquaponic nutrients were available for plant uptake. However, when these trials were combined with the positive control, SHF—which has a higher nutrient content, as seen in Table 2—there should have been sufficient nutrients necessary. Additionally, because the larger percentages of the aquaponic waters outperformed the positive control—potentially due to the benefits of PGPMs, illustrated by the work of Bartelme et al. [19] and Goddek et al. [22]—it is possible that, for germination percentage purposes, SHF use in hydroponic systems could be cut by up to 75% and supplemented with various aquaponic waters with no decrease in germination percentage.
For the second and third groupings of data; because all four solutions of 10% HTL-AP matched the controls with a perfect germination percentage, any inhibitory effect from HTL-AP does not inhibit germination when it is used to supplement various hydroponic nutrient sources by up to 10%. This indicates that the specific inhibitory properties of HTL-AP, demonstrated by the work of Jesse and Davidson [14], and Jesse et al. [18], do not affect the success of germination but some other component of plant growth and performance. The variation in performance among the solutions of 1% HTL-AP may be due to a nitrogen deficiency, specifically nitrate and to a lesser extent ammonia, as there are fewer of these nutrients in the DI and Bevier source waters compared to the SHF and CHSAS source waters. If the outlying trials are discarded, then all trials where source waters were mixed with HTL-AP to create 8%, 6%, 4%, and 2% solutions would have matched the controls at 100% germination. These outlying trials with CHSAS as the source water could indicate that CHSAS has an inhibitory effect on final germination proportion; however, the earlier analysis of the first grouping of data illustrates that CHSAS alone, or supplemented with SHF, does not affect the final germination proportion. Therefore, it is recommended that HTL-AP can be used to supplement DI water, SHF, and various aquaponic waters at concentrations up to 10% with no negative effects on final germination proportion. However, 1% HTL-AP solutions could be nutrient deficient depending on the nutrient content of the source water.

4.2. Germination Rate

The results of the four controls indicate that a higher nitrogen concentration delays the time it takes to achieve full germination, which is confirmed in the literature by Zhang et al. [32]. However, the source waters with a higher initial nitrogen concentration that was then supplemented with the nitrogen in SHF decreased the time it took for full germination in the CHSAS trials, contradicting the work of Zhang et al. [32]. This initial concentration of nitrogen is still relevant as seen through the Bevier trials, in which a higher percentage of the Bevier effluent increased the time it took to fully germinate, likely due to the lower nutrient concentrations in the Bevier source water, although this claim is contrary to the control trials’ time to germination, which indicates that a lower nutrient concentration decreases the time to germination; this further establishes how aquaponic effluents greatly differ from each other based on system design and operating conditions, agreeing with previous findings in the literature [19,22,23]. In the second and third groupings of data, the results align with the previous findings from Zhang et al. [32] along with the first grouping of data in this study, which indicate that a higher nitrogen concentration increases the time to germination. Future works should investigate if any particular form of inorganic nitrogen delays germination, or if it is only organic forms of nitrogen that cause a delay.

4.3. Total Length Produced

The results indicate that all 10% HTL-AP solutions performed worse than lower solutions with the same controls, indicating some degree of inhibitory effects were felt when it came to the total length of growth. When combined with SHF, the 8% HTL-AP mixture may have been too high in nitrogen content, a thesis supported by the work of Zhang et al. [32]; whereas, when diluted with DI water, the 8% HTL-AP surpassed the positive control, indicating that it is a viable trial for the total length of growth. On the other hand, when not supplemented with outside nutrients, the 1% HTL-AP with DI mixture likely did not have enough nutrients to maximize the total length produced; whereas, when supplemented with SHF, it performed adequately. The 6%, 4%, and 2% HTL-AP solutions with both DI and SHF are potentially viable combinations to test on full-scale crop growth. Overall, the Bevier results indicate that this solution was not ideal for the total length of growth outside of its control, likely due to its low nutrient content. The CHSAS aquaponic water also performed quite well by itself, but when supplemented with SHF, and with lower concentrations of HTL-AP, it performed even better. This indicates that mixed wastewaters may be a viable nutrient source depending on their initial composition, which aligns with the hypothesis stated in Section 4.2 [24,25]. A key takeaway from the total length of growth analysis is that, when diluted with only DI water, HTL-AP can serve as a viable nutrient source for maximizing the total length of growth in hydroponic lettuce production when diluted anywhere from 8% to 2% HTL-AP, which is much higher than the previous literature suggests [14,18]. This would prove to be a simple and cost-effective treatment process for HTL-AP if these results are confirmed with full-scale crop growth.

4.4. Growth Rates

The results indicate that the increased growth rates of the CHSAS trials may be due to the presence of PGPMs, which are in the aquaponic waters due to how aquaponic systems emulate natural aquatic environments. This aligns with the work of Bartelme et al. and Goddek et al. [19,22]. There are likely more PGPMs in the CHSAS aquaponic source water than in the Bevier aquaponic source water due to the larger nature of the CHSAS aquaponic system and the increased stocking rate. This is why the CHSAS trials outperformed the positive control until the PGMPs became too dilute, with the 25% CHSAS and the Bevier water lacking enough PGPMs to make up for their lower nutrient content. Regarding the second grouping of trials, at the edges of the HTL-AP solution range, we see that the 1% HTL-AP with DI lacked enough nutrients to provide a sufficient growth rate; while the 10% and 8% HTL-AP with SHF trials exhibited toxicity or other inhibitory effects that meant they were unable to produce a sufficient growth rate, confirming the general toxicity of HTL-AP found in the works of [14,18], although the results of this study push the viable solution range beyond the cited literature. The rough bell-curve shapes in Figure 6 illustrate these edge effects and indicate that future work should investigate solutions of between 6–2% HTL-AP. Overall, the results from the growth-rate category highlight the importance of PGMPs, and indicate that the middle to lower solutions, of 6–2% HTL-AP, have desirable growth rates.

5. Conclusions

This study provides evidence that HTL-AP and two different aquaponic wastewaters do not inhibit the germination of lettuce seeds. This finding may serve as the first step in identifying alternative nutrient sources for hydroponic cropping systems. Specific results indicated that the CHSAS aquaponics system performed better than the water from the Bevier aquaponics system; this is likely due to the differences between the two systems, namely, the larger scale and stocking rates of the CHSAS operation, which increases nutrient content as well as the quantity and diversity of PGPMs. Although more work is needed to determine the benefits of PGPMs and their synergistic effects with various nutrient contents and compositions, aquaponic effluents show promise as a viable supplement or even a complete substitute for hydroponic industry-standard liquid fertilizers. HTL-AP performed best as a nutrient source when it was diluted to 8% to 2%, for all four control waters. Although 10% HTL-AP solutions exhibited some sort of inhibitory or toxic effect regarding the total length of growth and the average growth rate performance, the 8% HTL-AP mixture is higher than concentrations used in previous studies that have been able to successfully sustain algae or lettuce growth. The exact inhibitory compounds in HTL-AP and their mechanisms affecting plant growth and development need to be further investigated. Additionally, this study only investigated the impacts of alternative nutrient sources, wastewaters, on the initial 10-day germination and initial growth period of lettuce. Therefore, further studies on the complete growth cycle of lettuce, as well as wastewater’s effects on other crops, are needed to establish the range of applications these alternative nutrient sources have in hydroponic production systems for either industry or research purposes. Alternative nutrient sources are needed to increase the circularity of global food-production systems as well as decrease the reliance on chemical fertilizers derived from fossil fuels or mined from the earth.

Author Contributions

Conceptualization, L.P.R. and P.C.D.; Data curation, L.P.R. and V.F.C.L.; Formal analysis, L.P.R.; Funding acquisition, P.C.D.; Investigation, L.P.R.; Methodology, L.P.R., V.F.C.L. and P.C.D.; Project administration, P.C.D.; Resources, P.C.D.; Supervision, P.C.D.; Visualization, L.P.R.; Writing—original draft, L.P.R.; Writing—review & editing, L.P.R. and P.C.D. All authors have read and agreed to the published version of the manuscript.

Funding

This work was funded, in part, by the USDA National Institute of Food and Agriculture, Hatch project 1021253.

Data Availability Statement

The data presented in this study are available on request from the corresponding author.

Acknowledgments

I would like to thank Michael Stablein for providing guidance with the experimental design and initial data analysis, Vitória Fernandes Cintra Leme for teaching me how to conduct the nutrient analyses, and Barbara Camila Bogarin Cantero for continuously providing feedback and guidance during the entire experimental process.

Conflicts of Interest

The authors declare no conflicts of interest. The funders had no role in the design of the study; in the collection, analyses, or interpretation of data; in the writing of the manuscript; or in the decision to publish the results.

References

  1. Ackerman, K. 7—Urban Agriculture: Opportunities and Constraints. In Metropolitan Sustainability; Zeman, F., Ed.; Woodhead Publishing Series in Energy; Woodhead Publishing: Sawston, UK, 2012; pp. 118–146. ISBN 978-0-85709-046-1. [Google Scholar]
  2. Grafton, R.; Daugbjerg, C.; Qureshi, M. Towards Food Security by 2050. Food Secur. 2015, 7, 179–183. [Google Scholar] [CrossRef]
  3. Alexandratos, N. World Agriculture towards 2030/2050: The 2012 Revision; FAO: Rome, Italy, 2012. [Google Scholar]
  4. Specht, K.; Siebert, R.; Hartmann, I.; Freisinger, U.B.; Sawicka, M.; Werner, A.; Thomaier, S.; Henckel, D.; Walk, H.; Dierich, A. Urban Agriculture of the Future: An Overview of Sustainability Aspects of Food Production in and on Buildings. Agric. Hum. Values 2014, 31, 33–51. [Google Scholar] [CrossRef]
  5. Tornaghi, C. Critical Geography of Urban Agriculture. Prog. Hum. Geogr. 2014, 38, 551–567. [Google Scholar] [CrossRef]
  6. Orsini, F.; Kahane, R.; Nono-Womdim, R.; Gianquinto, G. Urban Agriculture in the Developing World: A Review. Agron. Sustain. Dev. 2013, 33, 695–720. [Google Scholar] [CrossRef]
  7. Mougeot, L.J.A. Urban Agriculture: Definition, Presence, Potentials and Risks, and Policy Challenges; IRDC: Ottawa, ON, Canada, 2000.
  8. Opitz, I.; Berges, R.; Piorr, A.; Krikser, T. Contributing to Food Security in Urban Areas: Differences between Urban Agriculture and Peri-Urban Agriculture in the Global North. Agric. Hum. Values 2016, 33, 341–358. [Google Scholar] [CrossRef]
  9. Shabbir, G. Urban Agriculture: Food, Jobs & Sustainable Cities; United Nations Development Programme: New York, NY, USA, 1996; ISBN 978-92-1-126047-2. [Google Scholar]
  10. Mougeot, L.J.A. Growing Better Cities: Urban Agriculture for Sustainable Development; IDRC: Ottawa, ON, Canada, 2006; ISBN 978-1-55250-226-6.
  11. Kalantari, F.; Tahir, O.M.; Joni, R.A.; Fatemi, E. Opportunities and Challenges in Sustainability of Vertical Farming: A Review. J. Landsc. Ecol. 2017, 11, 35–60. [Google Scholar] [CrossRef]
  12. Goldstein, B.; Hauschild, M.; Fernández, J.; Birkved, M. Urban versus Conventional Agriculture, Taxonomy of Resource Profiles: A Review. Agron. Sustain. Dev. 2016, 36, 9. [Google Scholar] [CrossRef]
  13. Gollakota, A.R.K.; Kishore, N.; Gu, S. A Review on Hydrothermal Liquefaction of Biomass. Renew. Sustain. Energy Rev. 2018, 81, 1378–1392. [Google Scholar] [CrossRef]
  14. Jesse, S.; Davidson, P. Treatment of Post-Hydrothermal Liquefaction Wastewater (PHWW) for Heavy Metals, Nutrients, and Indicator Pathogens. Water 2019, 11, 854. [Google Scholar] [CrossRef]
  15. Leng, L.; Zhou, W. Chemical Compositions and Wastewater Properties of Aqueous Phase (Wastewater) Produced from the Hydrothermal Treatment of Wet Biomass: A Review. Energy Sources Part A Recovery Util. Environ. Eff. 2018, 40, 2648–2659. [Google Scholar] [CrossRef]
  16. Huang, H.; Yuan, X. Recent Progress in the Direct Liquefaction of Typical Biomass—ScienceDirect. Available online: https://www-sciencedirect-com.proxy2.library.illinois.edu/science/article/pii/S0360128515000246?via%3Dihub (accessed on 7 October 2022).
  17. Peterson, A.A.; Vogel, F.; Lachance, R.P.; Fröling, M.; Michael, J.; Antal, J.; Tester, J.W. Thermochemical Biofuel Production in Hydrothermal Media: A Review of Sub- and Supercritical Water Technologies. Energy Environ. Sci. 2008, 1, 32–65. [Google Scholar] [CrossRef]
  18. Jesse, S.; Zhang, Y.; Margenot, A.; Davidson, P. Hydroponic Lettuce Production Using Treated Post-Hydrothermal Liquefaction Wastewater (PHW). Sustainability 2019, 11, 3605. [Google Scholar] [CrossRef]
  19. Bartelme, R.P.; Oyserman, B.O.; Blom, J.E.; Sepulveda-Villet, O.J.; Newton, R.J. Stripping Away the Soil: Plant Growth Promoting Microbiology Opportunities in Aquaponics. Front. Microbiol. 2018, 9, 314035. [Google Scholar] [CrossRef] [PubMed]
  20. Blidariu, F.; Grozea, A. Increasing the Economical Efficiency and Sustainability of Indoor Fish Farming by Means of Aquaponics-Review. Available online: https://www.researchgate.net/publication/228442364_Increasing_the_Economical_Efficiency_and_Sustainability_of_Indoor_Fish_Farming_by_Means_of_Aquaponics-Review (accessed on 30 August 2023).
  21. Goodman, E.R. Aquaponics: Community and Economic Development. Master’s Thesis, Massachusetts Institute of Technology, Cambridge, MA, USA, 2011. [Google Scholar]
  22. Goddek, S.; Delaide, B.; Mankasingh, U.; Ragnarsdottir, K.; Jijakli, M.; Thorarinsdottir, R. Challenges of Sustainable and Commercial Aquaponics. Sustainability 2015, 7, 4199–4224. [Google Scholar] [CrossRef]
  23. Goddek, S.; Schmautz, Z.; Scott, B.; Delaide, B.; Keesman, K.J.; Wuertz, S.; Junge, R. The Effect of Anaerobic and Aerobic Fish Sludge Supernatant on Hydroponic Lettuce. Agronomy 2016, 6, 37. [Google Scholar] [CrossRef]
  24. Carvalho, R.d.S.C.; Bastos, R.G.; Souza, C.F. Influence of the Use of Wastewater on Nutrient Absorption and Production of Lettuce Grown in a Hydroponic System. Agric. Water Manag. 2018, 203, 311–321. [Google Scholar] [CrossRef]
  25. Egbuikwem, P.N.; Mierzwa, J.C.; Saroj, D.P. Assessment of Suspended Growth Biological Process for Treatment and Reuse of Mixed Wastewater for Irrigation of Edible Crops under Hydroponic Conditions. Agric. Water Manag. 2020, 231, 106034. [Google Scholar] [CrossRef]
  26. Arancon, N.; Pant, A.; Radovich, T.; Hue, N.; Converse, J. Seed Germination and Seedling Growth of Tomato and Lettuce as Affected by Vermicompost Water Extracts (Teas). HortScience 2012, 47, 1722–1728. [Google Scholar] [CrossRef]
  27. Ahmed, A.K.A.; Shi, X.; Hua, L.; Manzueta, L.; Qing, W.; Marhaba, T.; Zhang, W. Influences of Air, Oxygen, Nitrogen, and Carbon Dioxide Nanobubbles on Seed Germination and Plant Growth. J. Agric. Food Chem. 2018, 66, 5117–5124. [Google Scholar] [CrossRef]
  28. Poštić, D.; Štrbanović, R.; Tabaković, M.; Popović, T.; Ćirić, A.; Banjac, N.; Trkulja, N.; Stanisavljević, R. Germination and the Initial Seedling Growth of Lettuce, Celeriac and Wheat Cultivars after Micronutrient and a Biological Application Pre-Sowing Seed Treatment. Plants 2021, 10, 1913. [Google Scholar] [CrossRef]
  29. Moreira, I.N.; Martins, L.L.; Mourato, M.P. Effect of Cd, Cr, Cu, Mn, Ni, Pb and Zn on Seed Germination and Seedling Growth of Two Lettuce Cultivars (Lactuca sativa L.). Plant Physiol. Rep. 2020, 25, 347–358. [Google Scholar] [CrossRef]
  30. Adhikari, B.; Olorunwa, O.J.; Barickman, T.C. Seed Priming Enhances Seed Germination and Morphological Traits of Lactuca sativa L. under Salt Stress. Seeds 2022, 1, 74–86. [Google Scholar] [CrossRef]
  31. Priac, A.; Badot, P.-M.; Crini, G. Treated Wastewater Phytotoxicity Assessment Using Lactuca sativa: Focus on Germination and Root Elongation Test Parameters. Comptes Rendus Biol. 2017, 340, 188–194. [Google Scholar] [CrossRef]
  32. Zhang, T.; Liu, M.; Huang, X.; Hu, W.; Qiao, N.; Song, H.; Zhang, B.; Zhang, R.; Yang, Z.; Liu, Y.; et al. Direct Effects of Nitrogen Addition on Seed Germination of Eight Semi-arid Grassland Species. Ecol. Evol. 2020, 10, 8793–8800. [Google Scholar] [CrossRef] [PubMed]
Figure 1. (a) Experimental trials on shelving unit; (b) Example of daily trial picture. Note: Temporary shade is from taking the photo.
Agriculture 14 00608 g001
Figure 2. Subgroupings of trials and their controls for data analysis.
Agriculture 14 00608 g002
Figure 3. Final germination proportion results for the three groupings of trials.
Agriculture 14 00608 g003
Figure 4. Average germination rate for all source water combinations with various HTL-AP concentrations. The blue line denotes the average germination rate for each percentage of HTL-AP; the orange dotted line represents the linear line of best fit as seen below the title of the graph.
Agriculture 14 00608 g004
Figure 5. Summary of average total length produced for the three data groupings.
Agriculture 14 00608 g005
Figure 6. Box and whisker plot of the average growth rates for the aquaponic and HTL-AP trials. The lighter colored portions of the boxes represent the 3rd quartile and the darker colored portions of the boxes represent the 2nd quartile. The different colors distinguish groupings of data.
Agriculture 14 00608 g006
Table 1. Description of controls and source waters.
Source Water/ProcessDescription
DI WaterStandard deionized water (negative control)
Industry Standard
Hydroponic Fertilizer (SHF)
General Hydroponics (Santa Rosa, CA, USA) Flora Series hydroponic fertilizer for “aggressive vegetative growth” solution, consisting of Flora Grow (396; 2-1-6), Flora Micro (264; 5-0-1), and Flora Bloom (0-5-4; 132) measured in (mL/100 L; N-P-K). This solution was created in-house in the water quality lab of the AESB. (positive control)
Aquaponic Effluent from the Chicago High School for Agricultural Sciences (CHSAS)Collected from the system at the CHSAS; the system was a series of deepwater culture beds growing leafy greens and tomatoes, and also contained 4 large swim tanks that housed tilapia. This aquaponic water was collected by submerging a 19 L bucket horizontally into the fish swim tanks until it was full. This sample was obtained on 09/2020 and stored refrigerated for approximately 6 months.
Aquaponic Effluent from the UIUC’s Bevier Café Aquaponic SystemSourced from the system run by Bevier Café in the UIUC greenhouses to supplement their food supply. This system consists of an ebb and flow system made up of three leca-filled drain beds growing tomatoes, herbs, and leafy greens as well as a swim tank that housed koi at the time of sample collection. The sample was collected using the same method as the CHSAS sample, horizontally submerging a bucket until full. This sample was obtained on 02/2021 and stored in a refrigerator for approximately 1 month.
Hydrothermal Liquefaction Aqueous Phase (HTL-AP)This nutrient-rich effluent or wastewater was collected from the UIUC pilot HTL plant with Kraft salad dressing as the feedstock. The exact specifications of the HTL batch are as follows: HTL-AP Sample: 21 September 2020, Kraft Salad Dressing Bucket 2 of 3
Feedstock Volume Ran through the System: 75.7 L
Temperature Range: 240–280 °C
Pressure Range: 11,031–12,410 kPa
Feedstock Flow-rate Range: 0.53–0.68 LPM
Table 2. Summary of each source water used to create each combination. The tables are color-coded for convenience. The numbers represent the volume (mL) of each source water used to make a total of 20 mL (supplemented with DI water, as needed) for each trial.
TrialsDI Water
(mL)
SHF
(mL)
CHSAS Effluent
(mL)
Bevier Effluent
(mL)
Raw HTL-AP
(mL)
Negative Control20.00----
Positive Control-20.00---
CHSAS Control--20.00--
Bevier Control---20.00-
Trial 3 (10%)18.00---2.00
Trial 4 (8%)18.40---1.60
Trial 5 (6%)18.80---1.20
Trial 6 (4%)19.20---0.80
Trial 7 (2%)19.60---0.40
Trial 8 (1%)19.80---0.20
Trial 9 (75%)-5.0015.00--
Trial 10 (50%)-10.0010.00--
Trial 11 (25%)-15.005.00--
Trial 12 (75%)-5.00-15.00-
Trial 13 (50%)-10.00-10.00-
Trial 14 (25%)-15.00-5.00-
Trial 15 (10%)-18.00--2.00
Trial 16 (8%)-18.40--1.60
Trial 17 (6%)-18.80--1.20
Trial 18 (4%)-19.20--0.80
Trial 19 (2%)-19.60--0.40
Trial 20 (1%)-19.80--0.20
Trial 21 (10%)--18.00-2.00
Trial 22 (8%)--18.40-1.60
Trial 23 (6%)--18.80-1.20
Trial 24 (4%)--19.20-0.80
Trial 25 (2%)--19.60-0.40
Trail 26 (1%)--19.80-0.20
Trial 27 (10%)---18.002.00
Trial 28 (8%)---18.401.60
Trial 29 (6%)---18.801.20
Trial 30 (4%)---19.200.80
Trial 31 (2%)---19.600.40
Trial 32 (1%)---19.800.20
Table 3. Characterization of source waters.
Source WaterpHEC
(ms/cm)
NO3-N
(mg/L)
NH3-N
(mg/L)
COD
(mg/L)
DI6.40 ± 0.740.021 ± 0.0090 ± 00 ± 00 ± 0
SHF5.01 ± 0.062.136 ± 0.04756.40 ± 1.6536.58 ± 1.1238.00 ± 3.31
CHSAS Effluent7.07 ± 0.140.739 ± 0.0143.31 ± 0.050.51 ± 0.0458.93 ± 2.94
Bevier Effluent7.87 ± 0.060.572 ± 0.0100.57 ± 0.060.12 ± 0.0115.60 ± 3.05
HTL-AP3.99 ± 0.065.018 ± 0.0479.21 ± 0.4564.18 ± 3.688532.00 ± 84.17
Table 4. Summary of results.
Source
Water
Final Germination ProportionGermination
Rate
Total Length of GrowthGrowth Rate
Aquaponic
Effluent
No significant impact or trendsMore nutrients in source water tended to delay germinationPGPMs can make up for lower nutrient content to a certain extentHigher nutrient contents increase the average rate of growth
HTL-APNo inhibitory effects on germination even with 10% HTL-AP solutionsLinear model negatively correlated with HTL-AP concentration10% HTL-AP exhibits significant inhibitory effects on the length of plant growth8% to 2% HTL-AP solutions with DI & SHF provide viable growth rates; aquaponics inconclusive
Disclaimer/Publisher’s Note: The statements, opinions and data contained in all publications are solely those of the individual author(s) and contributor(s) and not of MDPI and/or the editor(s). MDPI and/or the editor(s) disclaim responsibility for any injury to people or property resulting from any ideas, methods, instructions or products referred to in the content.

