Article

Exploring Symbiosis: Innovatively Unveiling the Interplay between the Cold Chain Logistics of Fresh Agricultural Products and the Ecological Environment

School of Business and Management, Jilin University, Changchun 130022, China
*
Author to whom correspondence should be addressed.
Agriculture 2024, 14(4), 609; https://doi.org/10.3390/agriculture14040609
Submission received: 13 March 2024 / Revised: 7 April 2024 / Accepted: 10 April 2024 / Published: 12 April 2024
(This article belongs to the Special Issue Agricultural Policies toward Sustainable Farm Development)

Abstract

:
Cold chain logistics are crucial for reducing agricultural product loss, yet the environmental impact of energy and packaging consumption, among others, demands attention, making the search for eco-friendly development modes essential. Based on data from 30 provinces in China from 2015 to 2021, this study analyzes the basic correlation between the development of cold chain logistics of fresh agricultural products (CCLFAP) and the ecological environment (EE) by using a random forest regression model in comparison with the XGBoost model. Correlation heatmaps were used to analyze the relationships between the cold chain logistics of fresh agricultural products and various factors of the ecological environment. The generalized additive model was then used to establish the connection between cold chain logistics and the ecological environment, identifying significant factors impacting EE. The results demonstrate that a higher development level of cold chain logistics corresponds to a better development trend of EE. The economic efficiency and technical aspects of cold chain logistics for fresh agricultural products are closely related to ecological pressures and responses. The number of employees in the logistics industry, the trading volume of fresh agricultural products, the number of refrigerated vehicles, and the capacity of the cold room have significant positive correlations with the ecological environment, while the per capita consumption of fresh agricultural products, the number of cold chain logistics patent applications, and the road density had significant negative correlations with the ecological environment. The effects of the number of cold chain logistics enterprises and the freight turnover of agricultural products transported by the cold chain on the ecological environment fluctuated. These findings contribute to reducing climate and environmental emergencies throughout the life cycle, offering sustainable development solutions for the fresh agricultural product cold chain logistics industry.

1. Introduction

As China’s economy continues to grow, the demand for fresh agricultural products and prepared dishes has increased. The cold chain logistics market in China is expanding, with an expected annual revenue surpassing CNY 550 billion by 2024 [1]. Cold chain logistics help to reduce food loss and waste while ensuring product freshness [2]. This benefits consumers and farmers, supporting China’s economic transformation. However, it also poses challenges to the ecological environment (EE) [3]. Transport vehicles with refrigeration systems emit five times more pollutants than regular vehicles, and suboptimal cold chain technology can contribute to environmental pollution [4]. Disposable packaging materials that preserve the freshness of fresh produce also contribute to the generation of pollutants [5]. This statement is inconsistent with China’s sustainability objectives [6]. Managing cold chain logistics for fresh agricultural products (CCLFAP) involves considering economic, environmental, and social sustainability [7,8].
The impact of the development of CCLFAP on EE has two sides. CCLFAP can negatively affect the EE through energy consumption, material use, storage equipment, and waste discharge [9,10,11,12]. The scale and high-tech standards of cold chain logistics operations lead to extensive energy consumption [13,14]. Logistics equipment can produce harmful gases and noise pollution, harming the ecological environment [15]. However, CCLFAP’s role in preserving product quality and reducing waste offers economic benefits [16,17]. CCLFAP aligns with ecological protection and resource conservation by slowing product deterioration and waste generation [18,19].
The requirements for EE development are similar to those for the development of the CCLFAP [20]. Many countries have enacted regulations to reduce waste, carbon emissions, and wastewater. As a result, CCLFAP must adhere to higher standards in their operations, limiting their development. Small- and medium-sized fleets can reduce carbon emissions, but increase costs and space requirements for companies [21]. Scholars have recommended the use of renewable energy sources and environmental measures to reduce the burden on the environment [22,23,24], such as the use of new types of energy and the adoption of electric vehicles to replace traditional fuel vehicles. These measures require significant investments in equipment and technology upgrades, prompting necessary reforms [25,26].
The coordinated development of CCLFAP and EE manifests in various aspects. Different cold chain logistics modes have varying carbon emissions, offering opportunities to reduce environmental impacts without compromising efficiency or profitability [27]. Integrating internal and external resources in cold chain logistics enables efficient scheduling, benefiting urban governance needs such as product traceability and emission reduction [28,29,30,31,32]. Eco-friendly CCLFAP emphasizes sustainability, energy conservation, and low carbon footprint, aligning with ecological protection and contributing to a low-carbon economic system [33]. The synergy between ecological protection and economic development supports the sustainable growth of CCLFAP [34]. Focusing on ecological protection, technological innovation, and talent development enhances economic benefits when addressing high emission treatment costs and stringent requirements [35,36,37]. Advanced technologies such as the Internet of Things (IoT) or blockchain can further promote coordinated development between cold chain logistics for fresh agricultural products and the ecological environment [35,38].
At present, most studies have confirmed the complexity of cold chain logistics and the ecological environment of fresh agricultural products, but most of the research on CCLFAP and EE has focused on individual elements, often within the EE. Research data are often limited to specific roads or neighborhoods. The research method is mostly based on game theory. Few scholars have studied the broader “many-to-many” effects of CCLFAP on EE systems at the regional macro level. There is a lack of evidence with actual regional data. It is crucial to systematically investigate the complex relationship between cold chain logistics for fresh agricultural products and the ecological environment in specific regions, constituting an important direction for research.
Therefore, we explored the relationship between CCLFAP and EE in the system and determined which factors of CCLFAP play significant roles in EE, as well as the trend of these factors’ impact on the EE. This paper explores the relationship between CCLFAP and EE using data from 30 provinces in China (2015–2021). It employs the random forest regression model and the XGBoost model to analyze their fundamental correlation, utilizes a correlation heatmap to examine the interplay of various factors, and employs the generalized additive model to identify significant elements affecting EE due to CCLFAP. The paper then presents corresponding recommendations. By adopting the idea of a system, from the perspective of the whole life cycle, this paper validates the relationship between CCLFAP and EE development. This approach enhances result accuracy through multimodel comparisons, offering valuable insights for data integration and modeling applications. With full consideration of environmental protection factors, this paper proposes a more efficient direction for the development of CCLFAP. Furthermore, this paper provides theoretical foundations and critical guidance for government support for sustainable development in the cold chain logistics sector for fresh agricultural products. It also serves as a reference for promoting coordinated development across industries and alleviating ecological environmental emergencies.

2. Research Design

2.1. Selection of Evaluation Indicators for the Development of Cold Chain Logistics for Agricultural Products

To assess the coupling and interaction between fresh produce cold chain logistics and the ecological environment, this study draws on existing research to develop two indicator systems. The selection of these indicators is based on principles of systematicity, representativeness, practicability, comparability, and measurability. The CCLFAP indicator system was developed considering the STIRPAT model’s categorization of factors affecting environmental pressure into structure, scale, and technology [39]. This paper selects primary indicators to evaluate the development of regional fresh produce cold chain logistics, including participating subjects, economic benefits, technology level, and infrastructure. The secondary indicators are based on the LCA evaluation method and include all indicators of fresh agricultural products from production to consumption [40]. This study also utilizes the state–pressure–response model proposed by the United Nations Environment Program [41] to evaluate the ecosystem environment. This model considers the ecological state, ecological pressure, and ecological response as primary indicators for evaluating the ecological environment [42]. These three aspects are selected as secondary indicators. The complete indicator system is presented in Table 1 below:

2.2. Indicator Data Sources and Processing

To ensure horizontal data comparisons, data from 30 Chinese provinces between 2015 and 2021 were selected, while data from Tibet and some Chinese regions were missing. The data sources for these indicators include various statistical yearbooks published in China, the China Patent Information Network, and government websites of various regions. Additionally, some data come from survey data collected by the Zhongguancun Green Cold Chain Logistics Industry Alliance, while a few indicators were obtained through further processing.
The data for output of fresh agricultural products (OFAP), trading volume of fresh agricultural products (TVFAP), per capita consumption of fresh agricultural products (PCCFAP), total cold chain logistics of agricultural products (TCCLAP), number of employees in the logistics industry (NELI), research and experimental development (R&D) personnel full-time equivalent (RTDSFTE), and road density (RD) were extracted from the Statistical Yearbook. For some of these indicators, correlation coefficients were used to fill in missing data [43,44]. For example, the freight turnover of agricultural products transported by the cold chain (FTAPTCC) was calculated using road turnover, the road cold chain coefficient, and the shares of the road cold chain in the cold chain market and fresh products in cold chain products, ensuring a high degree of accuracy [45]. The number of cold-chain-related policies issued by the government (NCCPIG) was determined by inquiry and involved researching and recording government policies that support the cold chain in each province. Number of cold chain logistics enterprises (NCCLE), capacity of cold room (CCR), and number of refrigerated vehicles (NRV) were based on sample survey data collected by the Zhong Guan Cun Green Cold Chain Logistics Industry Alliance from 1000 enterprises across the nation, ensuring authenticity and credibility and reflecting the infrastructure and operations of cold chain logistics in each Chinese province. Number of cold chain logistics patent applications (NCCLPA) was queried using Python [3].
Data for per capita water resources (PCWR), sown area (SA), annual average mean temperature (AMT), and nonhazardous disposal of domestic waste (HDCHG) were found in the China Statistical Yearbook for each respective year [46]. Sewage treatment capacity (STC) data were calculated from the China Urban and Rural Construction Statistical Yearbook, while discharge of major pollutants in wastewater (DMPW) was calculated by summing the emissions of ammonia nitrogen, total nitrogen, total phosphorus, and volatile phenols from provincial statistical yearbooks, considering the characteristics of cold chain logistics for fresh agricultural products [47,48]. The carbon emissions (CE) was calculated using the IPCC formula, with any missing data supplemented by the IPCC emission factor database.

3. Methodology

Considering the multifaceted and intricate interactions between CCLFAP and the EE [3,49], this study utilizes the random forest (RF) and extreme gradient boosting (XGBoost) models to leverage their strengths in handling high-dimensional data and capturing complex relationships among variables. These models are employed to investigate the foundational relationship between the development of CCLFAP and EE. Building on this, we conducted a visual analysis of the influencing relationships among variables using a correlation heatmap based on Pearson’s correlation coefficient. Additionally, the generalized additive model (GAM) was applied to pinpoint significant factors impacting the interaction between CCLFAP and EE, thereby offering a comprehensive insight into the dynamics at play. This approach not only validates the basic relationship, but also uncovers the significant elements influencing the ecological effects of cold chain logistics for fresh agricultural products.

3.1. Random Forest Regression Model

Random forest is a machine learning algorithm that utilizes decision trees. It generates multiple decision trees and computes the average predicted values for regression tasks, effectively addressing the issue of overfitting [50].
The process of constructing a random forest regression model can be summarized as follows: (1) Iteratively sample the dataset N times to generate new sample sets. (2) Randomly select features to form feature subsets. (3) Determine the optimal splitting attributes for each new sample set and feature subset to construct individual decision trees. (4) Reiterate these steps m times to create m decision trees. (5) Combine the results from all decision trees by averaging their predicted values to obtain the final prediction. In this model, the weak classifier employs the CART tree, also referred to as a CART regression tree, which essentially performs a continuous partitioning of the original feature space to obtain multiple subspaces.
f ( x ) = n = 1 N C n I ( x O N )
The input unit is divided into N units, namely, O1, O2, … ON, and each unit has a fixed output C n . C n is the average value of yi corresponding to xi in region O N .
The evaluation metrics used for testing the model accuracy in this paper are the mean absolute error (MAE), root mean square error (RMSE), and determination coefficient (R2).
M A E = i = 1 n y i y ^ i n
R M S E = 1 n i = 1 n y i y ^ i 2
where y i is the true value, y ^ i is the predicted value, and n is the number of samples.

3.2. XGBoost Model

XGBoost is an ensemble learning algorithm based on gradient boosting decision trees [51]. Compared with the random forest model, which constructs multiple decision trees by randomly selecting samples and features, the XGBoost model obtains a base regression tree from the initial training set, trains a new base regression tree based on the current prediction error, and iterates many times to obtain the final regression function f(x) by weighting multiple base learners. The objective function for constructing the t-tree is as follows:
y ^ j = l L f l x j , f l F
where y ^ j is the final predicted value of the model, L represents the number of combined decision trees as the number of trees to be adjusted, fl represents the l tree, xj represents the j input sample, and F is the set of all tree models.
The objective function formula is:
O b j ( t ) = j = 1 n l o s s y j , y ^ j ( t 1 ) + f l x j + Ω f t + c
where O b j ( t ) denotes the objective function when constructing the t tree; loss stands for residual error; y ^ j ( t 1 ) represents the predicted value calculated by the preceding t − 1 tree; c stands for a constant term; and Ω(ft) represents the regular term of the t tree, which determines the depth of the tree. The regular term formula can be given as:
Ω f t = γ T + 1 2 λ o = 1 T w 0 2
where γ and λ represent regular term coefficients; T is the number of leaf nodes in a tree; and w0 indicates the weight of the 0th leaf node in a tree.
Both the random forest regression model and the XGBoost model are considered exemplary ensemble learning algorithms. In terms of their algorithmic principles, the random forest regression model performs regression tasks by building multiple decision trees and subsequently averaging their predicted values. In contrast, XGBoost addresses regression tasks by iteratively training multiple decision trees with weighted combinations. Regarding feature selection, the random forest model employs a random feature selection approach to mitigate the risk of model overfitting. This is achieved by randomly selecting different feature subsets when constructing each decision tree. On the other hand, XGBoost employs incremental training and fine-tuning of feature splitting points to optimize variable selection and weight parameter adjustments in continuous iterations. This approach enhances the model’s performance. Comparing these two methods in this study serves to enhance research accuracy and improve the interpretability of the study results.

3.3. Pearson’s Correlation Coefficient

Pearson’s correlation coefficient is a linear correlation coefficient used to reflect the degree of linear correlation between two variables [52]. It is defined as the ratio of the covariance to the product of the standard deviations of two variables, and can be expressed as follows:
ρ X , Y = cov X , Y D X D Y = E X E X Y E Y D X D Y
where E represents the mathematical expectation, D represents the variance, and D is the standard deviation. E X E X Y E Y is called the covariance of random variables X and Y, denoted as cov X , Y C ov X , Y = E X E X Y E Y , while the quotient of covariance and standard deviation between the two variables is called the correlation coefficient between the random variables CCLFAP and EE, denoted as ρ X , Y . The correlation coefficient’s value falls within the range of −1 to 1. A positive value indicates a positive correlation between two variables, while a negative value suggests a negative correlation. The closer the absolute value of the correlation coefficient is to 1, the stronger the linear correlation between the two variables. In general, when the correlation coefficient is greater than or equal to 0.6, it indicates a significant correlation, and when it exceeds 0.8, it signifies a strong and highly significant correlation.

3.4. Generalized Additive Model

Due to the complex nature of the relationship between CCLFAP and EE, traditional linear models may not be sufficient to capture the intricacies of these interactions. To address this limitation, we sought a model that would allow for a more nuanced exploration of the data, enabling the identification of nonlinear patterns and relationships. The generalized additive model (GAM) is a compelling choice in this context. The GAM combines the generalized linear model (GLM) and an additive model, providing a non-parametric extension of the GLM, allowing for more flexible modeling of nonlinear relationships [53]. The generalized linear model examines the influence of each explanatory variable on the dependent variable and can be expressed as follows:
g Y = β 0 + j = 1 p β j X j
where Y is the dependent variable, X is the explanatory variable, and β0 is the intercept term. Xj represents the parameter for the explanatory variable.
In the GAM constructed in this paper, the influence of explanatory variables on the dependent variable is not entirely linear. Nonlinear functions replace n explanatory variables in the GLM, based on the framework of the generalized linear model, as follows:
g Y = s 0 + i = 1 n s i X i + j = n + 1 m β j X j
where Y represents the EE system and X1, X2, … Xn and X1, X2, …, Xm represent the indicators impacting the EE system. s0 represents the intercept term, and s(.) denotes the smoothing function, which represents the nonlinear relationship between a dependent variable and explanatory variables. n is the number of smoothing terms, corresponding to the number of explanatory variables that have nonlinear effects on the dependent variable in the model.

4. Results

4.1. Relationship between the Level of Development of Cold Chain Logistics of Fresh Agricultural Products and the Level of Development of the Ecological Environment

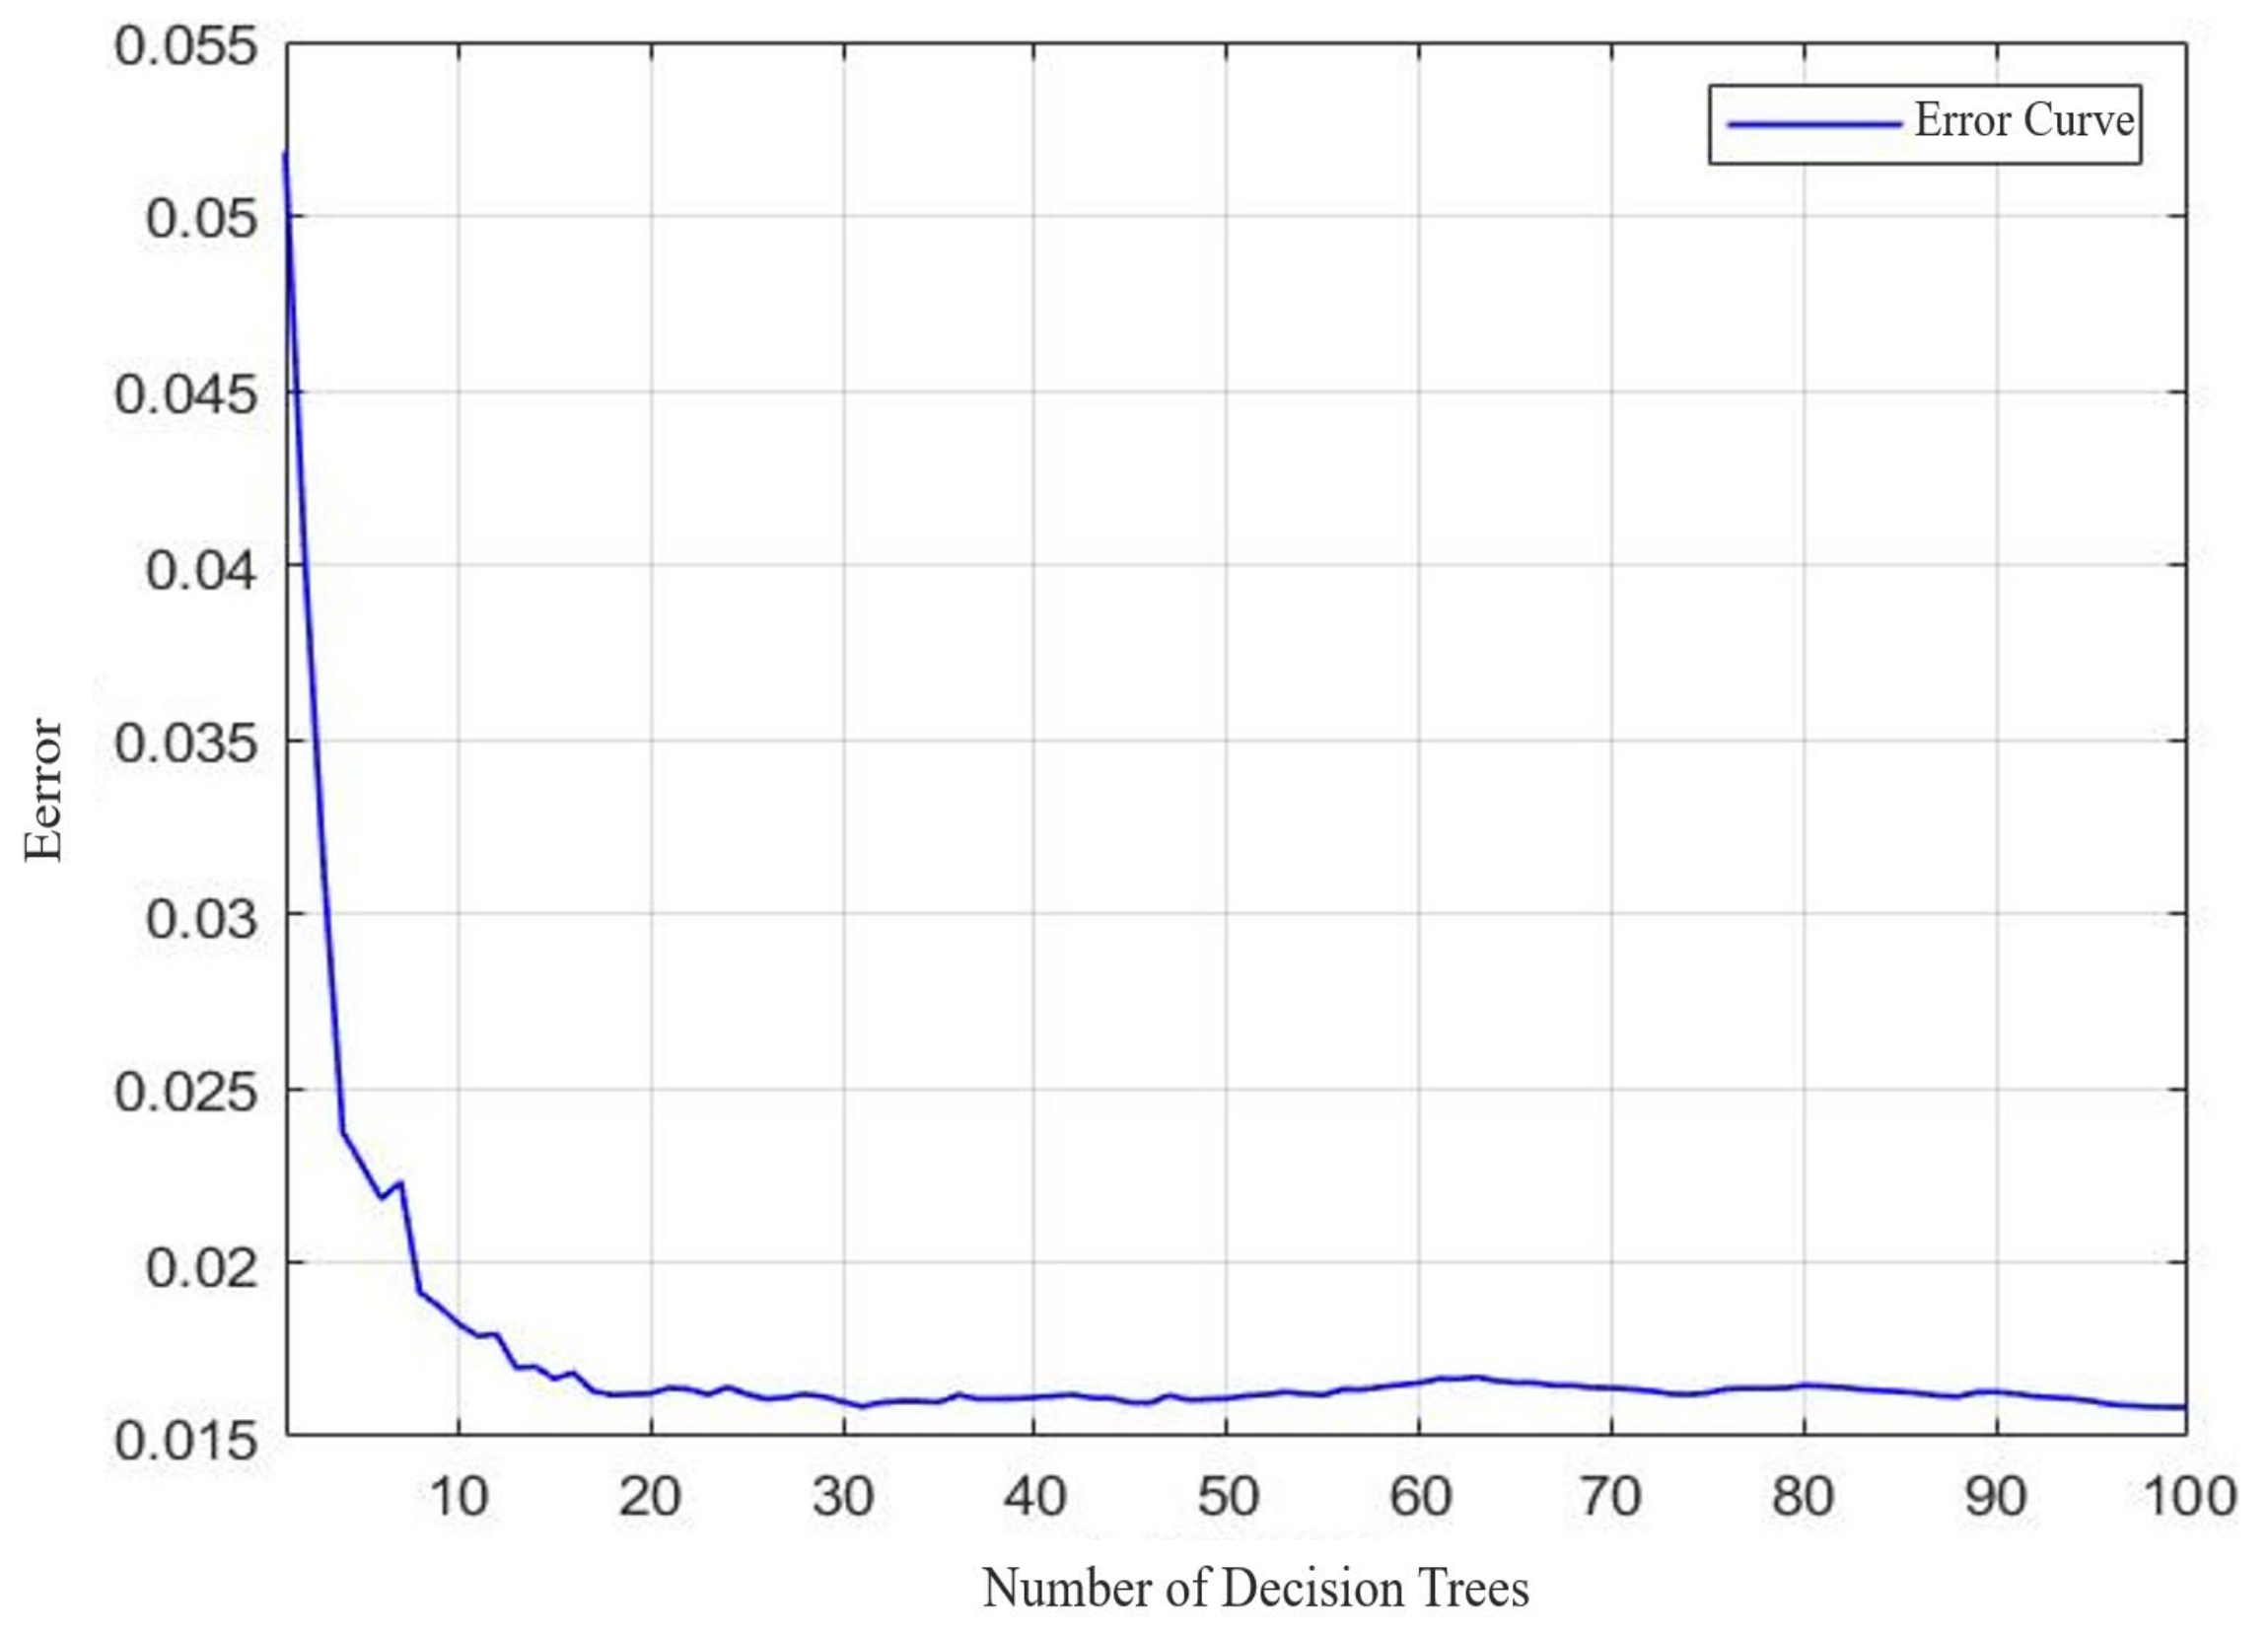
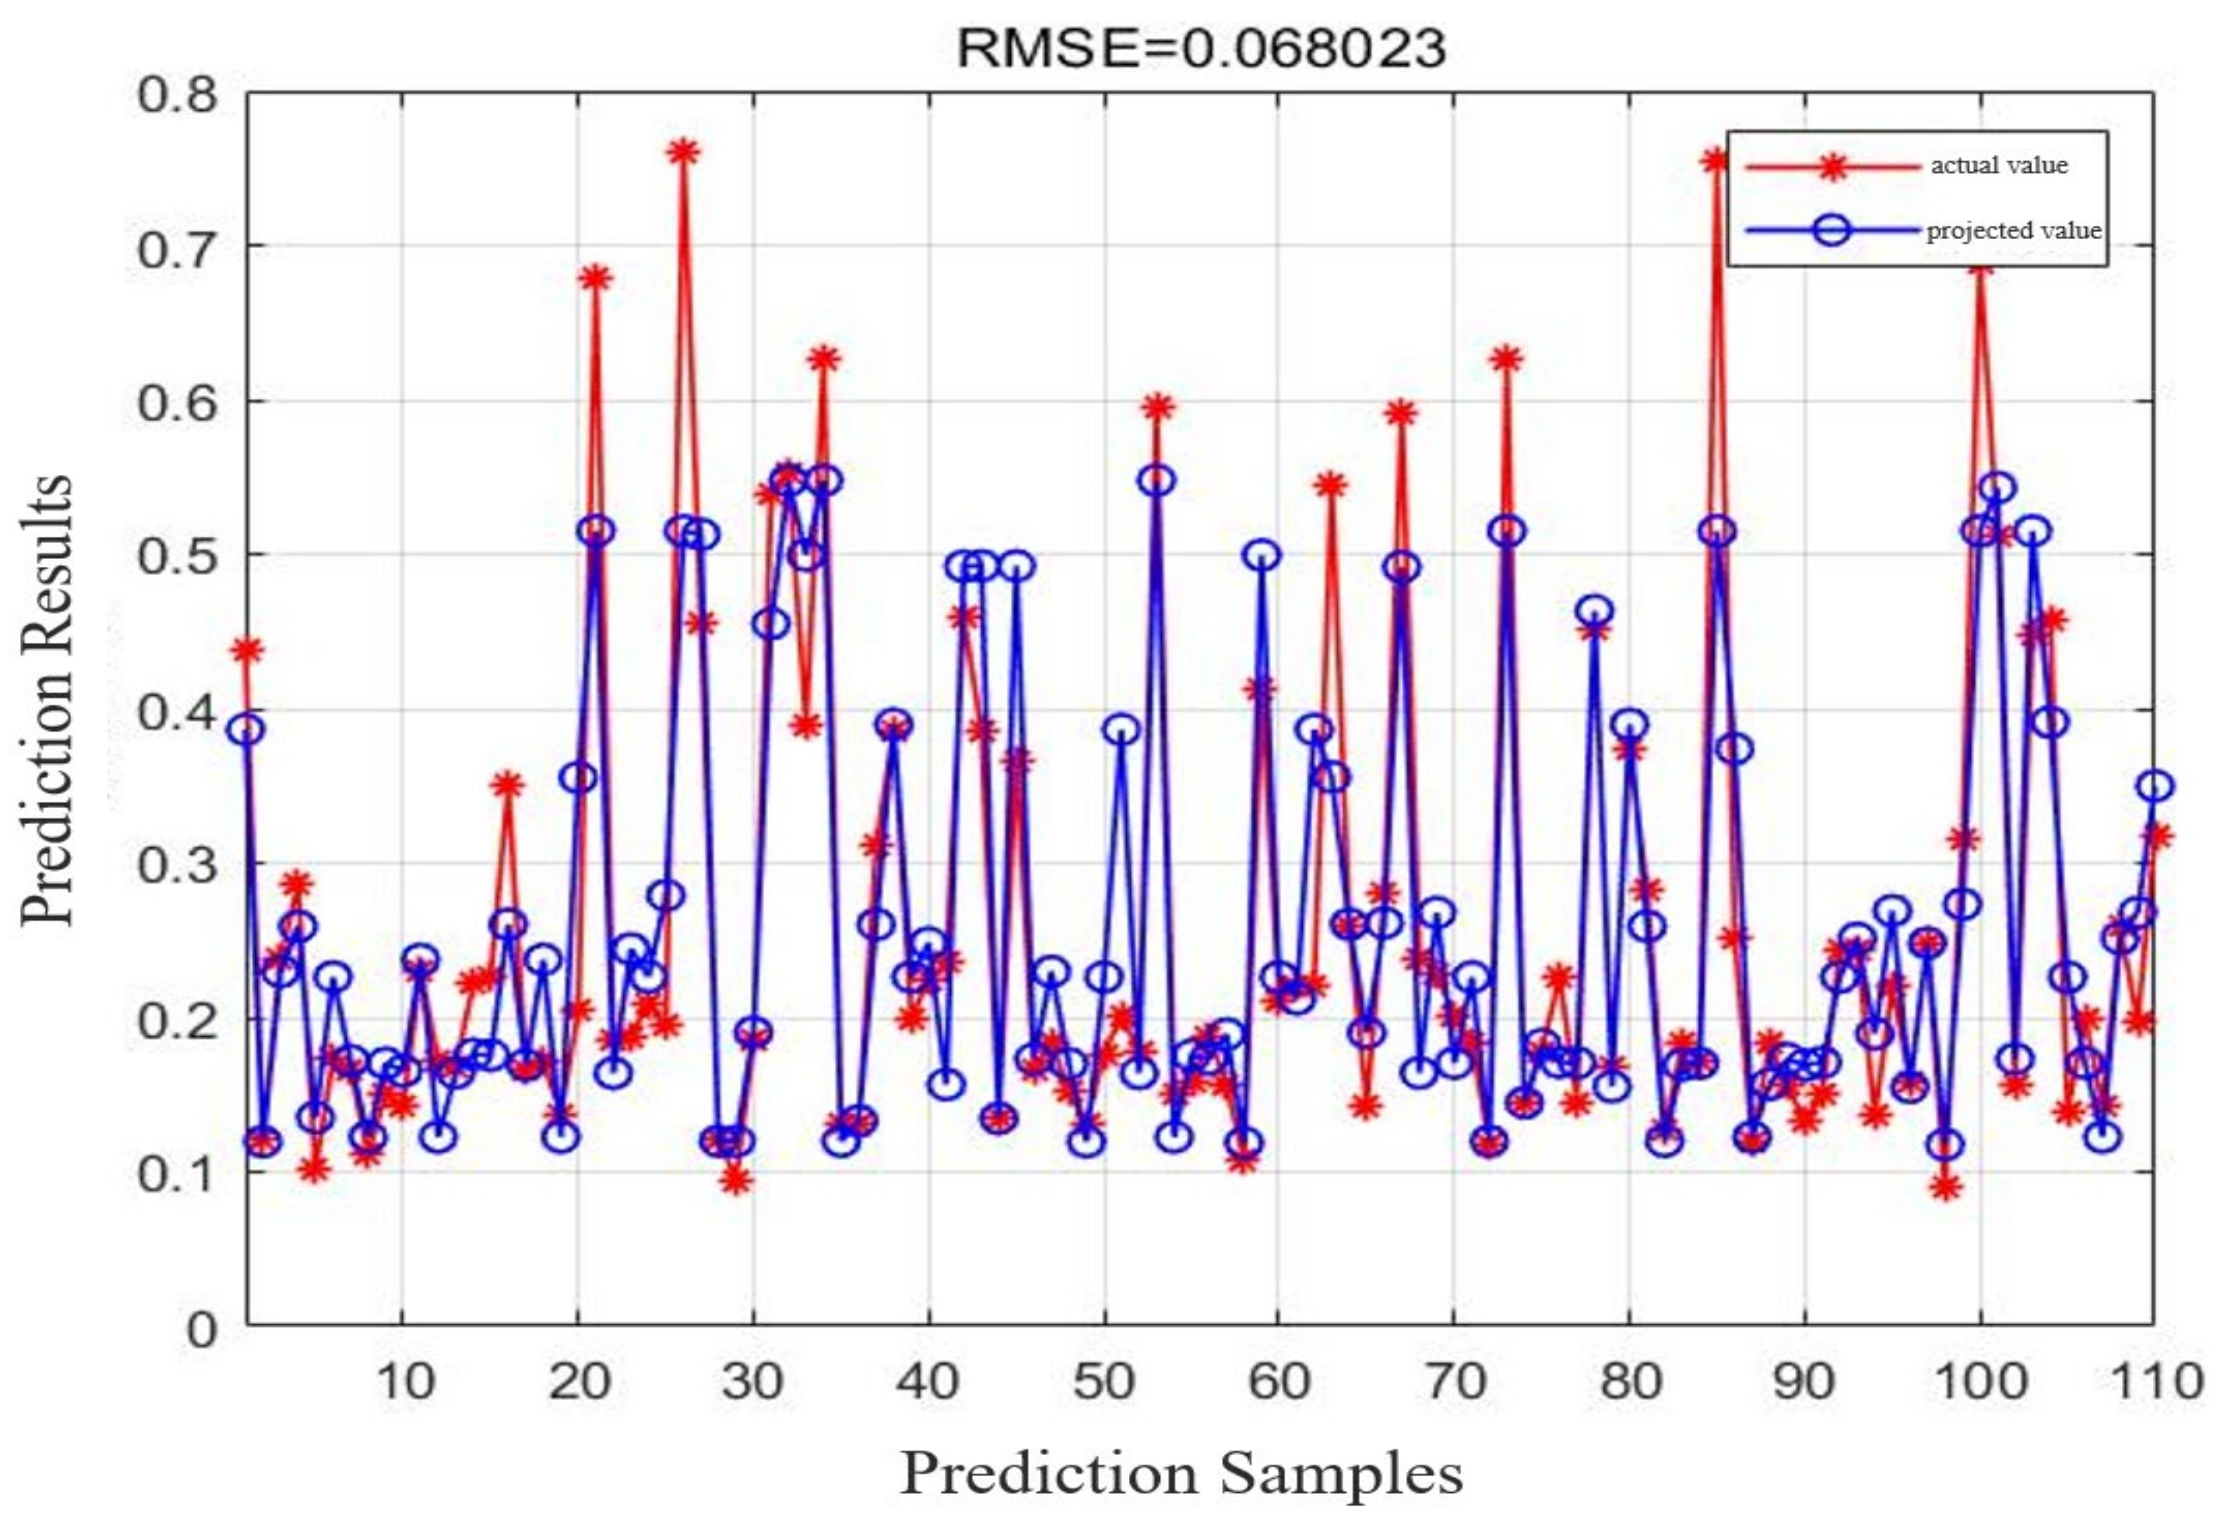
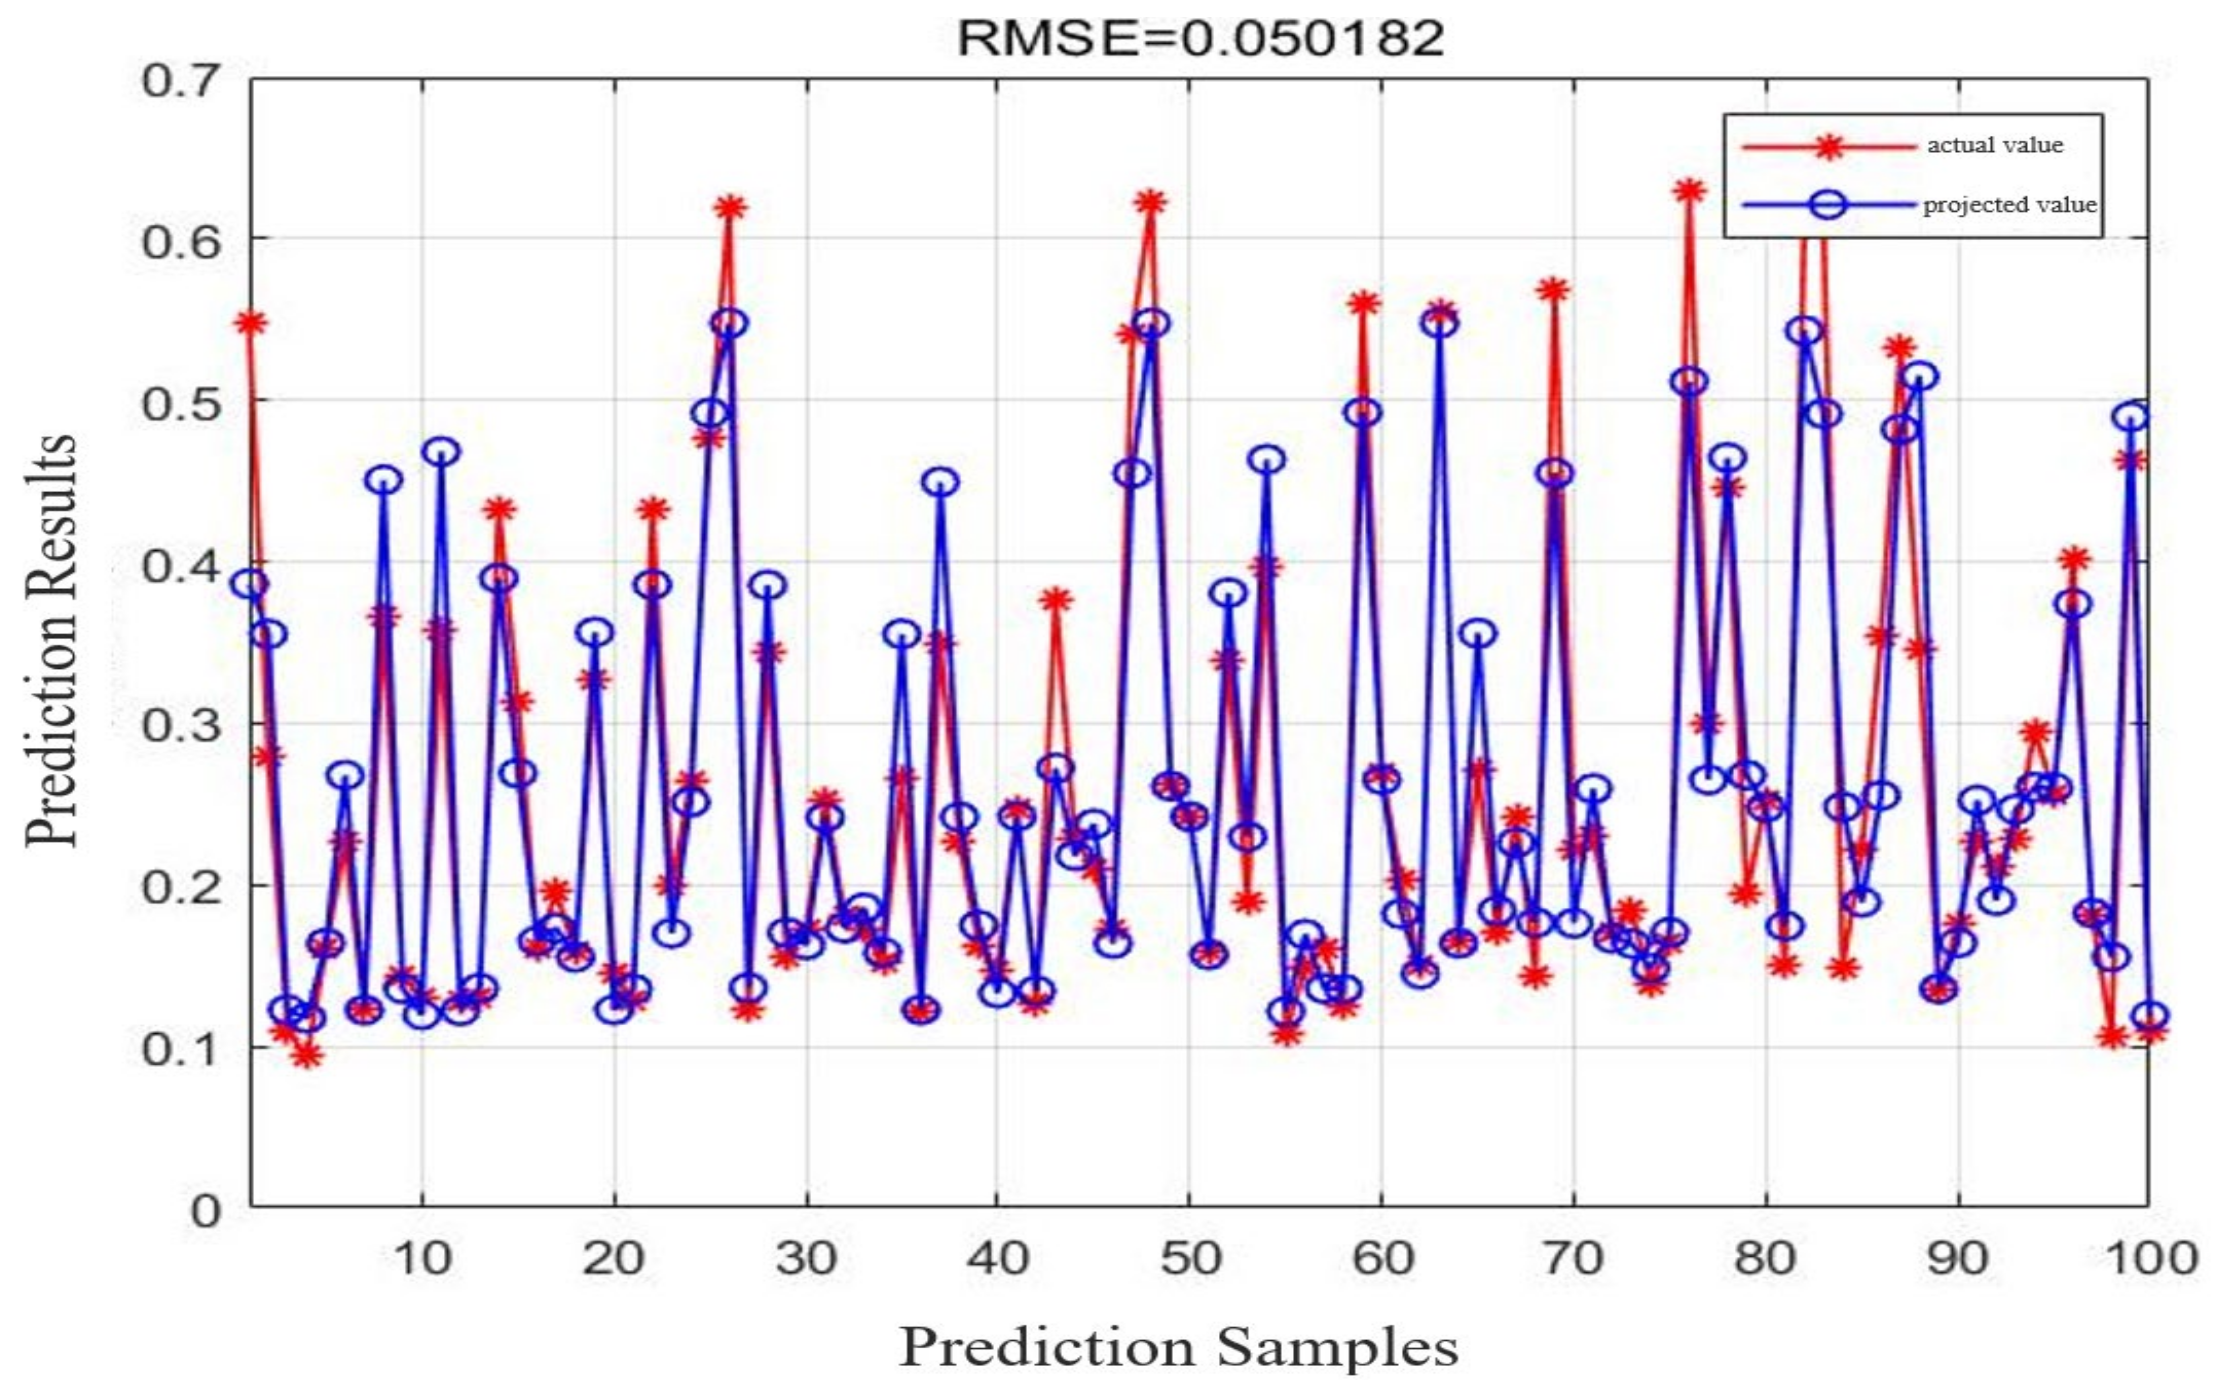
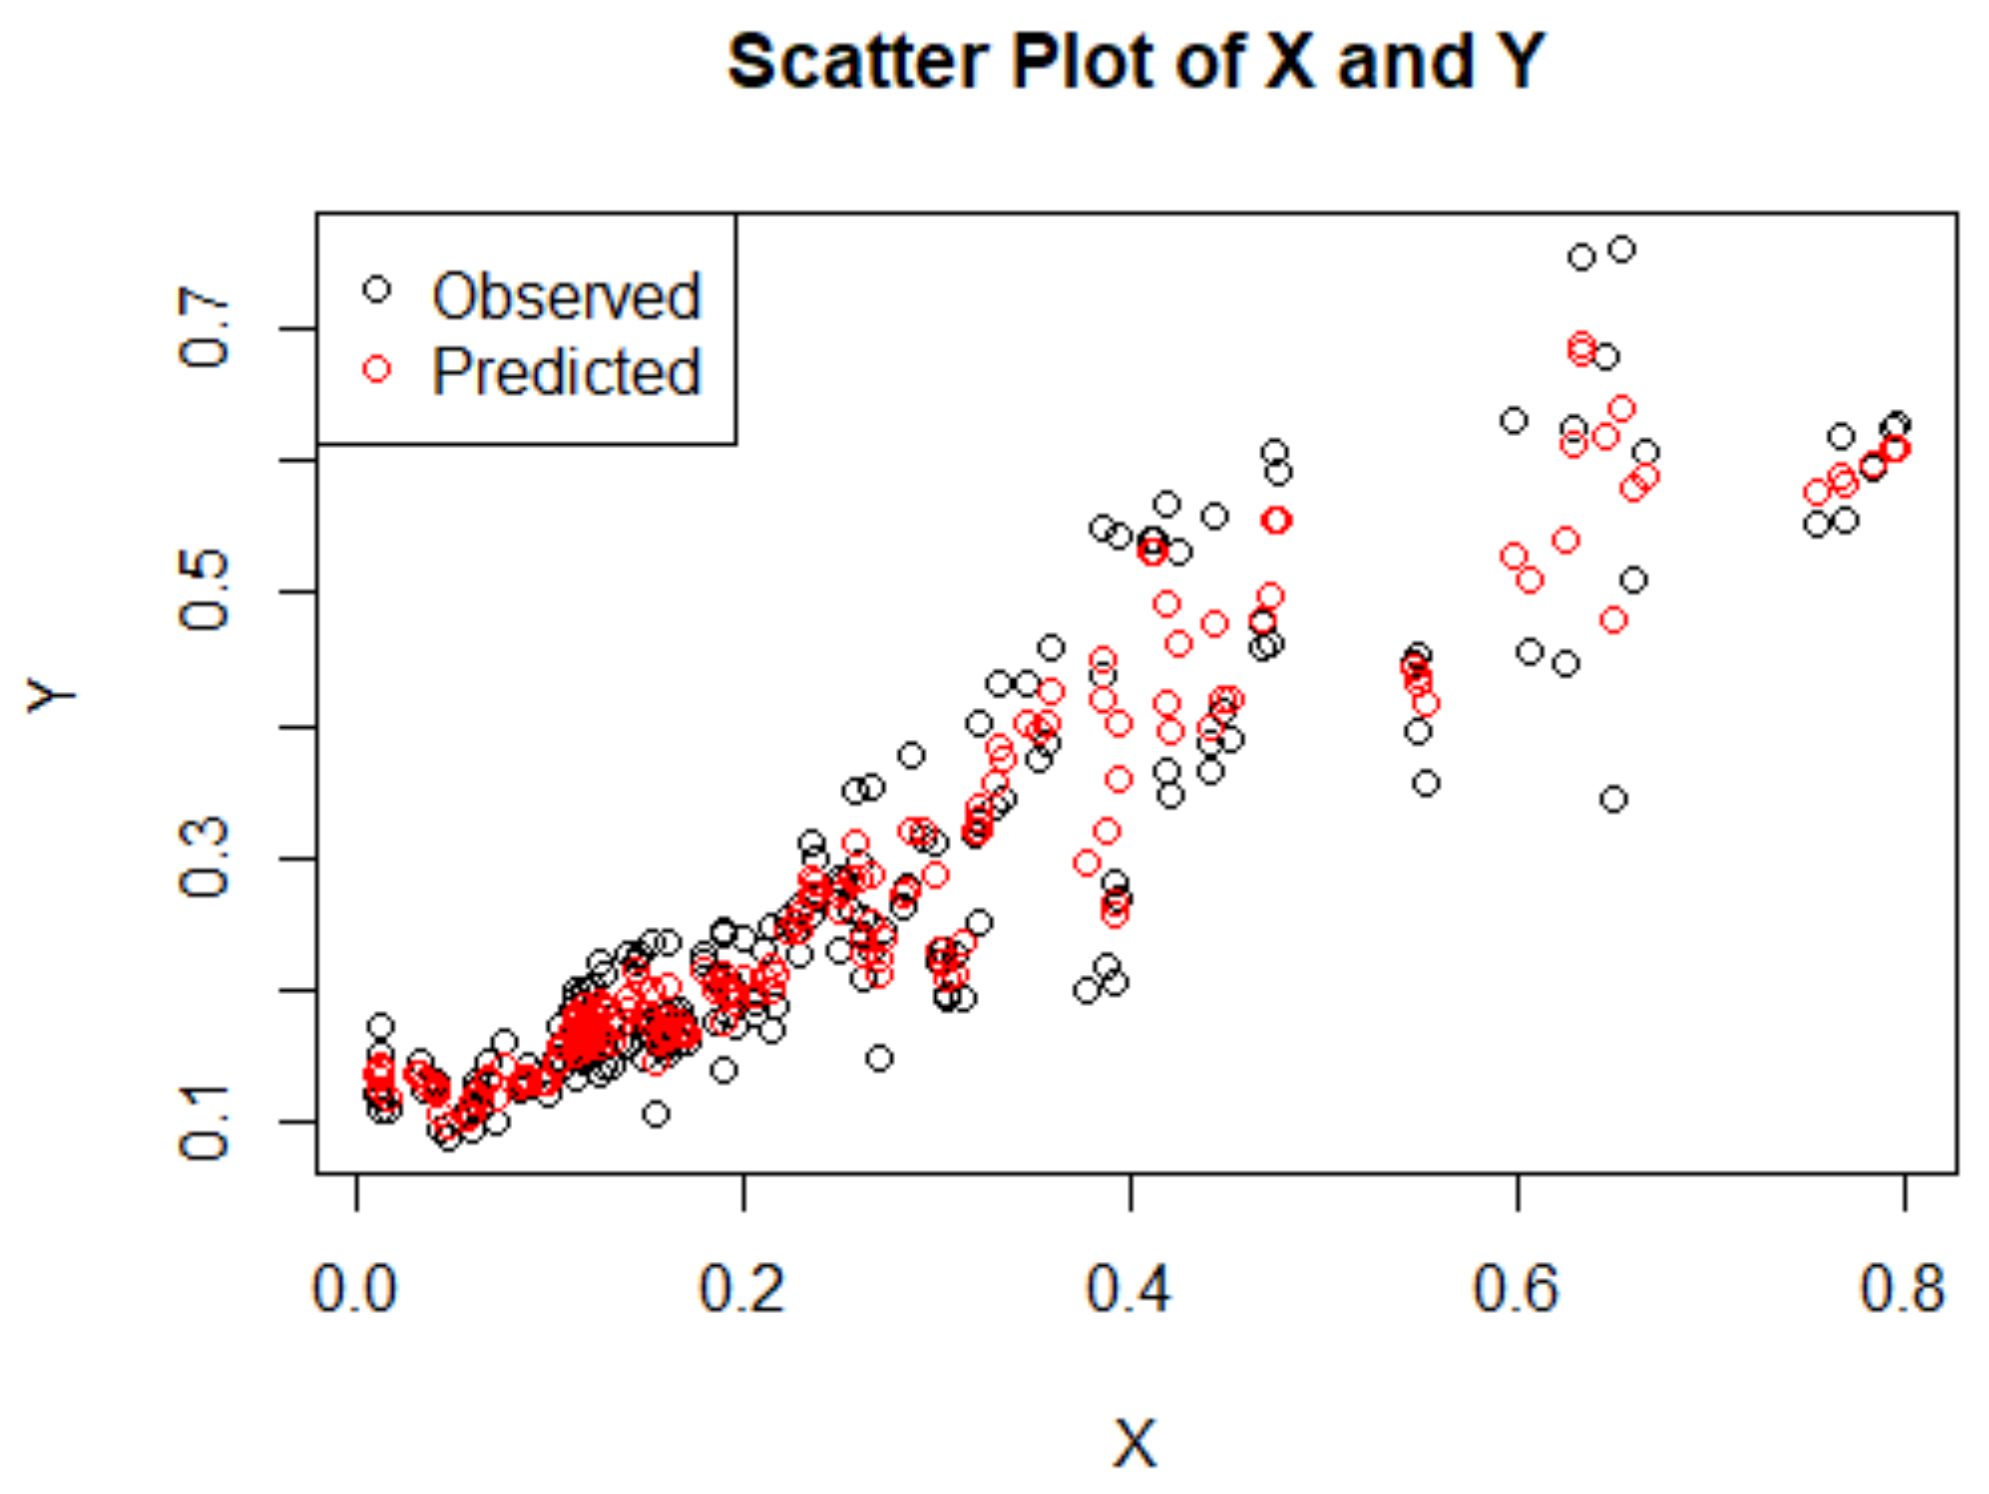
4.1.1. Random Forest Regression Algorithm

Based on the index system for fresh agricultural products’ cold chain logistics and the ecological environment, we adopted the entropy value method for panel data and utilized Stata 16 software to calculate the development levels of fresh agricultural products’ cold chain logistics and the ecological environment from 2015 to 2021 in 30 provinces in China (with some provinces having missing data). Initially, the data were standardized and normalized based on the positive and negative impacts of the indicators. Then, the proportion of the sample values under different indicators relative to the sum of all sample values of the indicators was calculated. Subsequently, we computed the information entropy and information entropy redundancy. Finally, we calculated the weights of the indicators for the purpose of evaluating the development of the cold chain logistics of fresh agricultural products and the development of the ecosystem, along with the composite scores, to determine the development levels of both.
Given the resource interdependence between the ecosystem and the cold chain logistics system (where plants and animals in the ecosystem are participants in the cold chain logistics of fresh agricultural products) and the fact that cold chain logistics generate energy consumption and waste, it is crucial to explore the correlation between the two. Therefore, after obtaining the development levels of the cold chain logistics of fresh agricultural products and the ecological environment, we constructed a random forest regression model using MATLAB 2018 software, following the principles of the random forest regression algorithm.
First, as depicted in Figure 1, the error decreases with the increasing number of decision trees and stabilizes after reaching a value of 60. To ensure robust results, we set the number of decision trees to 100 and the number of input features to 1. Simultaneously, we have a total of 210 samples, with the first 100 samples selected for the training set and the remaining 110 samples allocated to the test set.
Table 2 displays the model’s fitting prediction accuracy. When considering the range of observations and using the MAE and RMSE, smaller values for both metrics indicate better predictive ability of the regression model. It is evident that the MAE and RMSE for this model are relatively small, implying that the random forest model provides better predictive accuracy. Moreover, as revealed by the R2 values, the correlation coefficients are consistently above 0.8 for both the training and test sets, indicating that the random forest regression model exhibits a strong fit and a robust correlation.
Figure 2 and Figure 3 provide a detailed comparison of the results between the training set and test set. The error between the predicted value and the actual value is less than 0.1, with only a few individual predictions displaying relatively larger errors. This outcome suggests that the overall fitting effect is excellent. Consequently, the random forest regression model effectively discerns the relationship between the comprehensive development level of cold chain logistics for fresh agricultural products and the development level of the ecological environment.
Next, this paper generates scatter plots that compare the actual values of the development level of fresh agricultural products’ cold chain logistics and the development level of the ecological environment with the predicted values of the random forest regression, as shown in Figure 4. These plots reveal a positive correlation, signifying that higher levels of comprehensive development in the cold chain logistics of fresh agricultural products are associated with more extensive development in the ecological environment.

4.1.2. XGBoost Algorithm

By applying the XGBoost model settings and utilizing R Studio 3.6.3 software, we input variables x1, x2 …, x13 into the XGBoost model. We also divided the sample set into a test set and a training set. The fitting and prediction effects are illustrated in Figure 5.
The R2 value of the XGBoost model was 0.83872, indicating a strong fit. Upon examining the scatter plots, it was evident that the results of both the random forest regression model and the XGBoost model were positively correlated. This observation aligns with the principles of green supply chain management and green logistics, further confirming the significance of the eco-layout of cold chain logistics. Additionally, the consistency of the conclusions obtained through two different algorithmic models validated the correlation between the two variables.
However, it is worth noting that as the development level of the cold chain logistics system for fresh agricultural products improved, there were a greater number of outliers in the comprehensive development level of the ecological environment. This observation suggests that the advancement of cold chain logistics may have unpredictable impacts on the ecosystem. Thus, further analysis is required in order to explore the relationships among these influencing factors. To uncover the inherent correlation between the two systems, this paper conducts a relationship analysis between the factors of cold chain logistics for fresh agricultural products and the ecological environment.

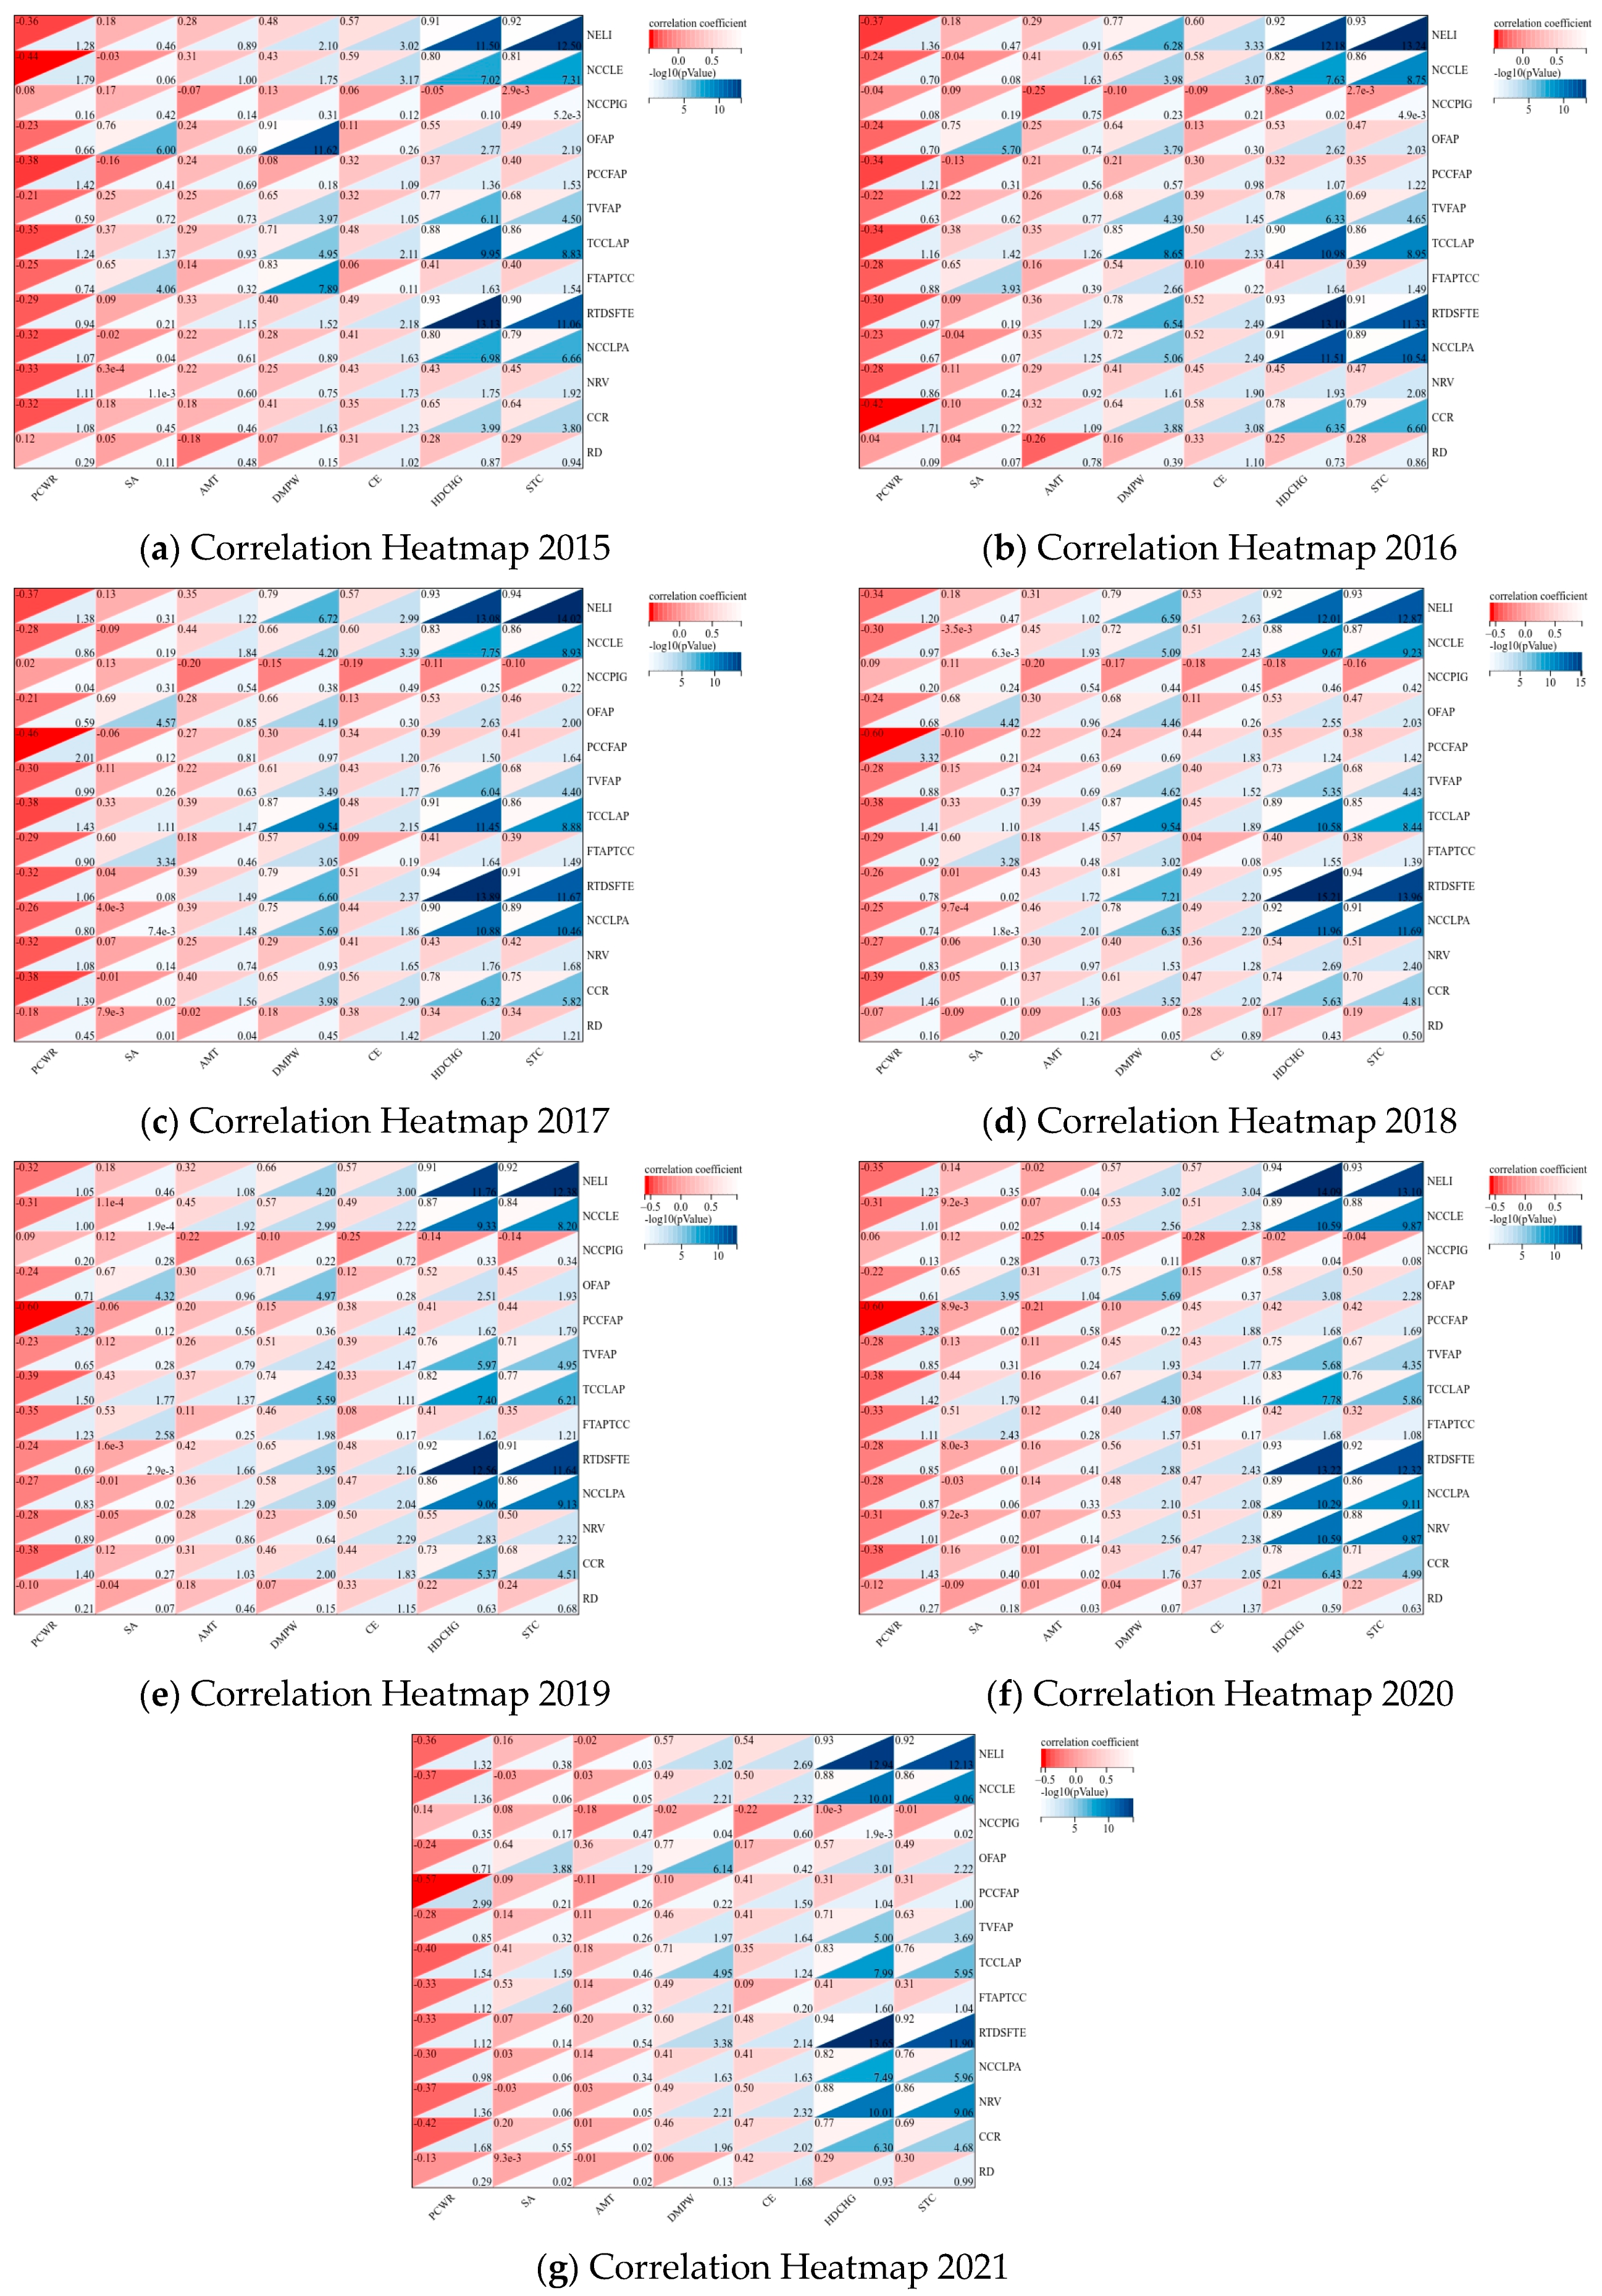
4.2. Relationships between the Cold Chain Logistics of Fresh Agricultural Products and Ecological Environmental Factors

In this paper, Pearson’s correlation coefficient is utilized to examine the relationship between cold chain logistics for fresh agricultural products and ecological environmental factors. Additionally, a visual representation of this correlation is presented in the form of a heatmap, as depicted in Figure 6a–g. The upper triangle displays the resulting correlation coefficients, while the lower triangle shows the -lg (p value). Generally, when p is less than or equal to 0.05, there is a significant relationship between the two indicators. Furthermore, if p is less than or equal to 0.01, it indicates a strong and significant relationship. Mathematical operations reveal that when -lg (p value) is greater than or equal to 1.3, a significant relationship exists between the two factors, and when -lg (p value) is greater than or equal to 2, the relationship is even stronger.
Figure 6a–g shows the correlation heatmaps between the fresh produce cold chain logistics factors and ecosystem factors from 2015 to 2021. By comprehensively assessing Pearson’s correlation coefficients and the p values at a significant level, it becomes evident that the factors within the fresh produce cold chain logistics system exert a more pronounced influence on four ecosystem factors, specifically DMPW, CE, HDCHG, and STC. These four factors significantly impact a broader array of elements. The correlation coefficients between each specific fresh produce cold chain logistics factor and the aforementioned four factors are presented in Table 3, Table 4, Table 5 and Table 6, with nonsignificant factors denoted as “--”.
Combining the data from Figure 6a–g and Table 3, it becomes apparent that the number of factors significantly affecting DMPW in fresh agricultural product cold chain logistics between 2015 and 2021 exhibits an increasing trend. OFAP, TCCLAP, and RTDSFTE, among other indicators, exhibited a strong, significant, positive correlation with DMPW. Notably, NELI, NCCLE, TCCLAP, RTDSFTE, TVFAP, NCCLPA, and CCR showed correlation coefficients that initially increased and then decreased, reaching their maximum values in 2018, while the correlation coefficients of FTAPTCC displayed a significant decreasing trend. In summary, primary pollutant emissions from wastewater are primarily associated with the economic efficiency and technical level of regional fresh produce cold chain logistics.
By analyzing the data from Figure 6a–g and Table 4, which span the years 2015 to 2021, it becomes evident that the factors within the fresh agricultural product cold chain logistics system significantly impacting CE exhibit an increasing trend. Compared to the factors within the same year, the NELI and NCCLE had the most substantial impacts on both the CE and NRV. The correlation coefficient between NRV and CEs significantly increased starting in 2019. The correlation coefficients of the other factors with CEs exhibited slight fluctuations. In summary, CE is strongly correlated with the key elements within the fresh agricultural product cold chain logistics system and with indicators related to economic efficiency.
Examining the data from Figure 6a–g and Table 5, spanning the years 2015 to 2021, it becomes apparent that the number of factors for which CCLFAP has a significant impact on HDCHG is basically the same. NELI, NCCLE, TCCLAP, RTDSFTE, NCCLPA, CCR, and HDCHG exhibited significantly strong positive correlations. Notably, the correlation coefficient between the NRV and HDCHG experienced a substantial surge starting in 2020, with the 2020–2021 correlation coefficient values consistently reaching or exceeding 0.88. Overall, HDCHG displays a high correlation with indicators related to the economic efficiency and technical level of the cold chain logistics of fresh agricultural products.
Combined with Figure 6a–g and Table 6, upon comparing data from different factors within the same years, from 2015 to 2021, it is evident that the NCCLE, TCCLAP, RTDSFTE, and NCCLPA exerted the most significant influence on the STC. The correlation coefficient between the NRV and STC exhibited a significant increase in 2020, and both had correlation coefficients exceeding 0.85 from 2020 to 2021. Overall, there is a high correlation between STC and indices related to the economic efficiency and technical level of fresh agricultural product cold chain logistics.
In summary, this study reveals that the ecological environment system and the factors of the cold chain logistics system interact with each other by examining the correlation between 13 development indicators of cold chain logistics for fresh agricultural products and 7 ecological indicators in 30 provinces from 2015 to 2021. The recent increase in consumer output and production scale has led to the discharge of a substantial amount of wastewater pollutants due to immature refrigeration technology and improper wastewater treatment. The development of cold chain logistics has primarily contributed to the degradation of water resource ecology. The expansion of the cold chain logistics scale inevitably results in increased pollutant emissions, technological advancements, a growing workforce, and the development of patents, which can enhance domestic waste and pollutant management, mitigating ecological deterioration to some extent. The development of cold chain logistics is closely tied to ecological degradation, but external interventions such as technological progress and workforce development can help to slow the degradation trend.
The correlation heatmap reveals the relationship between each factor of fresh agricultural cold chain logistics and each factor of the ecological environment. Each year exhibits different trends. The correlation coefficients of FTAPTCC, NRV, and other factors show significant variation, highlighting the intricate and ever-changing influence of cold chain logistics on the ecological environment of fresh agricultural products. This paper utilizes the GAM model to investigate how CCLFAP factors affect the overall EE.

4.3. Study on the Influencing Factors of the Cold Chain Logistics of Fresh Agricultural Products on the Ecological Environment

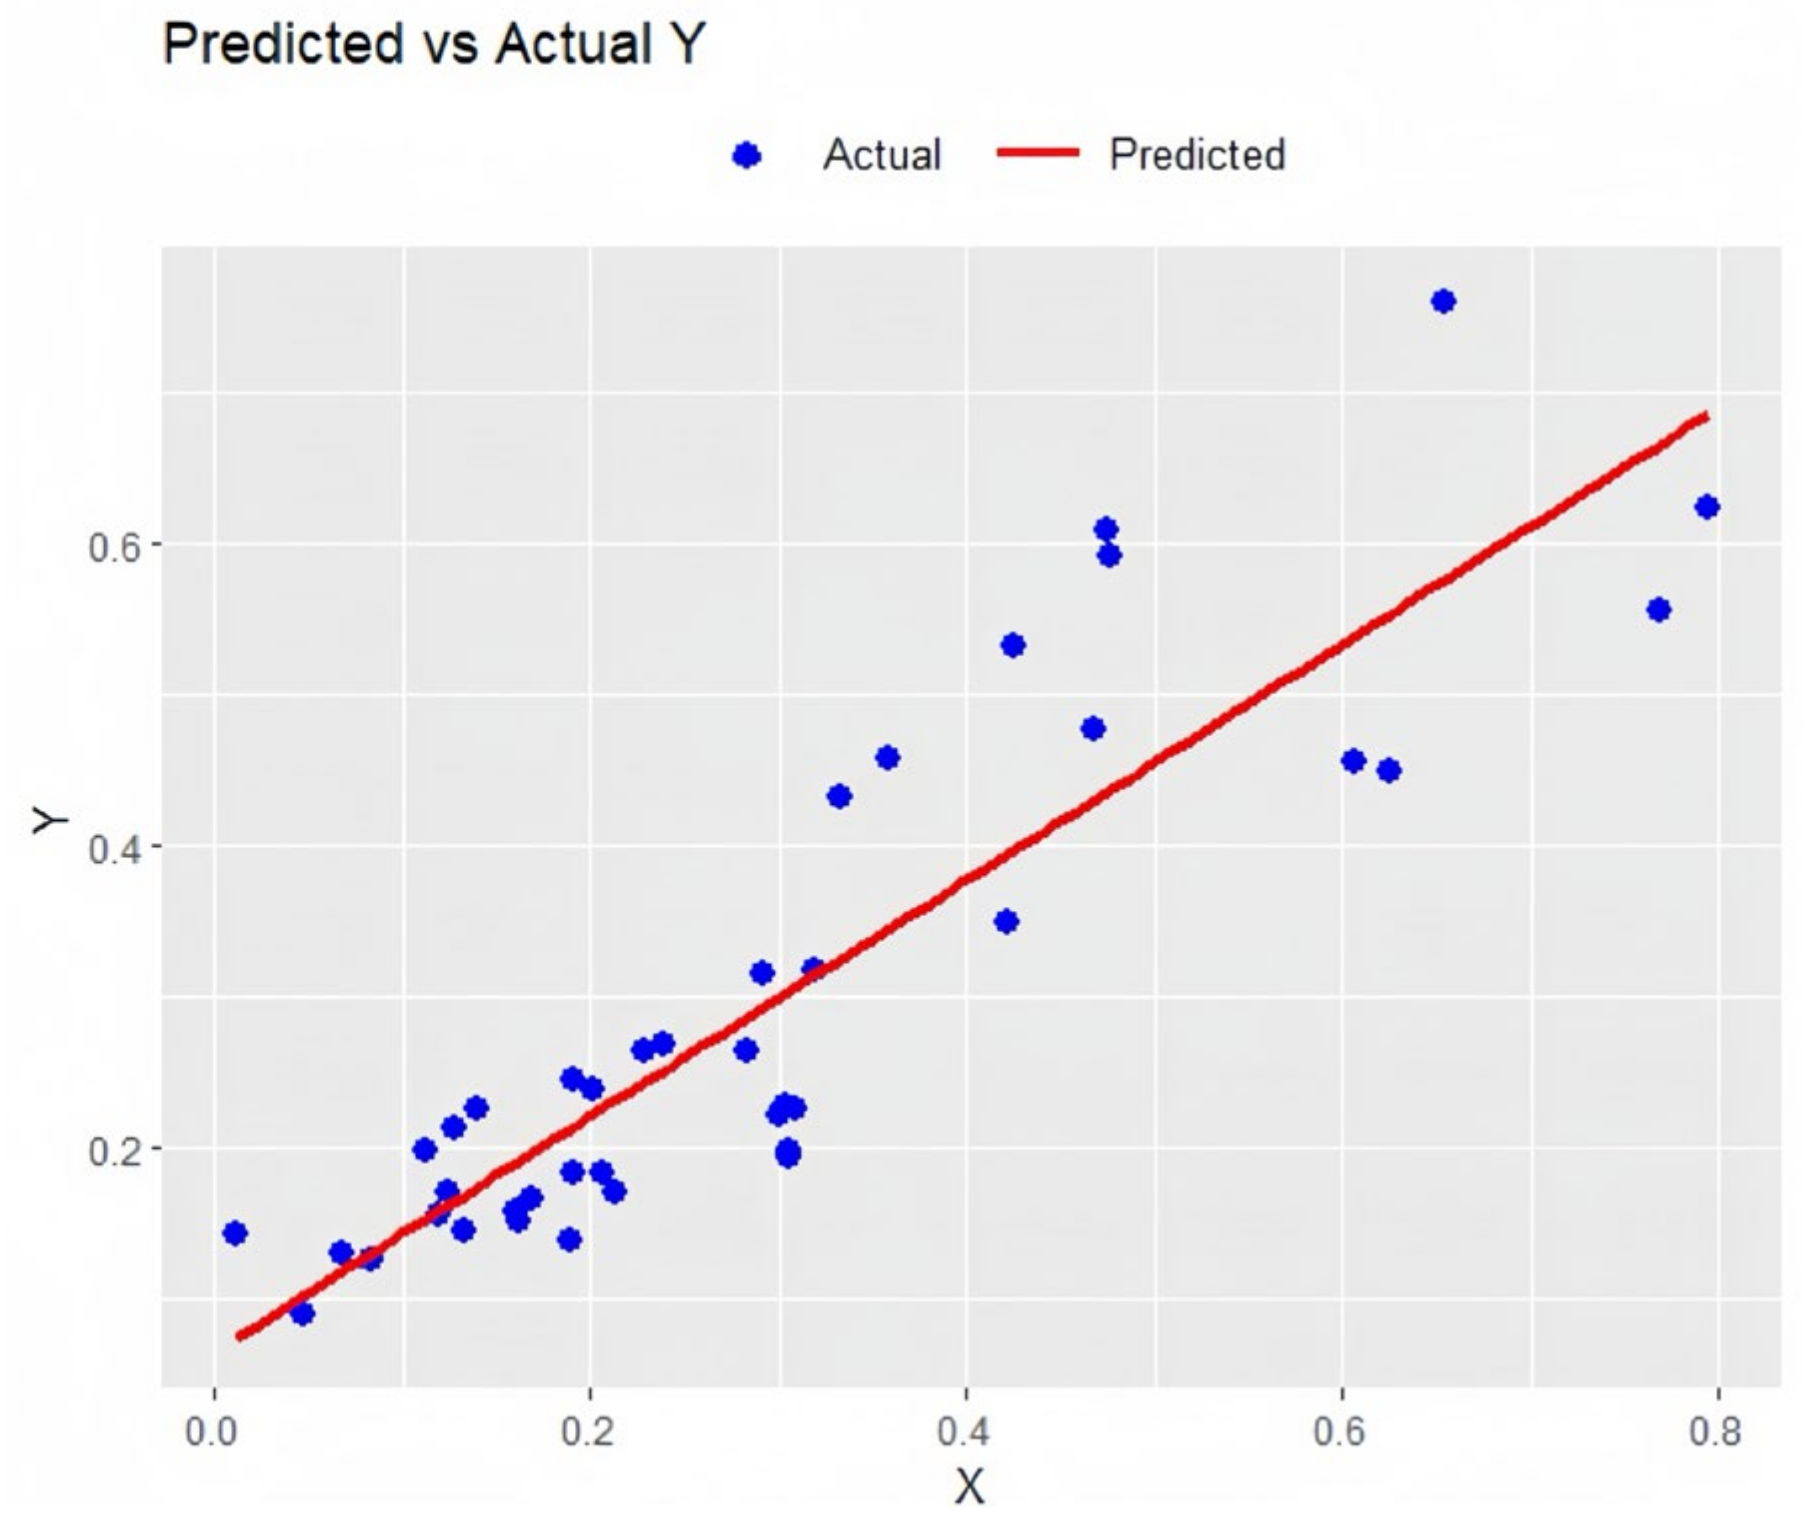
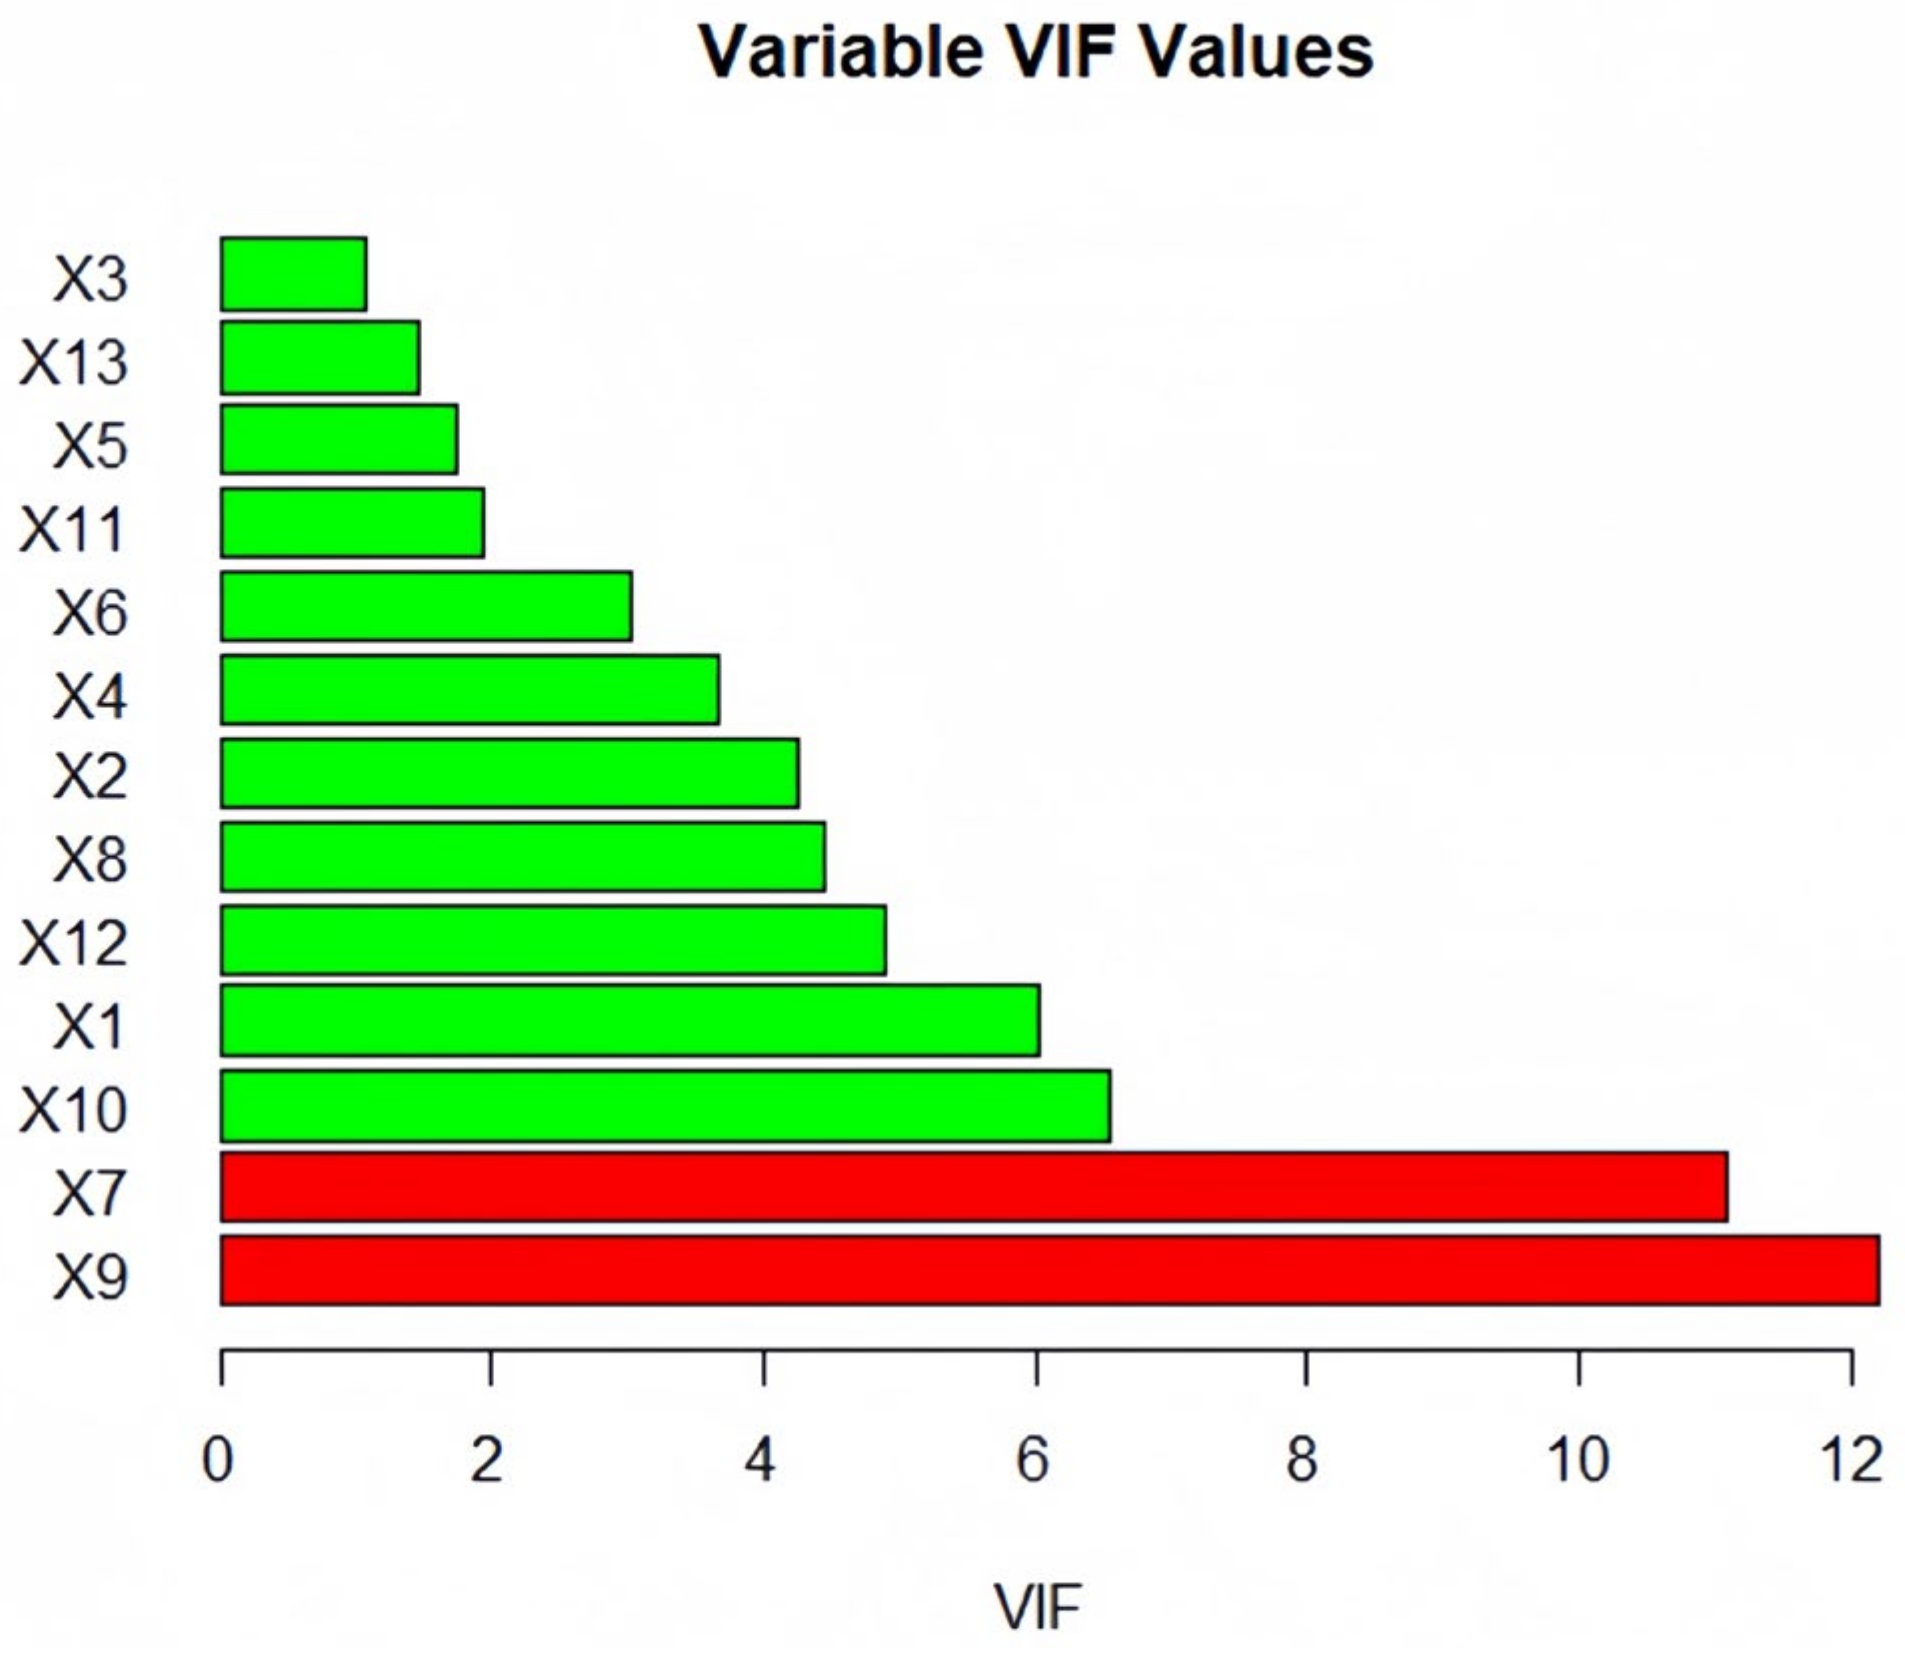
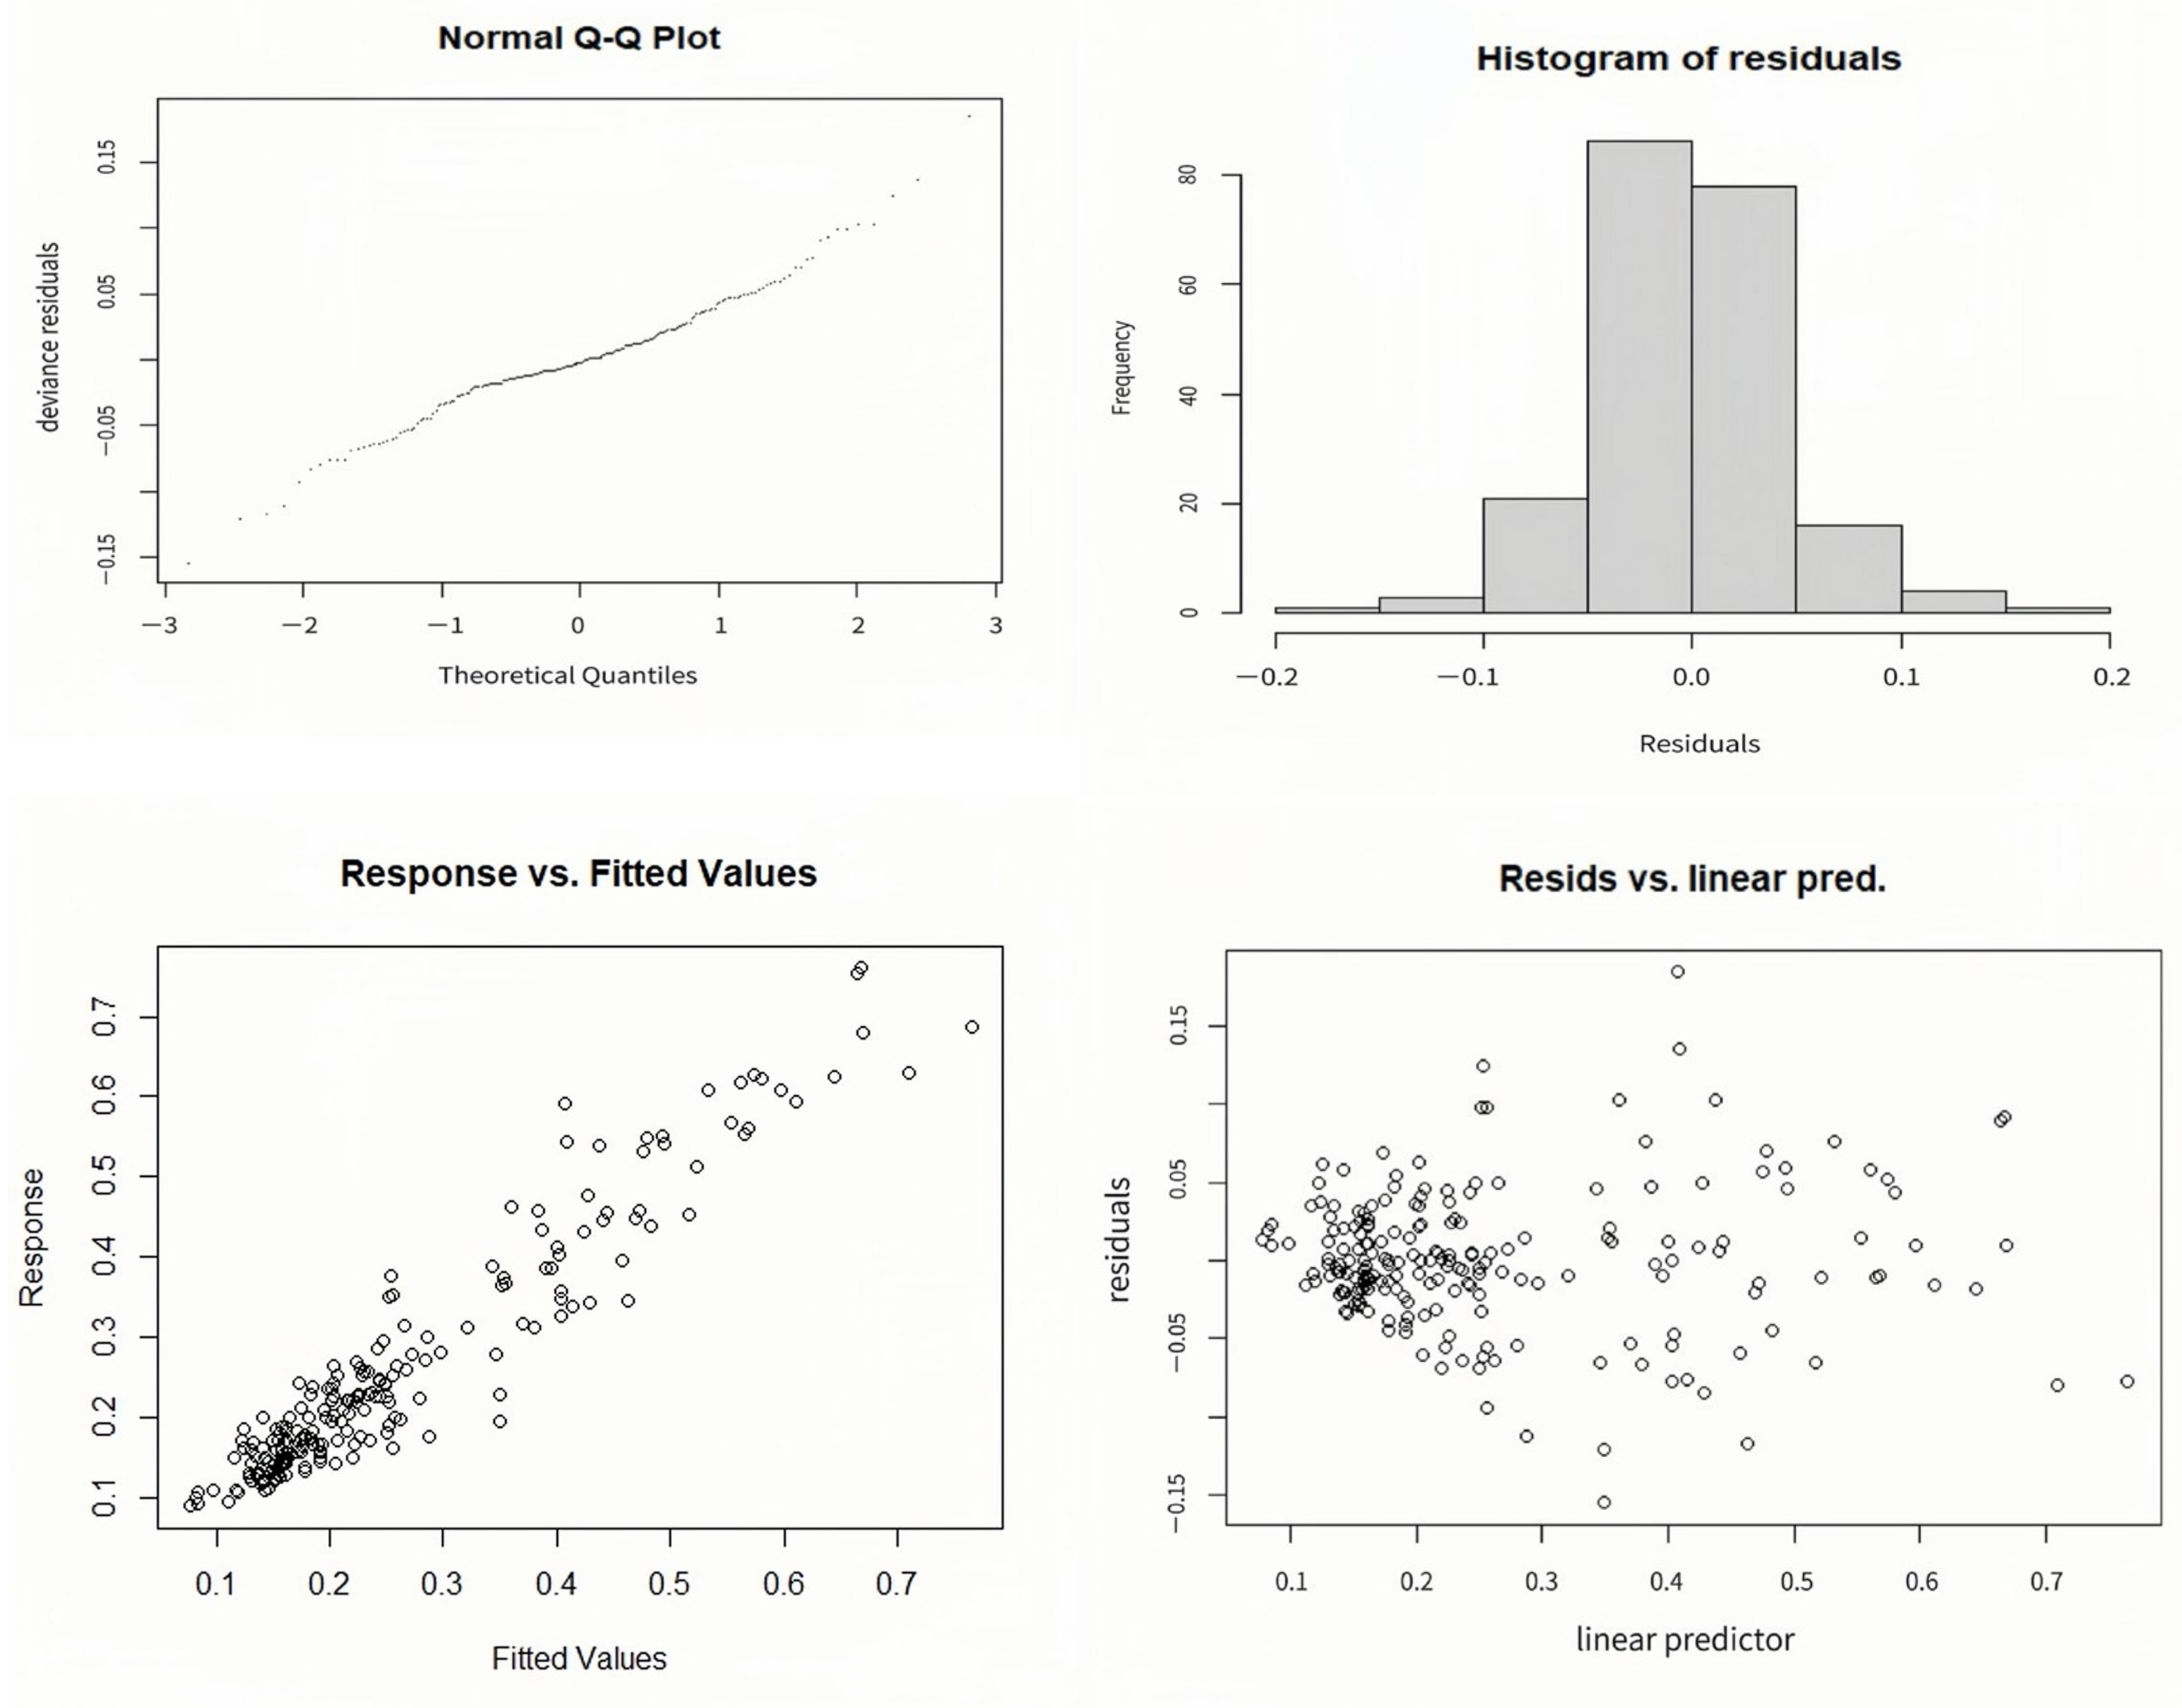
4.3.1. Model Preprocessing and Testing

Before proceeding with GAM modeling, it is crucial to assess whether there is multicollinearity among the selected variables. This paper employs R Studio 3.6.3 to determine this using the variance inflation factor (VIF). A variance inflation factor exceeding 10 indicates severe multicollinearity in the regression model. According to diagnostic criterion for covariance, a variance inflation factor less than 10 is acceptable when the tolerance of independent variables exceeds 0.1. Thus, from Figure 7, where VIF values greater than 10 are displayed in red and those less than or equal to 10 are shown in green, the variables TCCLAP (X7) and RTDSFTE (X9) have VIF greater than 10. Consequently, these variables are eliminated to avoid the influence of multicollinearity on the GAM results.
Subsequently, this paper constructs a GAM model using R Studio 3.6.3 and tests the residuals of each factor of the ecological environment system and the cold chain logistics of fresh agricultural products. The results are shown in Figure 8. The residual quantile-quantile plots and histograms indicate that the data satisfy a normal distribution. The fitted values in the graph demonstrate that the fitted values in the model align well with the corresponding variables. The scatter distribution of the residual values is relatively random. In summary, the model for the influencing factors of the ecological environment and cold chain logistics of fresh agricultural products exhibits a good fit.

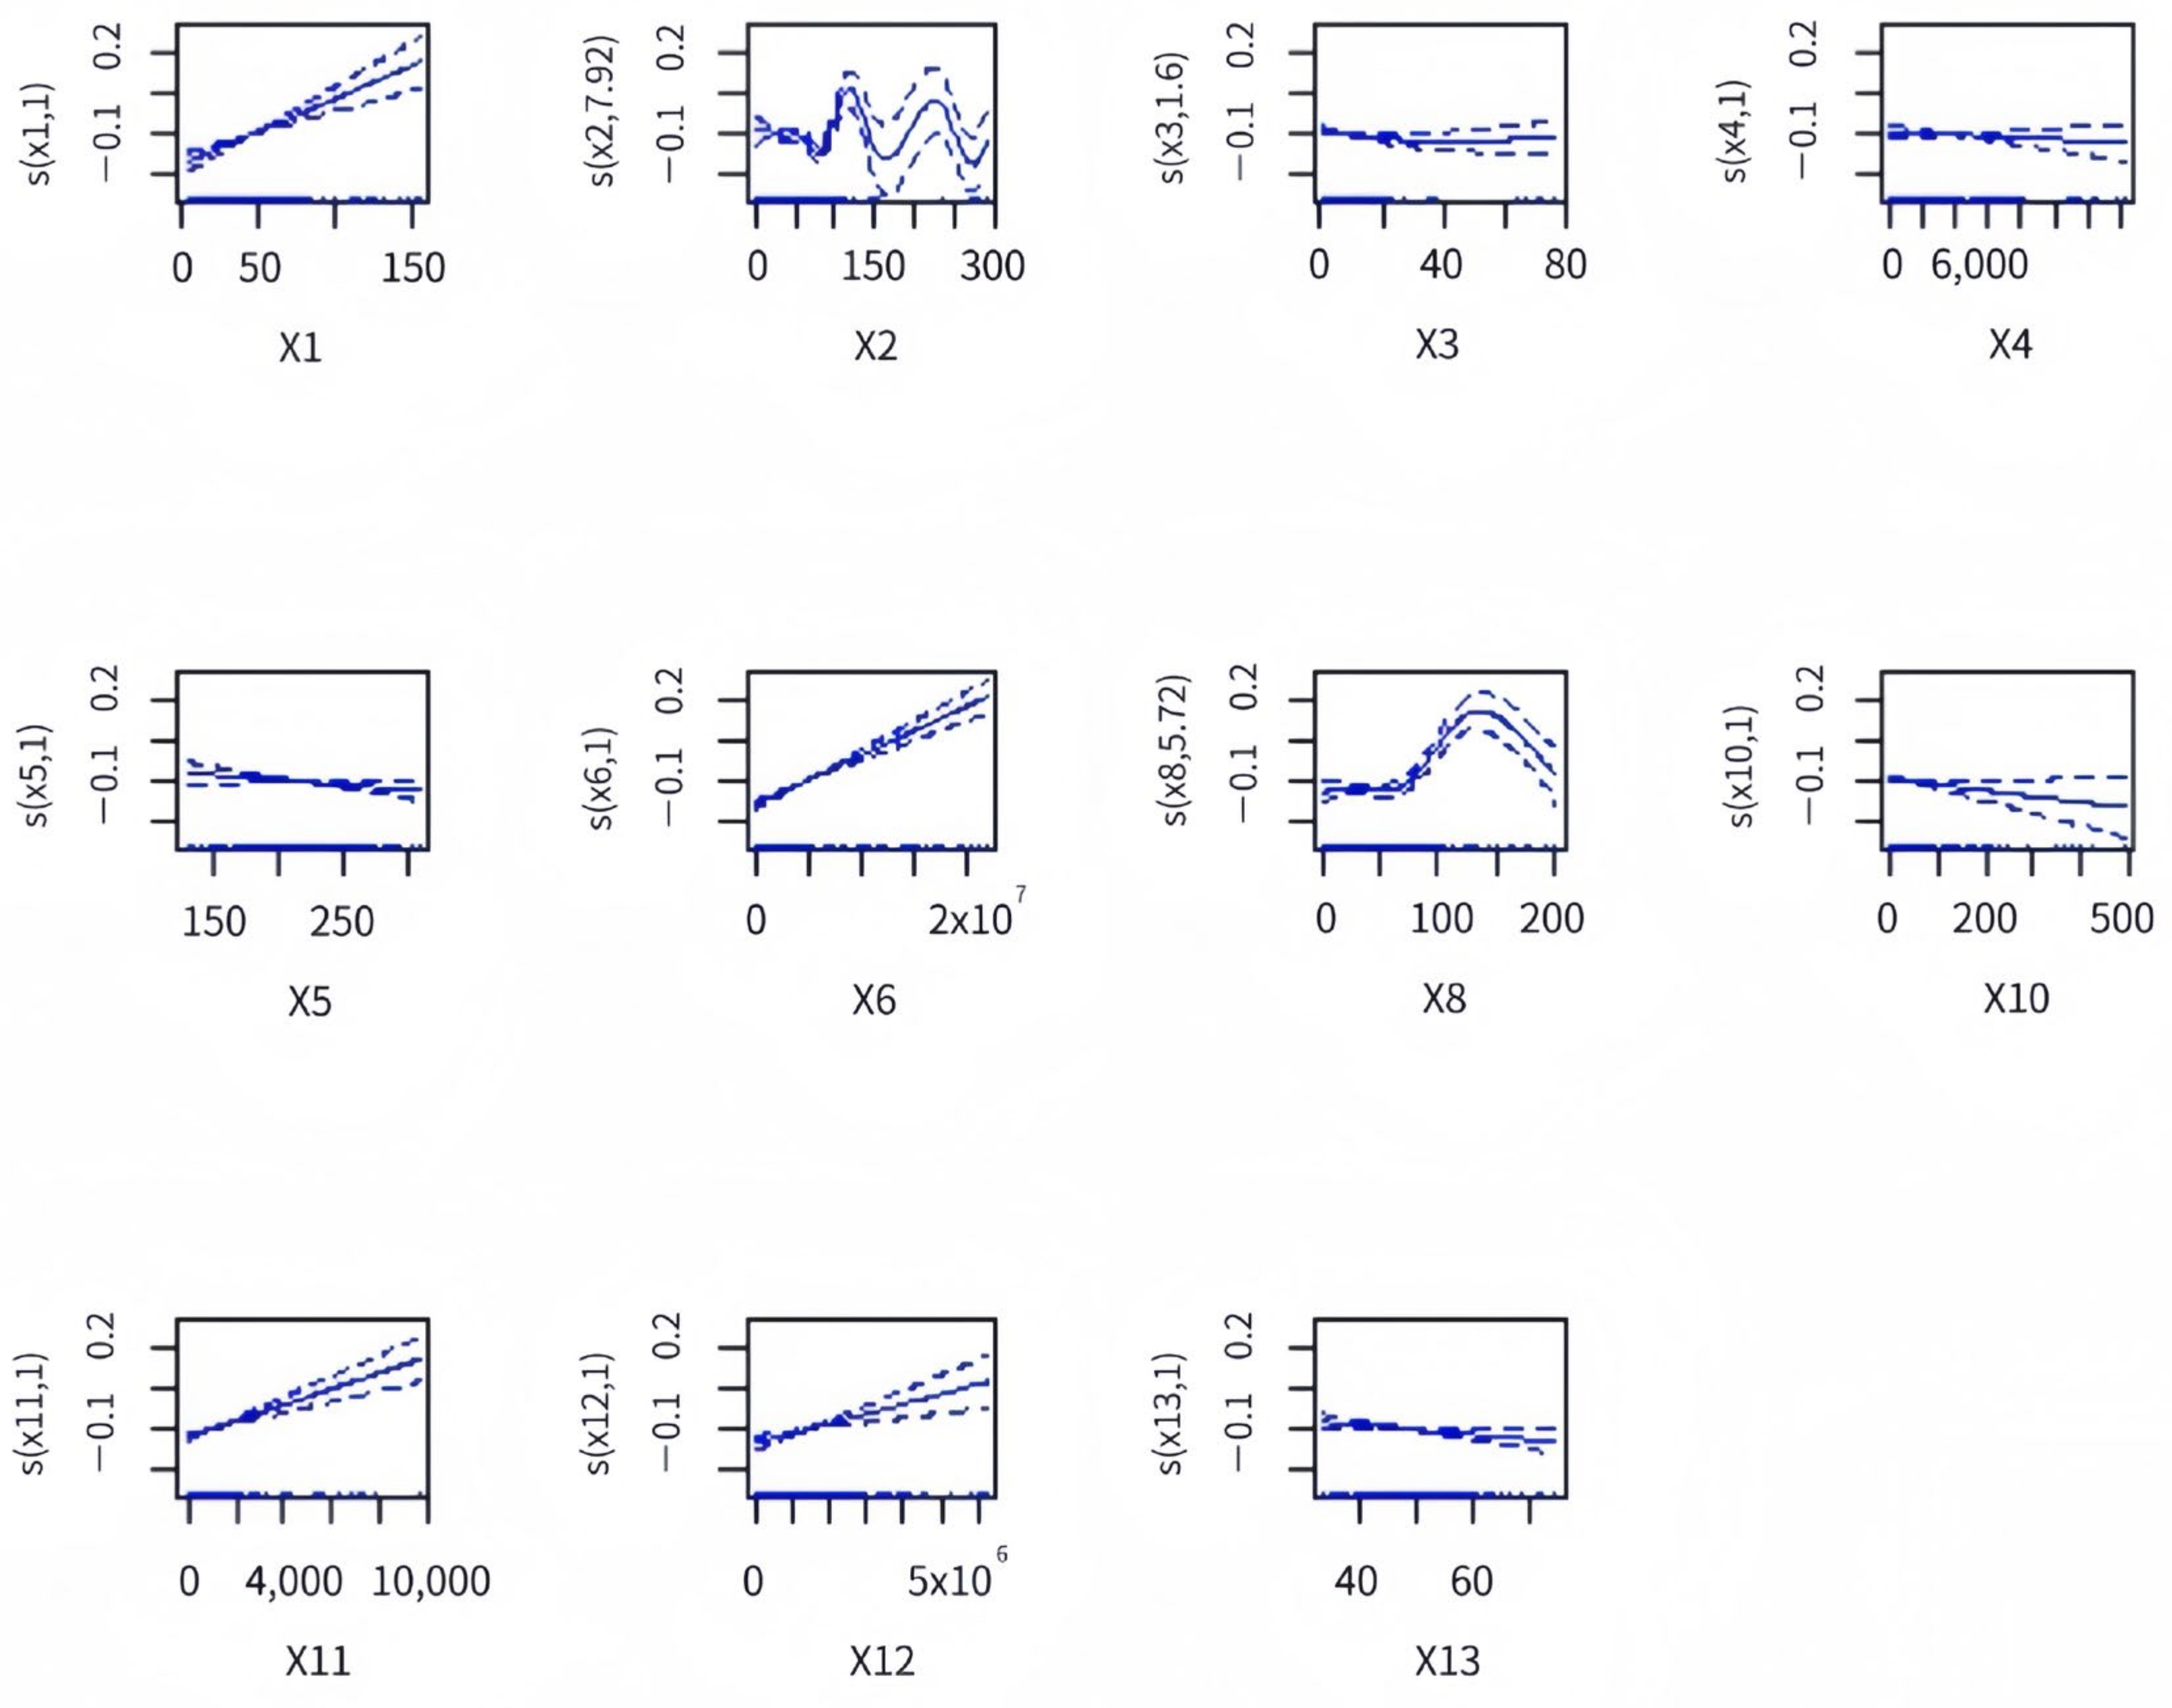
4.3.2. Analysis of the Results Based on GAM

To delve deeper into the linear and nonlinear relationships between the factors of the ecological environment system and agricultural product cold chain logistics, a multivariate GAM model is further analyzed. The R2 value of 0.899 for the model indicates a strong fitting effect, meaning that the model is highly capable of capturing the trends in the data [54]. The relevant simulation results are presented in Table 7:
According to the results, the NELI, NCCLE, PCCFAP, TVFAP, FTAPTCC, NCCLPA, NRV, CCR, and RD all passed the significance test (p < 0.1). p < 0.1 indicates at least 90% certainty, i.e., a certain factor of CCLFAP has a significant impact on EE. This means that, in addition to NCCPIG and OFAP, other factors greatly impact the ecological environment system, and the results of GAM are statistically significant. Overall, it is more consistent with the results of previous studies [3]. However, for NCCPIG, it is inconsistent with the findings of some studies. A possible reason is that some policies are proposed to focus only on the operational aspects of CCLFAP and do not consider the EE. For OFAP, this means that the current production model is environmentally sound again, and it is more the case that the other aspects of CCLFAP cause the EE or that the EE impacts are counteracted in the production aspects.
Based on the best-fit model obtained, the smoothed regression function for each factor of the cold chain logistics of fresh agricultural products was used to create a graphical representation of the impact of these factors on the ecological environment system using RStudio, as shown in Figure 9. In this figure, the solid line represents the smoothed fitting curve for the impact of cold chain logistics on agricultural products on the ecological environment system, and the dashed line represents the point-by-point standard deviation of the fitted additive function (the upper and lower bounds of the confidence interval). A wider gap between the dashed lines indicates greater random perturbation. The horizontal axis represents the actual value of the independent variable, and the vertical axis shows the smoothed fitted value of the impact of cold chain logistics factors on the ecological environment system. The values in parentheses on the vertical axis indicate the estimated degrees of freedom of the function.
Combining the results from Table 7 and Figure 9, it becomes clear that the impacts of NCCPIG (X3) and OFAP (X4) on the ecological environment system failed to reach statistical significance. This indicates that NCCPIG and OFAP, indicators of governmental concern and industry size, respectively, might play a greater role in influencing industry development rather than having a direct connection with the EE. Alternatively, a negative relationship between the two may exist, but the influence is less strong, or other influences also interfere.
Conversely, the influence of NELI (X1) on the ecological environment was significantly more marked, displaying a positive correlation. This may be attributed to the possibility that higher employment levels could signify enhance management efficiency or potential for technological advancement, which in turn might positively affect EE through technological improvements, efficient logistics management, and effective talent acquisition. This is consistent with the conclusions of He et al. and supports the idea of ecological modernization theory [36,55].
The impact of NCCLE (X2) on the ecological environment system was found to be more complex. The analysis indicated that an increase in NCCLE initially contributes positively to the ecological environment by improving logistics efficiency and reducing ecological footprint. However, as the market becomes saturated, the competition forces enterprises to adopt environmentally detrimental technologies, leading to increased energy consumption and emissions. This underscores a nuanced, non-linear relationship between NCCLE growth and its ecological consequences. This is consistent with the environmental Kuznets curve and expands on the study of Babagolzadeh et al. more explicitly [21].
PCCFAP (X5) displays a slight negative correlation with the ecological environment system, suggesting that as the per capita consumption of fresh agricultural products rises, there is greater pressure on the ecological environment, albeit with a low impact coefficient. This indicates that heightened consumption may result in an overuse of resources and increased environmental pressures, although this effect is not evident.
TVFAP (X6) shows a significant positive correlation with the ecological environment and experiences minimal disturbance. In essence, a higher trading volume of fresh agricultural commodities correlates with improved ecological development. Increased turnover means optimized market efficiency along with standardization of product packaging and distribution, which can reduce resource waste and environmental pressure [56].
FTAPTCC (X8) has a relatively intricate impact on the ecological environment system. For values below 70, the impact is weak, but between 70 and 170, there is a noteworthy positive correlation. Beyond 170, a significant negative correlation emerges, indicating that heightened freight turnover may lead to a decline in ecological environment quality. This implies that, at low to moderate turnover levels, an increase in turnover can enhance transport efficiency and reduce waste. However, when turnover reaches a certain scale, the adverse effects of increased energy losses and emissions may outweigh the benefits [57].
NCCLPA (X10) demonstrated a negative correlation with the ecological environment system, suggesting that patent applications in cold chain logistics might not adequately consider ecological impacts and could potentially introduce environmentally harmful substances. Additionally, the deployment of innovative technologies might be delayed, or may not achieve the desired results, thereby postponing their environmental benefits [58].
NRV (X11) and CCR (X12) showed significant positive correlations with the ecological environment system, indicating that an increase in refrigerated trucks and cold storage capacity not only helps to preserve fresh agricultural products, but also diminishes environmental impact. This highlights the crucial role of infrastructure development in reducing food wastage and enhancing resource efficiency. Nonetheless, the effect of CCR on the ecological environment diminishes with increase, and the ecosystem experiences a greater random effect from NRV (X11). Beyond a certain point of infrastructure development, the beneficial impact on environmental protection becomes insufficient.
Lastly, RD (X13) was negatively correlated with ecosystem development, indicating that increased road density leads to more traffic and higher carbon emissions, thus inflicting considerable environmental harm. Cold chain logistics requires not only the transportation of commodities, but also the continuous supply of electricity to maintain a low-temperature environment during transportation, leading to increased energy consumption and carbon emissions. In addition, the construction of roads requires a significant amount of natural resources. This further confirms the validity of previous studies [25,26].

5. Conclusions

This study collected data on each index through authoritative information such as the China Statistical Yearbook, and the results show that the greater the level of comprehensive development of fresh agricultural product cold chain logistics, the greater the level of comprehensive development of the ecological environment. The economic benefits and technical level of the fresh agricultural product cold chain logistics system are closely related to the ecological pressure and ecological response of the ecological environment system. Among these factors, the NELI, NRV, TVFAP, and CCR are significantly positively correlated with the EE; the PCCFAP, NCCLPA, and RD are significantly negatively correlated with the EE; and the effects of the NCCLE and FTAPTCC on the EE fluctuate. To promote more harmonious development of cold chain logistics for fresh agricultural products and the ecological environment, we propose the following suggestions:
  • Supporting the construction of cold chain logistics facilities and equipment. The construction of cold chain logistics facilities and equipment should be improved by focusing on refrigerated vehicles and cold rooms, and these facilities should comply with the requirements of construction and operation standards to provide a stable storage environment for fresh agricultural products. At the same time, it is necessary to pay attention to equipment supervision and to comprehensively consider the economic benefits and consumption outputs of facilities and equipment, such as carbon emissions and waste emissions, as well as the timely replacement of obsolete equipment.
  • Scientific and technological innovation should be strengthened in low-pollution cold chain logistics. Innovations in low-pollution cold storage, transportation, temperature monitoring, and packaging technologies should be encouraged. Specifically, enterprises can adopt biodegradable and environmentally friendly packaging, new energy-saving temperature-controlled transportation vehicles, new energy sources to provide energy technology, and the re-creation of recycled materials. In addition, the training of such innovative cold chain logistics personnel should be strengthened.
  • The marketization of cold-chain logistics for fresh agricultural products should be promoted by moderately increasing the number of participating entities, promoting market competition, and sharing the social responsibility of corporate environmental protection. The construction of a green certification system can be carried out to certify and reward enterprises that comply with environmental protection standards, through which the images of enterprises can be upgraded and their market competitiveness enhanced. In addition, associations and enterprises are encouraged to expand the scope of service business, explore and promote the integrated service model, and realize the efficient management of fresh agricultural products and cold chain logistics. Thus, service quality will be improved and the market scale will be expanded.
  • The formulation of policies on green fresh produce cold chain logistics should be strengthened, and through policy guidance and standard-setting, the main parties involved in fresh produce cold chain logistics can be encouraged to maintain the most favorable practices for the ecological environment in the face of market competition or consumption growth. At the same time, the transportation network of fresh produce cold chain logistics should be optimized so as not to blindly expand the roads, and the empty rate of transportation vehicles should be reduced by decreasing the rate of transportation vehicles, etc., under the condition of maintaining an appropriate freight turnover. This will reduce pollution of the environment.
The above suggestions can provide enterprises with guidelines for the future direction of cold chain logistics innovation and the optimization of operation strategies, and can provide the government with references for cold chain logistics policy making and infrastructure construction planning. Although this study can improve the environmental friendliness of the cold chain logistics of fresh agricultural products, it also has limitations and does not take into account the different characteristics of each region. Future research can further combine regional characteristics to show the relationship between fresh produce cold chain logistics and the ecological environment in a more explicit way, as well as to propose differentiated policy suggestions for each region.

Author Contributions

Y.Z.: conceptualization, software, writing—original draft. X.F.: methodology, funding acquisition, writing—review and editing. Y.C.: data curation, visualization, writing—review and editing. J.X.: formal analysis, writing—review and editing. All authors have read and agreed to the published version of the manuscript.

Funding

This research was funded by National Social Science Foundation of China (22BGL166).

Institutional Review Board Statement

Not applicable.

Data Availability Statement

Data will be made available upon request.

Conflicts of Interest

The authors declare that they have no known competing financial interests or personal relationships that could have appeared to influence the work reported in this paper.

References

  1. Zhang, Y.; Li, C.; Yao, S. Spatiotemporal evolution characteristics of China’s cold chain logistics resources and agricultural product using remote sensing perspective. Eur. J. Remote Sens. 2021, 54, 275–283. [Google Scholar] [CrossRef]
  2. Yu, Y.; Xiao, T. Analysis of cold-chain service outsourcing modes in a fresh agri-product supply chain. Transport. Res. Part E Log. Transport. Rev. 2021, 148, 102264. [Google Scholar] [CrossRef]
  3. Zhang, Y.; Fan, X.; Ma, Y.; Sun, Y. Spatial impacts of cold chain logistics for fresh agri-products on carbon emissions. Transp. Res. Part D Transp. Environ. 2022, 113, 103525. [Google Scholar] [CrossRef]
  4. White, A.; Lockyer, S. Removing plastic packaging from fresh produce—What’s the impact? Nutr. Bull. 2020, 45, 35–50. [Google Scholar] [CrossRef]
  5. Schwarz, A.E.; Lensen, S.M.C.; Langeveld, E.; Parker, L.A.; Urbanus, J.H. Plastics in the global environment assessed through material flow analysis, degradation and environmental transportation. Sci. Total Environ. 2023, 875, 162644. [Google Scholar] [CrossRef] [PubMed]
  6. Wu, D.; Zhou, D.; Zhu, Q.; Wu, L. Industrial structure optimization under the rigid constraint of carbon peak in 2030: A perspective from industrial sectors. Environ. Impact Assess. Rev. 2023, 101, 107140. [Google Scholar] [CrossRef]
  7. Zhang, X.R. Super cold chain-a high quality, energy-efficient, and environment-friendly method. Int. J. Energy Res. 2017, 41, 1225–1228. [Google Scholar] [CrossRef]
  8. Heard, B.R.; Miller, S.A. Critical Research Needed to Examine the Environmental Impacts of Expanded Refrigeration on the Food System. Environ. Sci. Technol. 2016, 50, 12060–12071. [Google Scholar] [CrossRef] [PubMed]
  9. Khan, A.U.; Ali, Y. Sustainable supplier selection for the cold supply chain (CSC) in the context of a developing country. Environ. Dev. Sustain. 2021, 23, 13135–13164. [Google Scholar] [CrossRef]
  10. Fichtinger, J.; Ries, J.M.; Grosse, E.H.; Baker, P. Assessing the environmental impact of integrated inventory and warehouse management. Int. J. Prod. Econ. 2015, 170, 717–729. [Google Scholar] [CrossRef]
  11. Chauhan, C.; Dhir, A.; Akram, M.U.; Salo, J. Food loss and waste in food supply chains. A systematic literature review and framework development approach. J. Clean. Prod. 2021, 295, 126438. [Google Scholar] [CrossRef]
  12. Bai, Q.; Gong, Y.; Jin, M.; Xu, X. Effects of carbon emission reduction on supply chain coordination with vendor-managed deteriorating product inventory. Int. J. Prod. Econ. 2019, 208, 83–99. [Google Scholar] [CrossRef]
  13. Stellingwerf, H.M.; Kanellopoulos, A.; van der Vorst, J.G.A.J.; Bloemhof, J.M. Reducing CO2 emissions in temperature-controlled road transportation using the LDVRP model. Transport. Res. Part D Transport Environ. 2018, 58, 80–93. [Google Scholar] [CrossRef]
  14. Sun, X.; Gao, L.; Lan, Y. Analysis of the efficiency of China’s cold chain logistics enterprises from the perspective of green supply chain. IOP Conf. Ser. Earth Environ. Sci. 2019, 440, 032140. [Google Scholar] [CrossRef]
  15. Amini, M.H.; Kargarian, A.; Karabasoglu, O. ARIMA-based decoupled time series forecasting of electric vehicle charging demand for stochastic power system operation. Electr. Power Syst. Res. 2016, 140, 378–390. [Google Scholar] [CrossRef]
  16. Acquaye, A.; Feng, K.; Oppon, E.; Salhi, S.; Ibn-Mohammed, T.; Genovese, A.; Hubacek, K. Measuring the environmental sustainability performance of global supply chains: A multi-regional input-output analysis for carbon, sulphur oxide and water footprints. J. Environ. Manag. 2017, 187, 571–585. [Google Scholar] [CrossRef]
  17. Gardas, B.B.; Raut, R.D.; Narkhede, B. Evaluating critical causal factors for post-harvest losses (PHL) in the fruit and vegetables supply chain in India using the DEMATEL approach. J. Clean. Prod. 2018, 199, 47–61. [Google Scholar] [CrossRef]
  18. Sadollah, A.; Nasir, M.; Geem, Z.W. Sustainability and Optimization: From Conceptual Fundamentals to Applications. Sustainability 2020, 12, 2027. [Google Scholar] [CrossRef]
  19. Sun, S.K.; Lu, Y.J.; Gao, H.; Jiang, T.T.; Du, X.Y.; Shen, T.X.; Wu, P.T.; Wang, Y.B. Impacts of food wastage on water resources and environment in China. J. Clean. Prod. 2018, 185, 732–739. [Google Scholar] [CrossRef]
  20. Fahimnia, B.; Sarkis, J.; Davarzani, H. Green supply chain management: A review and bibliometric analysis. Int. J. Prod. Econ. 2015, 162, 101–114. [Google Scholar] [CrossRef]
  21. Babagolzadeh, M.; Shrestha, A.; Abbasi, B.; Zhang, Y.; Woodhead, A.; Zhang, A. Sustainable cold supply chain management under demand uncertainty and carbon tax regulation. Transp. Res. Part D Transp. Environ. 2020, 80, 102245. [Google Scholar] [CrossRef]
  22. Zaman, K.; Shamsuddin, S. Green logistics and national scale economic indicators: Evidence from a panel of selected European countries. J. Clean. Prod. 2017, 143, 51–63. [Google Scholar] [CrossRef]
  23. Zhao, Y.; Zhang, X.; Xu, X. Application and research progress of cold storage technology in cold chain transportation and distribution. J. Therm. Anal. Calorim. 2019, 139, 1419–1434. [Google Scholar] [CrossRef]
  24. Islam, S.; Manning, L.; Cullen, J.M. A hybrid traceability technology selection approach for sustainable food supply chains. Sustainability 2021, 13, 9385. [Google Scholar] [CrossRef]
  25. Bassi, F. European consumers’ attitudes towards the environment and sustainable behavior in the market. Sustainability 2023, 15, 1666. [Google Scholar] [CrossRef]
  26. Liao, J.; Tang, J.; Vinelli, A.; Xie, R. A hybrid sustainability performance measurement approach for fresh food cold supply chains. J. Clean. Prod. 2023, 398, 136466. [Google Scholar] [CrossRef]
  27. Liu, B.; Li, J.; Chen, A.; Theodorakis, P.E.; Zhu, Z.; Yu, J. Selection of the cold logistics model based on the carbon footprint of fruits and vegetables in China. J. Clean. Prod. 2022, 334, 130251. [Google Scholar]
  28. Jia, X. Research on the optimization of cold chain logistics distribution path of agricultural products E-commerce in urban ecosystem from the perspective of carbon neutrality. Front. Ecol. Evol. 2022, 10, 966111. [Google Scholar] [CrossRef]
  29. Golestani, M.; Moosavirad, S.H.; Asadi, Y.; Biglari, S. A Multi-Objective Green Hub Location Problem with Multi Item-Multi Temperature Joint Distribution for Perishable Products in Cold Supply Chain. Sust. Prod. Consump. 2021, 27, 1183–1194. [Google Scholar] [CrossRef]
  30. Du, B.; Liu, Q.; Li, G. Coordinating leader-follower supply chain with sustainable green technology innovation on their fairness concerns. Int. J. Environ. Res. Public Health 2017, 14, 1357. [Google Scholar] [CrossRef] [PubMed]
  31. Shi, Y.; Lin, Y.; Lim, M.K.; Tseng, M.-L.; Tan, C.; Li, Y. An intelligent green scheduling system for sustainable cold chain logistics. Expert Syst. Appl. 2022, 209, 118378. [Google Scholar] [CrossRef]
  32. Dukkanci, O.; Peker, M.; Kara, B.Y. Green hub location problem. Transport. Res. Part E Log. Transport. Rev. 2019, 125, 116–139. [Google Scholar] [CrossRef]
  33. Khan, S.A.R.; Sharif, A.; Golpîra, H.; Kumar, A. A green ideology in Asian emerging economies: From environmental policy and sustainable development. Sust. Dev. 2019, 27, 1063–1075. [Google Scholar] [CrossRef]
  34. Zhang, W.; Zhang, X.; Zhang, M.; Li, W. How to Coordinate Economic, Logistics and Ecological Environment? Evidences from 30 Provinces and Cities in China. Sustainability 2020, 12, 1058. [Google Scholar] [CrossRef]
  35. Han, J.W.; Zhao, C.J.; Qian, J.P.; Ruiz-Garcia, L.; Zhang, X. Numerical modeling of forced-air cooling of palletized apple: Integral evaluation of cooling efficiency. Int. J. Refrig. 2018, 89, 131–141. [Google Scholar] [CrossRef]
  36. He, Z.; Chen, P.; Liu, H.; Guo, Z. Performance measurement system and strategies for developing low-carbon logistics: A case study in China. J. Clean. Prod. 2017, 156, 395–405. [Google Scholar] [CrossRef]
  37. Kumar, A.; Mangla, S.K.; Kumar, P.; Karamperidis, S. Challenges in perishable food supply chains for sustainability management: A developing economy perspective. Bus. Strateg. Environ. 2020, 29, 1809–1831. [Google Scholar] [CrossRef]
  38. Sharma, A.; Kumar, R. A Framework for Risk-Energy Aware Service-Level Agreement Provisioning (RESP) for Computing the Quickest Path. J. Comput. Netw. Commun. 2019, 2019, 4109453. [Google Scholar] [CrossRef]
  39. Ofori, E.K.; Li, J.; Gyamfi, B.A.; Opoku-Mensah, E.; Zhang, J. Green industrial transition: Leveraging environmental innovation and environmental tax to achieve carbon neutrality. Expanding on STRIPAT model. J. Environ. Manag. 2023, 343, 118121. [Google Scholar] [CrossRef] [PubMed]
  40. Chen, Q.; Qian, J.; Yang, H.; Wu, W. Sustainable food cold chain logistics: From microenvironmental monitoring to global impact. Compr. Rev. Food Sci. Food Saf. 2022, 21, 4189–4209. [Google Scholar] [CrossRef] [PubMed]
  41. El Mahrad, B.; Newton, A.; Icely, J.D.; Kacimi, I.; Abalansa, S.; Snoussi, M. Contribution of remote sensing technologies to a holistic coastal and marine environmental management framework: A review. Remote Sens. 2020, 12, 2313. [Google Scholar] [CrossRef]
  42. Dai, J.; Khan, Y.A. Ecological environment pressure state and response system for coupling coordinate development: An application on china data. Environ. Sci. Pollut. Res. 2023, 30, 25682–25690. [Google Scholar] [CrossRef] [PubMed]
  43. Wang, L.; Xiang, W.; Liu, J.; Wu, X. Analysis of cold chain logistics development of fresh agricultural products based on grey correlation model. J. Lanzhou Inst. Technol. 2021, 28, 85–91. [Google Scholar]
  44. Abulimiti, S.; Gumur, G. Research on the situation and development path of cold chain logistics of agricultural products in Xinjiang. Price Mon. 2018, 75–78. [Google Scholar]
  45. Wu, D.; Li, J.; Cui, J.; Hu, D. Research on the Time-Dependent Vehicle Routing Problem for Fresh Agricultural Products Based on Customer Value. Agriculture 2023, 13, 681. [Google Scholar] [CrossRef]
  46. Shen, L.Y.; Yang, Y.; Bao, H.J.; Du, X.Y.; He, H.M. Residents’ perceptions on the urban resources environment in Chinese large cities. Environ. Impact Assess. Rev. 2023, 100, 107080. [Google Scholar] [CrossRef]
  47. Li, H.; Jiao, Y.; Li, L.; Jiao, X. Research progress and trend of effects of organophosphorus pesticides on aquatic organisms in the past decade. Comp. Biochem. Physiol. C Toxicol. Pharmacol. 2023, 271, 109673. [Google Scholar] [CrossRef] [PubMed]
  48. Han, Z.; Leng, Y.; Sun, Z.; Lin, H.; Wang, J.; Zou, J. Machine learning-based estimation and mitigation of nitric oxide emissions from Chinese vegetable fields. Environ. Pollut. 2024, 343, 123174. [Google Scholar] [CrossRef] [PubMed]
  49. Fan, X.; Zhang, Y.; Ma, Y.; Zhao, C.; Liang, B.; Chu, H. Research on the sustainable development of agricultural product supply chain in three northeast provinces in China. Front. Public Health 2023, 10, 1007486. [Google Scholar] [CrossRef] [PubMed]
  50. Ao, Y.; Li, H.; Zhu, L.; Ali, S.; Yang, Z. The linear random forest algorithm and its advantages in machine learning assisted logging regression modeling. J. Petrol. Sci. Eng. 2019, 174, 776–789. [Google Scholar] [CrossRef]
  51. Wang, X.; Zhang, L.; Li, J.; Sun, Y.; Tian, J.; Han, R. Research on improved XGBoost method based on genetic algorithm and random forest. Comput. Sci. 2020, 47, 454–458, 463. [Google Scholar]
  52. Srivastava, R. Karl Pearson and “Applied” Statistics. Resonance J. Sci. Educ. 2023, 28, 183–189. [Google Scholar] [CrossRef]
  53. Mullah, M.A.S.; Hossain, Z.; Benedetti, A. Comparing estimation approaches for generalized additive mixed models with binary outcomes. J. Stat. Comput. Sim. 2023, 93, 3362–3381. [Google Scholar] [CrossRef]
  54. Nikolaisen, M.; Cornulier, T.; Hillier, J.; Smith, P.; Albanito, F.; Nayak, D. Methane emissions from rice paddies globally: A quantitative statistical review of controlling variables and modelling of emission factors. J. Clean. Prod. 2023, 409, 137245. [Google Scholar] [CrossRef]
  55. Weng, L.; Dou, W.; Chen, Y. Study on the Coupling Effect of Agricultural Production, Road Construction, and Ecology: The Case for Cambodia. Agriculture 2023, 13, 780. [Google Scholar] [CrossRef]
  56. Wang, G.; Zhang, Z.; Li, S.; Shin, C. Research on the influencing factors of sustainable supply chain development of agri-food products based on cross-border live-streaming e-commerce in China. Foods 2023, 12, 3323. [Google Scholar] [CrossRef]
  57. Zuo, D.; Liang, Q.; Zhan, S.; Huang, W.; Yang, S.; Wang, M. Using energy consumption constraints to control the freight transportation structure in China (2021–2030). Energy 2023, 262, 125512. [Google Scholar] [CrossRef]
  58. Ma, R.; Zhu, S.; Liu, F. The Impact of the Patent System on the Timing of Technology Licensing in China: Theory and Evidence from Patent Disclosure and Grant Delays. J. Eng. Technol. Manag. 2021, 61, 101631. [Google Scholar] [CrossRef]
Figure 1. Error curve.
Agriculture 14 00609 g001
Figure 2. Comparison of training set prediction results.
Agriculture 14 00609 g002
Figure 3. Comparison of test set prediction results.
Agriculture 14 00609 g003
Figure 4. Scatter plot of regression predictions.
Agriculture 14 00609 g004
Figure 5. Model fitting diagram.
Agriculture 14 00609 g005
Figure 6. (ag) Correlation heatmaps, 2015–2021.
Agriculture 14 00609 g006
Figure 7. Value of variable VIF.
Agriculture 14 00609 g007
Figure 8. Plot of the model residual test.
Agriculture 14 00609 g008
Figure 9. Effects of cold chain logistics of agricultural products on ecosystems.
Agriculture 14 00609 g009
Table 1. Indicator system for cold chain logistics development and ecosystems for agricultural products.
Evaluation
Objective
Primary
Indexes
Secondary IndicatorsUnit
Cold chain logistics development of fresh agricultural products (CCLFAP)ParticipantsNumber of employees in the logistics industry (NELI)10,000 people
Number of cold chain logistics
enterprises (NCCLE)
--
Number of cold-chain-related policies issued by the government (NCCPIG)--
Output of fresh agricultural
products (OFAP)
10,000 tons
Economic BenefitsPer capita consumption of fresh
agricultural products (PCCFAP)
KG
Trading volume of fresh agricultural products (TVFAP)RMB 10,000
Total cold chain logistics of agricultural products (TCCLAP)RMB 100 million
The freight turnover of agricultural products transported by the cold
chain (FTAPTCC)
Billion ton-km
Technical LevelResearch and experimental development (R&D) personnel full-time
equivalent (RTDSFTE)
Persons/year
Number of cold chain logistics patent applications (NCCLPA)--
InfrastructureNumber of refrigerated vehicles (NRV)--
Capacity of cold room (CCR)Ton
Road density (RD)Km per square km
Ecological
environment (EE)
Ecological statePer capita water resources (PCWR)Cubic Meters/person
Sown area (SA)Thousand hectares
Annual mean temperature (AMT)Degrees centigrade
Ecological pressureDischarge of major pollutants in wastewater (DMPW)Ton
Carbon emissions (CE)Million tons of
carbon dioxide
Ecological responseNonhazardous disposal of domestic waste (HDCHG)Million tons
Sewage treatment capacity (STC)Cubic meter
(unit of volume)
Table 2. Model fitting prediction accuracy.
MetricTraining SetTest Set
R20.87790.81055
MAE0.0340910.045277
RMSE0.0501280.068023
Table 3. Correlation coefficients between fresh produce cold chain logistics factors and DMPW, 2015–2021.
2015201620172018201920202021
NELI0.480.770.790.790.660.570.57
NCCLE0.430.650.660.720.570.530.49
NCCPIG--------------
OFAP0.910.640.660.680.710.750.77
PCCFAP--------------
TVFAP0.650.680.610.690.510.450.46
TCCLAP0.710.850.870.870.740.670.71
FTAPTCC0.830.540.570.570.460.40.49
RTDSFTE0.40.780.790.810.650.560.6
NCCLPA--0.720.750.780.580.480.41
NRV--0.41--0.4--0.530.49
CCR0.410.640.650.610.460.430.46
RD--------------
Table 4. List of correlation coefficients between fresh produce cold chain logistics factors and CE, 2015–2021.
2015201620172018201920202021
NELI0.570.60.570.530.570.570.54
NCCLE0.590.580.60.510.490.510.5
NCCPIG--------------
OFAP--------------
PCCFAP------0.440.380.450.41
TVFAP--0.390.430.40.390.430.41
TCCLAP0.480.50.480.45------
FTAPTCC--------------
RTDSFTE0.490.520.510.490.480.510.48
NCCLPA0.410.520.440.490.470.470.41
NRV0.430.450.41--0.50.510.5
CCR--0.580.560.470.440.470.47
RD----0.38----0.370.42
Table 5. List of correlation coefficients between fresh produce cold chain logistics factors and HDCHG, 2015–2021.
2015201620172018201920202021
NELI0.910.920.930.920.910.940.93
NCCLE0.80.820.830.880.870.890.88
NCCPIG--------------
OFAP0.550.530.530.530.520.580.57
PCCFAP0.37--0.39--0.410.42--
TVFAP0.770.780.760.730.760.750.71
TCCLAP0.880.90.910.890.820.830.83
FTAPTCC0.410.410.410.40.410.420.41
RTDSFTE0.930.930.940.950.920.930.94
NCCLPA0.80.910.90.920.860.890.82
NRV0.430.450.430.540.550.890.88
CCR0.650.780.780.740.730.780.77
RD--------------
Table 6. List of correlation coefficients between fresh produce cold chain logistics factors and STC, 2015–2021.
2015201620172018201920202021
NELI0.920.930.940.930.920.930.92
NCCLE0.810.860.860.870.840.880.86
NCCPIG--------------
OFAP0.490.470.460.470.450.50.49
PCCFAP0.4--0.410.380.440.42--
TVFAP0.680.690.680.680.710.670.63
TCCLAP0.860.860.860.850.770.760.76
FTAPTCC0.40.390.390.38------
RTDSFTE0.90.910.910.940.910.920.92
NCCLPA0.790.890.890.910.860.860.76
NRV0.450.470.420.510.50.880.86
CCR0.640.790.750.70.680.710.69
RD--------------
Table 7. Results of the GAM model for the effects of factors on the cold chain logistics of fresh agricultural products.
S (.)EdfRef.dfFp Value
S (NELI)1.0001.00032.0840.000 ***
S (NCCLE)7.9207.9208.2220.000 ***
S (NCCPIG)1.5971.5970.9500.229
S (OFAP)1.0001.0000.7650.383
S (PCCFAP)1.0001.0002.8560.092 *
S (TVFAP)1.0001.000109.9830.000 ***
S (FTAPTCC)5.7725.77215.1020.000 ***
S (NCCLPA)1.0001.0002.8310.094 *
S (NRV)1.0001.00040.8420.000 ***
S (CCR)1.0001.00013.7480.001 ***
S (RD)1.0001.0003.8930.049 **
Notes: * p < 0.1; ** p < 0.05; *** p < 0.001.
Disclaimer/Publisher’s Note: The statements, opinions and data contained in all publications are solely those of the individual author(s) and contributor(s) and not of MDPI and/or the editor(s). MDPI and/or the editor(s) disclaim responsibility for any injury to people or property resulting from any ideas, methods, instructions or products referred to in the content.

