Article

Analysis of Mechanical Properties of Functional Parts of Goat Hoofs under Multi-Slope

1
College of Agricultural Equipment Engineering, Henan University of Science and Technology, Luoyang 471003, China
2
Graduate School, Henan University of Science and Technology, Luoyang 471023, China
3
College of Biological and Agricultural Engineering, Jilin University, Changchun 130025, China
4
Wah Engineering College, University of Wah, Wah Cantt 47040, Pakistan
5
College of Physical Engineering, Henan University of Science and Technology, Luoyang 471023, China
*
Author to whom correspondence should be addressed.
Agriculture 2024, 14(3), 451; https://doi.org/10.3390/agriculture14030451
Submission received: 29 December 2023 / Revised: 27 February 2024 / Accepted: 6 March 2024 / Published: 11 March 2024
(This article belongs to the Section Agricultural Technology)

Abstract

:
In order to improve the adhesive and passing performance of agricultural tracked vehicles under a non-structural environment, a theoretical design method of the structure of a bionic track pattern is proposed in this article. The Saanen goat is taken as the experimental subject, and the hoof tips and hoof spheres are taken as the characteristic functional parts, whose pressure is measured by thin film pressure sensors. The Qualisys Track Manager (QTM) gait analysis system was used to obtain the gait sequence of goats under multi-slope. The changes in vertical ground reaction force (GRF) and vertical impulse (VI) of the hoof tips and spheres and adhesion coefficient under multi-slope were analyzed. The results show that with the increase in slope, the GRF is transferred from the left hind hoof to the right front hoof, and the right front hoof has the most significant effect. Under the 10-degree slope, the peak vertical GRF and VI of the inner tip of the right front hoof are the largest; peak vertical GRF is 146.20 N, and VI is 127.67 N·s. The adhesion coefficient is the largest; the right front and left hind hoof are in the diagonal two-phase supported state, and μ is 0.3455. Therefore, the inner tip of the right front hoof is used as a bionic prototype to design the track pattern architecture. It provides a theoretical basis for the design and optimization of bionic patterns applied to agricultural tracked vehicles.

1. Introduction

Vehicles are prone to skid during driving, climbing, and ditching in unstructured environments such as hilly and mountainous areas, which seriously restricts their trafficability. Tracks or tires are the only components in contact with the ground; their structure and pattern are closely related to their strong adhesion and high traction [1,2]. Shaikh et al. explored the influence of the height of the track grouser on the traction performance of the tracked vehicle under different soil moisture conditions through the soil trough test. The traction performance of the tracked vehicle was the best when the height of the track grouser was 45 mm, and the soil moisture content was in the range of 16.7–21.5% [3]. Xue et al. [4] designed a bionic paddy wheel by extracting the surface curve of the cow hoof as a bionic prototype, which improved the traction performance of the vehicle in the paddy field. Zhang et al. [5] designed four bionic walking wheels by imitating the structure and posture of ostrich hoofs during walking, which effectively reduced the resistance of soil and the disturbance of sand and improved the traction performance of walking wheels. Cai et al. [6] analyzed the relationship between the maximum traction force and the structural parameters of the crawler teeth based on the bionics theory to solve the problem of deep-sea collectors slipping on the seabed. Liang et al. [7] simulated and analyzed the influence of tread patterns on the traction performance of the vehicle and determined the parameters that had the greatest influence on the traction performance of the tire.
Based on the principle of bionics, it is an important and effective means to improve the adhesion performance of vehicle soil-engaging parts by applying the biological structure characteristics of animals to the structural design of vehicle soil-engaging parts [8]. Gan et al. [9] constructed a mathematical model for the tractive force between the track shoe and the sand and designed a sandy track shoe based on the mechanism of ostrich feet traveling on sand, which improved the traction performance of the vehicle. Based on the characteristics of reindeer foot, Zhang et al. [10] designed the bionic ribbed tread element and bionic non-ribbed tread element, which had excellent anti-skid properties. He et al. [11] designed a bionic adaptive low-vibration walking wheel based on ostrich foot locomotion posture, energy storage, and vibration reduction mechanism of the metatarsophalangeal joint (MTP). On the premise that the passing-through performance of the bionic wheel was assured, the wheel center fluctuation of the bionic walking wheel was decreased significantly. Based on the swing deformation characteristics of cat claw pad–ground contact, Wang et al. [12] adopted an asymmetric layout on both sides of the groove wall in the central area of the tire, which reduced the radial excitation force between the tread and the road surface. Liu et al. [13] designed the crown of a radial tire imitating a cat paw pad based on the cross-sectional fitting curve of a cat paw pad, which improved the lateral grip of the tire. Li et al. [14] designed the tire crown based on the cross-section fitting curve of the third toe pad of the cat, which improved the lateral adhesion of the tire when turning. Han et al. [15] designed a bionic ostrich foot, simulated its impact process on loose sand, and analyzed the stress distribution and deformation of the bionic foot. Liu et al. [16] designed bionic claw spines based on the foot structure of chafers and applied them to tracked robots, which had good adhesion and desorption properties. Ma [17] designed the bionic sand crossing tire monomer based on the data of the ostrich plantar mastoid group in order to study the tire with the function of sand crossing so as to improve the soil thrust of the wheel surface.
The interaction between animal hoofs and the ground affects its motion stability [18], and the pressure change in the hoof bottom of the limbs during animal movement is one of the main factors affecting stability. Liu et al. [19] studied the variation of the vertical GRF of the limbs of the blue sheep under different slopes and found that the hind limbs bore more vertical GRF and increased with the increase of the slope, and the difference index of the left and right sides of the limbs was similar. At the same time, the team [20] divided the hoof of blue sheep into four quadrants, which were lateral cranial, intracranial, caudal lateral, and caudal medial. The vertical GRF of blue sheep was transferred from the lateral quadrant to the medial quadrant and from the caudal quadrant to the cranial quadrant. Li et al. [21] measured the vertical GRF of reindeer with a Footscan pressure plate and found that the vertical GRF increased with the increase in motion speed. Rifkin et al. [22] studied the gait characteristics of goats during walking and found that there were significant differences between forelimbs and hindlimbs. Among them, the maximum peak force of the forelimbs was significantly greater than that of the hindlimbs. Fahie et al. [23] studied the changes in step length and stride length, the proportion of forelimb and hindlimb, and the difference of forelimb and hindlimb parameters of dogs with different body types in different motion states. Pitti et al. [24] studied the peak vertical GRF and VI of normal pony and unilateral limping pony with forelimb and found that there was a significant difference between healthy pony and limping pony. Oosterlinck et al. [25] studied the balance between the left and right hoofs, the front and hind hoofs, and the pressure distribution of the hoof bottom with the limp horse as the test object. Panagiotopoulou et al. [26] selected seven discrete regions of interest on the plantar pressure contours of adult African elephants and Asian elephants and analyzed their foot pressure distribution patterns and COP trajectories. There was no difference in the average peak pressure pattern and COP trajectory between different species of elephants. Zhang [27] took the goat hoof as a bionic prototype and studied the dynamic morphological characteristics by using the size, direction, and area of plantar pressure during goat movement. The goat’s plantar was divided into six regions according to the characteristic parts, and the size and distribution characteristics of the plantar pressure of the goats under different movement modes were analyzed. The research found that with the increase in speed, the dynamic morphology of goat hoof was improved. The peak plantar pressure of the goat’s forefoot increased from 57.5% to 92.5% of its body weight, while the hoof ball pressure of the goat increased from 52% to 78%. Qian et al. [28] studied the characteristics of foot–ground contact of German Shepherd dogs under different gaits and found that with the increase of the contact impact force, the main landing area and main bearing point of the dog’s right forefoot gradually adjusted from the fourth and fifth fingers of normal walking speed to the third and fourth fingers and palm pad area of the jumping state.
The preliminary study of the research group [29,30,31] found that several functional parts evolved by goats can adapt to the unstructured environment, showing strong adhesion and passing ability. Therefore, in this article, the goat was used as an experimental object, and the QTM gait analysis system was used to collect the three-dimensional force changes of the goat gait and hoof bottom under multi-slope. The pressure of functional parts was collected by thin film pressure sensors, and the changes in vertical GRF and VI of functional parts were analyzed to find the most significant functional parts. It will provide a theoretical basis for the design and optimization of the bionic crawler pattern structure.

2. Materials and Methods

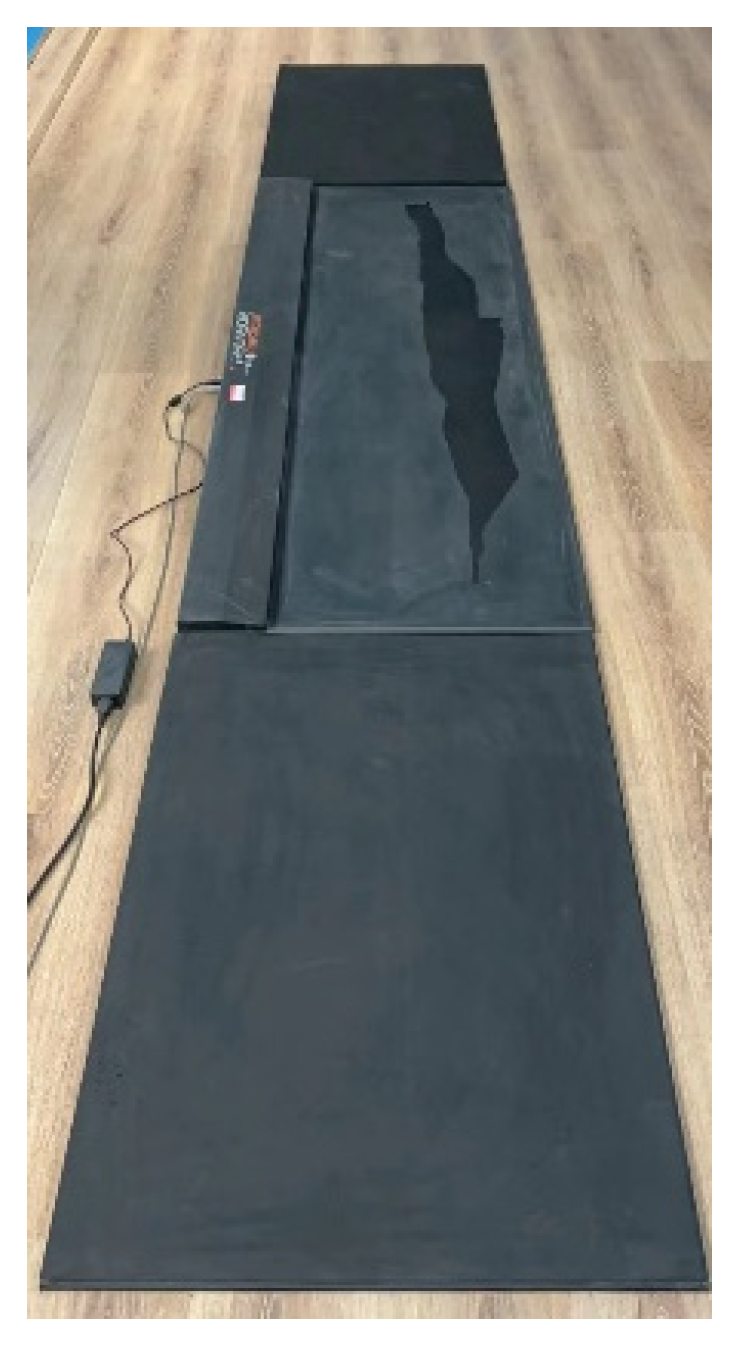
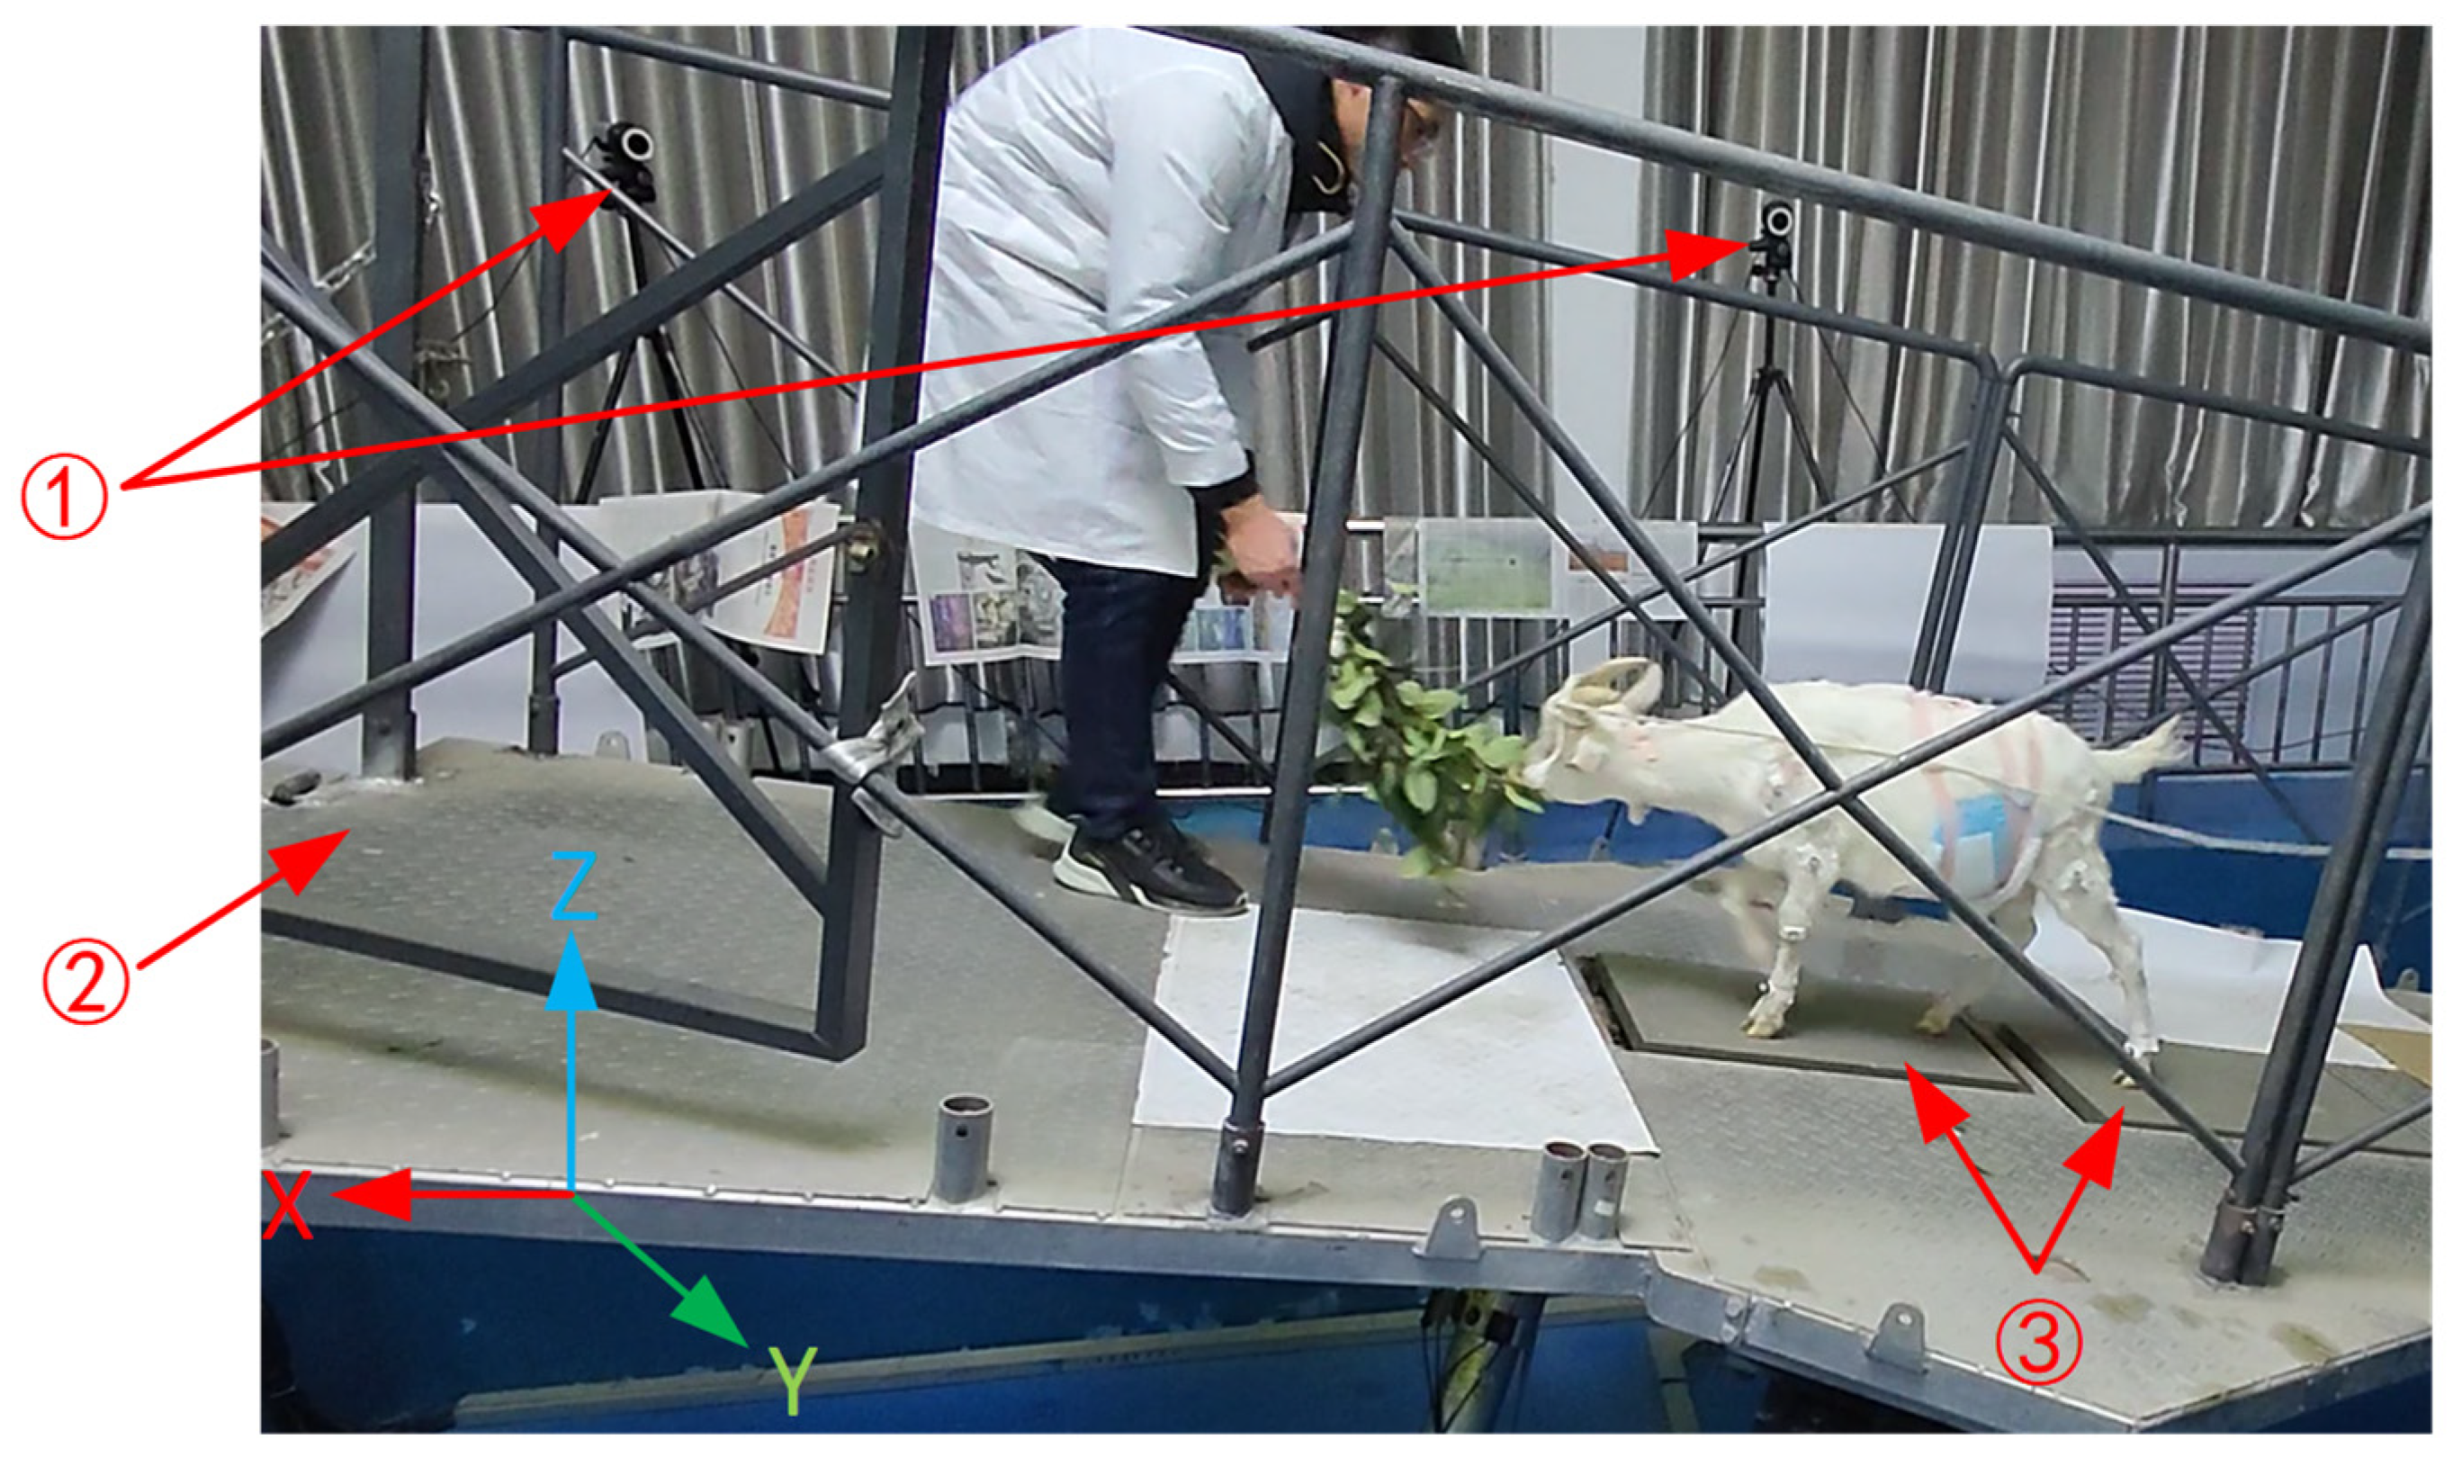
2.1. Acquisition and Analysis of Pressure Cloud Maps of Hoof Sole

Saanen goat was selected as the test subject, which was required to be healthy, able to walk naturally, with normal lower limb activity, and no history of hoof diseases. The plantar pressure plate test system (UP18, Podomed, ZIGUN AVOIN Company, Helsinki, Finland, measuring range 1–120 N/cm2, sampling frequency 200–400 Hz, error ≤ 1% F.S, lag ≤ 0.1 F.S) was used to collect the dynamic pressure cloud data during the hoof touchdown of the goat, as shown in Figure 1. Before the test, the weight of the goat was measured as 26.90 kg by a weighing scale (accuracy 0.01 kg), and the hoofs of the goat were trimmed, cleaned, and decontaminated to obtain the correct hoof traces.
It is to be noted that F.S indicates the percentage of the sensor’s indicator relative to the sensor’s full-scale error.
The dynamic videos of the goat hoof touching the ground were analyzed, and the key change frames were extracted, as shown in Table 1. The hoof spheres touched the ground first, and the hoof tips left the ground later. When touching the ground, the inner hoof flap was stressed first, and the outer hoof flap was stressed later, and the force was mainly concentrated on the inner hoof spheres. When leaving the ground, the outer hoof flap left the ground first, the inner hoof flap left the ground later, and the force was mainly concentrated on the outer hoof tips. The left front hoof, the left hind hoof, the right front hoof, and the right hind hoof were labeled as FL, HL, FR, and HR, respectively.

2.2. Acquisition and Analysis of the Pressure Data of the Characteristic Functional Parts of Hoof Sole

The goat locomotion environment was simulated, and hoof gait was obtained through a professional test platform, which consisted of an electromechanical six-degree-of-freedom adjustable platform, a three-dimensional biomechanical force measuring table (Model FP 4060-08-2000 of Bertec Corporation, Columbus, OH, USA, with dimensions of 0.6 m × 0.4 m, a range of 5 kN, a sampling frequency of 1 kHz, and an error of <1%), a motion-capture system, and a data-acquisition and analysis system, as shown in Figure 2.
Reflective balls were pasted on the joints of the limbs, forearm, and hind femur of the goat. The position of the reflective balls was captured by the motion capture system to obtain the hoof movement sequence and the three-dimensional movement posture of the goat. The position of the reflective balls is shown in Figure 3. By adjusting the angle between the six-degree-of-freedom motion platform and the X-axis direction to simulate different slopes, the goat climbing data were collected with the 0, 5, and 10-degree slopes.
Before the experiment, the weight of the goat was measured as 38.65 kg by a scale (accuracy 0.01 kg. The hairs on the surface of the goat hoofs were removed. According to the touching process of the goat hoof cloud maps, the hoof tips with soil-cutting function and the hoof spheres with buffer function were selected as the characteristic functional parts, and the thin film pressure sensors were pasted. Two sets of 8-channel FlexiForce wireless sensing systems were used to obtain the dynamic pressure change curves of the front and hind hoofs during the movement at different slopes. The position of the sensor placement on the hoof is shown in Figure 4, and the sensor is shown in Figure 5. The experiments were repeated to ensure data accuracy and elimination of abnormal data.

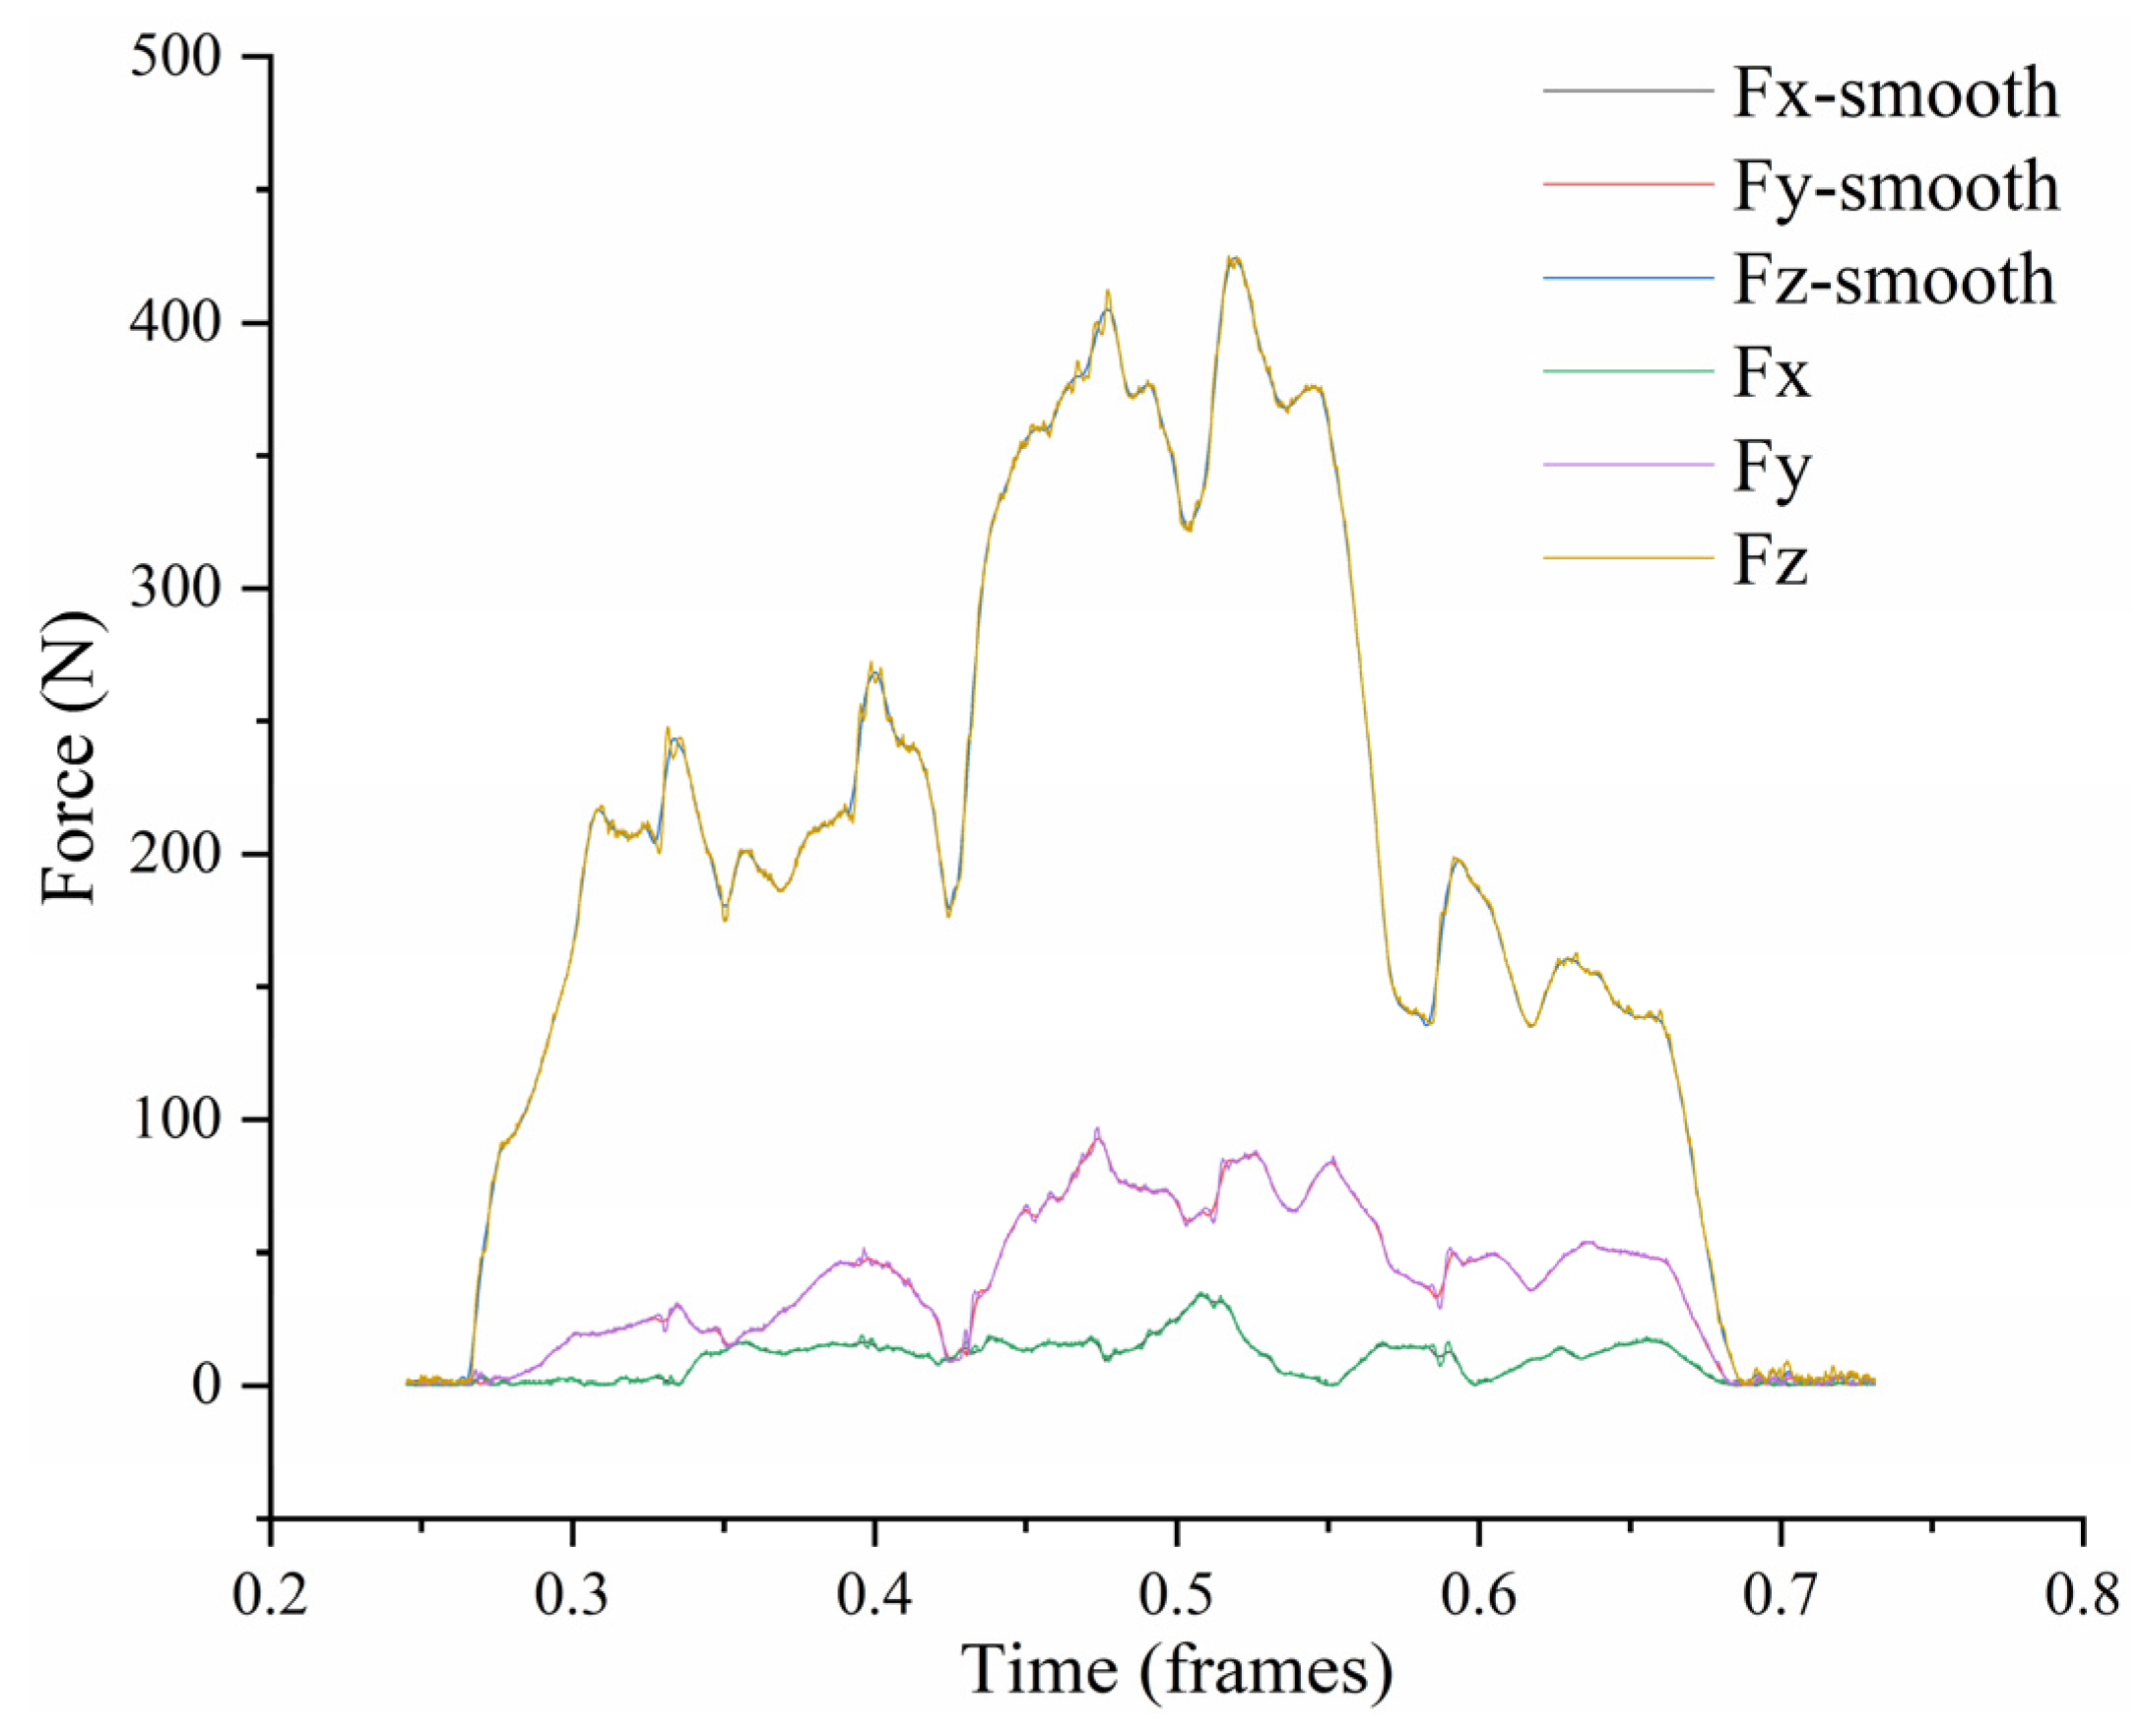
2.3. Data Processing and Analysis

Analyzing the pressure data of the goat uphill and downhill, a Walk gait of “diagonal supported—three-phase supported—same side supported—three-phase supported” was adopted. The leg lifting sequence of “FL-HR-FR-HL” was analyzed as a typical gait cycle as presented in Table 2, where 0 is the swing phase, and 1 is the support phase.
Goat movement speed and stride length were different, resulting in different goat gait cycle times. In order to analyze the dynamic change laws of the four hoof pressures, linear time normalization (LTN) was used for sequence calibration and matching of the gait cycle, which mapped the data to the interval [0, 1] without changing the original characteristics of the data. The normalization formula is given as follows:
F r a m e = F r a m e n F r a m e m i n F r a m e m a x F r a m e m i n  
where, F r a m e m i n is the smallest frame in the gait cycle, and F r a m e m a x is the largest frame in the gait cycle.
In order to accurately obtain the moving gait, considering that the motion amplitude of the third point of the limbs was the most significant, the motion trajectory of the third point along the positive directions of X, Y, and Z under different slopes were observed, as shown in Figure 6. It is obvious that the goat’s limbs had periodicity in the directions of X and Z. Therefore, when
X 2 X 1 < 3 m m
Z 2 Z 1 < 1 m m
the leg was considered to be in the supported state, which was the supported phase.

3. Results and Discussions

Peak vertical GRF and vertical impulse (VI) are the most common methods used to analyze the laws of foot–ground contact during animal locomotion. Therefore, peak vertical GRF and VI were selected as the main technical indexes to analyze the vertical GRF of the goat. Peak vertical GRF is the maximum value in the force–time sequence of the supporting phase vertical GRF during the whole gait cycle, and its unit is N. VI is the integral value of the vertical GRF versus the time fitting curve during the touchdown period during the hoof movement of the goat, as shown in Equation (4), and its unit is N·s. Impulse represents the increased momentum value perpendicular to the earth of the goat’s limbs due to the action of the vertical GRF on the limbs of the goat. The vertical datum plane of vertical GRF is defined as the earth rather than the plane where the 3D force platform is located. Therefore, the vertical GRF can be used to analyze the motion on the ground and slopes.
I = t 1 t 2 F d t

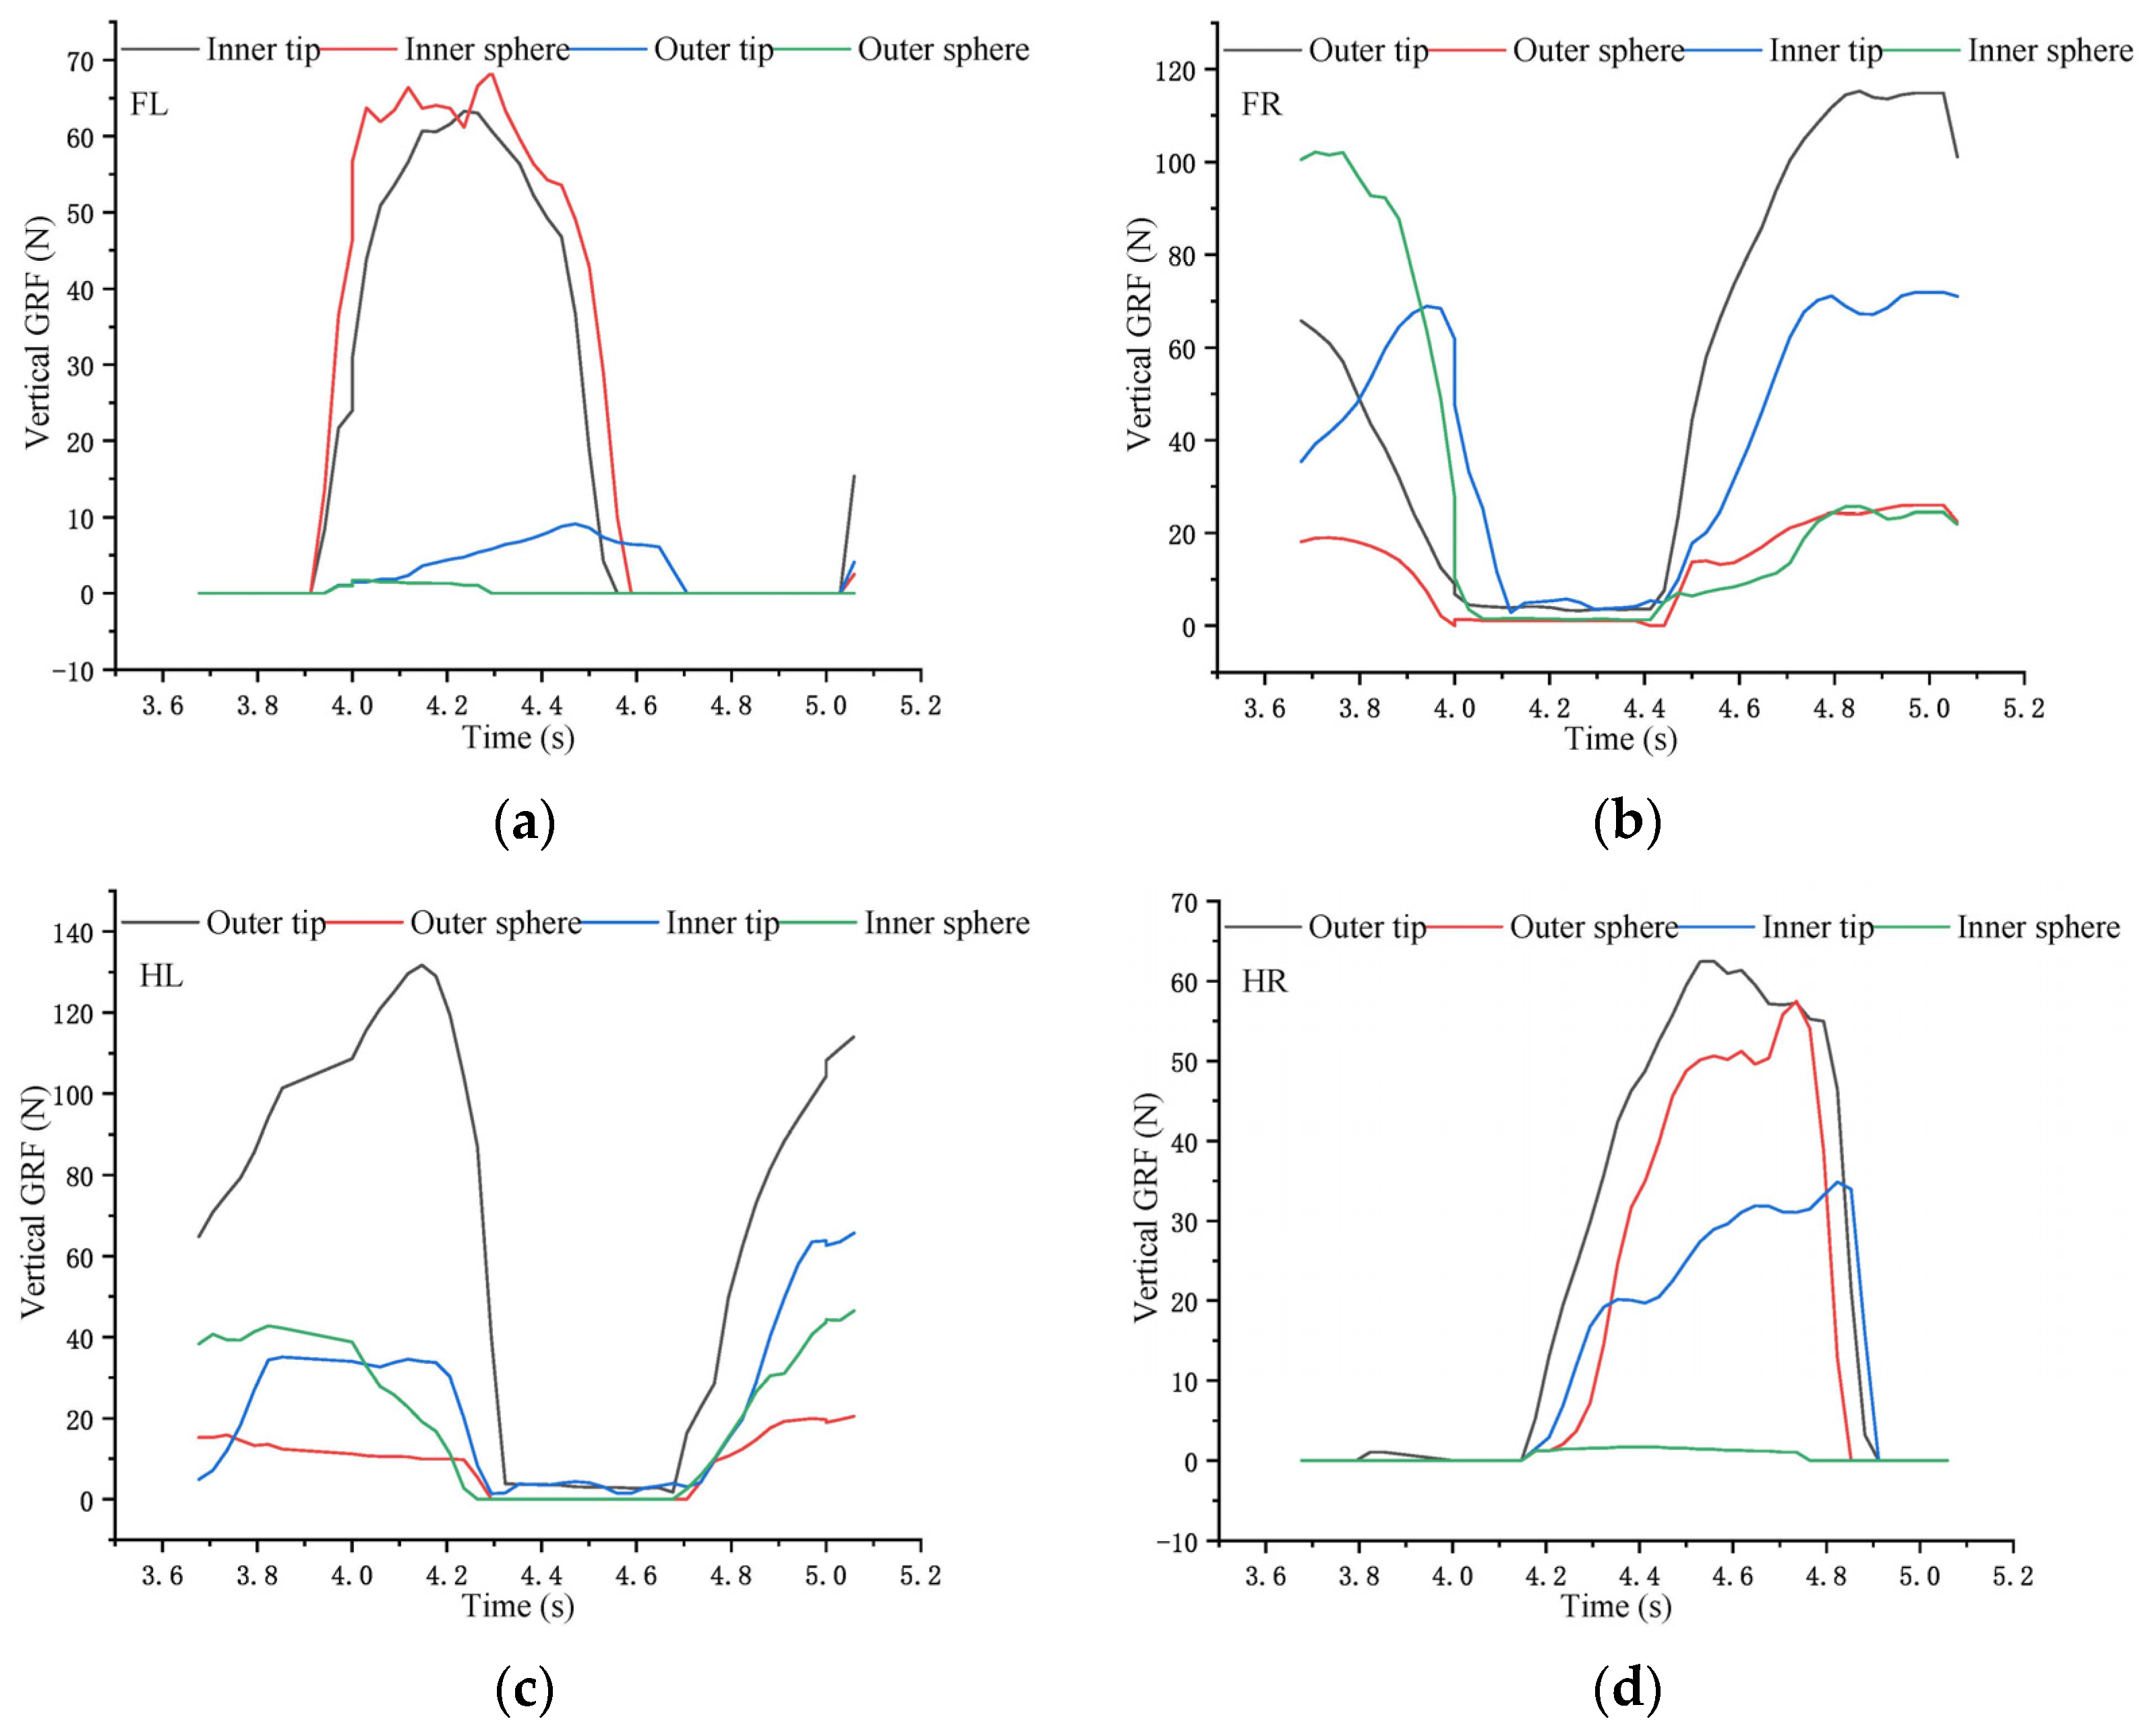
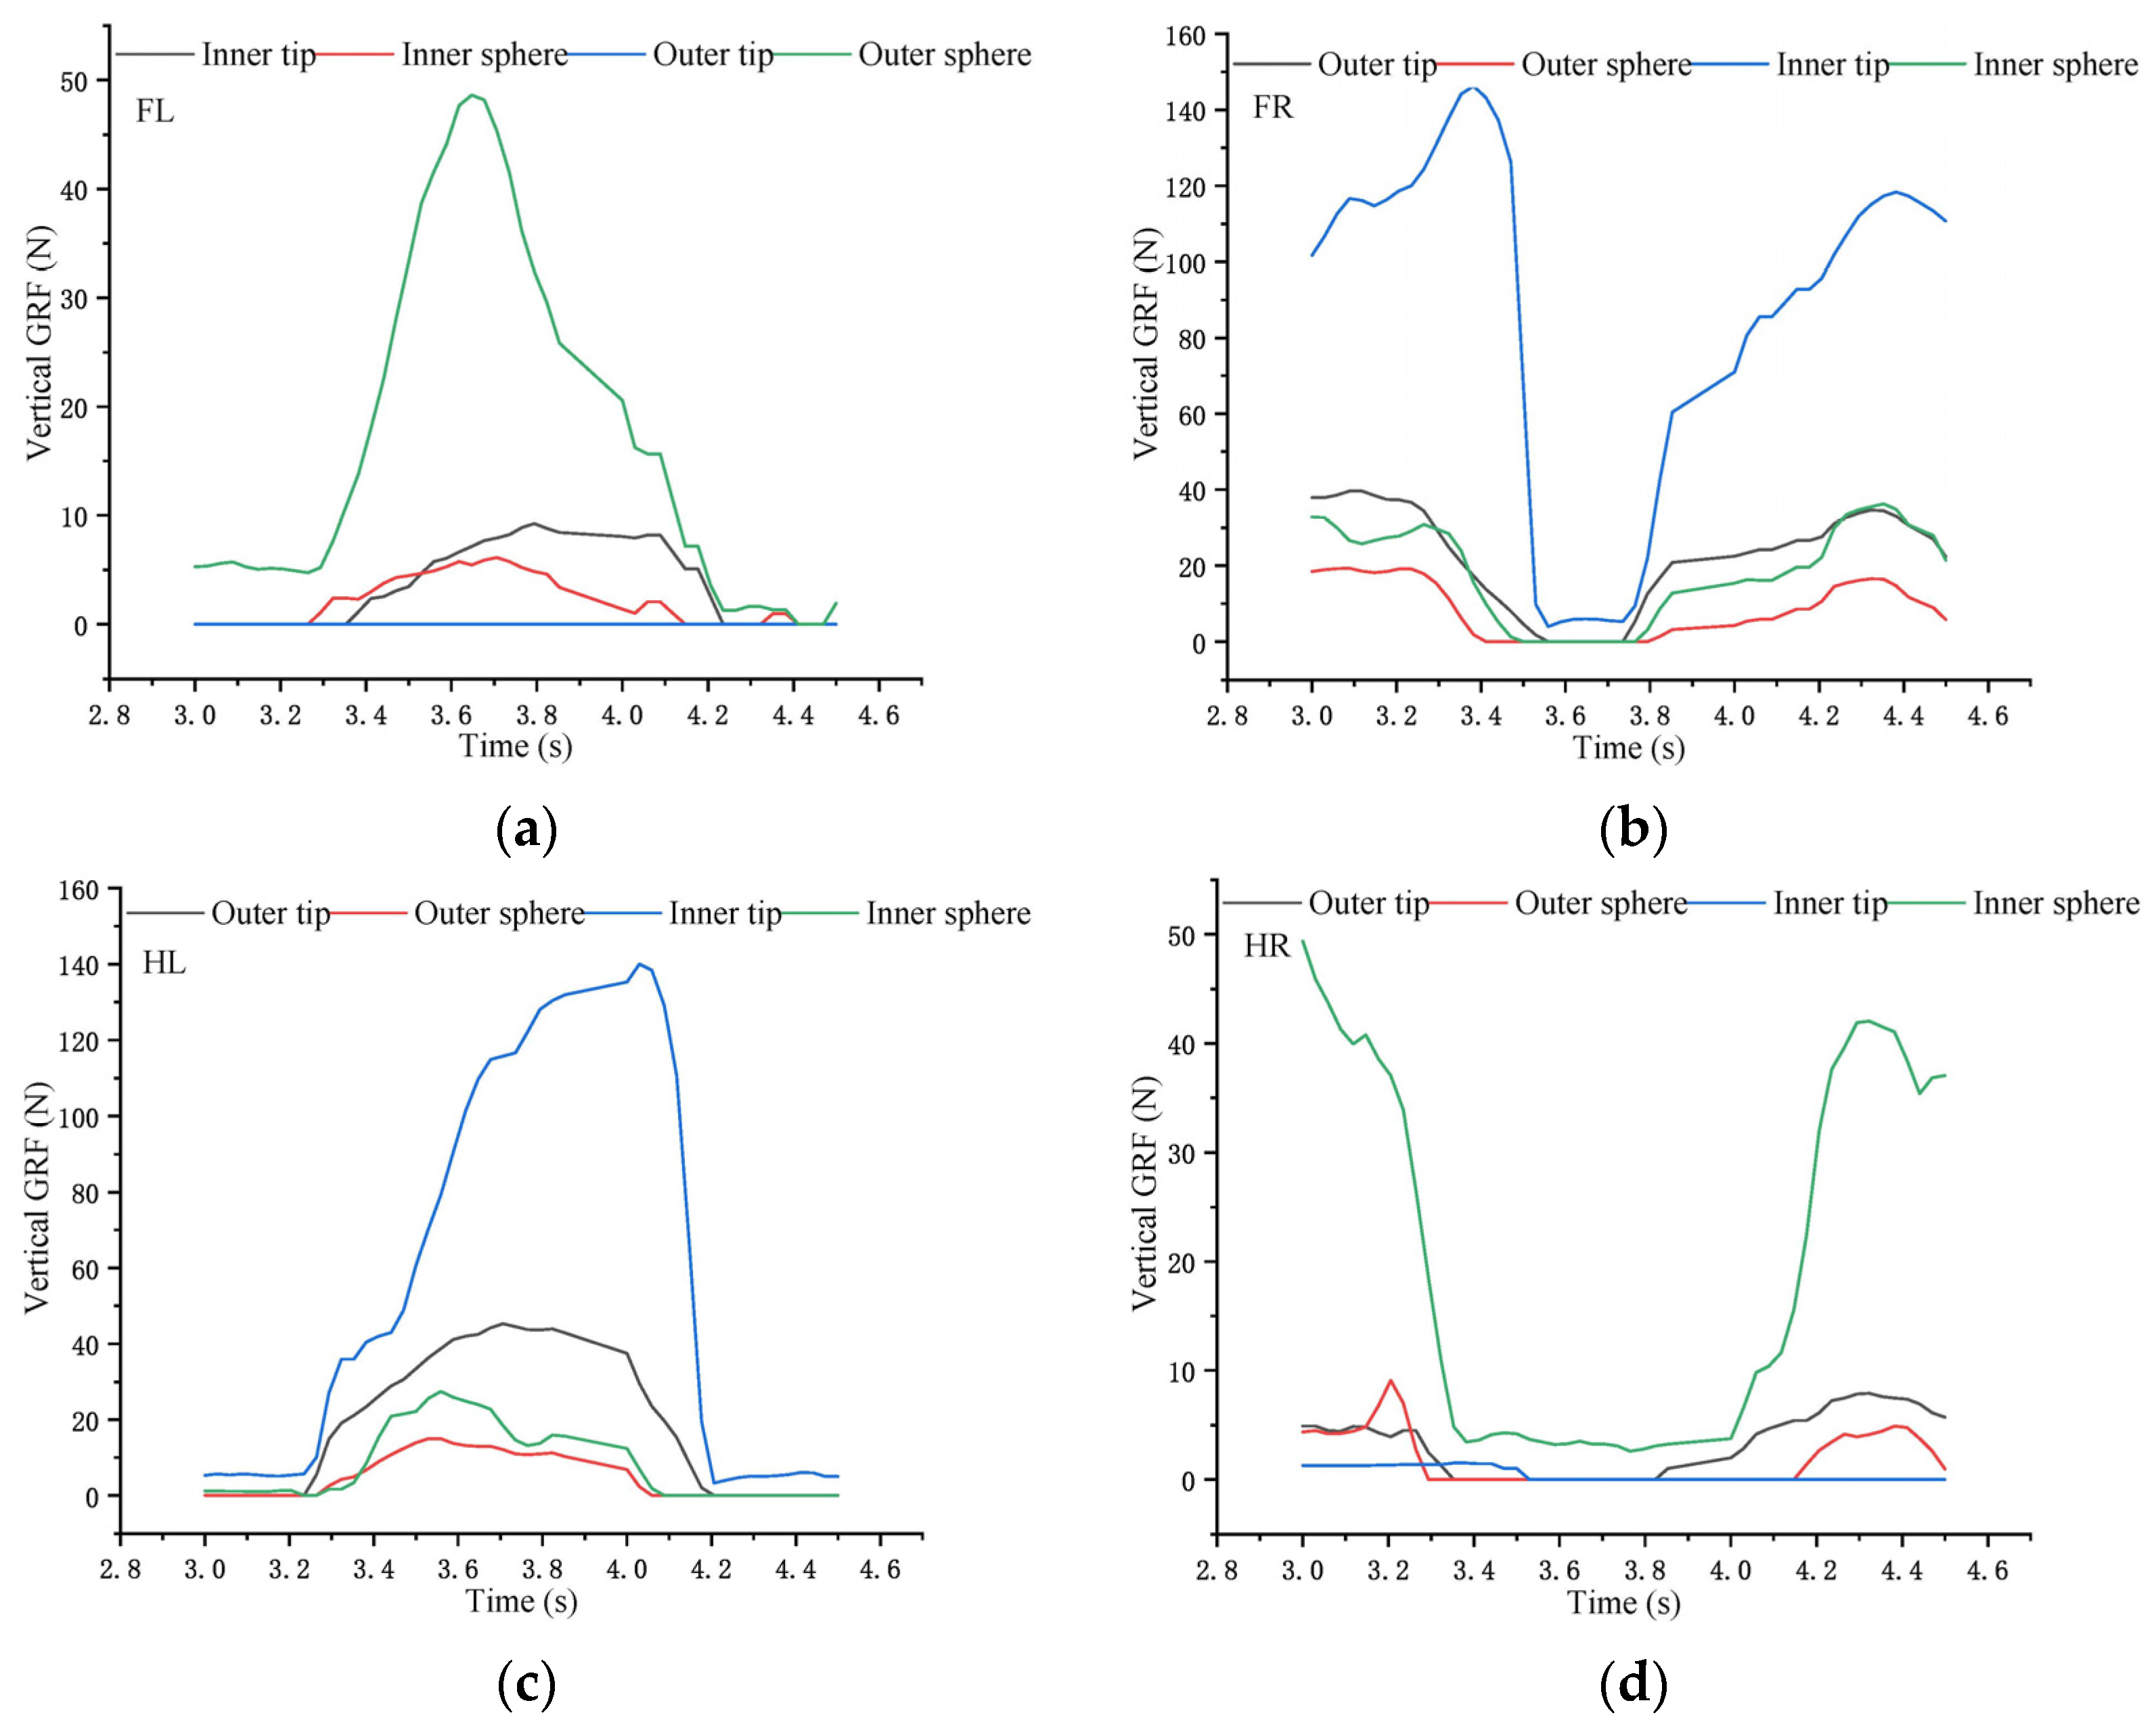
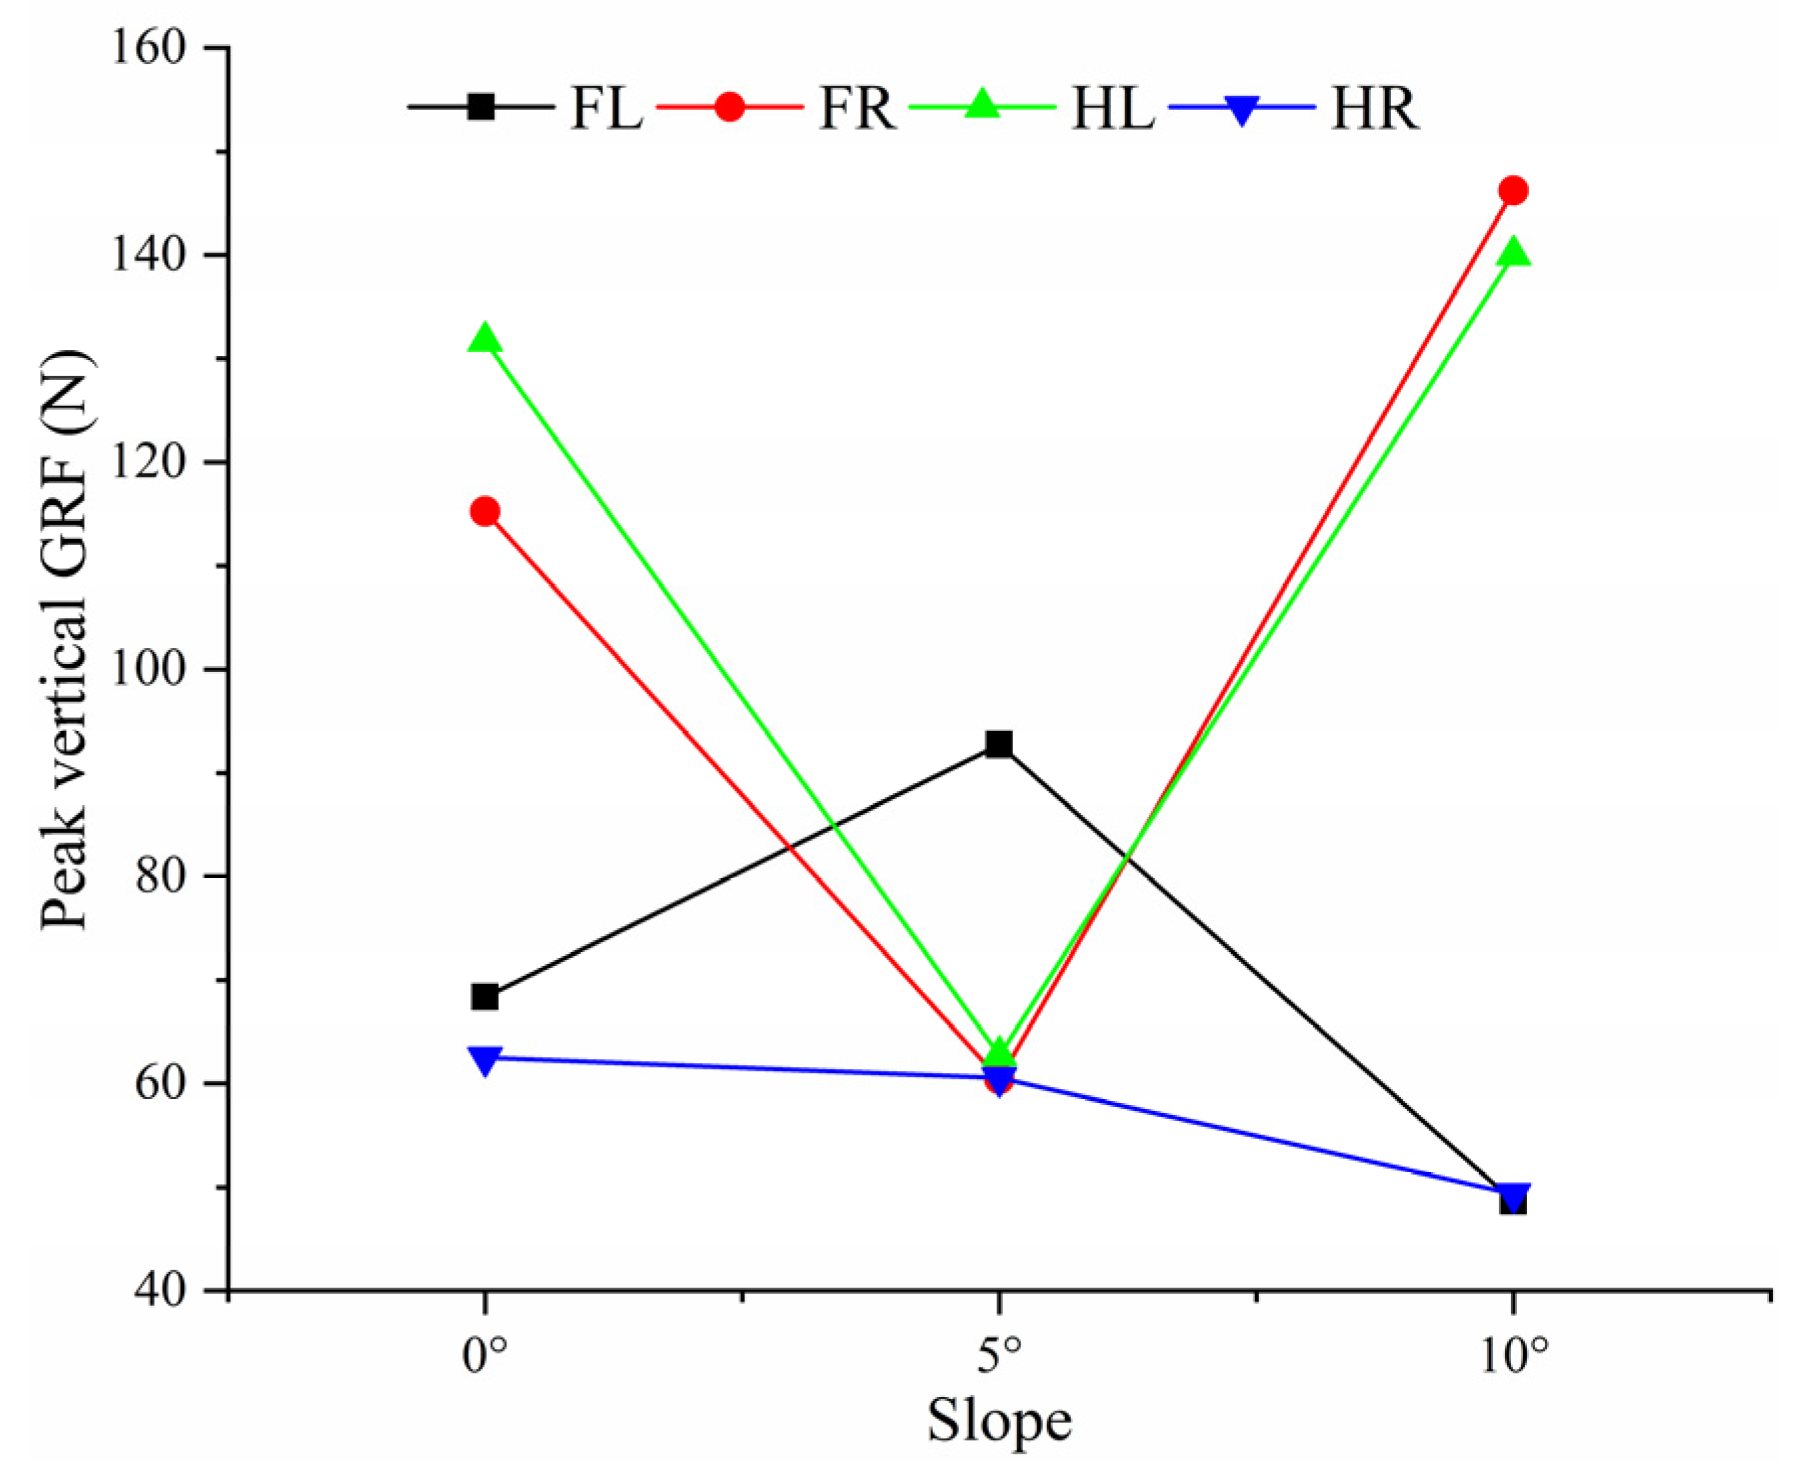
3.1. Analysis of the Vertical GRF of Characteristic Functional Parts of Goat Hoof under Multi-Slope

The vertical GRF of the characteristic functional parts of the hoof sole under the 0-degree slope was analyzed, as shown in Figure 7. The overall changing trend of the hoof tips and hoof spheres was the same since both reached the peak force first, that is, the part was completely touching the ground. Then, it gradually decreased to 0, with the part completely raised. Analyzing the maximum value of vertical GRF in each part, the hoof force of FL was mainly concentrated on the inner hoof sphere, with a peak vertical GRF of 68.36 N. The hoof force of FR was mainly concentrated on the outer hoof tip, with a peak vertical GRF of 115.23 N. The hoof force of HL was mainly concentrated on the outer hoof tip, with a peak vertical GRF of 131.67 N. The hoof force of HR was mainly concentrated on the outer hoof tip, with a peak vertical GRF of 62.51 N.
Next, the vertical GRF of the characteristic functional parts of the hoof sole under the 5-degree slope was analyzed, as shown in Figure 8. The hoof force of FL was mainly concentrated on the outer hoof sphere, with the peak vertical GRF of 92.70 N. The hoof force of FR was mainly concentrated on the outer hoof tip, with a peak vertical GRF of 60.42 N. The hoof force of HL was mainly concentrated on the outer hoof tip, with a peak vertical GRF of 62.73 N. The hoof force of HR was mainly concentrated on the inner hoof sphere, with a peak vertical GRF of 60.53 N.
Lastly, the vertical GRF of the characteristic functional parts of the hoof sole under the 10-degree slope was analyzed, as shown in Figure 9. The hoof force of FL was mainly concentrated on the outer hoof sphere, with a peak vertical GRF of 48.62 N. The hoof force of FR was mainly concentrated on the inner hoof tip, with a peak vertical GRF of 146.20 N. The hoof force of HL was mainly concentrated on the inner hoof tip, with a peak vertical GRF of 139.99 N. The hoof force of HR was mainly concentrated on the inner hoof sphere, with a peak vertical GRF of 49.35 N.

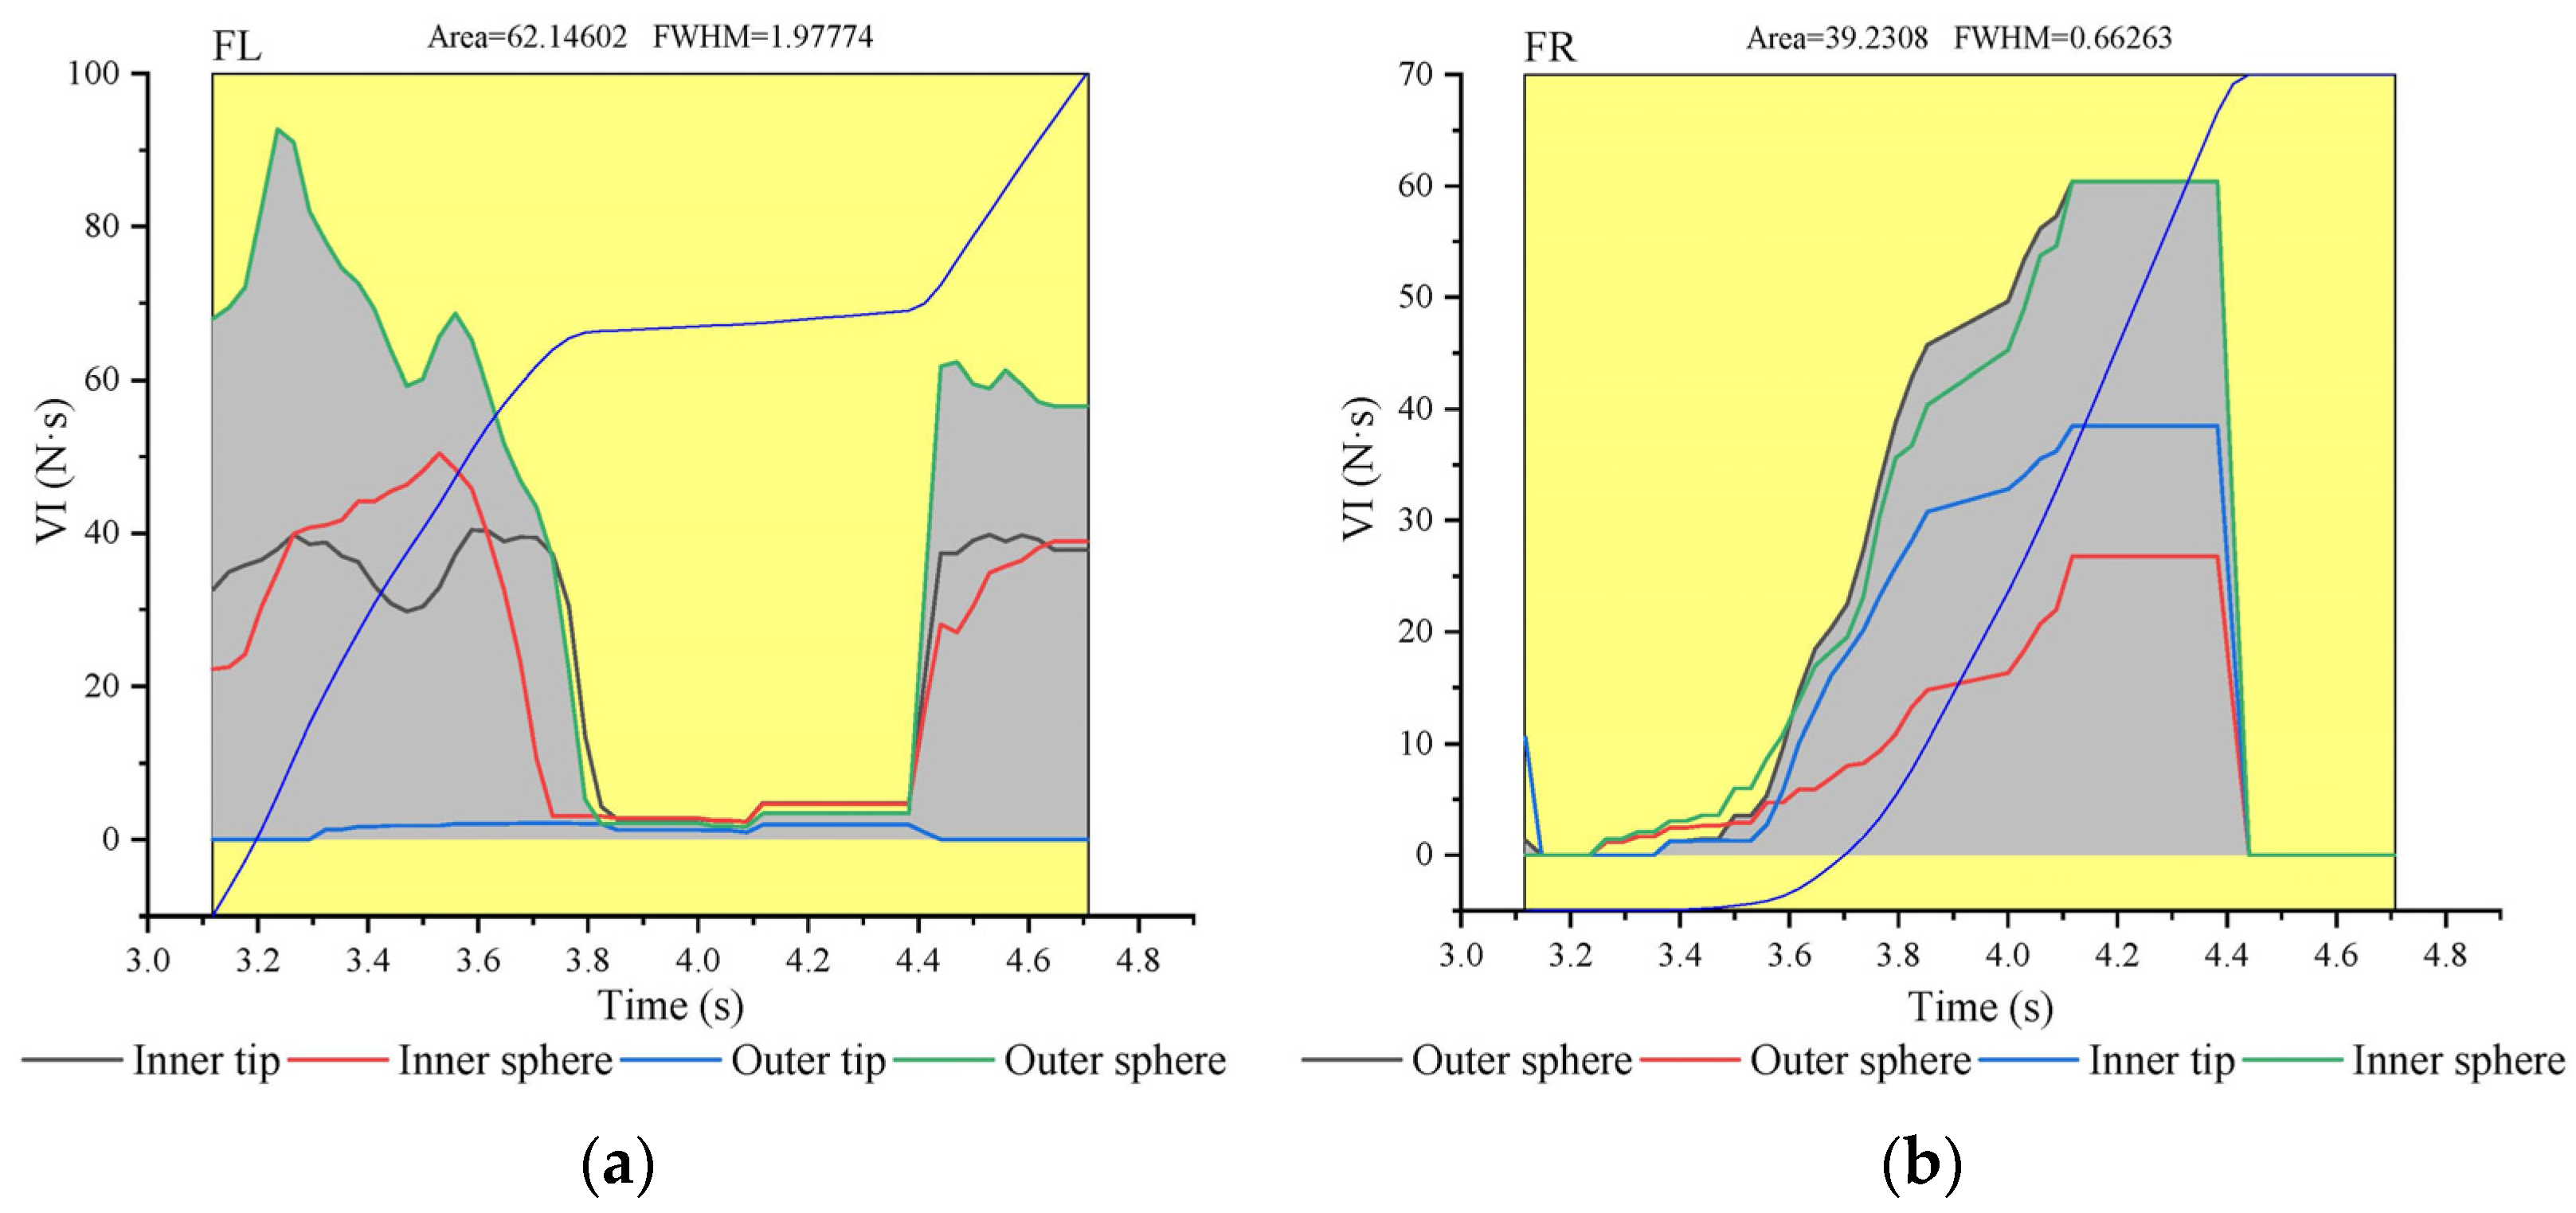
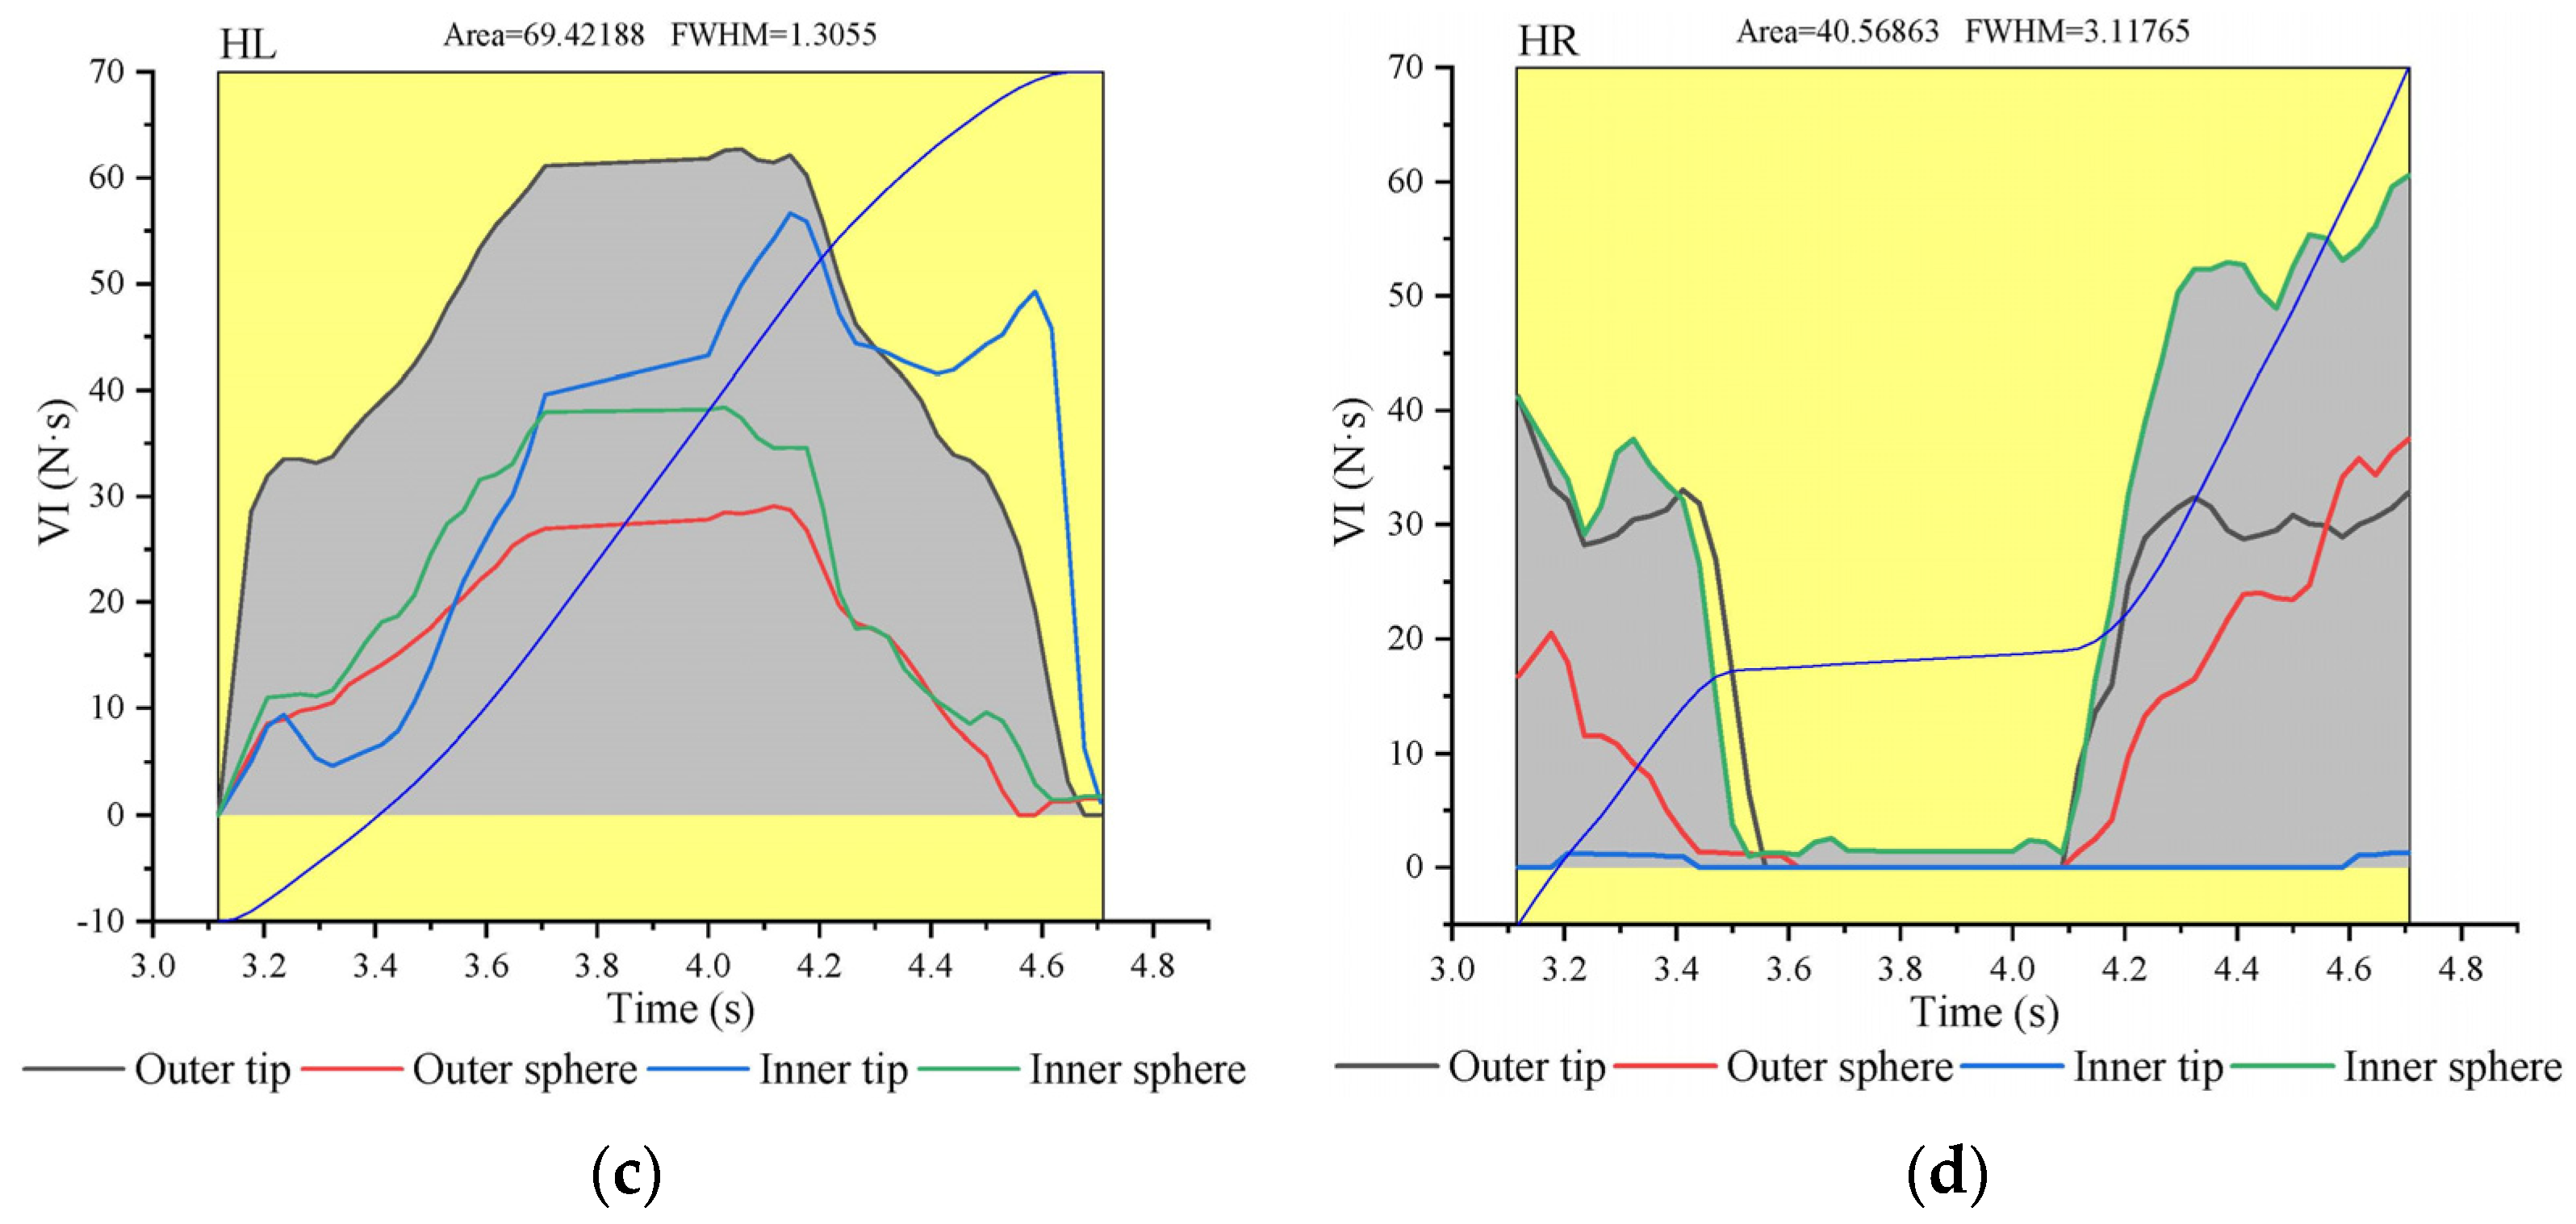
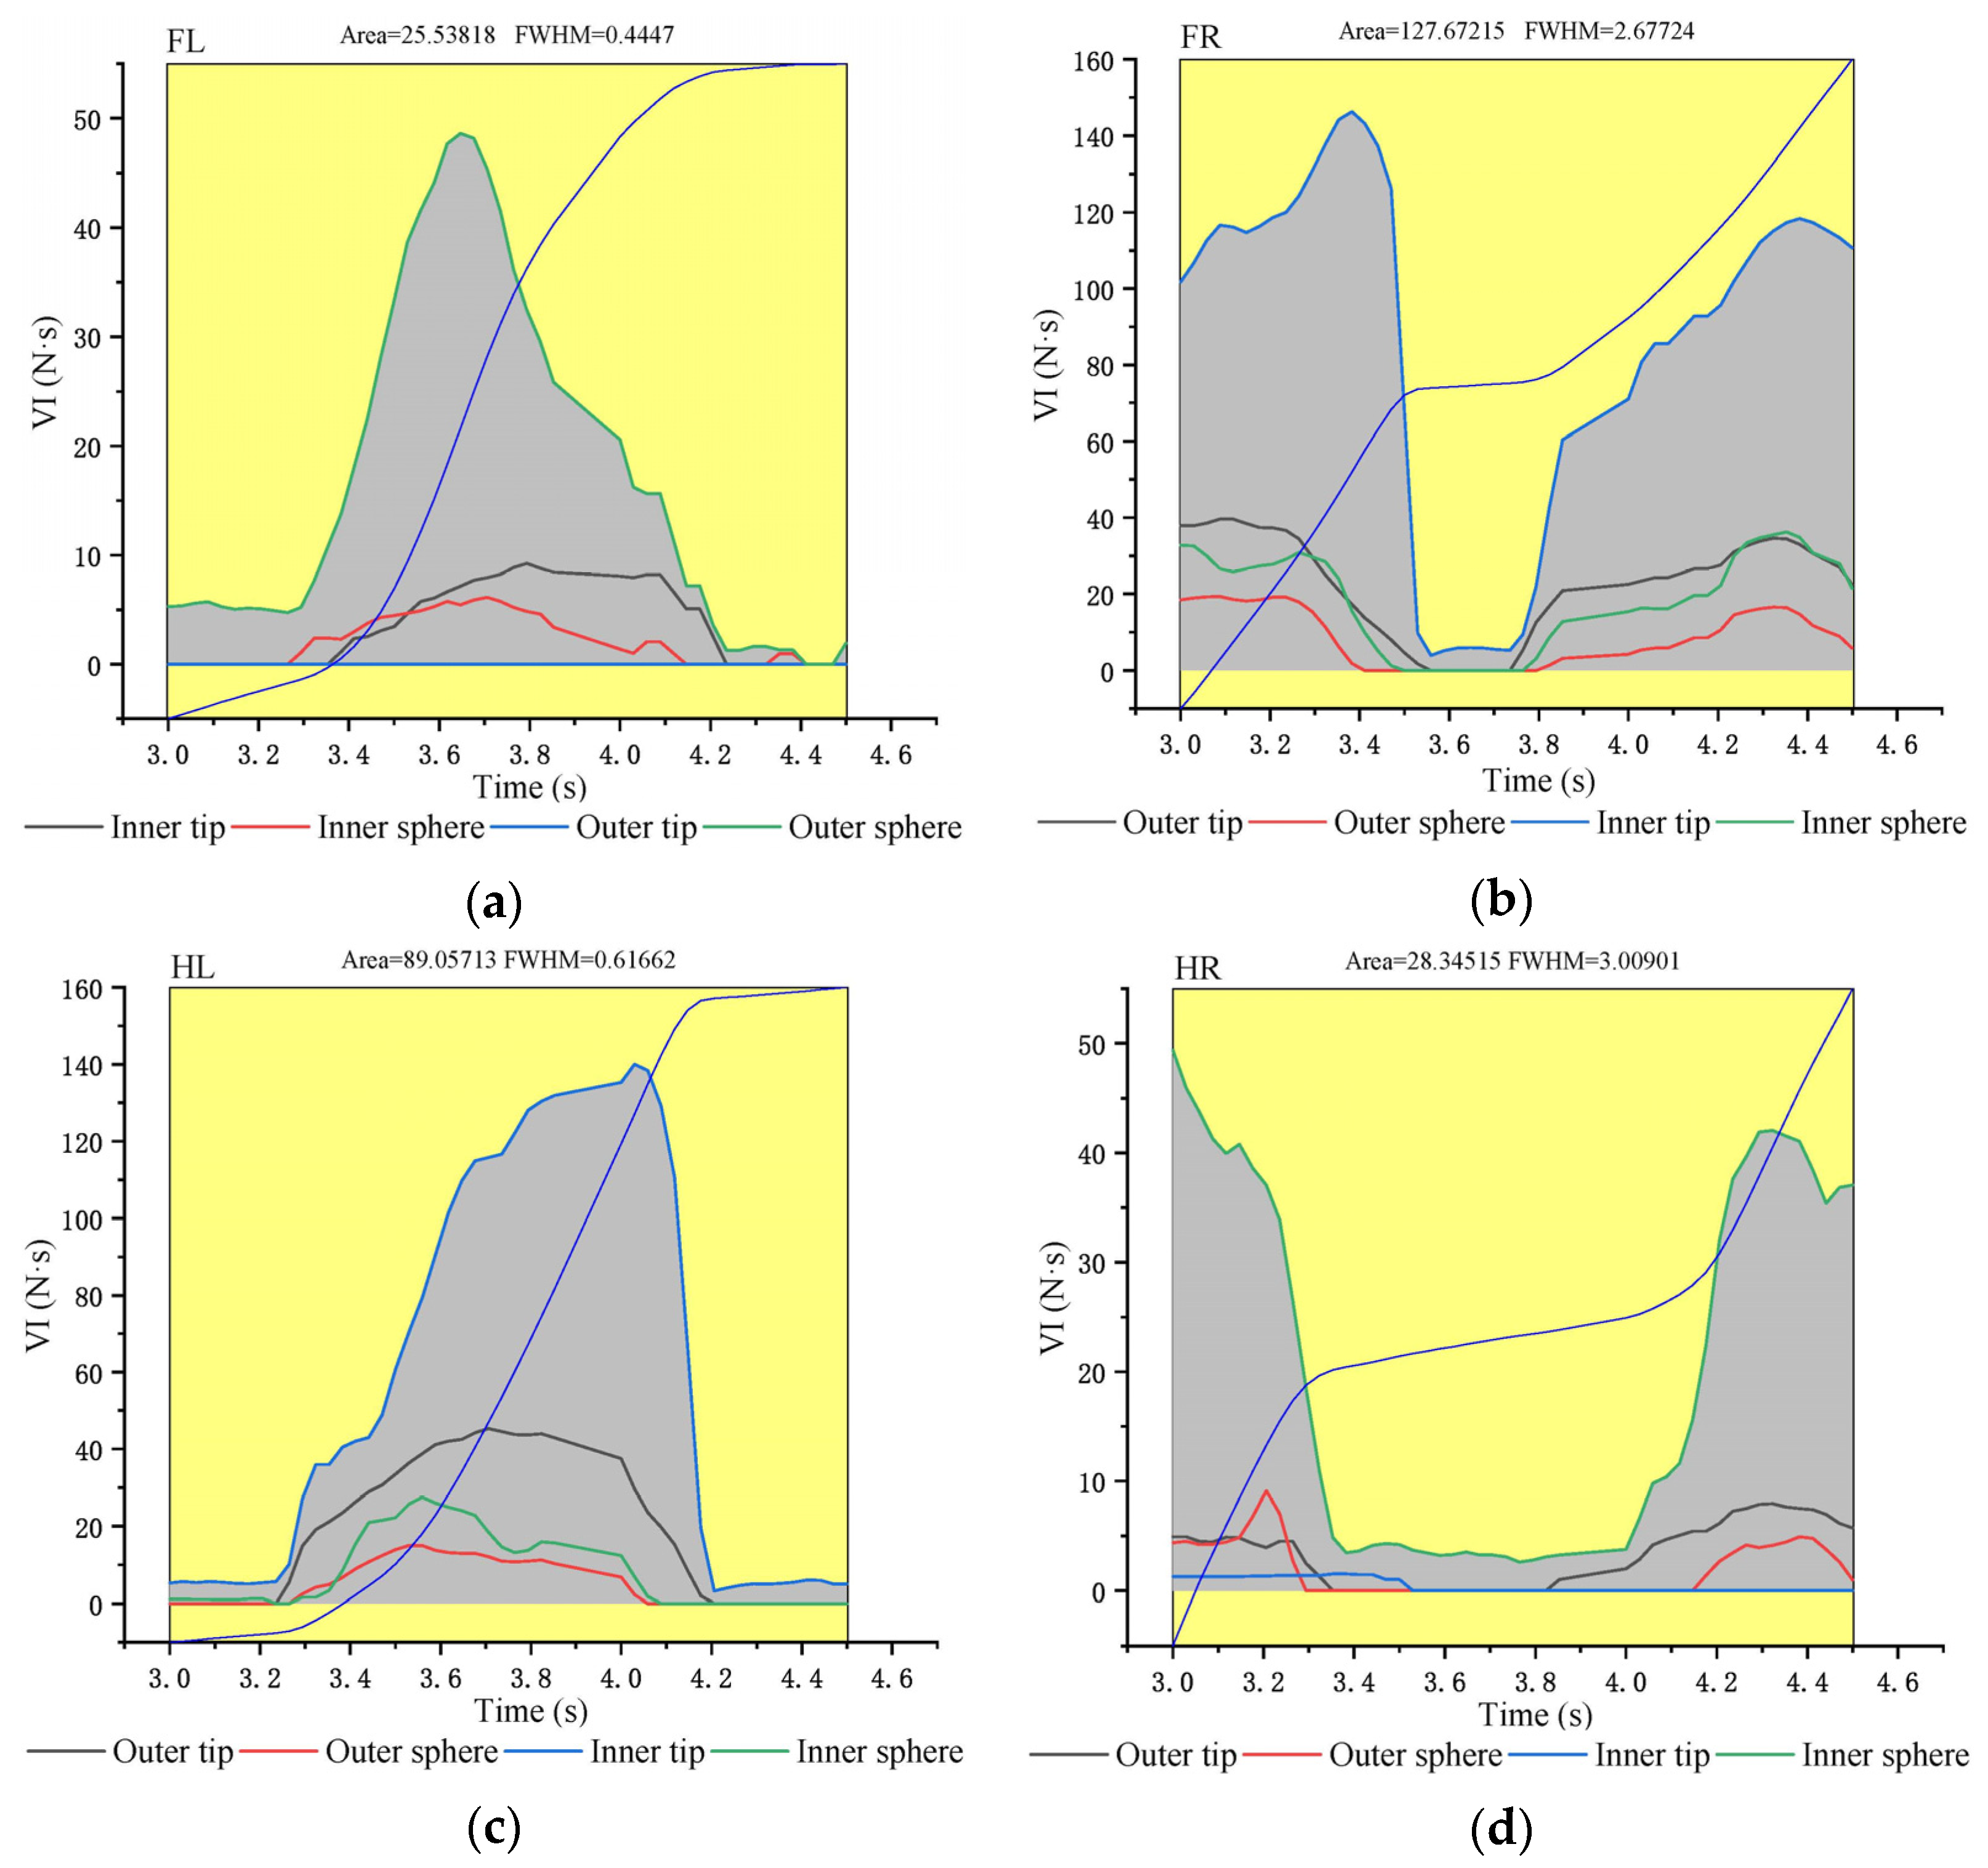
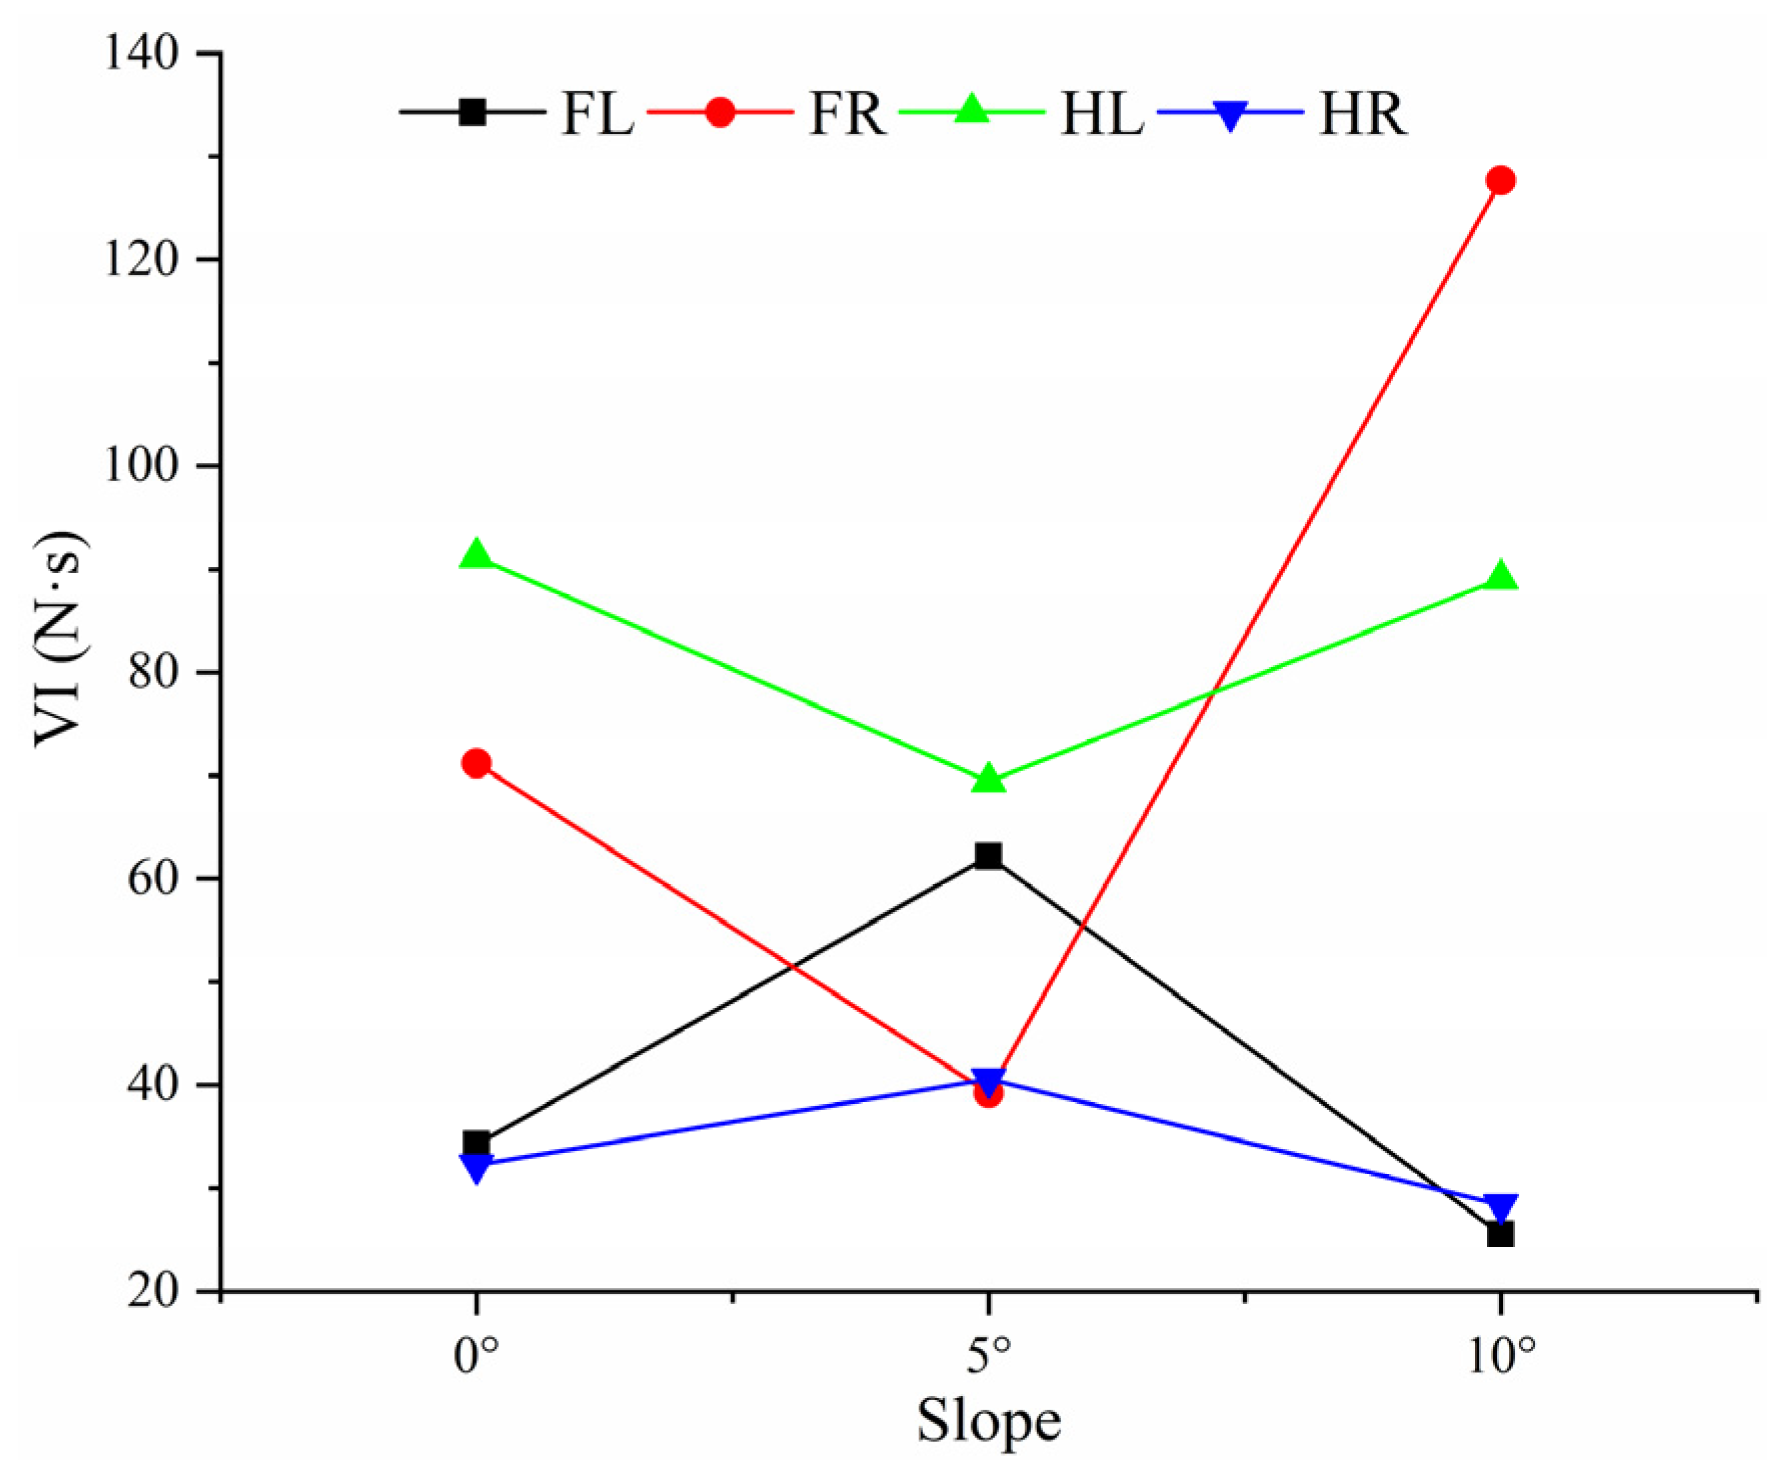
3.2. Analysis of the VI of Characteristic Functional Parts of Goat Hoofs Bottom under Multi-Slope

The VI of the characteristic functional parts of the hoof sole under the 0-degree slope was analyzed, as shown in Figure 10. The VI of the inner hoof sphere of FL was 34.22 N·s; the VI of the outer hoof tip of FR was 71.17 N·s; the VI of the outer hoof tip of HL was 91.17 N·s; and the VI of the outer hoof tip of HR was 32.24 N·s.
Next, the VI of the characteristic functional parts of the hoof sole under the 5-degree slope was analyzed, as shown in Figure 11. The VI of the outer hoof sphere of FL was 62.15 N·s; the VI of the outer hoof tip of FR was 39.23 N·s; the VI of the outer hoof tip of HL was 69.42 N·s; and the VI of the inner hoof sphere of HR was 40.57 N·s.
The VI of the characteristic functional parts of the hoof sole under the 10-degree slope was analyzed, as shown in Figure 12. The VI of the outer hoof sphere of FL was 25.54 N·s; the VI of the inner hoof tip of FR was 127.67 N·s; the VI of the inner hoof tip of HL was 89.06 N·s; and the VI of the inner hoof sphere of HR was 28.35 N·s.

3.3. Comparative Analysis of the Vertical GRF and VI of Characteristic Functional Parts of Goat Hoof under Multi-Slope

The changes of the peak vertical GRF of the characteristic functional parts of the hoof sole under different slopes were analyzed, as shown in Figure 13 and Table 3. With the increase of the slope, the peak vertical GRF of FR and HL decreased first and then increased significantly, and the force was transferred from the outer hoof tips to the inner hoof tips. The peak vertical GRF of FL increased first and then decreased, and the force was transferred from the inner hoof sphere to the outer hoof sphere. The peak vertical GRF of HR decreased all the time, and the force was transferred from the outer hoof tip to the inner hoof sphere. On the whole, the main bearing force of the goat hoofs was transferred from HL to FR; the force change of FR was the most significant.
The changes of VI of the characteristic functional parts of the hoof sole under different slopes were analyzed, as shown in Figure 14 and Table 4. With the increase of the slope, the VI of FR and HL decreased first and then increased greatly, and the FL and HR increased first and then decreased. Among them, FR showed a jump trend under the 10-degree slope, indicating that the tip of the goat hoof played an obvious role in the climbing process, and the accumulation of force was the most pronounced on FR.

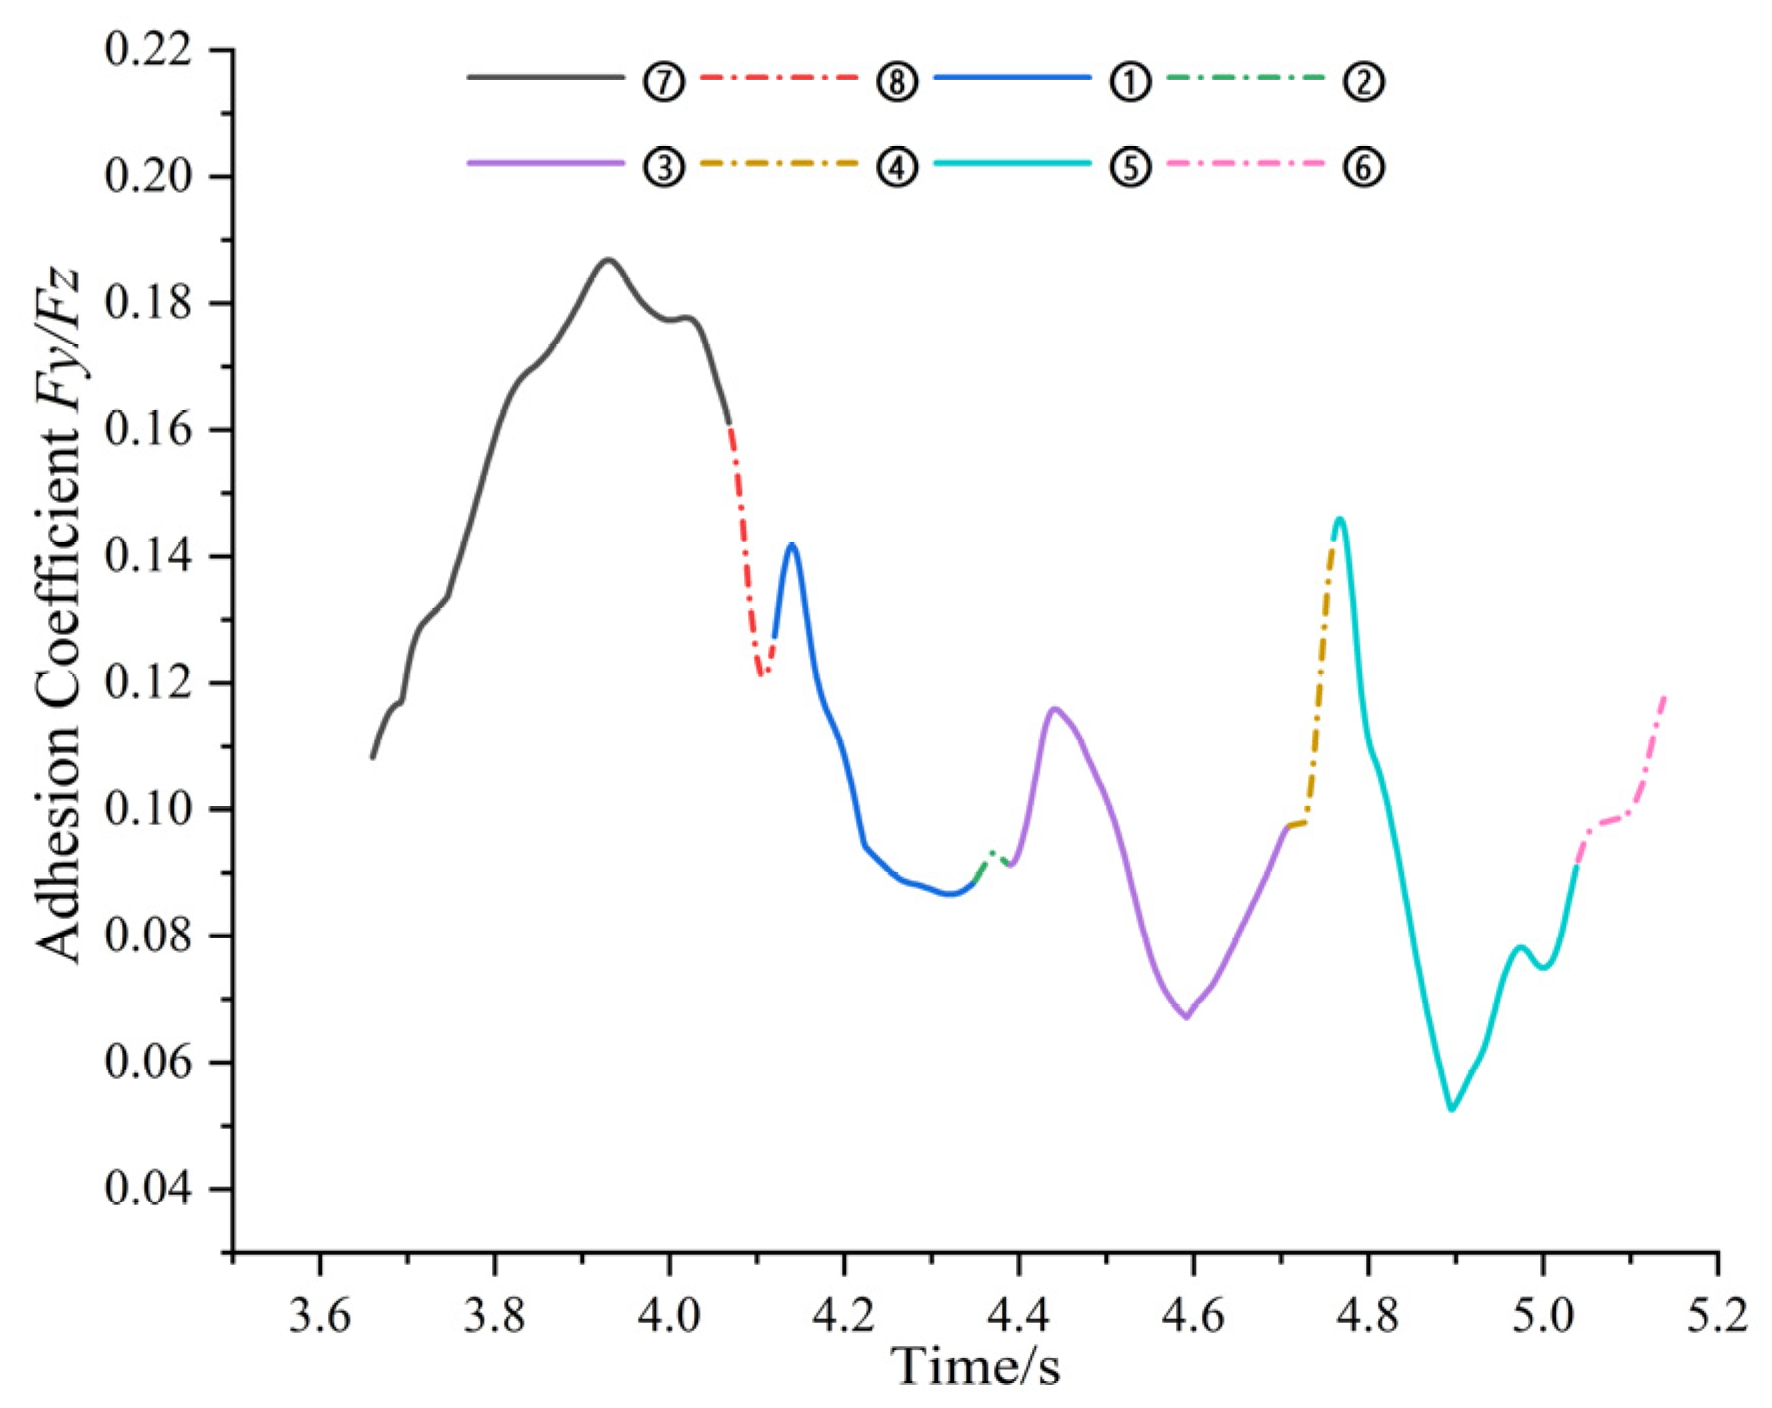
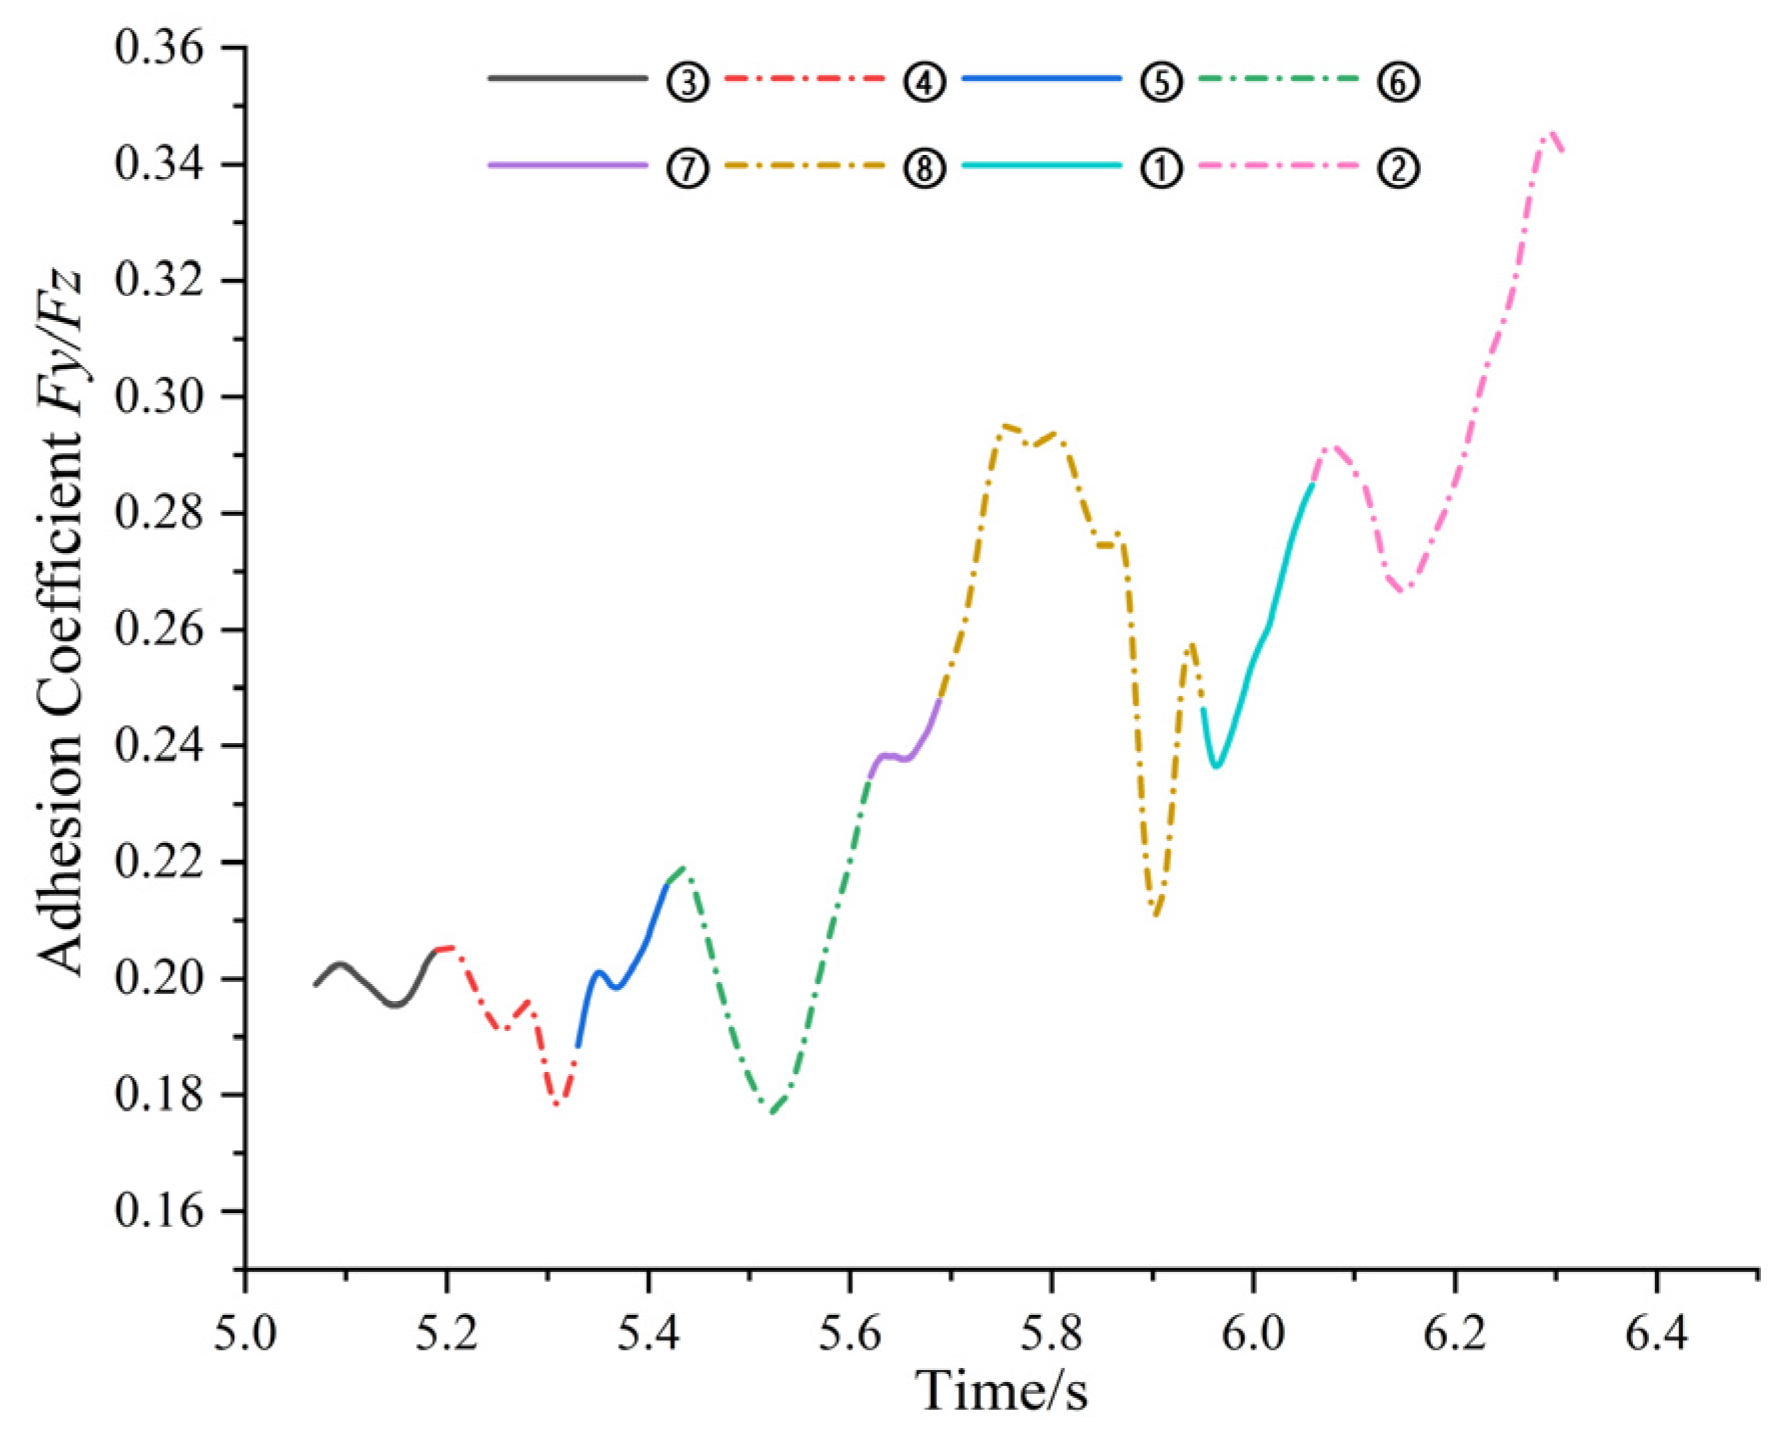
3.4. Analysis of Adhesion Coefficient of Goat Hoof Bottom under Multi-Slope

In order to analyze the force of the goat during the climbing process, and then quantitatively describe the adhesion performance of the goat hoofs. Taking the goat body as a whole, the spatial three-dimensional force was analyzed, and the spatial three-dimensional force distribution is shown in Figure 15.
Where, F x is the spatial lateral force, F y is the spatial forward driving force, F z is the vertical GRF, F h is the spatial three-dimensional resultant force. Since the spatial three-dimensional vertical plate is subjected to friction during the goat walking, noise will be generated, and the data analysis will be affected. The moving, lowess, loess, sgolay, rlowess and rloess data smoothing methods were used. The signal-to-noise ratio (SNR), root mean square error (RMSE), and coefficient of determination (R2) were used as evaluation indicators. Moreover, the optimal data smoothing method was selected as the final pressure denoising method. Among them, the denoising results of spatial lateral force, spatial forward driving force, and vertical GRF under the 10-degree slope are shown in Table 5.
The larger the SNR, the higher the signal credibility. The smaller the RMSE, the smaller the deviation between the denoised data and the original data. The larger the R2, the higher the fit between the denoised data and the original data. The comprehensive analysis revealed that the SNR of the data smoothed by the loess method is the largest, the RMSE is the smallest, the R2 is the largest, and the denoising effect is the best. The comparison of force values before and after denoising is shown in Figure 16.
It can be seen from Figure 16 that the spatial three-dimensional force during goat movement was mainly manifested as the spatial forward driving force and vertical GRF. The concept of adhesion coefficient is introduced to quantitatively describe the change in adhesion during goat movement. The attachment coefficient is calculated as follows:
μ = F y F z
where, F y and F z were taken as instantaneous state values during goat movement. The force value with the sampling interval of 0.01 s was retained to accurately analyze the changes in the adhesion coefficient of the goat hoof bottom under different slopes. Under the 0-degree slope, the data in a complete gait cycle from 2.615 s (when FL and HR were diagonally supported in two phases, FR touched the ground completely, and HL swung alone) to 3.789 s (when FL and HR were diagonally supported in two phases, HL raised the ground completely, and FR swung alone) were intercepted to analysis. The change curve of the adhesion coefficient is shown in Figure 17, where the solid line indicates the three-phase support state, and the dashed line indicates the two-phase support state.
According to Figure 17, under the 0-degree slope, the change in adhesion coefficient had obvious regularity. Analyzing the support time of each gait, the three-phase support state was mostly used, accounting for 65.11% of the whole gait cycle. When the time was 2.647 s in gait ⑦, FL and HR were diagonally supported in two phases: FR touched the ground completely and HL swung alone. The adhesion coefficient was the largest, and μ was 0.2292.
Under the 5-degree slope, the data in a complete gait cycle from 3.660 s (when FL and HR were diagonally supported in two phases, FR touched the ground completely, and HL swung alone) to 5.130 s (when FL and HR were diagonally supported in two phases, HL raised the ground completely, and FR swung alone) were intercepted to analysis. The change curve of the adhesion coefficient is shown in Figure 18, where the solid line indicates the three-phase support state, and the dashed line indicates the two-phase support state.
According to Figure 18, under the 5-degree slope, the change in adhesion coefficient had obvious regularity; as time changed, the adhesion coefficient reached four peaks, which were in the three-phase support state. Analyzing the support time of each gait, it is found that the three-phase support state was mostly used, accounting for 83.78% of the whole gait cycle. When the time was 3.930 s in gait ⑦, FL and HR were diagonally supported in two phases: FR touched the ground completely and HL swung alone. The adhesion coefficient was the largest, and μ was 0.1868. At the same time, the gait accounted for the longest time in the whole gait cycle, which was 28.28%.
Under the 10-degree slope, the data in a complete gait cycle from 5.070 s (when FR and HL were diagonally supported in two phases, FL touched the ground completely, and HR swung alone) to 6.310 s (when FR and HL were diagonally supported in two phases, HR raised the ground completely, and FL swung alone) were intercepted to analysis. The change curve of the adhesion coefficient is shown in Figure 19, where the solid line indicates the three-phase support state, and the dashed line indicates the two-phase support state.
According to Figure 19, under the 10-degree slope, the change in adhesion coefficient had obvious regularity, showing an upward trend as a whole, reaching four peaks during the period, which were all in the two-phase support state. Analyzing the support time of each gait, the two-phase support state was mostly used, accounting for 68.80% of the whole gait cycle. When the time was 6.294 s in gait ②, FR and HL were diagonally supported in two phases: HR raised the ground completely and FL swung alone. The adhesion coefficient was the largest, and μ was 0.3455. At the same time, the gait accounted for the longest time in the whole gait cycle, which was 20.80%.
Comparing and analyzing the gait support time under different slopes, the three-phase support state under the 0 and 5-degree slopes was adopted by a goat, and the two-phase support state under the 10-degree slope was adopted. Comparing and analyzing the changes in adhesion coefficient under different slopes, the peak value of adhesion coefficient was the lowest under the 5-degree slope, and the peak value of adhesion coefficient was the highest under the 10-degree slope. At this time, FR and the HL were diagonally supported in two phases. Combining with the analyses of the vertical GRF and VI, the inner hoof flap of FR was selected as the bionic prototype, and then the bionic hoof tip track pattern structure will be designed.
In conclusion, hoof tips play a decisive role in goat movement. Under the 10-degree slope, the adhesion coefficient is optimal when FR and HL are supported diagonally in two phases, and the inner hoof tip of FR is the significant functional part.

4. Conclusions

To optimize the design of the agricultural track pattern structure, the Saanen goat was taken as the experimental subject, and the hoof tips and hoof spheres were taken as the characteristic functional parts. The change laws of pressure distribution and adhesion coefficient of goat hooves were studied. Specific conclusions are as follows:
With the increase in slope, the GRF is transferred from the HL to FR, and the force change of FR is the most significant, indicating that the accumulation of force is the most pronounced on FR.
Under the 10-degree slope, the peak vertical GRF and VI of the inner tip of FR are the largest, indicating that the tip of the goat hoof plays an obvious role in the climbing process.
Under the 10-degree slope, the adhesion coefficient of FR and HL in the diagonal two-phase supported state is the largest.
Therefore, the inner hoof tip of FR is selected as the bionic prototype to design the bionic track pattern structure.
At present, this study only analyzed the vertical GRF and VI under the 0, 5, and 10-degree slopes by combining the two functional parts of the goat hoof tips and hoof spheres. The movement characteristics of the functional parts of the goat hoof bottom under a larger slope and the role of other functional parts in goat climbing remain to be studied.

Author Contributions

Conceptualization, F.Z.; data acquisition, X.W., X.C., Y.Q. and S.T.; data analysis, X.W., X.C., Y.Q. and S.T.; project administration, F.Z. and S.F.; writing—original draft, X.W. and X.C.; supervision, S.A. All authors have read and agreed to the published version of the manuscript.

Funding

This paper is supported by the National Natural Science Foundation of China (Grant No. 52075149), Frontier Exploration Projects of Longmen Laboratory (Grant No. LMQYTSKT032), the National Key Research and Development Program of China project (No. 2017YFD0301106), the Scientific and Technological Project of Henan Province (Grant No. 232102111119 and 222102110196), and Colleges and Universities of Henan Province Youth Backbone Teacher Training Program (Grant No. 2017GGJS062).

Institutional Review Board Statement

Not applicable.

Data Availability Statement

The data that support the findings of this study are available from the corresponding authors upon reasonable request.

Conflicts of Interest

The authors declare that they have no known competing financial interests or personal relationships that could have appeared to influence the work reported in this paper.

References

  1. He, J.; Wu, D.L.; Ma, J.S.; Wang, H.K.; Yang, Y.L. The influence law of grouser shape on soil slide sinkage when tracked vehicle travels on soft road. J. Multi-Body Dyn. 2019, 234, 225–237. [Google Scholar] [CrossRef]
  2. Li, J.Z.; Liu, S.J.; Dai, Y. Effect of grouser height on tractive performance of tracked mining vehicle. J. Braz. Soc. Mech. Sci. Eng. 2017, 39, 2459–2466. [Google Scholar] [CrossRef]
  3. Shaikh, S.A.; Li, Y.M.; Zheng, M.; Chandio, F.A.; Ahmad, F.; Tunio, M.H.; Abbas, I. Effect of grouser height on the tractive performance of single grouser shoe under different soil moisture contents in clay loam terrain. Sustainability 2023, 13, 1156. [Google Scholar] [CrossRef]
  4. Xue, L.; Xie, B.F.; Lin, F.; Cheng, S.; Li, L.; Liu, M.H.; Li, J. Field traction performance test analysis of bionic paddy wheel and vaned wheel. Biomimetics 2022, 7, 185. [Google Scholar] [CrossRef] [PubMed]
  5. Zhang, R.; Pang, H.; Ji, Q.L.; Li, G.Y.; Dong, W.C.; Wen, L.G.; Li, J.Q. Structure design and traction trafficability analysis of multi-posture wheel-legs bionic walking wheels for sand terrain. J. Terramech. 2020, 91, 31–43. [Google Scholar] [CrossRef]
  6. Cai, Q.; Ma, W.B.; Rao, Q.H.; Li, G.X. Optimization design of bionic grousers for the crawled mineral collector based on the deep-sea sediment. Mar. Georesour. Geotechnol. 2020, 38, 48–56. [Google Scholar]
  7. Liang, C.; Ji, L.; Mousavi, H.; Sandu, C. Evaluation of tire traction performance on dry surface based on tire-road contact stress. In 30th SIAR International Congress of Automotive and Transport Engineering: Science and Management of Automotive and Transportation Engineering (SWAT); Universitatea Craiova: Craiova, Romania, 2020. [Google Scholar]
  8. Xu, F.; Rao, Q.H.; Ma, W.B. Track shoe structure optimization of deep-sea mining vehicle based on new rheological calculation formulae of sediment. Mech. Based Des. Struct. Mach. 2019, 47, 479–496. [Google Scholar] [CrossRef]
  9. Gan, L.J.; Huang, Q.Q.; Chen, S. Design and traction performance research on the ostrich-foot sandy track shoe. Mech. Sci. Technol. Aerosp. Eng. 2022, 41, 673–680. [Google Scholar]
  10. Zhang, R.; Li, G.Y.; Qiao, Y.; Jiang, L.; Li, J.Q. Analysis for effect of tire tread element of imitation reindeer plantar morphology on tire anti-skid performance. Trans. Chin. Soc. Agric. Eng. 2019, 35, 47–54. [Google Scholar]
  11. He, Y.H.; Han, D.L.; Li, G.Y.; Luo, G.; Zhang, R. Bionic design and performance analysis of adaptive low vibration walking wheel. Trans. Chin. Soc. Agric. Mach. 2018, 49, 418–426. [Google Scholar]
  12. Wang, G.L.; Mei, Y.; Zhou, H.C.; Liu, C.Z. Vibration reduction mechanism of cat claw pad and its bionic application in tire pattern. J. Vib. Shock 2022, 41, 128–136. [Google Scholar]
  13. Liu, C.Z.; Li, Y.Q.; Sun, Y.F.; Xie, M.Y.; Xu, C.W. Crown design of radial tire bio-inspired by cat paw pads. Mech. Sci. Technol. Aerosp. Eng. 2022, 41, 186–191. [Google Scholar]
  14. Li, Y.L.; Liu, C.Z.; Yuan, Y.; Li, Y.Q.; Sun, Y.F. Cat-paw pad bionic design of motorcycle tire crown. Mech. Sci. Technol. Aerosp. Eng. 2020, 39, 1505–1510. [Google Scholar]
  15. Han, D.L.; Zhang, R.; Yu, G.L.; Jiang, L.; Li, D.; Li, J.Q. Study on bio-inspired feet based on the cushioning and shock absorption characteristics of the ostrich foot. PLoS ONE 2020, 15, e0236324. [Google Scholar] [CrossRef] [PubMed]
  16. Liu, Y.W.; Liu, S.W.; Mei, T.; Wu, X.; Li, Y. Design and analysis of a bio-inspired tracked wall-climbing robot with spines. Robot 2019, 41, 526–533. [Google Scholar]
  17. Ma, S.S. Bionic Research in Surface of Traveling-Sand Wheel Based on Adhesion Property of Ostrich Planta; Jilin University: Changchun, China, 2017. [Google Scholar]
  18. Xu, P.; Ding, L.; Gao, H.B.; Zhou, R.Y.; Li, N. Environmental characterization and path planning for legged robots considering foot-terrain interaction. J. Mech. Eng. 2020, 56, 21–33. [Google Scholar]
  19. Liu, X.Y.; Kui, H.L.; Qian, Z.H.; Ren, L. Vertical ground reaction force characteristics of blue sheep based on different slopes walking. J. Zhejiang Univ. 2021, 55, 1668–1675, 1704. [Google Scholar]
  20. Liu, X.Y.; Kui, H.L.; Qian, Z.H.; Ren, L. Hoof pressure distribution pattern of blue sheep during walking on different slopes: A subject-specific analysis. Front. Vet. Sci. 2021, 8, 633509. [Google Scholar] [CrossRef]
  21. Li, G.Y.; Zhang, R.; Han, D.L.; Pang, H.; Yu, G.L.; Cao, Q.Q.; Wang, C.; Kong, L.X.; Wang, C.J.; Dong, W.C.; et al. Forelimb joints contribute to locomotor performance in reindeer (Rangifer tarandus) by maintaining stability and storing energy. PeerJ 2020, 8, e10278. [Google Scholar] [CrossRef]
  22. Rifkin, R.E.; Grzeskowiak, R.M.; Mulon, P.Y.; Adair, H.S.; Biris, A.S.; Dhar, M.; Anderson, D.E. Use of a pressure-sensing walkway system for biometric assessment of gait characteristics in goats. PLoS ONE 2019, 14, e0223771. [Google Scholar] [CrossRef]
  23. Fahie, M.A.; Cortez, J.C.; Ledesma, M.; Su, Y.H. Pressure mat analysis of walk and trot gait characteristics in 66 normal small, medium, large, and giant breed dogs. Front. Vet. Sci. 2018, 5, 256. [Google Scholar] [CrossRef] [PubMed]
  24. Pitti, L.; Oosterlinck, M.; Díaz-Bertrana, M.L.; Carrillo, J.M.; Rubio, M.; Sopena, J.; Santana, A.; Vilar, J.M. Assessment of static posturography and pedobarography for the detection of unilateral forelimb lameness in ponies. BMC Vet. Res. 2018, 14, 151. [Google Scholar] [CrossRef]
  25. Oosterlinck, M.; Dumoulin, M.; Van de Water, E.; Pille, F. Biomechanical aspects of farriery in horses. Vlaams Diergeneeskd. Tijdschr. 2017, 86, 256–265. [Google Scholar]
  26. Panagiotopoulou, O.; Pataky, T.C.; Day, M.; Hensman, M.C.; Hensman, S.; Hutchinson, J.R.; Clemente, C.J. Foot pressure distributions during walking in African elephants (Loxodonta Africana). R. Soc. Open Sci. 2016, 3, 160203. [Google Scholar] [CrossRef] [PubMed]
  27. Zhang, Q. Study on Anti-Slip and Buffer Characteristics of Goat Foot and Design of Bionic Foot; Jilin University: Changchun, China, 2019. [Google Scholar]
  28. Qian, Z.H.; Miao, H.B.; Shang, Z.; Ren, L.Q. Foot-ground contact analysis of German shepherd dog in walking, trotting and jumping gaits. J. Jilin Univ. 2014, 44, 1692–1697. [Google Scholar]
  29. Zhang, F.; Cui, X.H.; Wang, S.Q.; Sun, H.X.; Wang, J.J.; Wang, X.Y.; Fu, S.L.; Guo, Z.J. Analysis of kinematic characteristics of Saanen goat spine under multi-slope. Biomimetics 2022, 7, 181. [Google Scholar] [CrossRef] [PubMed]
  30. Zhang, F.; Zhang, C.C.; Teng, S.; Cui, X.H.; Ali, S.; Wang, X.Y. Research on the adhesive performance of a biomimetic goat hoof track shoe pattern. Biomimetics 2022, 7, 80. [Google Scholar] [CrossRef]
  31. Zhang, F.; Teng, S.; Wang, Y.F.; Guo, Z.J.; Wang, J.J.; Xu, R.L. Design of bionic goat quadruped robot mechanism and walking gait planning. Int. J. Agric. Biol. Eng. 2020, 13, 32–39. [Google Scholar] [CrossRef]
Figure 1. The plantar pressure plate.
Agriculture 14 00451 g001
Figure 2. The motion test platform consists of ① the motion capture system, ② 6-DoF motion platform, and ③ the three-dimensional biomechanical force measuring table.
Agriculture 14 00451 g002
Figure 3. Marking of the position of the reflective ball.
Agriculture 14 00451 g003
Figure 4. The position of sensors.
Agriculture 14 00451 g004
Figure 5. Sensor.
Figure 5. Sensor.
Agriculture 14 00451 g005
Figure 6. The trajectory of the third marker of the limbs along the directions of X, Y, and Z under the different slopes.
Agriculture 14 00451 g006
Figure 7. Vertical GRF of characteristic functional parts under the 0-degree slope. (a) FL; (b) FR; (c) HL; and (d) HR.
Agriculture 14 00451 g007
Figure 8. Vertical GRF of characteristic functional parts under the 5-degree slope. (a) FL; (b) FR; (c) HL; and (d) HR.
Agriculture 14 00451 g008aAgriculture 14 00451 g008b
Figure 9. Vertical GRF of characteristic functional parts under the 10-degree slope. (a) FL; (b) FR; (c) HL; and (d) HR.
Agriculture 14 00451 g009
Figure 10. VI of characteristic functional parts under the 0-degree slope. (a) FL; (b) FR; (c) HL; and (d) HR.
Agriculture 14 00451 g010
Figure 11. The VI of characteristic functional parts under the 5-degree slope. (a) FL; (b) FR; (c) HL; and (d) HR.
Agriculture 14 00451 g011aAgriculture 14 00451 g011b
Figure 12. The VI of characteristic functional parts under the 10-degree slope. (a) FL; (b) FR; (c) HL; and (d) HR.
Agriculture 14 00451 g012
Figure 13. The changes of peak vertical GRF of the characteristic functional parts of the hoof bottom under different slopes.
Agriculture 14 00451 g013
Figure 14. The changes of VI of the characteristic functional parts of the hoof bottom under different slopes.
Agriculture 14 00451 g014
Figure 15. Three-dimensional force distribution diagram of goat.
Agriculture 14 00451 g015
Figure 16. Comparison of force values before and after denoising.
Agriculture 14 00451 g016
Figure 17. Change in adhesion coefficient under the 0-degree slope.
Agriculture 14 00451 g017
Figure 18. The change in adhesion coefficient under the 5-degree slope.
Agriculture 14 00451 g018
Figure 19. The change in adhesion coefficient under the 10-degree slope.
Agriculture 14 00451 g019
Table 1. The hoof track of the sheep’s hoof touching the ground.
First TouchdownSecond Touchdown
Touch the GroundTouch the Ground CompletelyOff the GroundTouch the GroundTouch the Ground CompletelyOff the Ground
HRAgriculture 14 00451 i001Agriculture 14 00451 i002Agriculture 14 00451 i003Agriculture 14 00451 i004Agriculture 14 00451 i005Agriculture 14 00451 i006
FRAgriculture 14 00451 i007Agriculture 14 00451 i008Agriculture 14 00451 i009Agriculture 14 00451 i010Agriculture 14 00451 i011Agriculture 14 00451 i012
HLAgriculture 14 00451 i013Agriculture 14 00451 i014Agriculture 14 00451 i015Agriculture 14 00451 i016Agriculture 14 00451 i017Agriculture 14 00451 i018
FLAgriculture 14 00451 i019Agriculture 14 00451 i020Agriculture 14 00451 i021Agriculture 14 00451 i022Agriculture 14 00451 i023Agriculture 14 00451 i024
Table 2. The leg lifting sequence.
Gait SequenceFLHLFRHR
0111
0110
1110
1100
1101
1001
1011
0011
0111
Table 3. Comparison of the variation of the peak vertical GRF of the characteristic function parts of the hoof bottom under different slopes.
0°(N)5°(N)10°(N)The Variation from 0° to 5°The Variation from 5° to 10°The Variation from 0° to 10°
FL68.36
Inner sphere
92.70
Outer sphere
48.62
Outer sphere
+24.34−44.08−19.74
FR115.23
Outer tip
60.42
Outer tip
146.20
Inner tip
−54.81+85.78+30.97
HL131.67
Outer tip
63.73
Outer tip
139.99
Inner tip
−67.94+76.26+8.32
HR62.51
Outer tip
60.53
Inner sphere
49.35
Inner sphere
−1.98−11.18−13.16
Table 4. Comparison of the variation of the VI of the characteristic function parts of the hoof bottom under different slopes.
0°(N·s)5°(N·s)10°(N·s)The Variation from 0° to 5°The Variation from 5° to 10°The Variation from 0° to 10°
FL34.22
Inner sphere
62.15
Outer sphere
25.54
Outer sphere
+27.93−36.61−8.68
FR71.17
Outer tip
39.23
Outer tip
127.67
Inner tip
−31.94+88.44+56.50
HL91.17
Outer tip
69.42
Outer tip
89.06
Inner tip
−21.75+19.64−2.11
HR32.24
Outer tip
40.57
Inner sphere
28.35
Inner sphere
+8.33−12.22−3.89
Table 5. Denoising results of spatial lateral force, spatial forward driving force, and vertical ground reaction force under the 10-degree slope.
IndexForceMovingLowessLoessSgolayRlowessRloess
SNR F x 1 45.673747.793549.908748.622046.786748.6099
F x 2 34.812436.972339.611037.677333.354836.3560
F y 1 52.237454.633457.687155.415547.682054.7717
F y 2 55.029957.747761.551158.801252.012756.9574
F z 1 57.737262.395967.073565.291149.479056.9990
F z 2 61.040765.528070.117968.345353.791863.0567
RMSE F x 1 0.01960.01530.01200.01390.01720.0140
F x 2 0.01990.01550.01150.01430.02360.0167
F y 1 0.03810.02890.02030.02640.06440.0285
F y 2 0.03830.02800.01810.02480.05420.0307
F z 1 0.10800.06320.03690.04530.27940.1176
F z 2 0.10140.06050.03570.04370.23370.0804
R2 F x 1 0.97560.98500.99080.98760.98110.9876
F x 2 0.98790.99260.99600.99370.98310.9915
F y 1 0.99140.99510.99760.99590.97550.9952
F y 2 0.99520.99740.99890.99800.99030.9969
F z 1 0.99700.99900.99960.99950.97980.9964
F z 2 0.99840.99940.99980.99970.99170.9990
Disclaimer/Publisher’s Note: The statements, opinions and data contained in all publications are solely those of the individual author(s) and contributor(s) and not of MDPI and/or the editor(s). MDPI and/or the editor(s) disclaim responsibility for any injury to people or property resulting from any ideas, methods, instructions or products referred to in the content.

