Article

Effect of Long-Term Different Land Uses on Improving Stable Humic Compounds in Arenosol

by
Kristina Amaleviciute-Volunge
1,*,
Liudmila Tripolskaja
2,
Asta Kazlauskaite-Jadzevice
2,
Alvyra Slepetiene
1 and
Eugenija Baksiene
2
1
Chemical Research Laboratory, Institute of Agriculture, Lithuanian Research Centre for Agriculture and Forestry, Instituto al. 1, Akademija, LT-58344 Kedainiai, Lithuania
2
Voke Branch, Lithuanian Research Centre for Agriculture and Forestry, Zalioji 2, LT-02232 Vilnius, Lithuania
*
Author to whom correspondence should be addressed.
Agriculture 2024, 14(2), 250; https://doi.org/10.3390/agriculture14020250
Submission received: 11 December 2023 / Revised: 11 January 2024 / Accepted: 1 February 2024 / Published: 3 February 2024
(This article belongs to the Special Issue Soil Management for Sustainable Agriculture)

Abstract

:
There has not been enough research conducted on the effect of land use on the composition of humus in Arenosols. This long-term study (1995–2022) aimed to determine the differences in the formation of humic compounds in the natural and agricultural ecosystems of Arenosols. Soil samples were collected from six plots at two soil depths (0–15 and 15–25 cm), with four replicates. Conclusions were reached based on the results of the accumulation of humic substances (HSs) and their qualitative fractional composition, C/N ratio, humification degree (HD), and the optical properties of the humus substances. Afforestation, after 27 years, significantly increased (+6.7 g kg−1) the soil organic carbon (SOC) and influenced the qualitative composition of HS: HA + FA 79.3% of the SOC. Grassland cultivation showed faster (+3.8 g kg−1) SOC sequestration, a higher HA/FA ratio, and an increased HD. Arenosols may be used in crop rotation with approximately 40% leguminous plants to maintain a stable humus balance. Additionally, the effects of mineral fertilisers on the humification processes and humus quality of +2.59 g kg−1 SOC, +1.27 g kg−1 humin in crop rotation, +3.26 g kg−1 SOC, and 2.82 g kg−1 humin in a grass cultivation field were established. For SOC accumulation and a larger humus amount of a better quality, it is recommended that an Arenosol is used, as it is suitable for use in perennial cut grasslands, natural grasslands, and pine afforestation.

1. Introduction

SOC sequestration has two important functions in the ecosystem: to increase soil fertility and to reduce the concentration of atmospheric carbon dioxide through its accumulation in the organic part of the soil. In agricultural arable soils, increasing the amount of SOC improves the physical, chemical, and biological properties of the soil and increases water absorption and erosion resistance [1,2,3,4,5,6,7,8]. This is particularly relevant for low-buffering soils with a light granulometric composition because agricultural activities often lead to the degradation of their properties.
Considerable attention is currently being paid to increasing the sustainability of ecosystems with low-fertility agricultural soils, and there is a need for optimal methods of using these soils to produce feed and food. The farmers of these soils often abandon arable agriculture and switch to other land uses that are suitable for SOC sequestration to prevent the fast mineralisation of soil organic matter (SOM).
Many studies have highlighted the effectiveness of grassy ecosystems in increasing SOC accumulation [6,9,10,11,12,13,14]. In forest ecosystems, compared with grasslands, the accumulation of SOC at the beginning is slower and becomes faster after the formation of abundant tree foliage, which provides a greater amount of organic fallout for the formation of humic substances (HSs) [15,16,17,18,19,20]. However, the ability of land use to accumulate SOC cannot be the main criterion for choosing the type of land use in a certain area, as it is equally important to ensure the necessary amount of food and feed production and to maintain the economic efficiency of these activities [1,12].
The type of land use determines the amount and quality of organic matter that returns to the soil after the harvest of plants or at the end of vegetation; this organic matter later humifies and replenishes the soil humus reserves. The hydrological conditions influencing the intensity of soil microorganism activity are also of great importance for this process, as positive temperatures and optimal soil moisture content are necessary for their optimal activity. In recent decades, climate warming has significantly changed the climatic norms for rainfall and air temperature in various European countries [21,22,23,24]. This not only increases the atmospheric CO2 concentration, but also affects the microbial population and enzymatic activities in the soil [5].
To reduce the concentration of CO2 in the atmosphere through the accumulation of SOC, it is important not only to increase the total amount of SOC, but also to promote the formation of stable humic substances (HSs), which are more resistant to mineralisation. This is because labile carbon compounds are released into the atmosphere during the further destruction of HSs. The stable HSs include humic acids (HAs), which are soluble in alkaline media and insoluble at pH 1.0, and humins (HNs), which are insoluble at all pH values [25,26].
In Lithuania, the fractional composition of humus was studied in [27,28,29]. Other researchers [27] investigated the humus status in clay soils (Endocalca-ri-Endohypogleyic Cambisol) under different tillage regimes. Mockeviciene et al. [28,29] hypothesised that acidic soils (natural acid Dystric Glossic Retisol) would promote organic carbon mineralisation and that it is likely that the concentration of carbon fractions of different stabilities would change during the carbon transformation processes. The changes in organic carbon in the mineral topsoil of formerly cultivated Arenosols under different land uses, the re-naturalisation of ex-arable Arenosols, nitrogen accumulation, and nitrogen leaching as affected by legume crop residues on sandy loam in the eastern Baltic region were analysed in Lithuania.
There is also a lack of knowledge on how humification takes place and on the distribution of humus fractions in differently used Arenosols (natural and agricultural) in Lithuania.
This study aimed to determine the differences in the formation of stable humic compounds in natural (pine afforestation and abandoned land) and agricultural (cropland and managed grassland) ecosystems in Arenosols.

2. Materials and Methods

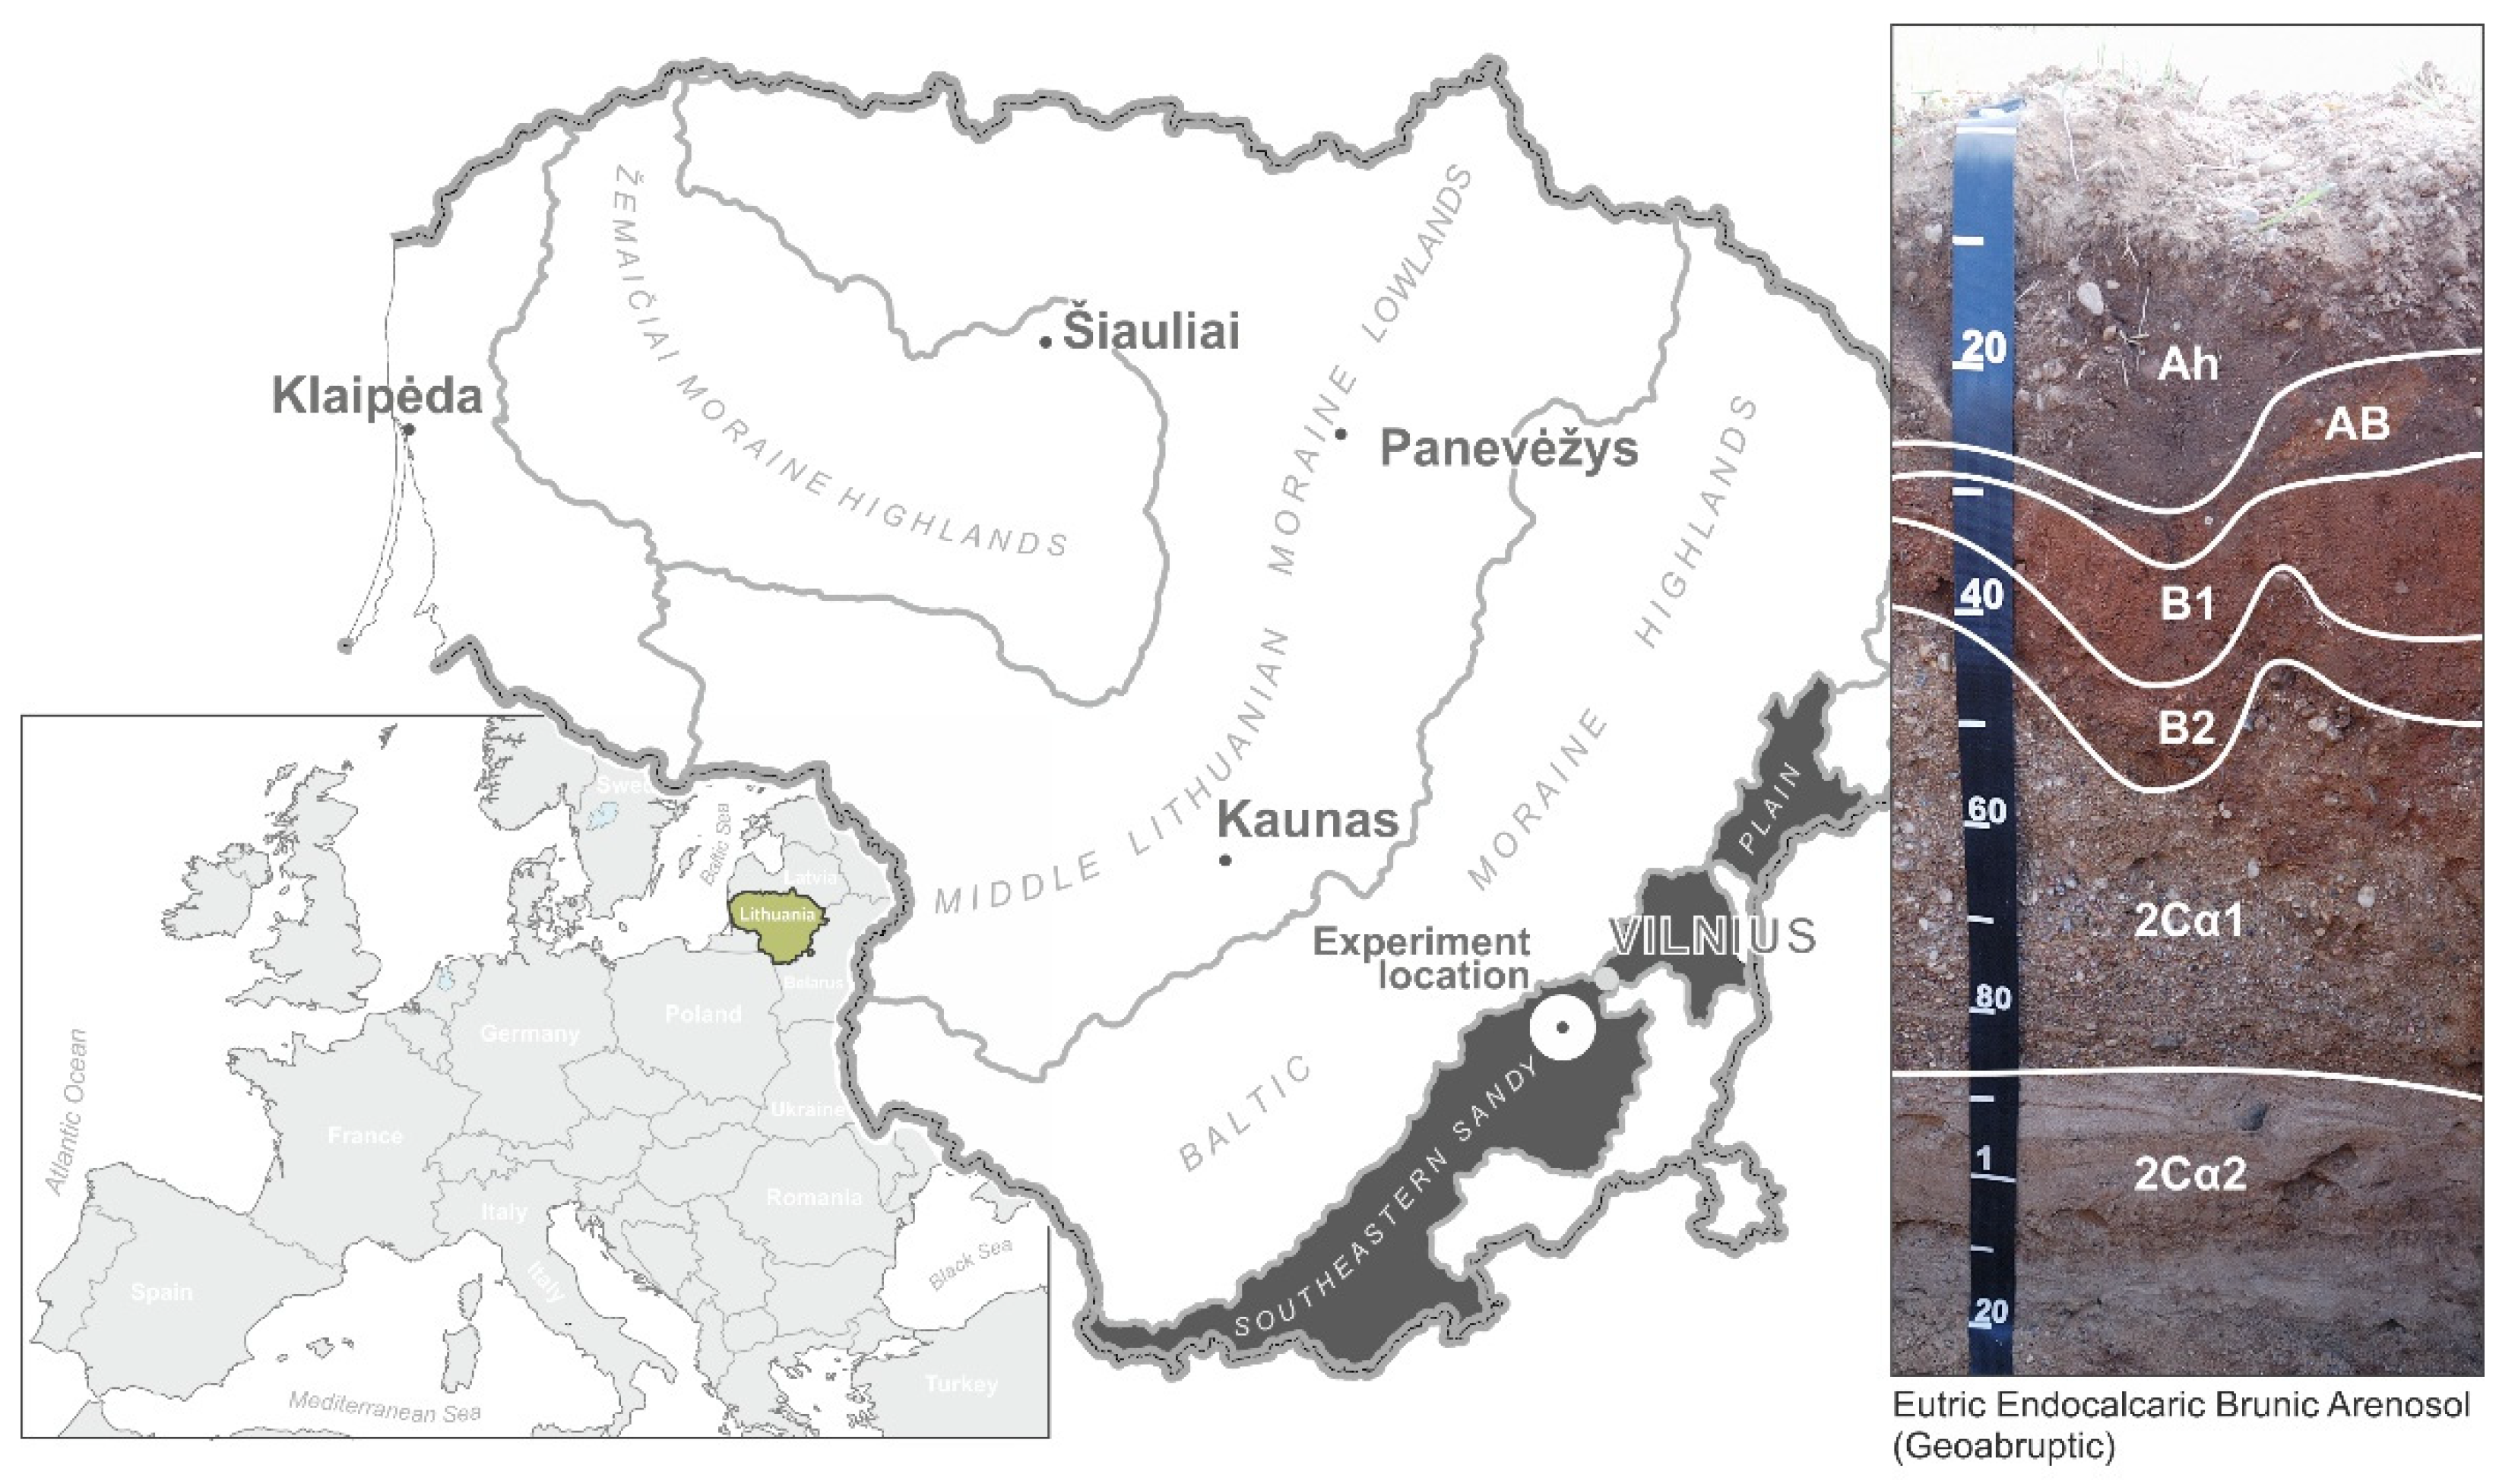
2.1. Study Object and Experimental Site

This research was conducted as a long-term trial of the LAMMC Voke Branch. The experiments were located in eastern Lithuania (NW: 54°33′52.27″ N, 25°05′12.68″ E; NE: 54°33′52.01″ N, 25°05′14.60″ E; SE: 54° 33′48.23″ N, 25°05′12.97″ E, SW: 54°33′48.56″ N, 25°05′10.86″ E). The experimental site represents an agricultural landscape of a stretch of the morainic hummocky uplands of eastern Lithuania. This stretch was formed as a terminal moraine; therefore, it is characterised by an upper layer of sandy loam and loamy sand parent material, which form the sandy soils under study (Figure 1). The experiment was conducted on arable soil that has been used for more than 50 years (until 1995) to grow various grain crops and is fertilised with mineral fertilisers. Table 1 presents the treatments and experimental design.
The clay content of the upper part of the profile was low. In horizon “A”, the content of sand (63 µm–2 mm) was 80.7–83.8%, that of the silt content (2 95–63 µm) was 11.8–14.3%, and the clay content was 4.5–5.4% (WRB 2022). According to the soil texture and structure of the profile (Ah-AB-B1-B2-2Cα1-2Cα2), the soil belonged to the Arenosol group (Eutric Endocalcaric Brunic Arenosol (Geoabruptic)) (WRB 2022) [30]. The upper layer of the soil was relatively low in organic carbon, and its amount was significantly reduced at the AB, B1, and B2 horizons. At a depth of approximately 40(60)–110 cm, the carbonate gravel horizon (2Cα1-2Cα2) began. The upper part of the profile consisted of non-carbonate sand, and the lower part consisted of carbonate pebbles and cobbles. The texture of the profile determined the presence of a geochemical barrier (calcium carbonate) at depths of 40–60 cm.
In the year of the beginning of the experiment (1995), the chemical properties of the soil were as follows: pHKCl 6.0–6.8, available phosphorus 157–188 mg P2O5 kg−1, available potassium 170–194 mg K2O kg−1, and SOC 9.5–9.9 g kg−1. Depending on land use and fertilisation, the soil chemical properties changed over the last 25 years. Without using fertilisers in the agricultural land use (CCunfert and GRunfert), the amount of available phosphorus decreased by 70–106 mg P2O5 kg−1 and that of the available potassium decreased by 94–96 mg K2O kg−1. Fertilisation with mineral fertilisers increased the amount of nutritional elements in the soil. The amounts of mobile elements changed differently in the natural land use area. In the UAL soil, the concentration of phosphorus and potassium did not change significantly, while the PA decreased by 35 mg P2O5 kg−1 and 64 mg K2O kg−1, respectively. The amount of SOC at the beginning of the study was small (9.5–9.9 g kg−1), and during the course of the experiment, it changed depending on the land use and applied agrotechnical measures. The carbon-to-nitrogen ratio (C/N) in 1995 ranged from 12.5 to 13.6, and this was favourable for the transformation of the organic matter in the soil. For the long-term experiment, the experimental land use changes and experimental design are described in more detail in [31].

2.2. Soil Sampling and Chemical Analysis

Soil samples were collected from each of the six plots at two soil depths (0–15 and 15–25 cm), with four replicates (n = 48). The air-dried soil samples were crushed and sieved through 2 mm and 0.25 mm sieves and homogeneously mixed before the visible roots and plant residues were removed manually. Total soil nitrogen (N) was determined using a spectrophotometric measurement procedure at a wavelength of 655 nm after mineralisation with sulfuric acid (H2SO4). The SOC content was determined according to Nikitin’s modified Tyurin method [32], which consisted of dichromate digestion at 160 °C for 30 min and a spectrophotometric measurement at a wavelength of 590 nm using glucose as a standard. The group and fractional compositions of the soil humus were determined using Ponomareva and Plotnikova’s (1980) [33] version of the Tyurin method according to the scheme presented in Figure 2. The following humic acid fractions were identified: HA1—free and weakly bound with clay minerals, referred to as the mobile humic acids fraction; HA2—bound with calcium; HA3—strongly bound with soil clay minerals; the fulvic acid fractions: FA1a—the so-called aggressive fulvic acid fraction; FA1—mobile; FA2—bound with calcium; FA3—bound with soil clay mineral fulvic acid fractions. A more detailed description of the fractionation methodology can be found in the previous studies [27,28,32,33,34].
The humification properties were calculated using the following formula:
Humification degree (HD, %) = ΣHA/SOC × 100
where HA is the humic acid C content (g kg−1), and SOC is the soil organic carbon content (g kg−1).
The “aggressiveness” of HS was calculated using the following formula [27]:
Aggressiveness, % = FA1a/(ΣHA + ΣFA) × 100
where FA1a is the C content of the most aggressive FA1a fraction (g kg−1), HA is the humic acid C content (g kg−1), and FA is the fulvic acid C content (g kg−1).
The C/N ratio was calculated as the relationship between the SOC (g kg−1) and nitrogen content (N, g kg−1) in the soils.
The optical density (specific extinction) of the HS solution was determined as described previously [35]. It is a classic parameter that is closely related to maturity and aromaticity. The absorbance of the HS was measured at 465 and 665 nm in 0.5 M NaOH extracts using a UV–VIS spectrophotometer, and the polydispersity or degree of polymerisation was calculated using the ratio E4/E6.

2.3. Statistical Analysis

All the data were analysed using SAS Enterprise software, version 7.1 (SAS Institute Inc., Cary, NC, USA). All the results for the SOC and humus fractional composition are the means of four field replicates. The differences between the experimental treatments were tested using one-way analysis of variance (ANOVA). The probability level was set at 0.05 and grouped according to letters by Duncan’s test. Standard error (SE) values were used to estimate the deviations of the soil chemical parameters from the mean values.

2.4. Meteorological Conditions during the Experiment (1995–2022)

The study was conducted in east Lithuania, which is a part of Central Europe (the eastern Baltic region). These regions are characterised by a moderate climate, with a mean long-term (1991–2020) annual precipitation value of 678 mm, and an annual mean air temperature of 7.4 °C (standard climate norm—SCN).
During 1995–2022, annual precipitation ranged from 519 mm in 1996 and 1999 to 963 mm in 2010 (SKN 678 mm). The average annual precipitation during this period was 687 mm, which did not differ significantly from that of the 1991–2020 (678 mm) SKN. Based on the regression analysis of the precipitation change during the investigation period, the linear correlation function trend did not show any significant change in its quantity due to climate change (r = 0.08). The relatively rainy years (when the amount of precipitation was 20% higher than the SKN) were 2010, 2011, and 2017; the dry years (when the amount of precipitation was 20% lower than the SKN) were 1996, 1999, 2018, and 2019. The air temperature in Lithuania is rising, as is the case for the whole world. Larger changes began in the last decade of the 20th century and in the 21st century. Compared with the 1961–1990 air temperature SKN, the 1991–2020 SKN increased by +1.0 °C. The winter and spring seasons became warmer by +1.6 °C, summer became warmer by +1.4 °C, and autumn became warmer by +1.3 °C [36]. As the average annual air temperature rises, the duration of plant vegetation changes in Lithuania. Compared to 1961–1991, in the period of 1991–2020, the growing season was 13 days longer. This creates more favourable conditions for the growth of plant biomass and extends the period of the decomposition of organic residues in the soil, as the period of soil freezing is reduced when the microbiological processes in it are significantly slowed down due to negative air temperatures.

3. Results

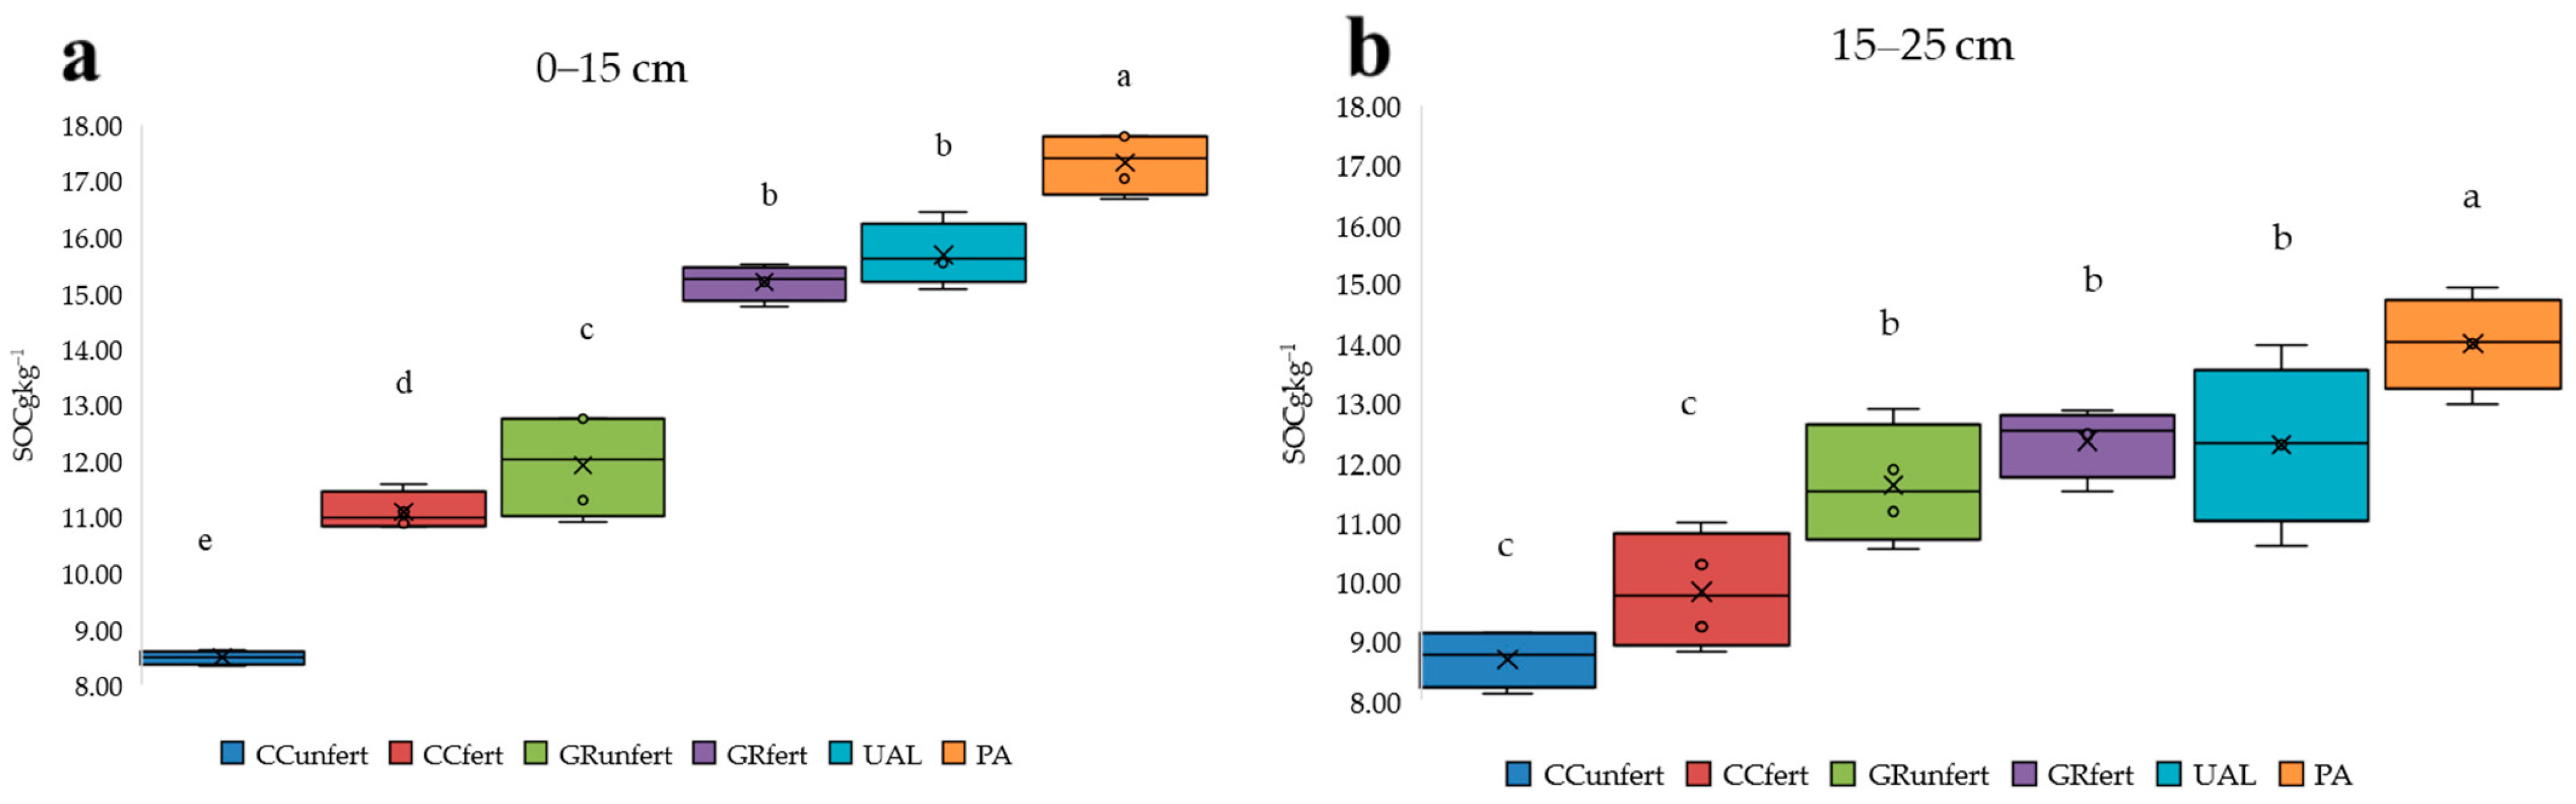
3.1. Distribution of SOC Amounts for Different Land Uses and Depths

The variation in the SOC amount in 1995–2022, according to the data, is given in Figure 3. For the Arenosol, by applying arable farming practices, it is possible to maintain a stable amount if 40% of the crop rotation consists of soil-improving plants (red clover, mixtures of legumes, and cereal plants) and the recommended rates of mineral fertilisers are used.
Without the use of fertilisers, plants produce less biomass, fewer post-harvest residues are returned to the soil, and the SOC content gradually decreases at a rate of −0.7 g kg−1. The SOC amount increased the most, at a rate of +6.7 g kg−1, according to the conversion of arable land use to pine afforestation. The cultivation of grasslands (UAL, GRfert, and GRunfert) on arable land was also effective; the amount of SOC increased substantially by an average of 1.0–3.8 g kg−1 (Figure 3).
The analysis of SOC in 2022 showed that its levels ranged from 8.50 to 17.32 g kg−1 (0–15 cm) and from 8.70 to 13.99 g kg−1 (15–25 cm) (Figure 4a,b; Table S1).
Cropland cultivation (CC) negatively affected the amount of SOC compared to the other land uses. The lowest concentration of SOC was established here in the 0–15 cm layer and in the 15–25 cm layer (8.50 and 8.70 g kg−1, respectively). The accumulation of SOC in the upper layer of horizon A was established during the conversion of arable soil into PA or grass phytocenoses (UAL and GR). Pine cultivation, due to naturally occurring organic forest fallout, was determined to cause the highest SOC amount compared to those of the other treatments. In the upper layer, in all the treatments in this research, 0–15 cm had higher SOC amounts than the deeper 15–25 cm layer because of the accumulation of natural organic matter. The natural ecosystems (PA and UAL) and GRfert showed statistically significant differences in SOC accumulation in the 15–25 cm layers.

3.2. Distribution of Labile and Stable Humus Fractions by Arenosol Use and Depth

One of the best methods used to assess soil quality is to establish the fractional composition of the humus. The HA1 and FA1 fractions are labile; they have the most soluble HA and FA, which are the most likely to form and are the quickest to mineralise. HA1 is free or faintly bound to non-silicate sesquioxides and is insoluble under acidic (pH < 2) conditions, but it is soluble in solutions with higher pH values [27,28,29]. During the mineralisation process, this labile fraction of humus makes the soil valuable in terms of nutrients. This is necessary for plant development and for the formation of aboveground biomass. In the investigated land types, labile humus fractions consist of 42–53% of the total SOC. The different distributions were due to the different uses of Arenosol. The data presented in Figure 5a,b show that the use of an Arenosol as an arable soil led to a decrease in the amounts of labile HA, FAa1, and FA, while in the uncultivated abandoned land and managed grassland, they increased: PA (HA1 6.19 C g kg−1, FA1 2.29 C g kg−1 FAa1 0.79 C g kg−1); UAL (HA1 4.88 C g kg−1, FA1 1.98 C g kg−1 FAa1 0.59 C g kg−1); and GRfert (HA1 3.99 C g kg−1, FA1 1.97 C g kg−1). In the deeper soil layer at 15–25 cm, the same trend as in the upper layer was determined. Their amounts varied as follows: HA1 2.28–4.93 C g kg−1, FA1 1.04–1.72 C g kg−1, and FA1 0.29–0.68 C g kg−1. Significantly higher amounts of labile HS were found in the PA as well as in the GRfert and UAL in the deeper layers. The humus labile fractions (HA1, FAa1, and FA1) in the differently used Arenosols at 0–15 cm decreased in the following order: PA > UAL > GRfert > GRunfert < CCfert < CCunfert, respectively; 15–25 cm: PA > GRfert > UAL > GRunfert < CCfert < CCunfert (Table S2).
On closer examination, based on the data in Figure 5c,d, it could be stated that the HA2 quantity was higher in CCunfert at 0.89 C g kg−1 (0–15 cm) and UAL at 0.70 C g kg−1 (15–25 cm). GRunfert and GRfert contained the lowest amounts of HA2. Thus, the opposite regularity of the distribution of FA2 compared to that of HA2 by land use was established. A smaller amount of FA2 was found in the CCunfert land type compared to those of the other treatments. Larger amounts of FA2 were found in the upper layers of CC and PA than those in the lower layers, and the opposite was true in the grassland (Table S2). The fractions of HA2 and FA2 were associated with Ca and were the most agronomically valuable humus fractions. These humus fractions comprise the smallest part of the humus (0–15 cm 4–12%; 15–25 cm 6–10%). Based on these results, it can be stated that a higher amount of HA2 bound to Ca was found in the upper layer than that in the deeper layers in the CCunfert, CCfert, and GRunfert soils. The humus fraction of HA2 in the Arenosols decreased in the following order: CCunfert > UAL > GRfert > CCfert and PA > GRfert. The depth also determined the differences between the soil uses, because at a depth of 15–25 cm, the following order was established: UAL > CCunfert > PA > GRfert > GRunfert (Figure 5c,d).
In assessing these results, more attention should be paid to the dominant ratio rather than the amounts of HA2 and FA2. The Ca-bound humic-to-FA ratio (HA2/FA2) is characterised by the intensity of the second stage of humification and is used to assess the degree of polymerisation rate of HS and the formation of humates. Secondary humification occurred when HA2/FA2 > 1 in the CCunfert Arenosol: 3.19 (0–15 cm) and 5.44 (15–25 cm), GRunfert 1.51 (0–15 cm), UAL 1.52, and PA 1.44 (15–25 cm).
The HA3 and FA3 fractions accounted for 17–23% (0–15 cm) and 14–20% (15–25 cm) of the total SOC, respectively. The highest amounts of HA3 and FA3 were determined in the PA soil use groups at HA3 1.6 C g kg−1 and FA3 1.5 C g kg−1, and conversely, the lowest were CCunfert HA3 1.14 C g kg−1 and FA3 0.799 C g kg−1. In the other soil use groups, similar amounts of HA3 and FA3 prevailed.
Examining the differences between the layers in the HA3 and FA3 fractions, it was found that CCunfert, CCfert, and GRfert negatively affected the amounts of HA3 and FA3 in the upper layers. The HA3 amounts were higher in the upper layers of CCfert, GRunfert, and UAL. The FA3 amount was lower in the deeper layers of CCfert, UAL, and PA (Figure 5e,f; Table S2).
Humin is a component of SOM that is insoluble in aqueous bases at any pH and is a heterogeneous mixture of old and new macro-organic substances [37]. The humin fraction represents the most resistant pool of SOM; it plays a crucial role in soil carbon sequestration and, due to its high functional group content, contributes to the maintenance of soil and its ecosystem services [38]. The knowledge regarding the properties of humin and its importance in soil quality is lacking. As reported previously [27,39,40], humin represents the highest proportion of soil humus composition. The results of our experiment on Arenosols showed that the humin fraction ranged from 15% to 33% in the 0–15 cm layer and from 23% to 31% in the 15–25 cm layer of SOC in all the soils used (Figure 5e,f). The highest amount of humin was found in GRfert and UAL (0–15 cm) and in PA in the lower layer (15–25 cm). In the non-fertilised treatments, a higher amount of humin formed in the deeper layer than that in the upper layer (Table S2).

3.3. Qualitative Characteristics of Humus According to Different Land Uses of Arenosol

The main indicators that indicate the qualitative composition of humus are the amounts of ΣHA and ΣFA and their ratios. Table 2 presents the summarised data for all the humic ΣHA (HA1 + HA2 + HA3) and fulvic ΣFA (FA1a + FA1 + FA2 + FA3) acids and their distributions according to land use.
The amounts of ΣHA and ΣFA were the highest in PA (ΣHA3 8.33 and 6.59; ΣFA3 5.41 and 3.47), and, in contrast, they were the lowest in CCunfert and CCfert. Fertilisation affected the amounts of ΣHA and ΣFA, as the fertilised treatments contained more ΣHA and ΣFA than the unfertilised treatments. Owing to the roots and fallows, more ΣHA and ΣFA accumulated in the upper layer than those in the lower layer in the natural ecosystem soil. This was set up for the cultivated leguminous plants, and in CCunfert, the soil used contained more ΣHA and ΣFA than in the lower layer. Significantly more ΣFAs were found in the upper layer of the CCfert than in the deeper layers.
By summarising all the fractions of humus, PA, and UAL maintenance, the largest amounts of HS (ΣHA + ΣFA) and their accumulation were determined. The CCunfert soil was the most inappropriate land use type in terms of HSs. An increased (p < 0.05) accumulation of HSs was found in the upper layers than that in the deeper layers (Table 2).
The ΣHA/ΣFA ratio is the main indicator of humus quality. The higher the ratio is, the better the humus quality is, and the greater the possibility of preserving the humus is. If the HA/FA ratio is <0.5, FA predominates in the soil humus; when the ratio varies from 0.5 to 1.0, the humus is called humic fulvic type. When HA/FA > 1, it predominates the HA [6,11,27,28]. All the variants in this research are dominated by HA acids, as the ΣHA/ΣFA ratio ranges from 1.46 to 1.73 (0–15 cm soil layer) and from 1.61 to 1.85 (15–25 cm soil layer) (Table 2). Therefore, they were evaluated as having high-quality HSs. Significant differences between the soils used in the upper layer were not observed; however, in the 15–25 cm soil layer, CCunfert was different. It had a larger HA/FA ratio than that of the other treatments. No differences were found between the depths, except in CCfert, and there was a set ΣHA/ΣFA ratio in the deeper layer that was larger than that in the upper layer. Therefore, the ΣHA/ΣFA ratio should not be unambiguously evaluated. This is because the cultivation of leguminous plants positively influences humification in crop cultivation. In the arable soil in the upper layer (0–15 cm), the HS was characterised by a greater degree of aggressiveness (6.20–6.31), while in the grass cenoses (UAL and GRfert) and PA, the aggressiveness of HS was significantly reduced (5.03–5.49) (Table 2). In the deeper layer (15–25 cm), the highest amounts of aggressive compounds were found in the PA soil, but here they should be considered as naturally occurring fulvic compounds due to pine cultivation.

3.4. Cultivation and Abandonment Effects on Humification and Optical Properties of HS

The proportion of SOC and N content (C/N) is a simple and popular indicator of SOM quality, the potential humification of organic residues, and N mineralisation [27,40,41,42]. The C/N ratio indicates the SOM composition, stability, and mineralisation. Therefore, this ratio helps predict the impact of land use change on SOC sequestration and greenhouse gas emissions [41,43].
The C/N ratio ranged from 14.7 to 19.8. The UAL and PA soils had higher C/N ratios than the cropland (CC) and GRunfert soils, which may have been due to N supplementation and its complexation with the SOM (Table 3). The most stable SOCs, according to the C/N ratio, were formed when the Arenosol was used in PA (19.8 and 18.6) and UAL (17.0 and 16.5). A less-stable SOC was formed in the Arenosol when it was used for crop cultivation. The lowest C/N ratio (14.7–15.8) was determined in the upper layers of the Arenosol in the CC. According to [44], the organic matter in the studied soils was characterised by a high C/N ratio (approximately 20), which indicates the low availability of nitrogen for microorganisms and plants.
The relative proportion of HA to SOC, which is comprehensible as the humification degree (HD), indicates the stability of the SOM [6,28]. An increase in the HD is both agronomically and ecologically valuable. The data show that the highest degree of humification (HD) was in the PA (0–15 cm and 15–25 cm). In other land use systems, no significant differences were established, although a tendency towards a greater accumulation of HA in the herbaceous phytocenoses compared to that of CC can be noted. The most commonly used indicator, E4/E6, provides information on the molecular size and weight of the HSs [11]. Lower values of this ratio indicate the advanced transformation of the SOM and the prevalence of humus compounds in the mature phase of humification [11,29]. Other authors have suggested that a low E4/E6 ratio indicates the accumulation of stable forms of SOM because of the potentially higher proportion of HA [20,26,34,44]. According to the previous studies [20,44,45,46], the E4/E6 ratio is inversely related to the degree of condensation and aromaticity of HS and the degree of humification. HSs with high molecular weights (HA) have low ratios (E4/E6 < 5), whereas those with low molecular weights (FA) have high ratios (5 < E4/E6 < 10) [20,47].
The measurement results of the absorbance of HSs were 0.117–0.465 and 0.108–0.375 at E465 and 0.018–0.074 and 0.015–0.060 at E655 at 0–15 cm and 15–25 cm, respectively. The highest values of E4 and E6 were determined in the PA soil, and, conversely, the lowest values were found in the fertilised and non-fertilised CC. UAL- and MGunfert and -fert were similar. Statistical differences between the depths were determined only for PA soil use. During secondary humification, some of the organic compounds are transformed into FA, and later, into HA; lower values of the E4/E6 ratio are typical for the more transformed soils. The E4/E6 ratio of the studied soils was significantly lower in PA (0–15 and 15–25 cm), suggesting secondary humification. The lowest E4/E6 ratios were characteristic of large molecules and indicated increased levels of molecular association and humification (Table 3). These results show variations in the low molecular weights of the particles, which had a high E4/E6 ratio of 6.26–7.05. No significant differences were observed in the optical densities of E465 and E665 of the HSs at the 0–15 cm soil depth, except for the PA treatment at the soil depth of 15–25 cm.

4. Discussion

The results of a study of the humus status of soil 27 years after the conversion of arable soil into various types of land use made it possible to assess the influence of phytocenoses and agrotechnical practices on the accumulation of humic substances and their fractional composition in Arenosols. Our study confirmed the previously formulated conclusion that the more active accumulation of humus in sandy loam soils occurs in forests. In herbaceous phytocenoses, the accumulation of humus occurs more slowly than it does in PA. Similar data on faster SOC accumulation in forest and grass phytocenoses have been reported by many researchers [4,13,48].
Research on the quality of HSs has revealed that in Arenosols, the most effective way to increase the amount of HSs was to perform pine afforestation because, in 27 years, the SOC amount increased by 6.3 g kg−1, and the highest amounts of the following contents were also determined: the SOC, agronomically valuable labile HA1, FA1, HA3, and FA3 bound to clay, ΣHA + ΣFA, C/N ratio, and HD. At the same time, the low-level aromaticity of HSs was discovered.

4.1. Humic Substance Quality in Agricultural Ecosystems of Arenosols

Relatively more (c 85.3%) SOC was formed in the CCunfert soil. The lowest amount was found in the GRfert and UAL lands; they accumulated more humin 25.9–33.4% SOC. The most pronounced changes in humus fractions were observed in the GRfert soil. There were more labile HS and fewer aggressive compounds and stable compounds with calcium and clay, but, at the same time, almost twice as much humin 33.4% from SOC than that in CC was formed in GRfert. This confirms and contributes to the research conducted in [49,50] in sandy soils, and it was concluded that the use of mineral fertilisers has a beneficial effect on the amounts of stable SOM fractions; however, the application of mineral fertilisers reduced the humification processes of SOM, supported the mineralisation processes, and led to a decrease in the quality of the humus.

4.2. Humic Substance Quality in Natural Ecosystems of the Arenosol

A similar composition of HS was found in the UAL soil, although, unlike in the GRfert, the aboveground biomass of the plant was not removed from the field, and after the end of vegetation, it remained mineralised on the soil surface. However, the application of mineral fertilisers increases [51] the biomass of grasses by 2–3 times in GRfert, which leads to the formation of a larger root mass and a higher amount of post-harvest residues in this land use. Therefore, the mineralisation processes of plant residues in both land types had a similar effect on the relative amount of HS fractions: they formed similar amounts of HA, FA, and HD. The compositions of the HA and FA fractions also showed no significant differences, except for those of the labile HA1, FA1, and FA fractions. These fractions, which were more labile in the soil, were less abundant in the UAL soil. According to [11] and [52,53], abandoning land usually causes an increase in the SOC content, but SOM transformation and accumulation depend on many factors, such as temperature, microbial activity, soil texture, soil moisture, and the composition of the plant and microbial residues. The quality indicators of HSs include not only the amounts of HA and FA and their ratio, but also the HD and E6/E6 ratio. This research confirmed and supplemented the results of the other studies [12,27] that demonstrated that ploughing negatively affects humification. The results showed that the use of Arenosol led to a low C/N ratio and HD and, at the same time, a higher E4/E6 ratio, and humification was accelerated by pine cultivation (high C/N ratio of 19.6 and HD of 36% at 0–15 cm, and C/N ratio of 18.6 and HD of 35% at 15–25 cm and, at the same time, lower E4/E6 values) and had the same indicator trend as grassland cultivation.

4.3. Afforestation Effect on Humic Fractional Composition and Quality

In the PA soil, the qualitative composition of HSs was not significantly different from that of the GRfert soil. However, PA had relatively more HA and FA 79.3% SOC, higher HDs (36% at 0–15 cm; 35% at 15–25 cm), C/N ratios of 17.0 and 16.5, and less humin 20.7% SOC. This indicates a relatively lower formation of difficult-to-decompose HS (low E4/E6 ratio) in the PA soil. Kukuļs and their team [4] studied the influence of afforestation on the SOC content and the properties of SOM in the mineral topsoil in Latvia. They found that a gradual decrease in the HA-to-FA ratio after land use change showed that the SOM was transported to the mineral topsoil, mainly through the leaching of the soluble FA fraction. The FTIR spectra revealed that the SOM in the mineral topsoil was degraded to small compounds. However, the HA extracted from forest soils had a higher abundance of –OH groups, more aromatic C–C structures, and a relatively lower abundance of N–H groups in the amides [54]. The soil properties may also affect the chemical properties of the SOM during afforestation [55]. The molecular weight of the HA fraction gradually increased with the age of the forest land in the sandy soils. These results suggest that sandy soils have the most rapid changes in SOM properties after afforestation. According to a study conducted in Lithuania [19], the findings suggest the encouragement of the afforestation of former agricultural land according to the climate and soil characteristics of the territory, but the conversion of perennial grasslands to forests should be performed with care. The SOC values in the Arenosols 30 years after afforestation did not differ significantly from those in the croplands or grasslands [56]. In the Arenosols, there was higher SOC accumulation in the forest topsoil with an increasing stand age, whereas the proportion of SOC stocks in the mineral topsoil layers was similar to that in the grasslands.
In the Arenosol soil, according to the effect on SOC sequestration and the qualitative composition of HSs, the formation of the resistance to decay and the sequence of land use was as follows: GRfert > PA > UAL > GRunfert > CCunfert > CCfert.

5. Conclusions

Long-term research (1995–2022) on the transformation of arable lands into natural ecosystems (uncultivated abandoned land and pine afforested field) or into land to be used for agriculture (fertilised and unfertilised cut grassland) has confirmed the differences in humus accumulation and revealed trends in the change in the HS fractional composition.
The different uses of Arenosols changes not only the accumulation of SOC in Arenosols, but also affect the qualitative composition of the humus compounds.
Arenosols used for PA have an increased SOC (0–15 cm +6.23 g kg−1), and the use of herbaceous phytocenoses positively impacts the SOC by +3.8 g kg−1 in GRfert and +3.7 g kg−1 in UAL compared to the arable land (CCfert).
When the arable soil is converted into PP, the concentrations of humin, ΣHA + ΣFA, and aggressive humus fraction FA1 also increase significantly. These processes were established in the 0–25 cm soil layer.
Humin formed more intensively in herbaceous phytocenoses (GR and UAL) compared to that in CCfert, but only in GRfert and UAL (5.08 g kg−1 and 4.06 g kg−1, respectively). The relative amount of ΣHA + ΣFA reactions changed slightly. The plant residues remaining in the UAL after the end of the plant growing season influenced the formation of humic substances; the SOC amount in the soil was higher by +3.74 g kg−1, with more humin (+1.80 g kg−1) and ΣHA + ΣFA (+1.95 g kg−1) compared with those of GRunfert.
The use of fertilisers in CC and GR contributes to the more intensive accumulation of SOC (+2.59 g kg−1 in CC and +3.26 g kg−1 in GR, respectively), including humin (+1.27 g kg−1 in CC and 2.82 g kg−1 in GR, respectively), but, at the same time, the relative amount of the ΣHA + ΣFA fraction decreases.

Supplementary Materials

The following supporting information can be downloaded at: https://www.mdpi.com/article/10.3390/agriculture14020250/s1, Table S1. Significant (p < 0.05) differences in SOC were observed between the soil layers within the same land type. The standard errors are marked; Table S2. Significant (p < 0.05) differences of HS between soil layers within the same land type.

Author Contributions

Conceptualization, K.A.-V., L.T. and A.K.-J.; methodology, K.A.-V., L.T. and A.K.-J.; software, K.A.-V., L.T. and A.K.-J.; validation, L.T., A.K.-J., K.A.-V., A.S. and E.B.; formal analysis, K.A.-V. and L.T.; investigation, L.T., K.A.-V., A.K.-J. and E.B.; resources, L.T., A.K.-J., K.A.-V., A.S. and E.B.; data curation, K.A.-V., L.T. and A.K.-J.; writing—original draft preparation, L.T., K.A.-V. and A.K.-J.; writing—review and editing, L.T., K.A.-V., A.K.-J., A.S. and E.B.; visualization, K.A.-V. and L.T.; supervision, L.T., K.A.-V. and A.K.-J. All authors have read and agreed to the published version of the manuscript.

Funding

This research received no external funding.

Institutional Review Board Statement

Not applicable.

Data Availability Statement

The original contributions presented in the study are included in the article/Supplementary Material, further inquiries can be directed to the corresponding author.

Acknowledgments

The experimental findings were obtained through the research programme “Biopotential of plants for multifunctional use and sustainability of agroecosystems” implemented by the Lithuanian Research Centre for Agriculture and Forestry. The authors greatly thank M. Petrovas for the experimental technique development (1994) and for conducting the experiment up to 2001 and S. Marcinkonis for experimental execution during the period 2002–2012; we also thank J. Volungevicius for the soil profile characterisation in 2015.

Conflicts of Interest

The authors declare no conflicts of interest.

References

  1. Stockmann, U.; Adams, M.A.; Crawford, J.W.; Field, D.J.; Henakaarchchi, N.; Jenkins, M.; Minasny, B.; McBratney, A.B.; de Courcelle, S.V.R.; Singh, K.; et al. The knowns, known unknowns and unknowns of sequestration of soil organic carbon. Agric. Ecosyst. Environ. 2013, 164, 80–99. [Google Scholar] [CrossRef]
  2. Lal, R.; Wakene Negassa, W.; Klaus Lorenz, K. Carbon sequestration in soil. Curr. Opin. Environ. Sustain. 2015, 15, 79–86. [Google Scholar] [CrossRef]
  3. Lal, R.; Smith, P.; Jungkunst, H.F.; Mitsch, W.J.; Lehmann, J.; Nair, P.K.R.; McBratney, B.; de Moraes Sá, J.C.; Schneider, J.; Zinn, Y.L.; et al. The carbon sequestration potential of terrestrial ecosystems. J. Soil. Water Conserv. 2018, 73, 145A–152A. [Google Scholar] [CrossRef]
  4. Kukuļs, I.; Kļaviņš, M.; Nikodemus, O.; Kasparinskis, R.; Brūmelis, G. Changes in soil organic matter and soil humic substances following the afforestation of former agricultural lands in the boreal-nemoral ecotone (Latvia). Geoderma Reg. 2019, 15, e00213. [Google Scholar] [CrossRef]
  5. Malhi, G.S.; Kaur, M.; Kaushik, P. Impact of Climate Change on Agriculture and Its Mitigation Strategies: A Review. Sustainability 2021, 13, 1318. [Google Scholar] [CrossRef]
  6. Raiesi, F. The quantity and quality of soil organic matter and humic substances following dry-farming and subsequent restoration in an upland pasture. Catena 2021, 202, 105249. [Google Scholar] [CrossRef]
  7. Ukalska-Jaruga, A.; Bejger, R.; Debaene, G.; Smreczak, B. Characterization of Soil Organic Matter Individual Fractions (Fulvic Acids, Humic Acids, and Humins) by Spectroscopic and Electrochemical Techniques in Agricultural Soils. Agronomy 2021, 11, 1067. [Google Scholar] [CrossRef]
  8. Malou, O.P.; Chevallier, T.; Moulin, P.; Sebag, D.; Rakotondrazafy, M.N.; Badiane-Ndour, N.Y.; Thiam, A.; Chapuis-Lardy, L. Measuring the stability of soil organic carbon in Arenosols in the Senegalese Groundnut Basin. J. Arid. Environ. 2023, 213, 104978. [Google Scholar] [CrossRef]
  9. Dilly, O.; Gnaß, A.; Pfeiffer, E.-M. Humus accumulation and microbial activities in Calcari-Epigleyic Fluvisols under grassland and forest diked in for 30 years. Soil Biol. Biochem. 2005, 37, 2163–2166. [Google Scholar] [CrossRef]
  10. Don, A.; Scholten, T.; Schulze, E.-D. Conversion of cropland into grassland: Implications for soil organic-carbon stocks in two soils with different texture. J. Plant. Nutr. Soil Sci. 2009, 172, 53–62. [Google Scholar] [CrossRef]
  11. Mielnik, L.; Hewelke, E.; Weber, J.; Oktaba, L.; Jonczak, J.; Podlasiński, M. Changes in the soil hydrophobicity and structure of humic substances in sandy soil taken out of cultivation. Agric. Ecosyst. Environ. 2021, 319, 107554. [Google Scholar] [CrossRef]
  12. Guillaume, T.; Makowski, D.; Libohova, Z.; Elfouki, S.; Fontana, M.; Leifeld, J.; Bragazza, L.; Sinaj, S. Carbon storage in agricultural topsoils and subsoils is promoted by including temporary grasslands into the crop rotation. Geoderma 2022, 422, 115937. [Google Scholar] [CrossRef]
  13. Rambaut, L.-A.E.; Vayssières, J.; Versini, A.; Salgado, P.; Lecomte, P.H.; Tillard, E. 15-year fertilization increased soil organic carbon stock even in systems reputed to be saturated like permanent grassland on Andosols. Geoderma 2022, 425, 116025. [Google Scholar] [CrossRef]
  14. Papierowska, E.; Szatyłowicz, J.; Ruta, M.; Łachacz, A.; Gnatowski, T.; Stańczyk, T. Water repellency of soils on unpaved roads in coniferous forests. Catena 2020, 195, 104784. [Google Scholar] [CrossRef]
  15. Vasconez Navas, L.K.; Becker, J.N.; Heger, A.; Grongroft, A.; Eschenbach, A. Are active and former floodplain soils of the lower middle Elbe similar? A study of soil characteristics and possible implications for forest restoration. Catena 2023, 222, 106814. [Google Scholar] [CrossRef]
  16. An, S.; Mentler, A.; Mayer, H.; Blum, W.E.H. Soil aggregation, aggregate stability, organic carbon and nitrogen in different soil aggregate fractions under forest and shrub vegetation on the Loess Plateau. Catena 2010, 81, 226–233. [Google Scholar] [CrossRef]
  17. Barcena, T.G.; Kier, L.P.; Vesterdal, L.; Stefansdottir, H.M.; Gundersen, P.; Sigurdsson, B.D. Soil carbon stock change following afforestation in Northern Europe: A meta-analysis. Glob. Chang. Biol. 2014, 18, 2393–2405. [Google Scholar] [CrossRef]
  18. Lafleur, B.; Labrecque, M.; Arnold, A.A.; Bélanger, N. Organic Carbon Accumulation in Topsoil Following Afforestation with Willow: Emphasis on Leaf Litter Decomposition and Soil Organic Matter Quality. Forests 2015, 6, 769–793. [Google Scholar] [CrossRef]
  19. Varnagiryte-Kabašinskiene, I.; Žemaitis, P.; Armolaitis, K.; Stakenas, V.; Urbaitis, G. Soil Organic Carbon Stocks in Afforested Agricultural Land in Lithuanian Hemiboreal Forest Zone. Forests 2021, 12, 1562. [Google Scholar] [CrossRef]
  20. Adiyah, F.; Mich’eli, E.; Csorba, A.; Weldmichael, T.G.; Gyuricza, C.; Ocansey, C.M.; Dawoe, E.; Owusu, S.; Fuchs, M. Effects of land-use change and topography on the quantity and distribution of soil organic carbon stocks on Acrisol catena’s in tropical small-scale shade cocoa systems of the Ashanti region of Ghana. Catena 2022, 216, 106366. [Google Scholar] [CrossRef]
  21. Knist, S.; Goergen, K.; Simmer, C. Evaluation and projected changes of precipitation statistics in convection permitting WRF climate simulations over Central Europe. Clim. Dyn. 2020, 55, 325–341. [Google Scholar] [CrossRef]
  22. Riedel, T.; Weber, T.K.D. Review: The influence of global change on Europe’s water cycle and groundwater recharge. Hydrogeol. J. 2020, 28, 1939–1959. [Google Scholar] [CrossRef]
  23. Bevacqua, E.; Zappa, G.; Lehner, F.; Zscheischler, J. Precipitation trends determine future occurrences of compound hot–dry events. Nat. Clim. Chang. 2022, 12, 350–355. [Google Scholar] [CrossRef]
  24. Plunge, S.; Gudas, M.; Povilaitis, A. Expected Climate Change Impacts on Surface Water Bodies in Lithuania. Ecohydrol. Hydrobiol. 2021, 22, 246–268. [Google Scholar] [CrossRef]
  25. Tao, Z.-Y.; Zhang, J.; Zhai, J.-J. Characterization and differentiation of humic acids and fulvic acids in soils from various regions of China by nuclear magnetic resonance spectroscopy. Anal. Chim. Acta 1999, 395, 199–203. [Google Scholar] [CrossRef]
  26. Zalba, P.; Amiotti, N.M.; Juan, A.; Galantini, J.A.; Pistolaore, S. Soil Humic and Fulvic Acids from Different Land-Use Systems Evaluated By E4/E6 Ratios. Commun. Soil Sci. Plant Anal. 2016, 47, 1675–1679. [Google Scholar] [CrossRef]
  27. Liaudanskiene, I.; Zukaitis, T.; Velykis, A.; Satkus, A.; Parasotas, I. The impact of tillage practices on the distribution of humified organic carbon in a clay loam. Zemdirbyste 2021, 108, 11–18. [Google Scholar] [CrossRef]
  28. Mockeviciene, I.; Karcauskiene, D.; Slepetiene, A.; Vilkiene, M.; Repsiene, R.; Braziene, Z.; Anne, O. Influence of Liming Intensity on Fractions of Humified Organic Carbon in Acid Soil: A Case Study. Sustainability 2022, 14, 5297. [Google Scholar] [CrossRef]
  29. Mockeviciene, I.; Repsiene, R.; Amaleviciute-Volunge, K.; Karcauskiene, D.; Slepetiene, A.; Lepane, V. Effect of long-term application of organic fertilizers on improving organic matter quality in acid soil. Arch. Agron. Soil Sci. 2022, 68, 1192–1204. [Google Scholar] [CrossRef]
  30. IUSS Working Group WRB. World Reference Base for Soil Resources. In International Soil Classification System for Naming Soils and Creating Legends for Soil Maps, 4th ed.; International Union of Soil Sciences (IUSS): Vienna, Austria, 2022. [Google Scholar]
  31. Tripolskaja, L.; Kazlauskaite-Jadzevice, A.; Baksiene, E.; Razukas, A. Changes in organic carbon in mineral topsoil of a formerly cultivated Arenosol under different land uses in Lithuania. Agriculture 2022, 12, 488. [Google Scholar] [CrossRef]
  32. Nikitin, B.A. Methods for soil humus determination. AgroChemistry 1999, 3, 156–158. (In Russian) [Google Scholar]
  33. Ponomareva, V.V.; Plotnikova, T.A. Humus and Soil Formation; Nauka: Leningrad, Russia, 1980; p. 220. [Google Scholar]
  34. Slepetiene, A.; Slepetys, J. Status of humus in soil under various long-term tillage systems. Geoderma 2005, 127, 207–215. [Google Scholar] [CrossRef]
  35. Kalisz, B.; Urbanowicz, P.; Smólczyński, S.; Orzechowski, M. Impact of siltation on the stability of organic matter in drained peatlands. Ecol. Indic. 2021, 130, 108149. [Google Scholar] [CrossRef]
  36. Bukantis, A.; Kažys, J. 330 Years of Vilnius’ Climate: History and Future. Vilnius Univ. Proc. 2020, 10, 10. [Google Scholar] [CrossRef]
  37. Bagherifam, S.; Brown, T.C.; Bagherifam, S.; Baglieri, A. Sequential extraction of labile and recalcitrant fractions of soil organic matter: A case study focusing on antimony (Sb) in humic acids, fulvic acids and humin fractions of long-term aged, contaminated soils. Environ. Pollut. 2023, 327, 121610. [Google Scholar] [CrossRef] [PubMed]
  38. Weber, J.; Jerzykiewicz, M.; Ukalska-Jaruga, A.; Ćwieląg-Piasecka, I.; Jamroz, E.; Kocowicz, A.; Debicka, M.; Bekier, J.; Mielnik, L.; Bejger, R.; et al. Molecular characteristics of humin fraction isolated from soils of temperate climate: A study on Chernozems and Phaeozems in Poland. Authorea 2023. [Google Scholar] [CrossRef]
  39. Litvinovich, A.; Pavlova, O.; Lavrishchev, A.; Bure, V.; Saljnikov, E. Empirical models of transformations of humic acids and humin in Umbric Albeluvisol Abruptic as influenced by liming. Zemdirbyste 2017, 104, 115–122. [Google Scholar] [CrossRef]
  40. Han, B.; Kitamura, K.; Hirota, M.; Shen, H.; Tang, Y.; Suzuki, T.; Fujitake, N. Humus composition and humification degree of humic acids of alpine meadow soils in the northeasten part of the Qinghai-Tibet Plateau. Soil Sci. Plant Nutr. 2019, 65, 11–19. [Google Scholar] [CrossRef]
  41. Radočaj, D.; Jurišić, M.; Antonić, O. Determination of soil C: N suitability zones for organic farming using an unsupervised classification in eastern Croatia. Ecol. Indic. 2021, 123, 107382. [Google Scholar] [CrossRef]
  42. Amorim, H.C.S.; Araujo, M.A.; Lal, R.; Zinn, Y.L. What C: N ratios in soil particle-size fractions really say: N is preferentially sorbed by clays over organic C. Catena 2023, 230, 107230. [Google Scholar] [CrossRef]
  43. Amorim, H.C.S.; Hurtarte, L.C.C.; Souza, I.F.; Zinn, Y.L. C: N ratios of bulk soils and particle-size fractions: Global trends and major drivers. Geoderma 2022, 425, 116026. [Google Scholar] [CrossRef]
  44. Oktaba, L.; Odrobińska, D.; Uzarowicz, Ł. The impact of different land uses in urban area on humus quality. J. Soils Sediments 2018, 18, 2823. [Google Scholar] [CrossRef]
  45. Kunlanit, B.; Butnan, S.; Vityakon, P. Land-use changes influencing C sequestration and quality in topsoil and subsoil. J. Agron. 2019, 9, 520. [Google Scholar] [CrossRef]
  46. Chen, Y.; Senesi, N.; Schnitzer, M. Information provided on humic substances by E4/E6 ratios. Soil Sci. Soc. Am. J. 1977, 41, 352. [Google Scholar] [CrossRef]
  47. Stevenson, F.J. Humus Chemistry: Genesis, Composition and Reactions; John Wiley and Sons Publications: New York, NY, USA, 1994; p. 496. [Google Scholar]
  48. Murty, D.; Kirschbaum, M.U.F.; McMurtrie, R.E. Does conversion of forest to agricultural land change soil carbon and nitrogen? A review of the literature. Glob. Chang. Biol. 2002, 8, 105–123. [Google Scholar] [CrossRef]
  49. Datta, A.; Choudhury, M.; Sharma, P.C.; Priyanka, H.S.; Jat, M.L.; Kar, S. Stability of humic acid carbon under conservation agriculture practices. Soil Tillage Res. 2022, 216, 105240. [Google Scholar] [CrossRef]
  50. Ukalska-Jaruga, A.; Klimkowicz-Pawlas, A.; SMreczak, B. Characterization of organic matter fractions in the top layer of soils under different land uses in Central-Eastern Europe. Soil Use Manag. 2019, 35, 595–606. [Google Scholar] [CrossRef]
  51. Šimanský, V.; Wójcik-Gront, E.; Horváthová, J.; Pikuła, D.; Lošák, T.; Parzych, A.; Lukac, M.; Aydın, E. Changes in Relationships between Humic Substances and Soil Structure following Different Mineral Fertilization of Vitis vinifera L. in Slovakia. Agronomy 2022, 12, 1460. [Google Scholar] [CrossRef]
  52. Šimanský, V.; Juriga, M.; Jonczak, J.; Uzarowicz, Ł.; Stępień, W. How relationships between soil organic matter parameters and soil structure characteristics are affected by the long-term fertilization of a sandy soil. Geoderma 2019, 342, 75–84. [Google Scholar] [CrossRef]
  53. Di Donato, N.; Chen, H.; Waggoner, D.; Patrick, G.; Hatcher, P.G. Potential origin and formation for molecular components of humic acids in soils. Geochim. Cosmochim. Acta. 2016, 178, 210–222. [Google Scholar] [CrossRef]
  54. Martin, D.; Srivastava, P.C.; Ghosh, D.; Zech, W. Characteristics of humic substances in cultivated and natural forest soils of Sikkim. Geoderma 1998, 84, 345–362. [Google Scholar] [CrossRef]
  55. Nikodemus, O.; Kasparinskis, R.; Kukuls, I. Influence of afforestation on soil genesis, morphology and properties in glacial till deposits. Arch. Agron. Soil Sci. 2013, 59, 449–465. [Google Scholar] [CrossRef]
  56. Poeplau, C.; Don, A. Sensitivity of soil organic carbon stocks and fractions to different land-use changes across Europe. Geoderma 2013, 192, 189–201. [Google Scholar] [CrossRef]
Figure 1. Study object and research site. Soil profile index according to WRB 2022: “A”—a mineral horizon in which decomposed organic material is accumulated; “B”—an illuvial horizon; “C”—an initial mineral horizon; “h”—a humic horizon with a significant amount of organic matter; “i”—organic material in the initial state of decomposition; “2”—a mineral horizon of another origin (in combination with horizon C); “α”—the primary carbonate.
Agriculture 14 00250 g001
Figure 2. The scheme of humus fractional composition (according to Ponomareva and Plotnikova).
Agriculture 14 00250 g002
Figure 3. Changes in SOC amounts (1995–2022) in the topsoil of Arenosols with different uses. Notes: CCunfert—non-fertilised crop cultivation; CCfert—fertilised crop cultivation; GRunfert—non-fertilised cut grassland cultivation; GRfert—fertilised cut grassland cultivation; UAL—uncultivated abandoned land; PA—pine afforestation field. The standard errors are marked.
Agriculture 14 00250 g003
Figure 4. Distribution of SOC in differently used Arenosols at 0–15 cm (a) and 15–25 cm (b). The different letters (a–e) in the diagram indicate significant differences (p < 0.05) between the different Arenosol uses. CCunfert—non-fertilised crop cultivation; CCfert—fertilised crop cultivation; GRunfert—non-fertilised cut grassland cultivation; GRfert—fertilised cut grassland cultivation; UAL—uncultivated abandoned land; PA—pine afforestation field. The standard errors are marked.
Agriculture 14 00250 g004
Figure 5. Labile (HA1, FA1, and FA1a) (a,b), calcium-bound (HA2 and FA2) (c,d), and clay mineral-bound (HA3 and FA3) (e,f) humic, fulvic acid, and humin contents for different land types and depths. The different letters (a–d) in the diagram indicate significant differences (p < 0.05) between the different Arenosol uses. CCunfert—non-fertilised crop cultivation; CCfert—fertilised crop cultivation; GRunfert—non-fertilised cut grassland cultivation; GRfert—fertilised cut grassland cultivation; UAL—uncultivated abandoned land; PA—pine afforestation field. The standard errors are marked.
Agriculture 14 00250 g005
Table 1. Description of the research site and land use.
Land Use Systems and Total Size of Each Land Use Site Land Uses
Non-fertilised Cropland Cultivation (CCunfert) (200 m2)Various agricultural plants (Secale cereale L., Hordeum vulgare L., Triticosecale wittmack, Triticum aestivum L. Fagopyrum esculentum Moench, Solanum tuberosum L., Brassica napus L., Lupinus angustifolius L., Trifolium pratense, Lupinus angustifolius L., Secale cereale L., Hordeum vulgare L., and Trifolium pratense) were cultivated in the cropland site. In order to increase the accumulation of SOC, since 2016, in CC, the five-field crop rotation of a 40% legume plant family was performed. One part of this site was unfertilised. In another part, a fertiliser application was used: N 0–100 kg ha−1, P—13–26 kg ha−1, and K—25–100 kg ha−1 (ammonium nitrate, granulate superphosphate, and potassium chloride, respectively). In 1995 and 2000, the cropland soil was fertilised with 40 t ha−1 manure.
Fertilised Cropland Cultivation (CCfert) (200 m2)
Non-fertilised Cut Grassland Cultivation (GRunfert) (200 m2)A grass–legume mixture (Medicago varia L., Festuca arundinacea Schreb., Bromus inermis Leyss, Festuca rubra L., and Dactylis glomerata L.) was grown in a cut grassland site. It was reduced twice during the vegetation period and resown as needed for approximately three decades. One part of this site was unfertilised. In another part, a fertiliser application was used: N60+30P40K1020. N60P40K1020 was applied at the beginning of grass vegetation. The grass was fertilised for a second time (N30) after the first grass cutting.
Fertilised Cut Grassland Cultivation (GRfert) (200 m2)
Uncultivated Abandoned Land (UAL) (400 m2)Uncultivated uncontrolled wild grass. It was reduced to only shrubs and trees, and sporadic wood cutting was performed according to the need in order to avoid overgrowth of trees (self-afforestation process). Biomass was left in the experimental area.
Pine Afforestation Field (PA) (400 m2)Afforested by pine trees (Pinus sylvestris L.).
Table 2. Quality and properties of humic substances according to land use and depth in Arenosols.
Land UseΣHAΣFAΣHA + ΣFAΣHA/ΣFA“Aggressiveness”
g kg−1 %
0–15 cm
CCunfert4.57dA2.68dA7.25eA1.71aA6.31aA
CCfert5.12dA3.47cA8.59dA1.48aA6.2aA
GRunfert6.06cA3.61cA9.67cA1.69aA5.76abA
GRfert6.39bcA3.71cA10.1cA1.73aA5.28bcA
UAL7.22bA4.40bA11.6bA1.64aA5.03cB
PA8.33aA5.41aA13.7aA1.54aA5.49bcB
15–25 cm
CCunfert3.86dB2.1dB5.96dB1.85aA4.89cB
CCfert4.52cdA2.82cB7.35cB1.61bA4.12dB
GRunfert5.27bcA3.27bA8.54bcA1.61bA5.78abA
GRfert5.97abA3.6abA9.57abA1.65abA5.52bcA
UAL5.65abB3.30bB8.95bB1.70abA6.03abA
PA6.59aB3.74aB10.3aB1.76abA6.60aA
Notes. CCunfert—non-fertilised crop cultivation; CCfert—fertilised crop cultivation; GRunfert—non-fertilised cut grassland cultivation; GRfert—fertilised cut grassland cultivation; UAL—uncultivated abandoned land; PA—pine afforestation field. ΣHA—sum of humic acid; ΣFA—sum of fulvic acids; ΣHA + ΣFA—sum of humic and fulvic acids; ΣHA/ΣFA—ratio of sum of humic and sum of fulvic acids. Lowercase letters indicate differences (p < 0.05) between land use in the 0–15 and 15–25 cm layers, and capital letters indicate differences (p < 0.05) between soil layers within the same land type.
Table 3. Indicators of humification and optical properties of HS of differently used Arenosols.
Land UseC/NHD, %E465E665E4/E6
0–15 cm15–25 cm0–15 cm15–25 cm0–15 cm15–25 cm0–15 cm15–25 cm0–15 cm15–25 cm
CCunfert14.7 cA16.0 bcA30 bA26 bA0.117dA0.108 cA0.018 cA0.015 cA6.71 abA7.05 aA
CCfert15.5 bcA14.8 bcA29 bA31 abA0.170 dA0.163 cA0.025 cA0.025 cA6.87 aA6.53 abcA
GRunfert14.7 cA15.5 bcA33 abA33 aA0.262 cA0.244 bA0.041 bA0.038 bA6.39 abA6.44 bcA
GRfert15.8 bcA13.6 cB32 abA35 aA0.320bcA0.276 bA0.048 bA0.041 bA6.73 abA6.90 abA
UAL17.0 bA16.5 abA31 abA32 abA0.334 bA0.263 bA0.050 bA0.040 bA6.77 abA6.67 abcA
PA19.8 aA18.6 aA36 aA26 bA0.465 aA0.375 aB0.074 aA0.060 aB6.26 bA6.31 cA
Notes. C/N—ratio of soil organic carbon and nitrogen; HD—humification degree; E465—humic solution absorbance at 465 nm; E655—humic solution absorbance at 665 nm; E4/E6—ratio of humic solution absorbance from 465 nm to 665 nm. CCunfert—non-fertilised crop cultivation; CCfert—fertilised crop cultivation; GRunfert—non-fertilised cut grassland cultivation; GRfert—fertilised cut grassland cultivation; UAL—uncultivated abandoned land; PA—pine afforestation field. Lowercase letters indicate differences (p < 0.05) between land use in the 0–15 and 15–25 cm layers, and capital letters indicate differences (p < 0.05) between soil layers within the same land type.
Disclaimer/Publisher’s Note: The statements, opinions and data contained in all publications are solely those of the individual author(s) and contributor(s) and not of MDPI and/or the editor(s). MDPI and/or the editor(s) disclaim responsibility for any injury to people or property resulting from any ideas, methods, instructions or products referred to in the content.

