Abstract
Digital technologies have penetrated all spheres of human life, becoming an integral element of sustainable development, and rural areas and agriculture are no exception. However, the processes of digital transformation possess certain challenges. Among them are ICT penetration, digital literacy of society, and the digital divide. This article aims to evaluate the digital penetration and the digital divide in rural areas of Armenia and identify and propose directions for improvement. For that purpose, a sample survey was conducted among rural households. The questionnaires included questions aimed at assessing digital literacy, as well as the level of ICT penetration and use. In addition, the Digital Devices and Technologies Usage Index (DTUI) was composed and calculated. The comparison of DTUI values revealed that being distant from the capital Yerevan can negatively impact ICT usage and digital penetration. It was revealed that households with higher incomes tend to use more ICT, which can indicate a possible positive relationship between DTUI and can be further studied by integrating econometric regression analysis. To facilitate and accelerate the processes of digital penetration and ICT use in rural areas of Armenia, relevant proposals were presented in the scope of the article. The results of this article can be useful for policymakers and the results part can be relevant for wider audiences. In particular, the recommendations presented in the article can be used by the RA Government as practical state support measures aimed at the promotion of digitalization in rural areas. Further research can include the digitalization issues in urban areas and provide insights into the digital divide between urban and rural areas.
1. Introduction
One of the current, relevant issues of scientific research is the analysis of the impact of the factors of digital transformation of the spheres of life at the regional level, particularly in rural areas, on the formation and implementation of development potential. In this context, Armenia is not an exception. The socio-economic separation between rural and urban areas finds its vivid expression in the context of digitalization. The manifestation of that issue is the “digital divide”. This phenomenon expresses the gap in the level of digitalization between rural and urban areas, which negatively affects balanced territorial development. Analyzing the level of digital penetration in the RA economy and society, especially in rural areas, requires the availability of appropriate analytical tools and statistical data.
One of the most widespread methods is statistical analysis, which requires access to certain numerical data. Among the indicators characterizing the digital economy in RA, are the following: the cost of broadband Internet access, global cyber security index, global innovation index, e-government development index, network readiness index, individuals using the Internet, government online services index, digital quality of life index, digital adoption index, e-participation index, ICT development index, and Internet usage from households.
Naturally, the listed indicators allow us to form some knowledge about the level of digitalization of the RA economy and society. However, there are no indicators regarding the development of ICT in rural areas, the level of digital literacy of the rural population, or the level of implementation of digital technologies in agriculture. The only available indicator is the indicator of internet use by rural households, which in 2021 was 90%. The lack of presented indicators makes it impossible to assess the state of digitalization, to identify existing digitalization issues in rural areas, and to properly address the rural digital divide. Taking into account the importance of digitalization in improving the quality of life in rural areas, this article aims to define the state of digitalization and existing issues in RA rural areas and develop solution approaches.
Digital technologies not only improve the quality of life but also affect the workforce (increasing productivity, creating new jobs, etc.), thus contributing to increasing the efficiency of economic activities. Although the studies dedicated to the digital economy itself are considered a new direction of scientific interest, there are already plenty of studies by experts in the field. The implementation of digital technologies in agriculture is discussed in the study by Lajoie-O’Malley, A., Bronson, K., van der Burg, S., & Klerkx, L. [1], which proves that the implementation of digital technologies contributes to economic development as a whole, including the agro-industrial sector. International organizations such as the World Bank, FAO, the Organization for Economic Cooperation and Development (OECD), and others have conducted studies in this field. In their studies, the mentioned organizations have concluded that digital technologies are being considered as a way to solve food security problems today. Today, digitalization is expected to be used as a means to reduce the use of chemical and mineral materials in the production process, while simultaneously ensuring high productivity.
The benefits of digitalization in rural areas are discussed in a study by Shaibu, A.F., Hudu, Z., and Israel, M. [2]. In particular, it is noted that digitalization contributes to the improvement of the quality of life of rural residents, in terms of expanding the possibilities of communication with relatives, working effectively in emergencies, increasing the efficiency of daily operations, increasing the income of households, facilitating money transfers, etc. The impact of different types of ICT and the level of infrastructure development on different areas of life in rural areas has been discussed by many researchers since the 2000s. The study of Whitacre, B., Gallardo, R. and Strover, Sh. [3] specifically mentions the importance of access to broadband and the positive impact it has on improving various socio-economic aspects of the lives of the rural population. Large-scale studies document that, in developing countries and regions, such as Latin America, Caribbean countries, Chile, India, Malaysia, etc., broadband has contributed to the increase in GDP [4].
The role of ICT as a key area of economic development was studied by Kumari, R., Singh, S.K. [5]: in the example of 85 countries, they showed that the impact of ICT on economic growth as an individual factor is positive. Another study was performed by Adeleye, N., & Eboagu, C. [6]. This research was carried out on the example of 54 African countries, and, according to the results, ICT development has a statistically significant positive relationship with the economic growth of the country. Therefore, it is recommended to make a concentrated effort to increase the availability and accessibility of ICT, which includes reducing the price of digital devices, increasing the access and quality of the Internet, etc.
Studies in sub-Saharan African countries have concluded that, along with promoting ICT infrastructure, it is also important to increase digital education and literacy, especially among the younger generation, as these generations are more likely to use ICTs in the future [7]. The impact of ICT even penetrates the spheres of life such as the level of tourism use by rural residents. In particular, the research conducted in China shows that the penetration of ICT has a positive effect on the increase in the consumption of tourist services in rural areas, and the use of ICT also contributes to the reduction of costs during tourism [8].
The state needs to create a favorable environment for the widespread penetration of digital technologies. In that regard, we are referring not only to the financing of the digital infrastructure development but also to ensuring the necessary legal framework for business digitalization and the flexibility to introduce new technologies in state institutions [9]. The prevailing policy and legal framework have a lasting impact on the development of the digital ecosystem, regardless of the country’s level of development or income [10].
There is a relatively small number of studies regarding the digital economy development of Armenia. The study by Manucharyan M. [11] presents the key issues of the development of the digital economy in the Armenian agrarian sector. The comprehensive assessment of the innovative potential of the sector, the development of information technologies, the impact of the digital economy on the transformation of the labor market, as well as several advantages of the new generation of digital technologies, were evaluated. As a result, it was concluded that the implementation of all these prerequisites will increase the effectiveness of the agri-food system.
Other studies dedicated to the digital transformation of the Armenian economy state that digitalization in Armenia is still in the formative stage, and its application model is imperfect. The basis for the formation of the national digitalization model can be the already established international experience. Such an example can be the model of digitalization in Estonia. Armenia, as a country with a small economy, has certain similarities with Estonia, which provides a basis for the expediency of using the Estonian model of digital development. This model emphasizes the development of startup ecosystems and the provision of an attractive business environment [12].
The study “Digitalization, E-Governance and Institutional Transformation” by Sargsyan H., Gevorgyan R., and Minasyan K. is dedicated to the introduction of digitalization of the economy and electronic management system in Armenia. The study included a sample of 198 countries. The following tasks were set in the research: to identify the functional relationship between the above-mentioned variables and to find out their influence in improving the institutional system. Using non-linear regression methods, the relationships between e-government efficiency indicators and institutional development indicators of countries were revealed. As a result of the research, it was found that the impact of e-government on institutions is significant, and, accordingly, the improvement of the index can have a positive impact on various spheres of public administration. In addition, this study also presents the use of digital technologies in the state administration system in the RA in recent years, and comparisons are made in the context of global developments [13].
The first policy steps at the state level for digital transformation in Armenia were taken in the early 2000s. In 2008, the RA Government approved the concept of information technology development. The main goal of the concept was to define the perspectives and directions of the development of information technologies and information society. With this concept, the Armenian Government was foreseeing that the country would become the technological center of the region. The concept has set targets for enabling the use of IT and ICT in various sectors and has provided capacity for education programs dedicated to training IT professionals in the country. Another goal of the concept was to create a strong research and development sector that would help Armenia compete in the international market of IT and ICT technologies in various fields [14].
A dynamic growth in the field of digitalization in Armenia has been observed since 2017, in connection with the development and adoption of the document “Digital Transformation Agenda of Armenia 2030”. This document, which defines the main directions and goals of the country’s digital transformation, includes three main stages: “digital leap”, “digital acceleration”, and “digitalization-based development”.
In 2021, the digitalization strategy of Armenia 2021–2025 was adopted, which was designed to contribute to the high quality of state services, the efficiency, and transparency of the state administration system, the development of broadband and telecommunication infrastructures, the increase in the competitiveness of the private sector and development of a digitally skilled workforce. In general, Armenia’s digital strategy has three directions: state, economy, society, and according to the strategy a reliable e-governance model should be created in the field of public administration. To develop the private sector of the economy, it was planned to develop a data policy, develop data infrastructures, and provide a secure digital environment in the scope of the strategy. For the introduction of innovative educational technologies and the formation of digital literacy, the introduction of advanced courses in this direction in the general education system is mandatory. So, the scope of the strategy programs aimed at revising the school curriculum and training teachers will be implemented, which will make the public education system more flexible, and more in line with the professions of the future and the demands of the digital economy [15,16].
For the promotion of the digitalization of the economy and the development of digital skills, the Digitalization Council was established, the main targets of which are [17] the following:
- To ensure the modernization, digitalization, and automation of the state administration system;
- To provide an assessment of the cost-effectiveness of state functions and the implementation of reforms aimed at cost reduction;
- To ensure the interoperability and synchronization of the state information data system;
- To modernize, automate, and digitize the state services, based on the “one-stop, one window” and “only once” principles;
- To provide a favorable environment for the development of the digital economy, and ensure information security, cyber security, and personal data protection during digitalization.
The Ministry of High-tech Industry was established in Armenia, which deals with the development and implementation of the state digitalization policy, startup ecosystem, and military industry. The e-Gov digital platform has operated in Armenia for about 10 years, which provides online state services and stands out as a registry of legal acts. The system of electronic management tools “www.e-gov.am (accessed on 30 January 2024)” has more than 20 online services: the platform brings together real estate “www.e-cadastre.am/en (accessed on 30 January 2024)”, state payments “www.e-payments.am (accessed on 30 January 2024)”, organizations’ electronic registration “www.e-register.am (accessed on 30 January 2024)”, tax reports electronic filing systems “www.file-online.taxservice.am (accessed on 30 January 2024)”, and the unified platform for electronic requests “www.e-request.am (accessed on 30 January 2024)”. Other systems also exist that serve building permit processes “www.e-permits.am (accessed on 30 January 2024)” and the register of unified electronic RA licenses “www.e-license.am (accessed on 30 January 2024)”. In addition to the above, the following digitalization institutes have been established in Armenia: the state body implementing technical functions attached to the RA Ministry of High-tech Industry, the Institute of Information Managers (Chief Information Officer), the Cyber Security Center, data center(s), a cloud infrastructures coordinating body, and the consultation platform attached to the Ministry of High-tech Industry.
To reveal the socio-economic potential of digital technologies, as well as to avoid unwanted consequences, international cooperation is important [18]. For example, the EAEU Digital Agenda 2025 was developed as a model for the formation of a unified digital space. It should also be noted that Armenia actively cooperates with relevant international organizations to develop programs and draw road maps on such issues of the digital economy as digital agriculture. Armenia actively cooperates with FAO to develop the strategy of the latter [19].
2. Materials and Methods
The evaluation of the level of digitalization, regardless of the field, the purpose of the research, and the scope of inclusion, has specific difficulties. The problem lies in the fact that in RA, in terms of official statistics, there are no statistical publications that will specifically address or provide data about the state of the digital economy and digitalization in general in various spheres of life, which means the availability of official statistical data on the state of digitalization of rural areas is out of the question. Taking into account the aim of our research and the peculiarities of RA, the methodological basis of the article was the method of sample survey, through which the missing primary information about digital penetration, digitalization level, and the use of digital technologies in rural areas of RA was provided. Surveys are very common research tools, the application of which includes a range of different fields, starting from the collection of information about environmental issues [20] to the study of the economic performances of enterprises [21], the research of various aspects of the health of the population [22], the study of various socio-economic phenomena [23,24], etc.
The strata of surveys were the households of the Armenian rural areas. The survey was carried out in the rural areas of all ten regions of the RA. The stratified sampling method was implemented for the surveys. The essence of stratified sampling lies in the fact that when forming the sample, the population (in our case, households) is divided into strata, which represent homogeneous groups, and then the survey participants are selected from the strata by random sampling [25]. So, the choice of this sampling method and data collection was conditioned by the specifics of our research, as it was better suited for accomplishing the goals of the research.
There are two common problems with sample surveys: first is correctly defining the sample size, and second is the problem of response bias [26]. To determine the sample size, the number of rural households must be considered. Since the RA Statistical Committee does not provide the exact indicator of rural and urban households, the following path was taken: according to the data of the RA Statistical Committee, the mean number of members of rural households (per resident population) in 2021 was 4, and the resident rural population as of 1 January 2022 was 1069.2 thousand men. To determine the number of rural households in RA, the number of rural population (1069.2) was divided into the mean number of household members (4)—1069.2/4 = 267.3 thousand—which would be the size of the main population of the surveys. To calculate the required representative sample size with a 95% confidence level and 5% margin of error, the following formula was used, developed by Arkin H. and Colton R. [27]:
where
N—population size;
p—expected rate of occurrence (50%);
e—margin of error (percentage as a decimal) (0.05);
z—this is a value that indicates how much deviation occurs from the mean value. At the confidence level of 95% z = 1.96.
The required sample size for the research was at least 384 units; that is, at least 384 households from rural areas of the RA must participate in the survey to provide a representative sample with a 95% confidence level and 5% margin of error. Considering the obtained number 400 surveys were conducted within the framework of the research for the period from March to May 2023. It should be noted that each rural household had an equal opportunity to be selected and included in the sample, and the selection of households was carried out using a random address generator. The survey coverage area and the rural settlements are presented in Figure 1.
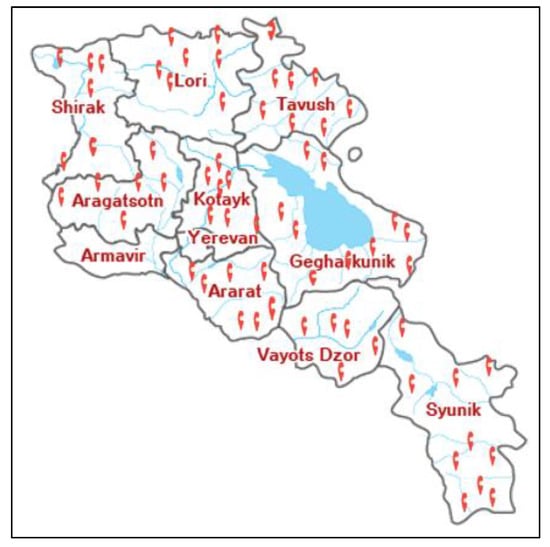
Figure 1.
The area and the rural settlements included in the survey.
Nowadays online surveys have become a widely used form of data collection: as studies show the benefits of online surveys include cost effectiveness, quick results, high response rate, etc. [28]. However, for this study to ensure the maximum accuracy of survey results without incomplete questions or incomplete questionnaires, or without bias, interview surveys were performed. This way provided reliable, complete data, and the response bias was minimized (all the questionnaires were completed, there was no missing data, and the respondents fully understood the meaning of the questions, so the results were as reliable as possible). The questionnaires consisted of 20 questions, which explore the basic information about the place of residence, number of household members, household’s average income, etc., as well as questions specifically related to digitalization: the use of digital technologies, access, digital literacy, and attitudes toward digitalization.
The results of the survey allowed for forming a comprehensive knowledge about digital penetration in the rural areas of RA. However, in our opinion, the lack of a specific indicator of the level of use of digital devices and technologies by households reduces the completeness and scientific value of the research. There is no single comprehensive indicator, an index that expresses the level of use of digital devices and technology in a given household, through which it will be possible to draw parallels and comparisons and determine how the region, number of household members, average incomes, and other characteristic determinants affect the use of digital devices and technologies. To solve the problem such an index was developed and calculated by the authors. Based on the analyses of foreign approaches and studies on the evaluation and characterization of digitalization combined with conducting discussions with experts in the field using the Delphi method, the authors developed the “Digital Devices and Technologies Usage Index” (DTUI).
While developing the methodology for index calculation, the methodology of the Personal Informatization Index (PII) was considered. PII is a similar index used in the field of digitalization assessment, which was developed by 19 experts from the Korean National Information Community Agency and 17 professors from the Korean University [29]. There are three components of PII: personal access to digital devices, the second component is the ability to use computer devices and programs, and the last component is the personal use of digital devices and technologies in different areas and purposes of life. These three components are evaluated through 37 different questions, which have their specific weights in PII. During the survey, the respondent answers the questions on a Likert scale (from 0–4), and then those points are multiplied by the weight of the question and the sum of the obtained results forms the PII of the respondent [30]. Taking into account the applied approach, the following methodology was developed for DTUI calculation:
- First, those digital devices and technologies that are widespread and incorporated in various spheres of life, were identified;
- Devices were divided into two groups, primary and secondary, taking into account their importance in everyday life and their level of spread;
- The maximum value of DTUI was set to 1 and the minimum to 0;
- The DTUI consists of three components: the level of use of primary digital devices, the level of use of secondary digital devices, and the level of use of digital technologies;
- The first component was given a weight point of 0.4, the other two were 0.3 each, and, in their turn, every digital device and technology was given its specific weight. The individual weights of devices and technologies (Table 1) composing DTUI were determined by taking into account several factors: the role of the device or technology in different aspects of human life, the affordability of device and technology, positive effects and aspects of use, the obstacles of usage, etc.
 Table 1. The list of digital devices and technologies included in the DTUI calculation and their respective weights.
The results of DTUI provide us with further insights about the use of ICT in rural areas of RA. They are also useful in determining the priorities of the digitalization promotion policies in RA.
The list of devices and technologies is presented in Table 1. That list of devices and technologies was included in the questionnaires, and the respondents answered whether or not their household uses the given device/technology. When at least one member of the household uses the given device or technology, then the answer is “Yes”, and the point is given.
Except for primary devices and technologies, the following options were included in the list, too: “other device” and “other technology”, so that the evaluation of the usage of digital devices and technologies is not limited only to the options set by us.
The DTUI index is calculated by the following formula:
where W indicates the weight assigned to the given device or technology, V takes the value 0 if the given device/technology is not used, or 1 if otherwise.
DTUI = ∑[W × V]
3. Results
To avoid the excessive overload of estimates as in a descriptive report, the main takeaways from survey results are presented below:
- The vast majority of respondent households—99.5% of the total—have Internet access at home, which is quite a high indicator and implies a high level of Internet accessibility in RA rural areas. A total of 99.5% of households use mobile internet, and 4G is the most common type of mobile internet in rural areas of RA. A total of 58.75% of households use fixed broadband internet at home. Internet usage and access to it are usually considered primary determinants of digital penetration. In this context, the rural areas of RA are in a good state.
- Regarding the quality assessment of Internet access, the following picture was obtained: 45.5% of the households are satisfied with the quality and speed of the Internet available to them, 35.5% are rather satisfied, 8% are not satisfied, and 10.5% are rather not satisfied. If we take into account the fact that the survey also included households from the border and peripheral rural settlements and the results about the quality of the Internet are like this, then it can be stated that in addition to high availability, the quality and speed of the Internet is also high.
- It turns out that the main directions and purposes of Internet usage are related to communication, entertainment, social media (SM), and absorbing daily news, while the degree of use for more meaningful activities, such as self-development, within the scope of the job, earning income, etc., is low (Figure 2). Similarly, to evaluation of the purposes and directions of SM usage was performed. The result essentially repeats the current situation regarding Internet usage: 82.25% of households use SM for entertainment, 86.0% use them for communication purposes, 20.0% participate in online discussions through SM, and 15.0% use SM for membership in any online community or group. A total of 1.3% use SM to raise awareness of social issues in the community, and 7.25% use SM for other purposes. Sadly, the use of the Internet and SM in rural areas of RA is still very low for purposes such as using e-government, online banking, and financial services, solving community and social problems, etc. This situation is conditioned by the low level of digital literacy of the population in rural areas. Only 31% of households used the Internet to contact the state administration or local government bodies or to use their online services. It is noteworthy that only 13.75% of households consider electronic processes in RA to be safe, 36.25% consider them rather safe, 16.5% consider it rather not safe, and 33.5% do not consider electronic processes to be safe.
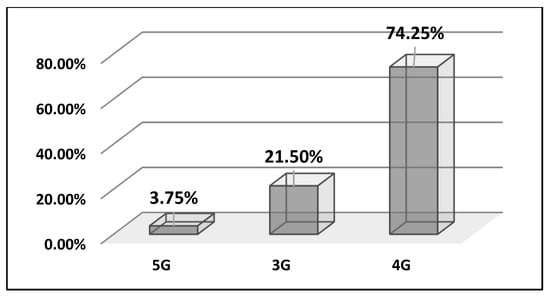 Figure 2. The mobile internet access in rural areas of RA.
- A total of 81% of respondent households have a positive attitude towards digital technologies, 17.5% have a neutral attitude, and 1.5% of respondents have a negative attitude towards digital technologies (Figure 3). The attitude towards digital technologies is a key to their implementation and diffusion; thus, the positive attitude towards digital technologies in the RA rural areas plays a key role in the further intensification of digital penetration.
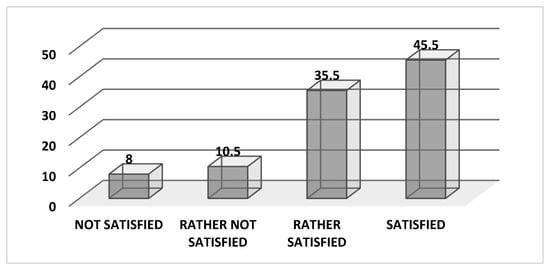
Figure 3.
The level of satisfaction with internet quality in rural areas of RA (%).
- When asked about “what problems they face while using digital devices and technologies”, the majority of households stated that they face technical problems and lack skills in this area. Specifically, 51.25% face technical problems, 76.25% lack skills, 4% face other problems, and 11.5% do not face problems (Figure 4). It turns out that the state of technical support of digital devices in the rural areas of RA is higher and causes fewer problems than the lack of skills; that is, the low level of digital literacy is the main issue. In general, digital literacy and skills are considered a necessity of the 21st century, and their lack is one of the factors hindering digital penetration, and the rural areas of RA are no exception.
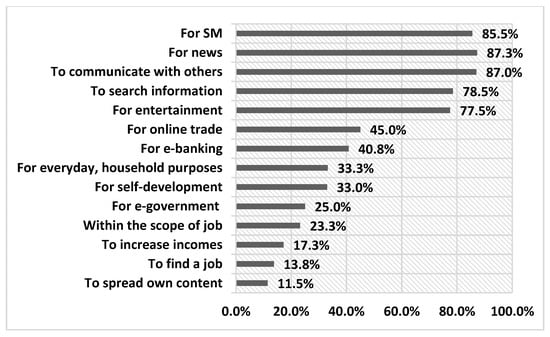
Figure 4.
The purposes and directions of Internet usage in rural areas of RA.
Digital literacy and skills are classified by some authors into the following sets of skills [10]:
- Information literacy: the use of digital technologies to locate, find, analyze, and synthesize resources, evaluate the appropriate literate use and reference techniques of these resources, to accurately and effectively develop the research problem and objectives, etc.
- Computer literacy: the ability and receptivity to use computers, digital technologies, and their applications for practical purposes.
- Media literacy: the ability and skill to use digital technologies in various social, and digital media platforms and to receive, analyze, and communicate information through them.
- Communication literacy: using digital technologies to communicate effectively as individuals, as well as to work collaboratively in groups using various digital tools.
- Visual literacy: the use of digital technologies for receiving, perceiving, and communicating graphic information, as well as the visual presentation of information through digital technologies.
- Technological literacy: is the ability to improve learning, productivity, and employability processes using digital technologies.
Foreign experience shows that the application of various state support programs promoting digital penetration [31], the adaptation of the educational components of the country’s general education and university system [32], the development and implementation of strategies aimed at improving digital literacy [33,34], as well as the dissemination of digitalization skills and knowledge in formal and informal forms of learning [35]. All these measures can elevate the level of digital literacy, which in turn has a decisive role in the deepening of digital penetration and the further development of the digital economy [36]. In the RA, the only general education component related to digitalization and the use of digital technologies is the subject “Informatics” in schools, and similar components are missing in educational programs. The existence of such a subject in the educational program somewhat solves the issue of digital literacy of the young generation, whereas, in the case of the middle-aged and elderly generations, that weight falls on the courses, training, and seminars organized and financed by state and non-state bodies. A question was added to the survey questionnaire to assess the situation and the results are quite worrying.
- Only 5% of the households had a member that participated in or attended digital literacy, skill-building courses, seminars, and trainings organized by government bodies, and 9% of households participated in such programs organized by non-state and private organizations (UN, NGOs, businesses, etc.). It is noteworthy that most of those households live in the border settlements and the peripheral regions of RA: Syunik, Tavush, and Lori. This is mainly explained by the activities of NGOs, which choose the border and underdeveloped rural settlements as the target groups for their social and charity activities. Digital literacy teachings, courses, and seminars are organized in the bordering and underdeveloped rural areas of the mentioned regions for different target groups: housewives, people with limited abilities, representatives of the vulnerable class, young people and teenagers, etc.
- A separate question assessing the skills of using digital devices was also included in the questionnaires. The results show that the level of smartphone usage skills is highest in the households: 43.25% of the respondents rated their smartphone usage skills as “good” and 29.25% as “high”. In terms of computer usage skills, the “average” version prevailed, and in terms of laptop and tablet skills, the “low” rating prevailed. This is due to the fact that almost all members of all households have smartphones and smartphones can replace computers, laptops, and tablets with their multi-functionality. Things become more obvious when the frequency of usage of these devices is discussed. A total of 87.25% of households use a smartphone every day; that is, all members of these households use a smartphone every day, and only 1% stated that they never use a smartphone. In comparison, the next in line with usage frequency is the computer, then the laptop, and the least frequently used is the tablet.
Digital Devices and Technologies Usage Index
In rural areas of RA based on the methodology discussed in the Section 2, the calculation of DTUI provided the following results (Figure 5):
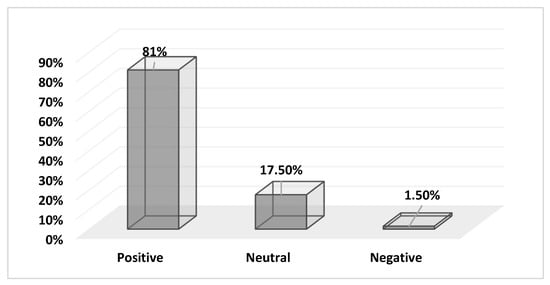
Figure 5.
The attitude of rural households toward digital technologies in rural areas of RA.
- The average value of DTUI in RA rural areas was 0.34, out of a maximum of 1 point. Moreover, that value was secured due to the use of digital devices, whereas the level of use of digital technologies was very low. The maximum recorded average value of DTUI was 0.85, which was recorded in the Ararat region.
- When analyzing regional DTUI values, it became clear that the highest average value was recorded in the Ararat region (0.38), and the lowest one was recorded in the Tavush region (0.30). Values of DTUI higher than the RA average were recorded in the Armavir, Aragatsotn, Gegharkunik, and Lori regions. In the peripheral regions (Tavush, Syunik, Shirak) that do not border the capital city of Yerevan regional DTUI values are lower than the RA average. Such a situation can be considered a vivid example of the digital divide. When moving away from urban settlements with a relatively high level of digitalization, the indicators characterizing digitalization decrease. This is caused by a combination of several personal and contextual factors: geographic isolation affects people’s attitudes toward the use and implementation of new technologies and experiences. Secondly, the aging population in rural areas is also a serious challenge, as young people play a major role in promoting the penetration of new digital technologies. Finally, jobs and economic activities are mostly those that do not create a need and do not contribute to increasing people’s motivation toward digital technologies [37]. The aging population in rural areas is generally not inclined to use ICT and mainly uses digital technologies for entertainment purposes [38]. The disparity of infrastructure development between rural areas and urban areas also has a negative impact on this issue. Such a digital divide can also be caused by significant differences in digital literacy between regions, as in the case of Brazil, where digital literacy is one of the main determinants of the digital divide (Figure 6 and Figure 7) [39].
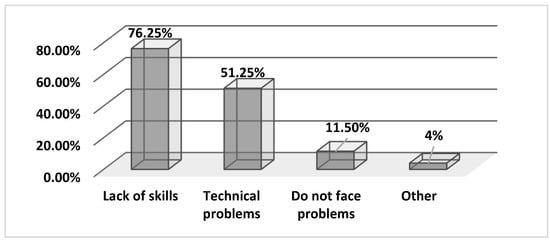 Figure 6. The main problems occurring during the use of digital devices and technologies in rural areas of RA.
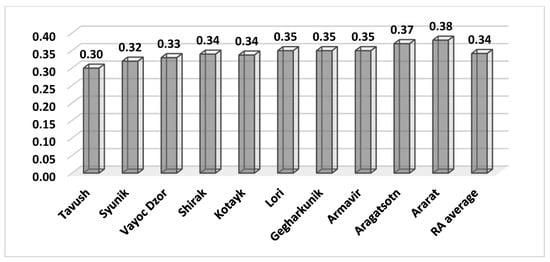 Figure 7. The regional values of DTUI in RA.
The level of usage of digital devices and technologies depends not only on the development of infrastructure, accessibility, and digital literacy but also on the user’s income. After all, the acquisition and use of devices and technologies imply making costs.
Since the surveyed households were classified according to their average monthly incomes, the DTUIs were calculated for each income group. The results are the following:
- In the group of households with a monthly income of up to AMD 100 thousand, the average value of DTUI was 0.29;
- In the group of households with a monthly income of AMD 101–250 thousand, the average value of DTUI was 0.31;
- In the group of households with a monthly income of AMD 251–500 thousand, the average value of DTUI was 0.36;
- In the group of households with a monthly income of AMD 501 thousand and more, the average value of DTUI was 0.45.
The obtained results prove the idea that the income of households determines the introduction and use of ICT technologies in everyday life. Then, the use of ICT can be promoted by increasing the economic availability and accessibility of digital devices and technologies. For example, exempting the sale of ICT devices from VAT in target rural areas can lead to a significant decrease in their price, which is an additional incentive for their purchase and penetration.
4. Conclusions and Practical Implications
This paper aims to study the state and issues of digitalization of rural areas in RA. The main objectives of this paper were the implementation of a sample survey to gain necessary data and use the obtained data to make a qualitative and empirical evaluation of the research issue. All the research findings served as a basis for providing policy recommendations, which are presented in this section.
The survey conducted among households in the rural areas of RA provided a sufficient body of knowledge to evaluate the digitalization state and highlight the existing issues. As a result of the literature review, it became clear that one of the keys to economic growth and social development, as well as the solution to the uneven development between regions or rural–urban areas, is ICT penetration and the further development of digitalization. ICT adoption leads to the development of rural areas, as the example of China shows. The results of the conducted surveys document that the access and quality of the Internet in the rural areas of RA are at a high level, mainly 4G is used, and the majority of the population of the rural areas has a positive attitude towards digital technologies.
The main problems arising during the use of ICT are related to the lack of digital skills; trainings, courses, programs, and all types of activities aimed at increasing digital literacy are few and usually concentrated in a few peripheral, bordering rural settlements. The Internet is mainly used for entertainment, leisure, and communication, and more meaningful purposes are pushed to the background, which is a consequence of the development of the population in rural areas, the level of education, views, and mindsets, but also the lack of digital literacy. The use of the Internet for online financial services and online banking, as well as online trading, ranges around 50%, while the level of using government services and e-government is quite low.
PCs and smartphones are the most common digital devices, and according to the results of the survey, the skills of using them are mostly at an average level, and the level of skills was given a “good” rating mainly in terms of smartphones. In terms of usage frequency, smartphones are leading, followed by PCs. The usage frequency of laptops and tablets is quite low. The average value of DTUI for RA rural areas was 0.34 out of a possible 1, and in the scope of individual regions Ararat regions is leading, whereas the Tavush region had the lowest DTUI value. These results help to identify where should efforts be directed to promote ICT usage. It is worth noting that the value of DTUI increases along with the growth of household income, so households with low incomes should be specially targeted during ICT promotion measures. In conclusion: the use of such digital technologies as AI, Cloud Computing, Big Data, etc. is very low in the rural areas of the Republic of Armenia.
The key role in promoting and developing the digital economy remains on the shoulders of the state. Managing the digital transformation and building a digital economy presents many new challenges for governments. The role of the state in digital transformation is expressed in the following ways [40]:
- First, the state develops new policies suitable for the new challenges of the digital era, as well as monitors the adoption of the national development strategy to the digitalization perspectives;
- The state supports R&D, acting as a customer for the creation and testing of new and promising research and innovations;
- The state strengthens the backbone of ICT infrastructures and ensures inclusive and affordable access to the Internet;
- The state provides investment in human capital and institutional learning in all sectors to ensure further benefits from digitalization and digital inclusion.
Taking into account the role that the state has in the development of the digital economy, the following recommendations are developed for the policymakers to improve the level of digitalization, digital penetration, and ICT use in the rural areas of RA.
- Taking into account the existing commonalities between the RA and South Africa, it is suggested to implement their experience in digitalization in rural areas [41]. Specifically, to create public-access ICT centers (PAC) in Armenian rural areas, where representatives of marginalized groups have free access to ICTs. The implementation of PACs has a successful experience in the development of underdeveloped, borderline settlements with a pace of development inferior to others [42]. PACs provide access to the Internet for rural areas by solving the following problems: reducing the digital divide, developing the economic, social, political, and cultural opportunities of the community, promoting the creation of local/community “content”, providing communities with specific online services, promoting the effective use of ICTs [16]. It is preferable to implement PACs in Syunik, Tavush, Gegharkunik, and Shirak regions, as the results of the survey showed that these regions stay behind in the context of digitalization.
- In parallel with PACs, it is recommended to develop and introduce measures aimed at increasing the digital literacy of rural residents in the form of course studies, trainings, etc. This measure can easily be combined with PAC’s activities, when, for example, the course is dropped in the center and the obtained skills are applied in practical conditions.
- To increase the accessibility of ICTs and digital infrastructure in rural areas, it is recommended that ICT prices should be affordable for residents in the target rural settlements, for example, ICT devices exempted from VAT or subsidy of broadband internet subscription tariffs implemented by the State.
- Along with the listed recommendations, there is the necessity to form an appropriate legal base for the development of the digital ecosystem.
These were the main findings and points of this paper; however, it must be noted that it has some limitations, such as the fact that this paper does not provide a comparison between ICT penetration, usage, etc., in urban and rural areas, or it does not explore the dynamics of digitalization issues over time. This paper provides some methodology bases for further expansion of similar studies both in terms of including the urban areas and different periods to explore the digitalization issues in urban and rural areas.
Author Contributions
Conceptualization, F.H.A. and V.A.; methodology, M.M. (Meri Muradyan) and G.H.; software, H.A. and M.M. (Meri Manucharyan); validation, F.H.A., M.M. (Meri Muradyan) and V.A.; formal analysis, G.H.; investigation, M.M. (Meri Muradyan) and H.A.; resources, G.H.; data curation, G.H.; writing—original draft preparation, H.A.; writing—review and editing, H.A. and M.M. (Meri Muradyan); visualization, M.M. (Meri Muradyan); supervision, G.H.; project administration, V.A. and M.M. (Meri Manucharyan). All authors have read and agreed to the published version of the manuscript.
Funding
This research was funded by the Higher Education and Science Committee of RA, grant number 22YR-5B031.
Institutional Review Board Statement
Not applicable.
Data Availability Statement
Data are contained within the article.
Conflicts of Interest
The authors declare no conflicts of interest.
References
- Lajoie-O’Malley, A.; Bronson, K.; van der Burg, S.; Klerkx, L. The future(s) of digital agriculture and sustainable food systems: An analysis of high-level policy documents. Ecosyst. Serv. 2020, 45, 101183. [Google Scholar] [CrossRef]
- Shaibu, A.-F.; Hudu, Z.; Israel, M. Digital Technology and Rural Livelihood—A Study of Peasant Communities in Pru District? AGRIS Online Pap. Econ. Inform. 2018, 10, 71–78. [Google Scholar] [CrossRef]
- Whitacre, B.; Gallardo, R.; Strover, S. Broadband’s Contribution to Economic Health in Rural Areas: A Causal Analysis (26 March 2013). TPRC 41: The 41st Research Conference on Communication, Information, and Internet Policy. Available online: https://ssrn.com/abstract=2239876 (accessed on 15 September 2023).
- Katz, R.; Suter, S. “Estimating the Economic Impact of the Broadband Stimulus Plan.” Working Paper. 2009. Available online: https://www.itu.int/ITU-D/treg/broadband/ITU-BB-Reports_Impact-of-Broadband-on-the-Economy.pdf (accessed on 25 December 2023).
- Kumari, R.; Singh, S.K. Impact of ICT Infrastructure, Financial Development, and Trade Openness on Economic Growth: New Evidence from Low- and High-Income Countries. J. Knowl. Econ. 2023, 14, 1–30. [Google Scholar] [CrossRef]
- Adeleye, N.; Eboagu, C. Evaluation of ICT development and economic growth in Africa. NETNOMICS Econ. Res. Electron. Netw. 2019, 20, 31–53. [Google Scholar] [CrossRef]
- Hasbi, M.; Dubus, A. Determinants of mobile broadband use in developing economies: Evidence from Sub-Saharan Africa. Telecommun. Policy 2020, 44, 101944. [Google Scholar] [CrossRef]
- Zhu, Z.; Ma, W.; Leng, C. ICT adoption and tourism consumption among rural residents in China. Tour. Econ. 2022, 28, 1669–1675. [Google Scholar] [CrossRef]
- EDB. Digital Potential of EDB Member Countries, 2019, p. 8. Available online: https://eabr.org/upload/iblock/551/EABR_Digital_Potential_06_2019.pdf (accessed on 10 November 2023).
- Katz, R.; Kallorda, F. The Economic Impact of Broadband, Digitization and ICT Regulation: Econometric Modeling for the CIS Region ITU; ITU: Geneva, Switzerland, 2020; 38p, p. 2. [Google Scholar]
- Manucharyan, M.G. Digital Economy: Prospects for Development of the Agrarian Sector, Monograph (in Armenian); National Center for Innovation and Entrepreneurship: Yerevan, Armenia, 2022; 250p, ISBN 978-9939-9279-7-8. [Google Scholar]
- Harutyunyan, G.A. Estonian experience of digital development and the ways of its application in Armenia. Sci. J. Reg. Probl. Transform. Econ. 2021, 12, 32–39. [Google Scholar] [CrossRef]
- Sargsyan, H.; Gevorgyan, R.; Minasyan, K. Digitalization, E-Governance and Institutional Transformation. Sci. Artsakh 2022, 1, 205–221. [Google Scholar] [CrossRef]
- Digitalization Strategy of Armenia 2021–2025, 36p, p. 14–15. Available online: https://www.e-gov.am/u_files/file/decrees/kar/2021/02/183_1.pdf (accessed on 10 November 2023). (In Armenian).
- Anthonysamy, L. Digital literacy deficiencies in digital learning among undergraduates. In Understanding Digital Industry; Routledge: London, UK, 2020; pp. 133–136. [Google Scholar] [CrossRef]
- Clement, A.; Gurstein, M.; Longford, G.; Luke, R.; Moll, M.; Shade, L.R.; DeChief, D. The Canadian Research Alliance for Community Innovation and Networking (CRACIN): A Research Partnership and Agenda for Community Networking in Canada. J. Community Inform. 2004, 1, 7–20. [Google Scholar] [CrossRef]
- Sargsyan, H.; Gevorgyan, R.; Minasyan, K.; Mkhitaryan, J.; Zakarian, H. The Problems of Forming the Institutional System of Digital Transformations of the RA Economy, -Yerevan, YSU Publishing House, 2020. 160p. Available online: http://publishing.ysu.am/files/Tvaynatsum.pdf (accessed on 25 December 2023).
- UN. Creating Value and Benefits: Implications for Developing Countries, Digital Economy Report 2019. 31p. Available online: https://unctad.org/system/files/official-document/der2019_overview_ru.pdf (accessed on 5 November 2023).
- FAO of UN. Implementation of E-Agriculture in Central and Eastern Europe and Central Asia; FAO: Budapest, Hungary, 2018; 64p. [Google Scholar]
- Friberg, R. Surveys on Environmental Investments and Costs in Swedish Industry. Stat. J. United Nations Econ. Comm. Eur. 2018, 1992, 101–110. [Google Scholar] [CrossRef]
- Foster, L.; Norman, P. The annual survey of entrepreneurs. J. Econ. Soc. Meas. 2018, 42, 199–224. [Google Scholar] [CrossRef]
- Kalton, G. Measuring health in population surveys. Stat. J. IAOS 2012, 28, 13–24. [Google Scholar] [CrossRef]
- Hurst, E. Measuring time use in household surveys. J. Econ. Soc. Meas. 2015, 40, 177–196. [Google Scholar] [CrossRef]
- Kim, R.S.; Ashley, J.D.; Corcoran, M.E. A nationally representative economic survey five months after the Haitian earthquake: Radical changes in household members and gender discrepancy in employment retention. Stat. J. IAOS 2014, 30, 341–346. [Google Scholar] [CrossRef]
- Iliyasu, R.; Etikan, I. Comparison of quota sampling and stratified random sampling. Biom. Biostat. Int. J. 2021, 10, 24–27. [Google Scholar] [CrossRef]
- Bartlett, J.E.; Kotrlik, J.W.; Higgins, C.C. Organizational Research: Determining Appropriate Sample Size in Survey Research. Inf. Technol. Learn. Perform. J. 2001, 19, 43–50. [Google Scholar]
- Arkin, H.; Colton, R. Tables for Statisticians; Barnes & Noble: New York, NY, USA, 1963. Available online: https://trove.nla.gov.au/version/170127267 (accessed on 16 November 2023).
- Gichohi, B.W. Web surveys for offline rural communities. Stat. J. IAOS 2016, 32, 627–630. [Google Scholar] [CrossRef]
- Ko, G.; Routray, J.K.; Ahmad, M.M. ICT infrastructure for rural community sustainability. Community Dev. 2018, 50, 51–72. [Google Scholar] [CrossRef]
- Available online: https://unstats.un.org/unsd/economic_stat/ICT-Korea/Documents/3.6_Choi_Korea.pdf (accessed on 15 November 2023).
- Joseph, N.; Kar, A.K.; Ilavarasan, P.V. A Model for Prioritization and Prediction of Impact of Digital Literacy Training Programmes and Validation. In Proceedings of the Digital Nations—Smart Cities, Innovation, and Sustainability, I3E 2017, Delhi, India, 21–23 November 2017; Kar, A., Ed.; Springer: Cham, Switzerland, 2017; Volume 10595. [Google Scholar] [CrossRef]
- Singh, M. Digital Literacy: An Essential Life Skill in the Present Era of Growing and Global Educational Society. J. Adv. Sch. Res. Allied Educ. 2018, 15, 62–67. [Google Scholar] [CrossRef]
- Reddy, P.; Chaudhary, K.; Hussein, S. A digital literacy model to narrow the digital literacy skills gap. Heliyon 2023, 9, e14878. [Google Scholar] [CrossRef] [PubMed]
- Reddy, P.; Chaudhary, K.; Sharma, B.; Chand, D. Contextualized game-based intervention for digital literacy for the Pacific Islands. Educ. Inf. Technol. 2021, 26, 5535–5562. [Google Scholar] [CrossRef]
- Maphosa, C.; Bhebhe, S. Digital literacy: A must for open distance and e-learning (odel) students. Eur. J. Educ. Studies 2019, 5, 186–199. [Google Scholar] [CrossRef]
- Reddy, P.; Sharma, B.; Chaudhary, K. Digital literacy: A review in the South Pacific. J. Comput. High. Educ. 2022, 34, 83–108. [Google Scholar] [CrossRef]
- Correa, T.; Pavez, I. Digital Inclusion in Rural Areas: A Qualitative Exploration of Challenges Faced by People from Isolated Communities. J. Comput.-Mediat. Commun. 2016, 21, 247–263. [Google Scholar] [CrossRef]
- Khalil Moghaddam, B.; Khatoon-Abadi, A. Factors affecting ICT adoption among rural users: A case study of ICT Center in Iran. Telecommun. Policy 2013, 37, 1083–1094. [Google Scholar] [CrossRef]
- Nishijima, M.; Ivanauskas, T.M.; Sarti, F.M. Evolution and determinants of digital divide in Brazil (2005–2013). Telecommun. Policy 2017, 41, 12–24. [Google Scholar] [CrossRef]
- Hanna, N. A role for the state in the digital age. J. Innov. Entrep. 2018, 7, 5. [Google Scholar] [CrossRef]
- Frans, C.; Pather, S. Determinants of ICT adoption and uptake at a rural public-access ICT center: A South African case study. Afr. J. Sci. Technol. Innov. Dev. 2022, 14, 1575–1590. [Google Scholar] [CrossRef]
- Uys, C.; Pather, S. Government Public Access Centres (PACs): A beacon of hope for marginalized communities. J. Community Inform. 2016, 12, 21–52. [Google Scholar] [CrossRef]
Disclaimer/Publisher’s Note: The statements, opinions and data contained in all publications are solely those of the individual author(s) and contributor(s) and not of MDPI and/or the editor(s). MDPI and/or the editor(s) disclaim responsibility for any injury to people or property resulting from any ideas, methods, instructions or products referred to in the content. |
© 2024 by the authors. Licensee MDPI, Basel, Switzerland. This article is an open access article distributed under the terms and conditions of the Creative Commons Attribution (CC BY) license (https://creativecommons.org/licenses/by/4.0/).