Managemental Impacts on Particulate Matter Emission in Tunnel-Ventilated Broiler Houses


Abstract
1. Introduction
2. Materials and Methods
2.1. Experimental Farms
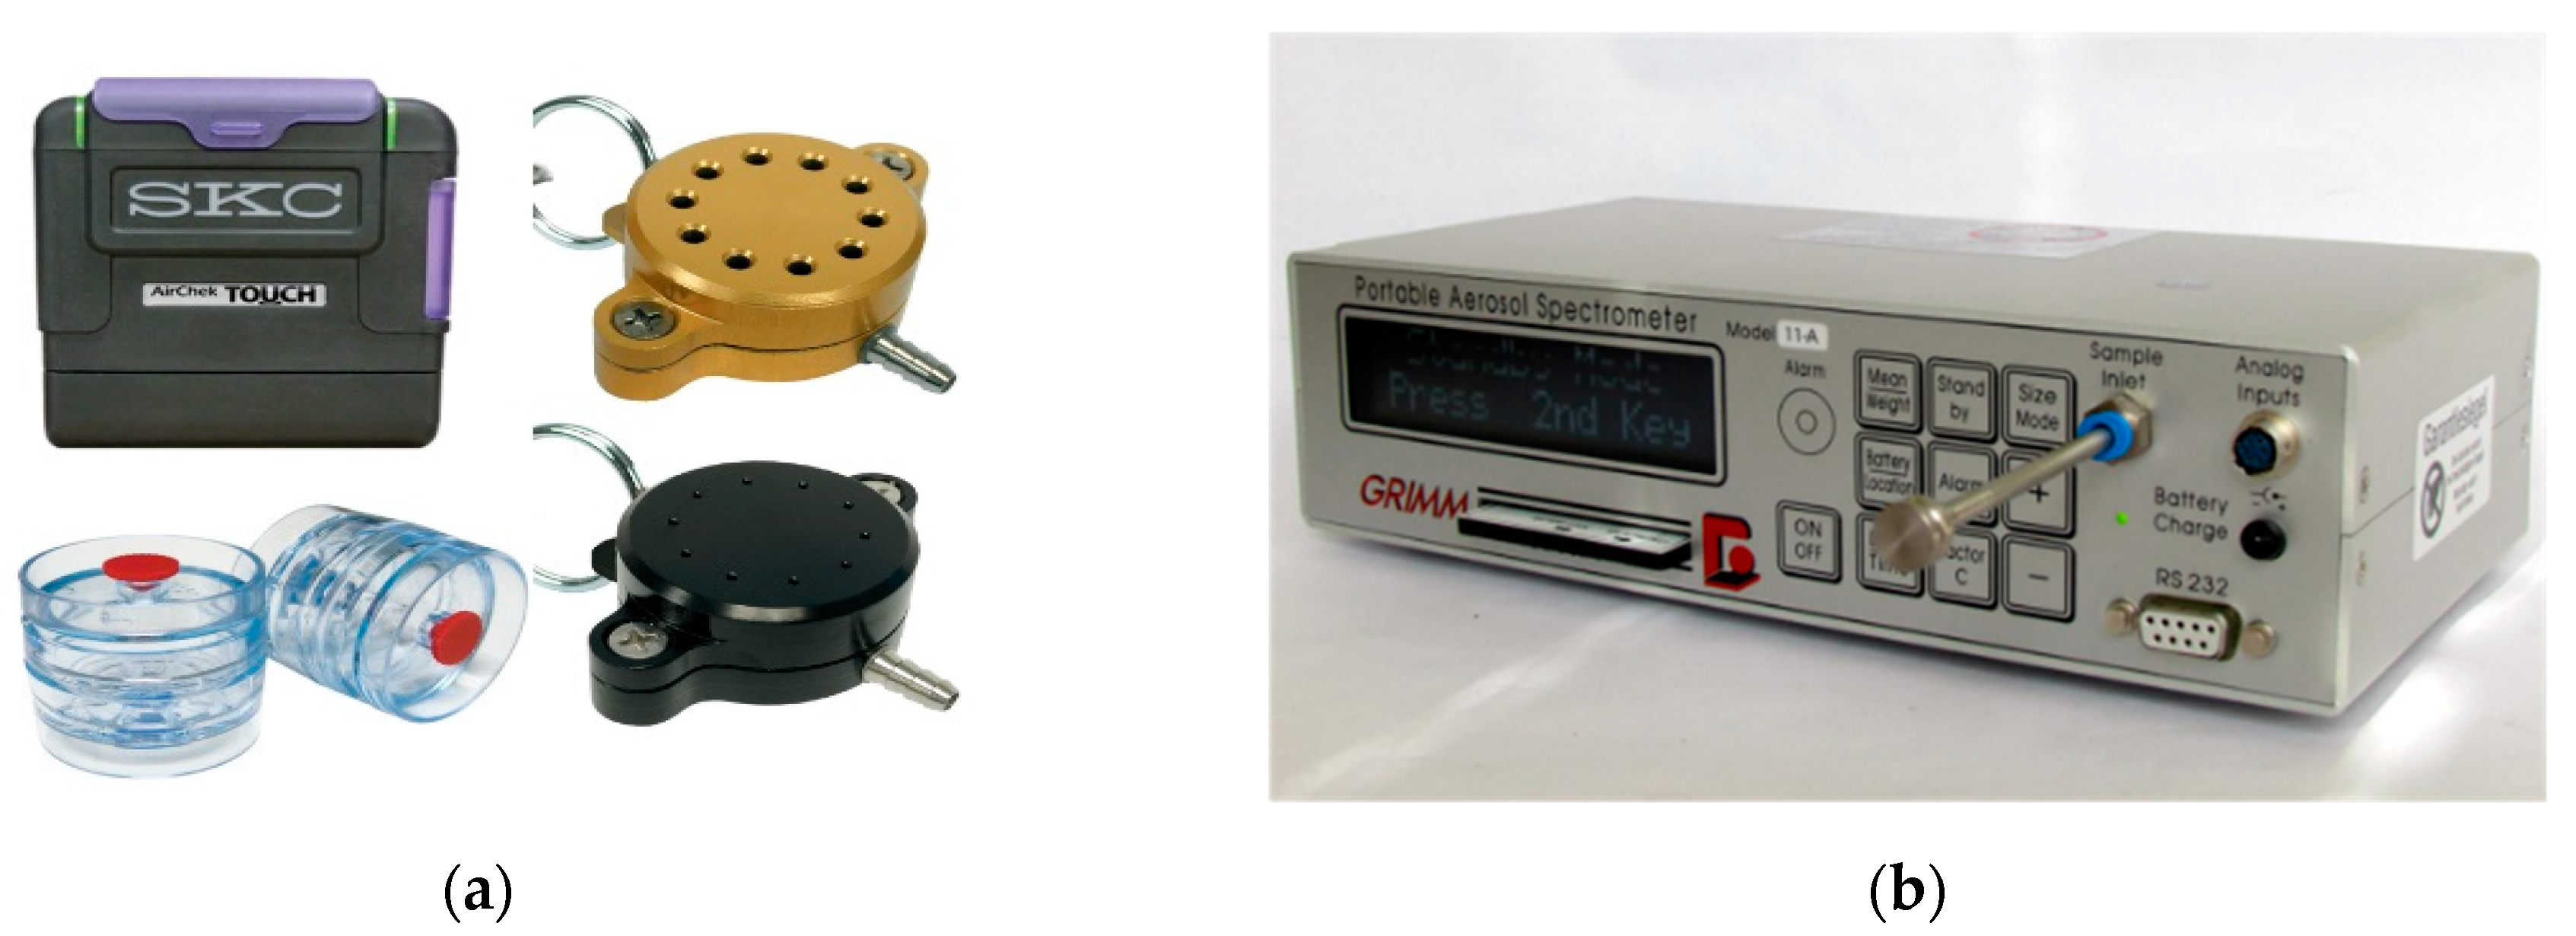
2.2. Aerosol Collection and Measurement
2.3. Experimental Procedure
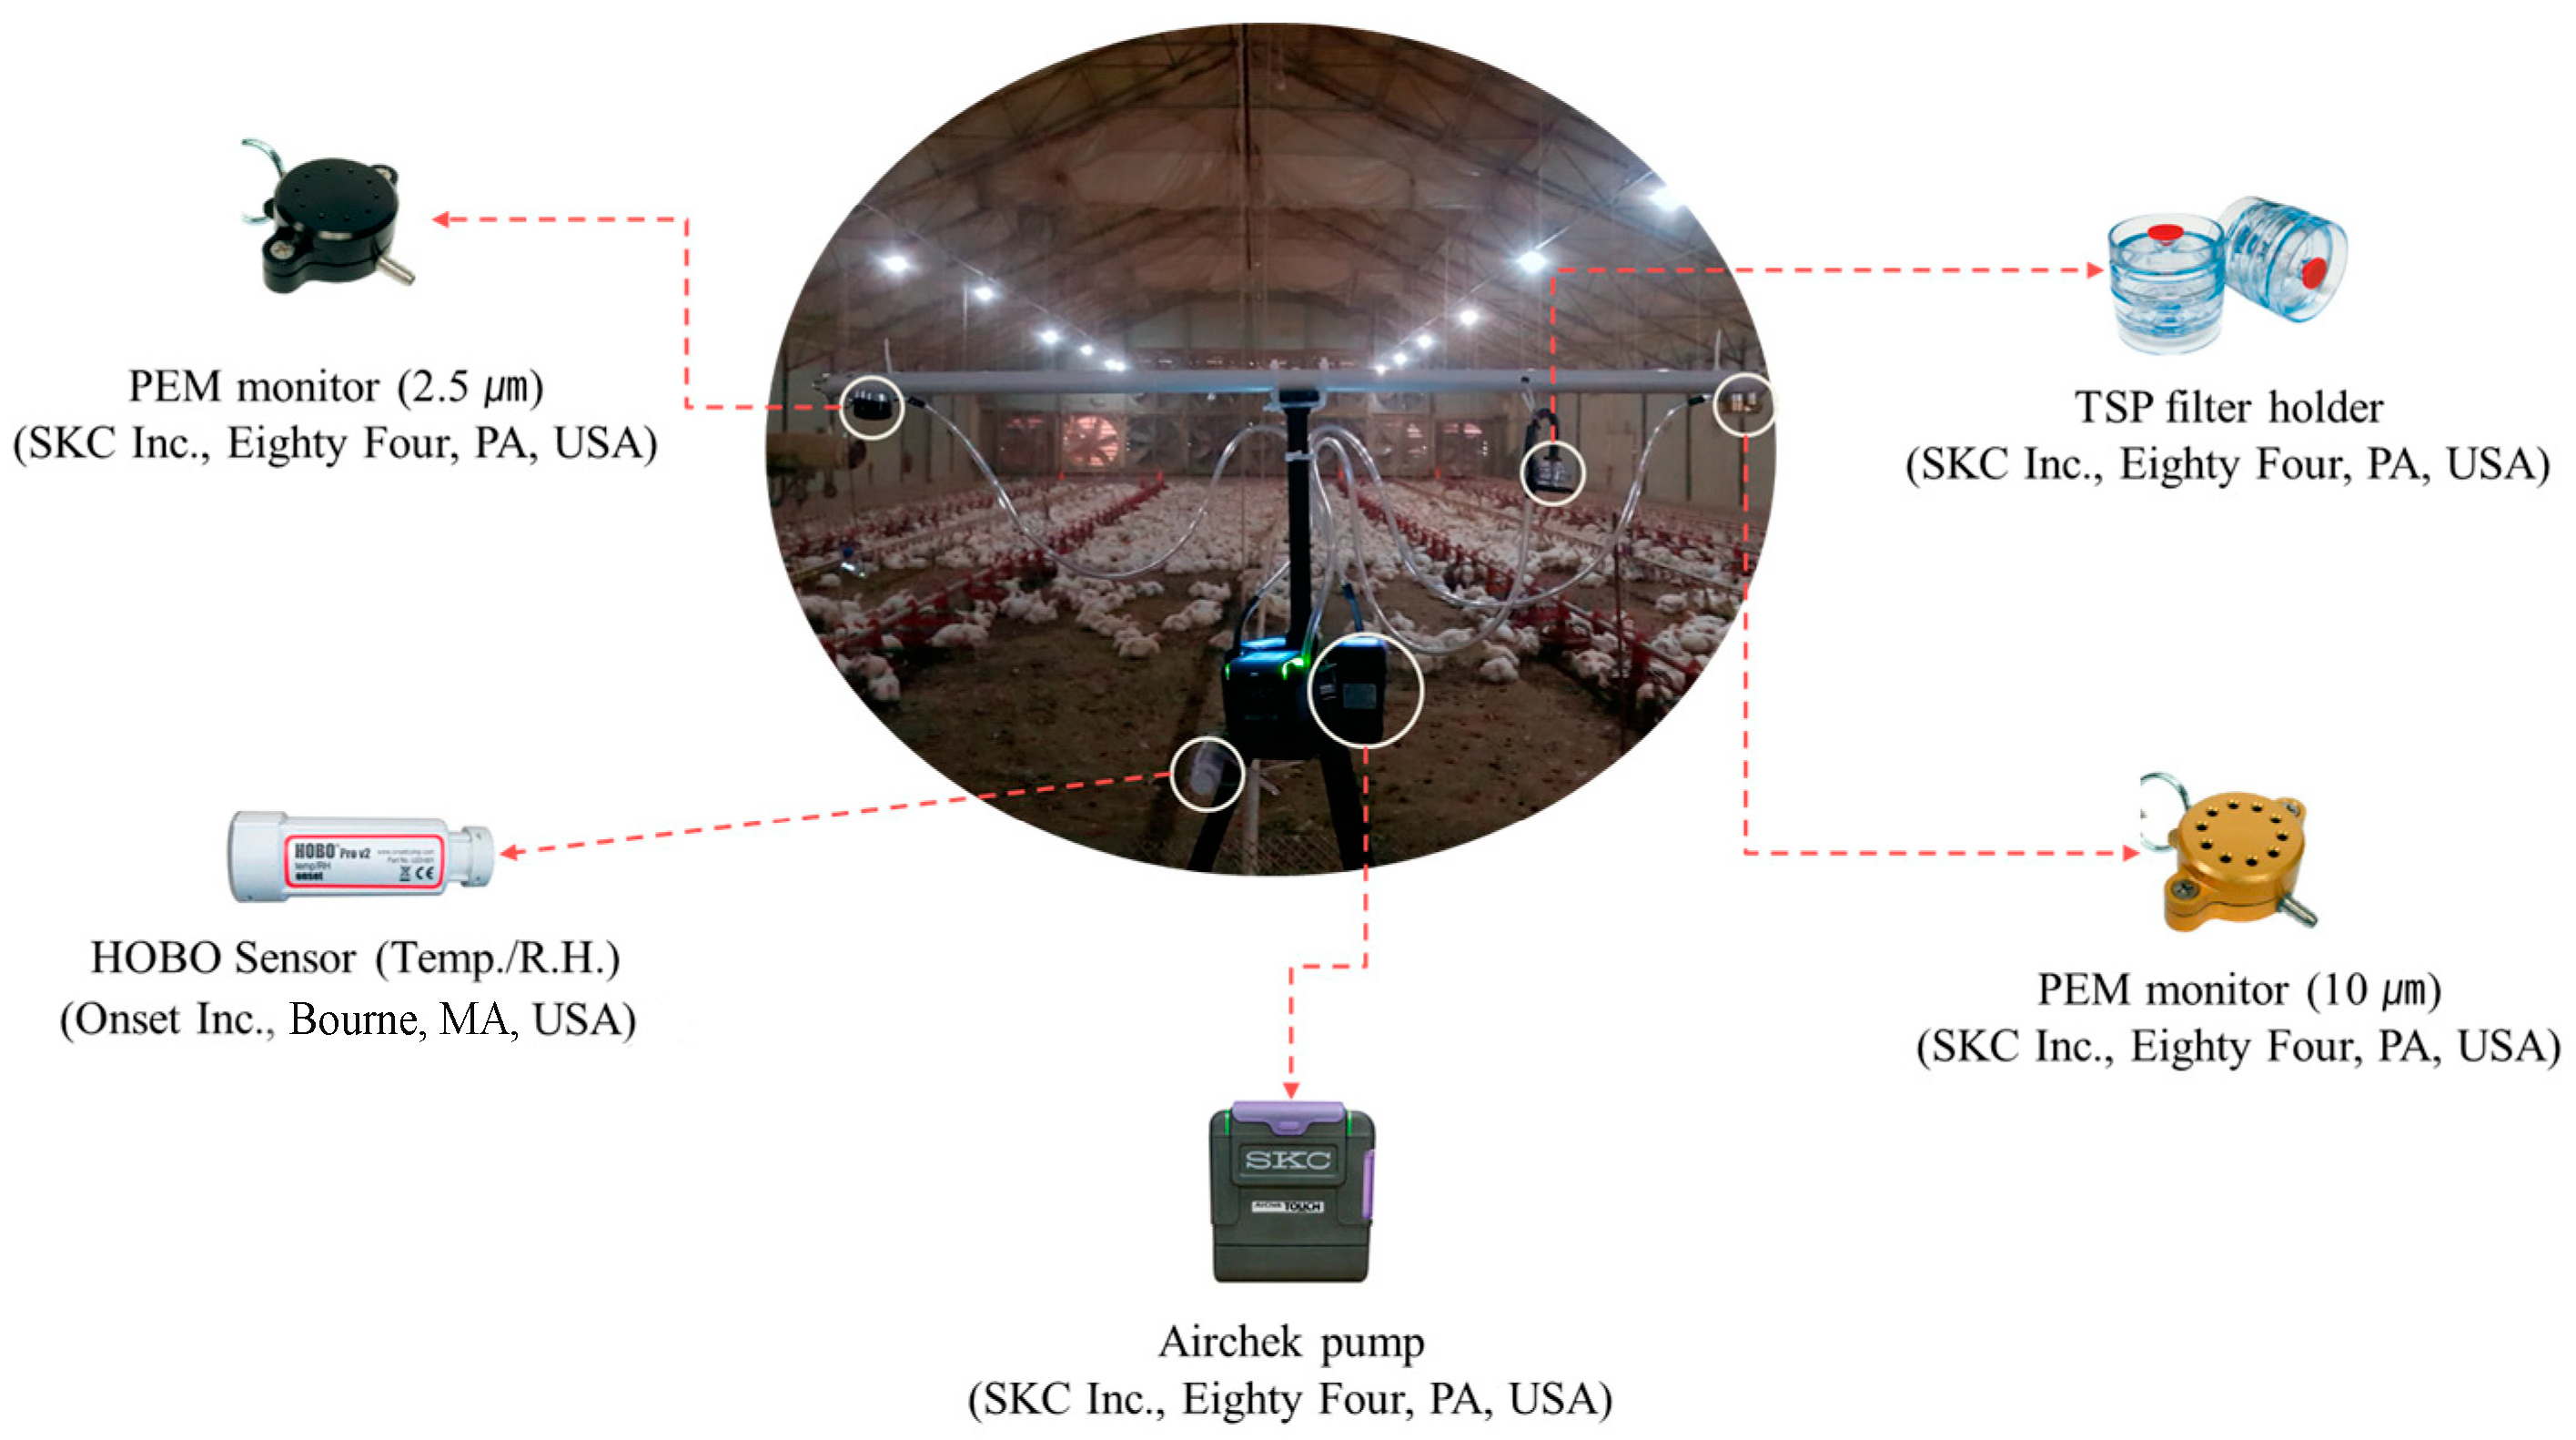
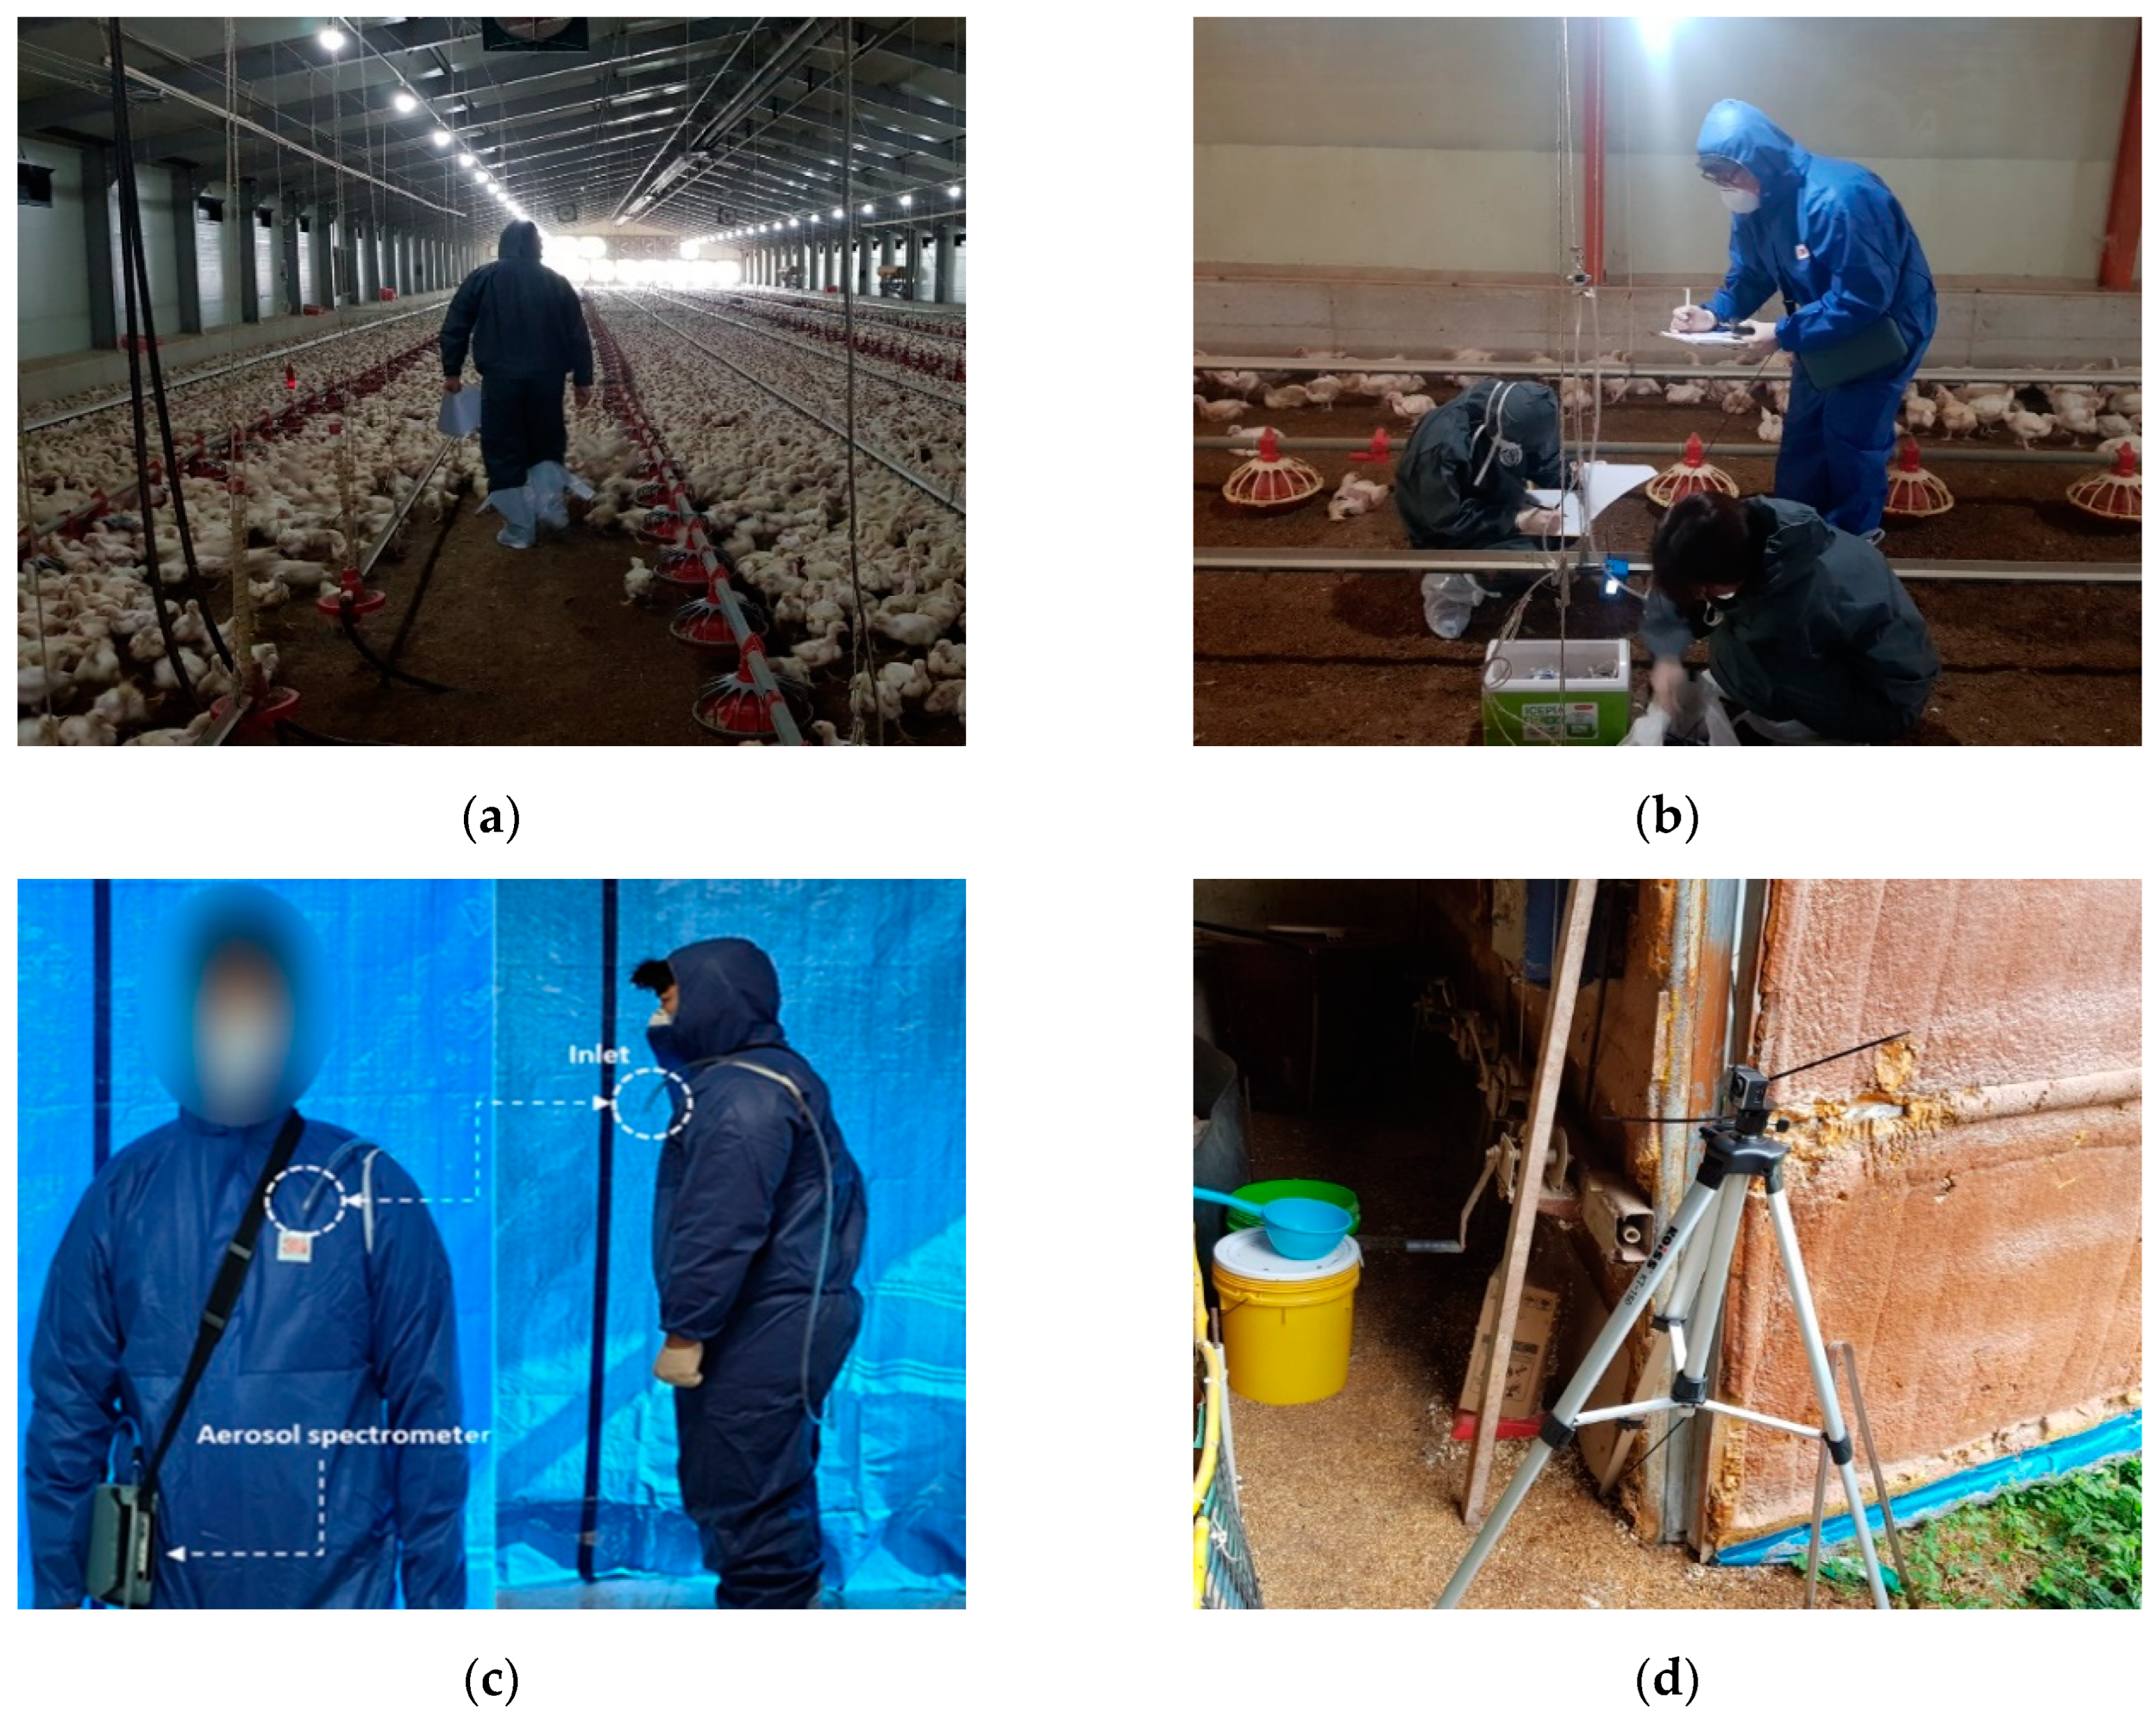
2.3.1. Regional PM Monitoring
2.3.2. Personal PM Monitoring
3. Results
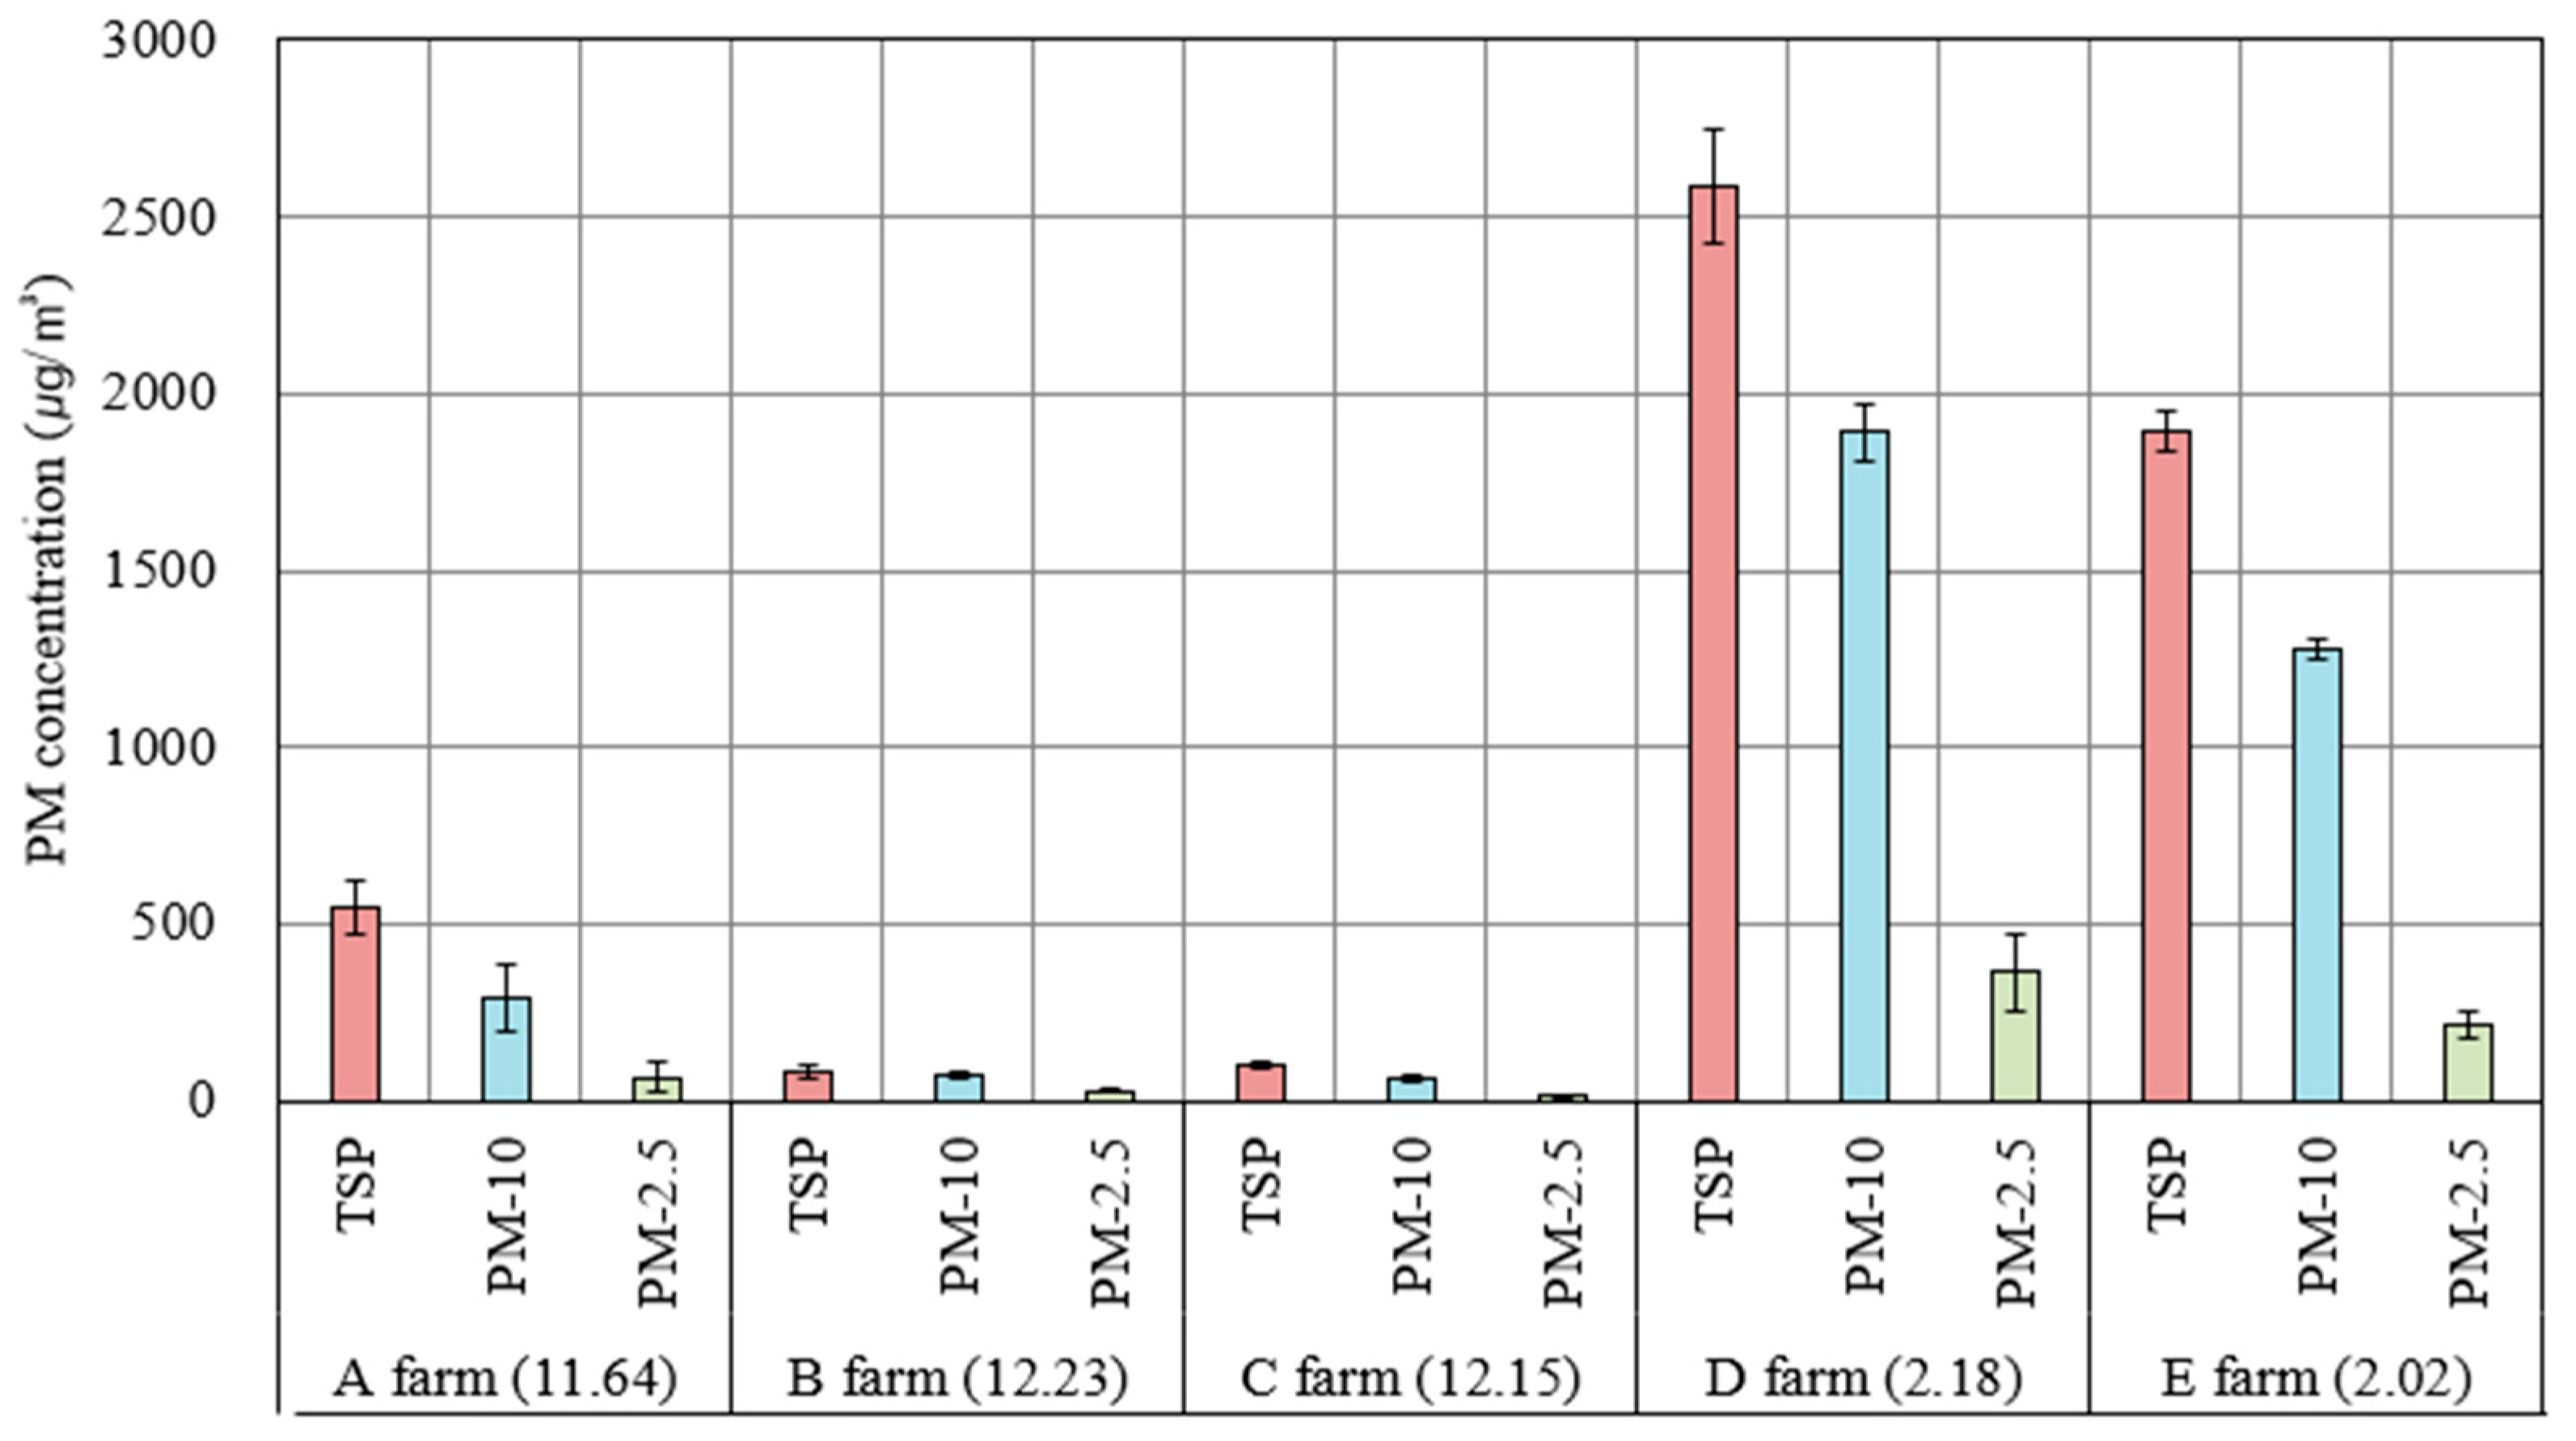
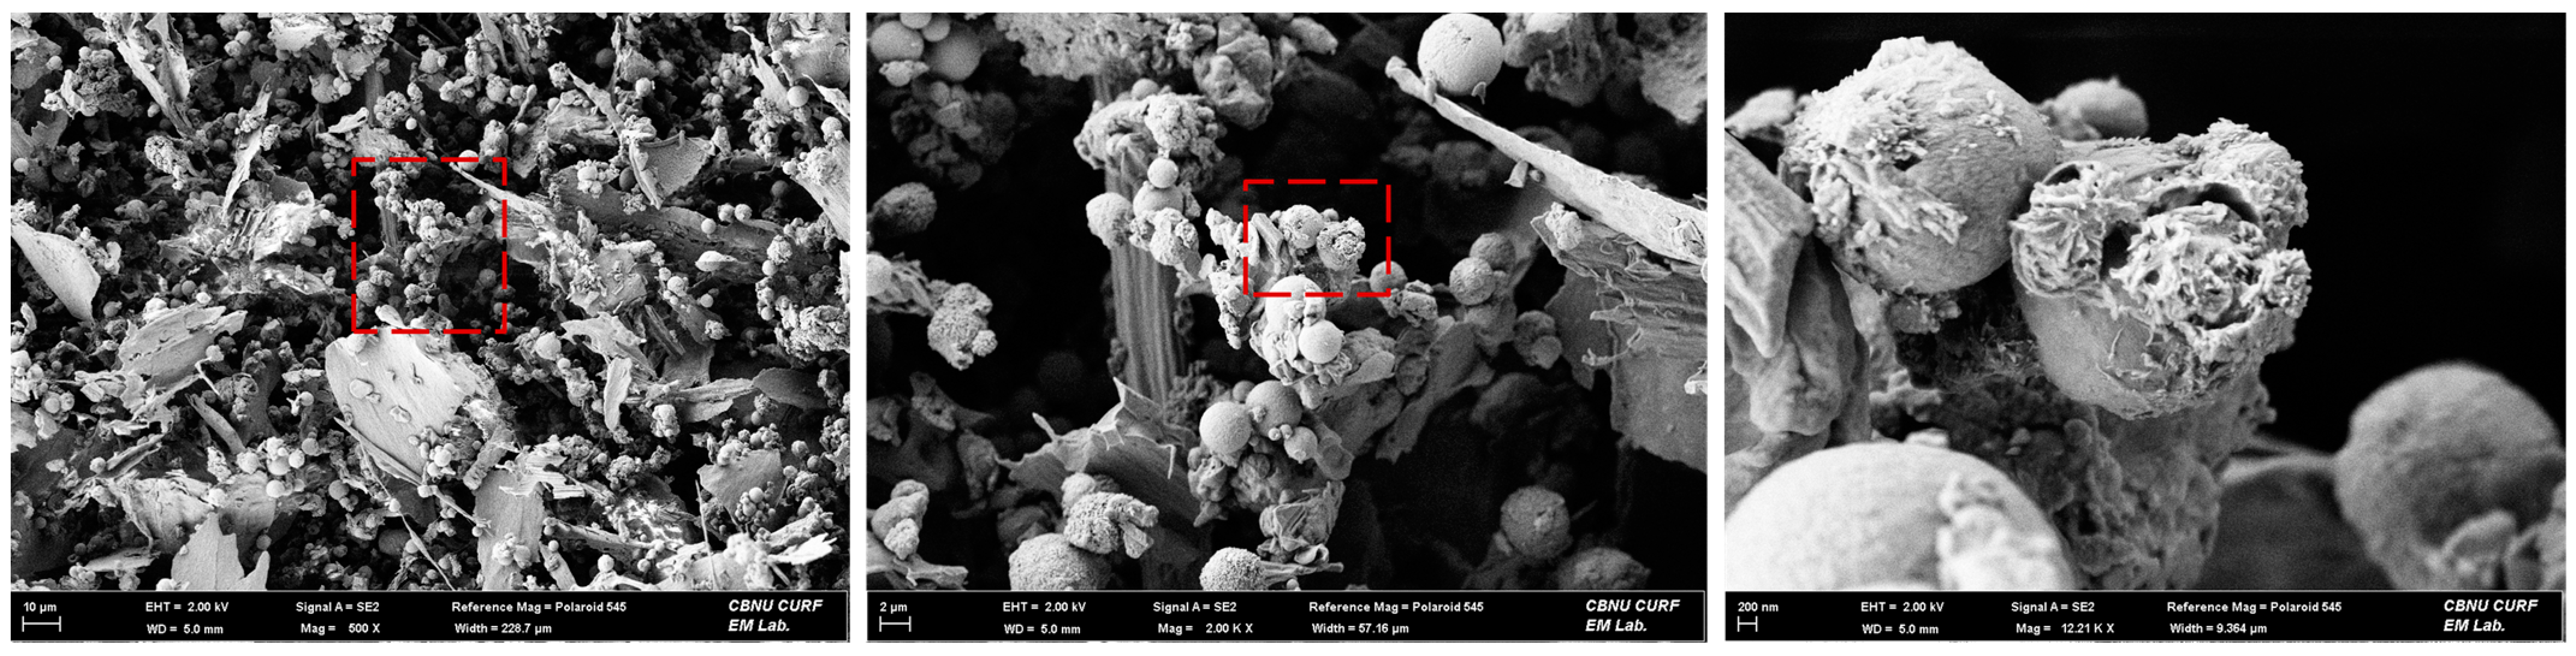
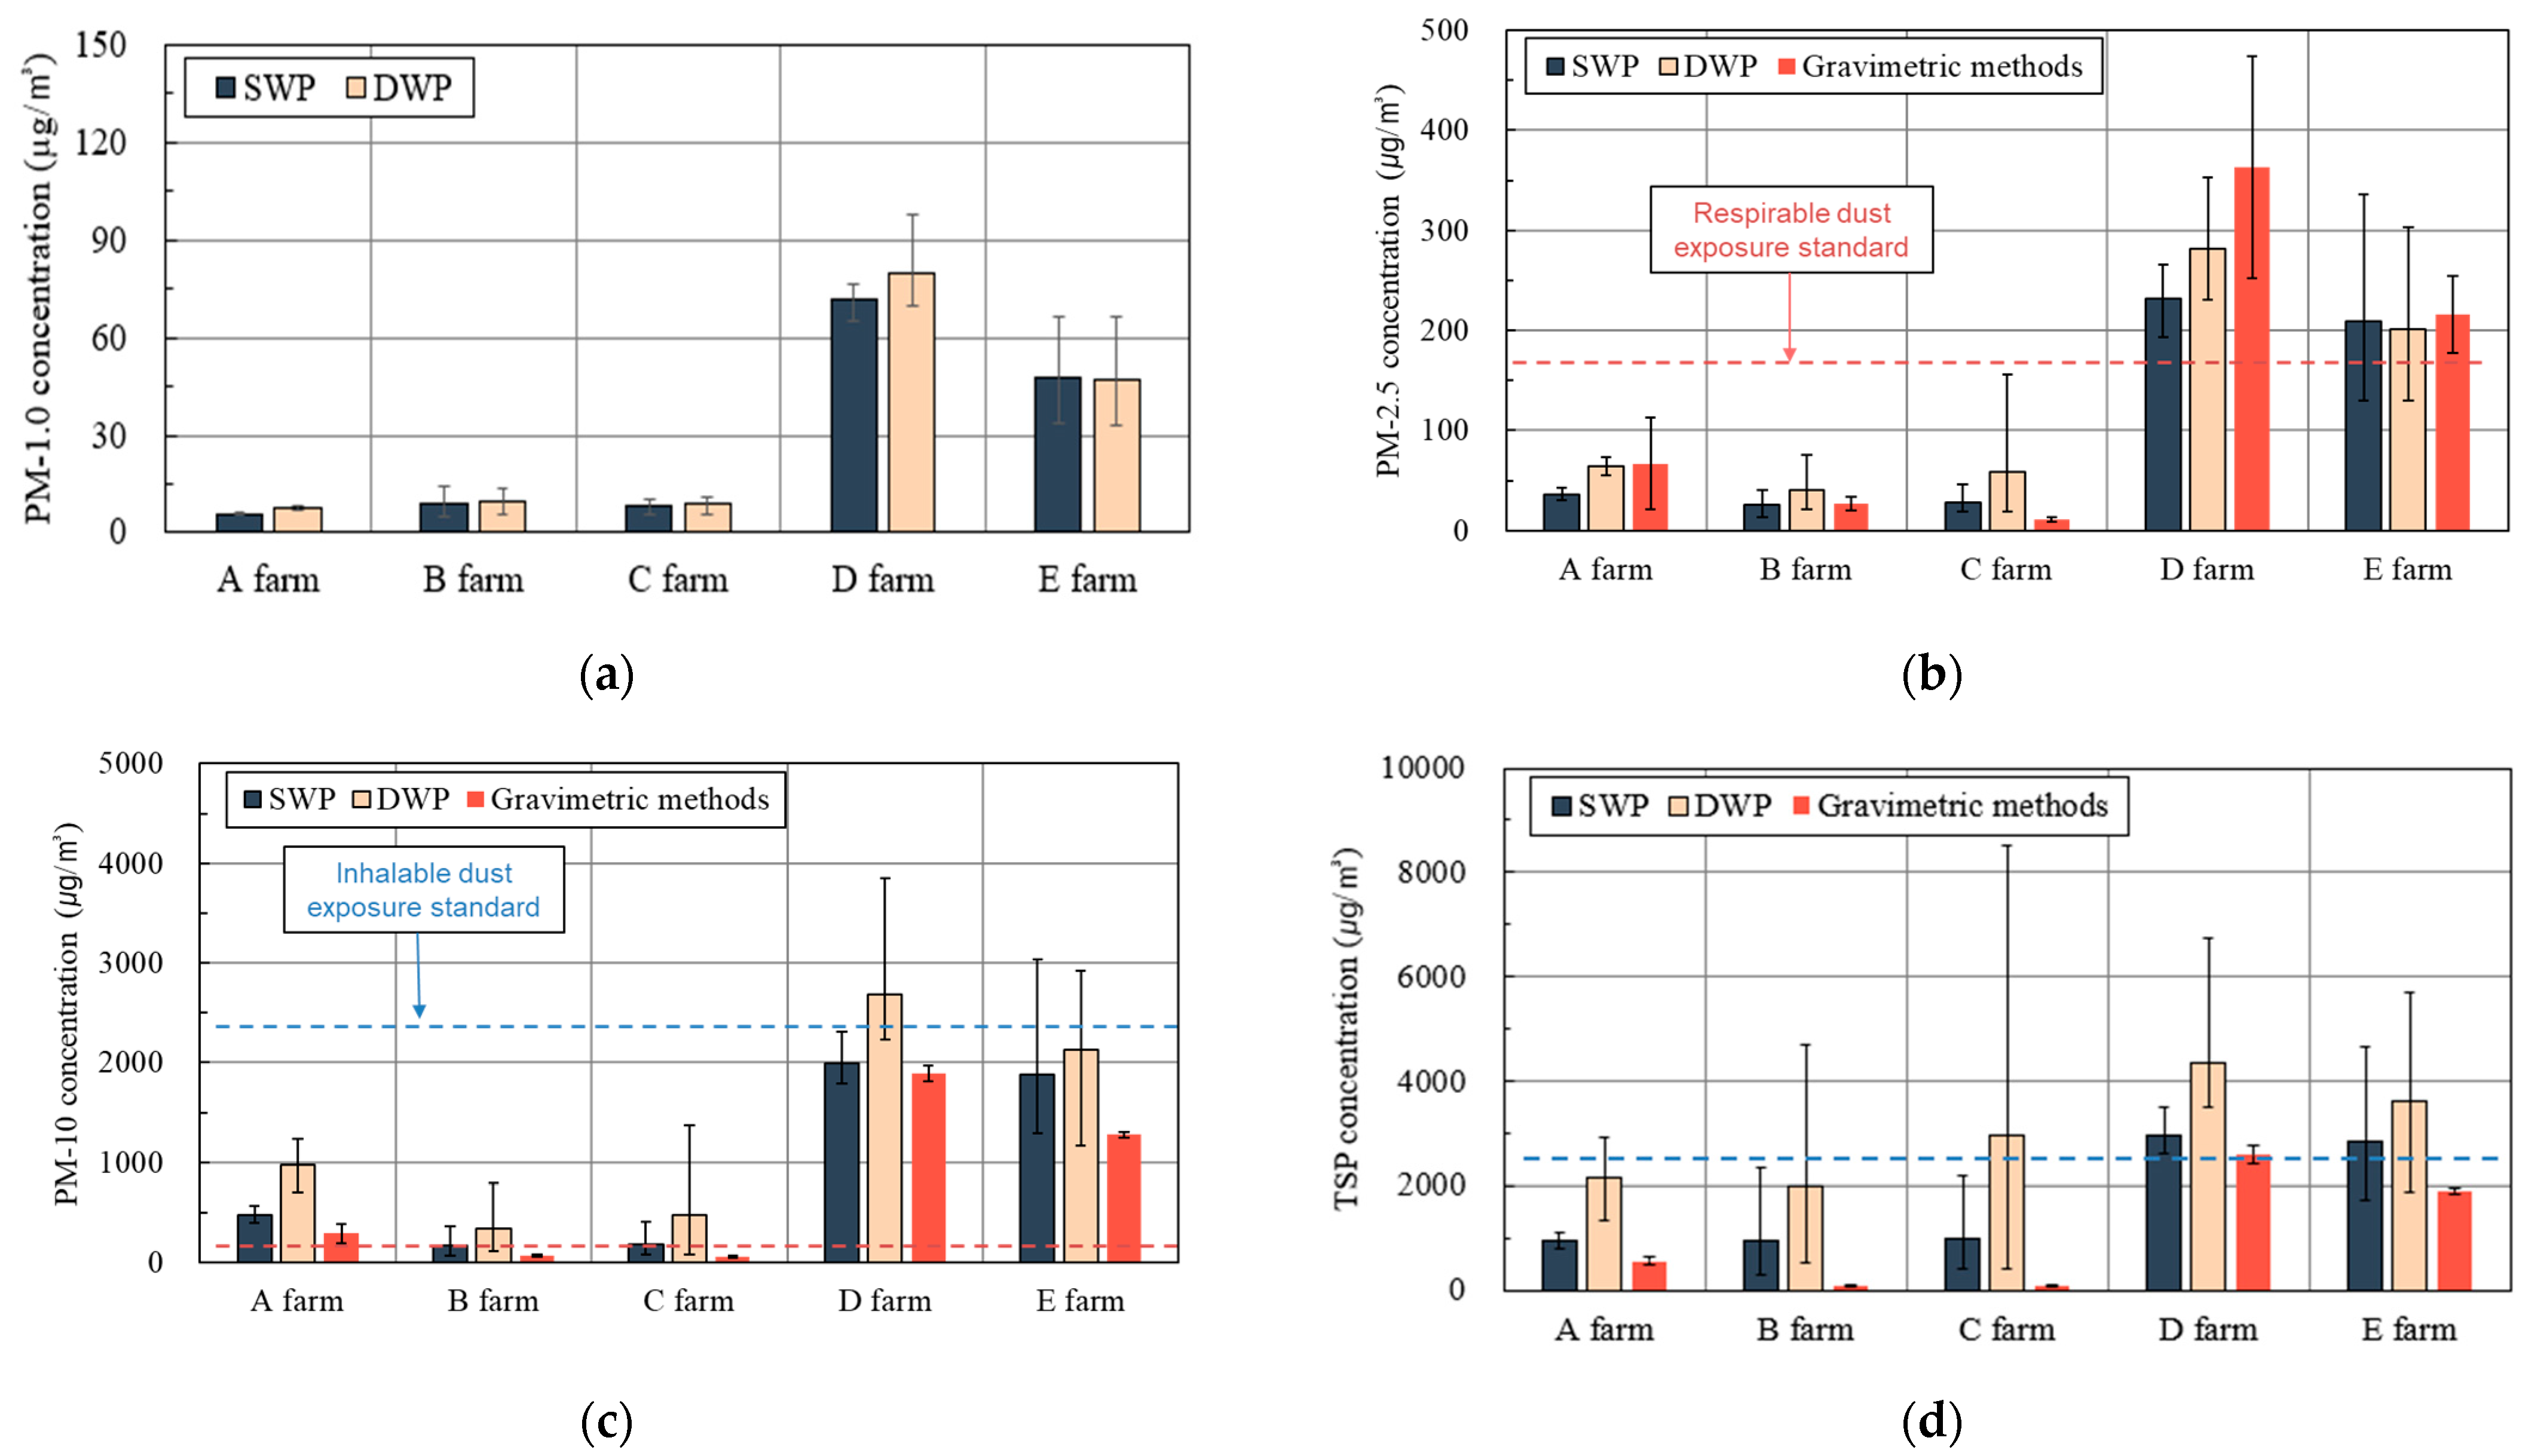
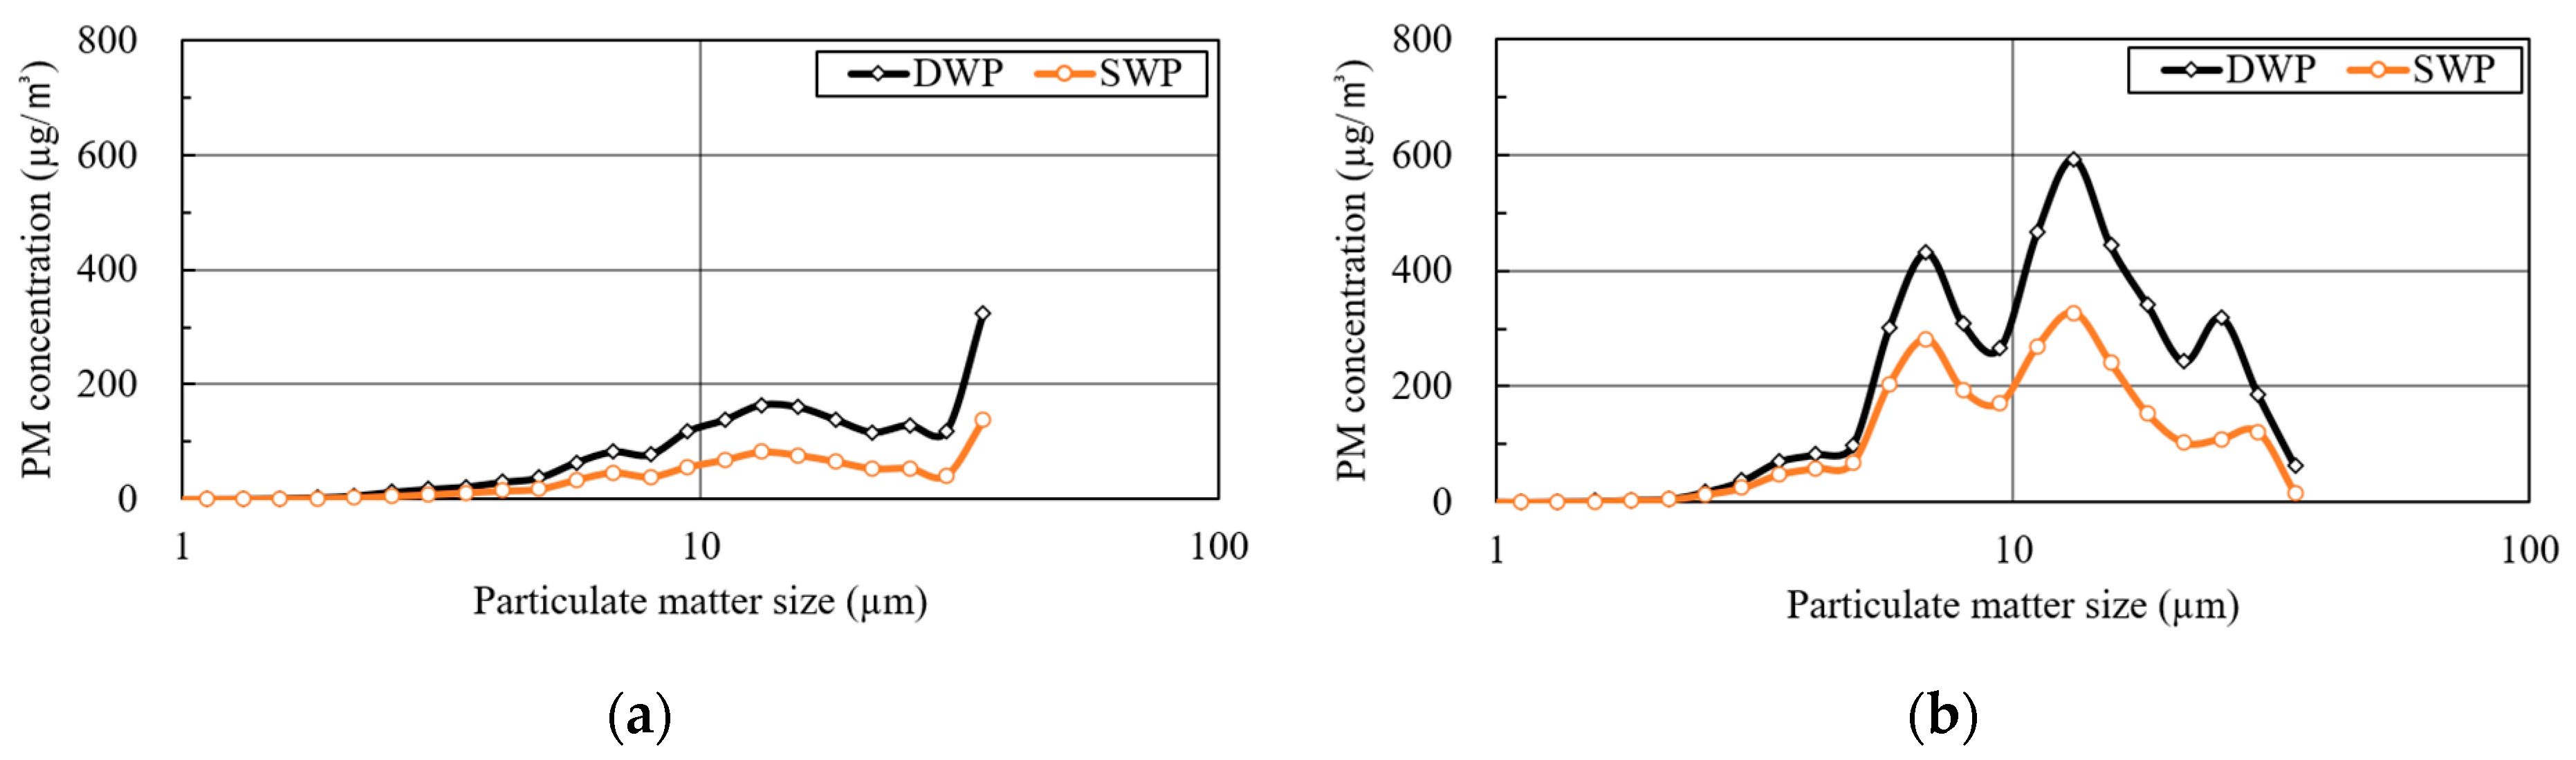
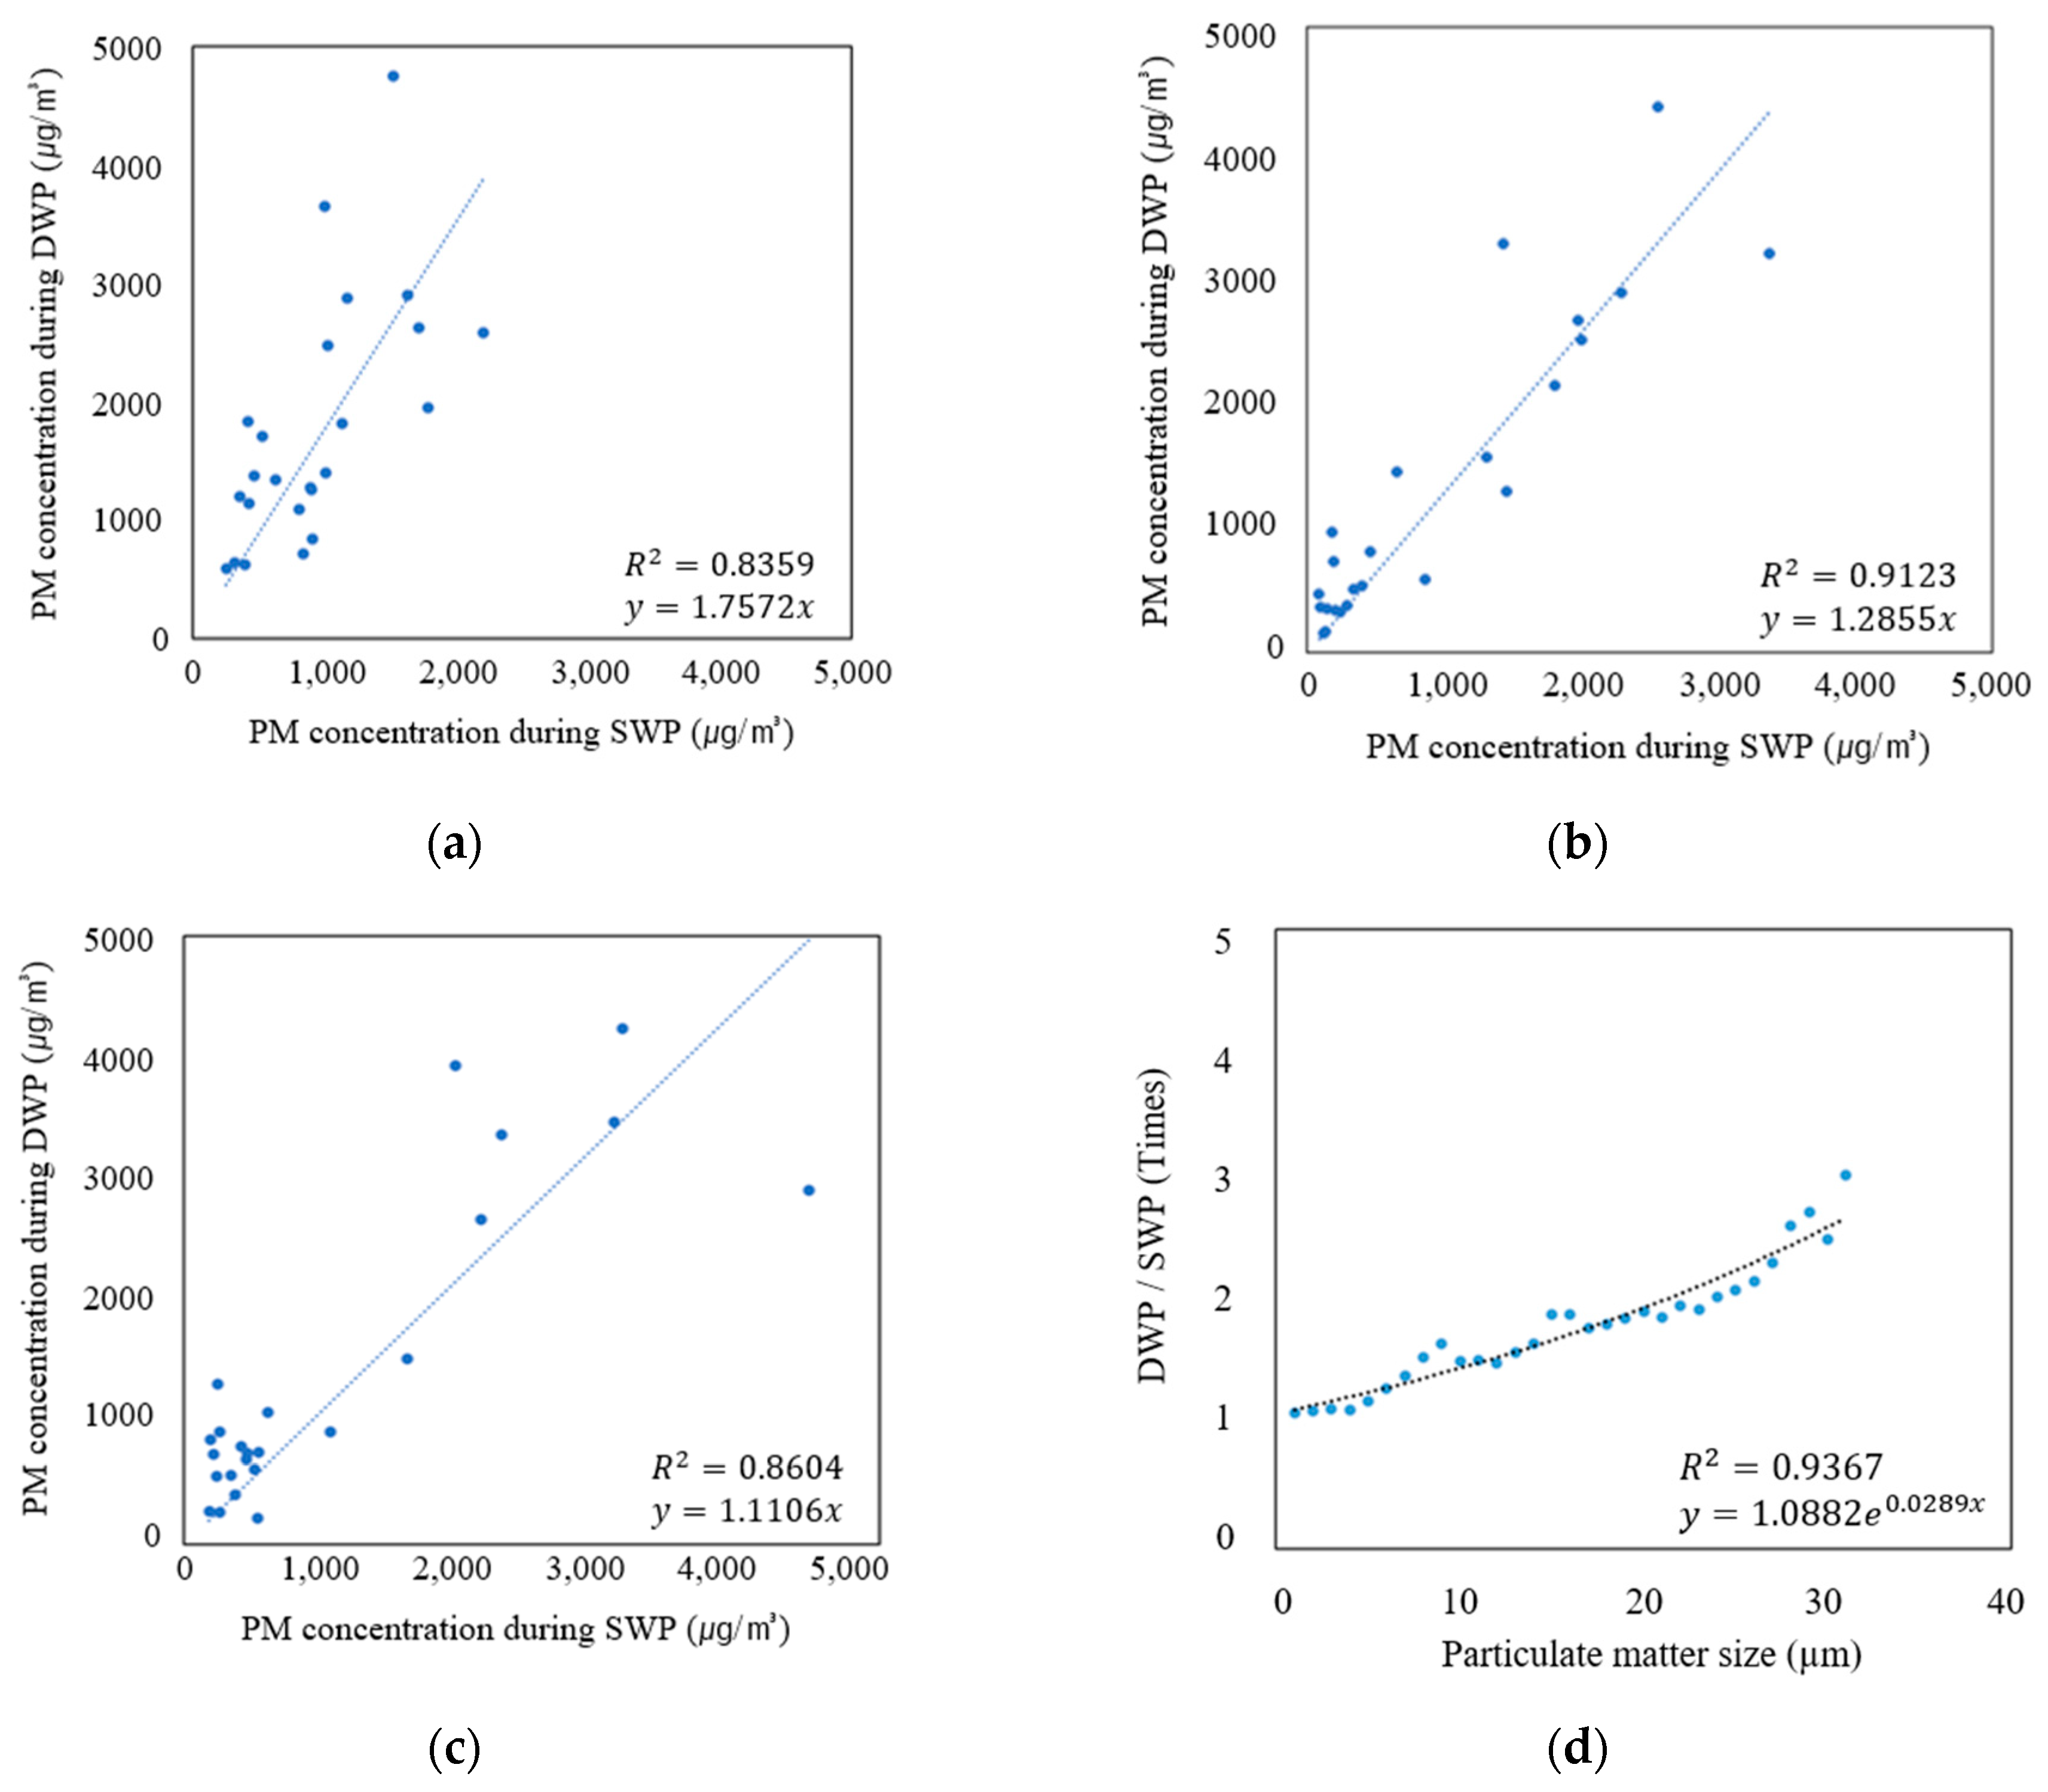
3.1. Regional PM Monitoring
3.2. Personal PM Monitoring
4. Conclusions
Author Contributions
Funding
Institutional Review Board Statement
Data Availability Statement
Conflicts of Interest
References
- Kleven, S. Mycoplasmas in the etiology of multifactorial respiratory disease. Poult. Sci. 1998, 77, 1146–1149. [Google Scholar] [CrossRef] [PubMed]
- Seo, I.-H.; Lee, I.-B.; Moon, O.-K.; Kim, H.-T.; Hwang, H.-S.; Hong, S.-W.; Bitog, J.; Yoo, J.-I.; Kwon, K.-S.; Kim, Y.-H. Improvement of the ventilation system of a naturally ventilated broiler house in the cold season using computational simulations. Biosyst. Eng. 2009, 104, 106–117. [Google Scholar] [CrossRef]
- Wathes, C. Aerial emissions from poultry production. World’s Poult. Sci. J. 1998, 54, 241–251. [Google Scholar] [CrossRef]
- Kim, K.-R.; Kim, H.; Lee, K.; Chae, H.-S. Exposure to dust and organic gas during chicken entrance and shipment tasks in poultry farms. J. Korean Soc. Occup. Environ. Hyg. 2014, 24, 471–477. [Google Scholar] [CrossRef]
- Viegas, S.; Faísca, V.; Dias, H.; Clérigo, A.; Carolino, E.; Viegas, C. Occupational exposure to poultry dust and effects on the respiratory system in workers. J. Toxicol. Environ. Health Part A 2013, 76, 230–239. [Google Scholar] [CrossRef] [PubMed]
- Bottcher, R.W. An environmental nuisance: Odor concentrated and transported by dust. Chem. Senses 2001, 26, 327–331. [Google Scholar] [CrossRef] [PubMed]
- Donham, K.; Haglind, P.; Peterson, Y.; Rylander, R.; Belin, L. Environmental and health studies of farm workers in Swedish swine confinement buildings. Occup. Environ. Med. 1989, 46, 31–37. [Google Scholar] [CrossRef]
- Olson, D.K.; Bark, S.M. Health hazards affecting the animal confinement farm worker. AAOHN J. 1996, 44, 198–204. [Google Scholar] [CrossRef]
- Wang, K.; Shen, D.; Dai, P.; Li, C. Particulate matter in poultry house on poultry respiratory disease: A systematic review. Poult. Sci. 2023, 102, 102556. [Google Scholar] [CrossRef]
- Castañeda, A.R.; Bein, K.J.; Smiley-Jewell, S.; Pinkerton, K.E. Fine particulate matter (PM2.5) enhances allergic sensitization in BALB/c mice. J. Toxicol. Environ. Health Part A 2017, 80, 197–207. [Google Scholar] [CrossRef]
- Moran, R.E.; Bennett, D.H.; Garcia, J.; Schenker, M.B. Occupational exposure to particulate matter from three agricultural crops in California. Int. J. Hyg. Environ. Health 2014, 217, 226–230. [Google Scholar] [CrossRef]
- Poole, J.A.; Romberger, D.J.; Wyatt, T.A.; Staab, E.; VanDeGraaff, J.; Thiele, G.M.; Dusad, A.; Klassen, L.W.; Duryee, M.J.; Mikuls, T.R. Age impacts pulmonary inflammation and systemic bone response to inhaled organic dust exposure. J. Toxicol. Environ. Health Part A 2015, 78, 1201–1216. [Google Scholar] [CrossRef]
- Yang, W.; Guo, M.; Liu, G.; Yu, G.; Wang, P.; Wang, H.; Chai, T. Detection and analysis of fine particulate matter and microbial aerosol in chicken houses in Shandong Province, China. Poult. Sci. 2018, 97, 995–1005. [Google Scholar] [CrossRef]
- Yasmeen, R.; Ali, Z.; Tyrrel, S.; Nasir, Z.A. Assessment of respiratory problems in workers associated with intensive poultry facilities in Pakistan. Saf. Health Work 2020, 11, 118–124. [Google Scholar] [CrossRef]
- Younis, F.; Salem, E.; Salem, E. Respiratory health disorders associated with occupational exposure to bioaerosols among workers in poultry breeding farms. Environ. Sci. Pollut. Res. 2020, 27, 19869–19876. [Google Scholar] [CrossRef] [PubMed]
- Zhou, Y.; Xu, B.; Wang, L.; Zhang, C.; Li, S. Fine Particulate Matter Perturbs the Pulmonary Microbiota in Broiler Chickens. Animals 2023, 13, 2862. [Google Scholar] [CrossRef] [PubMed]
- Adell, E.; Calvet, S.; Pérez-Bonilla, A.; Jiménez-Belenguer, A.; García, J.; Herrera, J.; Cambra-Lopez, M. Air disinfection in laying hen houses: Effect on airborne microorganisms with focus on Mycoplasma gallisepticum. Biosyst. Eng. 2015, 129, 315–323. [Google Scholar] [CrossRef]
- Banhazi, T.; Seedorf, J.; Laffrique, M.; Rutley, D. Identification of the risk factors for high airborne particle concentrations in broiler buildings using statistical modelling. Biosyst. Eng. 2008, 101, 100–110. [Google Scholar] [CrossRef]
- Cambra López, M. Control of Particulate Matter Emissions from Poultry and Pig Houses. Ph.D. Thesis, Universitat Politècnica de València, Valencia, Spain, 2010. [Google Scholar]
- Donham, K.J.; Cumro, D.; Reynolds, S.J.; Merchant, J.A. Dose-response relationships between occupational aerosol exposures and cross-shift declines of lung function in poultry workers: Recommendations for exposure limits. J. Occup. Environ. Med. 2000, 42, 260–269. [Google Scholar] [CrossRef]
- Li, Z.; Xiong, Y.; Wang, S.; Wang, C.; Ji, B.; Liu, Y.; Liang, C.; Tong, Q. Assessing particulate matter concentration level and its limit exceedance based on year-round field measurements of different laying hen building systems. Biosyst. Eng. 2023, 226, 266–279. [Google Scholar] [CrossRef]
- Radon, K.; Weber, C.; Iversen, M.; Danuser, B.; Pedersen, S.; Nowak, D. Exposure assessment and lung function in pig and poultry farmers. Occup. Environ. Med. 2001, 58, 405–410. [Google Scholar] [CrossRef]
- Takai, H.; Pedersen, S.; Johnsen, J.O.; Metz, J.; Koerkamp, P.G.; Uenk, G.; Phillips, V.; Holden, M.; Sneath, R.; Short, J. Concentrations and emissions of airborne dust in livestock buildings in Northern Europe. J. Agric. Eng. Res. 1998, 70, 59–77. [Google Scholar] [CrossRef]
- Wilson, D.J.; Gabriel, E.; Leatherbarrow, A.J.; Cheesbrough, J.; Gee, S.; Bolton, E.; Fox, A.; Fearnhead, P.; Hart, C.A.; Diggle, P.J. Tracing the source of campylobacteriosis. PLoS Genet. 2008, 4, e1000203. [Google Scholar] [CrossRef]
- Zuskin, E.; Mustajbegovic, J.; Schachter, E.N.; Kern, J.; Rienzi, N.; Goswami, S.; Marom, Z.; Maayani, S. Respiratory function in poultry workers and pharmacologic characterization of poultry dust extract. Environ. Res. 1995, 70, 11–19. [Google Scholar] [CrossRef]
- dos Anjos Magri, C.; Garofallo Garcia, R.; Binotto, E.; Duarte da Silva Lima, N.; de Alencar Nääs, I.; Sgavioli, S.; de Castro Burbarelli, M.F. Occupational risk factors in health of broiler-farm workers: A systematic review. Arch. Environ. Occup. Health 2021, 76, 482–493. [Google Scholar] [CrossRef]
- Cambra-López, M.; Hermosilla, T.; Lai, H.T.; Montero, M.; Aarnink, A.J.; Ogink, N.W. Source identification and quantification of particulate matter emitted from livestock houses. In Proceedings of the International Symposium on Air Quality and Manure Management for Agriculture Conference Proceedings, Dallas, TX, USA, 13–16 September 2010; p. 41. [Google Scholar]
- Kim, K.Y. Distribution of concentration and emission of dust according to types of poultry buildings in Korea. J. Environ. Health Sci. 2017, 43, 185–193. [Google Scholar] [CrossRef]
- Seo, H.-J.; Oh, B.-W.; Kim, H.-C.; Sin, S.-J.; Seo, I.-H. Concentrations of particulate matter exposed to farm workers in the broiler houses. J. Korean Soc. Agric. Eng. 2020, 62, 27–37. [Google Scholar] [CrossRef]
- Shin, S.-J.; Song, E.-S.; Kim, J.-W.; Lee, J.-H.; Gautam, R.; Kim, H.-J.; Kim, Y.-G.; Cho, A.-R.; Yang, S.-J.; Acharya, M. Major environmental characteristics of swine husbandry that affect exposure to dust and airborne endotoxins. J. Toxicol. Environ. Health Part A 2019, 82, 233–243. [Google Scholar] [CrossRef]
- Lee, B.-J.; Park, S.-S. Evaluation of PM10 and PM2.5 concentrations from online light scattering dust monitors using gravimetric and beta-ray absorption methods. J. Korean Soc. Atmos. Environ. 2019, 35, 357–369. [Google Scholar] [CrossRef]
- Choi, S.-I.; An, J.-A.; Jo, Y.-M. Review of analysis principle of fine dust. Korean Ind. Chem. News 2018, 21, 16–23. [Google Scholar]
- Yasmeen, R.; Ali, Z.; Tyrrel, S.; Nasir, Z.A. Estimation of particulate matter and gaseous concentrations using low-cost sensors from broiler houses. Environ. Monit. Assess. 2019, 191, 470. [Google Scholar] [CrossRef]
- Fernández, A.P.; Demmers, T.G.; Tong, Q.; Youssef, A.; Norton, T.; Vranken, E.; Berckmans, D. Real-time modelling of indoor particulate matter concentration in poultry houses using broiler activity and ventilation rate. Biosyst. Eng. 2019, 187, 214–225. [Google Scholar] [CrossRef]
- Kwon, K.S.; Jo, Y.S.; Lee, I.B.; Ha, T.H.; Hong, S.W. Measurement of dust concentration in a mechanically ventilated broiler house and analysis of dust generation from ground beds. J. Korean Soc. Agric. Eng. 2014, 56, 31–43. [Google Scholar] [CrossRef]
- Choi, H.; Yeon, G.; Song, J.; Kang, H.; Kwon, D.; Yoo, Y.; Barroga, A.; Yang, C.; Chun, S.; Kim, Y. Seasonal dust concentration and characteristics of windowless broiler building. J. Anim. Environ. Sci. 2005, 11, 197–206. [Google Scholar]
- Dai, P.; Shen, D.; Tang, Q.; Huang, K.; Li, C. PM2.5 from a broiler breeding production system: The characteristics and microbial community analysis. Environ. Pollut. 2020, 256, 113368. [Google Scholar] [CrossRef]
- Kabelitz, T.; Biniasch, O.; Ammon, C.; Nübel, U.; Thiel, N.; Janke, D.; Swaminathan, S.; Funk, R.; Münch, S.; Rösler, U. Particulate matter emissions during field application of poultry manure-The influence of moisture content and treatment. Sci. Total Environ. 2021, 780, 146652. [Google Scholar] [CrossRef] [PubMed]
- Shen, D.; Wu, S.; Dai, P.; Li, Y.; Li, C. Distribution of particulate matter and ammonia and physicochemical properties of fine particulate matter in a layer house. Poult. Sci. 2018, 97, 4137–4149. [Google Scholar] [CrossRef]
- Heber, A.; Stroik, M.; Faubion, J.; Willard, L. Size distribution and identification of aerial dust particles in swine finishing buildings. Trans. ASAE 1988, 31, 882–887. [Google Scholar] [CrossRef]
- Pearson, C.; Sharples, T. Airborne dust concentrations in livestock buildings and the effect of feed. J. Agric. Eng. Res. 1995, 60, 145–154. [Google Scholar] [CrossRef]


| Farm (Location, City) | Season | Date | Internal | External Weather Conditions | ||||
|---|---|---|---|---|---|---|---|---|
| Temp. (°C) | RH. (%) | Temp. (°C) | RH. (%) | TSP (µg/m3) | PM-10 (µg/m3) | |||
| A (Jin-an) | summer | 9 September 2019 | 26.0 | 85.0 | 24.4 | 90.2 | 14.6 | 9.4 |
| B (Young-gwang) | 30 July 2020 | 28.7 | 84.0 | 30.8 | 74.8 | 89.1 | 57.4 | |
| C (Young-gwang) | 31 July 2020 | 29.9 | 77.3 | 32.8 | 69.1 | 55.5 | 42.9 | |
| D (Ik-san) | autumn | 28 October 2019 | 25.8 | 46.8 | 18.5 | 43.2 | 23.1 | 11.4 |
| E (Ik-san) | 4 November 2019 | 24.9 | 50.2 | 21.8 | 46.7 | 25.8 | 13.3 | |
| Farm | No. of Chickens (Heads) | Floor Area (m2) | Stock Density (m2/Head) | Ventilation System Configuration (Activated/Overall Fans) | Ventilation Rate (CMH/Head) | Fan Operation Rate |
|---|---|---|---|---|---|---|
| A | 9000 | 450 | 0.05 | Outlet exhaust fans (4/6) | 11.64 | 66% |
| B | 30,000 | 1500 | 0.05 | Outlet exhaust fans (14/14) | 12.23 | 100% |
| C | 34,500 | 1880 | 0.054 | Outlet exhaust fans (16/16) | 12.15 | 100% |
| D | 24,000 | 1600 | 0.067 | Outlet exhaust fans (2/16) | 2.18 | 13% |
| E | 26,000 | 1200 | 0.046 | Outlet exhaust fans (2/13) | 2.02 | 15% |
| Categories | TSP | PM-10 | ||||
| Mean | S.D. | p-value | Mean | S.D. | p-value | |
| DWP | 2957 | 1603 | 0.000 | 1179 | 1064 | 0.001 |
| SWP | 1772 | 1167 | 839 | 854 | ||
| Categories | PM-2.5 | PM-1.0 | ||||
| mean | S.D. | p-value | mean | S.D. | p-value | |
| DWP | 110.9 | 104.4 | 0.017 | 26.1 | 29.8 | 0.098 |
| SWP | 87.3 | 95.7 | 23.4 | 26.4 | ||
Disclaimer/Publisher’s Note: The statements, opinions and data contained in all publications are solely those of the individual author(s) and contributor(s) and not of MDPI and/or the editor(s). MDPI and/or the editor(s) disclaim responsibility for any injury to people or property resulting from any ideas, methods, instructions or products referred to in the content. |
© 2024 by the authors. Licensee MDPI, Basel, Switzerland. This article is an open access article distributed under the terms and conditions of the Creative Commons Attribution (CC BY) license (https://creativecommons.org/licenses/by/4.0/).
Share and Cite
Seo, H.-J.; Seo, I.-H.; Oh, B.-W. Managemental Impacts on Particulate Matter Emission in Tunnel-Ventilated Broiler Houses. Agriculture 2024, 14, 204. https://doi.org/10.3390/agriculture14020204
Seo H-J, Seo I-H, Oh B-W. Managemental Impacts on Particulate Matter Emission in Tunnel-Ventilated Broiler Houses. Agriculture. 2024; 14(2):204. https://doi.org/10.3390/agriculture14020204
Chicago/Turabian StyleSeo, Hyo-Jae, Il-Hwan Seo, and Byung-Wook Oh. 2024. "Managemental Impacts on Particulate Matter Emission in Tunnel-Ventilated Broiler Houses" Agriculture 14, no. 2: 204. https://doi.org/10.3390/agriculture14020204
APA StyleSeo, H.-J., Seo, I.-H., & Oh, B.-W. (2024). Managemental Impacts on Particulate Matter Emission in Tunnel-Ventilated Broiler Houses. Agriculture, 14(2), 204. https://doi.org/10.3390/agriculture14020204