Article

Crushing Force Prediction Method of Controlled-Release Fertilizer Based on Particle Phenotype

by
Linlin Sun
1,2,
Xiubo Chen
1,
Zixu Chen
1,
Linlong Jing
1,2,
Jinxing Wang
1,3,
Xinpeng Cao
1,
Shenghui Fu
1,
Yuanmao Jiang
4 and
Hongjian Zhang
1,4,*
1
College of Mechanical and Electronic Engineering, Shandong Agricultural University, Taian 271018, China
2
Shandong Provincial Engineering Laboratory of Agricultural Equipment Intelligence, Taian 271018, China
3
Shandong Provincial Key Laboratory of Facility Horticulture Intelligent Production Technology and Equipment, Taian 271018, China
4
College of Horticultural Science and Engineering, Shandong Agricultural University, Taian 271018, China
*
Author to whom correspondence should be addressed.
Agriculture 2024, 14(12), 2235; https://doi.org/10.3390/agriculture14122235
Submission received: 12 November 2024 / Revised: 3 December 2024 / Accepted: 3 December 2024 / Published: 6 December 2024
(This article belongs to the Section Agricultural Technology)

Abstract

:
This study proposed a method to predict the crushing force of controlled-release fertilizer granules based on their phenotypic characteristics to prevent coating damage during production, transport, and fertilization, which could affect nutrient diffusion rates. The phenotypic features, including sphericity, particle size, and texture, of three commonly used controlled-release fertilizers were obtained using machine vision, while the crushing force was measured using a universal testing machine. A principal component analysis was applied for data reduction, and the optimal parameters for the support vector machine (SVM) were selected using particle swarm optimization (PSO) combined with k-fold cross-validation. A particle swarm optimization–support vector machine (PSO-SVM) model was then developed to predict the crushing force based on fertilizer shape features. Compared with the traditional method, the innovation of this paper is that a non-destructive prediction method is proposed, which enables high-precision predictions of the crushing force by integrating multi-dimensional phenotypic features and an intelligent optimization algorithm. Comparative tests with a random forest regression, the K-nearest neighbor, a back propagation (BP) neural network, and a long short-term memory (LSTM) neural network have demonstrated that the PSO-SVM model outperforms these methods in terms of mean absolute error, root mean square error, and correlation coefficient, underscoring its effectiveness. The proportion of predictions within the −10% to +10% error range reached 0.82, 0.82, and 0.86 for the three fertilizers, confirming the high reliability and accuracy of the PSO-SVM method for non-destructive testing.

1. Introduction

The application of chemical fertilizers has played a crucial role in increasing grain yields, contributing to a 21.7% growth in agricultural production in China [1]. However, the excessive application and low utilization rate of chemical fertilizers will lead to environmental pollution [2,3,4]. The rapid nutrient release rate of traditional fertilizers, the easy loss, migration, and volatilization of traditional fertilizers, environmental pollution, and the disturbance of soil microbial ecosystems have constrained the sustainable development of agriculture in China [5]. Controlling fertilizer application rates, enhancing fertilizer use efficiency, and using controlled-release fertilizers in place of traditional fertilizers have therefore become profoundly significant for the sustainable development of agriculture in China [6]. The controlled-release capability of these fertilizers stems from a unique nutrient diffusion mechanism: the coating of controlled-release fertilizers isolates the internal nutrients from the external environment, creating a concentration gradient that regulates nutrient release [7]. However, if the coating of a controlled-release fertilizer is damaged during production, transportation, or application, this nutrient diffusion mechanism is compromised, ultimately reducing the effectiveness of nutrient release control [8,9]. Consequently, accurately predicting the crushing strength of fertilizers has become essential for minimizing coating damage and ensuring that controlled-release fertilizers release nutrients at a predetermined rate [10].
The shape characteristics of fertilizer granules have influenced parameters such as sphericity, the friction coefficient, the restitution coefficient, and seeding performance, making them a critical focus of agricultural machinery design research. These shape characteristics have been shown to affect the mechanical and flow behavior of granular materials, serving as key parameters for predicting and controlling fertilizer performance. Jun Shan and Liming Xu [11] found that the texture characteristics of spheres impacted the accuracy of spherical shapes. Mohammad and Ahmad [12] discovered that texture features were significant in predicting surface roughness. Hongfu Kan et al. [13] demonstrated that higher sphericity in fertilizer granules led to denser granules with greater strength; additionally, increased roundness resulted in smoother, more uniform granules, which enhanced porosity, heat dissipation, and flowability. Hofstee and Huisman [14] identified five physical properties that influence fertilizer motion: granule size, strength, the friction coefficient, the restitution coefficient, and aerodynamic drag. Among these, fertilizer strength indirectly affects granule movement, as low-strength granules often fracture during fertilizer spreader operations, altering the granule size and, consequently, the nutrient distribution. Silverberg and Hoffmeister [15,16] found that the shape of fertilizer granules and the pore structures formed during fertilizer packing influence salt ion diffusion, thereby impacting fertilizer performance. Additionally, differences in granule size, shape, and density have been shown to influence nutrient segregation during the transport and distribution of blended fertilizers.
In recent years, machine learning algorithms have been widely used in various fields for predictive tasks. Yunchao Tang [17] et al. studied the performance of adding waste rubber to temperature-tolerant recycled aggregate concrete (RAC), proposed an optimization model based on an SVR, and discussed the effects of waste rubber on the compressive strength and durability of recycled aggregate concrete under temperature changes. Sulaiman R. [18] et al. developed an SVM/KNN/RF ensemble prediction model to achieve high-precision predictions of the phosphorus concentration in hydroponic solutions using spectral data. Zadeh A. [19] found that machine learning algorithms exhibit high levels of reliability in predicting the occurrence of new tumors in organ transplant patients by comparing different predictive algorithms. Guochao Ding [20] constructed a CGA-BP prediction model for aerobic compost aeration oxygen supply, improving the prediction efficiency of oxygen supply during fermentation and achieving the control of the aeration process with a high degree of precision. Pei Shi [21] optimized the traditional ELM neural network, achieving high-accuracy and high-efficiency predictions of dissolved oxygen concentrations in water bodies using the SPLS-ELM prediction model. Linlu Zu [22] implemented an SSA-LSTM prediction model, enabling accurate temperature predictions in complex small-scale climatic environments, which is significant for the precise regulation of growth environments. Zhang H. [23] developed a D-PE-SVM prediction model to forecast the crushing strength of common nitrogen, phosphorus, and potassium fertilizers based on shape characteristics, focusing on fertilizer strength prediction. However, methods for predicting the strength of controlled-release fertilizer granules still need improvement.
In order to improve the application efficiency of controlled-release fertilizer and prevent damage during production, transportation, and fertilizer application processes that may affect nutrient diffusion rates, this paper proposes a novel method for the non-destructive prediction of the crushing force of controlled-release fertilizer granules based on phenotypic characteristics and a support vector machine (SVM) regression prediction model. The PSO-SVM model was developed using MATLAB 2020b, utilizing the Optimization Toolbox for Particle Swarm Optimization (PSO) and the Statistics and Machine Learning Toolbox for Support Vector Machine (SVM) construction. The crushing force of the controlled-release fertilizer was measured using a universal testing machine, and the sphericity and particle size were extracted from the phenotypic characteristics after photo preprocessing. Texture features, such as energy, contrast, correlation, and entropy, from the phenotypic characteristics were obtained using the gray-level co-occurrence matrix algorithm. Based on the SVM prediction model, the particle swarm optimization algorithm and K-fold cross-validation were used to obtain the optimal parameters for the support vector machine. The crushing force of the controlled-release fertilizers was then predicted based on their phenotypic characteristics, further optimizing the prediction accuracy and reducing the breakage rate of the controlled-release fertilizer, thereby enhancing the fertilizer application efficiency. Compared with the traditional prediction methods, the innovation of this paper is that a non-destructive prediction method based on the phenotypic characteristics of particles is proposed. The phenotypic characteristics of controlled-release fertilizer particles are accurately obtained through machine vision technology, and the high-precision prediction of the crushing force of controlled-release fertilizer particles is realized through intelligent optimization algorithms, which avoids the damage to the granules caused by destructive testing methods and improves the prediction efficiency and accuracy.

2. Materials and Methods

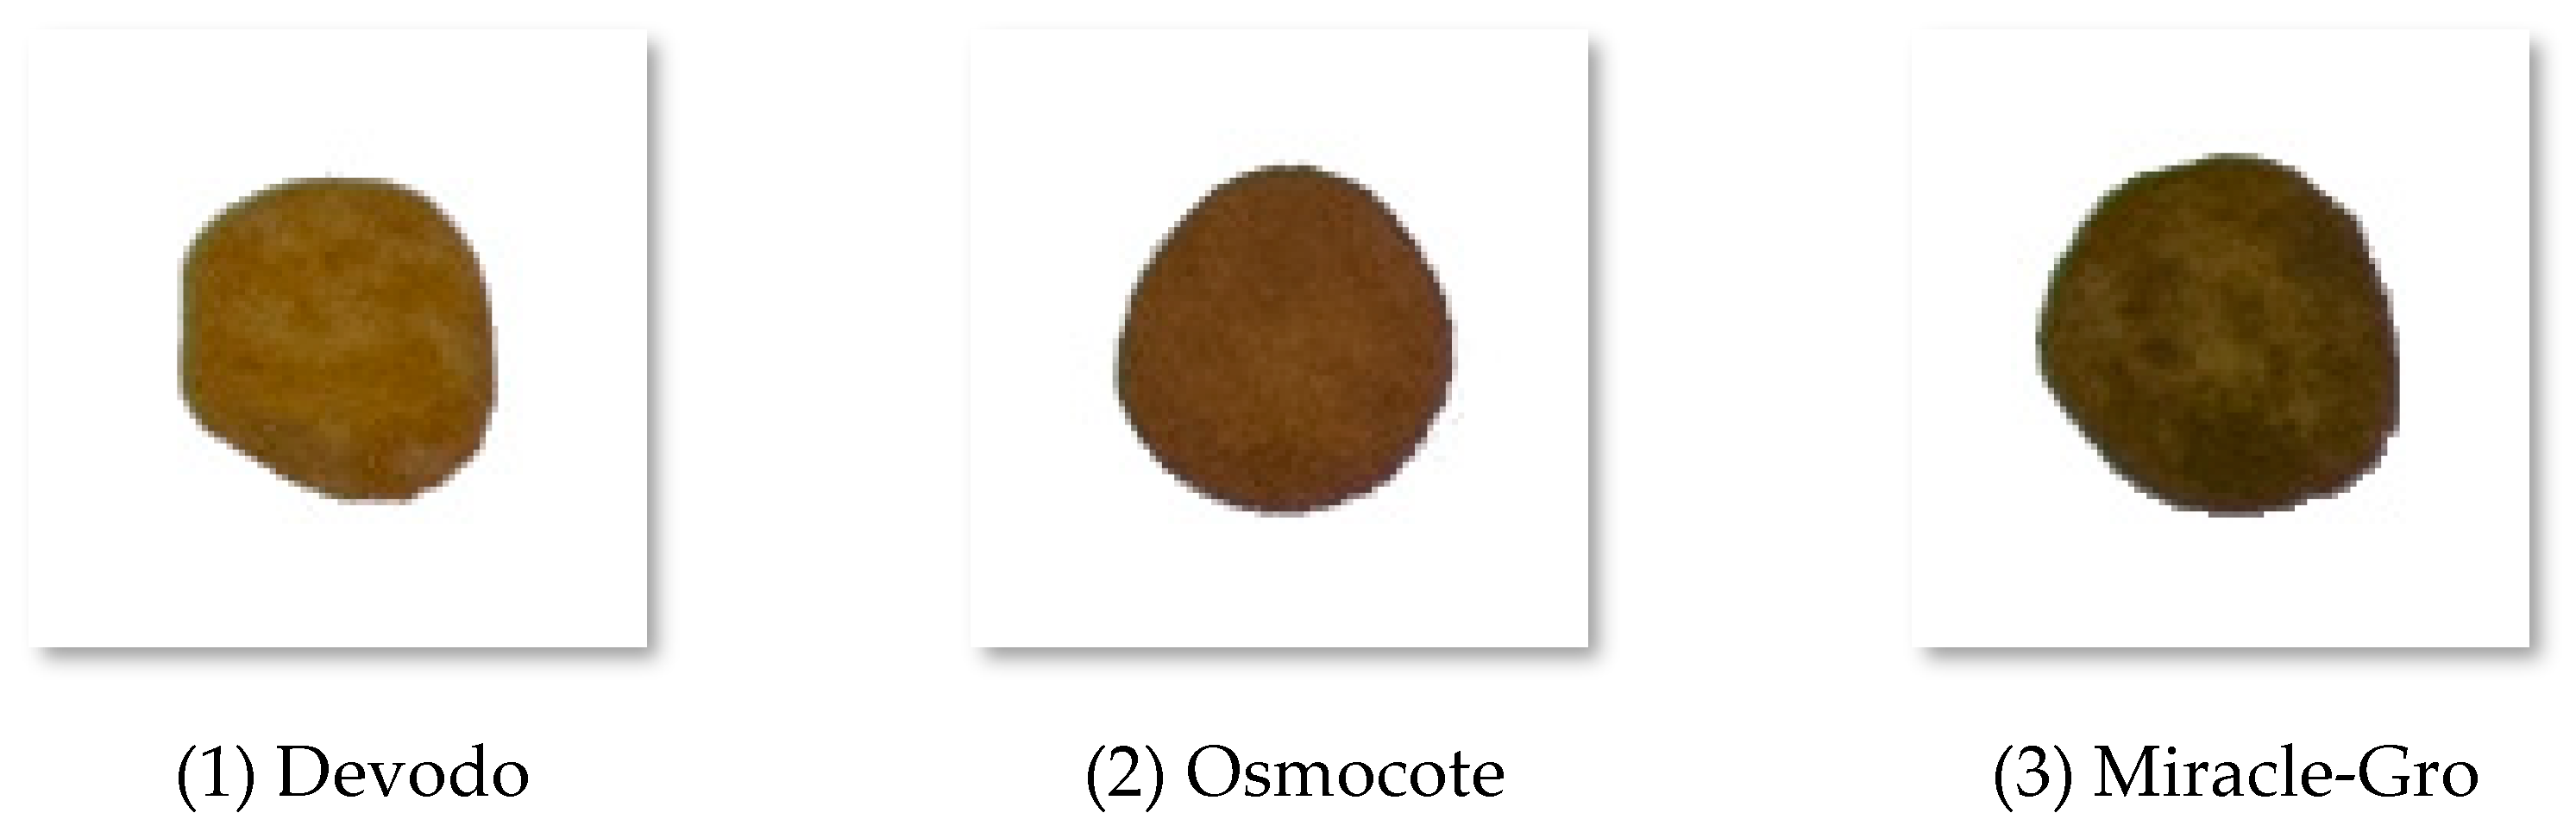
2.1. Collection of Morphological Characteristics and Crushing Force of Controlled-Release Fertilizer Granules

2.1.1. Phenotypic Characteristics

Phenotypic characteristics refer to the geometric shape and surface features of granules, primarily including attributes such as length, width, thickness, sphericity, particle size, and surface texture [24]. Sphericity, particle size, and surface texture are treated as independent attributes, in which a change in one parameter does not affect the other two. These characteristics can therefore be used as parameters in the prediction model.

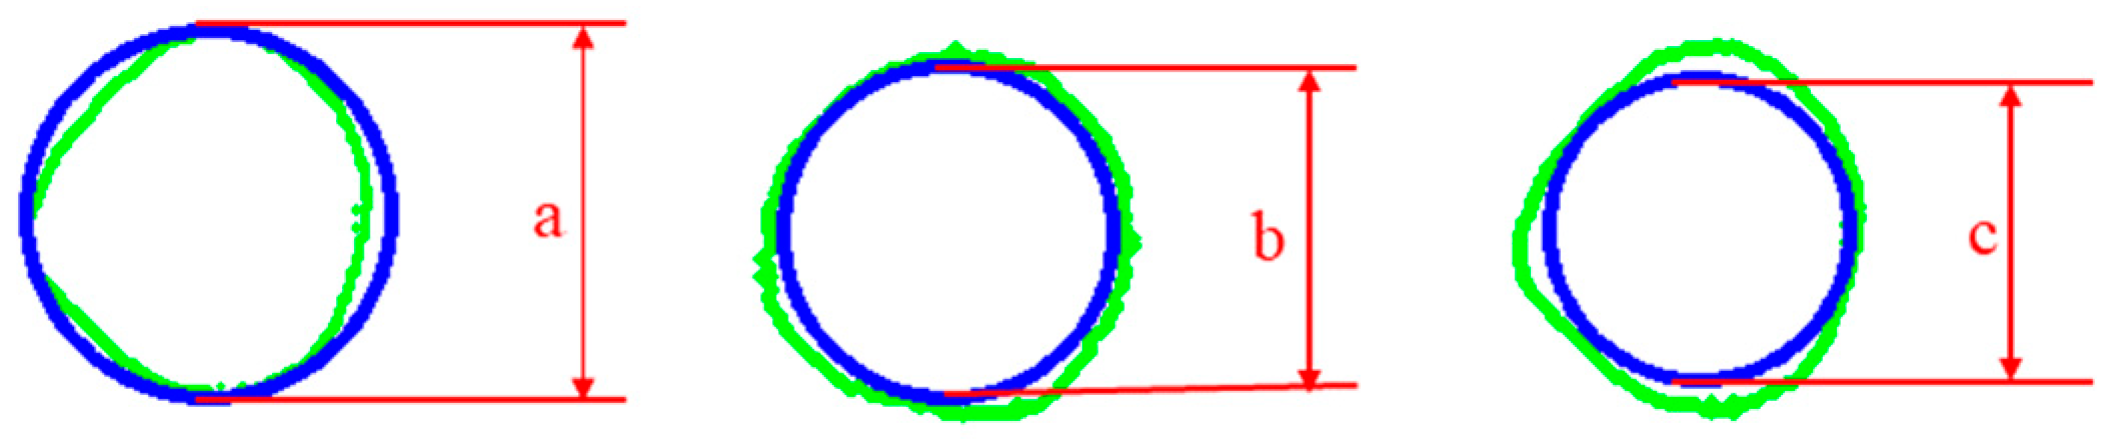
2.1.2. Triaxial Features

The macroscopic contour of a granule has been described by three mutually perpendicular axes, referred to as the long axis, intermediate axis, and short axis, which correspond to the granule’s dimensions in the length, width, and thickness directions, respectively. In a naturally stable resting state, the length (a) was defined as the maximum dimension in the plane projection, while the width (b) referred to the maximum dimension perpendicular to the length. The thickness (c) represented the longest linear distance along the direction perpendicular to both the length and width.

2.1.3. Sphericity

Sphericity represents the degree of deviation between the actual shape of a granule and that of a sphere. The sphericity φ of a granule is defined as follows [25]:
φ = v v s 3
According to the definition of granule sphericity, the granule is considered equivalent to an ellipsoid [26]. Therefore, the equivalent volume v of the granule can be expressed as follows:
v = π 6 a b c
v s = π 6 a 3
By substituting Equations (2) and (3) into Equation (1), the sphericity φ of the granule is obtained as follows:
φ = v v s 3 = π 6 a b c π 6 a 3 3 = b c a 2 3
In this equation, a, b, and c represent the length, width, and thickness of the granule, respectively.

2.1.4. Granularity

Particle size d is a parameter used to describe the size of a granule, which can represent the dimension of a single particle or the average particle size of a group of particles. For an individual spherical granule, the particle size d is defined as follows [27]:
d = 6 v π 3 = a b c 3

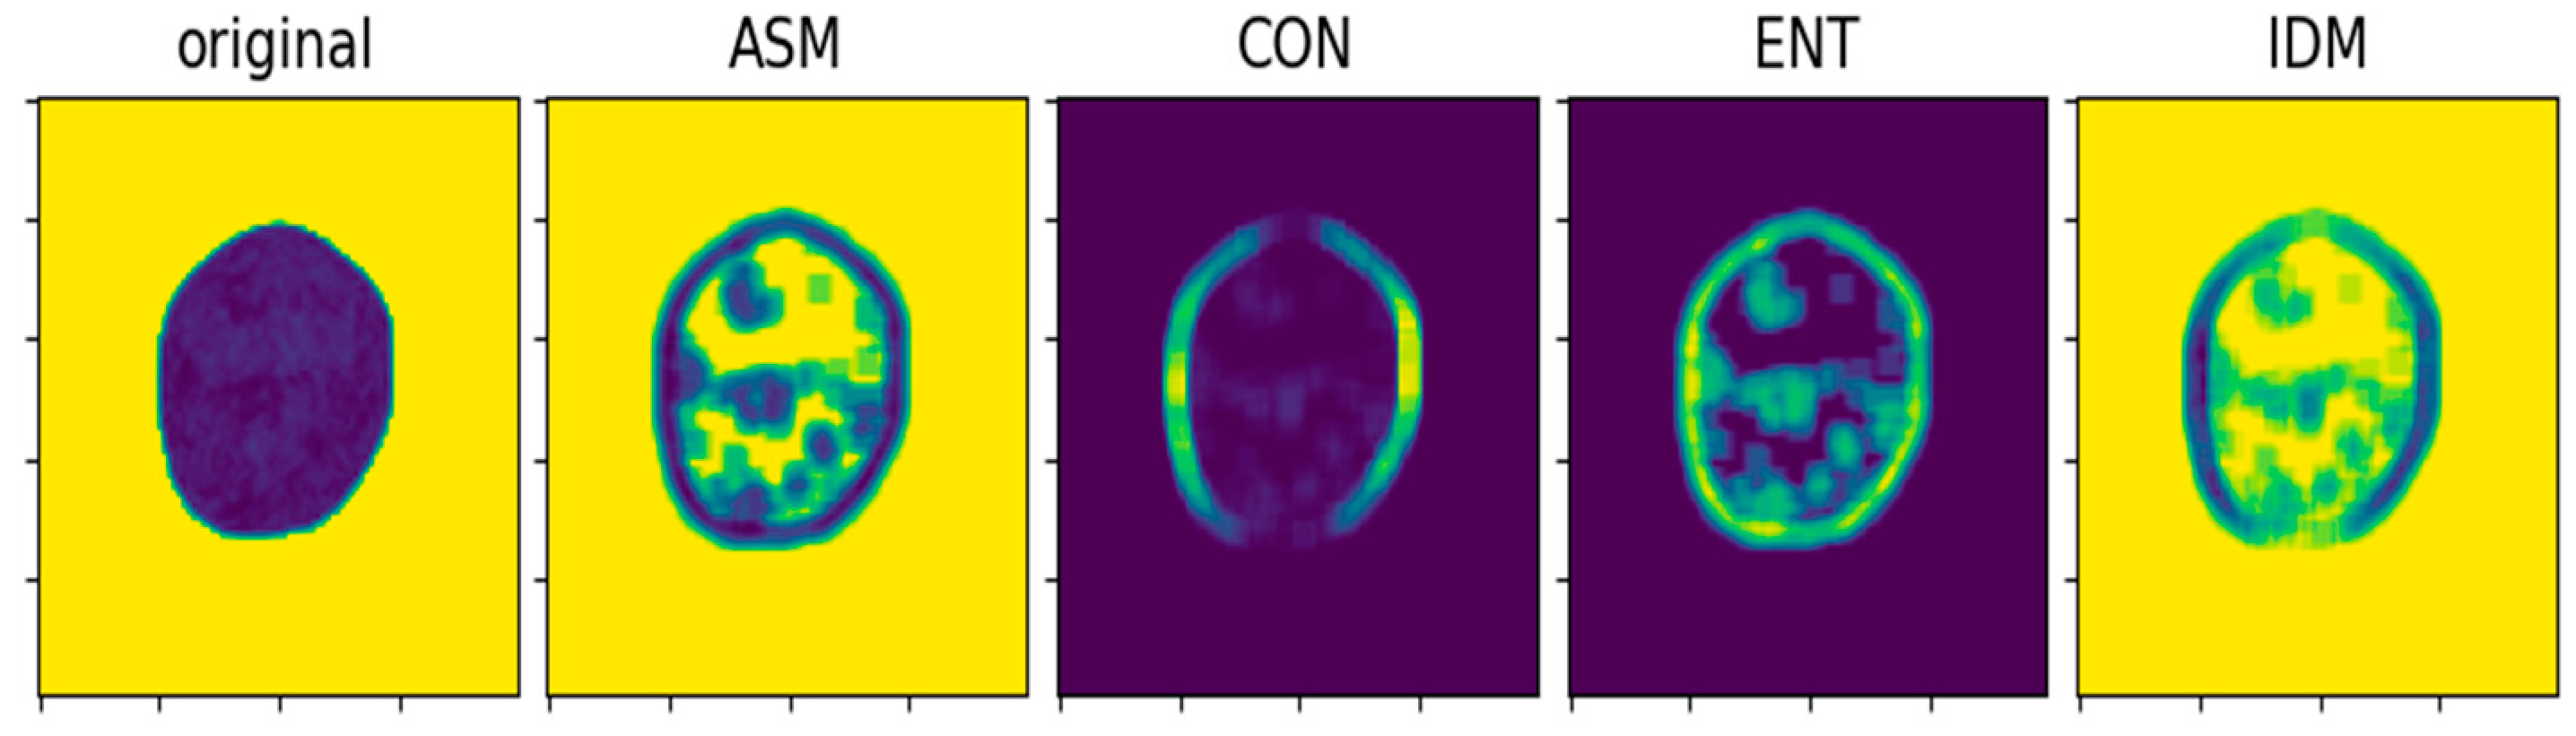
2.1.5. Texture Features

Texture features describe the structure and organization of the surface texture within an image region. The main texture features of an image region include the following: angular second moment (ASM), also known as energy, which reflects the uniformity of gray-level variations and distribution of the texture in the image. The ASM feature value is positively correlated with roughness. Contrast (CON) reflects the depth and clarity of grooves in the texture; as contrast increases, groove depth and clarity also increase. Entropy (ENT) measures the amount of information or the richness of information in the image texture; a lower entropy value indicates more ordered texture, while a higher entropy value indicates less regularity. The inverse difference moment (IDM) assesses the smoothness of the image texture; higher IDM values indicate greater smoothness and greater regularity of the texture [28].

2.2. Crushing Force

As pressure increases on granules, they undergo deformation or breakage. The response of brittle and plastic granules to force differs: brittle granules fracture once the pressure reaches a certain threshold, while plastic granules undergo compression or breakage during the application of force. Based on the force variation characteristics of different types of granules under pressure, the maximum pressure the granules can withstand is determined, and this maximum pressure is used to calculate the granule’s crushing force. The peak pressure at which controlled-release fertilizer granules are compressed to the point of fracture, with no material connection except for the outer coating, is identified as the crushing force of the controlled-release fertilizer granules. The maximum crushing force of controlled-release fertilizer granules reflects their resistance to breakage.

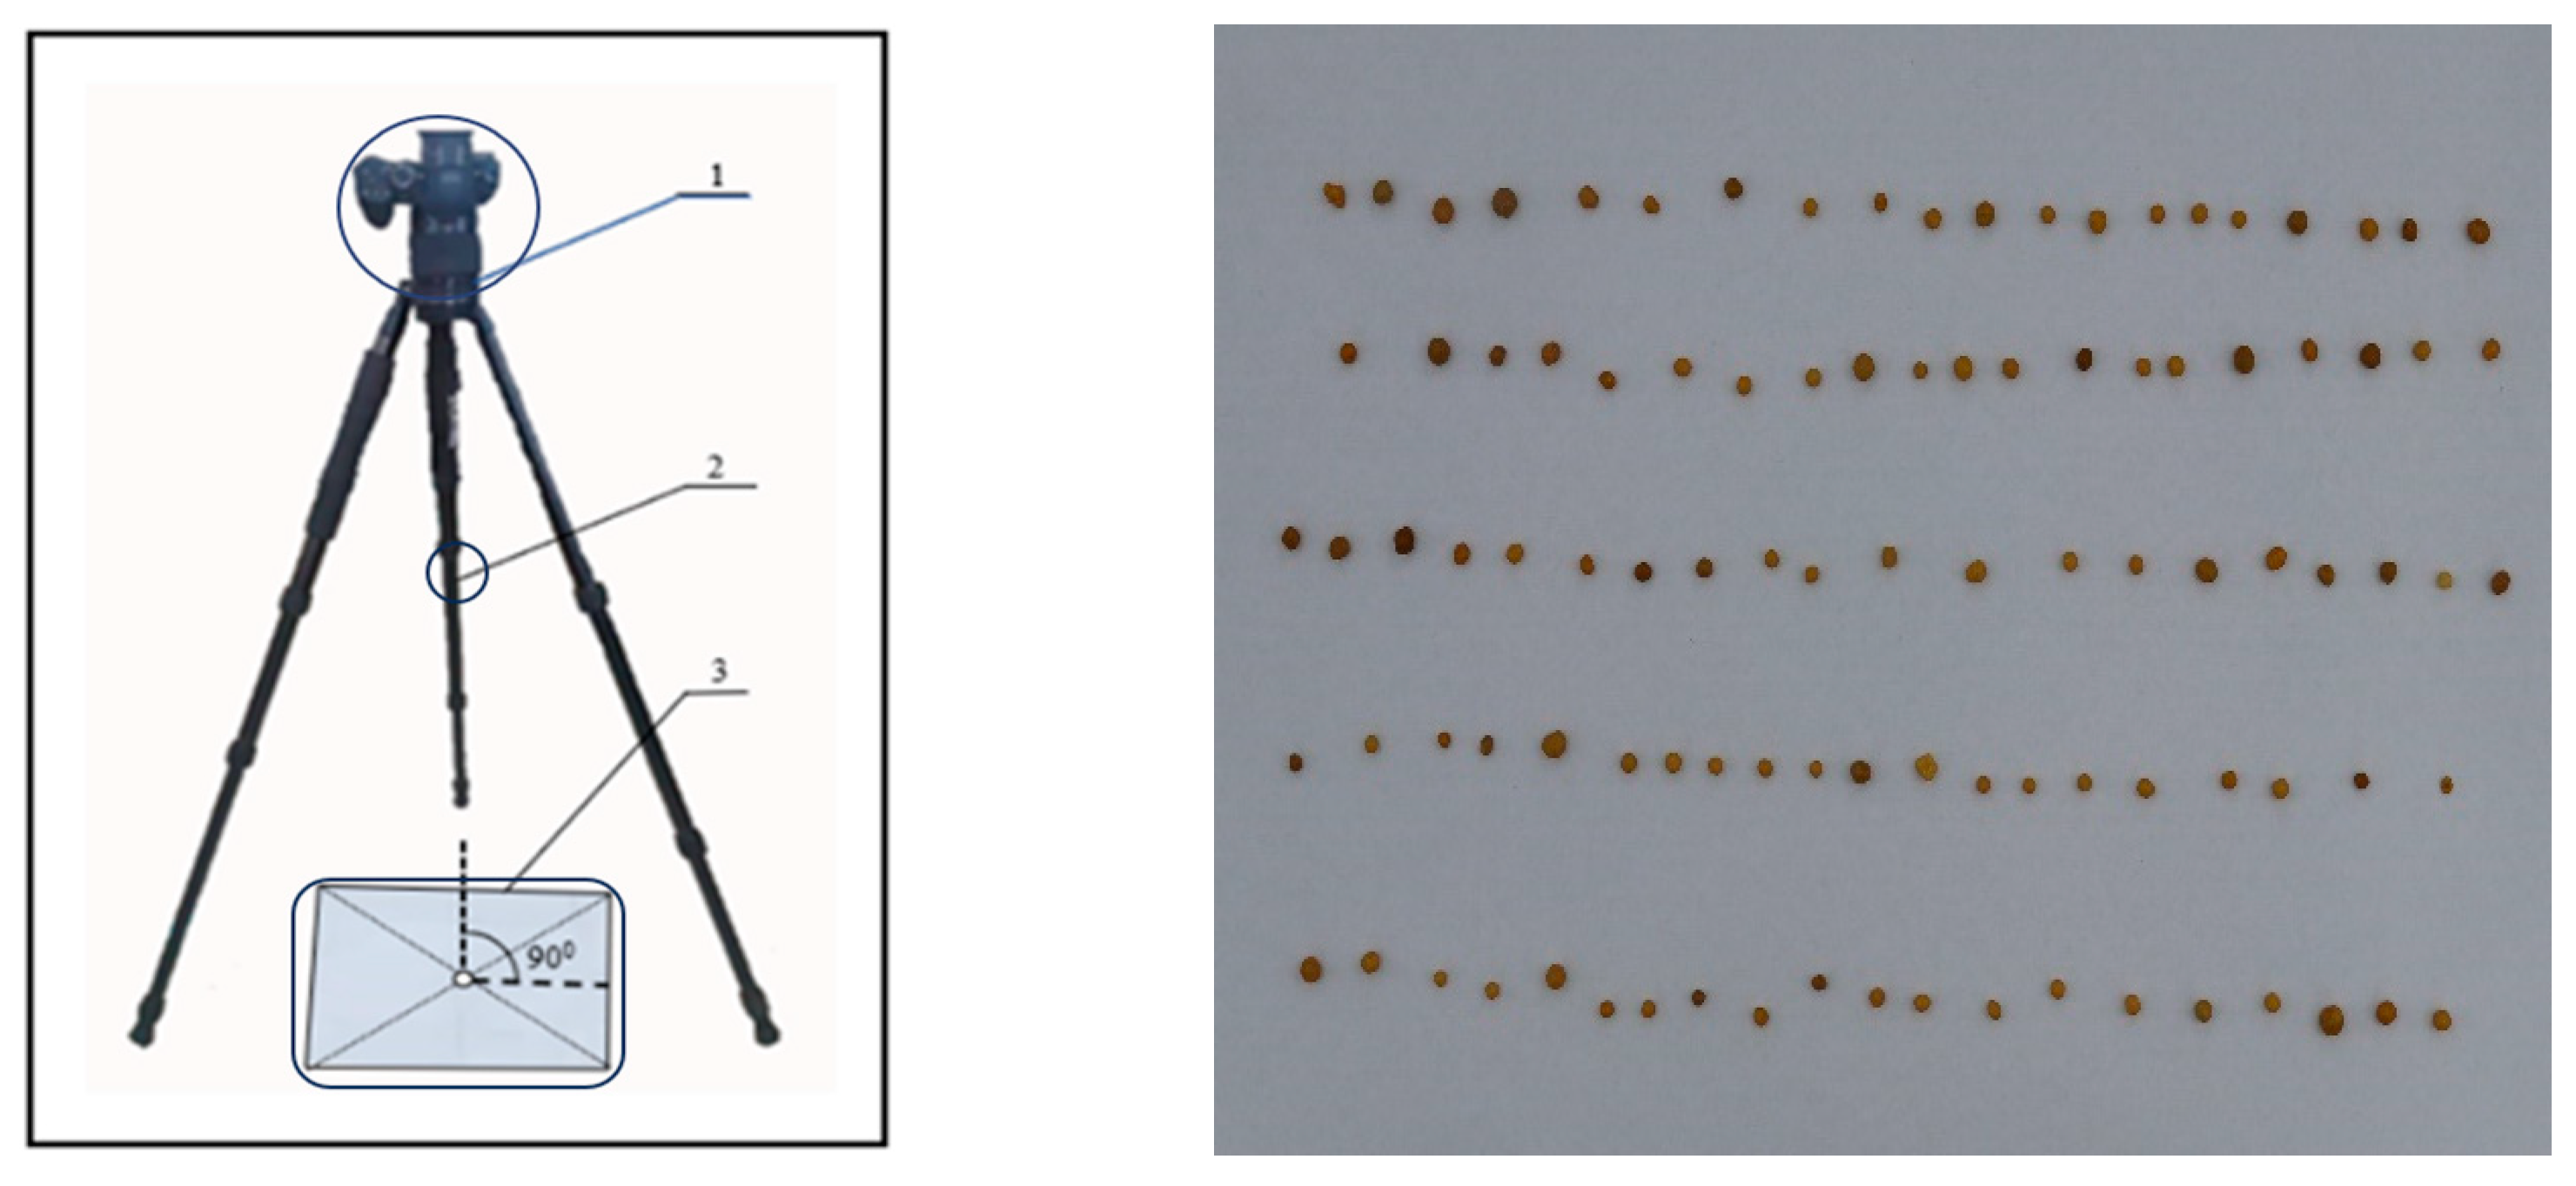
2.2.1. Image Acquisition and Pre-Processing

Three widely used types of controlled-release fertilizer were selected for prediction: Devodo controlled-release fertilizer (D) produced by Hebei Devodo Fertilizer Co., Ltd., Hebei Province, China, Osmocote No. 1 controlled-release fertilizer (A) produced by ICL Group Ltd., Tel Aviv, Israel, and Scotts Miracle-Gro controlled-release fertilizer (M) produced by Scotts Miracle-Gro., Marysville, OH, USA. The image acquisition equipment mainly included a DMC-GH4GK camera (Panasonic Corporation, Osaka, Japan) (17.2 million pixels), LUMIX zoom lens (Osaka, Japan), camera stand, and white background board. The complete setup is shown in Figure 1. The purpose of the internal parameter calibration is to determine the internal parameters of the camera, including focal length, principal point position, distortion coefficient, etc. Extrinsic calibration is used to determine the relationship between the camera and the world coordinate system, i.e., the position and orientation of the camera. For each of the three types of controlled-release fertilizer, 100 granules were randomly selected and neatly arranged on the background board. A DSLR camera was used for the first round of image capture, ensuring the controlled-release fertilizer granules remained stationary. The granules were then flipped over, and a second image was captured. This process was repeated three times for each type of controlled-release fertilizer, resulting in three images for each fertilizer type, and a total of nine images for the three controlled-release fertilizers. The controlled-release fertilizer images are shown in Figure 1.
After image acquisition, each image is cropped to 100 × 100 pixels, with each cropped image containing only a single controlled-release fertilizer granule. From each large image, 100 individual controlled-release fertilizer images are obtained. A total of 300 images are collected for each of the three types of controlled-release fertilizers, resulting in 900 individual fertilizer images. The hardware used for data processing and algorithm development consists of an Intel (R) Core (TM) i7-6700 CPU @ 3.40 GHz and 16 GB of memory, while the software used is Python 3.7. The preprocessed images of the three types of controlled-release fertilizers are shown in Figure 2.

2.2.2. Acquisition of Triaxial Features

To determine the length (a), width (b), and thickness (c) of controlled-release fertilizer granules and subsequently calculate the sphericity and granularity parameters, the three-dimensional characteristics of the granules were obtained. The specific steps were as follows: (1) Each image of a controlled-release fertilizer granule was converted to grayscale; (2) The grayscale image was preprocessed to enhance contrast and reduce noise; (3) The Canny operator was applied for edge detection; (4) Image contours were identified and extracted; (5) The parameters of the minimum enclosing circle and maximum inscribed circle were drawn and calculated based on the contours; and (6) For each granule, three images were used to obtain three datasets for comparative analysis. Since the diameter of the minimum enclosing circle represented the largest dimension in planar projection, and the diameter of the maximum inscribed circle indicated the largest dimension perpendicular to the length, the largest minimum enclosing circle diameter was considered the length (a), the largest maximum inscribed circle diameter was considered as the width (b), and the smallest maximum inscribed circle diameter was considered as the thickness (c). The obtained length, width, and thickness values were then substituted into Equations (4) and (5) to calculate sphericity and granularity. An example of a single granule’s length, width, and thickness is shown in Figure 3.

2.2.3. Acquisition of Texture Features

The surface texture characteristics of controlled-release fertilizer particles have an important impact on the physical properties of granules. The surface texture directly affects its compressive strength, and controlled-release fertilizers with smooth particle surfaces (high IDM and low CON) are usually more likely to deform or crack under the action of external forces, so their crushing force is low. Particles with rough surfaces and high levels of contrast (high CON and low ASM) may increase the contact area of the particles, enhance their friction and compressive resistance with external forces, and thus exhibit higher compressive strength. Particles with a smooth surface usually have good flowability, and particles with poor flow may be stressed unevenly during fertilization, resulting in changes in crushing force. At the same time, the texture features have a significant contribution to the prediction ability of particle crushing force, especially when dealing with uneven particle surface and complex morphology. By introducing texture features, the model can better fit complex nonlinear relationships and reduce errors due to changes in particle surface morphology. In this study, the texture features of controlled-release fertilizer were obtained using the gray-level co-occurrence matrix (GLCM) algorithm. GLCM, as a statistical tool, extracts texture features from an image by analyzing the frequency or probability of gray-level pairs of pixels occurring within the image. The GLCM method is non-invasive, making no modifications to the original image, while capturing global information of the image. It also offers multi-scale and multi-directional analysis, features a simple and efficient computational process, and provides four key texture features required in this study. These texture features include angular second moment (ASM), contrast (CON), entropy (ENT), and inverse difference moment (IDM). The specific process for obtaining these features is as follows: (1) Define the maximum gray level as 16; (2) Calculate the maximum gray level of the image; (3) Compute the gray-level co-occurrence matrix of the image; and (4) Read the image and calculate its texture feature values. An example of a feature image for a single controlled-release fertilizer granule is shown in Figure 4.

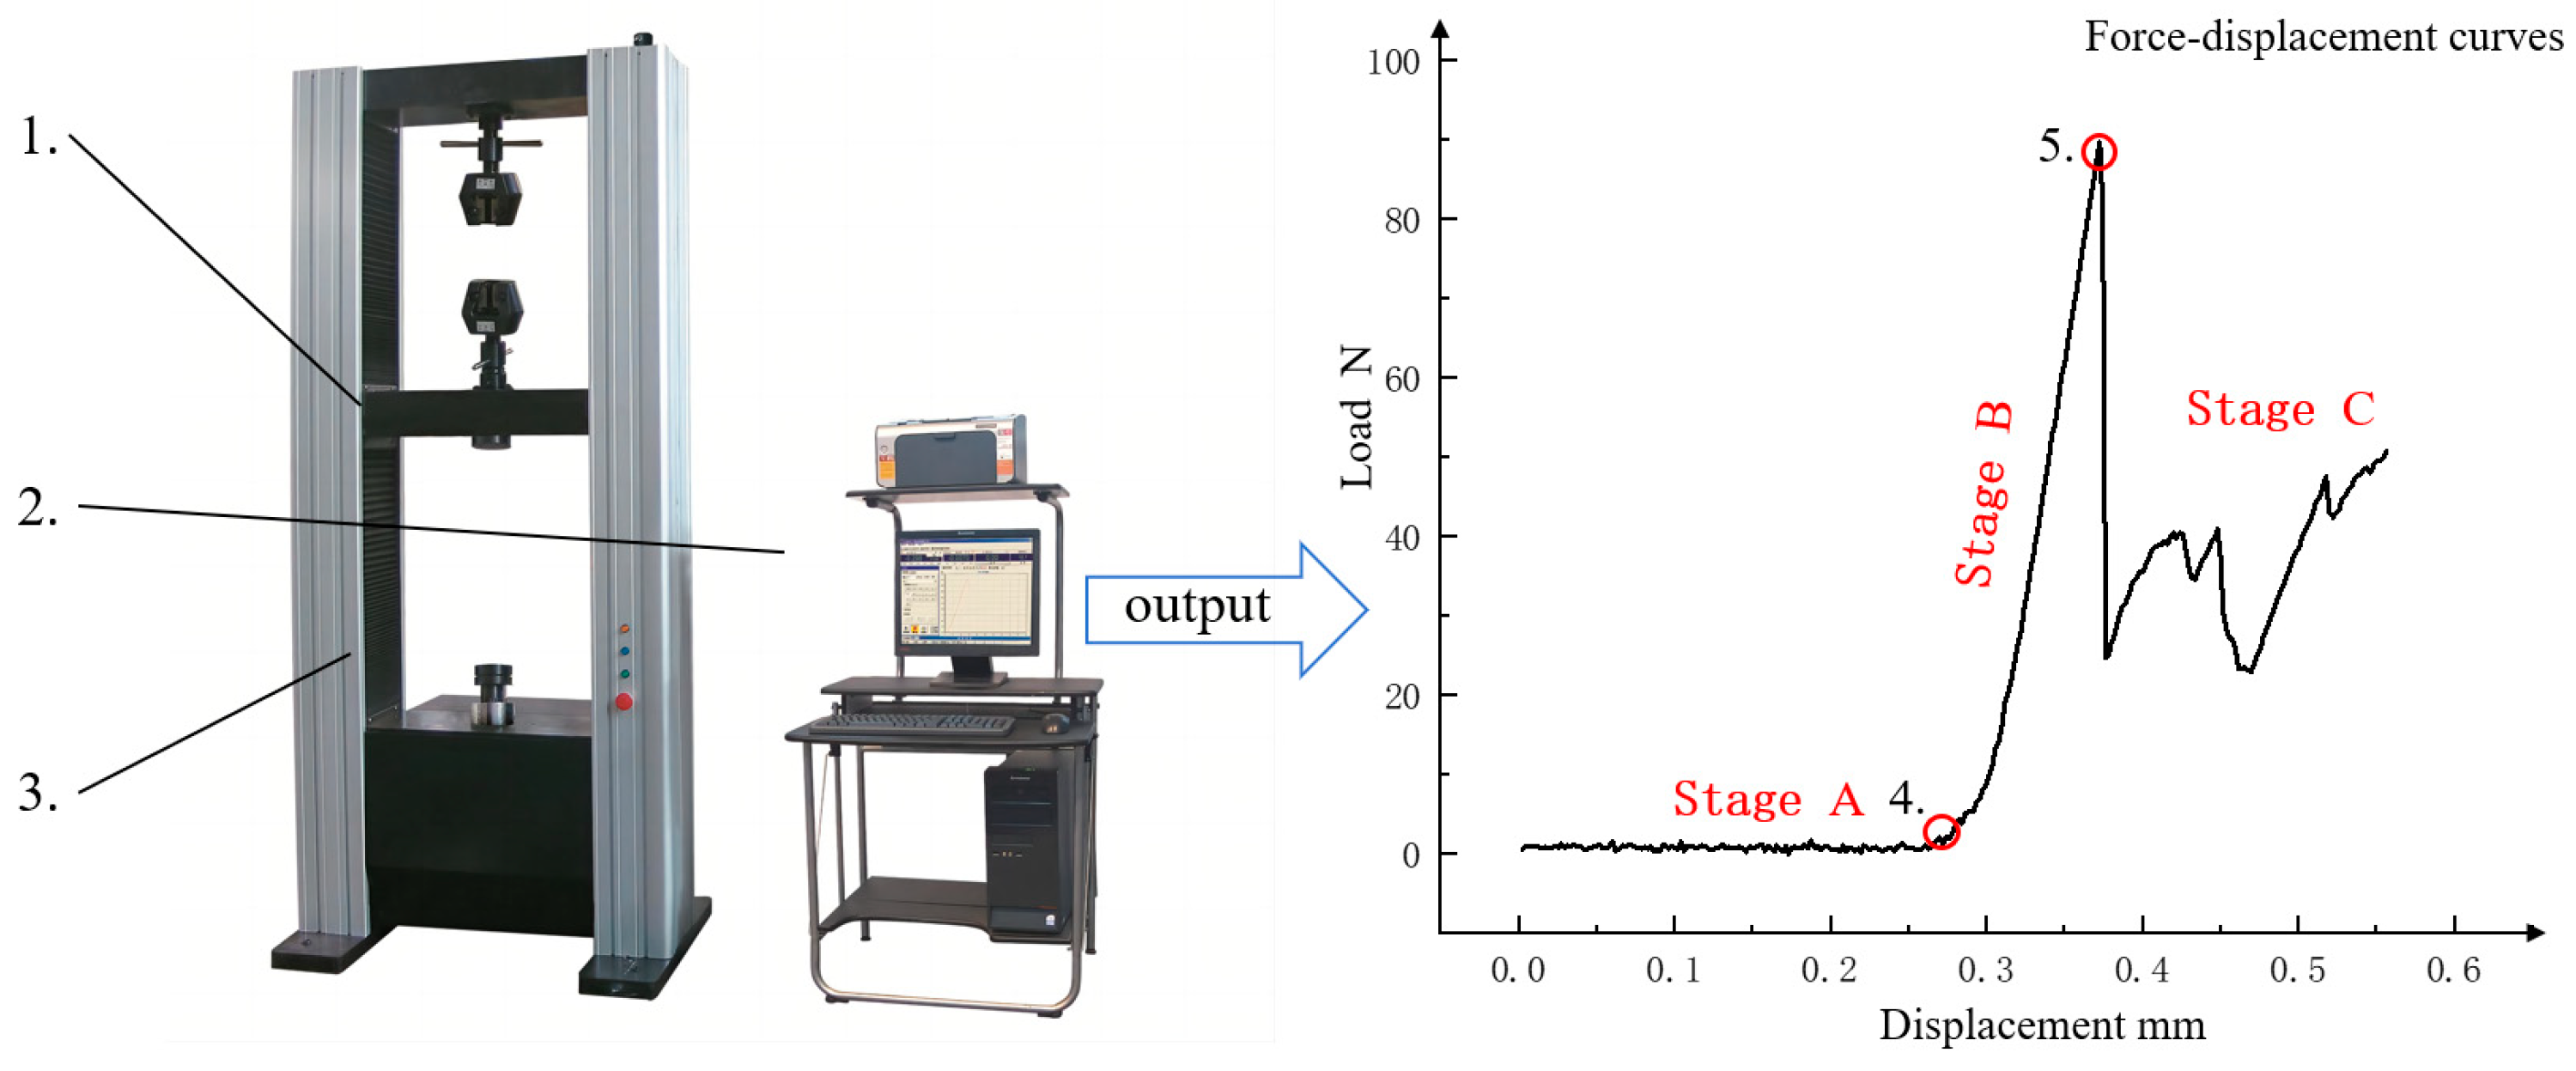
2.2.4. Acquisition of Crushing Force

A uniaxial compression test was conducted on controlled-release fertilizer granules using a microcomputer-controlled electronic universal testing machine to determine the crushing force of the granules. The granules were placed on a specimen stage lined with acid-free paper, and the feed speed was adjusted to 0.0001 m/s. The test was continued until the granules were crushed, and the “force-displacement curve” on the display showed a peak load, at which point the feed was stopped. The process of the uniaxial compression test and the output “force——displacement curve” of the controlled-release fertilizer granules are shown in Figure 5.
The uniaxial compression of controlled-release fertilizer granules can be divided into three stages. In Stage A, Compression Preparation Stage, the granules come into contact with the testing apparatus, and the loading equipment begins applying external force. Due to variations in the granules’ shape, hardness, and material properties, the initial deformation is characterized by slight compression or expansion in localized regions. This stage is brief, typically lasting only a few seconds, and involves primarily elastic deformation without cracks or permanent changes, allowing the granules to adapt to the testing apparatus. In Stage B, Overall Fracture Stage, as the load increases, the granules begin to experience plastic deformation. Internal stresses accumulate, causing cracks to form and spread outward. When the applied pressure reaches the granules’ bearing limit, these cracks propagate through the structure, resulting in complete fracture. The load curve reaches its maximum value at this point, with the compression head’s pressure stopping its increase, marking the peak load corresponding to the fracture. After the fracture, the granule fragments continue to maintain contact pressure, leading to a slight decrease in the load curve. In Stage C, Crushing Stage, the granules break into smaller fragments, which continue to interact with the testing apparatus through mechanisms like collision and sliding. This crushing process evolves gradually, with the load curve rapidly decreasing as the granules fracture further. In some cases, the load curve may temporarily increase due to the accumulation and overlap of fragments, but it will eventually stabilize as all the granules are fully crushed.

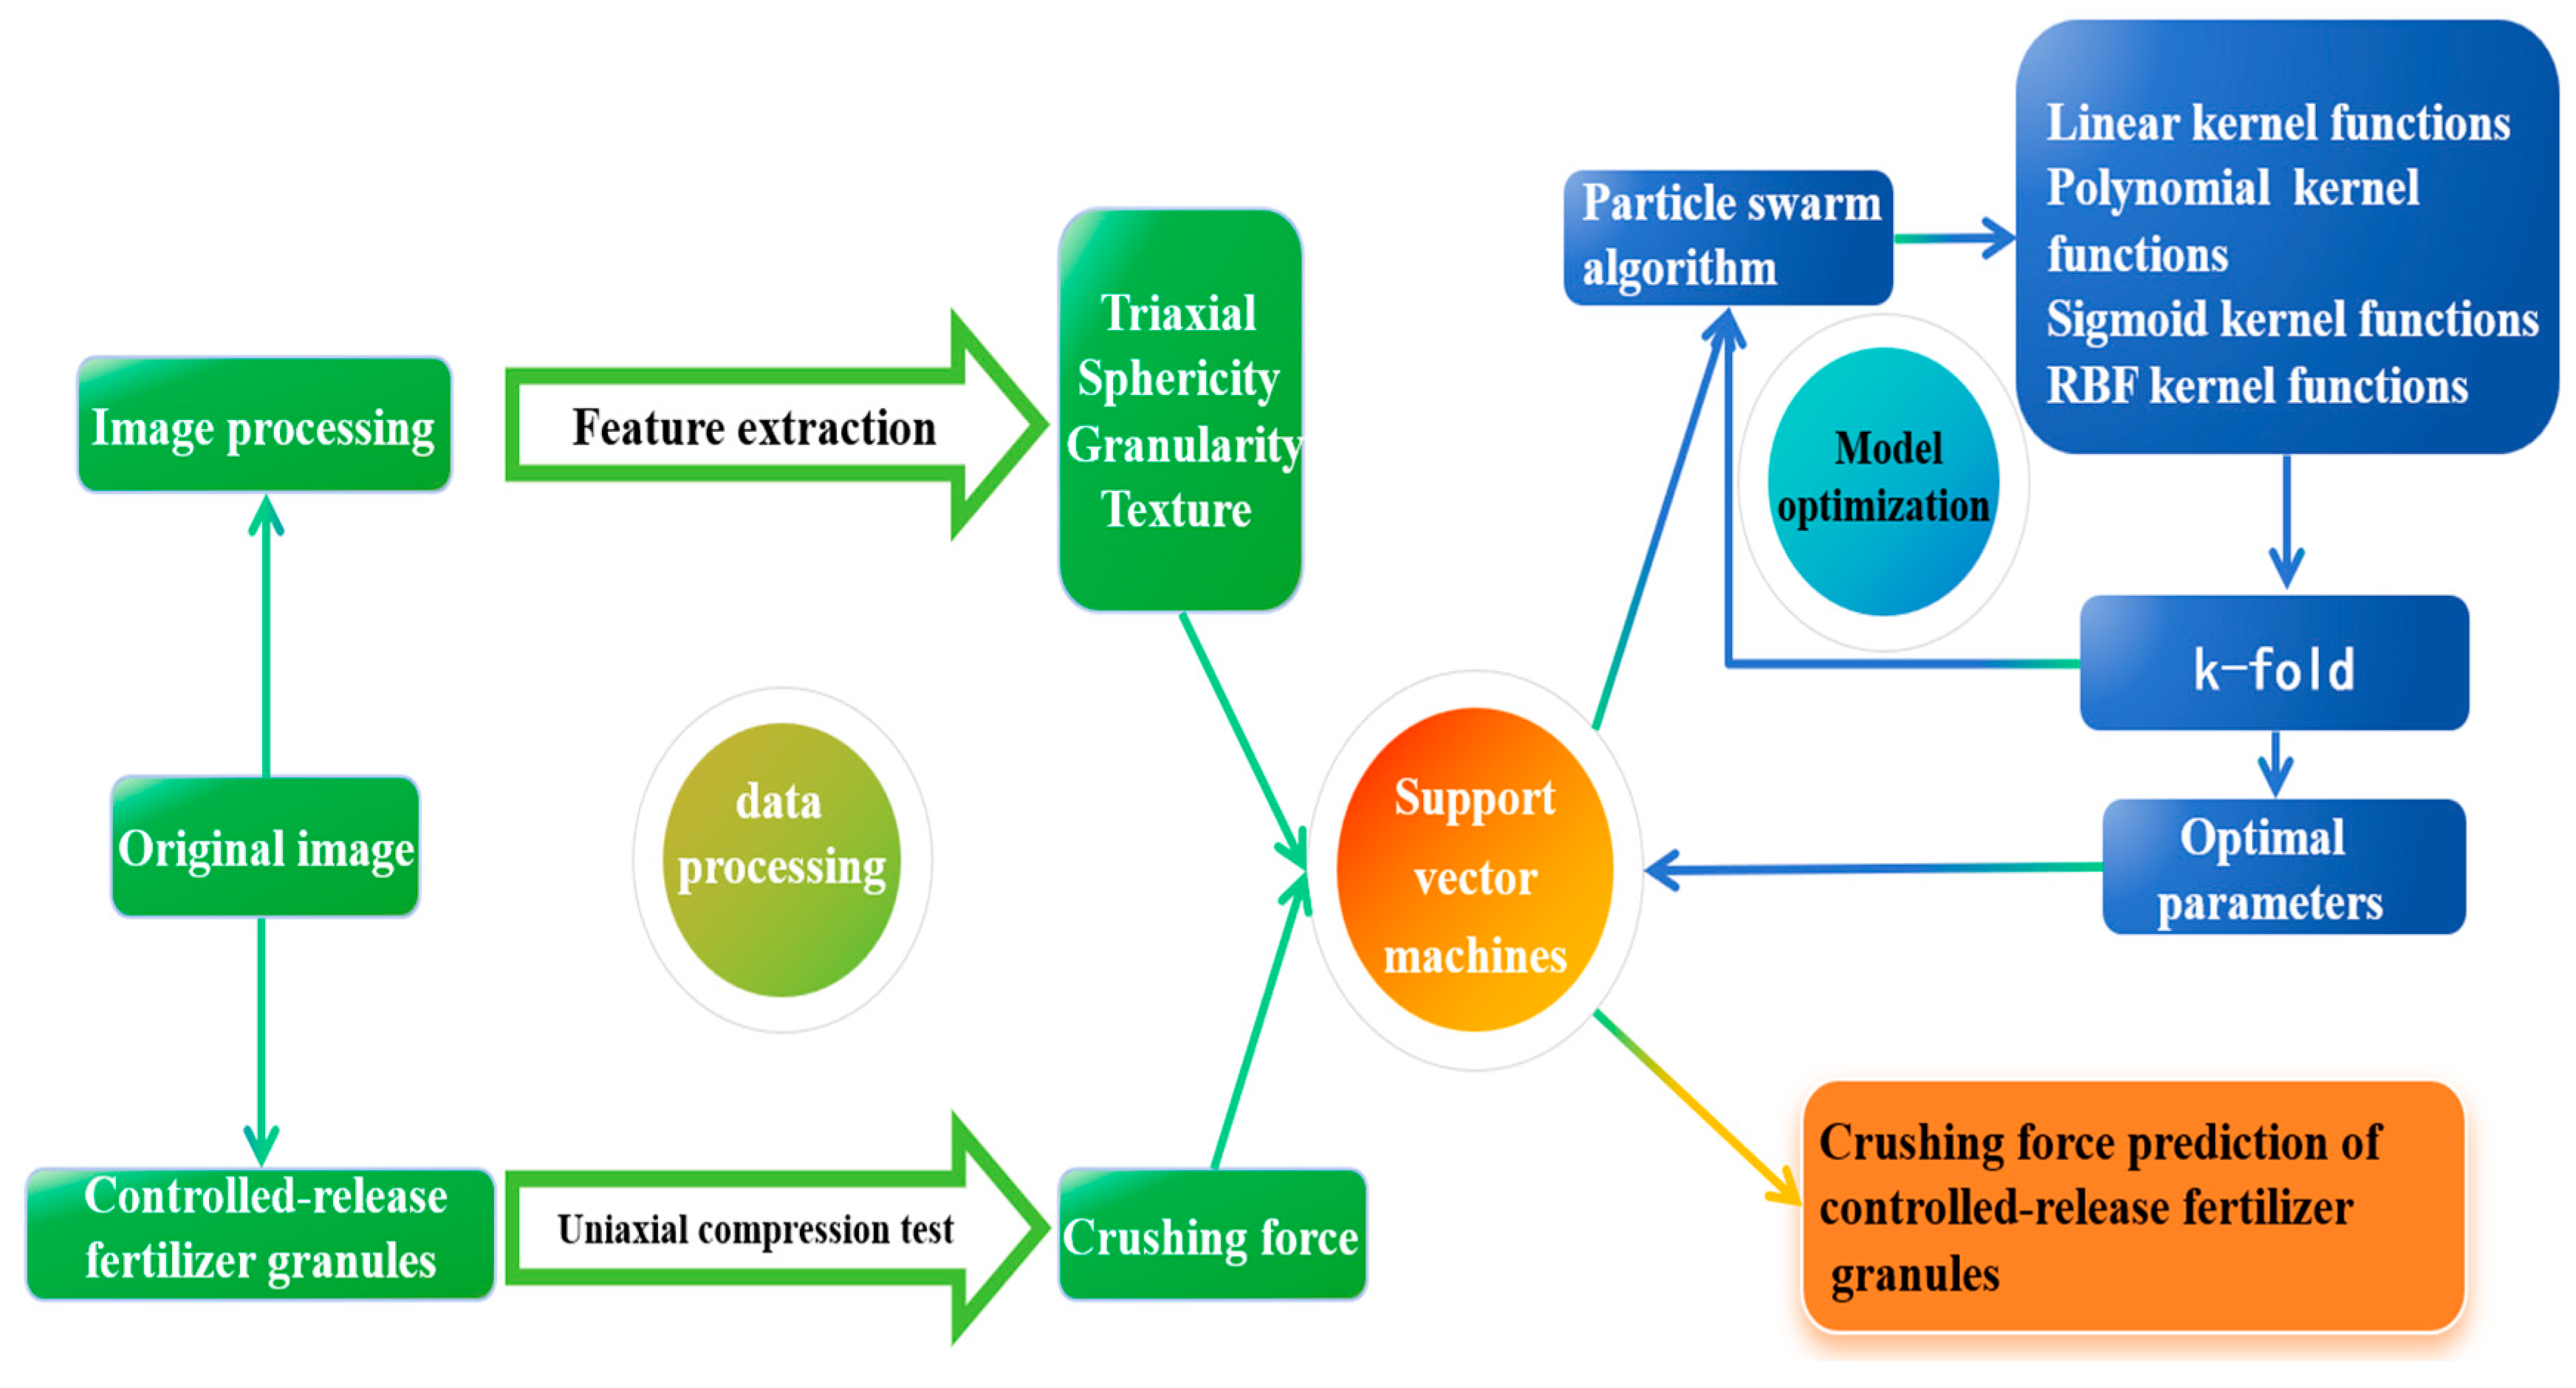
2.3. Construction of Crushing Force Prediction Model of Controlled-Release Fertilizer

The construction of the crushing force prediction model for controlled-release fertilizer granules proposed in this study comprised two main stages: data processing and model optimization. In the data processing stage, images of neatly arranged fertilizer granules were captured to obtain the raw images. These granules were labeled from the raw images and subjected to uniaxial compression tests to acquire crushing force values. After preprocessing, feature extraction was performed to obtain values for the three-axis dimensions, sphericity, granularity, and texture features. In the model optimization stage, the extracted feature values and crushing force values were used as inputs. Dimensionality reduction was carried out through principal component analysis, followed by particle swarm optimization iterations. A k-fold cross-validation function based on support vector machines was then applied to determine the optimal hyperparameters and kernel function. With these optimal parameters, the SVM model produced predicted crushing force values, thereby constructing the crushing force prediction model for controlled-release fertilizer granules. The overall process is illustrated in Figure 6 [29,30,31].

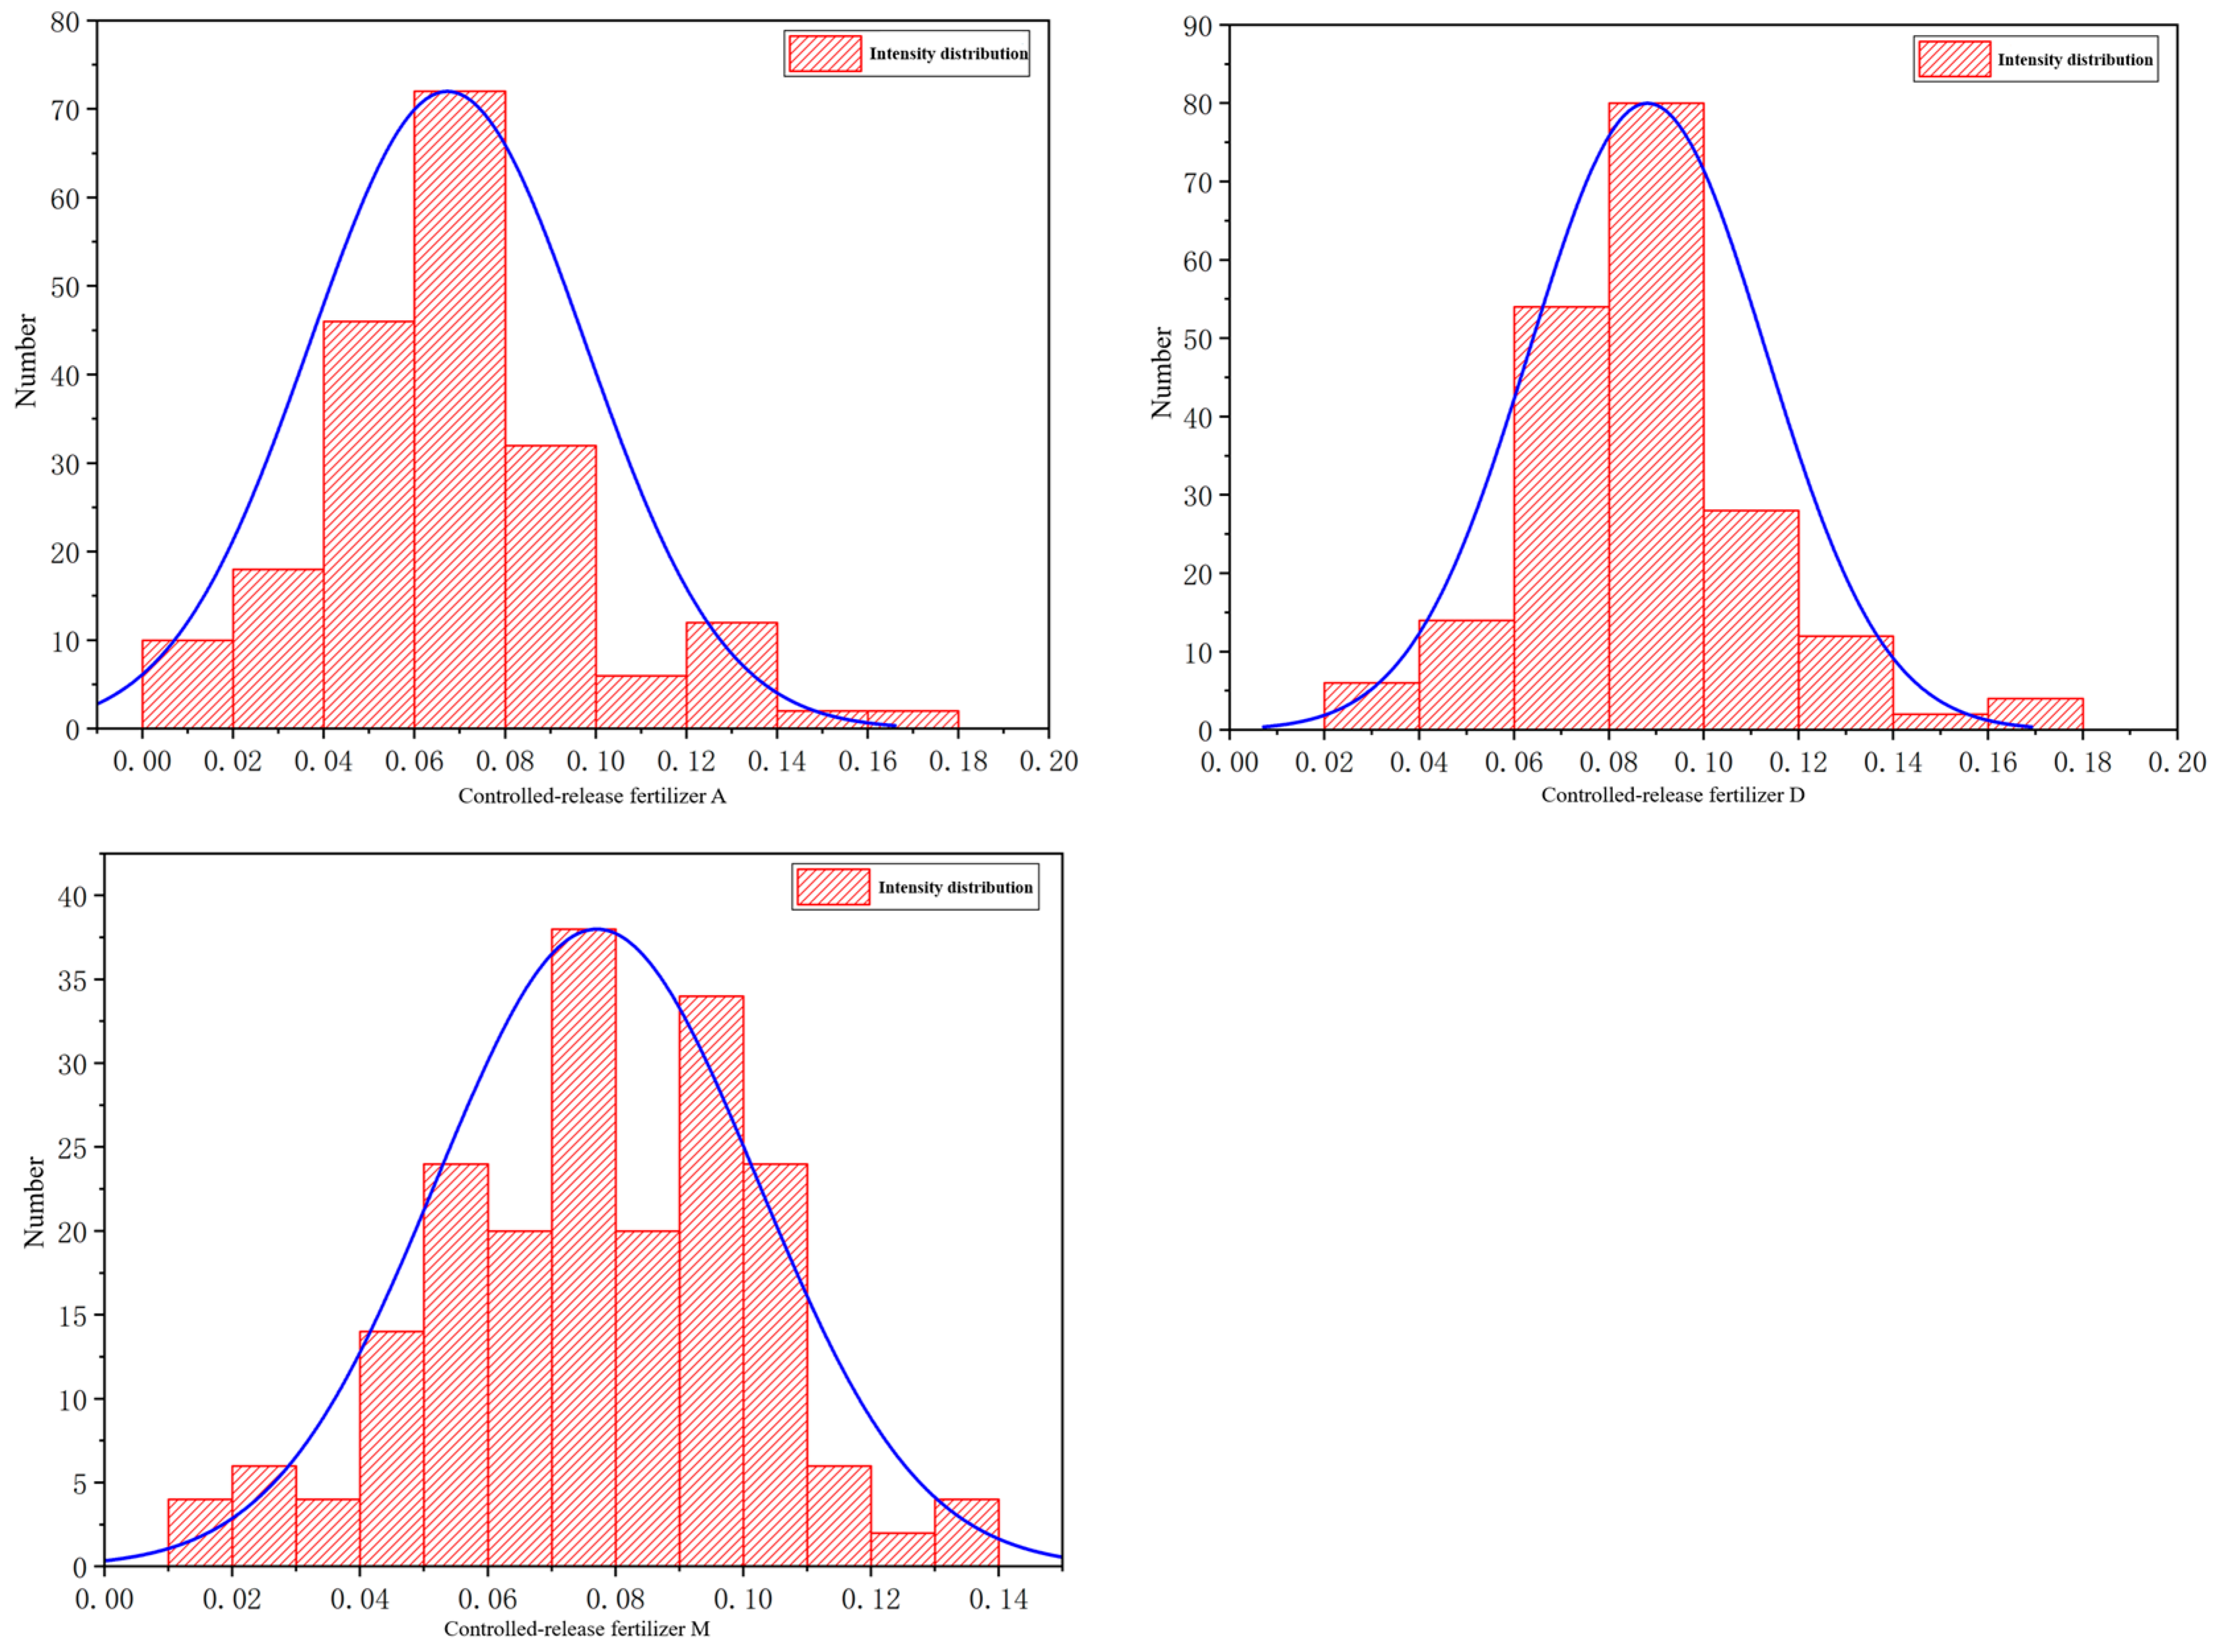
2.4. Data Processing

A total of 100 granules from each of the three types of controlled-release fertilizers were randomly sampled. After photographing them and processing the images through the computational program, the phenotypic feature parameters were obtained. Additionally, the crushing force of the granules was determined through uniaxial compression tests. The phenotypic feature values of the controlled-release fertilizers are shown in Figure 7, and the distribution of the crushing force is displayed in Figure 8.
As shown in Figure 7, the phenotypic characteristics of the controlled-release fertilizer granules are presented using box plots. The box plots display the distribution of key attributes including granule length (a), width (b), thickness (c), and granularity (d). Each box plot features distinct box bodies and whisker lines, which provide a clear visual representation of the central tendency of and variability in the data.
For granularity, the three types of controlled-release fertilizer granules exhibit distributions in the ranges of 2.554 to 4.792, 2.675 to 4.539, and 2.479 to 4.539, respectively. These ranges indicate that, although the granules differ slightly in their granularity, the distribution intervals are relatively similar across the three types, suggesting comparable texture characteristics. The granularity feature is important as it influences the release rate and mechanical properties of the granules.
The texture feature values, including ASM (angular second moment), CON (contrast), and ENG (energy), also show well-defined box bodies and whisker lines. ENG has the largest range of values, reflecting a higher degree of variation in the energy distribution within the granules’ surfaces. This suggests that energy features may contribute to distinguishing granules with varying surface roughness values or structures. CON, which measures the contrast in the image, follows with a moderately wide distribution, whereas ASM, representing homogeneity, exhibits the smallest range, indicating relatively uniform texture characteristics in the granules. These features collectively offer insight into the surface texture, which plays a significant role in the release profile and durability of the granules.
In contrast, the feature values of sphericity and IDM (inverse difference moment) show very small box bodies and narrow whisker lines, indicating that the data distributions for these attributes are highly concentrated. The low variability in sphericity and IDM suggests that these features do not significantly vary across the granules in the dataset, making them less informative for distinguishing between different granules. Consequently, these features were considered unsuitable as predictive input variables and were removed from further analysis.
The remaining texture and dimensional features exhibit more dispersed distributions, suggesting a wider range of variation and, therefore, more potential for use as input variables for prediction. These features, such as granule length, width, thickness, granularity, ASM, CON, and ENG, show sufficient variability to capture meaningful patterns in the data, making them suitable for building a predictive model. The presence of these features with varying degrees of dispersion indicates that they could contribute significantly to improving the model’s performance by providing a broader range of information regarding the physical and texture properties of the granules.
As illustrated in Figure 8, the crushing force distributions for the different types of controlled-release fertilizers follow a normal distribution curve, indicating a symmetric distribution around the mean value for each fertilizer type. This normality in the data is beneficial as it suggests that the crushing force of the granules exhibits consistent behavior and can be reliably modeled using statistical techniques.
For fertilizer A, the crushing force values range from 0.013 to 0.169 kN, reflecting the highest variability in crushing force among the three types of fertilizers. The relatively wide range indicates that fertilizer A has a diverse set of granules with varying degrees of mechanical strength, which may be influenced by factors such as granule size, composition, and surface texture. This variability makes fertilizer A suitable for predicting the mechanical performance of the granules under compressive stress, as it offers a broad spectrum of crushing force values.
In comparison, fertilizer D has a crushing force range between 0.036 and 0.087 kN, which is narrower than that of fertilizer A. This suggests that the granules of fertilizer D exhibit less variation in their crushing force, potentially indicating more uniformity in their material properties or manufacturing process. Although the range is smaller, the data still show a clear, bell-shaped normal distribution, making fertilizer D a suitable candidate for prediction, particularly when uniformity in crushing force is desired in applications in which consistency is critical.
For fertilizer M, the crushing force range is between 0.014 and 0.078 kN, which is the smallest range of the three fertilizers. Despite the narrower range, the crushing force distribution for fertilizer M still follows a normal distribution curve, indicating that the granules exhibit consistent mechanical behavior. The lower range may reflect a more homogeneous material or a different processing technique that results in less variation in the granules’ resistance to compression. The distribution of the crushing forces for the three types of controlled-release fertilizers is dispersed, making them suitable as predictive output values. To verify the measurement accuracy, the experimental data were statistically analyzed. The mean, range, and standard deviation of the phenotypic feature values and crushing force values, which serve as predictive input and output values for each type of controlled-release fertilizer, were calculated. The results are shown in Table 1.
To avoid the impact of outliers caused by measurement errors on the prediction performance, Grubbs’ test was used to detect outliers in the raw parameters of the controlled-release fertilizer. First, the mean (mean) and standard deviation (std) of the dataset were calculated. Next, the Grubbs’ statistic (Gi) and the maximum value of the statistic (GMax) were computed. Finally, the maximum statistic value was compared with the critical value (GPn) from the Grubbs’ test table. If GMax exceeds GPn, the corresponding data point (xi) is considered an outlier and must be discarded; otherwise, it is retained. The GMax calculation results for each parameter of the three types of controlled-release fertilizers are shown in Table 2. The equation for calculating the Grubbs’ statistic Gi is as follows. In the equation, N is the sample size.
G i = x ¯ x i S i = 1 , 2 , , N
By referring to the Grubbs’ test table, with a significance level of α = 0.05 and a sample size of n = 100, the critical value GPn was found to be 3.207. As shown in Table 2, the GMax values for all parameters of the controlled-release fertilizer are smaller than GPn, indicating that there are no outliers among the parameters. Therefore, the data are valid and can be used to create the dataset.

2.5. Prediction Model Based on Support Vector Machine Regression

Due to the nonlinear relationship between the morphological characteristics and mechanical strength of controlled-release fertilizer, combined with a limited sample size, a support vector machine was selected to develop a predictive model for the relationship between fertilizer morphology and crushing strength. For regression problems, the support vector machine uses feature mapping and optimization methods to construct a function in a high-dimensional feature space that approximates the target function, thereby establishing the optimal boundary and maximizing the margin between boundaries. In extracting the texture features of controlled-release fertilizer, a dataset S comprising n samples, S = {(xi, yi), i = 1, 2, 3…, n}, was constructed by combining the input variables xi (morphological characteristics) and output variable yi (fertilizer crushing strength) for each experiment. The linear hyperplane expression for yi is given by the following:
F y x = ω T x i + b
where ω T is the weight vector, and b is the bias term. The distance to the hyperplane x i is expressed as follows:
ω T x i + b ω
Support vectors are scaled by ω and b, ensuring ω T x i + b 1 vectors closest to the hyperplane have a distance of 1 ω . This maximizes 1 ω by minimizing 1 2 ω 2 . To enhance the predictive accuracy of the SVM, a penalty factor C > 0 and a positive slack variable ξ i are introduced. The optimization formulation is as follows:
min 1 2 ω 2 + C i = 1 n ξ i s . t . y i ω T x i + b 1 ξ i       ξ i 0
By introducing Lagrange multipliers αi, αj, and the Lagrangian function, the problem is transformed into its dual form, and the SVM regression function is obtained, expressed as follows:
F y x = i = 1 n α i α j K x i , x j + b j = 1 , 2 , 3 , , n
where K x i , x j is the kernel function.

2.6. Predictive Model Optimization

2.6.1. Particle Swarm Algorithm

Particle swarm optimization works by simulating the position and velocity of particles. Initially, each particle is assigned a random position and velocity. Then, based on the evaluation criterion of the current position of each particle, the individual best value (pbest) and the global best value (gbest) for the entire swarm are determined. Subsequently, the velocity and position of each particle are updated using the following eqs, iterating continuously until the stopping condition is met. The position of the i-th particle is denoted as pbesti, and the velocity update equation for each particle is as follows:
v i t + 1 = w v i t + c 1 r 1 p b e s t i t x i t + c 2 r 2 g b e s t x i t
The position update equation is given by the following:
x i t + 1 = x i t + v i t + 1
where v t is the velocity vector of the particle at time t, x t is the position vector of the particle at time t, and ω , c1, and c2 are weight parameters, while r1 and r2 are random numbers between 0 and 1.

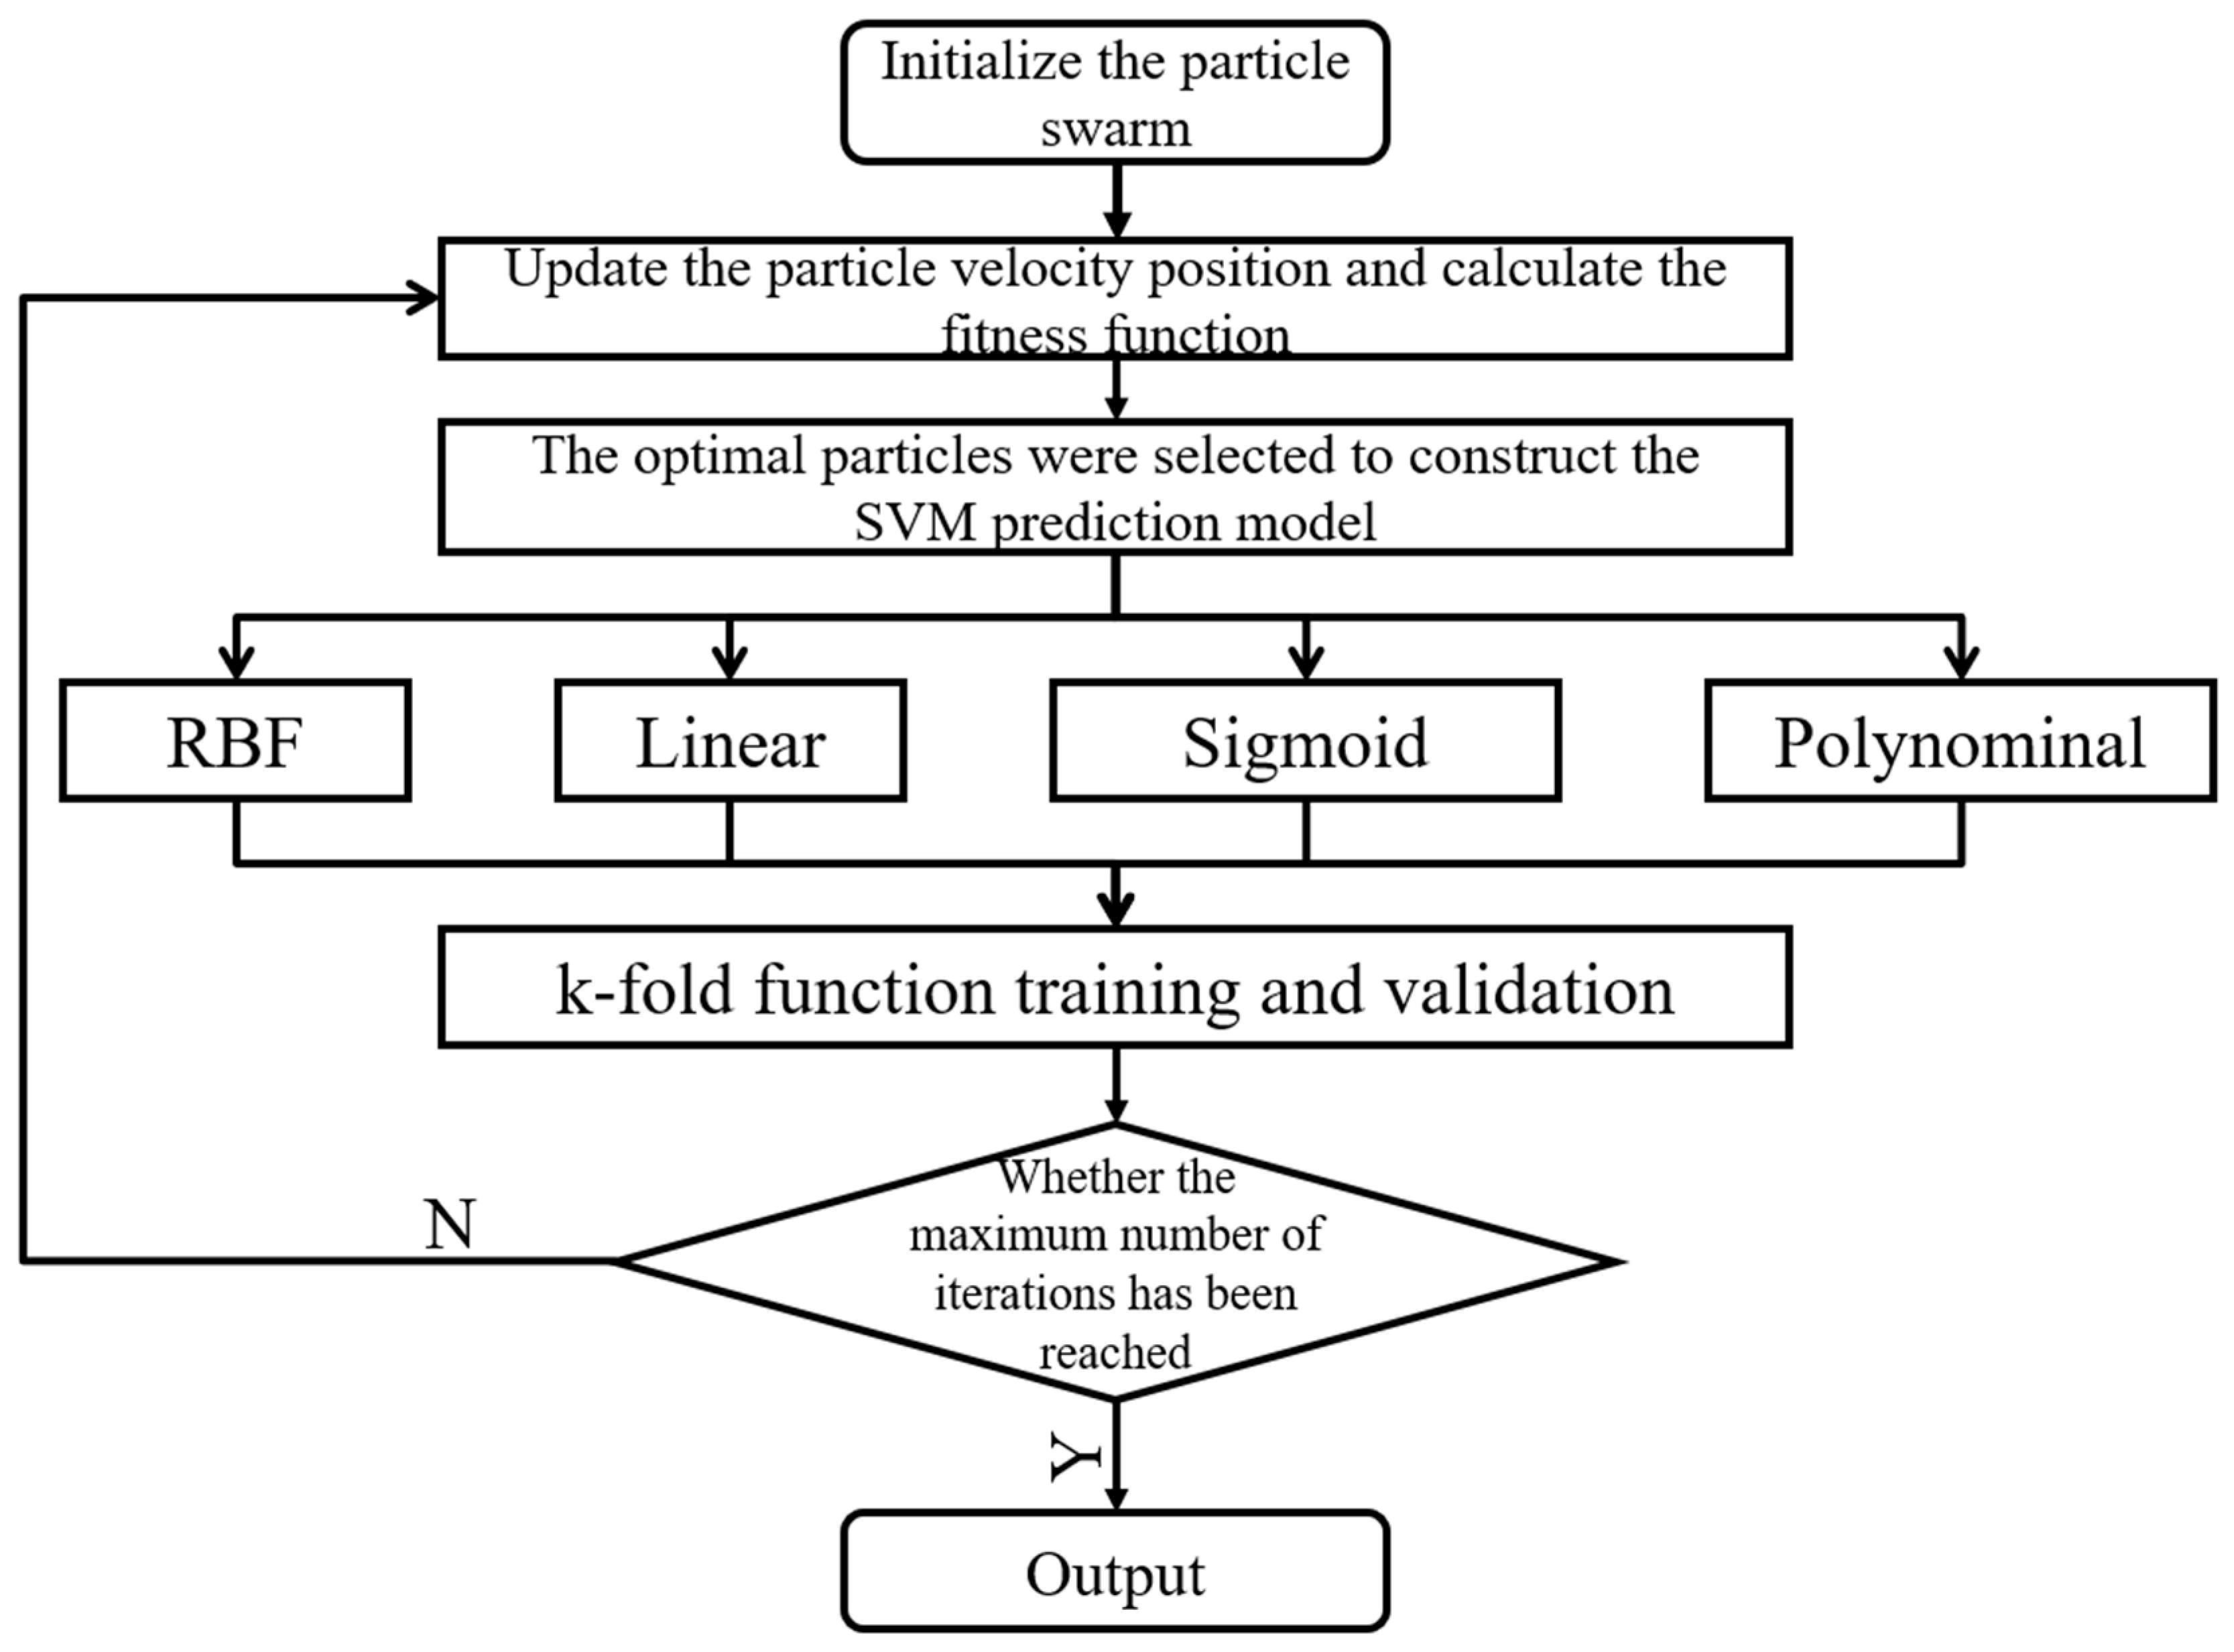
2.6.2. SVM Parameter Optimization Method Based on Particle Swarm Optimization Algorithm and K-Fold Function

The PSO algorithm tends to exhibit slow convergence and can easily fall into local optima. To address this, combining PSO with a k-fold cross-validation function enabled multiple rounds of training and validation, which more effectively utilized the data and reduced overfitting, resulting in more accurate model evaluation.
The predictive performance of SVM has been determined by the penalty parameter C, the kernel function parameter gamma, and the kernel function. The penalty parameter C controls the penalty for margin violations; the kernel function parameter gamma influences the decision boundary’s curvature in the Gaussian radial basis function and Sigmoid kernel functions; and the kernel function maps data from a low-dimensional feature space to a high-dimensional space through nonlinear transformation. Different kernel functions are suited to varying data characteristics. Thus, PSO combined with k-fold cross-validation was proposed to optimize SVM parameters. The optimization process is illustrated in Figure 9.
The detailed steps were as follows: (1) The dataset was standardized; (2) Initial parameters for PSO were set, with 100 iterations and 10 particles. The penalty parameter C ranged from 0.001 to 100, and the kernel function parameter gamma ranged from 0.001 to 100; (3) Initialize the particle swarm with random parameter values within the specified search range and calculate each particle’s fitness based on the k-fold function (k = 10); (4) The velocity and position of the particles were updated according to the PSO algorithm, with tracking of the global best fitness and particle; (5) When a particle’s fitness was found to be better than the global best fitness, the global best fitness and particle were updated, and different kernel functions were fitted accordingly; and (6) The process was terminated upon reaching the maximum number of iterations, yielding the optimal penalty parameter C, the optimal kernel function, and the optimal kernel parameter gamma.

2.6.3. Predict Performance Evaluation Indicators

To evaluate the predictive performance of the model, three metrics are selected: mean absolute error (MAE), root mean square error (RMSE), and the coefficient of determination (R2). MAE calculates the average absolute difference between the predicted values and the actual values, representing the average magnitude of deviation between them, which has a clear physical meaning.
RMSE measures the average squared difference between the predicted values and the actual values, and by taking the square root of the result, it converts this difference into the same units as the original data.
R2 measures the goodness of fit of the model to the observed data. Its value ranges from 0 to 1, with values closer to 1 indicating a better fit of the model to the data.

3. Results

This section is divided into subsections. It provides a concise and precise description of the experimental results, their interpretation, as well as the experimental conclusions that can be drawn from the validation and analysis of a controlled-release fertilizer crushing force prediction model.

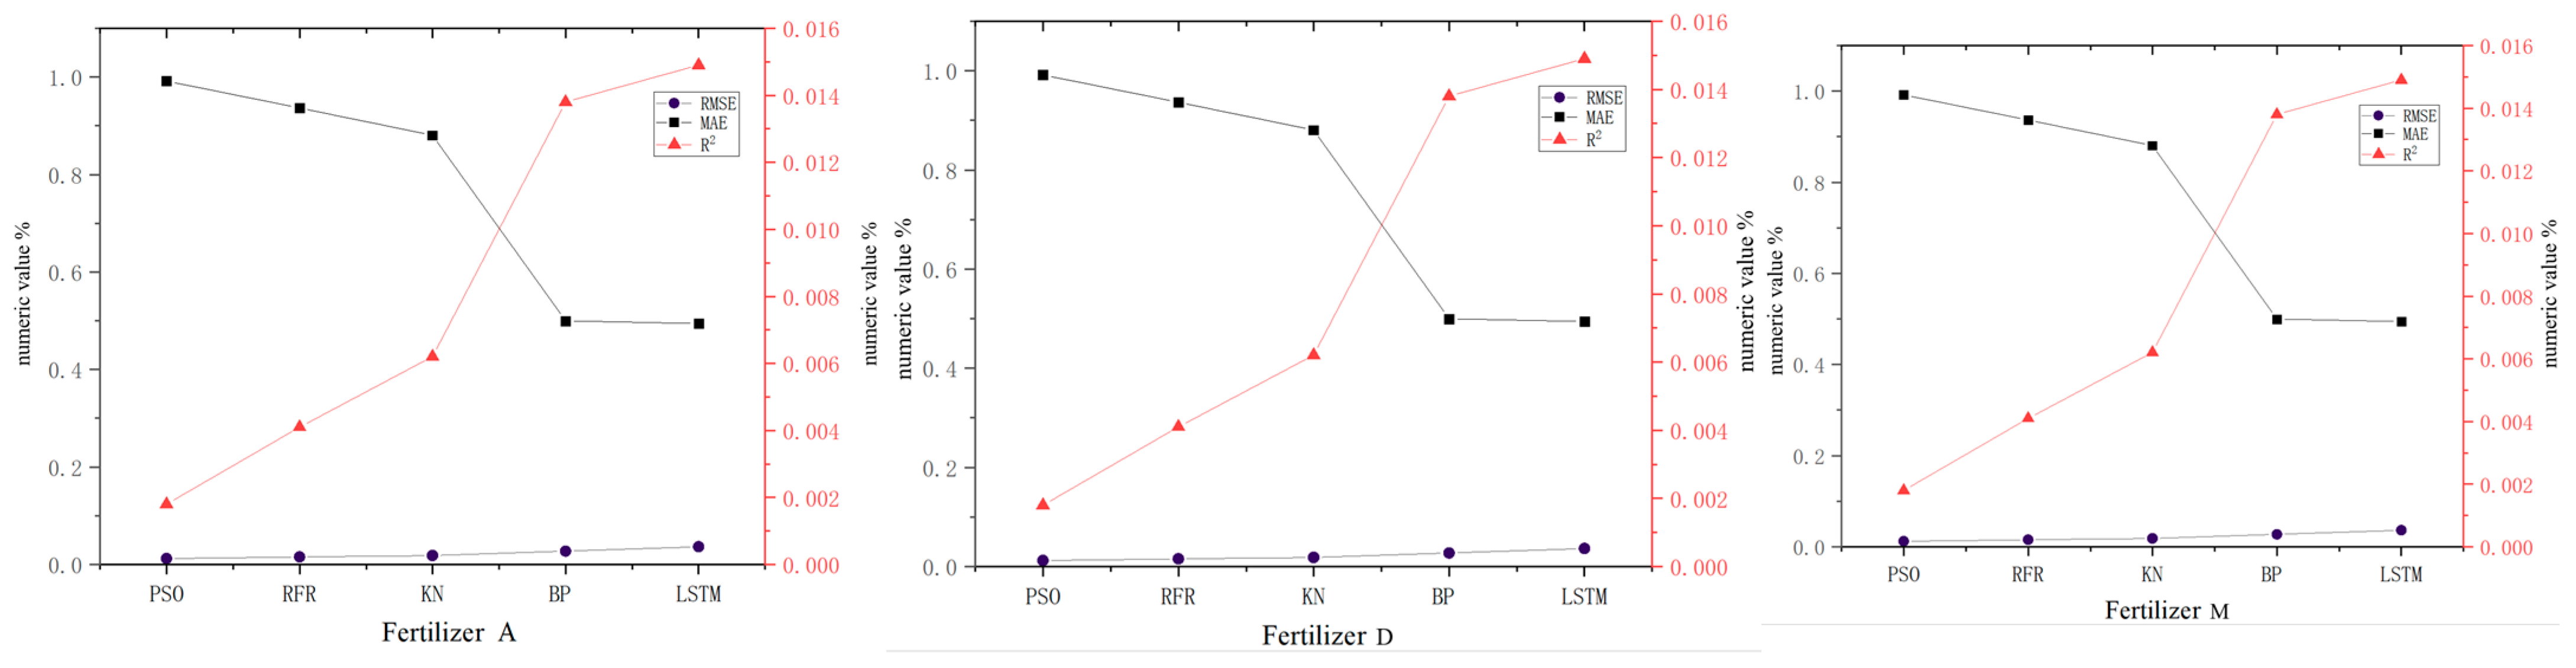
3.1. Comparative Analysis of Predictive Models

To verify the feasibility of predicting the crushing force of controlled-release fertilizers based on phenotypic features and to assess the accuracy and efficiency of the PSO-SVM prediction model, K-nearest neighbor (KNN), backpropagation (BP), random forest regression, and long short-term memory (LSTM) neural networks were selected as comparison models. These models were used to predict the force of the three types of controlled-release fertilizers, and the mean absolute error (MAE), root mean square error (RMSE), and coefficient of determination (R2) were calculated for comparison. The prediction performance metrics are shown in Table 3. Figure 10 shows the analysis of the evaluation indexes of the three controlled-release fertilizers by different prediction models.
As shown in Table 3, the random forest regression and K-nearest neighbor prediction models exhibit high levels of convergence and good fitting performances, with their evaluation metrics closely resembling those of the PSO-SVM prediction model. In contrast, the backpropagation neural network and LSTM neural network show larger prediction errors and a worse predictive performance. The poor performance of the BPNN and LSTM models can be attributed to several factors. First of all, the BP neural network has overfitting, which can lead to the poor generalization ability of the model. Secondly, although the LSTM model is effective in some cases, it does not perform well in capturing the nonlinear relationship between particle characteristics and performance indicators, resulting in its low prediction accuracy.
The PSO-SVM prediction model outperforms the other four models in predicting the crushing strength of controlled-release fertilizers. For fertilizer A, the RMSE and MAE of the PSO-SVM model are respectively 37.1%, 74.1%, 87.4%, and 86.7% lower, and 56.1%, 71.0%, 87.0%, and 87.9% lower than those of the random forest regression, K-nearest neighbor, backpropagation neural network, and LSTM neural network models. Additionally, the R2 is 5.9%, 12.7%, 98.4%, and 100.6% higher than the other four models. For fertilizer D, the PSO-SVM model’s RMSE and MAE are 42.9%, 78.4%, 89.2%, and 89.7% lower, and 52.2%, 84.3%, 92.0%, and 92.2% lower than those of the random forest regression, K-nearest neighbor, backpropagation neural network, and LSTM neural network models, respectively. The R2 is 5.8%, 12.2%, 94.8%, and 146.5% higher than the other four models. For fertilizer M, the RMSE and MAE of the PSO-SVM model are 47.1%, 86.2%, 92.4%, and 94.0% lower, and 46.7%, 82.3%, 92.3%, and 94.1% lower than the random forest regression, K-nearest neighbor, backpropagation neural network, and LSTM neural network models. The R2 is 3.5%, 11.8%, 91.1%, and 94.0% higher than the other models.
The PSO-SVM prediction model exhibits high performance metrics for all three types of controlled-release fertilizers, with RMSE and MAE values both less than 0.005 and R2 values greater than 0.99. This indicates that the PSO-SVM model, using phenotypic features to predict the crushing force, can effectively predict the crushing force of different controlled-release fertilizers.
In this section, a detailed comparative analysis was conducted to assess the performance of the proposed method for determining the length, width, and thickness of the controlled-release fertilizer granules. The results obtained from the new method were compared against measurements from traditional manual methods and existing automated techniques in terms of accuracy, consistency, and computational efficiency. The key metrics used for comparison included the mean absolute error (MAE), root mean square error (RMSE), and the coefficient of variation (CV) for each parameter (length, width, and thickness).
The comparative analysis demonstrated that the proposed method provided a more accurate and consistent measurement of the granule dimensions compared to the traditional methods. Specifically, the sphericity and granularity calculations derived from the proposed method showed lower MAE and RMSE values, indicating improved precision in characterizing the shape of the granules. Additionally, the proposed method exhibited faster processing times, making it more suitable for high-throughput applications in fertilizer manufacturing.

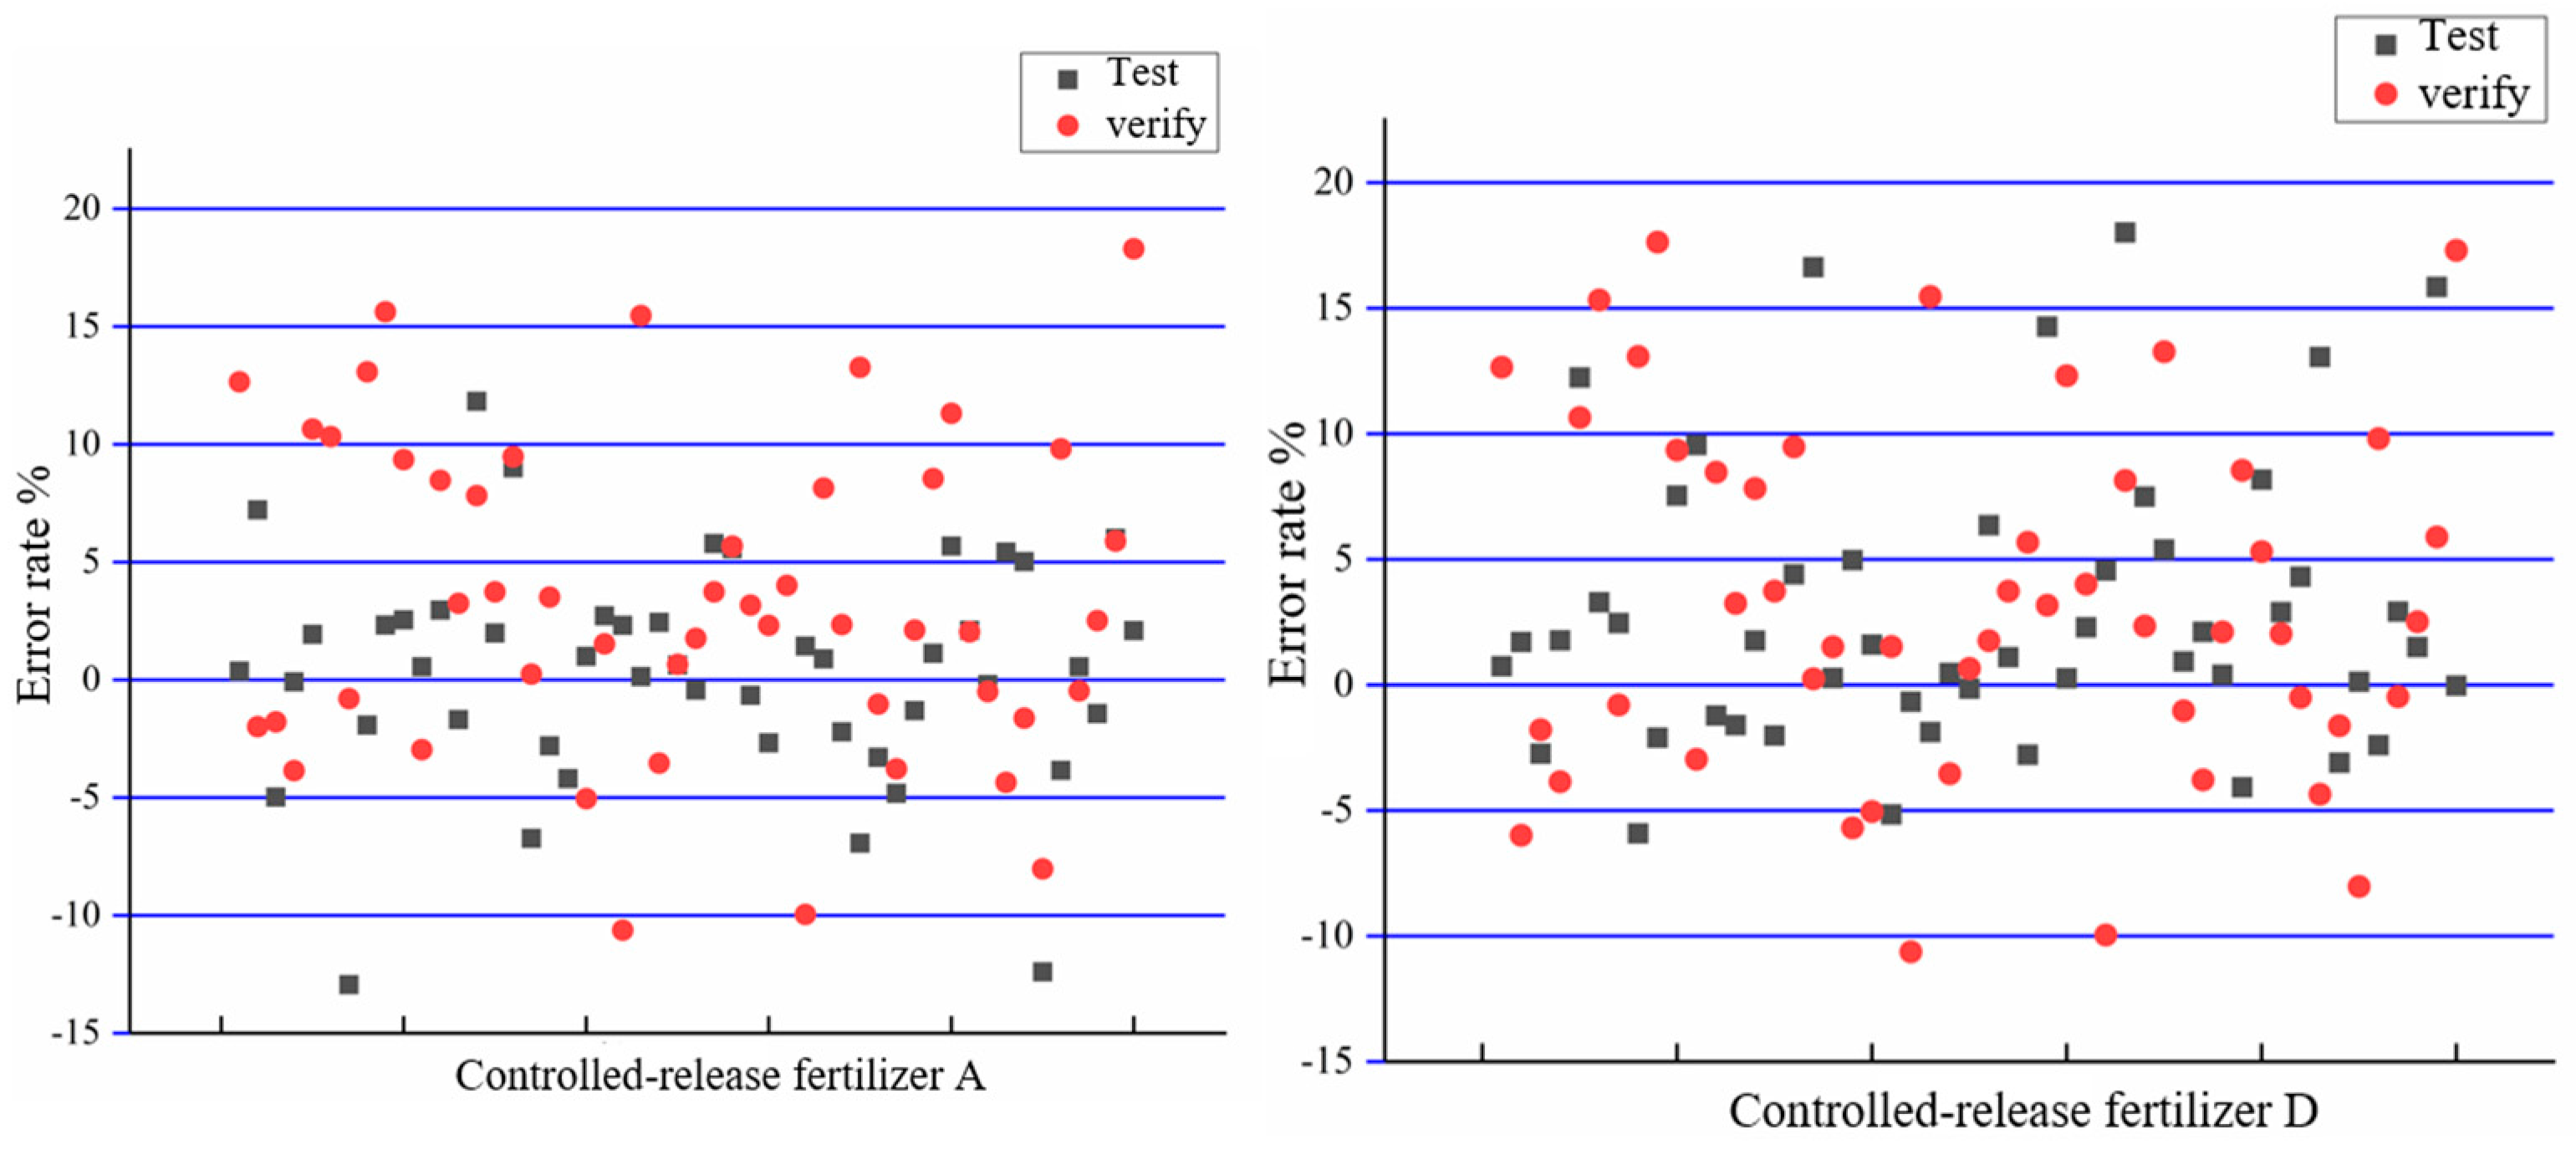
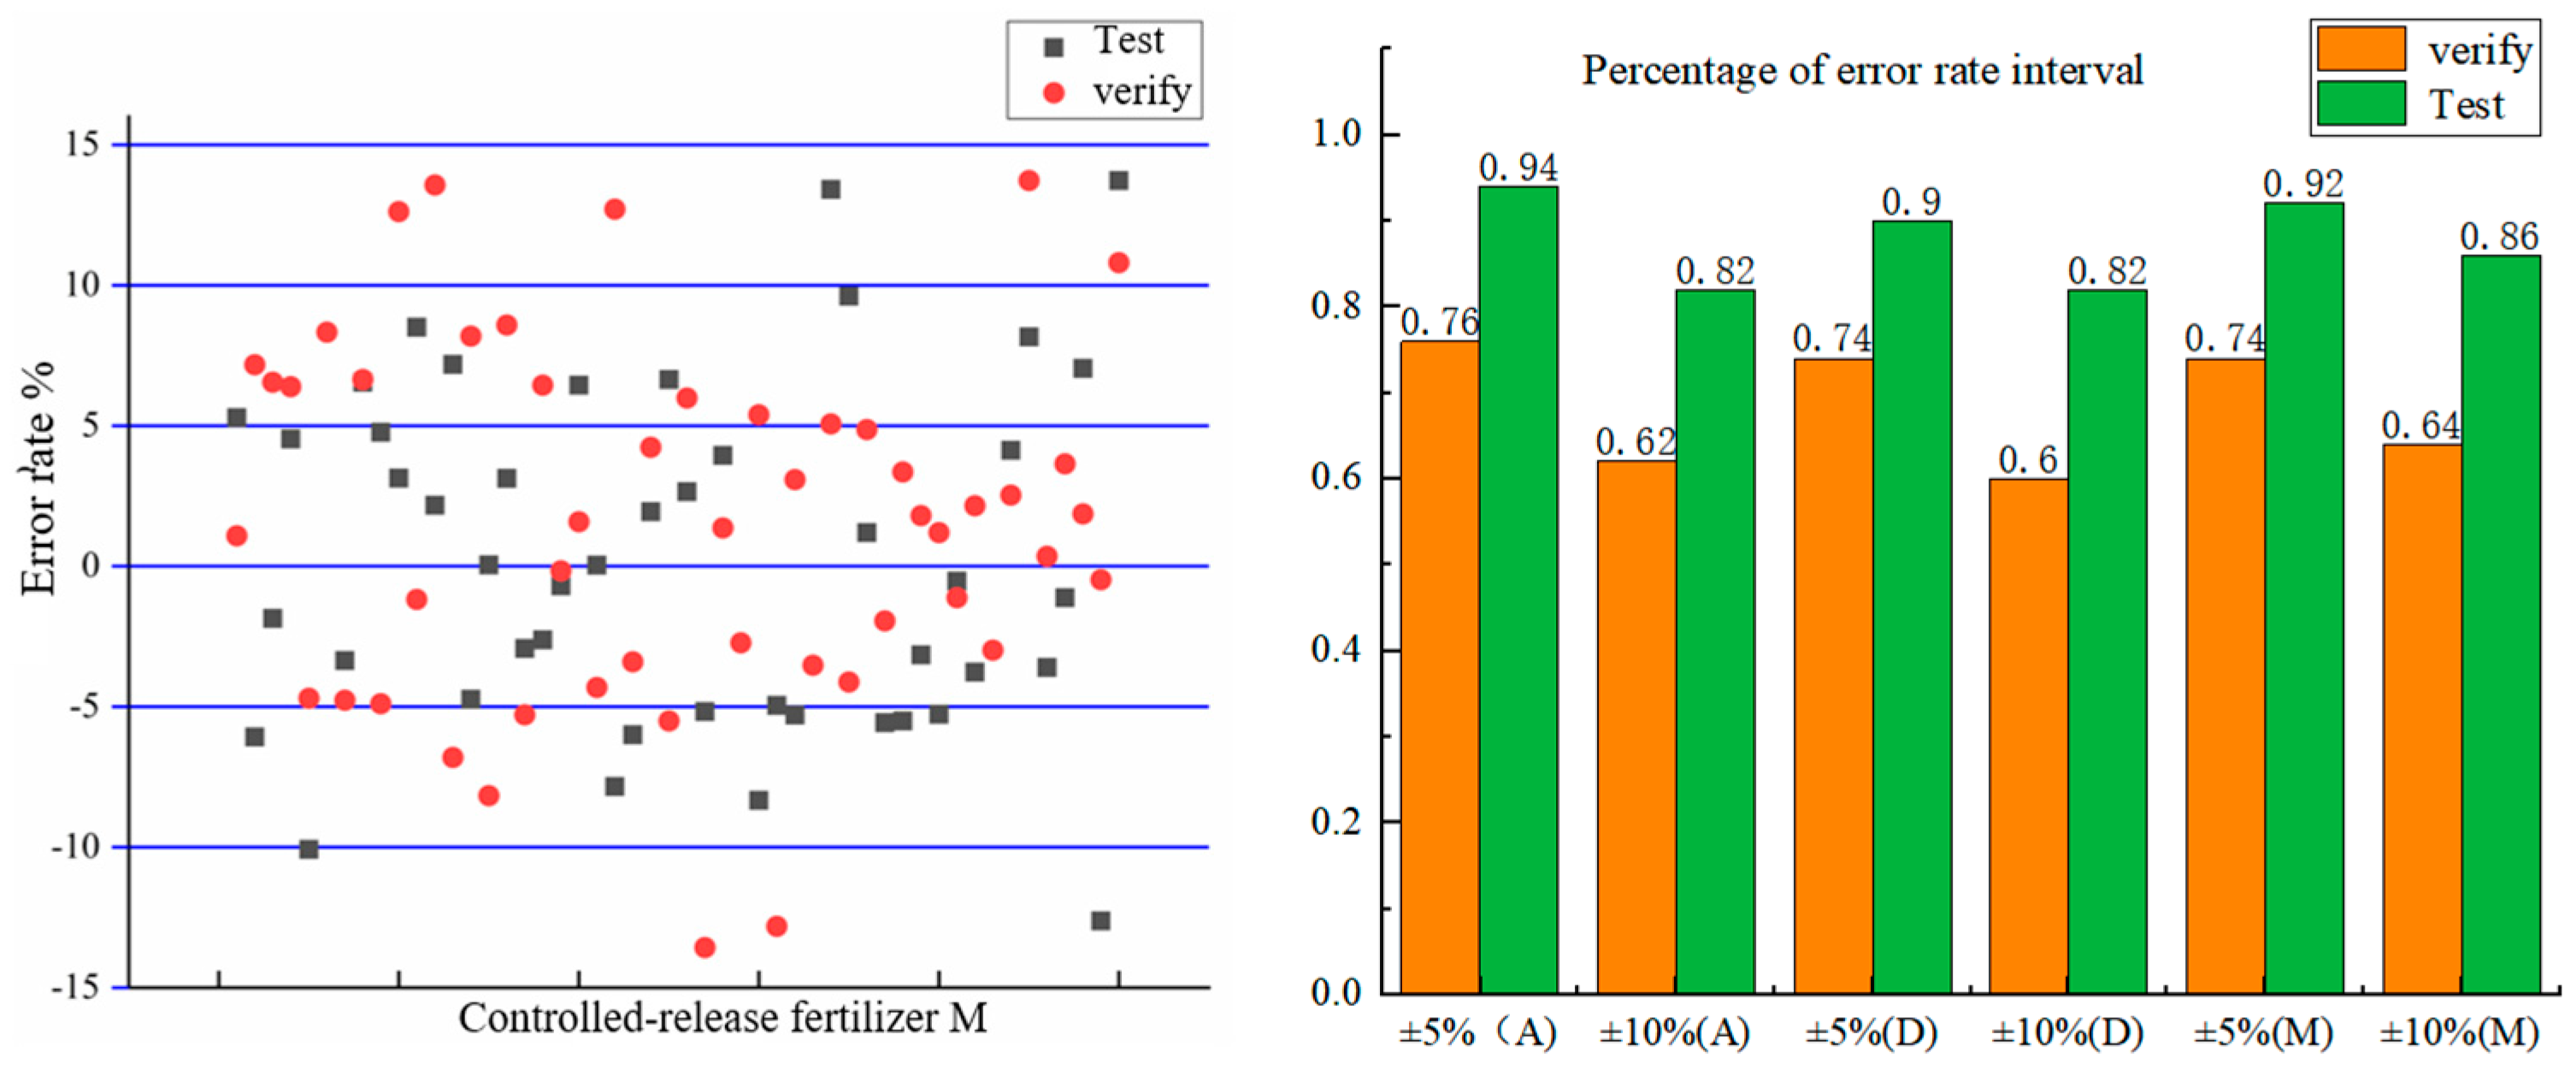
3.2. Validation Analysis of the PSO-SVM Prediction Model

The accuracy of the PSO-SVM prediction model is evaluated through the error rate (e). The error rate e is defined as follows:
e = s 2 s 1 s 1 × 100 %
where s 1 represents the actual value, and s 2 represents the predicted value.
Fifty particles from each type of controlled-release fertilizer were randomly sampled again, photographed, and processed, with the resulting images input into the prediction model to obtain the predicted crushing force for each fertilizer particle. A uniaxial compression experiment was then conducted on the sampled fertilizer to obtain the actual crushing force, and the validation error rate was calculated. Fifty sets of data were extracted as the test set, and the error rate between the actual values and predicted values in the test set was calculated. A comparison between the test set error rate and the validation experiment error rate is shown in Figure 10.
As shown in Figure 11, the error rates for the three types of controlled-release fertilizers were primarily concentrated around the zero interval, in which zero indicates that the predicted values matched the actual values. The higher the concentration of values around the zero interval, the greater the prediction accuracy. For controlled-release fertilizer particles A, the proportion of test error rates falling within the −5% to +5% range was 0.76, and within the −10% to +10% range, the proportion was 0.94; meanwhile, the proportion of validation error rates within the −5% to +5% range was 0.62, and within the −10% to +10% range, the proportion was 0.82. For controlled-release fertilizer particles D, the proportion of test error rates within the −5% to +5% range was 0.74, and within the −10% to +10% range, the proportion was 0.88, while the validation error rates within the −5% to +5% and −10% to +10% ranges were 0.60 and 0.82, respectively. For controlled-release fertilizer particles M, the proportion of test error rates within the −5% to +5% range was 0.74, and within the −10% to +10% range, the proportion was 0.92; the validation error rates within the −5% to +5% and −10% to +10% ranges were 0.64 and 0.86, respectively. This comparison has shown that the test and validation error rates for all controlled-release fertilizers were concentrated around the zero interval. The proportion of test error rates within 10% exceeded 0.9, and the proportion of validation error rates within 10% exceeded 0.8, indicating that the prediction model has achieved a high level of accuracy.
A set of 100 granules, chosen from multiple batches with varying sizes and surface characteristics, was used for the validation analysis. For each granule, three independent measurements were performed using both the proposed method and the 3D scanning system. The results were statistically analyzed to assess the correlation between the two measurement techniques. A high degree of correlation (r > 0.95) was observed for all parameters (length, width, and thickness), confirming the validity of the proposed method.
Additionally, the sensitivity of the method to different granule sizes and shapes was tested by analyzing granules with a wide range of dimensions. The validation results showed that the proposed method was equally effective in accurately measuring both large and small granules, with minimal error introduced by variations in size or shape.
To assess the repeatability of the method, measurements were repeated on the same set of granules under identical conditions. The results indicated high levels of repeatability, with negligible variation in the measured dimensions across multiple trials. This confirms the reliability of the proposed method for consistent and precise granule characterization.
Although most of the errors are small, there are still a few data points that are outside the ±10% range. These large deviations may be due to extreme irregularities in the surface texture of some particles or anomalies in the data, and further optimization of the data preprocessing process, especially the identification and removal of abnormal data, can reduce the error fluctuations in predictions. In practice, the magnitude of the prediction error is directly related to the usability of the model. Large prediction errors can affect the quality monitoring and performance evaluation of controlled-release fertilizer pellets, especially in demanding production environments.

4. Discussion

The crushing force prediction method of controlled-release fertilizers based on particle phenotype, developed and optimized in this study, enables efficient predictions of the mechanical stability of fertilizer granules. This method is particularly suited for controlled-release fertilizers used in precision agriculture, in which stability and consistency in particle breakdown are crucial. Compared to traditional methods for evaluating fertilizer durability, this approach utilizes a particle phenotype analysis, making it highly applicable for real-time and in situ assessments without the need for extensive laboratory testing. When compared to conventional mechanical testing methods, it has the advantages of a simplified testing process, higher levels of accuracy in predictions of crushing force, and enhanced adaptability to varying particle sizes and shapes. Future research will focus on further refining the phenotypic analysis parameters and optimizing the prediction algorithm to improve its accuracy and broaden its applicability to diverse types of controlled-release fertilizers.
In this paper, the research mainly focuses on the granular crushing power of controlled-release fertilizers, and there is a lack of consideration of other important factors of controlled-release fertilizers, such as nutrient release and the chemical integrity of controlled-release fertilizers, and the prediction method should be extended to other types of fertilizers. The controlled-release fertilizers used in our experiment have the same physical properties, and no other varieties or types of fertilizers were studied. This prediction method can be extended to include research in this area.

5. Conclusions

Using machine vision to extract phenotypic characteristics of different types of controlled-release fertilizers, an SVM-based model was constructed to predict the crushing force of fertilizer particles. The model was optimized using a particle swarm optimization algorithm and compared with existing predictive algorithms, including random forest regression, K-nearest neighbor, backpropagation neural network, and long short-term memory neural network models. The results indicate the following:
(1) By optimizing the SVM prediction model with the PSO algorithm and using k-fold cross-validation to determine the optimal parameters for the SVM model, the accuracy and efficiency of parameter selection for predicting different controlled-release fertilizers were improved, thereby improving the prediction accuracy;
(2) The PSO-SVM prediction model was used to predict the crushing force of the most widely used controlled-release fertilizer, and validation experiments were conducted. The proportion of validation error rates within the −10% to +10% range for the three types of fertilizers was 0.82, 0.82, and 0.86, respectively, all exceeding 0.8. This method, based on phenotypic characteristics and the PSO-SVM prediction model, has high levels of accuracy in predicting the crushing force of controlled-release fertilizers;
(3) A comparison of the prediction performance of the PSO-SVM model with random forest regression, KNN, BP neural network, and LSTM neural network models for predicting the crushing force of three types of controlled-release fertilizers showed that the PSO-SVM model outperformed the other four models in terms of the RMSE, MAE, and R2. The PSO-SVM model exhibited an excellent prediction performance, along with high levels of precision, simplicity, efficiency, and objectivity, making it widely applicable. It can provide a theoretical basis for non-destructive testing methods of the crushing force of controlled-release fertilizers.

Author Contributions

Writing—original draft preparation, L.S., X.C. (Xiubo Chen), Z.C. and L.J.; writing—review and editing, L.S. and X.C. (Xiubo Chen); conceptualization, L.S., X.C. (Xiubo Chen) and J.W.; methodology, X.C. (Xiubo Chen), X.C. (Xinpeng Cao) and L.J.; software, X.C. (Xinpeng Cao), H.Z., Y.J. and S.F.; validation, L.S., X.C. (Xinpeng Cao), L.J. and J.W.; resources, J.W.; data curation, X.C. (Xiubo Chen). All authors have read and agreed to the published version of the manuscript.

Funding

This research was funded by the National Natural Science Foundation of China (3220151788), the Young Talent of Lifting Engineering for Science and Technology in Shandong, China (SDAST2024QTA050), the Shandong Province Key R&D Plan (2022CXGC020706), the Shandong Province “University Youth Innovation Team” Program (2023KJ160), and China Agriculture Research System (CARS-27).

Institutional Review Board Statement

Not applicable.

Informed Consent Statement

Not applicable.

Data Availability Statement

The data presented in this study are available upon request from the corresponding author.

Acknowledgments

Thanks to all the authors cited in this article and the reviewers for their helpful comments and suggestions.

Conflicts of Interest

The authors declare no conflicts of interest.

References

  1. Liu, Y.H.; Zheng, W.T.; Zhang, J.T.; Zhang, Z.Q.; Zhao, Y.X.; Ma, M.; Wang, J.; Zhang, X.H. Reserch progress and application of slow/controlled-release fertilizers. J. Huazhong Agric. Univ. 2023, 42, 1–10. (In Chinese) [Google Scholar]
  2. Liu, Q.P.; Sun, J.R.; Pu, L.J. Comparative study on fertilization intensity and integrated efficiency in China and Euro-American major countries. Trans. Chin. Soc. Agric. Eng. 2020, 36, 9–16. (In Chinese) [Google Scholar]
  3. Liang, Z.H.; Zhang, L.; Zhang, J.B. Land consolidation and fertilizer reduction: Quasi-natural experimental evidence from China’s well-facilitated capital farmland construction. Chin. Rural. Econ. 2021, 4, 123–144. (In Chinese) [Google Scholar]
  4. Bai, Y.L. The situation and prospect of research on efficient fertilization. Sci. Agric. Sin. 2018, 51, 2116–2125. (In Chinese) [Google Scholar]
  5. Zhu, Z.L.; Jin, J.Y. Fer-tilizer use and food security in China. Plant Nutr. Fer-Tilizer Sci. 2013, 19, 259–273. (In Chinese) [Google Scholar]
  6. Chen, Y.H.; Sun, Y.X.; Xue, G.F.; Xiao, Q.; Zhao, R.D.; Jian, C.F. Study on releasing mechanics of resin-coated controlled-release fertilizer in soil based on SUGIHARA model. Chin. J. Soil Sci. 2011, 42, 637–641. (In Chinese) [Google Scholar]
  7. Fertahi, S.; Ilsouk, M.; Zeroual, Y.; Oukarroum, A.; Barakat, A. Recent trends in organic coating based on biopolymers and biomass for controlled and slow release fertilizers. J. Control. Release 2021, 330, 341–361. [Google Scholar] [CrossRef]
  8. Liu, Z.H.; Wu, X.B.; Tan, D.S.; Li, Y.; Jiang, L.H. Application and environmental effects of one-off fertilization technique in major cereal crops in China. Sci. Agric. Sin. 2018, 51, 3827–3839. (In Chinese) [Google Scholar]
  9. Sun, Y.M.; Song, H.H.; Li, L.X.; Cao, B.; Li, H.Y.; Xiao, Q.; Wang, J.Z. Preparation and application of polyester/polyether type polyurethane swap films. Eng. Plast. Appl. 2016, 44, 1–5. (In Chinese) [Google Scholar]
  10. Liu, Y.C. Key Technology on Variable Rate Application System. Ph.D. Thesis, Academy of Agricultural Mechanization Sciences, Beijing, China, 2012. (In Chinese). [Google Scholar]
  11. Shan, J.; Xu, L.M.; Hu, D. In situ evaluation method of sphericity error based on spherical grinding texture. J. Shanghai Jiao Tong Univ. 2016, 50, 654–659. (In Chinese) [Google Scholar]
  12. Maroof, M.A.; Mahboubi, A.; Noorzad, A.; Safi, Y. A new approach to particle shape classification of granular materials. Transp. Geotech. 2020, 22, 100296. [Google Scholar] [CrossRef]
  13. Kan, H.F.; Su, J.L.; Tang, C. Anti-caking measure for compound fertilizer by acid ammoniation process and its application. Phosphate Compd. Fertil. 2016, 31, 31–32. (In Chinese) [Google Scholar]
  14. Hofstee, J.W.; Huisman, W. Handling and spreading of fertilizers part1: Physical properties of fertilizer in relation to particle motion. J. Agric. Eng. Res. 1990, 47, 213–234. [Google Scholar] [CrossRef]
  15. Hoffmeister, G.; Watkins, S.C.; Silverberg, J. Fertilizer Consistency, Bulk Blending of Fertilizer Material: Effect of Size, Shape, and Density on Segregation. J. Agric. Food Chem. 1964, 12, 64–69. [Google Scholar] [CrossRef]
  16. Silverberg, J.; Lehr, J.R.; Hoffmeister, G., Jr. Fertilizer caking, microscopic study of the mechanism of caking and its prevention in some granular fertilizers. J. Agric. Food Chem. 1958, 6, 442–448. [Google Scholar] [CrossRef]
  17. Tang, Y.; Wang, Y.; Wu, D.; Chen, M.; Pang, L.; Sun, J.; Feng, W.; Wang, X. Exploring temperature-resilient recycled aggregate concrete with waste rubber: An experimental and multi-objective optimization analysis. Rev. Adv. Mater. Sci. 2023, 62, 20230347. [Google Scholar] [CrossRef]
  18. Sulaiman, R.; Azeman, N.H.; Mokhtar, M.H.H.; Mobarak, N.N.; Bakar, M.H.; Bakar, A.A. Hybrid ensemble-based machine learning model for predicting phosphorus concentrations in hydroponic solution. Spectrochim. Acta Part A Mol. Biomol. Spectrosc. 2024, 304, 123327. [Google Scholar] [CrossRef] [PubMed]
  19. Zadeh, A.; Broach, C.; Nosoudi, N.; Weaver, B.; Conrad, J.; Duffy, K. Building analytical models for predicting de novo malignancy in pancreas transplant patients: A machine learning approach. Expert Syst. Appl. 2024, 237, 121584. [Google Scholar] [CrossRef]
  20. Ding, G.; Shi, X.; Hu, J. Prediction model of oxygen supply by aerobic compost based on CGA-BP neural network. Trans. Chin. Soc. Agric. Eng. 2023, 39, 211–217. (In Chinese) [Google Scholar]
  21. Shi, P.; Kuang, L.; Yuan, Y.M.; Zhang, H.Y.; Li, G.H. Dissolved oxygen prediction method in water body based on an improved limit learning machine. Trans. Chin. Soc. Agric. Eng. 2020, 36, 225–232. [Google Scholar]
  22. Zu, L.L.; Liu, P.Z.; Zhao, Y.P.; Li, T.H.; Li, H. Research on the environmental prediction model of solar greenhouse based on SSA-LSTM. Trans. Chin. Soc. Agric. Mach. 2023, 54, 351–358. (In Chinese) [Google Scholar]
  23. Zhang, H.; Liu, X.; Liu, S.; Jiang, H.; Xu, C.; Wang, J. Prediction Model of Dry Fertilizer Crushing Force Based on P-DE-SVM. ACS Omega 2021, 6, 3612–3624. (In Chinese) [Google Scholar] [CrossRef] [PubMed]
  24. Lin, C.L.; Miller, J.D. 3D characterization and analysis of particle shape using X-ray microtomography (XMT). Powder Technol. 2005, 154, 61–69. [Google Scholar] [CrossRef]
  25. Mora, C.F.; Kwan, A.K.H. Sphericity, shape factor, and convexity measurement of coarse aggregate for concrete using digital image processing. Cem. Concr. Res. 2000, 30, 351–358. [Google Scholar] [CrossRef]
  26. Rakotonirina, A.D.; Delenne, J.Y.; Radjai, F.; Wachs, A. Grains3D, a flexible DEM approach for particles of arbitrary convex shape-Part III: Extension to non-convex particles modelled as glued convex particles. Comput. Part. Mech. 2019, 6, 55–84. [Google Scholar] [CrossRef]
  27. Masad, E.; Olcott, D.; White, T.; Tashman, L. Correlation of fine aggregate imaging shape indices with asphalt mixture performance. Transp. Res. Rec. 2001, 1757, 148–156. [Google Scholar] [CrossRef]
  28. Yan, M.; Lin, J.; Guo, X.Y.; Zhao, Y.; Wang, H.; Li, J. Extracting the flame image color feature after PCA transformation based on clustering analysis. J. Hunan Univ. Sci. Technol. 2014, 29, 64–68. (In Chinese) [Google Scholar]
  29. Zhang, J.D.; Guo, X.N.; Luo, X.Q.; Wang, Y.; Li, H.; Chen, Z. Improved modal parameter identification method based on particle swarm optimization. J. Vib. Shock. 2022, 41, 255–264. (In Chinese) [Google Scholar]
  30. Ren, J.; Du, W.; Ye, W.L.; Liu, W.; Wei, Z. Contact loss identification of CA mortar in prefabricated slab track based on PSO-SVM. J. Cent. South Univ. 2021, 52, 4021–4031. (In Chinese) [Google Scholar]
  31. Yang, W.; Lan, H.; Li, M.Z.; Meng, C. Predicting bulk density and porosity of soil using image processing and support vector regression. Trans. Chin. Soc. Agric. Eng. 2021, 37, 144–151. (In Chinese) [Google Scholar]
Figure 1. Image acquisition device and image acquisition. 1. Cameras and lenses 2. Camera mount 3. Backdrop.
Agriculture 14 02235 g001
Figure 2. Image of a single controlled-release fertilizer after preconditioning.
Agriculture 14 02235 g002
Figure 3. Length (a), width (b), and thickness (c) of controlled-release fertilizer.
Agriculture 14 02235 g003
Figure 4. A schematic representation of the texture features of the controlled-release fertilizer.
Agriculture 14 02235 g004
Figure 5. Universal testing machine. 1. Indenter; 2. Control panel; 3. Assistive devices; 4. Stage transition point; 5. The peak point of the load.
Agriculture 14 02235 g005
Figure 6. The process diagram for the construction of the predictive model for controlled-release fertilizer particle crushing force.
Agriculture 14 02235 g006
Figure 7. Boxplot of shape characteristic distribution of controlled-release fertilizer.
Agriculture 14 02235 g007
Figure 8. Crushing force distribution of controlled-release fertilizer.
Agriculture 14 02235 g008
Figure 9. PSO-SVM flow chart.
Agriculture 14 02235 g009
Figure 10. Analysis of the evaluation indexes of three controlled-release fertilizers by different prediction models.
Agriculture 14 02235 g010
Figure 11. Distribution of error rates of controlled-release fertilizers A, D, and M.
Agriculture 14 02235 g011aAgriculture 14 02235 g011b
Table 1. Shape characteristics and crushing force parameters of controlled-release fertilizer.
Projecta/mb/mc/mGranularity dASMCONENTCrushing Forces/N
Fertilizer Aaverage value0.009410.003790.003173.5210.7070.5230.74062.0
range0.003100.003090.0030102.2390.3780.5900.81616.6
standard deviation0.006700.000600.000570.5180.0820.1230.17728.0
Fertilizer Daverage value0.003990.003720.003593.744 0.616 0.521 0.971 69.0
range0.003180.002590.002342.127 0.335 0.608 0.827 51.0
standard deviation0.000570.000470.000440.420 0.067 0.123 0.156 15.0
Fertilizer Maverage value0.003700.003600.003053.335 0.700 0.522 0.759 57.0
range0.003680.003140.002522.060 0.332 0.617 0.739 63.0
standard deviation0.000730.000560.000490.487 0.062 0.104 0.137 16
Table 2. GMax test results of controlled-release fertilizer parameters.
Classa/mb/mc/mGranularity dASMCONENTCrushing Force/N
Fertilizer A0.002860.003190.002622.857 1.6033.178 3.046 2.270
Fertilizer D0.003030.002760.003102.791 2.894 2.985 2.455 2.947
Fertilizer M0.002960.003020.003102.509 1.883 3.199 2.687 2.388
Table 3. Evaluation indexes of controlled-release fertilizers of different prediction models.
Predictive ModelsClassRMSEMAER2
PSO-SVMFertilizer A0.0022 0.0018 0.9918
Fertilizer D0.0016 0.0011 0.9948
Fertilizer M0.0009 0.00080.9988
Random forest regressionFertilizer A0.00550.00410.9364
Fertilizer D0.00280.00230.9405
Fertilizer M0.00170.00150.9650
K-nearest neighborFertilizer A0.00850.00620.8804
Fertilizer D0.00740.00700.8867
Fertilizer M0.00650.00460.8930
BP neural networkFertilizer A0.01740.01380.4998
Fertilizer D0.01480.01370.5106
Fertilizer M0.01180.01040.5227
LSTM neural networkFertilizer A0.01650.01490.4943
Fertilizer D0.01560.01410.4035
Fertilizer M0.01510.01360.5150
Disclaimer/Publisher’s Note: The statements, opinions and data contained in all publications are solely those of the individual author(s) and contributor(s) and not of MDPI and/or the editor(s). MDPI and/or the editor(s) disclaim responsibility for any injury to people or property resulting from any ideas, methods, instructions or products referred to in the content.

