


Abstract
This paper addresses the challenge of accurately estimating bee orientations on beehive landing boards, which is crucial for optimizing beekeeping practices and enhancing agricultural productivity. The research utilizes YOLOv8 pose models, trained on a dataset created using an open-source computer vision annotation tool. The annotation process involves associating bounding boxes with keypoints to represent bee orientations, with each bee annotated using two keypoints: one for the head and one for the stinger. The YOLOv8-pose models demonstrate high precision, achieving 98% accuracy for both bounding box and keypoint detection in px images. However, trade-offs between model size and processing speed are addressed, with the smaller nano model reaching 67 frames per second on px images. The entrance ramp detection model achieves 91.7% intersection over union across four keypoints, making it effective for detecting the hive’s landing board. The paper concludes with plans for future research, including the behavioral analysis of bee colonies and model optimization for real-time applications.
1. Introduction
Beekeeping is a vital component of modern agriculture, playing a significant role in crop pollination and maintaining overall ecosystem health [1,2]. As global agricultural productivity demands rise, the need for efficient and precise methods to monitor bee behavior becomes increasingly critical [3]. Monitoring bee activities at hive entrances offers valuable insights that can help optimize hive productivity and ensure sustainable agricultural practices [4]. Despite various efforts to improve hive monitoring, there remains a gap in systems that can automatically detect, track, and analyze bee behavior in a detailed and scalable way at the hive entrance. Specifically, current approaches have limitations in accurately estimating bee orientations and detecting key areas such as the hive’s entrance ramp.
This paper addresses this gap by proposing a key component of a bee behavior identification system that integrates keypoint-based bee orientation estimation and ramp detection at the hive entrance. Leveraging advanced computer vision techniques, particularly keypoint detection models, this research aims to enhance the accuracy and efficiency of monitoring bee activities. The ability to precisely estimate bee orientations can support more refined observations of hive health, bee traffic, and foraging behavior, thereby contributing to better hive management and research [5]. Additionally, by automatically detecting hive entrance ramps, this system provides a novel solution for analyzing bee behavior without manual intervention, offering insights for real-time hive monitoring applications.
Detecting and tracking bee orientations on beehive landing boards serve multiple critical functions in beekeeping and scientific research. By observing bee movements and directions at hive entrances, beekeepers can assess hive strength, foraging efficiency, and overall health [6,7]. This information is essential for making informed hive management decisions, such as feeding schedules or honey harvesting [8]. Tracking orientations also provides insights into the foraging patterns of bees, helping researchers identify preferred foraging locations and optimize hive maintenance strategies based on the availability of resources [9,10].
Beyond its contributions to hive management, bee orientation estimation plays a critical role in understanding foraging behavior, insect coordination, and environmental impacts. Studying how bees land at hive entrances [11] or respond to changes in weather, temperature, or resource availability can provide valuable data for ecological research [12]. Additionally, by monitoring unusual bee orientation patterns, beekeepers can detect early signs of health issues or pest infestations such as Varroa mites [13,14]. This level of observation is key for ensuring hive sustainability and minimizing colony losses [15].
To bridge the current gaps in hive monitoring systems, we propose a method that uses two keypoints per bee, one on the head and one on the stinger, to estimate bee orientation. In addition, we present the first known research on detecting hive entrance ramps using keypoint-based approaches. This system is capable of localizing entrance ramps, tracking bee movements, and estimating orientations, even in scenarios where bees are partially occluded. Our approach is designed to be scalable and adaptable across different hives, which is critical for real-world beekeeping applications.
The contributions of this research are as follows:
- We collected, annotated, and publicly provided dataset [16] for the following:
- -
- Bee direction estimation based on keypoint detection: 400 images from eight beehives.
- -
- Landing board detection: 156 images of 15 entrance ramps.
- We presented the first known research on localizing beehive entrance ramps using keypoint detection. This key component of the machine vision-based system can automatically recognize the shape of the landing board, enabling further analysis of bee traffic specifically within the zone of interest.
- We performed a comparative evaluation of bee keypoint detection and entrance ramp detection by training pose detection models of varying complexity to assess both accuracy and processing speed.
This work marks a significant step towards developing an automated, long-term monitoring system capable of extracting behavioral statistics and detecting significant events at hive entrances. Currently, we focus on using keypoint-based approaches for bee orientation estimation, which will later be extended to track bee directions and recognize behavior patterns at hive entrance ramps. To ensure the system can adapt to any hive within the investigated apiary, we trained and tested a distinct keypoint detection model to automatically identify and localize the entrance zone of beehives.
The main objective of this research is to demonstrate that using two trackable keypoints per bee enables accurate orientation estimation, while also showing that a keypoint detection model can effectively localize entrance ramps. The following section reviews the state of the art in bee orientation estimation. Next, we outline the dataset, labeling process, and algorithm for converting annotation files, followed by an evaluation of precision and speed for bee and entrance ramp detection models.
2. Related Works
To accurately identify bee behavior, a monitoring system must track the direction of individual bees, not just detect them. Most related works focus on aspects such as bee tracking inside honeycombs [17], bee traffic analysis [18], bee detection [19], counting [20], improving pollen-bearing bee detection on native entrance ramp [21], determining crowd density at hive entrances [15], and precise body parts tracking of individual separated bees [22]. Some studies use artificial passageways with black backgrounds for bee tracking [23] and pollen detection [10], or white backgrounds to enhance contrast for bee segmentation [7]. All of these approaches utilize stationary mounted cameras to collect datasets and test their algorithms. In contrast, our aim is to train a model that can detect the region of entrance ramp in image for further analysis of bee behavior in that area in a certain period of time, and then move to observe another hive in the apiary.
2.1. Orientation Estimation
The studies related with bee orientation estimation are summarized in Table 1. The first four studies are based on CNN models, the last four use background subtraction, and edge detection to segment bees or detect the barcode tag glued to the thorax of the bee.
Table 1.
Comparative evaluation of the proposed methods for the estimation of bee orientation.
To implement the axis orientation of the bees, the researchers use a U-Net segmentation architecture to identify individual bees in a video sequence [24]. After filtering out irrelevant foreground patches, they calculate the centroid and main body axis for each remaining region, with the body axis determined by the first principal component of the segmented bees. To predict the orientation angle, each foreground pixel is assigned the bee rotation angle, and a loss function is defined to optimize the angle estimation. The proposed solution effectively localizes bees and estimates their orientation in video frames with difference on average, demonstrating robustness in densely packed scenarios.
In the bee activity tracking project [9] the angle of inclination of the bee is determined using ResNet50 as the backbone for Mask R-CNN model trained on 143 images to detect bees and estimate orientation on the landing board. After validation, binary masks undergo skeletonization, and linear regression on resulting coordinates calculates the angle of inclination. The authors achieved 94.5% average precision for bee detection.
The orientation of the bee can be estimated by tracking bee pose [25]. The approach considers five body parts, including tip abdomen, thorax, head, left, and right antennas, with defined connections. The pose detector architecture employs the convolutional neural network (CNN) with a feature extraction backbone and two branches for pose detection. In the inference stage, a greedy approach is used to detect body-part keypoints and group them into skeletons, providing a trajectory of bee poses over time. The average precision of body part detection reaches 99% on a custom dataset with an artificial entrance ramp. A similar approach for bee pose estimation inside the hive uses 12 keypoints per bee [26]. The authors reported an Object Keypoint Similarity (OKS) of 0.96 for detecting the centroid of the anchor box and 0.33 for localizing 12 different anatomical points on a bee.
The orientation of honeybees can be monitored with tiny barcodes glued to their thorax [26,27,28]. Changes in the location and orientation of an individual’s barcode are tracked to study the behavior of bees inside the observation hive. The research approach combines barcode-based tracking and convolutional neural networks to efficiently identify specific behaviors in honey bee colonies. Barcodes aid in individual identification, and the tracking system provides continuous location and orientation data inside the observation hive. The approach for bee identification is robust; however, challenges persist with barcode placement, lighting conditions, and the limited number of tracked bees, as control individuals still need to be manually labeled. To detect and decode the pattern of the barcode, authors [28] used methods for edge detection, image binarization, morphological operations, and ellipse fitting.
Tu et al. [7] developed a Raspberry Pi-based system to analyze the behavior of honeybees at the hive entrance. The system successfully counts honeybees, determines their positions, and tracks their in-and-out activity. Bee detection is achieved through background subtraction and statistical analysis. Angle of inclination was simulated through ellipse fitting to the segmented contour of the bee. The system achieves an accuracy of 98.7% for bee counting, 95.3% for measuring in-activity, and 88.8% for measuring out-activity. It periodically saves 30-s video clips every 10 min at 5 fps and processes them offline within 567 s, resulting in a relatively low frame rate.
2.2. Entrance Monitoring
As far as we know, hive entrance ramp detection in images has not been previously investigated. Therefore, there is a lack of references to compare the proposed keypoint-based approach with state-of-the-art methods. However, we review several monitoring systems, emphasizing the type of landing boards selected by other authors for analyzing bee traffic at the hive entrance.
The monitoring system for detecting pollen-bearing honey bees utilizes a Raspberry Pi camera mounted on a wooden sensing box positioned above the hive entrance [30,31]. It captures RGB video at resolution and 30 fps, focusing on the lower part of each frame to mitigate lighting issues and shadows. A blue-painted flight board enhances the segmentation of moving bees against the background. The system effectively classifies bees as pollen-bearing or not, leveraging real-time background subtraction and color segmentation techniques for accurate detection.
The research on bee tracking and activity monitoring [23] and pollen versus non-pollen bearing honey bee classification [10] involves using an observation box mounted on the front of the hive, allowing the bees to pass through the entrance hole. The image monitoring system includes a Jetson TX2, a webcam, a red LED lighting panel, and a monotone black passageway to improve contrast. The authors achieved a pollen classification accuracy of 94% using the YOLOv3 algorithm. A similar bee traffic analysis unit was developed, which is portable and connectable to a standard beehive [7]. In this system, honeybees enter and exit the hive through a specially designed monotone white passage that enhances the detectability of bees and prevents their overlapping, allowing for more accurate monitoring.
Another study on pollen detection achieved 98% accuracy using YOLOv5 and Faster R-CNN with a Jetson Nano [21]. The image acquisition system was stationary, mounted above the hive entrance to capture bees on the landing board. The dataset used for this study includes 2051 annotated images of the native entrance ramp of a single beehive. In a series of studies, authors monitored the native hive entrance for bee counting [20], traffic analysis [18], and enhancing bee detection [19]. The monitoring system used a Raspberry Pi and a stationary camera mounted above the hive entrance.
Two key inferences can be drawn from recent efforts in vision-based bee orientation estimation and monitoring systems for beehive entrances. First, convolutional network architectures are commonly used for bee direction estimation through segmentation [9,24], and keypoint extraction [25] approaches. Second, all current methods employ stationary cameras mounted above native ramps or inside observation boxes with a monotone background. However, there is a gap in research focused on entrance ramp detection, as existing studies analyze bee traffic across the entire field of view. This work addresses the ramp localization problem and aims to advance portable systems for bee behavior identification in the entrance zones of any hive within an apiary.
3. Materials and Methods
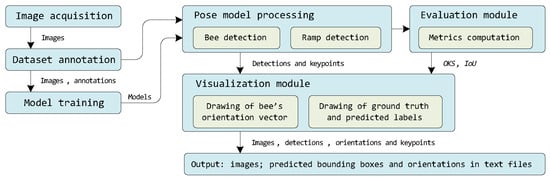
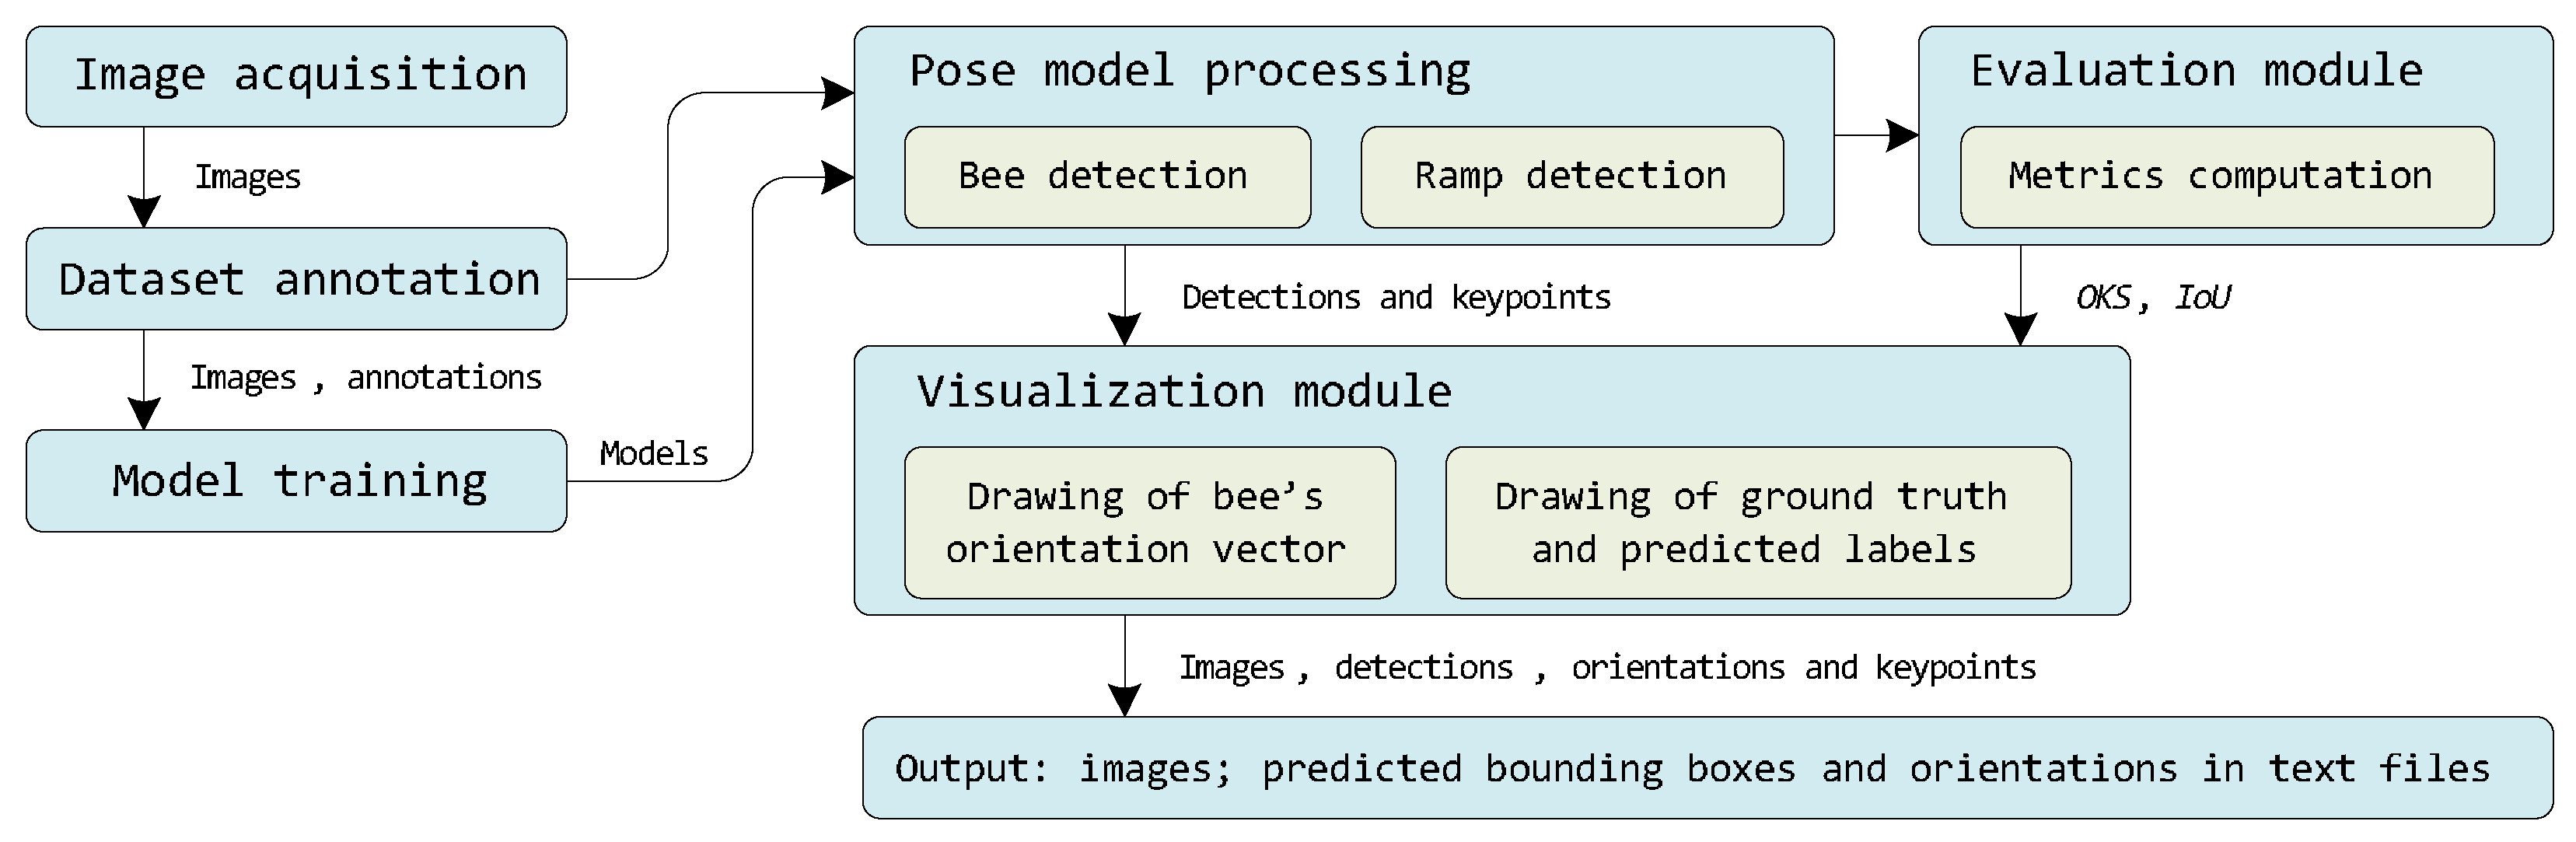
Figure 1 presents a flowchart of the bee orientation and ramp detection stages. Raw video recordings were captured at a local apiary and converted into a dataset of images. The images were then manually annotated with bounding boxes and keypoints. YOLOv8 keypoint detection models were trained on this annotated dataset and applied for both bee and ramp detection. Detection accuracy was evaluated using precision, recall, OKS, and IoU metrics. A developed visualization module allows us to display results visually on the raw images, including predicted bee orientation arrows, the predicted entrance ramp zone, OKS levels, and numerical metric values. The images, along with the detections, orientations, and keypoints, are saved in output files.
Figure 1.
Flowchart of pose models application for bee orientation and ramp detection.
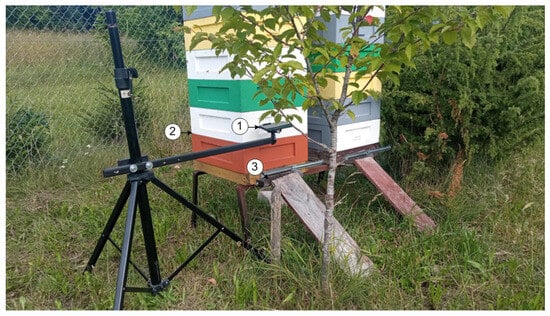
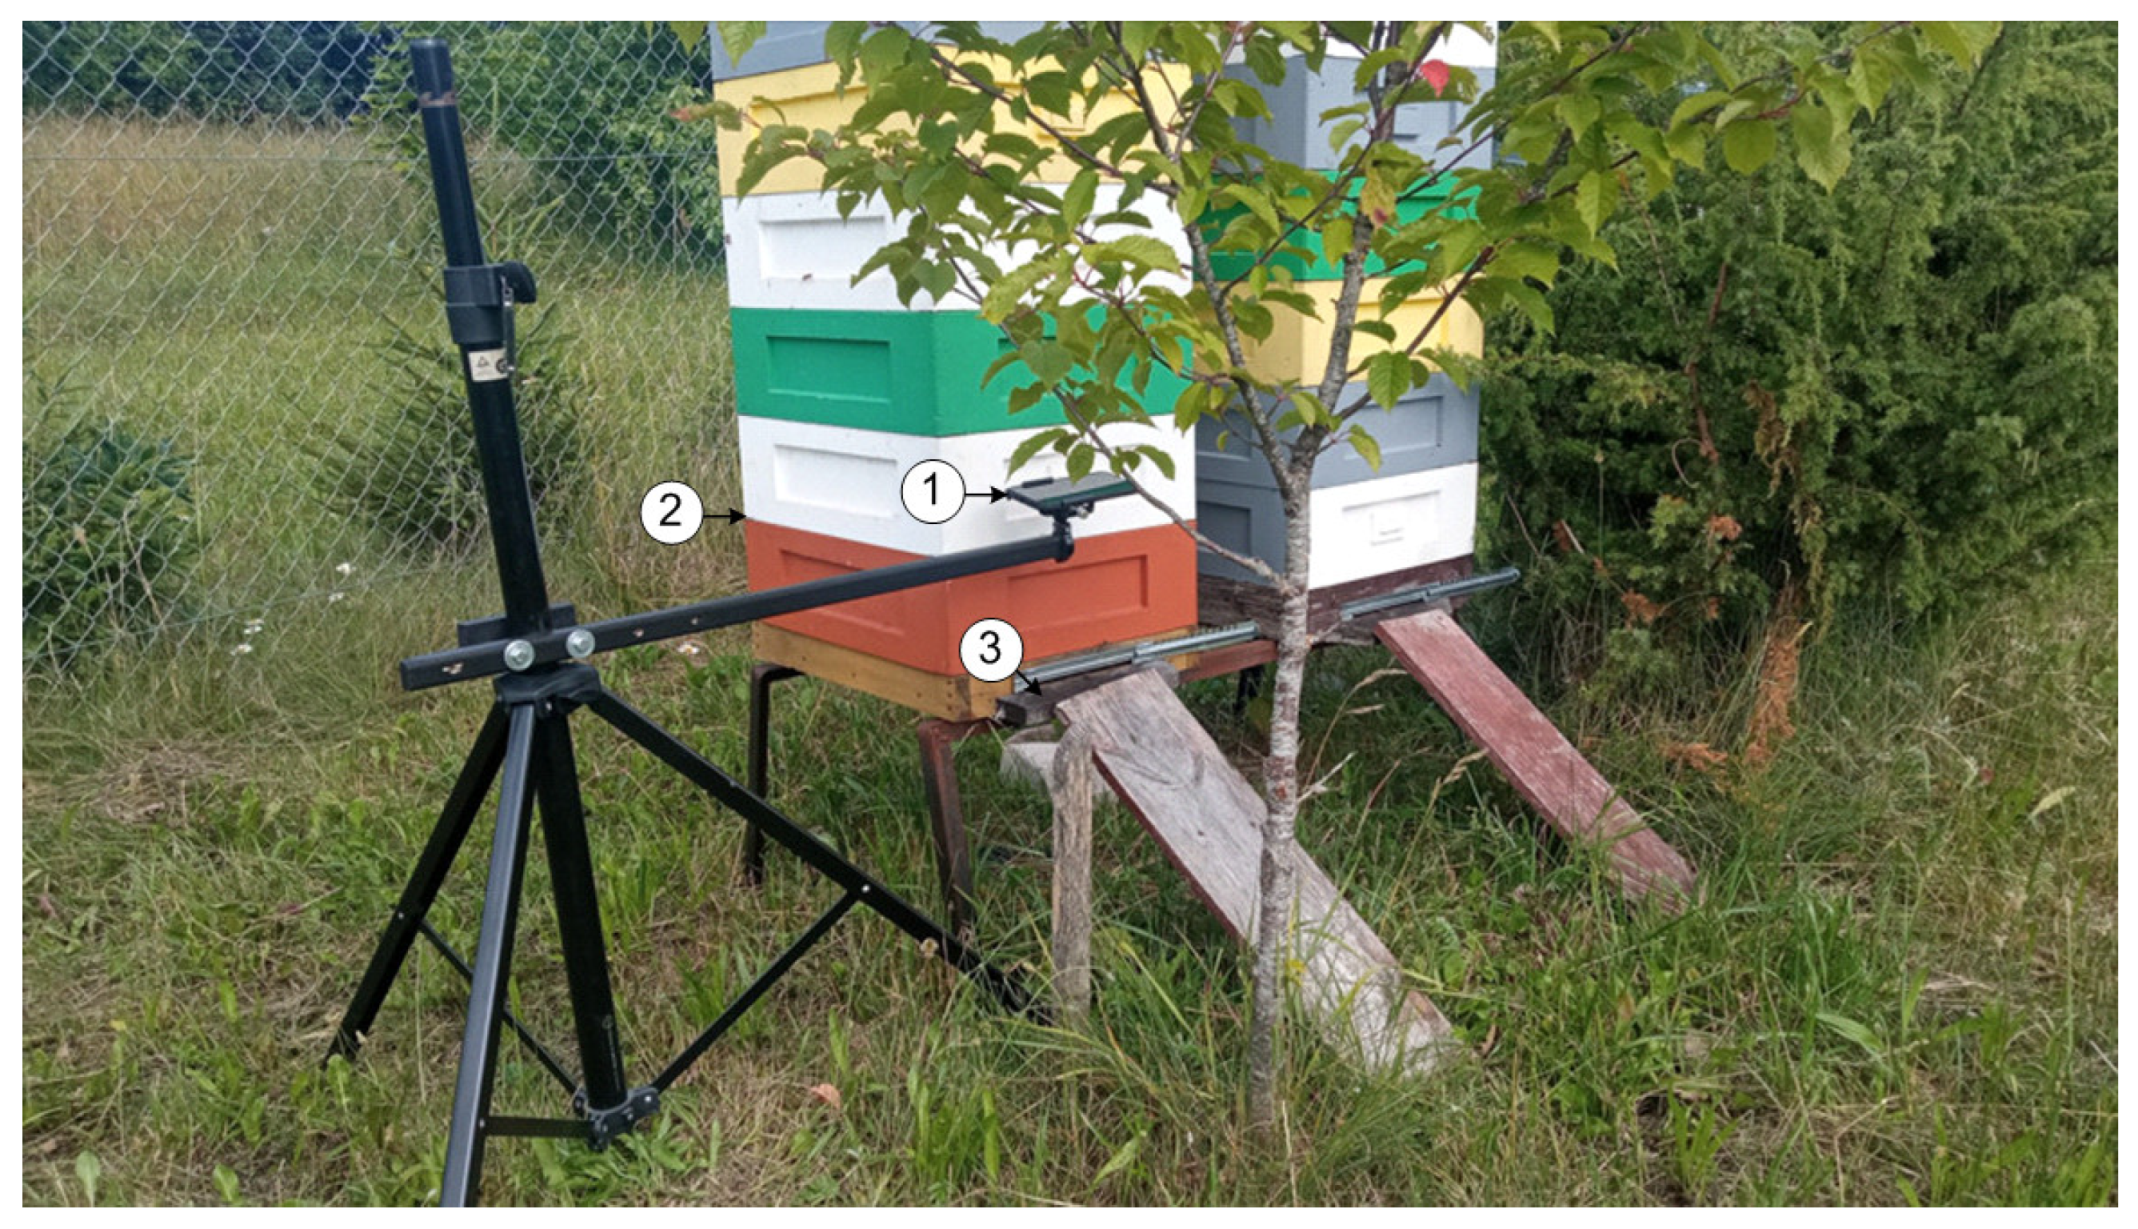
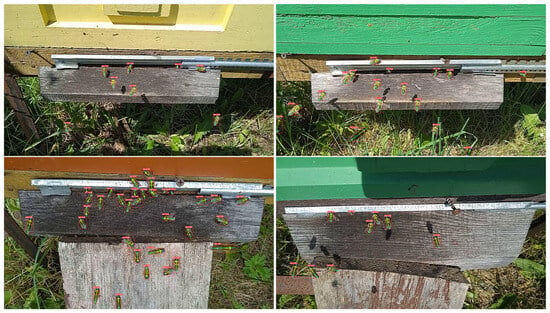
To create the datasets, videos of hive landing boards were recorded in local apiary in the Vilnius district in the 2018–2023 beekeeping seasons. The footage was captured at px and 50 fps, from a height of 30 cm above eight beehive landing boards for bee detection using a stationary mounted camera (Figure 2), and from 15 beehives for ramp detection using both stationary and non-stationary cameras. The videos were recorded on sunny and cloudy days, with each hive having 2 to 5 min of MP4 video captured. Frames for annotation were extracted from the raw footage. The annotated datasets are publicly available in the sub-folders “/pose” and “/ramp_detection” [16]. In the same repository, we have previously shared datasets for bee detection, segmentation, tracking, and behavior recognition.
Figure 2.
Data acquisition on apiary. (1) Camera, (2) beehive, (3) entrance ramp.
3.1. Bee Detection
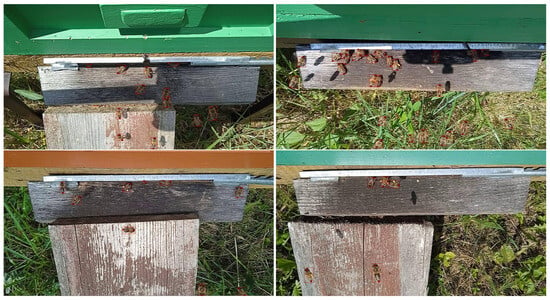
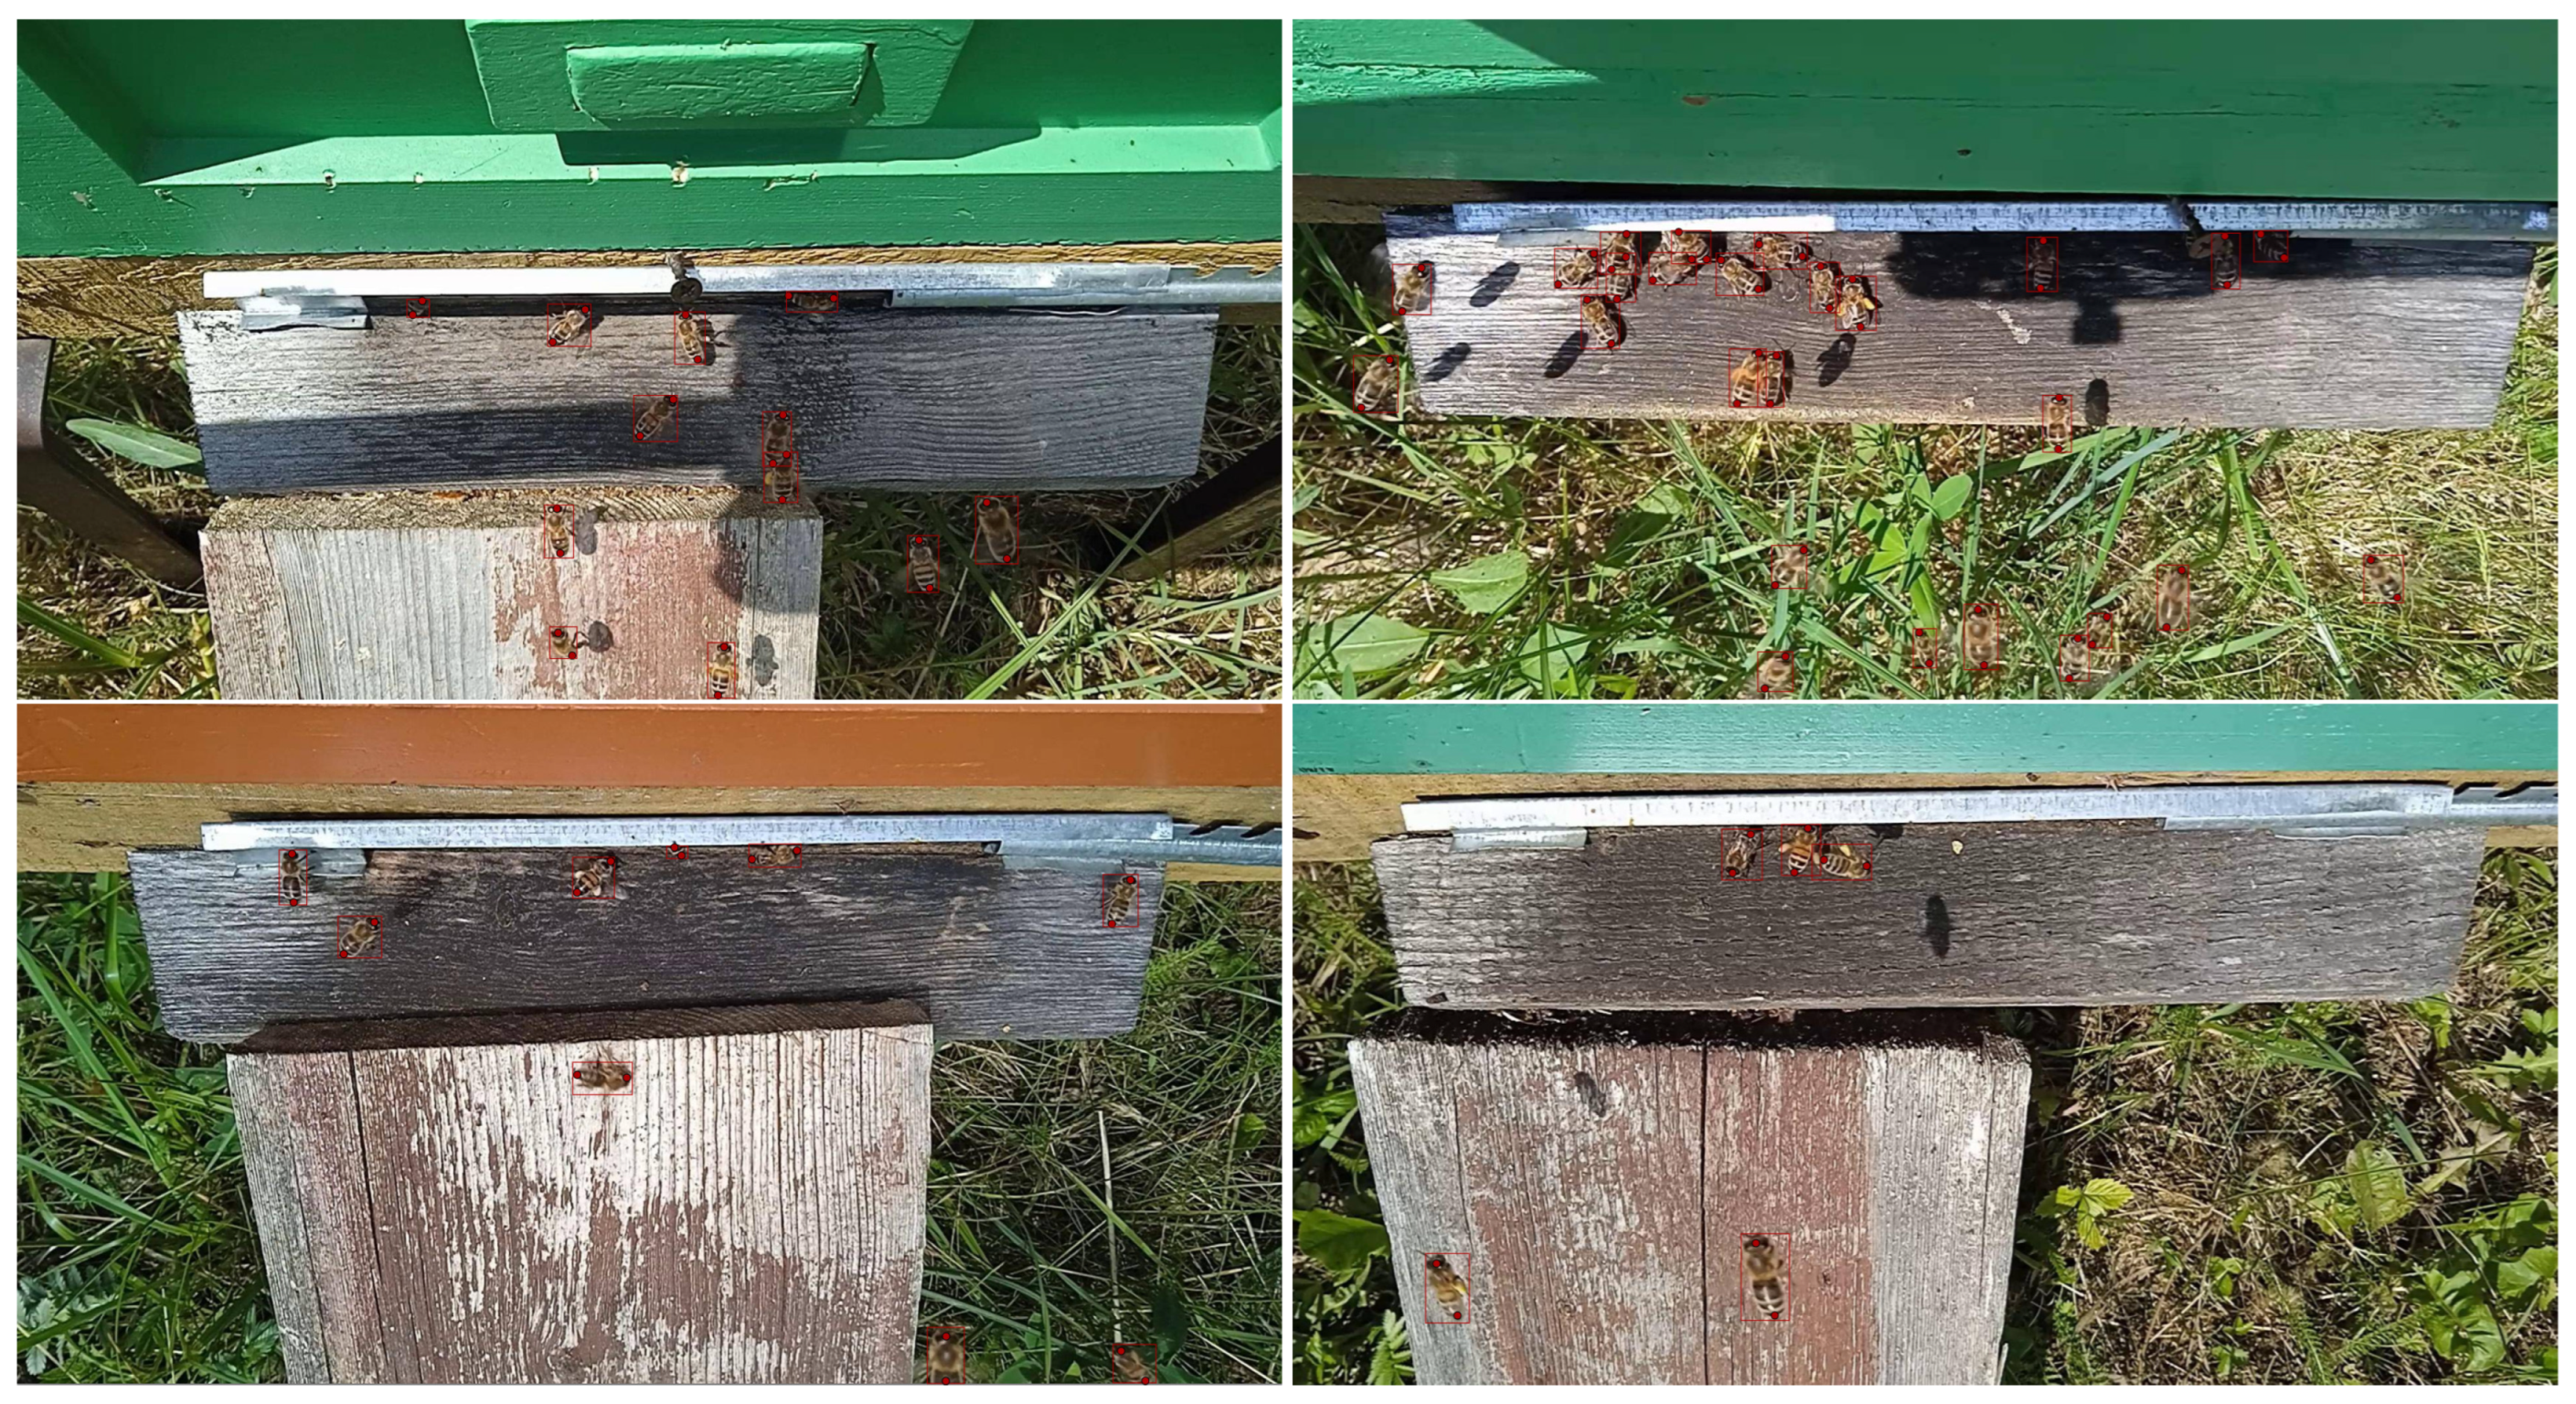
Various sizes of keypoint extraction models (YOLOv8-pose) are utilized for estimating bee direction. The dataset includes 400 images of eight beehive entrances, with 50 frames per beehive, and an average of nine bees per frame, each bee annotated with two keypoints. Annotations are saved in YOLO format. For fully visible bees, the first keypoint marks the head, while the second marks the stinger. For partially visible bees (on the entrance hole and on the frame border), the first point represents the front part, and the second point marks the back side (Figure 3). This labeling enables direction estimation even for partially occluded bees. The pose dataset annotation format is structured as follows: , where represent the center coordinates of the bounding box, and represent its width and height, respectively.
Figure 3.
Bees are annotated with bounding boxes and two keypoints for orientation estimation. The first point marks the head, and the second point marks the stinger. If the bee is partially occluded, the keypoints are placed on the visible body parts in front and back.
The online version of the open-source computer vision annotation tool (CVAT) [32] was used to prepare the dataset for estimating bee direction. Several annotated frames in CVAT are shown in Figure 3. During labeling, all bees are annotated with rectangle-shaped bounding boxes, and two points are assigned: one for the head and one for the stinger. If the head or stinger is not visible, the frontmost or rearmost part is marked with a point. The annotations are exported in XML format and processed with a custom application implemented in Python-3.9.17 to associate the bees’ bounding boxes with their keypoints. Since users can annotate boxes and keypoints in random order during manual labeling, and these annotations are not linked in the exported XML file, the program merges keypoints with the nearest bounding box by calculating the distance between the center of the keypoints and the center of the boxes. The output of the algorithm generates annotations in YOLO format.
3.2. Ramp Detection
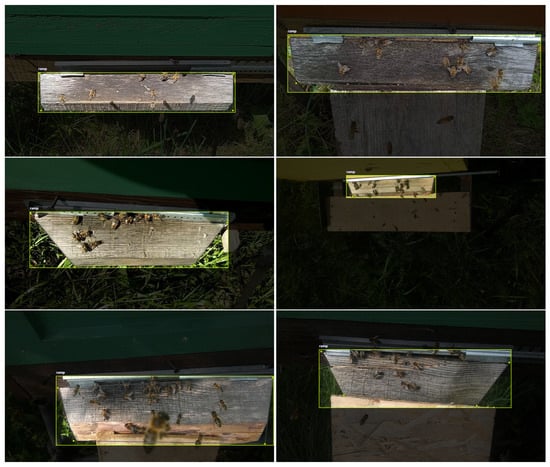
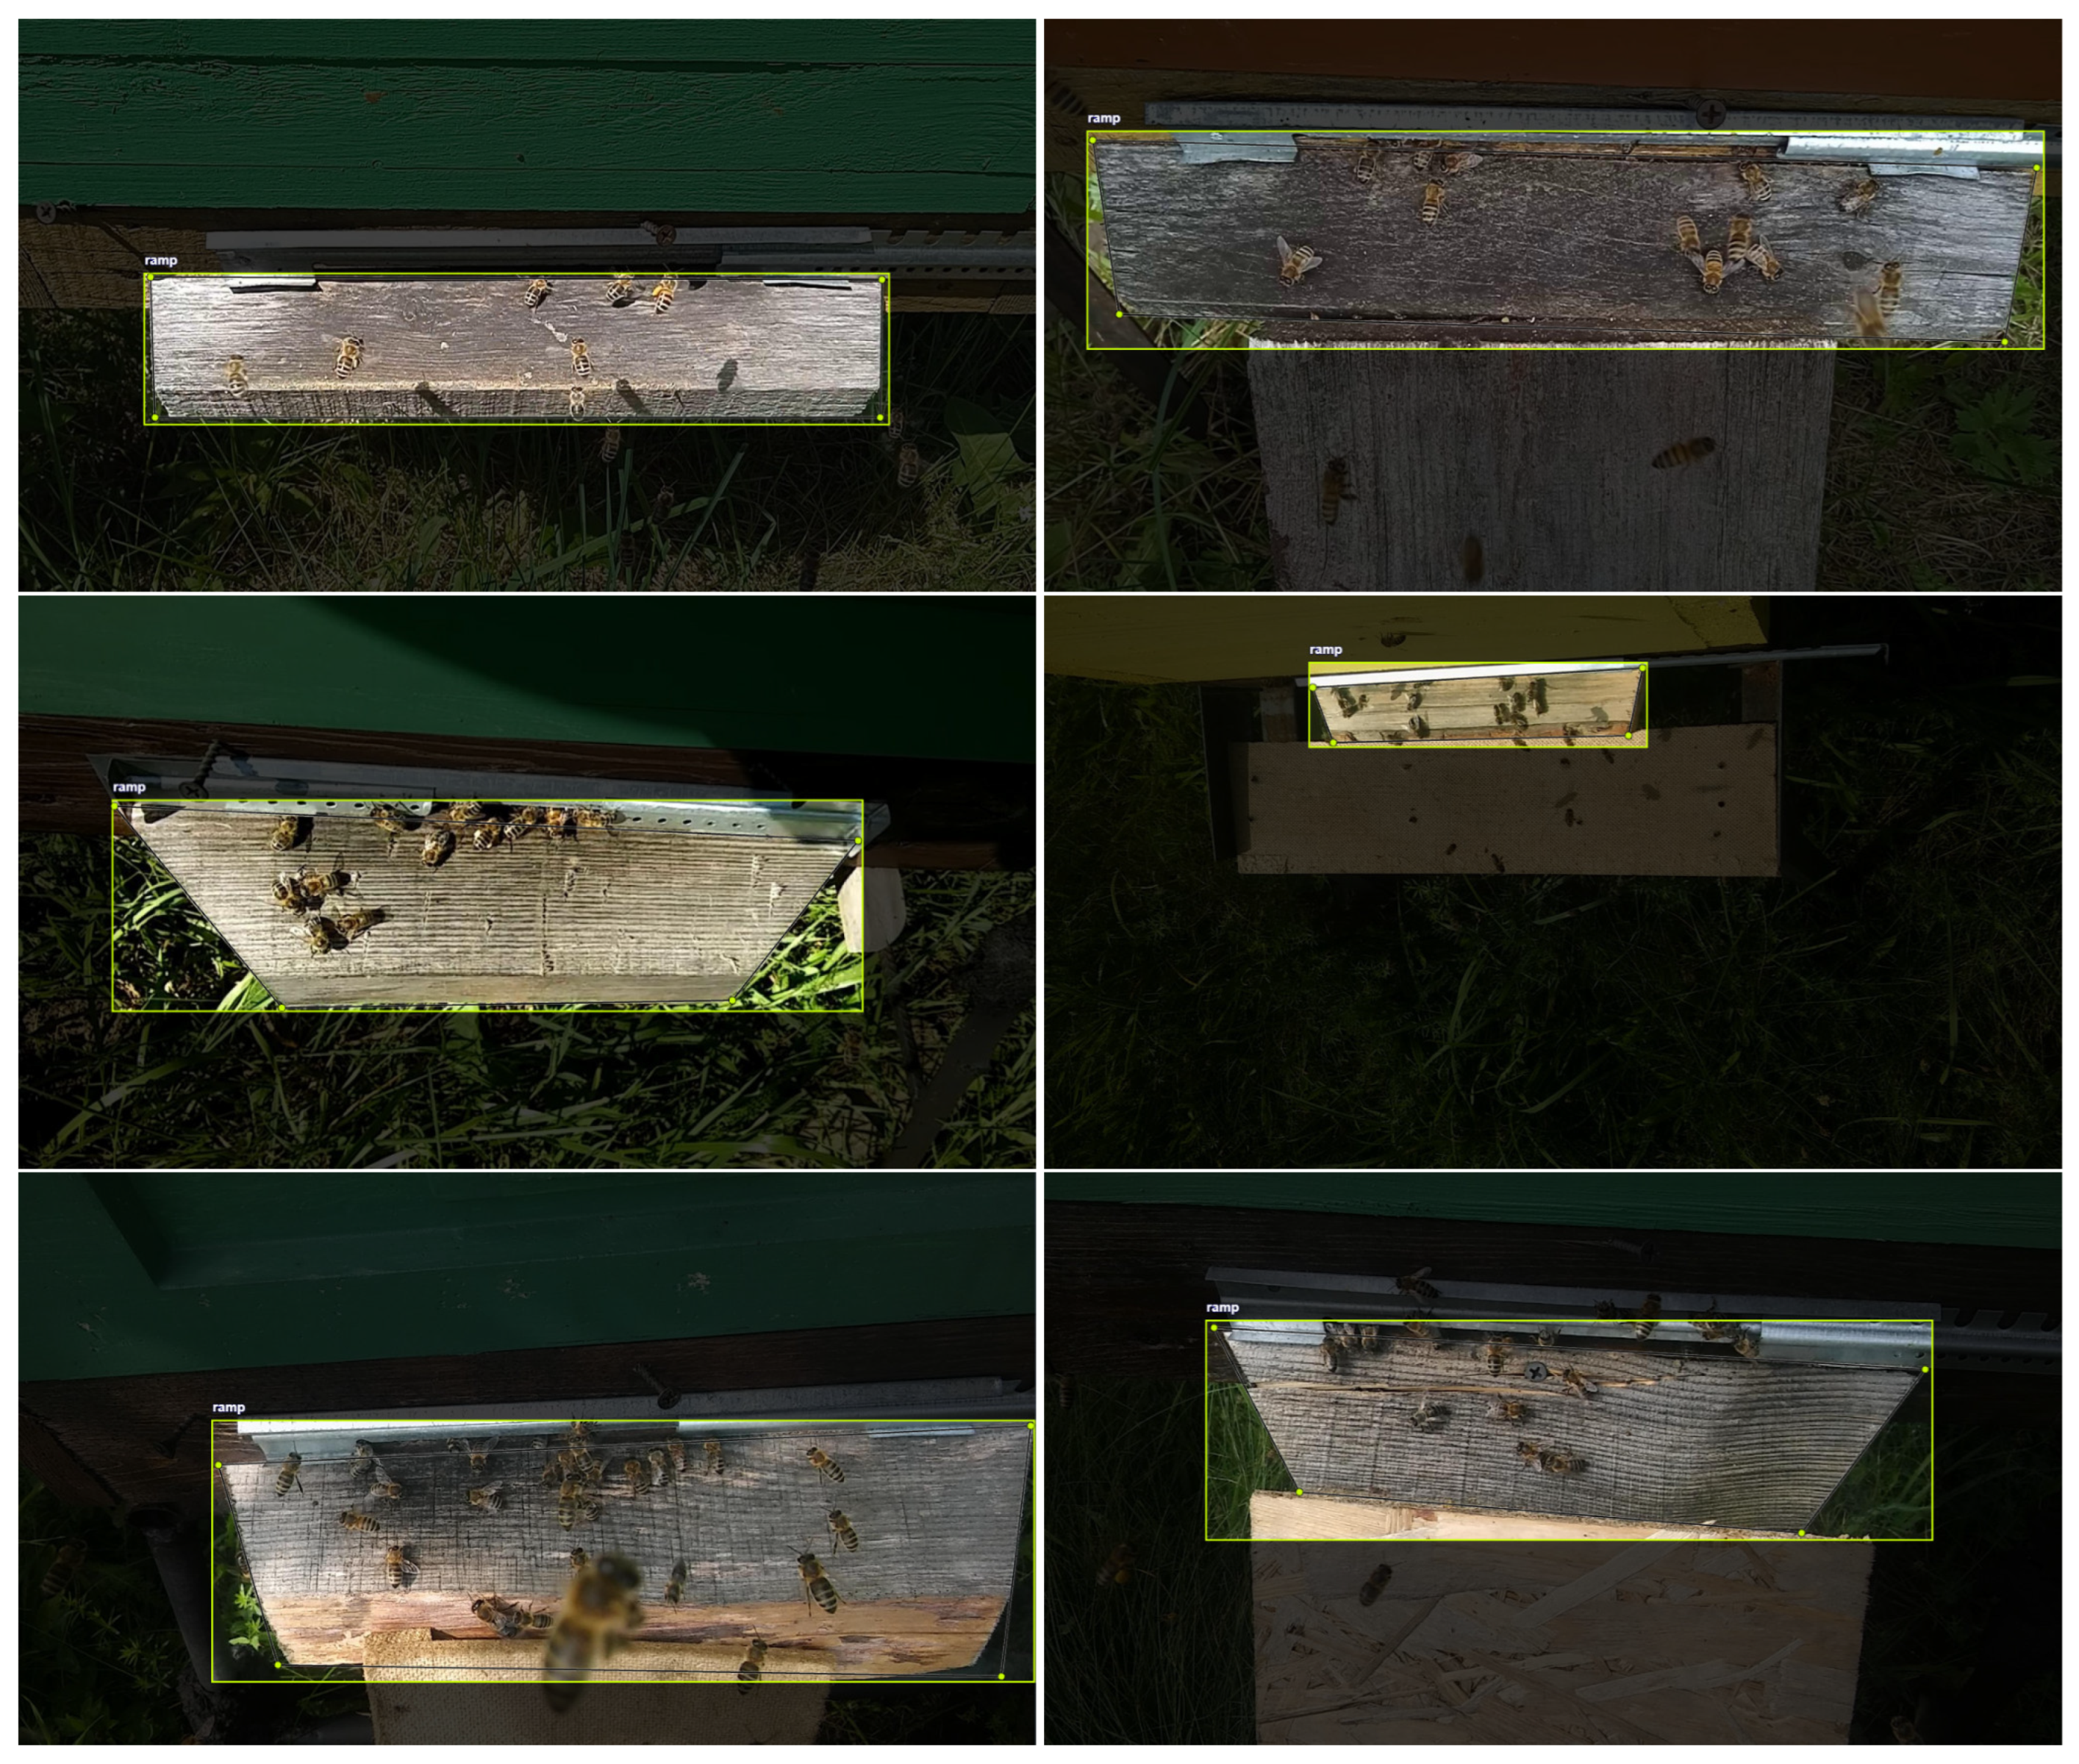
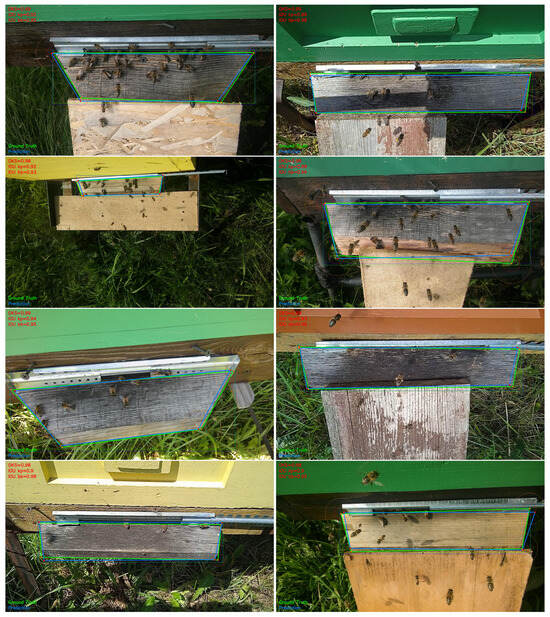
Detection of the entrance ramp is crucial for tracking bee behavior, allowing for continuous monitoring of activities such as foraging, fanning, defense, and swarming. Ramp detection will contribute to the automation of condition tracking across multiple hives, enabling an autonomous beekeeper support system to efficiently observe and analyze hive entrances, gather data, and report unusual conditions. For landing board detection, we collected and annotated a dataset of entrance ramps from 15 different beehives, which contains a total of 156 images [16]. Eight entrance ramps were taken from the bee detection dataset, and seven were collected from new beehives in the same apiary. The entrance ramps are often trapezoidal, rather than rectangular, and are therefore annotated with both rectangular bounding boxes and four keypoints at the corners (Figure 4). Compared to bounding box-based detection, localized keypoints allow for a more precise reconstruction of the ramp’s shape, even when the ramp in the image is rotated or distorted. This is particularly important when the camera is moving, as it is often not perfectly aligned with the landing board.
Figure 4.
Sample images of annotated entrance ramps with bounding boxes and keypoints.
Depending on the size and shape of the landing board, the area of the zone can be represented by a polygon of various forms, not necessarily constrained to four keypoints. Preliminary analysis of bee behavior at the hive entrance suggests that having multiple zones, particularly above the landing board during instances of robbing or swarming, can be beneficial for identifying distinct patterns of behavior exhibited by bees [33,34]. In this work, bee behavior was investigated solely within the landing board zone.
3.3. Model Description
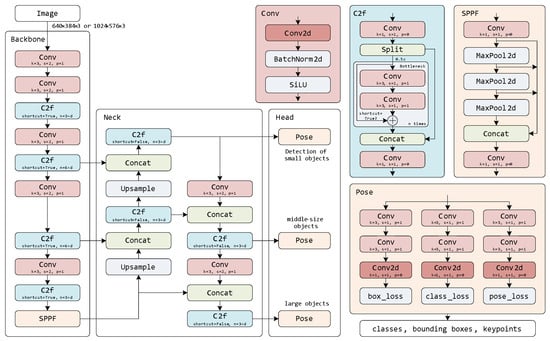
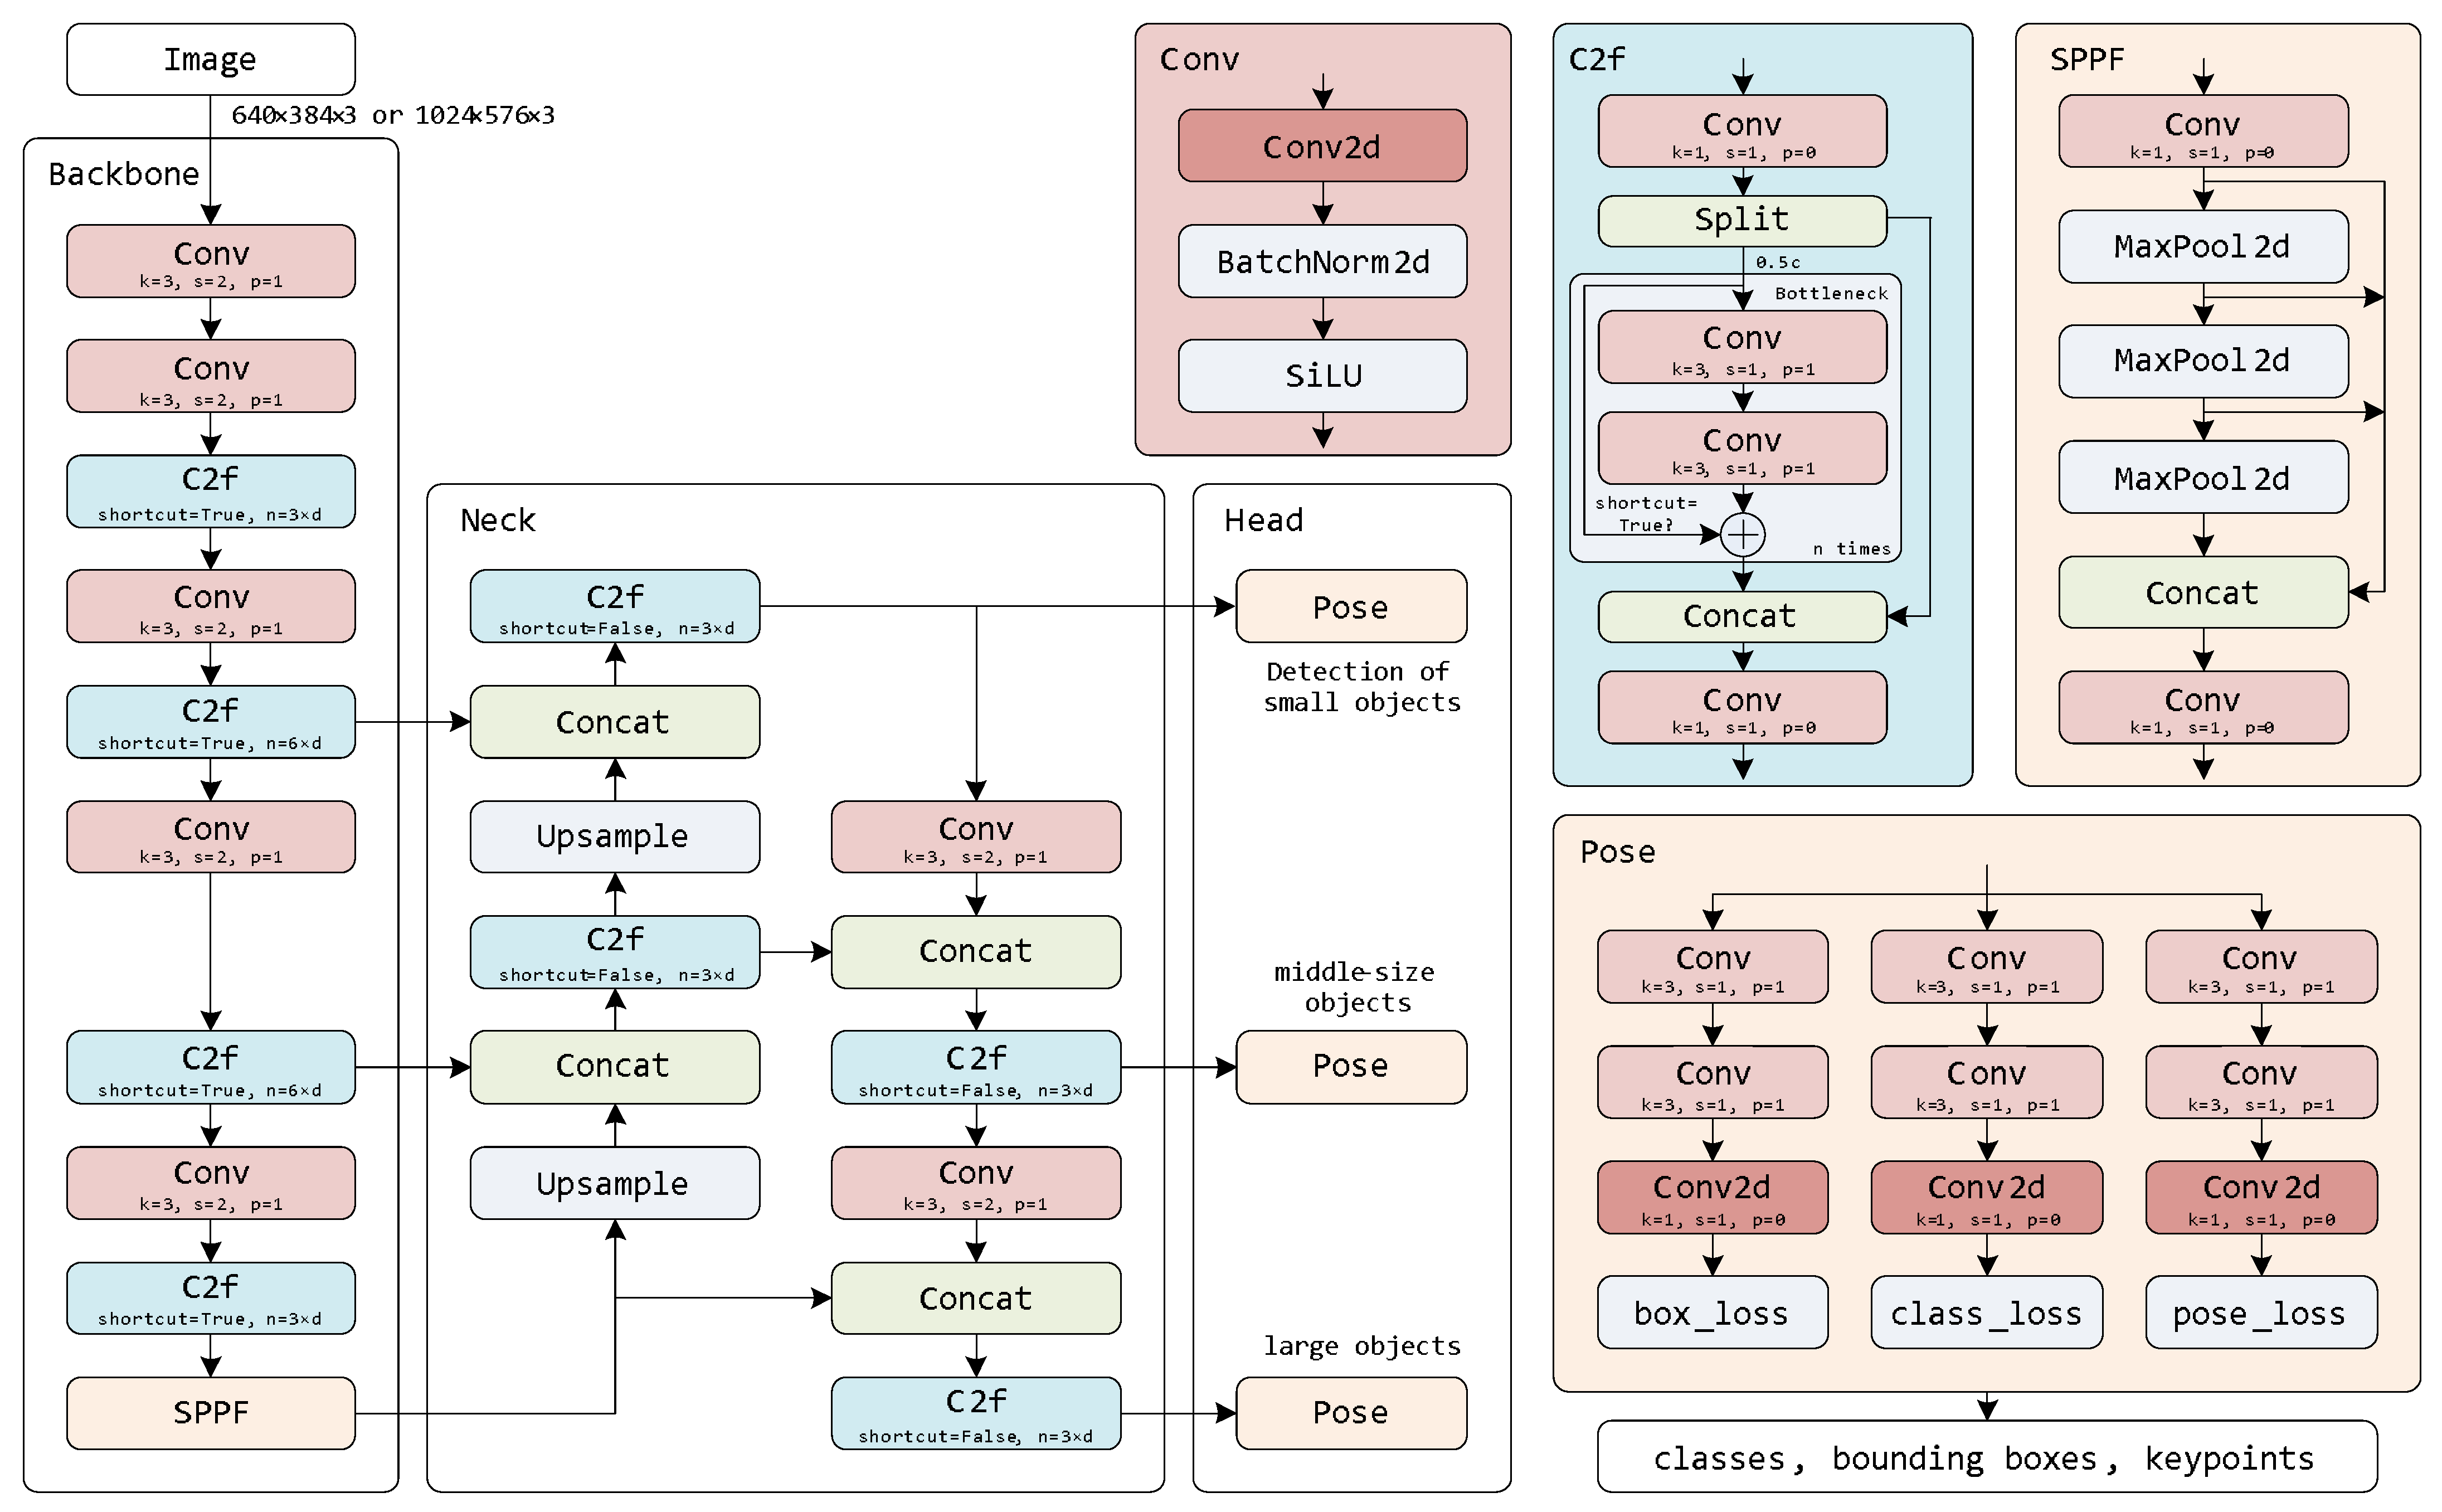
Figure 5 presents the architecture of the pose model used for detecting both bounding boxes and keypoints for bees and entrance ramps. The model was configured for two input resolutions: px and px. The model consists of three blocks: backbone, neck, and head. The backbone acts as a feature extractor, utilizing convolutional and C2f units, depicted in red and blue, respectively. The convolutional unit computes 2D convolution, normalizes the batch output, and applies the Sigmoid Linear Unit (SiLU) activation function. The k parameter defines the size of the 2D kernel, s is the convolution stride, and p represents the padding. The C2f unit contains multiple convolution blocks, with the total number of convolutional layers in the C2f depending on the depth multiplier d of the model. In this study, the nano, medium, and large models have depth multipliers of 0.33, 0.67, and 1, respectively. In the C2f unit, the bottleneck block is executed or times, with the shortcut path enabled or disabled, as shown in the C2f unit. The backbone concludes with the Spatial Pyramid Pooling Fast (SPPF) unit, which contains three max pooling layers and two convolutional layers [35].
Figure 5.
The architecture of the YOLOv8 pose model used for detecting both bounding boxes and keypoints for bees and entrance ramps.
In the neck block, the number of channels is summed up using the Concat unit, while the resolution of the feature maps remains unchanged. The Upsample unit increases the resolution of the feature map by a factor of two to match the size of the concatenated outputs from the C2f units. The head is the final part of the network and consists of three pose units designed to detect objects of different sizes. Each pose unit predicts object classes, the locations of bounding boxes, keypoints, and assigns confidence scores to each bounding box.
3.4. Evaluation Metrics
YOLOv8 pose models were trained on the proposed dataset for ramp detection and evaluated using Intersection over Union (IoU) and object keypoint similarity (OKS) metrics. The metric to evaluate the similarity of keypoints is measured by
here, is the Euclidean distance between the ground truth and the predicted keypoint of the ramp; is the per-keypoint standard deviation; s is the square root of the ground truth object segmented area.
The score takes into account the visibility of each keypoint:
here, presents the keypoint similarity for the ith point; is the Dirac-delta function, which equals 1 if the keypoint i is visible or occluded, otherwise 0; and is the ground truth visibility flag for the ith keypoint.
The is a metric used to evaluate the accuracy of an object detection model by comparing the predicted bounding box with the ground truth bounding box. It measures the overlap between these two bounding boxes and is defined as the ratio of the area of their intersection to the area of their union:
here, Area of Overlap is the area where the predicted bounding box and the ground truth bounding box intersect; Area of Union is the total area covered by both the predicted and ground truth bounding boxes, without counting the overlapping area twice.
In general, IoU is typically computed using rectangular bounding boxes. However, in this study, the shapes of entrance ramps are not perfect rectangles. To account for irregularly aligned and rotated ramps, the ramp detection precision is evaluated using both IoU based on rectangular bounding boxes and keypoints. Since four keypoints are placed at the corners of the ramp, they more accurately represent the landing board’s area compared to bounding boxes, providing a more precise measure of ramp detection.
The precision metric measures the model’s ability to correctly identify only the relevant objects, which in this study are the bees and entrance ramps. It represents the proportion of correct positive predictions and is quantified by the following equation:
where are true positives; are false positive predictions.
The mean Average Precision (mAP) measures how well the model detects objects and is based on the IoU score between the predicted bounding boxes and the ground truth boxes. For mAP50, a detection is considered correct if the IoU between the predicted and ground truth box is at least 0.5, meaning that the boxes overlap by 50% or more.
Recall is the capability of a model to locate all the relevant instances of all ground truth bounding boxes. It measures the percentage of true positives detected among all the relevant ground truths and is expressed as follows:
where are false negative predictions. Here, the detection is valid (True Positive) if the ratio of intersection over union (IoU) is above 0.5.
4. Results
The experiments were performed on GeForce RTX 2060 GPU with 6144 MB of RAM. The packages and libraries of Ultralytics YOLOv8.1.1, Python-3.9.17, torch-2.1.2 and CUDA 11.8 were used to train YOLOv8-pose models for bee and ramp detection. Nano-sized (n) and medium-sized (m) models [35] were trained on the input resolution px and px. All investigated models were trained for 400 epochs, with checkpoints of the model saved periodically. The batch size was set based on the model’s input resolution and complexity, aiming to maximize the utilization of available video RAM. For inputs of px, the batch size is 10 for the nano model and 4 for the medium-sized model. For px inputs, the batch sizes are thirty-two, twelve, and eight images, respectively, for the nano, medium, and large models. The dataset was split into 80% for training and 20% for validation/testing. All models were trained and tested on the same dataset split. Then, a new 20% subset of the dataset was assigned for validation/testing. Training was repeated five times using the same hyperparameters and training settings, with only the training and validation/test dataset splits varying.
Annotated bees have two keypoints per bee, so the keypoints–shape parameter was set to [2, 3], where 2 defines the number of keypoints and 3 defines the number of dimensions (x, y, ). For ramp detection, the keypoints–shape parameter was set to [4, 3], as the ramp has four corners to detect. For augmentation, image translation was set to ±0.1 of the image width, scaling was set to a gain of ±0.5, and the left–right image flip probability was set to 0.5. The mosaic augmentation was disabled for the final 10 epochs. The AdamW [36] optimizer, with a momentum of 0.9 and a learning rate of 0.002, was used for weight decay regularization. The total loss function used for pose model training is as follows:
here, lambdas () are loss gains that balance the contribution of each loss component to the total loss: the box loss gain – , classification loss gain – , distribution focal loss gain – , keypoints loss gain – , and keypoint objectness (confidence) loss gain – .
Figure 6 presents the precision and recall graphs. The validation loss is slightly higher than the training loss, the downward trend indicates that the model is generalizing reasonably well on the validation data. The red markers on the loss graphs indicate that after about 100 epochs, the model tends to overfit the training dataset, as the training loss becomes lower than the validation loss. To prevent overfitting, the model’s checkpoints were taken at the iteration where the training and validation losses matched. The precision for bounding boxes quickly rises from 0.75 to near 0.97 within the first 50 epochs and stays stable. The precision for pose prediction starts around 0.6 and quickly rises above 0.97, indicating good performance in accurately predicting keypoint locations.
4.1. Bee Detection
The performance of the trained models is evaluated using precision, recall, mean average precision (mAP@0.5) from the official VOC metric, and mAP@0.5-0.95 from the official COCO metric. Table 2 summarizes the precision and speed of bee detection. The medium model achieves 98% precision for both bounding box and keypoint detection at an input resolution of px. However, due to its larger size, the medium model requires more time to process the original resolution frame, detecting keypoints and bounding boxes at 15 fps compared to the nano model’s 21 fps at the same input resolution of px. Training the medium model with px input resolution took 11 min. When the input resolution is reduced to px, the medium model’s frame rate matches that of the nano model at px, though precision drops slightly from 97% to 96%. The fastest nano model processes at 23 fps with px input resolution, but with a slight precision decrease to 95% for both box and keypoint detection.
Table 2.
Results of bee box and keypoint detection after training of YOLOv8 pose models on custom dataset on RTX 2060.
Figure 6.
Training loss and evaluation metrics for the YOLOv8n-pose model for bee keypoint detection with an input resolution of px.
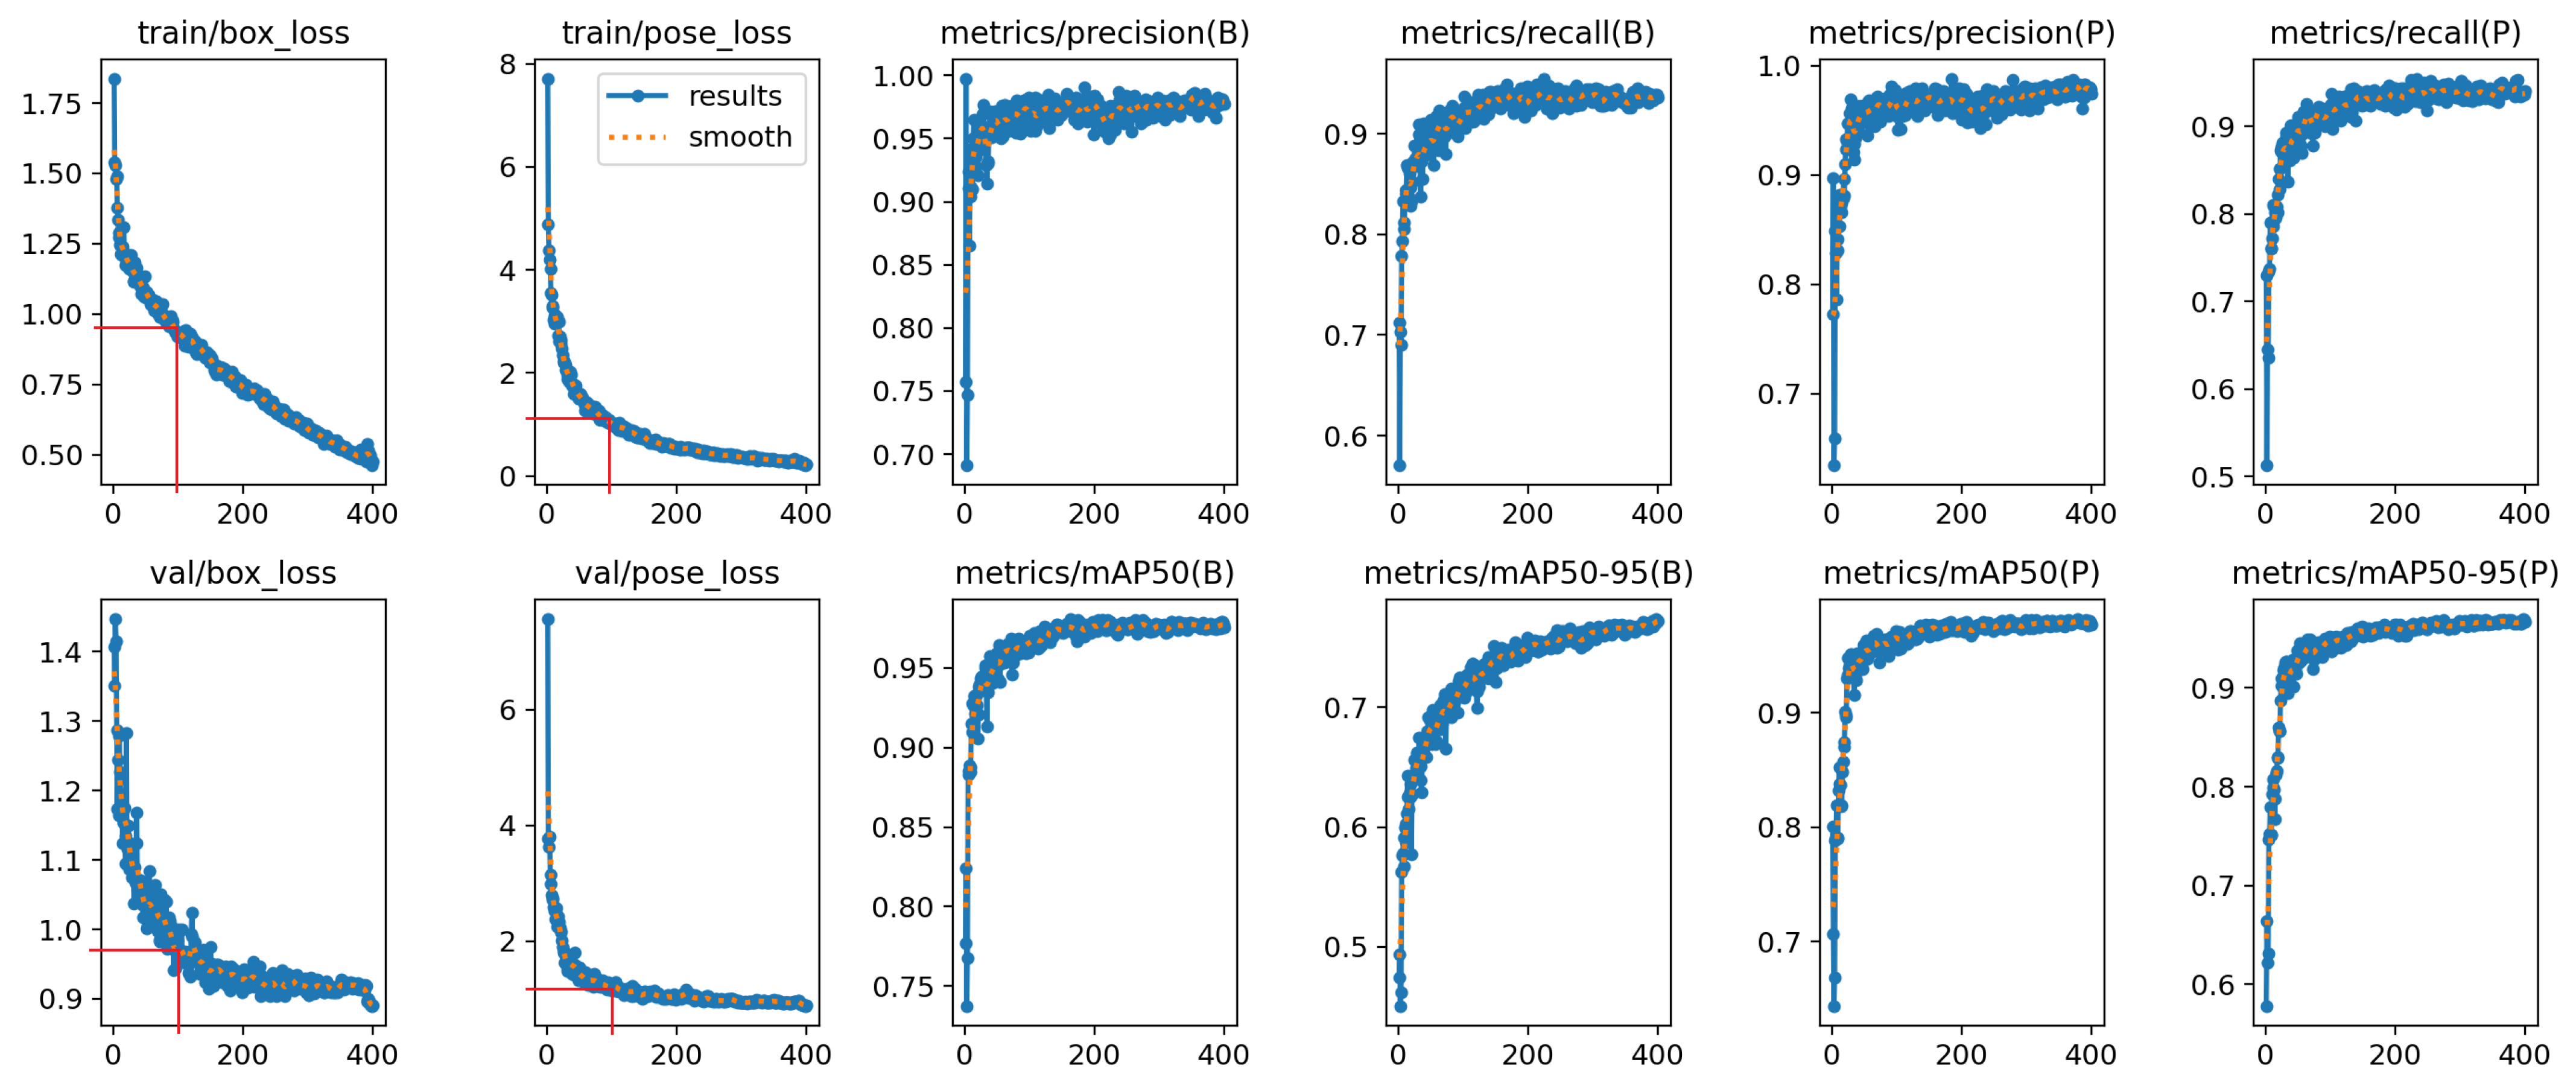
When the images were resized from the original px to match the input resolution of the model, the time per frame decreased significantly, while the precision and recall metrics remained unchanged. The YOLOv8 nano model now achieves up to 67 fps. Image pre-processing, such as resizing each frame before feeding it into the CNN, negatively impacts the overall system performance. It adds latency of 29 ms and 22 ms for the nano and medium models at px resolution, and 22 ms and 17 ms for the nano and medium models at px resolution, respectively. Therefore, for field deployment, the sensor resolution should match the model’s input resolution to avoid frame rate drops.
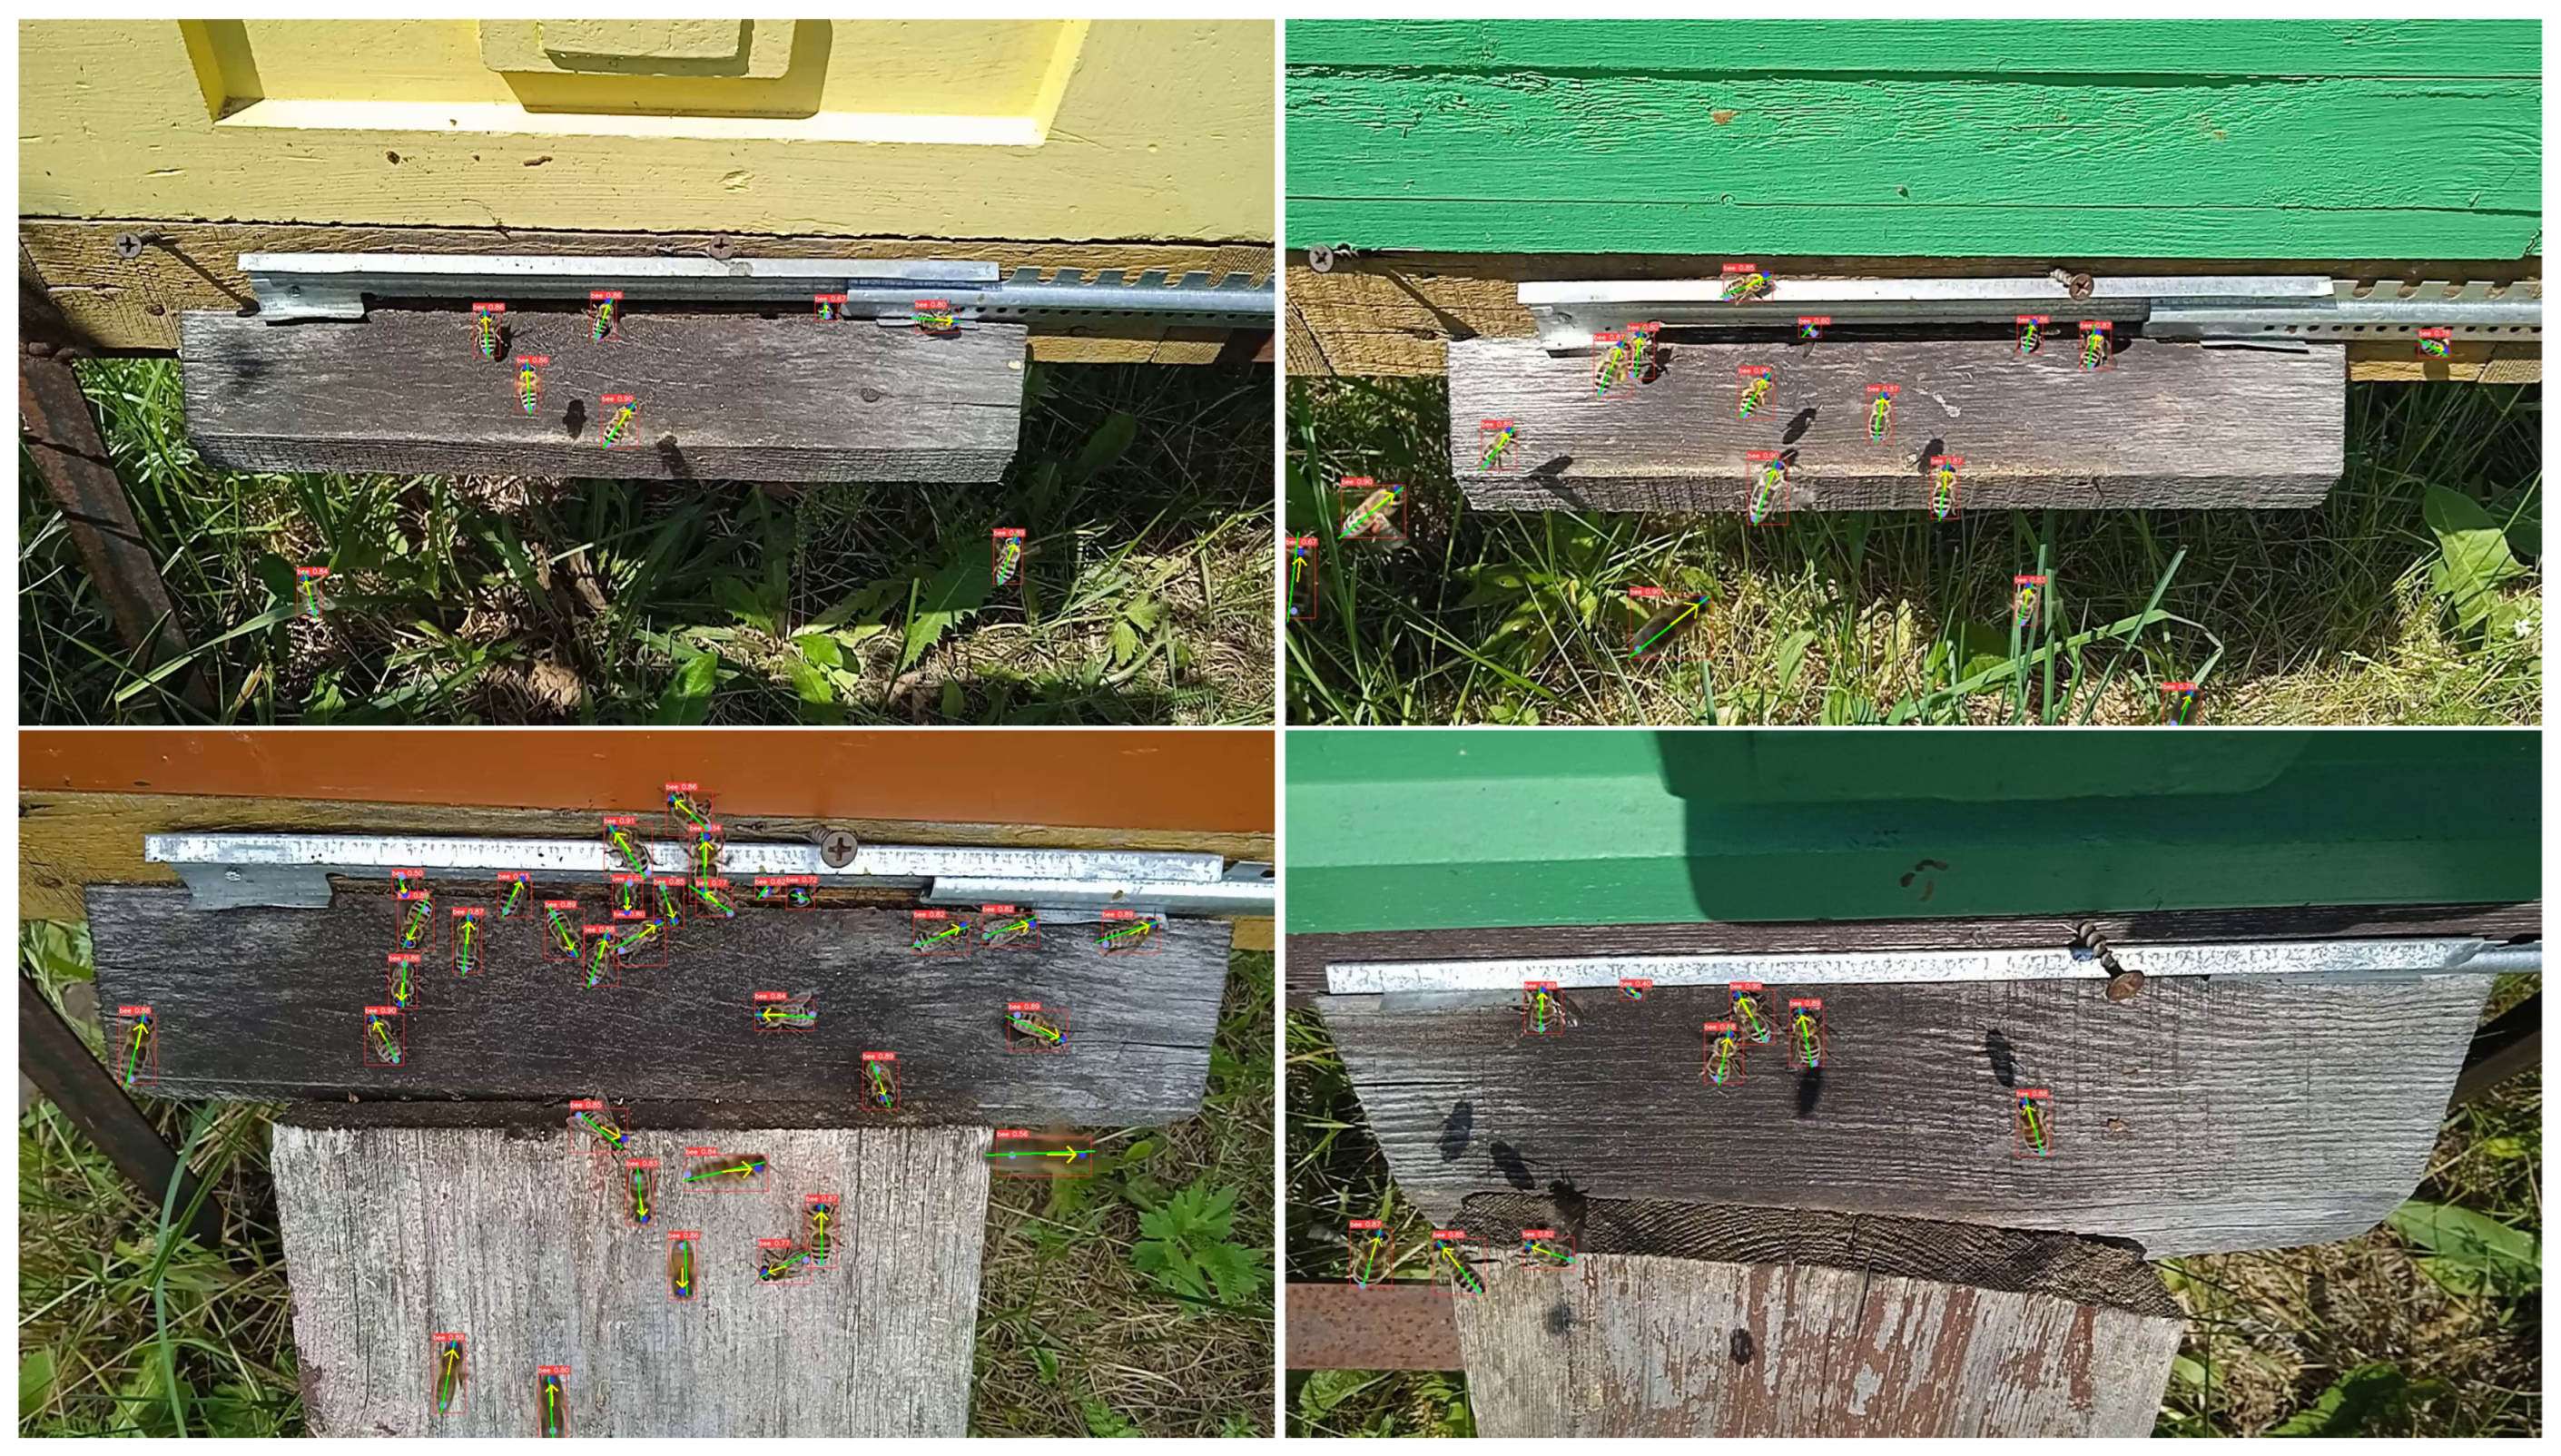
Figure 7 presents several images of entrance views with detected bees and keypoints. Visual inspection of the labeled frames shows that all bounding boxes fit the bees, and all keypoints correctly mark the head and stinger. When only part of the bee is visible at the entrance hole, the blue point accurately indicates the front part of the bee, while the violet point defines the back part of the body.
Figure 7.
Detected bees on the entrance to the beehive. Blue point marks a head, violet point marks a stinger. Green lines mark the ground truth inclination angle of bee. Predicted orientation vectors are depict with yellow arrows.
Table 3 presents a comparative evaluation of the proposed implementation with state-of-the-art methods for estimating bee orientation or pose in images. It is important to note that the first study by Smith et al. [26] used the OKS metric, while all subsequent studies used mAP. The implementations cannot be directly compared, as the authors used different datasets, CNN architectures, hardware, and image resolutions. Smith et al. [26] reported 97.7% OKS detecting the center point of the bees’ bounding box, and 33% OKS for localizing 12 keypoints on a bee. Bozek et al. [24] achieved 87% orientation precision using segmentation by calculating the centroid and first principal component, along with 96% precision in bee detection. Majewski et al. [9] reported 94% mean average precision (mAP) for bee detection; however, the precision of orientation estimation was not provided. Rodriguez et al. [25] achieved up to 99% mAP in detecting bee body parts: head, thorax, and abdomen tip—the key points used for bee pose and orientation estimation.
Table 3.
Comparative evaluation of the proposed implementation with state-of-the-art methods for bee detection, and the estimation of bee orientation (or body parts or pose detection) in images.
The dataset from the study by Rodriguez et al. [25] was used to train the YOLOv8m-pose model. The dataset was split in the same proportions as in the original article: 70% for training and 30% for validation. The test results are presented at the end of Table 3. The medium-sized pose model achieves 99% precision for detecting both bees and their body parts. The datasets from other studies were not tested in this research due to either unavailability of the datasets or format mismatch, as the pose model requires datasets specifically labeled for keypoint detection.
4.2. Ramp Detection
The investigation of bee keypoint detection presented above was conducted on the entire frame to eliminate errors related to ramp detection. Three different-sized models were trained exclusively for ramp detection in images. Similar to the training of bee detection models, the scale gain was set to 0.5, and the flip left-to-right probability was set to 0.5. Additionally, an image rotation parameter was introduced, allowing for a ±20-degree range to improve the model’s ability to recognize ramps at various orientations. Since the entrance ramp is symmetrical, the keypoint flipping index vector was set to [1, 0, 3, 2], meaning the two upper corners could be flipped with each other, as could the two lower corners. The nano, medium, and large models were each trained three times with different keypoint standard deviations. This study examined the influence of standard deviation on training time and precision. Two-thirds of the dataset were used for training, with the remaining one-third for testing. The dataset split was performed randomly. To evaluate ramp detection precision, the metrics , , and were used (Table 4). The metric measures the intersection area defined by the four keypoints, while is based on the intersection area of the rectangular bounding boxes. The last column of the table shows the epoch at which the algorithm stopped training. The highest was achieved by the YOLOv8m-pose model when , which also required the fewest training epochs.
Table 4.
IoU and OKS Metrics Detecting Beehive Entrance Ramp in Images.
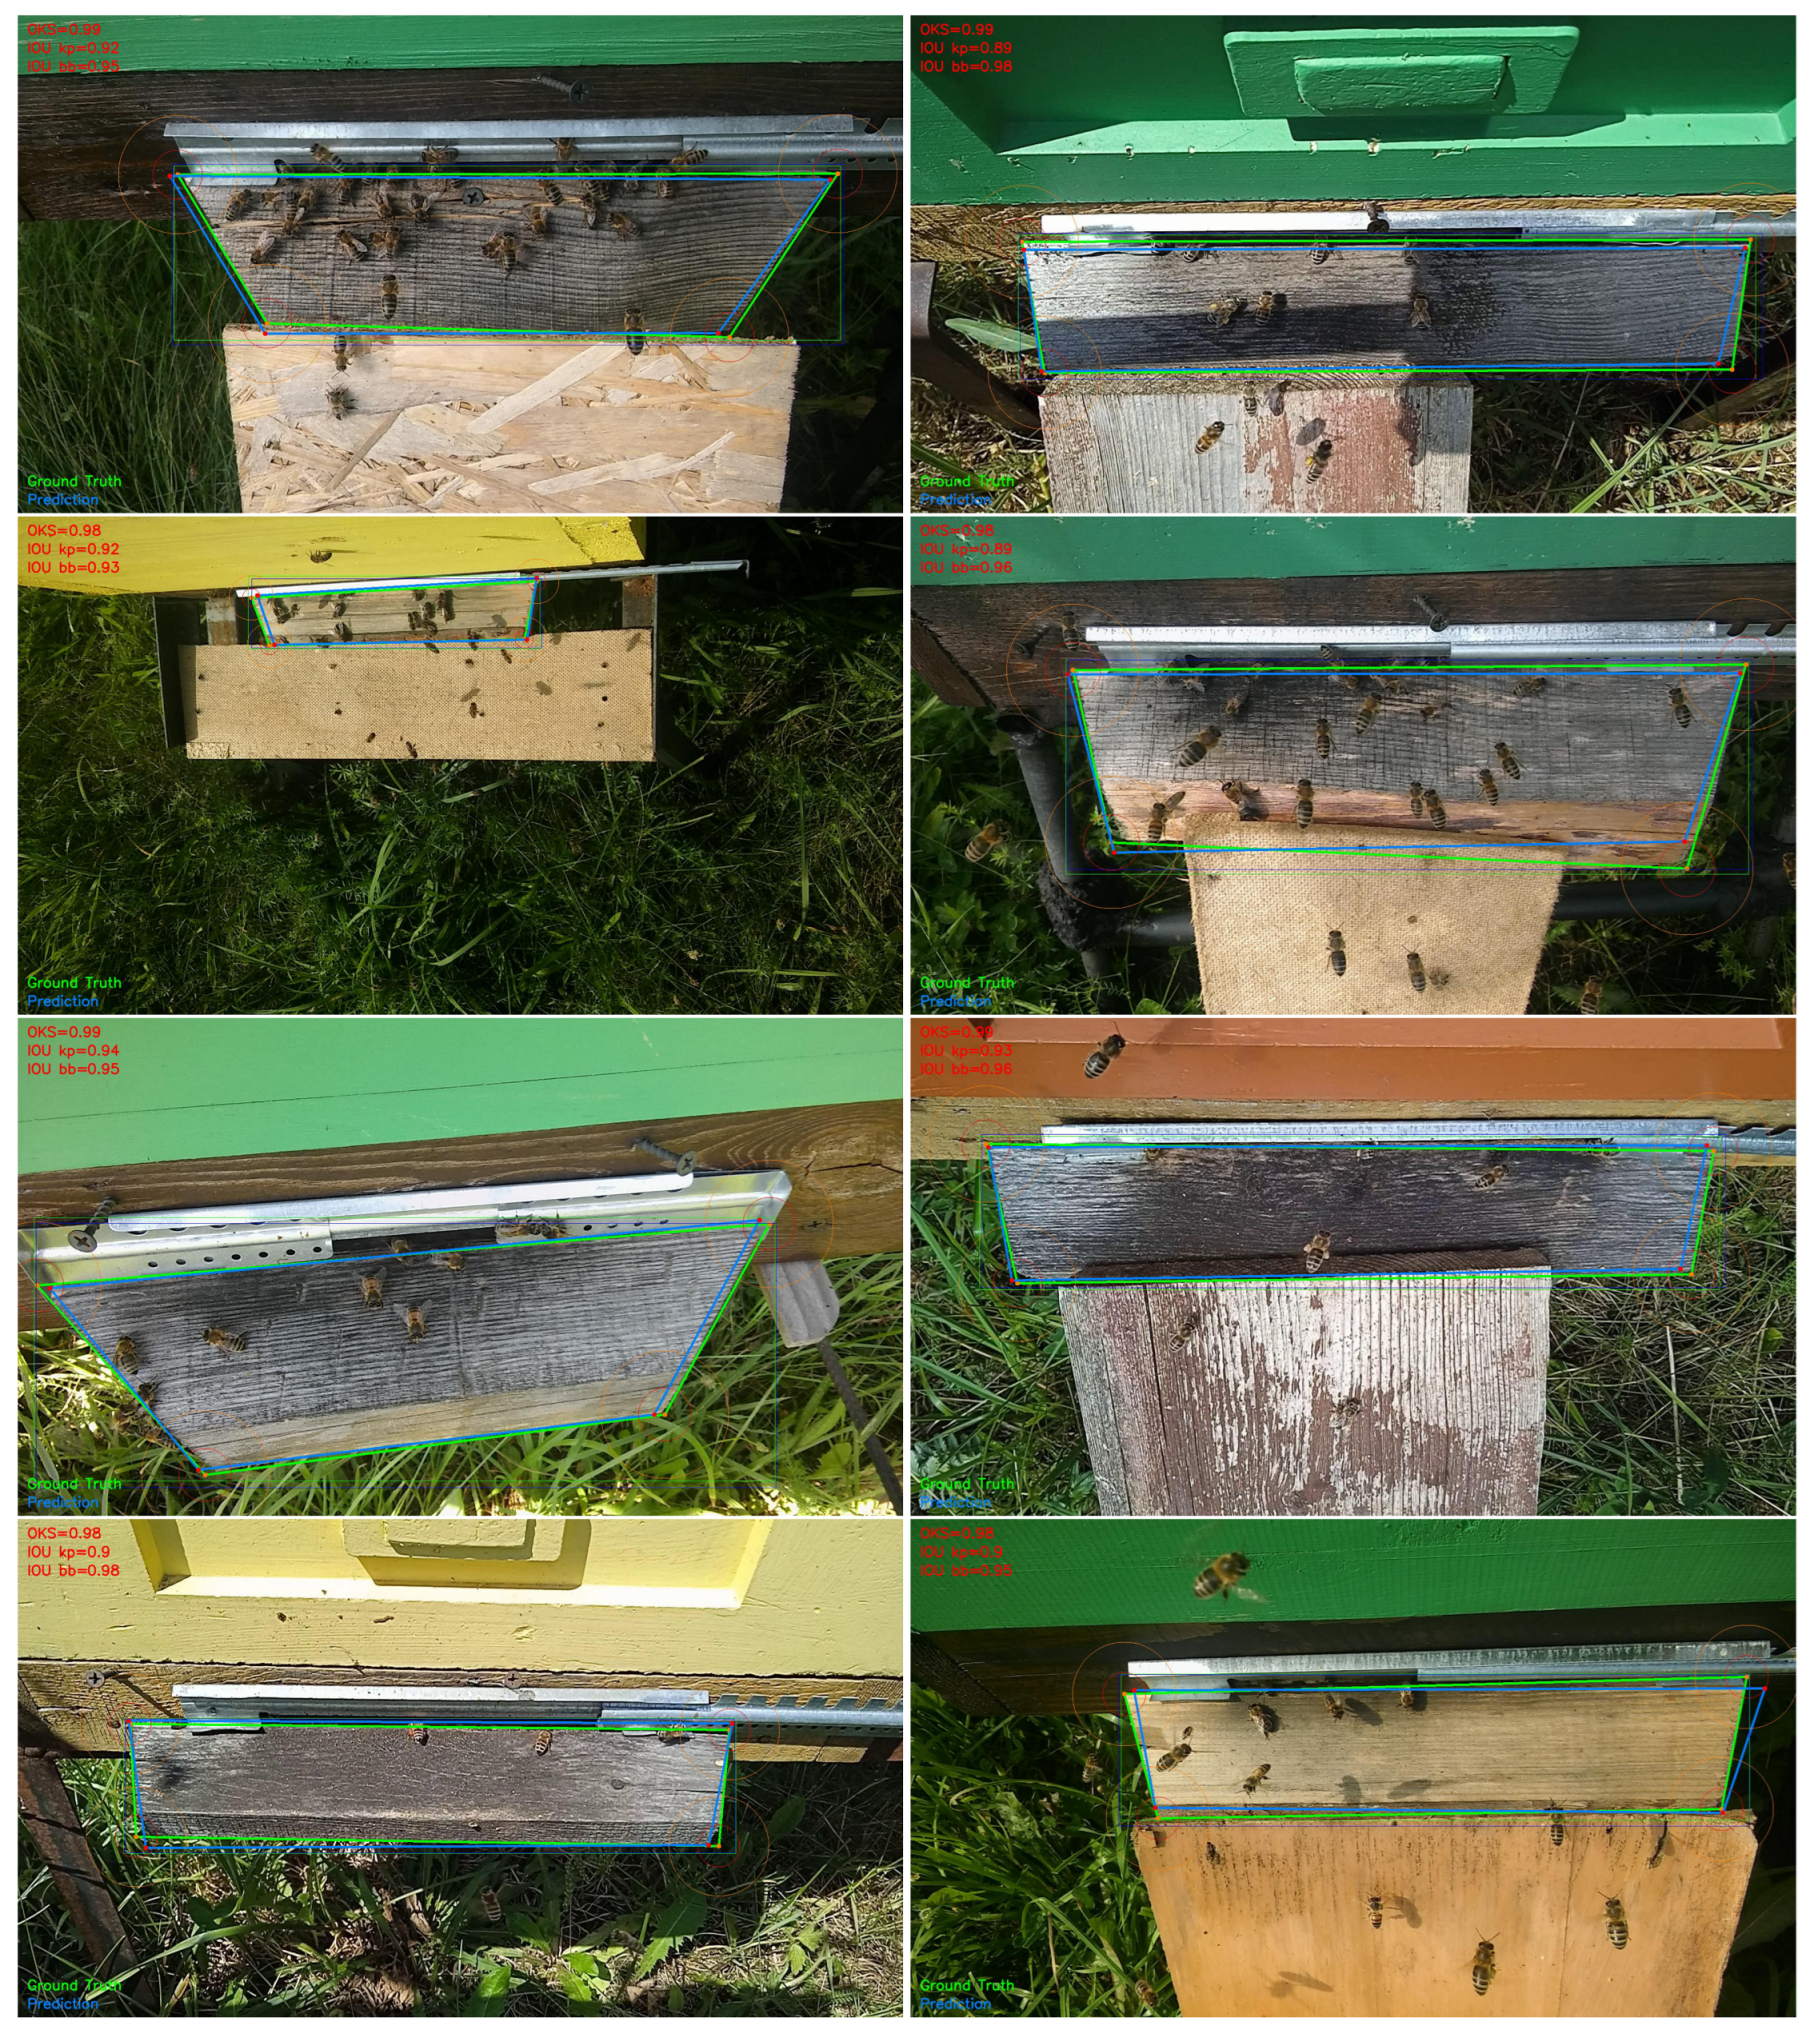
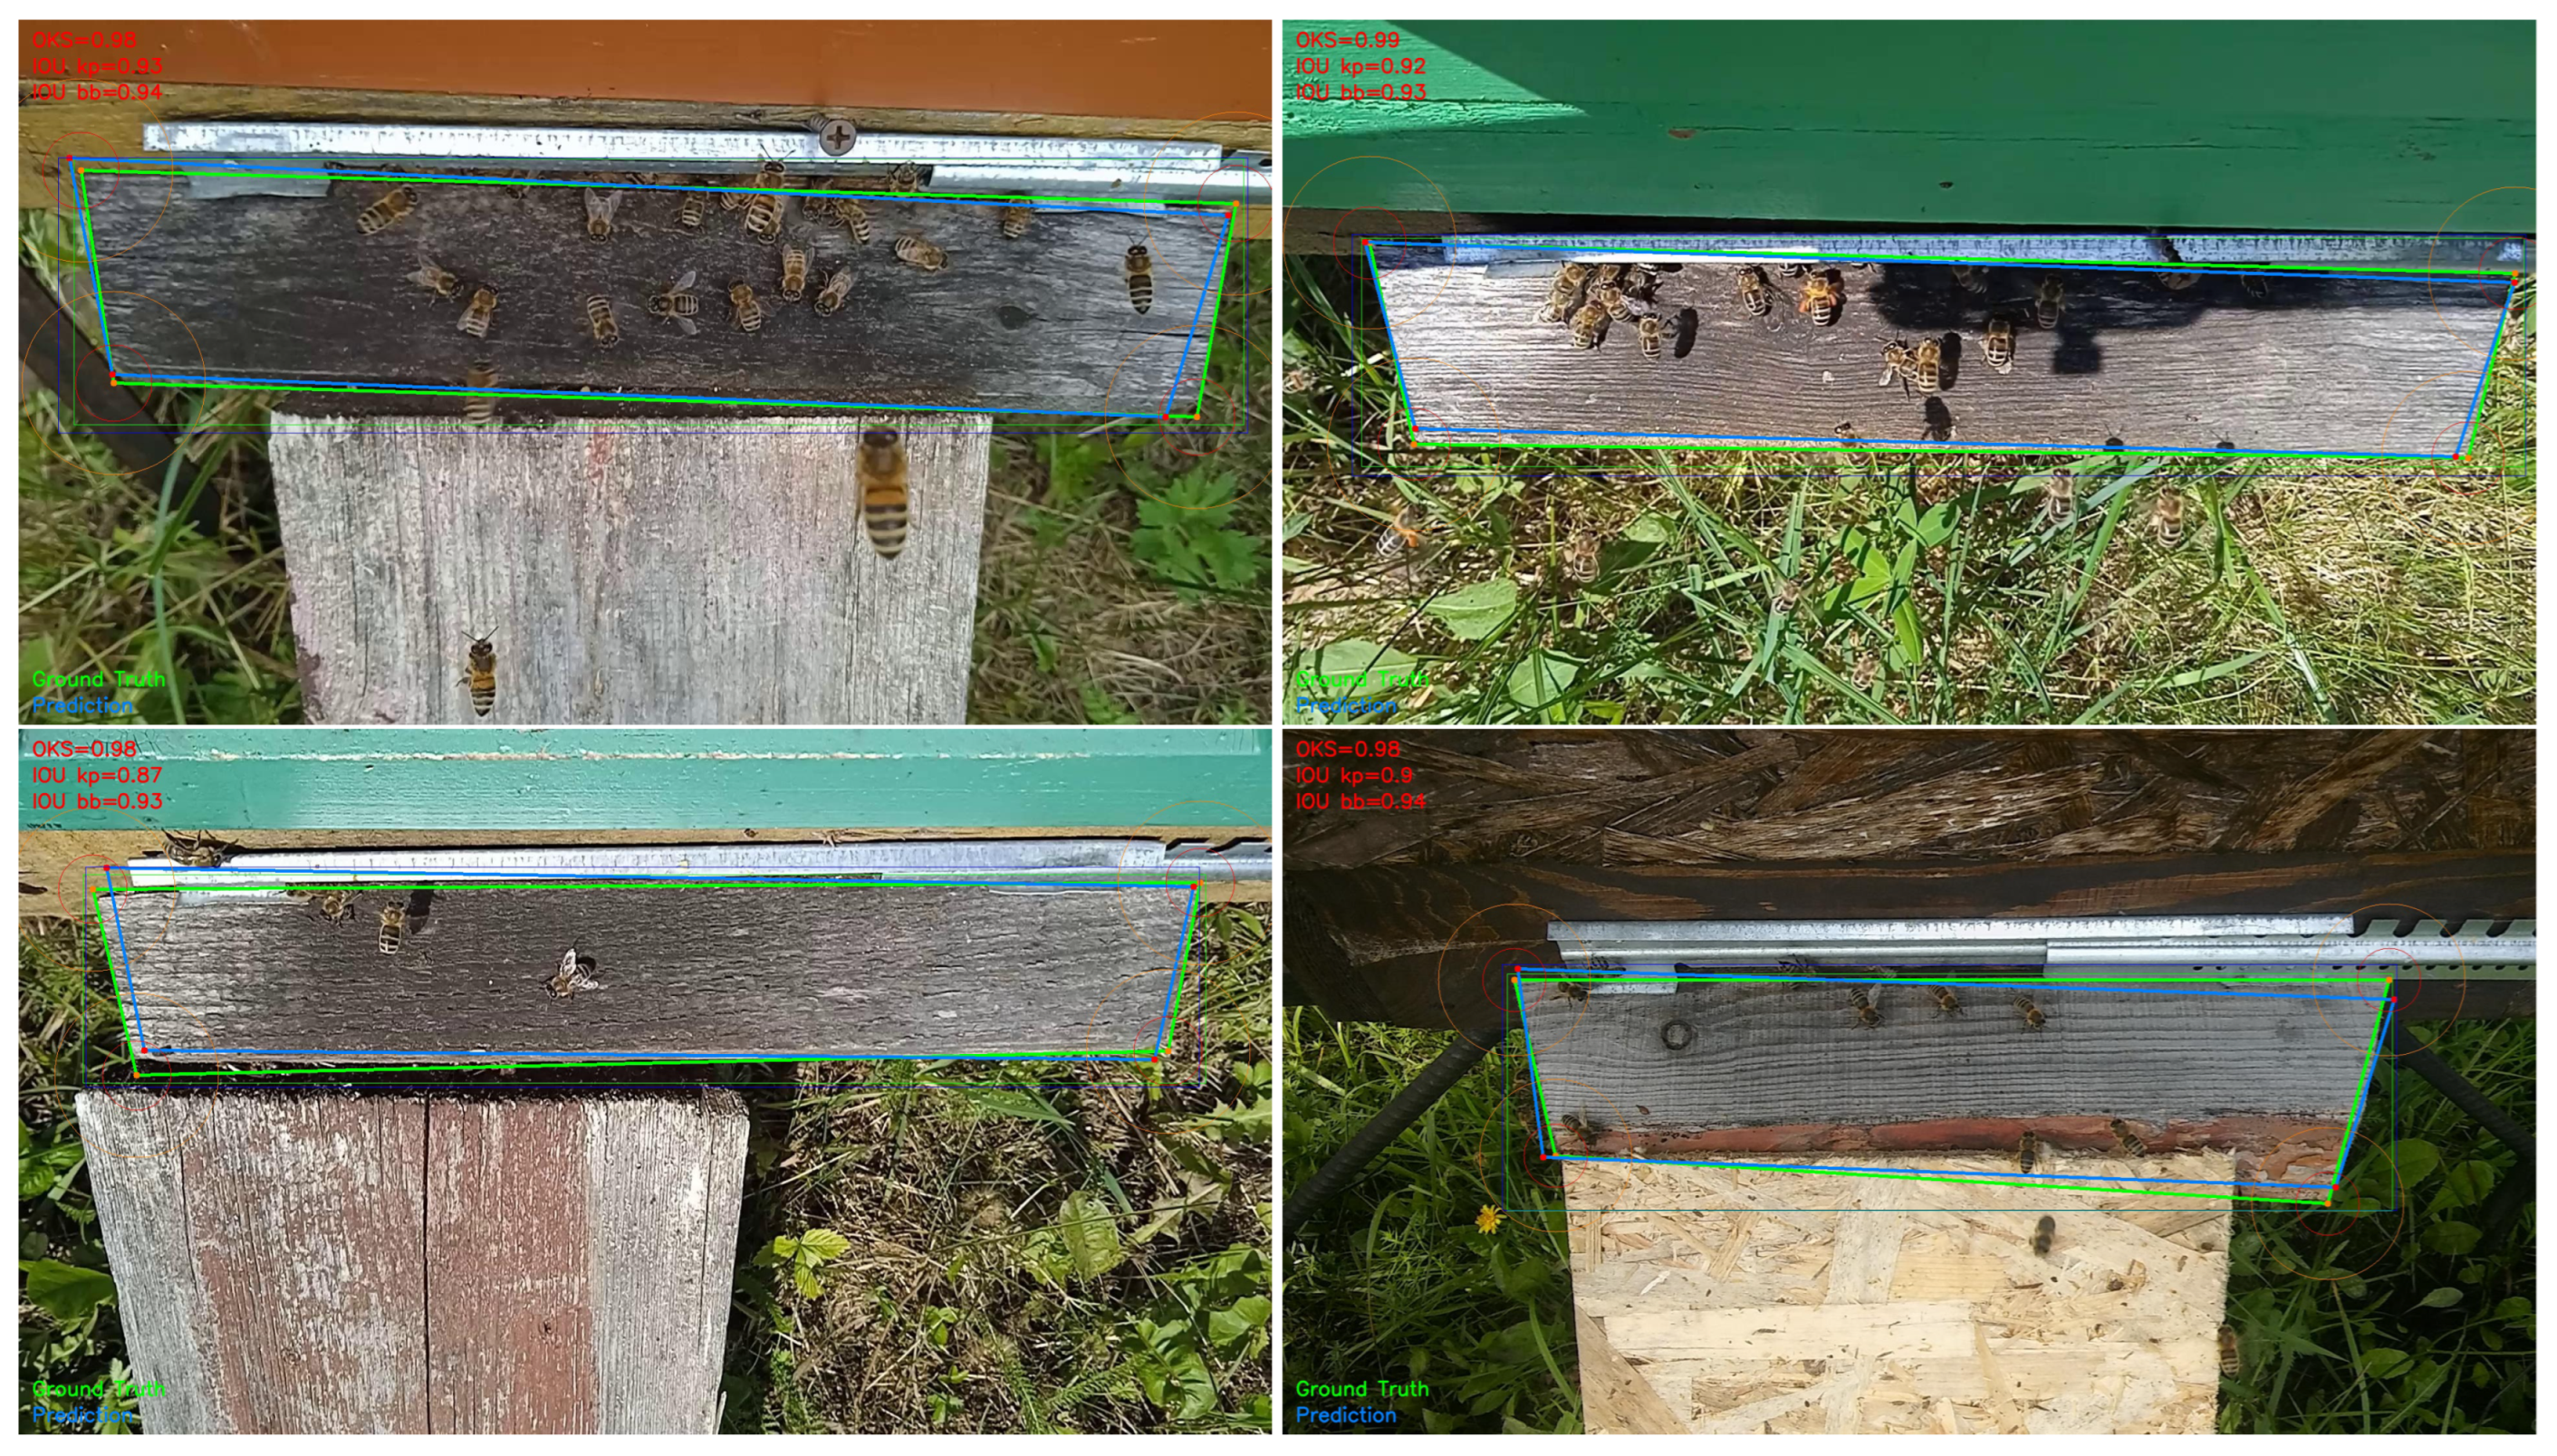
For visualization and better understanding of detection mismatches, several frames with detected ramps are presented in Figure 8. The red and orange circles indicate keypoint similarity levels of 0.95 and 0.75, respectively. The radius of each circle (measured in pixels) depends on the keypoint similarity level , standard deviation , and the area s of the ramp:
Figure 8.
Detected entrance ramps: the ground truth edges are marked in green, while the predicted ramp is marked in blue. Red and orange circles indicate OKS levels of 0.95 and 0.75, respectively, when the standard deviation is applied to all corners of the ramp.
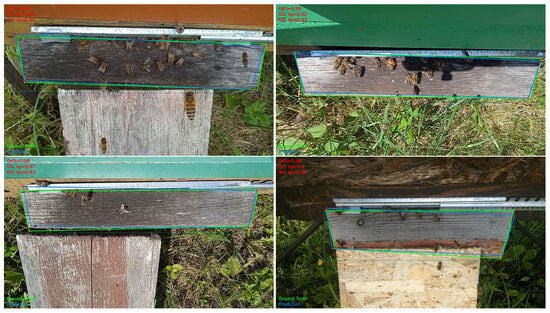
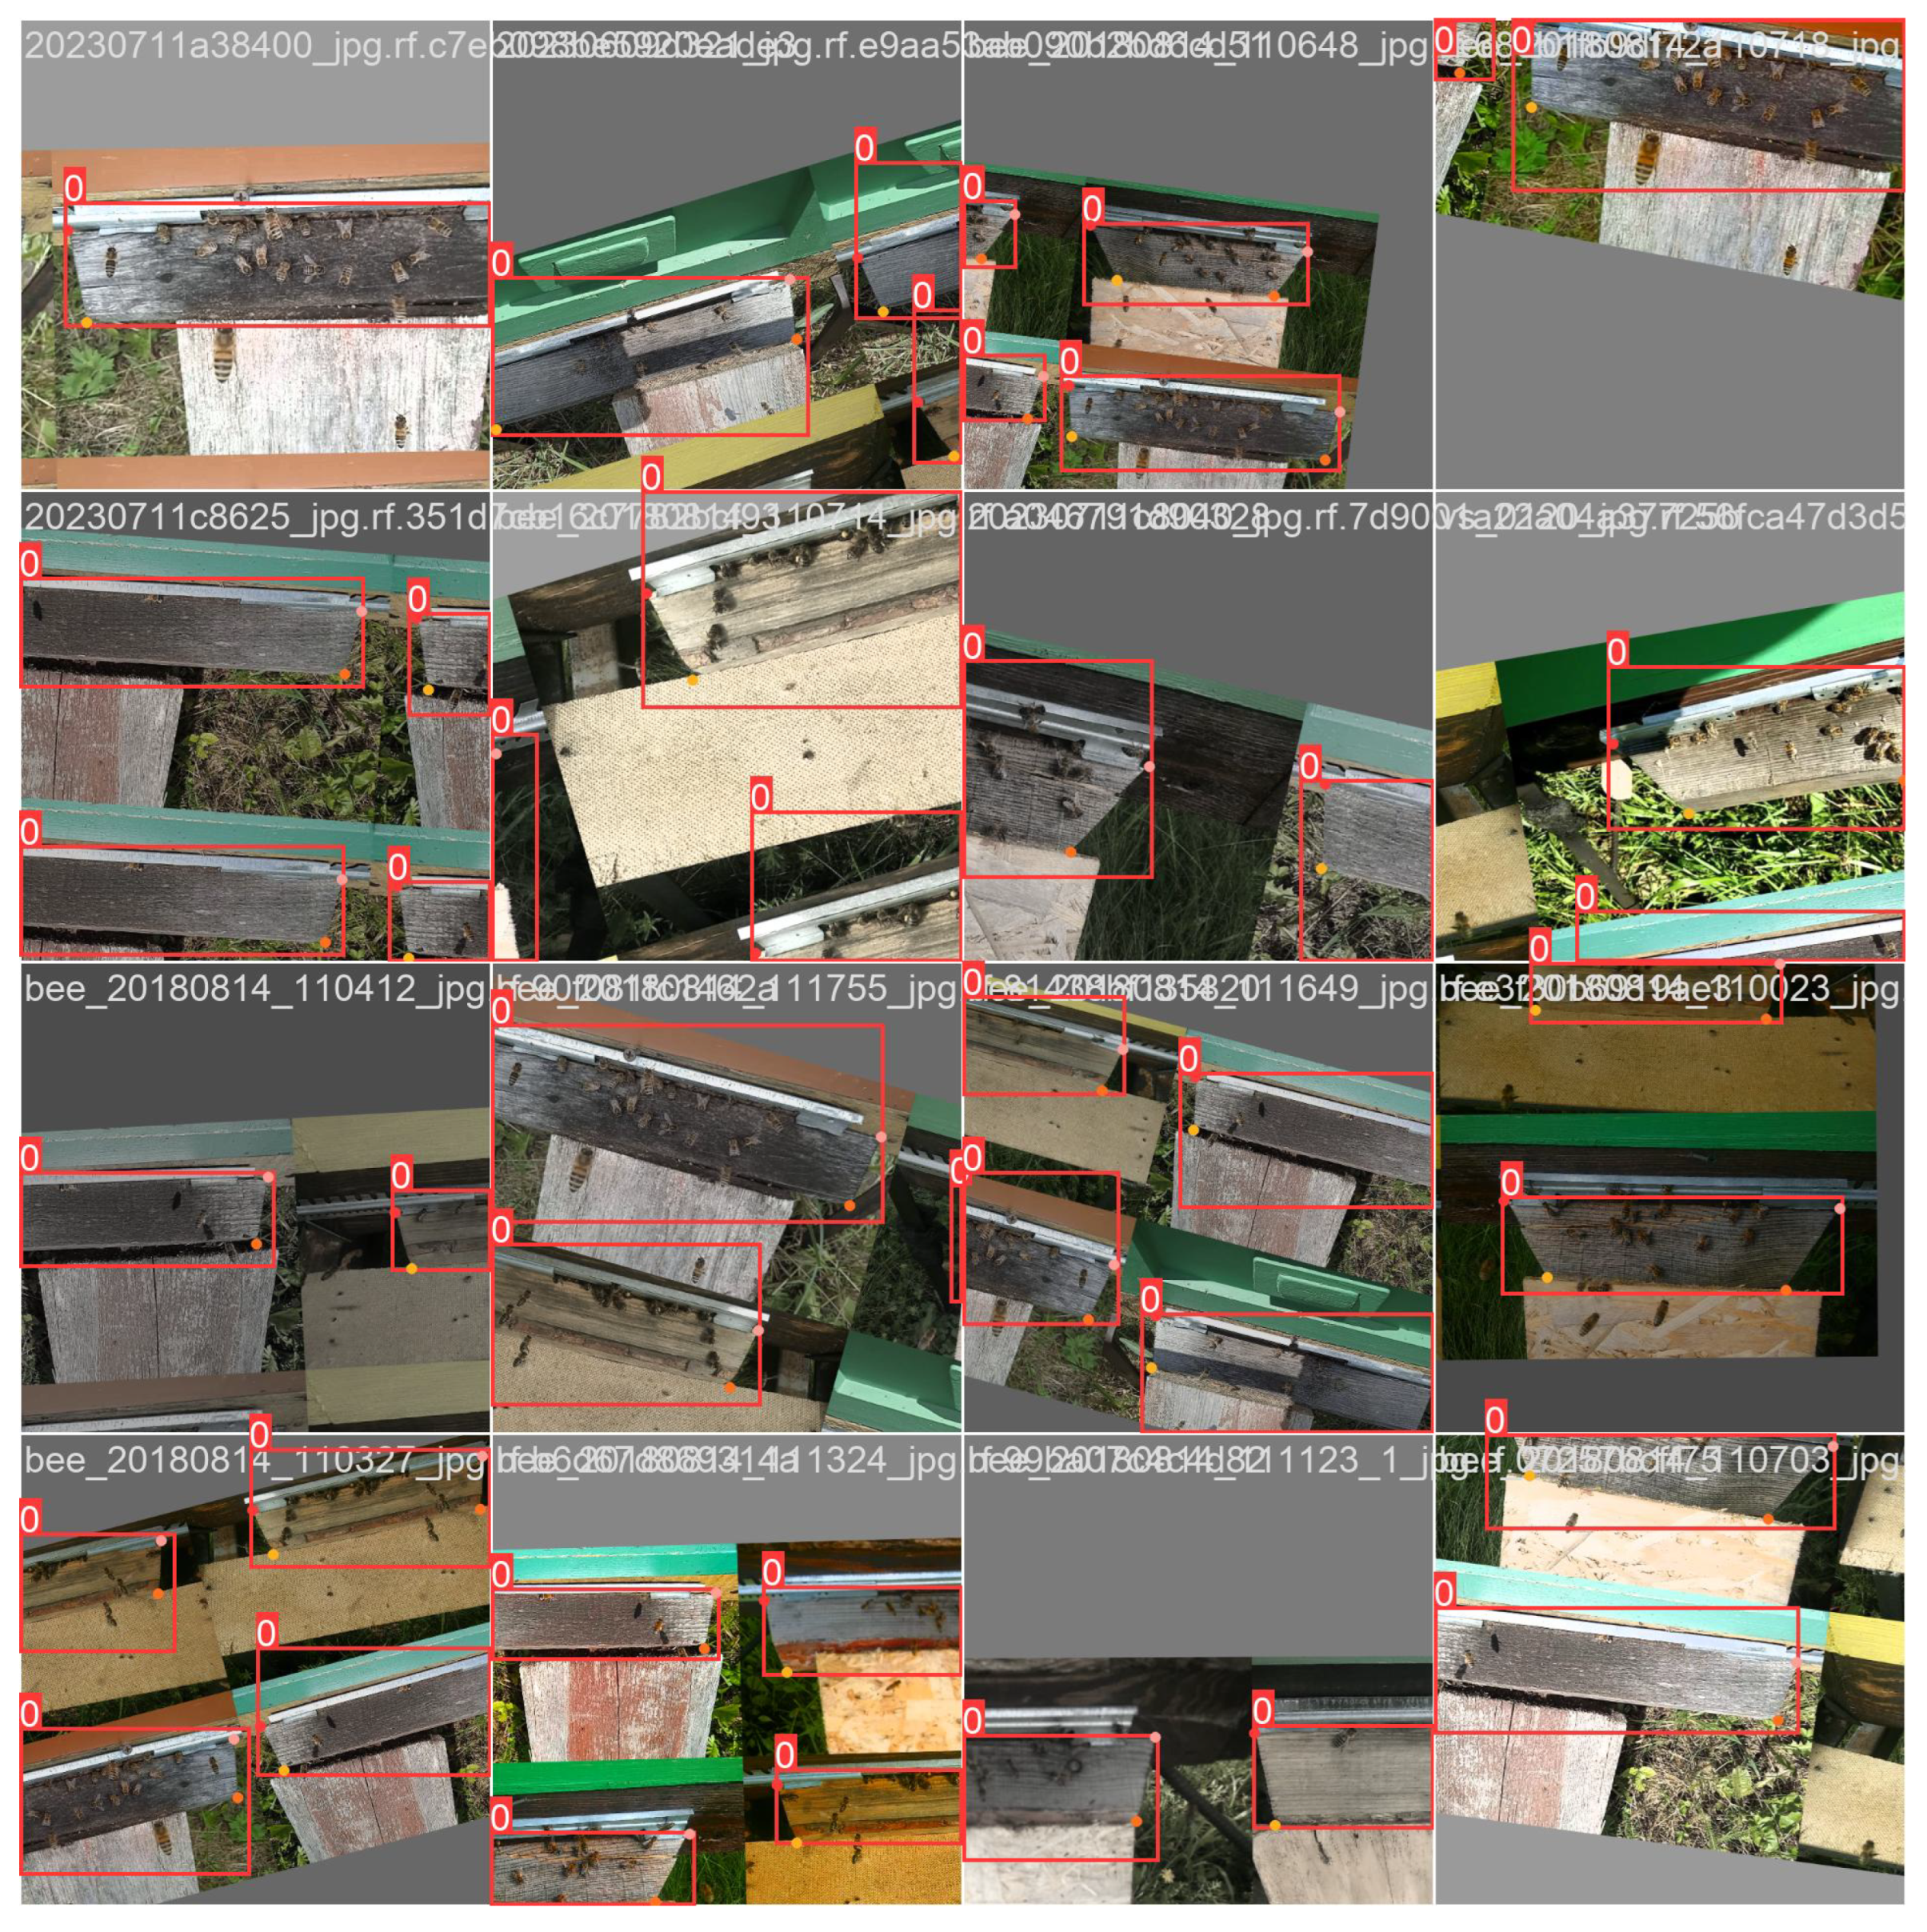
Samples of ramp images from one of the training batches are presented in Figure 9. The original dataset was successfully augmented with flipped and rotated images as planned. In these images, the red, pink, orange, and yellow dots indicate the order in which the ramp corners are labeled.
Figure 9.
Samples of ramp images in training batch after augmentation.
There are two approaches to integrate automatic ramp detection into the behavior recognition system. The first approach involves a stationary mounted camera and running the ramp detection once before continuous behavior recognition. The estimated coordinates of the ramp can then be used in subsequent frames. The second approach requires a moving camera; in this case, ramp detection needs to be performed for each frame to accurately reconstruct the bee’s track with respect to the ramp’s location.
5. Discussion
The bounding box-based intersection metric, , is unsuitable for ramp detection due to the ramp’s frequent misalignment with the horizontal axis of the image. Additionally, OKS is a conditional metric that depends on the Gaussian spread parameter and the number of keypoints assigned to the object. Therefore, we selected as a more appropriate metric. This metric accurately reflects the intersection between the predicted and ground truth areas defined by the four corners of the ramp, regardless of distortion, rotation, or alignment in the image.
During training, affects the speed of convergence of the keypoint loss function. A higher allows for a wider distribution of keypoints. The default standard deviation of the Gaussian distribution for a four-keypoint object in YOLOv8 pose models is . In this study, we evaluated the models’ performance using two smaller values, and , which require the training algorithm to maintain keypoint deviations that are two and four times smaller, respectively. With the default , the nano model achieved the best performance with an of 83.7%. For , the medium model performed best with an of 90.9%. For field applications of the entrance ramp detector, the medium-sized model was chosen due to its promising performance, yielding an of 91.7% with .
Automatic detection of a hive’s entrance ramp is crucial for a portable bee behavior analysis system, as it enables the localization of the area in the video where bee traffic needs to be analyzed. Once the ramp is detected and the corner locations are established, the ramp detection model only needs to be applied occasionally, such as when the camera moves. For a stationary mounted camera, the ramp detection model can be run once prior to bee traffic analysis.
We plan to enhance the ramp detection dataset by incorporating images from various apiaries to develop a more generalized model for ramp detection. This will make the bee behavior recognition system adaptable to different locations. Currently, the system employs two separate models for detecting bees and ramps. In future work, we aim to create a unified dataset and develop a single model capable of simultaneously detecting keypoints and bounding boxes for both bees and ramps.
The study of bee behavior at the entrance of the hive is a future goal. We plan to develop methods for recognizing bee actions by employing tracking, pose, and orientation estimation, as well as analyzing bee paths and the speed of incoming and outgoing bees. These methods will help beekeepers automate the tracking of foraging intensity and enable the early detection of robbing or swarming. Therefore, a high-priority task is to augment the dataset with intrinsic behavioral patterns of the bee colony at the hive entrance.
Early tests on bee tracking indicate that accurate track reconstruction requires a minimum of 50 fps to successfully monitor the fast movement of forager bees at the hive entrance. Only the nano model meets the real-time requirements, as other models achieve frame rates between 20–40 fps, which are insufficient for real-time applications, especially when additional tracking and action recognition algorithms run simultaneously on the same hardware. Therefore, future work should focus on optimizing the architecture of the YOLO models to balance performance, speed, and accuracy for deployment on embedded computing platforms.
Previous studies have utilized various methods for bee orientation estimation, including CNN models and barcode tracking systems. For instance, Smith et al. [26] reported an OKS of 0.96 for detecting multiple anatomical points on bees, while the current study’s dual keypoint approach offers a simpler yet effective alternative with comparable accuracy. While earlier works primarily focused on bee detection and counting through background subtraction or edge detection techniques, this study employs advanced computer vision models (YOLOv8) that enhance both detection speed and accuracy. Rodriguez et al. [25] achieved an impressive average precision of 99% on a custom dataset with an artificial entrance ramp. This approach focused on tracking specific body parts to infer orientation. In contrast, the current study utilized a YOLOv8 pose model that detected two keypoints (head and stinger) per bee, achieving a high accuracy of 99% for both bounding box and keypoint detection. This suggests that while Rodriguez’s method is highly precise, the current study’s approach may offer practical advantages in terms of speed and efficiency due to the YOLO architecture. Rodriguez et al. [25] utilized a modified VGG-19 model to detect five keypoints on bees, achieving precise pose tracking that allows for detailed orientation analysis. Similarly, Smith et al. [26] expanded this approach by employing twelve keypoints, enhancing the granularity of pose detection for individual bees. In contrast, our study focuses specifically on estimating bee orientation using only two keypoints—the head and the stinger. This streamlined approach is sufficient for our task, as it effectively captures the essential information needed for orientation detection while simplifying the model and improving processing speed.
The absence of prior studies on hive entrance ramp detection highlights the novelty of this research. While other systems have monitored bee traffic using various landing board designs, none have specifically addressed the automated identification of entrance ramps, marking a significant gap that this study fills.
6. Conclusions
The algorithm developed for label merging and conversion from XML to YOLO format was successfully tested, with unassigned keypoints correctly assigned to the corresponding bee boxes. YOLOv8-pose keypoint detection models are suitable for tracking the head and stinger of bees and estimating their orientation at the hive entrance. The medium-size YOLOv8 detection model achieved 98% precision in detecting both bounding boxes and keypoints in bees. However, the medium model only delivers 20 fps for px images. In contrast, the smallest nano model achieves 67 fps on px images, with a precision of 95% for both bounding boxes and keypoints. Therefore, for field deployment, either a hardware upgrade should be considered to speed up processing, or the smallest model could be used, sacrificing 3% precision in bee and keypoint detection. The achieved precision in bee keypoint detection is on par with state-of-the-art approaches.
The medium-size YOLOv8m-pose model achieves the highest compared to the nano and large-sized models. This high precision in ramp detection is due to the similarity in ramp shapes from a single apiary. To ensure effective bee behavior identification across different apiaries, it is necessary to extend the entrance ramp dataset.
Author Contributions
Conceptualization, T.S. and A.S.; methodology, T.S., D.A. and A.S.; software, T.S., D.P. and D.M.; validation, A.S. and D.M.; formal analysis, D.A.; investigation and analysis, D.M. and D.P.; data curation, D.A.; writing—original draft preparation, T.S., A.S., D.P. and D.M.; writing—review and editing, A.S., D.P., D.A. and D.M.; visualization, T.S. and D.P. All authors have read and agreed to the published version of the manuscript.
Funding
The publication was co-funded by the European Union under Horizon Europe program grant agreement No. 101059903, by the European Union funds for the period 2021–2027, and by the state budget of the Republic of Lithuania financial agreement Nr. 10-042-P-0001.
Institutional Review Board Statement
Not applicable.
Data Availability Statement
Dataset was publicly shared on Mendeley Data repository. Link was referenced in manuscript.
Conflicts of Interest
The authors declare no conflicts of interest.
References
- Kortsch, S.; Timberlake, T.P.; Cirtwill, A.R.; Sapkota, S.; Rokoya, M.; Devkota, K.; Roslin, T.; Memmott, J.; Saville, N. Decline in Honeybees and Its Consequences for Beekeepers and Crop Pollination in Western Nepal. Insects 2024, 15, 281. [Google Scholar] [CrossRef] [Scilit] [PubMed]
- Timberlake, T.; Cirtwill, A.; Sapkota, S.; Bhusal, D.; Devkota, K.; Karki, R.; Joshi, D.; Saville, N.; Kortsch, S.; Baral, S.; et al. Agricultural specialisation increases the vulnerability of pollination services for smallholder farmers. J. Appl. Ecol. 2024, 61, 2123–2134. [Google Scholar] [CrossRef] [Scilit]
- Kontogiannis, S. Beehive Smart Detector Device for the Detection of Critical Conditions That Utilize Edge Device Computations and Deep Learning Inferences. Sensors 2024, 24, 5444. [Google Scholar] [CrossRef] [Scilit] [PubMed]
- Gomes, C.R.; Batista, M.A.; Ferraz, Y.M.; Trivellato, M.F.; Siniscalchi, G.A.; Polycarpo, G.V.; Rigobelo, E.C.; De Jong, D.; Nicodemo, D. A Hive Entrance System That Directs Honey Bees Inside or Outside a Greenhouse Reduced Colony Decline While Effectively Pollinating Zucchini Squash. Agriculture 2024, 14, 805. [Google Scholar] [CrossRef] [Scilit]
- Camayo, A.I.C.; Muñoz, M.A.C.; Corrales, J.C. ApIsoT: An IoT Function Aggregation Mechanism for Detecting Varroa Infestation in Apis mellifera Species. Agriculture 2024, 14, 846. [Google Scholar] [CrossRef] [Scilit]
- Benahmed, H.K.; Bensaad, M.L.; Chaib, N. Detection and tracking of honeybees using YOLO and StrongSORT. In Proceedings of the 2022 2nd International Conference on Electronic and Electrical Engineering and Intelligent System (ICE3IS), Yogyakarta, Indonesia, 4–5 November 2022; IEEE: Piscataway, NJ, USA, 2022; pp. 18–23. [Google Scholar]
- Tu, G.J.; Hansen, M.K.; Kryger, P.; Ahrendt, P. Automatic behaviour analysis system for honeybees using computer vision. Comput. Electron. Agric. 2016, 122, 10–18. [Google Scholar] [CrossRef] [Scilit]
- Shwetha, B.; Neethu, T.; Bhat, N. Honey Harvesting for Sustainable Livelihoods and Agricultural Production. In Role of Giant Honeybees in Natural and Agricultural Systems; CRC Press: Boca Raton, FL, USA, 2024; pp. 150–157. [Google Scholar]
- Majewski, P.; Lampa, P.; Burduk, R.; Reiner, J. Prediction of the remaining time of the foraging activity of honey bees using spatio-temporal correction and periodic model re-fitting. Comput. Electron. Agric. 2023, 205, 107596. [Google Scholar] [CrossRef] [Scilit]
- Ngo, T.N.; Rustia, D.J.A.; Yang, E.C.; Lin, T.T. Automated monitoring and analyses of honey bee pollen foraging behavior using a deep learning-based imaging system. Comput. Electron. Agric. 2021, 187, 106239. [Google Scholar] [CrossRef] [Scilit]
- Goyal, P.; Baird, E.; Srinivasan, M.V.; Muijres, F.T. Visual guidance of honeybees approaching a vertical landing surface. J. Exp. Biol. 2023, 226, jeb245956. [Google Scholar] [CrossRef] [Scilit]
- Smith, M.L.; Davidson, J.D.; Wild, B.; Dormagen, D.M.; Landgraf, T.; Couzin, I.D. Behavioral variation across the days and lives of honey bees. iScience 2022, 25, 104842. [Google Scholar] [CrossRef] [Scilit]
- Bilik, S.; Kratochvila, L.; Ligocki, A.; Bostik, O.; Zemcik, T.; Hybl, M.; Horak, K.; Zalud, L. Visual diagnosis of the varroa destructor parasitic mite in honeybees using object detector techniques. Sensors 2021, 21, 2764. [Google Scholar] [CrossRef] [Scilit] [PubMed]
- Bjerge, K.; Frigaard, C.E.; Mikkelsen, P.H.; Nielsen, T.H.; Misbih, M.; Kryger, P. A computer vision system to monitor the infestation level of Varroa destructor in a honeybee colony. Comput. Electron. Agric. 2019, 164, 104898. [Google Scholar] [CrossRef] [Scilit]
- Borlinghaus, P.; Odemer, R.; Tausch, F.; Schmidt, K.; Grothe, O. Honey bee counter evaluation–Introducing a novel protocol for measuring daily loss accuracy. Comput. Electron. Agric. 2022, 197, 106957. [Google Scholar] [CrossRef] [Scilit]
- Sledevič, T.; Matuzevičius, D. Labeled dataset for bee detection and direction estimation on entrance to beehive. Data Brief 2024, 52, 110060. [Google Scholar] [CrossRef] [Scilit]
- Kongsilp, P.; Taetragool, U.; Duangphakdee, O. Individual honey bee tracking in a beehive environment using deep learning and Kalman filter. Sci. Rep. 2024, 14, 1061. [Google Scholar] [CrossRef] [Scilit]
- Mukherjee, S.; Kulyukin, V. Application of digital particle image velocimetry to insect motion: Measurement of incoming, outgoing, and lateral honeybee traffic. Appl. Sci. 2020, 10, 2042. [Google Scholar] [CrossRef] [Scilit]
- Kulyukin, V.A.; Kulyukin, A.V. Accuracy vs. Energy: An Assessment of Bee Object Inference in Videos from On-Hive Video Loggers with YOLOv3, YOLOv4-Tiny, and YOLOv7-Tiny. Sensors 2023, 23, 6791. [Google Scholar] [CrossRef] [Scilit]
- Kulyukin, V.; Mukherjee, S. On video analysis of omnidirectional bee traffic: Counting bee motions with motion detection and image classification. Appl. Sci. 2019, 9, 3743. [Google Scholar] [CrossRef] [Scilit]
- Nguyen, D.T.; Le, T.N.; Phung, T.H.; Nguyen, D.M.; Nguyen, H.Q.; Pham, H.T.; Vu, H.; Le, T.L. Improving pollen-bearing honey bee detection from videos captured at hive entrance by combining deep learning and handling imbalance techniques. Ecol. Inform. 2024, 82, 102744. [Google Scholar] [CrossRef] [Scilit]
- Shen, M.; Li, C.; Huang, W.; Szyszka, P.; Shirahama, K.; Grzegorzek, M.; Merhof, D.; Deussen, O. Interactive tracking of insect posture. Pattern Recognit. 2015, 48, 3560–3571. [Google Scholar] [CrossRef] [Scilit]
- Ngo, T.N.; Wu, K.C.; Yang, E.C.; Lin, T.T. A real-time imaging system for multiple honey bee tracking and activity monitoring. Comput. Electron. Agric. 2019, 163, 104841. [Google Scholar] [CrossRef] [Scilit]
- Bozek, K.; Hebert, L.; Mikheyev, A.S.; Stephens, G.J. Towards dense object tracking in a 2D honeybee hive. In Proceedings of the IEEE Conference on Computer Vision and Pattern Recognition, Salt Lake City, UT, USA, 18–22 June 2018; pp. 4185–4193. [Google Scholar]
- Rodriguez, I.F.; Chan, J.; Alvarez Rios, M.; Branson, K.; Agosto-Rivera, J.L.; Giray, T.; Mégret, R. Automated Video Monitoring of Unmarked and Marked Honey Bees at the Hive Entrance. Front. Comput. Sci. 2022, 3, 769338. [Google Scholar] [CrossRef] [Scilit]
- Smith, M.A.Y.; Easton-Calabria, A.; Zhang, T.; Zmyslony, S.; Thuma, J.; Cronin, K.; Pasadyn, C.L.; de Bivort, B.L.; Crall, J.D. Long-term tracking and quantification of individual behavior in bumble bee colonies. Artif. Life Robot. 2022, 27, 401–406. [Google Scholar] [CrossRef] [Scilit]
- Gernat, T.; Jagla, T.; Jones, B.M.; Middendorf, M.; Robinson, G.E. Automated monitoring of honey bees with barcodes and artificial intelligence reveals two distinct social networks from a single affiliative behavior. Sci. Rep. 2023, 13, 1541. [Google Scholar] [CrossRef] [Scilit] [PubMed]
- Wario, F.; Wild, B.; Couvillon, M.J.; Rojas, R.; Landgraf, T. Automatic methods for long-term tracking and the detection and decoding of communication dances in honeybees. Front. Ecol. Evol. 2015, 3, 103. [Google Scholar] [CrossRef] [Scilit]
- Veeraraghavan, A.; Chellappa, R.; Srinivasan, M. Shape-and-Behavior Encoded Tracking of Bee Dances. IEEE Trans. Pattern Anal. Mach. Intell. 2008, 30, 463–476. [Google Scholar] [CrossRef] [Scilit]
- Stojnić, V.; Risojević, V.; Pilipović, R. Detection of pollen bearing honey bees in hive entrance images. In Proceedings of the 2018 17th International Symposium INFOTEH-JAHORINA (INFOTEH), East Sarajevo, Bosnia and Herzegovina, 21–23 March 2018; IEEE: Piscataway, NJ, USA, 2018; pp. 1–4. [Google Scholar]
- Babić, Z.; Pilipović, R.; Risojević, V.; Mirjanić, G. Pollen bearing honey bee detection in hive entrance video recorded by remote embedded system for pollination monitoring. ISPRS Ann. Photogramm. Remote Sens. Spat. Inf. Sci. 2016, 3, 51–57. [Google Scholar] [CrossRef] [Scilit]
- CVAT.ai Corporation. Computer Vision Annotation Tool (CVAT). 2023. Available online: https://github.com/opencv/cvat (accessed on 15 August 2024).
- Grume, G.J.; Biedenbender, S.P.; Rittschof, C.C. Honey robbing causes coordinated changes in foraging and nest defence in the honey bee, Apis mellifera. Anim. Behav. 2021, 173, 53–65. [Google Scholar] [CrossRef] [Scilit]
- Bodlah, M.A.; Mohsin, A.; Younas, A.; Hussain, S.; Ashiq, A.; Khan, S.; Bodlah, I.; Arif, A.B.; Gull-E-Fareen, A.; Rasheed, M.T.; et al. Honey Bee Behavior. In Honey Bees, Beekeeping and Bee Products; CRC Press: Boca Raton, FL, USA, 2024; pp. 36–52. [Google Scholar]
- Jocher, G.; Chaurasia, A.; Qiu, J. Ultralytics YOLO. 2023. Available online: https://github.com/ultralytics/ultralytics (accessed on 3 July 2024).
- Loshchilov, I. Decoupled weight decay regularization. arXiv 2017, arXiv:1711.05101. [Google Scholar]

Disclaimer/Publisher’s Note: The statements, opinions and data contained in all publications are solely those of the individual author(s) and contributor(s) and not of MDPI and/or the editor(s). MDPI and/or the editor(s) disclaim responsibility for any injury to people or property resulting from any ideas, methods, instructions or products referred to in the content. |
© 2024 by the authors. Licensee MDPI, Basel, Switzerland. This article is an open access article distributed under the terms and conditions of the Creative Commons Attribution (CC BY) license (https://creativecommons.org/licenses/by/4.0/).