Article

Effect of Form of Silicon and the Timing of a Single Foliar Application on Sugar Beet Yield

1
Institute of Agriculture, Warsaw University of Life Sciences—SGGW, Nowoursynowska 159, 02-776 Warsaw, Poland
2
Department of Botany, Constituent Punjab College, University of Central Punjab, Bahawalpur 63100, Pakistan
*
Author to whom correspondence should be addressed.
Agriculture 2024, 14(1), 86; https://doi.org/10.3390/agriculture14010086
Submission received: 2 December 2023 / Revised: 30 December 2023 / Accepted: 30 December 2023 / Published: 31 December 2023
(This article belongs to the Special Issue Foliar Fertilization for Sustainable Crop Production)

Abstract

:
The aim of the study was the evaluation of silicon foliar application on sugar beet yield. In the years 2017–2019, the effect of a single foliar application of various forms of silicon (potassium silicate—PS, calcium silicate—CS, sodium metasilicate—SM, and orthosilicic stabilized acid—OSA) applied in the six-leaf phase of sugar beet, 7 and 14 days later on yield and technological quality of sugar beet roots was assessed. It was found that the form of silicon does not have a significant effect on the yield of sugar beet roots, and significantly modifies the biological yield of sugar and the pure sugar yield. The highest biological yield of sugar is achieved by the foliar application of PS, and the pure sugar yield by PS and OSA. The date of foliar application as well as the interaction of the date of application and silicon forms do not have a significant effect on the root yield, biological yield of sugar, and pure sugar yield. The form of silicon has a significant effect on the technological quality of sugar beet roots (sugar, α-amino nitrogen, potassium, and sodium content). The most beneficial effect on the sugar content and reduction of sodium content in sugar beet roots is the foliar application of OSA, and the reduction of α-amino nitrogen and potassium content—PS. The timing of the application of various forms of silicon has a significant effect on the sugar and potassium content in sugar beet roots. The most beneficial effect on the sugar content in the roots is the application carried out 7 days after the six-leaf phase of sugar beet, and the potassium content is most limited by the treatment 14 days after reaching this phase. The interaction of the timing of foliar application and the form of silicon significantly modifies the technological quality features of sugar beet roots: the content of sugar, α-amino nitrogen, potassium, and sodium. The results of the study proved the significant effect of silicon foliar application on the physiological parameters of plants, such as leaf area index (LAI), absorption of photosynthetically active radiation (PAR) and normalized difference vegetation index (NDVI) which are related to yield and sugar beet productivity.

1. Introduction

Agricultural crops are exposed to the unfavorable influence of environmental conditions, diseases, and pests, which impair the growth and development of plants and their health, and consequently adversely affect the size and quality of the crop. In recent years, weather anomalies have become particularly intense, constituting an additional source of stress for plants. Among others, drought is a factor that seriously threatens crop productivity and food security in the world, especially in areas exposed to its frequent occurrence [1]. According to a report by the United Nations (UN), since 2000, the number and duration of drought periods on Earth have increased by 29%, and by 2050, the effects of drought will occur for 75% of the world’s population [2]. Hence, there is an urgent need to introduce solutions that would improve plant resistance to drought [3]. One such solution may be the foliar application of silicon products (Si). The beneficial effect of the foliar application of silicon has been confirmed in many crops. In recent years, these included: rapeseed [4], grass–legume mixtures [5], forage-grasses [6] pea [7], and maize [8,9,10,11]. Silicon play a significant role in increasing the photosynthetic pigments and antioxidants activity in wheat plant [12]. Drought stress significantly reduced the plant growth and development as well as the photosynthetic activity of plant are reduced while the foliar silicon play a beneficial role by improving the growth and development of plant under drought stress [13].
Sugar beet (Beta vulgaris L.) is the second most important raw material for sugar production, after sugar cane, in some regions of the world. In 2021, the area under sugar beet cultivation in the world was 4.4 million hectares, and the root harvest was 270 million tons [14]. Sugar beet has high water needs due to the production of large biomass, and water shortages during periods of greatest demand have an adverse effect on plant growth and sugar yields.
Previous research results have shown that the foliar application of products containing silicon reduces the effects of drought in sugar beet cultivation [15,16]. The positive effect of foliar application on resistance to drought was also proven in many other crops such as potato [17], wheat [18], rice [19], maize [20] and many other crops [21]. The foliar application of silicon improved plant growth under drought stress due to the increased silicon content, leading to an improvement in antioxidant activity and soluble sugar, and a reduction in the content of reactive oxygen species. The foliar application of silicon helped to minimize the harmful effect of drought by increasing proline and superoxide dismutase, and decreasing the malondialdehyde. The foliar application of different forms of silica improved the physiological and biochemical parameters and plant growth during drought conditions.
However, it has not been possible to clearly state which form of silicon is the most effective and what is the optimal date for the treatments.
Therefore, the aim of the research was to assess the effect of a single foliar application of various forms of silicon at different dates on the yield and technological quality of sugar beet roots.

2. Materials and Methods

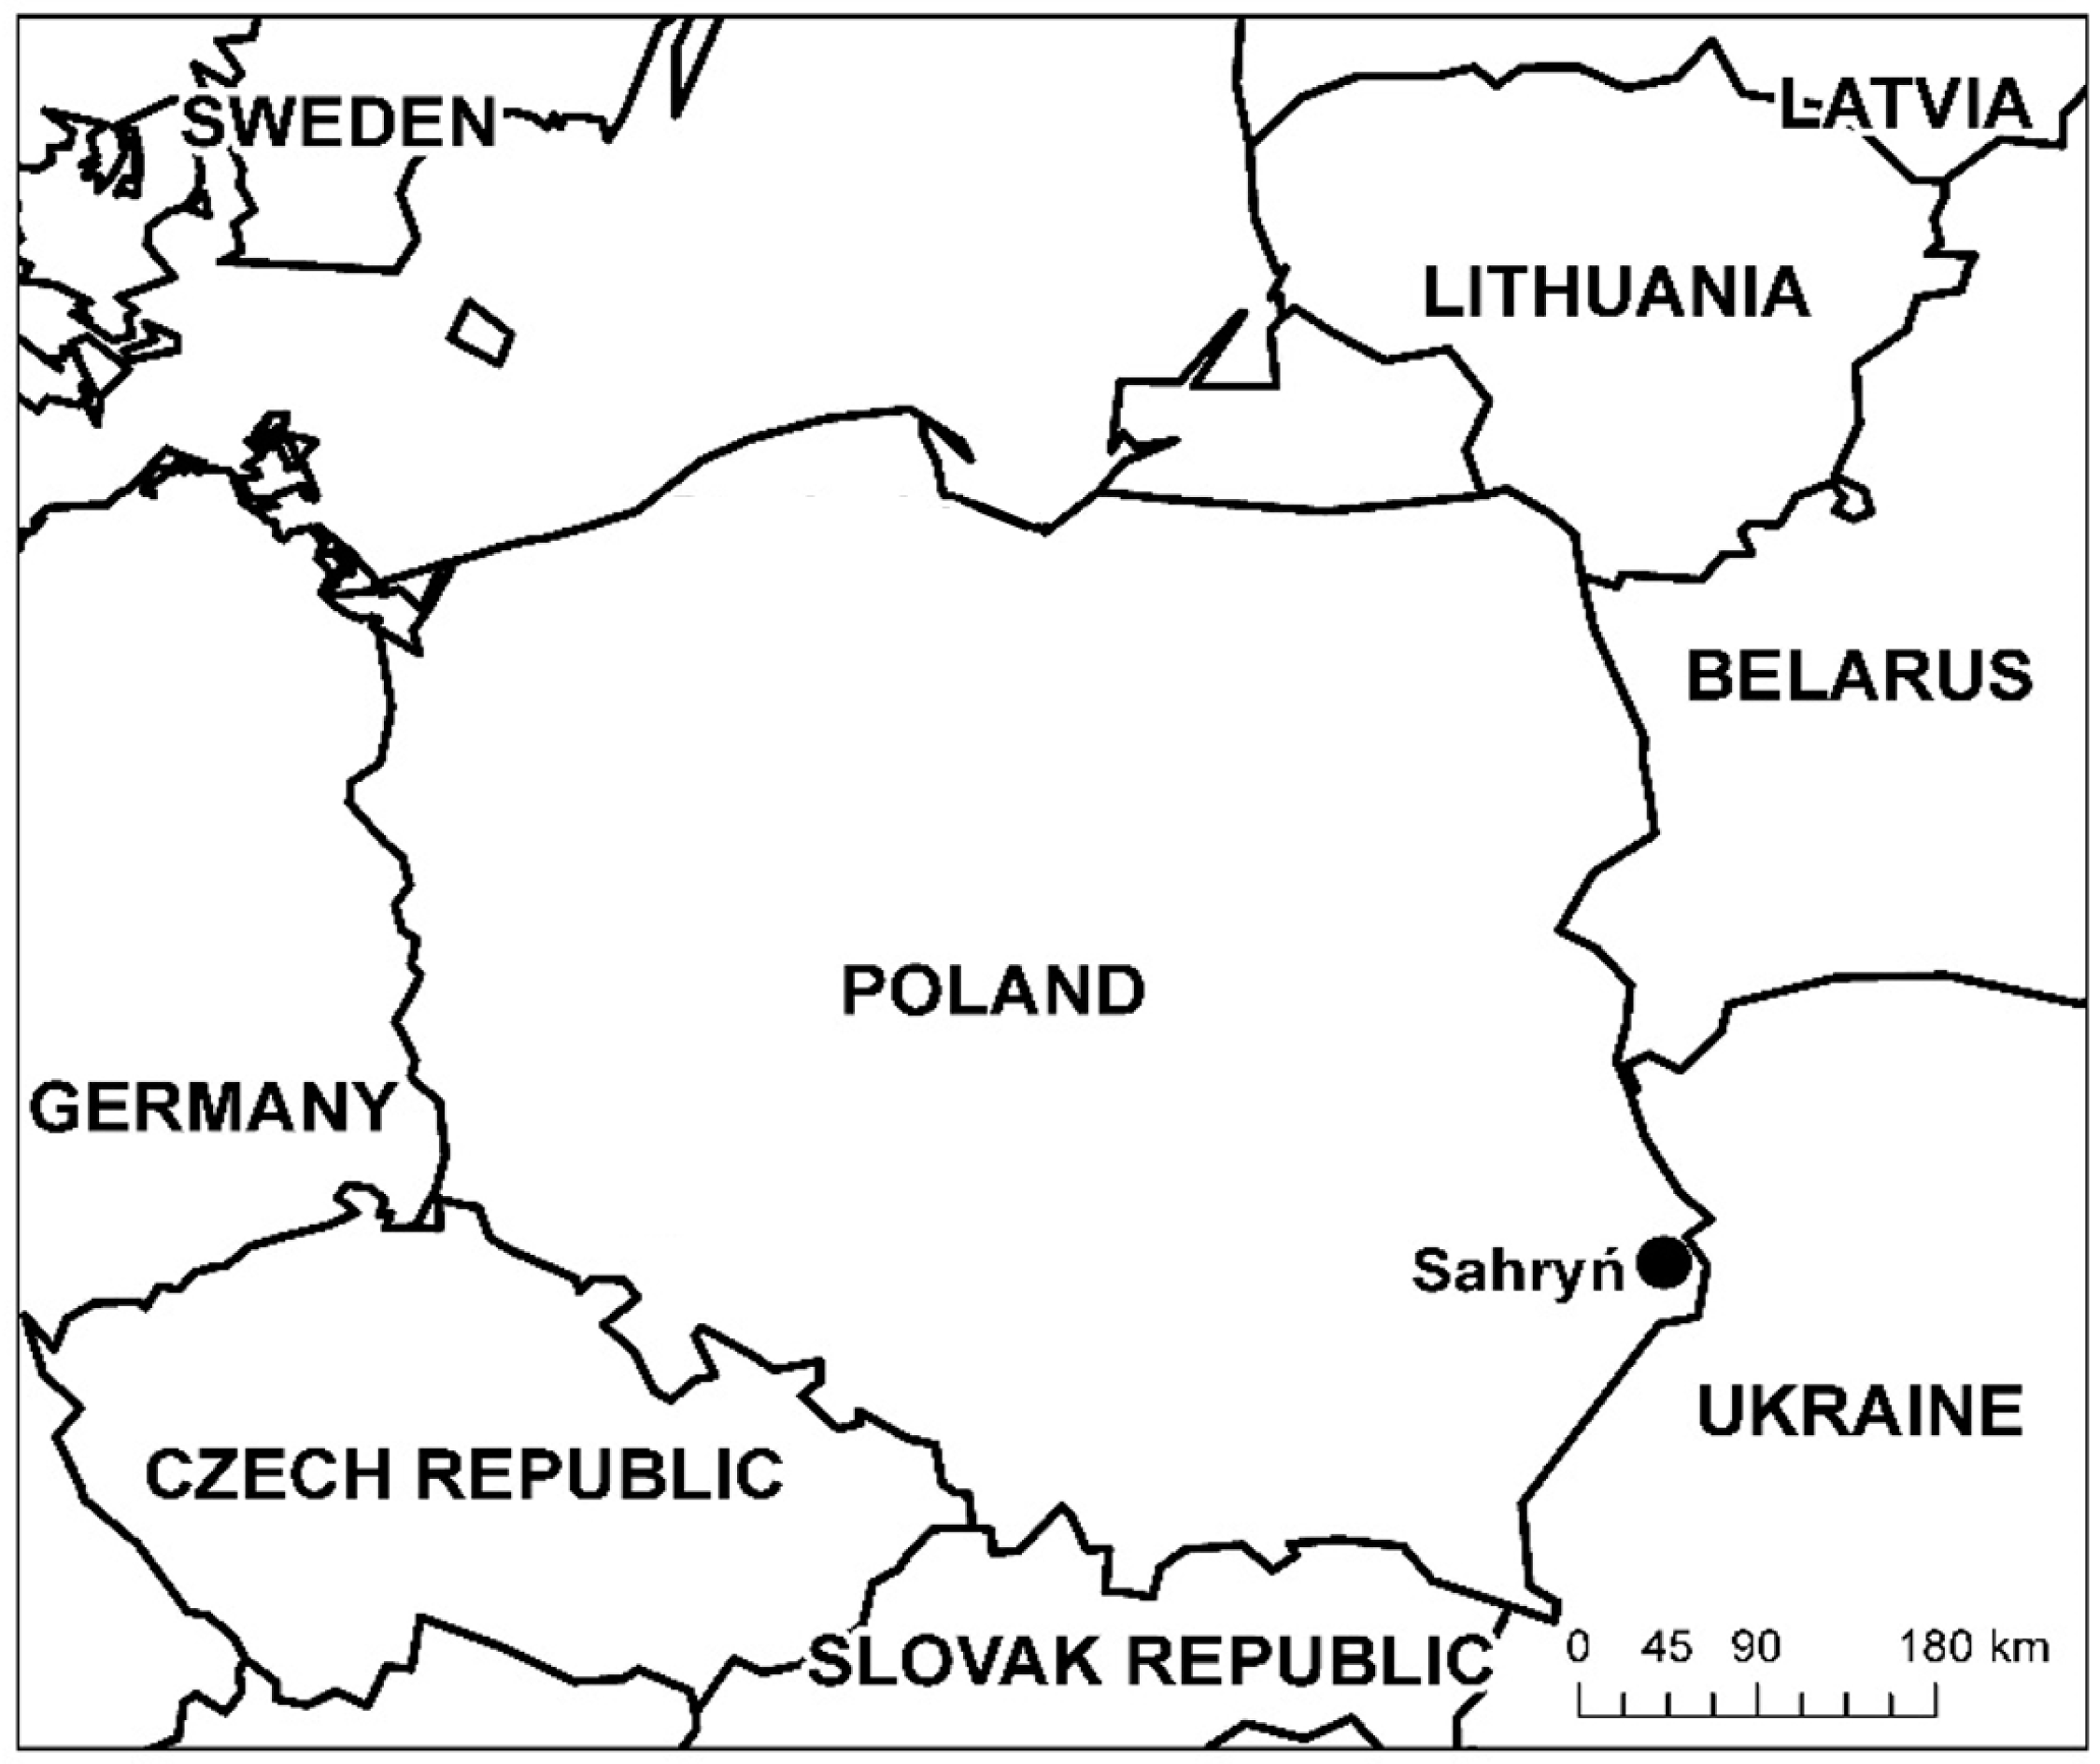
In the years 2017–2019, a field experiment with sugar beet was conducted in Sahryń (50°41′ N, 23°46′ E), in the southeast of Poland, near the border with Ukraine (Figure 1).
The experiment was conducted on Calcic Chernozem [22]. Soil samples were collected at two soil depths (0–30 and 30–60 cm) immediately after harvesting the fore crop. At District Chemical and Agricultural Stations in Warszawa-Wesoła, evaluated the content of soil organic carbon (Corg) [23], (pHKCl) potentiometrically in 1 M KCl [24], nitrate nitrogen (N-NO3) and ammonium nitrogen (NH4) [25], available phosphorus [26], available potassium [27], available magnesium [28], available B [29], available Cu [30], available Fe [31], available Mn [32] and available Zn [33] were evaluated.
The chemical soil properties are presented in Table 1. The soil reaction in each year of the study was alkaline. The content of most of the nutrients in the shallow layer was much higher in comparison to the deeper layer.
The amount of precipitation during the growing season (April–October) was 426–466 mm (Table 2). Sunshine during the growing season ranged from 1435 h in 2017 to 1566 h in 2018. The most favorable weather conditions were in 2017, and the least favorable were in 2018.
Sugar beet was grown in the third rotation: sugar beet–winter wheat–winter rapeseed. During the rapeseed harvest, the straw was shredded by a combine harvester and scattered on the field. The fore crop straw yield ranged from 3.10 to 6.90 t ha−1. After harvesting the fore crop, cultivation was performed three times in order to mix straw and crop residues with the soil, destroy weeds and self-seeding rapeseed, and cover the soil with multi-component fertilizers (third treatment). In spring, the field was prepared for sowing sugar beet with a cultivating unit. Compound fertilizers were spread in autumn and spring (Table S1). Depending on the year (kg ha−1): N—159–170, P—35–46 and K—195–249 were used. The foliar application of boron was performed at the stage of six beet leaves (BBCH 16) and 14 days later (B).
Sugar beet sowing was carried out from 30 March to 11 April. The row spacing was 45 cm, the distance within the row was 18 cm, and the sowing depth was from 2 to 2.5 cm.
The sugar beet variety Toleranza KWS (KWS), which is of high importance in Poland, was used in the research. It is a diploid variety, normal type (N), entered into the National Register in 2015. The root yield is high and the sugar yield is very high. Technological quality good; sugar content slightly above the standard, harmful nitrogen content quite low, potassium content—quite high, sodium content—quite low. Resistance to the beetroot weevil (Cercospora beticola Sacc.) is quite high. Resistance to the beet cyst nematode (Heterodera schachtii Schmidt) declared by the breeder [34].
Sugar beet was harvested, depending on the year, from 26 September to 12 October. The length of the growing season was from 178 to 195 days.
Protection against weeds, diseases and pests was carried out in accordance with the recommendations of the Plant Protection Institute—National Research Institute in Poznań. The location of the experiment is in the area of strong infection pressure of the beetroot beetle; therefore, it was necessary to carry out four fungicide treatments in 2019, and three in the previous two years.
The experiment assessed the influence of two factors: silicon forms (A) and the date of their application (B) (Table 3 and Table 4). The factors and their levels were set based on current recommendations of silicon foliar application in sugar beet by the producers of the fertilizers and scientific recommendations for agronomical practice. The application was made depending on the combination: at the stage of six sugar beet leaves (I), 7 days later (II) and 14 days later (III). Product doses were based on manufacturers’ recommendations. The water dose in each application was 250 dm3 ha−1. Since it was known from many previous studies that silicon had a positive effect on sugar beet yield, the use of the control variant (without foliar application of silicon) was abandoned and the focus was on comparing the forms of silicon used with each other.
An Apollo tractor sprayer (Krukowiak) equipped with TeeJet flat-jet nozzles was used for application. In 2017, the treatments were performed on 27 May, 3 and 10 June. In 2018, on 26 May, 2 and 9 June, respectively, and in 2019, on 25 May, 1 and 8 June.
The number of combinations in the experiment was 12, the number of repetitions was four, and the total number of plots was 48. Each plot included six rows and was 16 m long and 2.7 m wide. The area of one plot was 43.2 m2, of which 21.6 m2 was intended for harvesting (three middle rows).
On the day of each application and 7 days after the last treatment, the following physiological parameters of plants were measured:
(1)
leaf area index (LAI),
(2)
absorption of photosynthetically active radiation (PAR),
(3)
normalized difference vegetation index (NDVI).
In 2017, measurements of physiological parameters were carried out on 27 May, 3, 10 and 17 June. In 2018—26 May, 2, 9 and 16 June, and in 2019—25 May, 1, 8 and 15 June.
Leaf area index (LAI) and photosynthetically active radiation (PAR) were measured above the canopy (Il) and below the canopy (Iu) using an AccuPar probe (Decagon, USA). PAR absorption was calculated according to the formula: PAR absorption = I l I u I l × 100 [%].
NDVI measurements were made with a GreenSeeker device (Trimble, Westminster, Color\do USA) rented by Polski Farmer. The NDVI index was calculated using the formula:
NDVI = (NIR − VIS)/(NIR + VIS);
where: NIR—reflection in the infrared band; VIS—reflection in the red band.
Measurements were taken on nine plants in the three middle rows in each plot. A total of 36 measurements were performed on each experimental combination at each date.
During harvest, the plants were topped by hand on the three middle rows and the leaves were weighed. The roots were then counted, dug up, and weighed. During the harvest, each plot was collected in accordance with the Polish Standard [35]. The root samples were transported to the Plant Breeding Station of the KHBC Sp. z o.o. in Śmiłów, where they were processed into pulp. The pulp was transported to Straszków, where the technological quality of roots was evaluated on the automatic Venema technological line: sugar content polarimetrically, α-amino nitrogen, K and Na—by photoelectric flame photometry.
Measurements performed in the experiments: leaf area index (LAI), absorption of photosynthetically active radiation (PAR), normalized difference vegetation index (NDVI), plant density at harvest (thousand plants ha−1), root yield (t ha−1), yield of leaves (t ha−1), content of sucrose in roots (%), content of α-amino nitrogen in the roots (mmol kg−1), content of potassium (K) in the roots (mmol kg−1), content of sodium (Na) in the roots (mmol kg−1), the biological yield of sugar (t ha−1) = product of root yield (t ha−1) and content of sugar in roots (%), pure sugar yield (t ha−1) = root yield (t ha−1) × [content of sugar (%) − sugar yield losses (%)] [36], sugar yield losses (%) = standard molasses losses (%) + 0.6 (%), standard molasses losses (%) = 0.012 × (K + Na) + 0.024 (α-amino nitrogen) + 0.48; where the content of K, Na, and α-amino nitrogen are given in mmol kg−1 of pulp.
The obtained experimental data were subjected to statistical analysis using analysis of variance and multiple comparisons using the Tukey procedure. For the comparison of means, the significance level was set at p = 0.05. On this basis, homogeneous groups of the means were distinguished and marked with subsequent letters of the alphabet. To characterize individual features, minimum and maximum values, standard deviation, and coefficient of variation were calculated. The assessment of the correlation between physiological parameters and yield characteristics was based on the values of Pearson’s simple correlation coefficients. The significance of the correlation was assessed at p ≤ 0.05 and p ≤ 0.01. The results are presented in the form of tables and figures. Analyzes were performed using Statistical 13.3 (TIBCO Software Inc., Palo Alto, CA, USA).

3. Results

3.1. Physiological Traits of Plants

Evaluations of the effects of the studied factors as well their interactions were performed based on p-values for multifactor ANOVA. Years of the study showed a significant effect on the assessed physiological parameters of sugar beet plants (LAI index, absorption of photosynthetically active radiation (PAR) and NDVI index) at each measurement date (Table 5). Similarly, the form of silicon, except for the effect on PAR absorption, at the first measurement date showed a significant effect. The date of foliar application of silicon-containing products significantly differentiated the value of the LAI index in the second and third measurement terms, the PAR absorption in the third measurement term, and the NDVI index value in the second measurement term. The interaction of years of the study and products had a significant effect on the tested physiological parameters, with the exception of PAR absorption in the first measurement date. The interaction of the years of the study and the date of application significantly influenced the assessed physiological parameters, except for the LAI index in the first measurement date, PAR absorption in the first and third measurement term, and the NDVI index in the second and third measurement term. A significant effect of the interaction of the silicon form and the application date was found on all physiological parameters in all measurement dates, except for the LAI index and PAR absorption in the second time, and the NDVI index in the first and third time. The interaction of the years of the study, the form of silicon, and the date of application had a significant effect on the value of all assessed physiological parameters at each measurement date, except for the NDVI index at the first and second dates.
The evaluation of the significance of the differences between means was performed based on Tukey’s multiple comparisons procedure and homogenous groups of the means were distinguished. The years of study significantly differentiated the values of the LAI index at each measurement date (Figure S1a). Its highest values were observed in 2018, while the lowest was in 2019, with the exception of the fourth measurement, in which the lowest value of the LAI index was achieved in 2017.
On average, for the entire research period, in the first measurement term, a significantly higher value of the LAI index was observed in objects with the PS, SM, and CS application compared to the OSA variant, and in the second measurement term after the application of SM and CS compared to PS and OSA (Figure S1b). However, in the third and fourth terms, a significantly higher value of the LAI index was recorded after CS application compared to other forms of silicon.
In the years 2017–2019, a significant effect of the date of application of silicon-containing products on the value of the LAI index was observed on the second and third dates of measurements (Figure S1c). In the second measurement term, it had a significantly higher value in the variants using these products in the second application term compared to the first one, while in the third measurement term after application in the second and third application terms compared to the first one.
Years of the study significantly differentiated the PAR absorption value at each measurement date (Figure S2a). In the first measurement term, this feature had a significantly higher value in 2017 and 2018 compared to 2019. In the second measurement term in 2017 compared to 2018 and 2019, and in the third and fourth measurement terms in 2018 compared to the other two years.
On average, for the entire study term, the forms of silicon used significantly differentiated the PAR absorption value at each measurement date (Figure S2b). In the first measurement date, it was significantly higher in objects with the CS application compared to PS. In the second and third terms after applying CS to other forms of silicon. However, in the fourth term after CS application compared to PS and OSA.
In the years 2017–2019, the date of use of silicon-containing products had a significant effect on the PAR absorption value only in the third measurement term (Figure S2c). It was significantly greater after application on the second and third dates than on the first date.
Years of the study significantly influenced the value of the NDVI index at each measurement date (Figure S3a). In the first, second, and fourth measurement dates, it was significantly higher in 2018 compared to other years. However, in the third measurement term, the NDVI index had a significantly higher value in 2017 compared to 2018 and 2019.
On average, over the entire study term, silicon forms significantly differentiated the NDVI value at each measurement date (Figure S3b). In the first, third, and fourth measurement dates, a significantly higher NDVI value was recorded after the application of CS compared to the other forms, and in the second measurement date after the application of CS compared to PS and SM.
Throughout the entire study term, the date of use of silicon-containing products had a significant effect on the value of the NDVI index only on the second measurement date (Figure S3c). It was then significantly higher in objects with the second and third application dates compared to the first application dates.
To characterize the variability of the studied traits, basic statistics such as means, range, standard deviations and coefficient of variations were calculated. In each of the years of the study and at each measurement date, the LAI index was characterized by the greatest variability (Table 6). The value of the coefficient of variation of this indicator decreased with each subsequent measurement, except for 2017, when it increased in the second term compared to the first term, and in the fourth term compared to the third term.
The NDVI index was characterized by the lowest variability in each of the study years and in each of the measurement dates, with the exception of the second measurement date in 2017, the third measurement date in 2018, and the fourth measurement date in 2019.
On average, during the entire study term, the LAI index was characterized by the greatest variability at each measurement date and the NDVI index was characterized by the smallest variability, with the exception of the fourth measurement. The value of the coefficient of variation for the LAI index decreased with each subsequent measurement, and in the case of the NDVI index, it increased on the second measurement date and then decreased.
During the entire study term, in the second measurement term, a significant positive relationship was found between PAR absorption and root yield (r = 0.496), PAR absorption and biological sugar yield (r = 0.438), and PAR absorption and pure sugar yield (r = 0.408). On the third measurement date, a significant positive correlation was confirmed NDVI index with root yield (r = 0.443), NDVI index with sugar content in roots (r = 0.318), NDVI index with biological sugar yield (r = 0.476), and NDVI index with pure sugar yield (r = 0.476).

3.2. Root Yield and Yield Related Traits

For each trait, ANOVA and multiple comparisons of the means were performed for individual years as well for total period of the study. p-values for ANOVA were presented and homogenous groups of the means were distinguished. The plant population before harvest in 2017 and 2019 was significantly higher than in 2018 (Table S2). The average for the entire study period was 82.5 thousand plants ha−1 up to 93.1 thousand plants ha−1.
The root yield was significantly influenced by the years of the study and their interaction with the date of application (Table S3). The highest root yield was obtained in the first year of the study, and the lowest in the second year. On average, during the entire study term, neither the form of silicon nor the application date had a significant effect on root yield. In 2017, a significantly higher root yield was obtained when using OSA compared to SM and CS, and in 2019, PS compared to OSA. In 2018, no significant effect of the forms of silicon used on the size of the tested feature was observed. The date of foliar application differentiated root yields in 2018 and 2019. In the second year of the study, the date of foliar application of the tested forms of silicon was characterized by a significantly higher root yield than date I, and in the third year of the experiment, foliar application in date I resulted in a significant increase in root yield compared to both remaining dates. In 2017, the root yield did not differ significantly depending on the date of foliar application of the forms of silicon used.
Years of the study, form of silicon, interaction of years and form of silicon, years and date of application, and years, form of silicon, and date significantly differentiated the yield of sugar beet leaves (Table S4). Indeed, the largest one was recorded in 2017, while in the other two years, the yield had a similar value.
On average, during the entire study term, the applied forms of silicon had a significant effect on the leaf yield, unlike the date of their application, which had no significant effect. A significantly higher leaf yield was obtained after the application of CS compared to PS and SM. On average, during the entire study period, no significant interaction between the silicon forms used and the application date was found.
Years of the study, form of silicon, date of application, interaction of years and form of silicon, as well as form of silicon and date of application significantly influenced the sugar content in sugar beet roots (Table S5). The highest was found in 2019 and the lowest in 2018. On average, throughout the entire study period, both the form of silicon and the date of application had a significant effect on the sugar content in the roots. A significantly higher sugar content in the roots was found after the use of OSA compared to other forms. The second application date contributed to a significant increase in the content of the tested ingredient compared to the first application date. In 2017, the sugar content was significantly higher after the application of OSA compared to MS. In 2018, after the application of CS and OSA, a significantly higher sugar content was observed in the roots than after both other forms, and in 2019 after the application of OSA compared to the other forms. The date of application of various forms of silicon significantly varied the sugar content in the roots in 2017—application on the second and third dates significantly increased this content compared to the first date.
Years of the study, form of silicon, interaction of years and form of silicon, form of silicon and application date, and years, form of silicon and application date significantly differentiated the content of α-amino nitrogen in sugar beet roots (Table S6). Its content in roots in 2017 and 2018 was at a similar level and significantly higher compared to 2019. On average, for the entire study period, the forms of silicon used had a significant effect on the value of this feature, while the date of their application did not show such an effect. The highest content of α-amino nitrogen in the roots was found after the application of SM, which was significantly higher compared to other forms of silicon. However, it is the smallest after PS application and significantly smaller compared to other forms of silicon. On average, throughout the entire study period, the content of α-amino nitrogen was significantly higher after the application of PS in the first and second terms, SM and CS in each term, and OSA in the second and third terms. In 2017, the content of α-amino nitrogen in the roots was significantly lower after the application of OSA, and in 2018 and 2019 after the application of PS compared to other forms of silicon. The date of foliar application did not have a significant effect on the α-amino nitrogen content in roots in any of the years of the study.
Years of the study, form of silicon, interaction of years of the study and form of silicon, form of silicon and application date, and years, form of silicon and application date had a significant effect on the potassium content in sugar beet roots (Table S7). The highest content was recorded in 2018 and the lowest in 2019.
On average, for the entire study period, a significant effect of the form of silicon on the potassium content in sugar beet roots was found. The analysis of the p value indicates that the application date in 2017–2019 did not have a significant effect on the potassium content in the roots, and that it did in homogeneous groups. The potassium content in the roots after the application of potassium PS was significantly lower compared to other forms. In the years 2017–2019, application in the first term contributed to a significant increase in the potassium content in the roots compared to the third term. On average, throughout the entire study period, the potassium content in the roots was significantly higher after the application of SM on each date and CS on the first and second dates. In 2017, the use of PS and OSA contributed to a significant reduction in the potassium content in the roots compared to SM and CS, and in 2018 and 2019, PS compared to the other forms. The application date significantly differentiated the potassium content in the roots in the second and third year of the study. In 2018, the application in the second term contributed to a significant reduction in the content of the tested molasses-forming ingredient compared to the first term, and in 2019 in the first and second terms compared to the third term.
The sodium content in sugar beet roots was significantly influenced by years of the study, form of silicon, interaction of years of the study and form of silicon, years and application date, form of silicon and application date, and years, form of silicon and application date (Table S8). The highest content of this element was found in 2017 and the lowest in 2019. On average, for the entire study period, there was a significant effect of the form of silicon, and no significant effect of the application date on the sodium content in the roots. The use of OSA resulted in a significant reduction in the content of the tested molasses-forming component in the roots compared to other forms. On average, throughout the entire study period, the sodium content was significantly higher after the application of PS and SM on each date, as well as CS on the first and third dates. In 2017, significantly lower sodium content in the roots was found after the application of OSA, in 2018 after the application of CS and OSA, and in 2019 after the application of SM compared to the other forms. In 2017, a significantly lower sodium content in the roots was found after the first and second dates of application compared to the third dates, and in 2019 after the second and third dates compared to the first dates.
The biological yield of sugar was significantly influenced by the years of the study, the interaction of years and form of silicon, and years and date of application (Table S9). The highest biological yield of sugar was in 2017 and the lowest in 2018. The analysis of the p value indicates that, on average for the entire study period, the form of silicon did not have a significant effect on the biological yield of sugar, while it did according to homogeneous groups. It was significantly greater after the use of PS compared to MS. In the years 2017–2019, the application date did not have a significant effect on the value of this feature. In 2017, a significantly higher biological sugar yield was found after the use of OSA compared to other forms. In 2018, there was no significant effect of the form of silicon, and in 2019, the biological sugar yield was significantly higher after the use of PS compared to SM and OSA. The application date significantly differentiated the biological sugar yield in 2018 and 2019. In the second year of the study, it was significantly higher after application on the second date compared to the first date, and in the last year of the study after application on the first date compared to the other two dates.
The years of the study and the interaction of years and form of silicon, as well as years and application date had a significant effect on the pure sugar yield (Table S10). The highest pure sugar yield was recorded in 2017, and the lowest a year later. According to the analysis of the p value, on average for the entire study period, the form of silicon did not have a significant effect on the pure sugar yield, but according to the homogeneous groups it did. It was significantly higher after the use of PS and OSA compared to SM. The application date in 2017–2019 did not have a significant effect on the pure sugar yield. In 2017, a significantly higher technological sugar yield was found after the application of OSA compared to other forms. A year later, there was no significant effect of the forms of silicon used on the value of the tested feature. However, in 2019, the technological sugar yield was significantly higher after the application of PS compared to SM and OSA. The date of application significantly differentiated the pure sugar yield in 2018 and 2019. In 2018, it was significantly higher after application on the second date compared to the first, and in 2019 after application on the first date compared to the other two dates.
To characterize variability of the studied traits, statistical parameters such as means, range, standard deviations and coefficient of variations were calculated. Among the tested sugar beet yield characteristics, the highest variability during the entire study period was observed in the sodium content in roots (CV = 38.58), and the lowest in sugar content (CV = 5.94%) (Table 7).

4. Discussion

In our own research, the assessed physiological parameters of sugar beet plants (LAI index, PAR absorption, and NDVI index) varied significantly over the years of the study. It was mainly caused by variability of weather conditions between years.
On average, during the entire study period, the form of silicon significantly modified the assessed physiological parameters at almost every measurement date, and the date of application only in some of them. In the third and fourth measurement terms, the highest values of the LAI index were obtained after the application of CS, PAR absorption after the application of CS, and in the fourth measurement term, also SM. The use of CS allowed us to obtain the highest value of the NDVI index on the second, third, and fourth measurement dates.
Other studies using GMC showed a significant positive relationship between the pure sugar yield and the biological yield of sugar with the share of petiole dry matter in the dry matter of the whole plant, and a negative relationship with the share of root dry matter in the plant’s dry matter [37].
Our own research revealed a significant positive relationship between root yield, biological yield of sugar, and pure sugar yield with PAR absorption on the second measurement date, and root yield, sugar content in roots, biological yield of sugar, and pure sugar yield with the NDVI index on the third measurement date. It indicates that canopy density in early growth stages is related to yield and yield-related traits of sugar beet.
Photosynthetic efficiency is modulated by a number of stress factors, the effects of which can be reduced by silicon [38]. In potato cultivation, SM caused an increase in plant height and above-ground plant biomass, enlarged leaf area, and decreased leaf weight ratio (LWR), and, as a result, increased tuber number and tuber weight per plant [39]. The effect of SM depended on a water deficit during potato growth. The average tuber weight per plant in the cultivation treated with SM was higher by 23% under periodic water deficits during potato growth, and by 13% under drought conditions, than in the cultivation without SM.
The use of DM in potato production resulted in an increase in the assimilation area and an increase in the leaf area index (LAI), leaf dry weight, the content of chlorophyll a (Chl a), chlorophyll b (Chl b), and carotenoids (Car) and a decrease in the Chl a/Chl b ratio under conditions water deficit, but had no effect on specific leaf area (SLA) and the Chl (a + b)/Car ratio in potato production [40].
In our own research, the root yield was significantly influenced by the years of the study and their interaction with the date of application. The highest root yield was obtained in 2017, which had the best conditions for the growth and yield of sugar beet, and the lowest a year later, when they were the least favorable. In 2019, a year that was moderate in terms of weather conditions, it was 18% higher than in 2018 and 26% lower than in 2017. The selection of the silicon form and the application date had no significant effect on the root yield.
Most studies using foliar products containing silicon prove that they have a positive effect on the yield of sugar beet roots. A significant increase in root yield was obtained after the use of GMC [41,42,43], SM [42,44], OSA [44], CS [44], and SSN [15].
Few authors [45] used foliar application of GMC on several production plantations and found that the effect on root yield varied greatly in individual years of the study and depended on habitat conditions. Root yield increased after application in the year when weather conditions were less favorable for sugar beet yield [15].
The closest plant to sugar beet, because it also belongs to the group of root crops, is the potato. Wróbel [46] found no effect of OSA application on tuber yield. However, he noted a significant effect of this product on reducing the share of the smallest tubers in the yield by approximately 50%, as well as increasing the share of the largest tubers.
Foliar application of GMC increased the total tuber yield by 9% and the marketable yield by 11%, with a much greater increase observed in the year when yielding conditions were more difficult. An increase in the share of tubers with a diameter of 50–60 mm and over 60 mm was also observed [47]. In other studies, a significant increase in tuber yield compared to the control variant was achieved as a result of foliar application of OSA with the addition of trace elements [48,49,50]. However, no significant effect on the structure of tuber yield was observed [48,49] or a tendency to increase the share of tubers with a diameter above 60 mm in the yield structure [50]. Studies with GMC showed a significant increase in tuber yield (by 9.5%) compared to the control combination and the share of tubers with a diameter above 60 mm [51]. The use of SM resulted in a significant increase in the marketable yield of tubers by 20.1% and the share of the medium-sized tuber fraction (41–50 mm in diameter) in the marketable yield [52].
In our own research, the sugar content in sugar beet roots varied significantly between the years of the study and was the highest in 2019 and the lowest the year before. The year 2017 was the most favorable in terms of weather conditions, especially rainfall, and was average in terms of sugar content in beetroot roots.
The selection of the form of silicon and the date of application also had a significant effect on the content of this ingredient in the roots. The highest sugar content in the roots was obtained using OSA. The second application date turned out to be the most favorable for the sugar content in the roots. Years of the study have significantly modified the effect of the forms of silicon used.
The vast majority of research results indicate no significant effect of foliar-applied silicon products on the sugar content in sugar beet roots [41,42,45] or show a diversified effect, i.e., in one variant an increase and in others a decrease or no significant changes compared to the control combination [44]. Sometimes a significant increase in sugar content in roots was achieved after foliar application of SSN in combination with potassium-sulfur fertilizer [15].
In our own research, the content of α-amino nitrogen in sugar beet roots in 2017 and 2018 was significantly higher than in 2019. The highest content of α-amino nitrogen was in roots from objects where SM was applied, and the smallest after PS application. The content of α-amino nitrogen in the roots of individual years was determined by different experimental combinations.
Foliar applications of GMC [41] and SSN [15] resulted in a significant reduction in the content of α-amino nitrogen in sugar beet roots. In some studies, an increase in the content of the tested molasses-producing component was observed in one of the variants used, while in the others there was no significant effect [42,44]. No significant changes in the α-amino nitrogen content in roots were also reported under the influence of foliar application of GMC [43]. It was also found that the years of the study and the location of the experiment mainly determined the effect of GMC on the α-amino nitrogen content in sugar beet roots [45].
In our own research, the potassium content in sugar beet roots was significantly modified over the years of the study. It indicates that weather conditions have strong effect on the chemical composition of roots. The roots had the highest content of this molasses-forming ingredient in 2018, and the lowest a year later. The potassium content in roots in 2017 was 13% lower than a year later and 6% higher than in the last year of the study. Throughout the entire study period, roots after SM application had the highest potassium content, and PS had the lowest potassium content. The analysis of homogeneous groups shows that the application date had a significant effect on the content of this molasses-forming component; the first application date resulted in a significant increase in the potassium content in the roots compared to the third application date.
The results of studies using foliar products containing silicon in sugar beet cultivation indicate no significant effect or variation on the potassium content in roots [41,42,43]. Foliar application of SSN increased the potassium content in sugar beet roots in one of the variants, and in two others it decreased compared to the control combination [15]. A significant increase in potassium content in roots was found in combinations with OSA and CS, and no significant differences were found in the combination with SM compared to the control variant [44]. Some authors observed that the effect of foliar application of GMC on the potassium content in roots was ambiguous and variable, depending on the years of the study and the location of the study [45].
In our own research, the sodium content in sugar beet roots was significantly dependent on the years of the study. It confirms that weather conditions have a strong effect on the chemical composition of roots. The highest content of this molasses-forming component in the roots was found in the first year of study, and the lowest in the third year. The sodium content in the roots in 2018 was 11% lower than the previous year and 69% higher than in 2019. The lowest sodium content was in the roots from combinations with OSA objects, and the highest in the MS variants. Different variants in particular years determined the highest sodium content in the roots.
Literature data also indicate a varied effect of the use of foliar products containing silicon on the sodium content in sugar beet roots. Some report no significant changes [43], a downward trend [41,42], or a significant decrease in the content of the molasses-forming component in all or some of the experimental variants [15]. Some authors showed a significant increase in sodium content in roots after the foliar application of OSA and no significant differences after the application of SM and CS [44]. Other authors did not find a clear effect of the foliar application of GMC on the sodium content in roots [45].
Foliar application of GMC in potato cultivation resulted in a decrease in the share of green tubers in the yield and had no significant effect on the content of starch, nitrates, and dry matter in tubers [47]. Foliar application of OSA with the addition of trace elements resulted in a significant increase in the content of vitamin C and starch in tubers and a decrease in the content of nitrates. However, no significant effect was observed on the share of deformed and green tubers per hundred to the control combination [48]. Foliar application of the same product containing OSA and trace elements in other studies resulted in an increase in the content of vitamin C in tubers in each of the years of the study, and of starch, and a significant decrease in the content of nitrates in one of the years [49]. The application of this product resulted in a decreasing trend in the share of deformed tubers in the yield. A beneficial effect on the content of starch and vitamin C in tubers has also been demonstrated [50]. Foliar application of GMC resulted in a significant increase in the content of starch acid and vitamin C compared to the control variant [51].
In our own research, the biological yield of sugar varied significantly depending on the years of the study; the highest was obtained in 2017 and the lowest a year later, which resulted from the weather conditions. In 2019, the biological sugar yield was 36% higher than in 2018. On average during the study period, the combination with PS was characterized by a significantly higher biological sugar yield than the variant with SM. The application date did not have a significant effect on the value of the assessed feature.
In the vast majority of previous studies with sugar beet, the foliar application of silicon-containing products, at least in some experimental variants, resulted in a significant increase in the biological yield of sugar [15,41,42,43,44].
In our own research, the highest technological sugar yield was obtained in the first year of study, and the lowest in the second year. In the third year of the study, it was 42% higher than in the second year. On average, during the study period, the combination of PS and OSA was characterized by a significantly higher technological sugar yield than the variant with SM. The application date did not have a significant effect on the value of the assessed feature. What was important was the interaction of years of the study and products, as well as years of the study and application date. In the first year of the study, the highest technological sugar yield was obtained after the application of PS in the second and third terms, SM in the third term, CS in the first term, and OSA in each term. In the second year of study after the application of PS in the first term, SM and CS in the second term, and OSA in the second and third term. In the third year of the study, after the application of PS and CS in the first and second term, as well as SM and OSA in the first term.
In the vast majority of studies to date, the foliar application of silicon-containing products resulted, at least in some experimental combinations, in a significant increase in the technological yield of sugar compared to the control combination [15,41,42,43]. Some authors observed slight differences in the technological yield of sugar [44,45].

5. Conclusions

The obtained research results prove that the foliar application of products containing various forms of silicon has a significant effect on the physiological parameters of plants, such as leaf area index (LAI), absorption of photosynthetically active radiation (PAR) and normalized difference vegetation index (NDVI). The highest value of these parameters, assessed 7 days after the last application date (14 days after the six-leaf phase), is achieved by the application of CS, and in the case of absorption of photosynthetically active radiation (PAR), SM.
The timing of the foliar application of products containing silicon in various forms significantly modifies only some physiological parameters and in some measurement dates, and the interaction of the application date and the products most of the parameters and in most measurement dates.
The form of silicon applied foliarly does not have a significant effect on the yield of sugar beet roots and significantly modifies the biological yield of sugar and the technological yield of sugar. The highest biological yield of sugar is achieved by the foliar application of PS, and the technological yield of sugar by PS and OSA. The date of foliar application as well as the interaction of the date of application and silicon forms do not have a significant effect on the root yield, biological yield of sugar, and pure sugar yield.
The form of silicon has a significant effect on the technological quality of sugar beet roots (sugar, α-amino nitrogen, potassium, and sodium content). The most beneficial effect on the sugar content and reduction of sodium content in sugar beet roots is the foliar application of OSA, and the reduction of α-amino nitrogen and potassium content—PS.
The timing of the application of various forms of silicon has a significant effect on the sugar and potassium content in sugar beet roots. The application carried out 7 days after the six-leaf phase of sugar beet (BBCH 16) has the most beneficial effect on the sugar content in the roots, and the potassium content is most limited by the treatment 14 days after reaching this phase. The interaction of the timing of the foliar application and the form of silicon significantly modifies the technological quality features of sugar beet roots: the content of sugar, α-amino nitrogen, potassium, and sodium.
The effect of foliar silicon fertilization is modified by years, i.e., variable weather conditions between years of the study. The strongest variability of weather is observed for precipitation and because of that we can conclude that soil water availability for plants is one of the main factors which has a strong effect on the foliar fertilization of silicon.

Supplementary Materials

The following supporting information can be downloaded at: https://www.mdpi.com/article/10.3390/agriculture14010086/s1, Figure S1. Changes in LAI in years of the experiment (a); depending on silicon form in 2017–2019 (b); depending on term of foliar application in 2017–2019 (c). The same letters indicate lack of significant differences at p = 0.05; Figure S2. Changes in PAR absorption in years of the experiment (a); depending on silicon form in 2017–2019 (b); depending on term of foliar application in 2017–2019 (c), %. The same letters indicate lack of significant differences at p = 0.05; Figure S3. Changes in NDVI value in years of the experiment (a); depending on silicon form in 2017–2019 (b); depending on term of foliar application in 2017–2019 (c). The same letters indicate lack of significant differences at p = 0.05; Table S1: Fertilization treatments in the experiment (2016/2017–2018/2019); Table S2. Number of sugar beet plants at harvest depending on the form of silicon (A) and the term of foliar application (B) (in 2017–2019), thousand plants ha−1; root yield of sugar beet plants at harvest depending on the form of silicon (A) and the term of foliar application (B) (in 2017–2019), t ha−1; Table S3. Root yield of sugar beet plants at harvest depending on the form of silicon (A) and the term of foliar application (B) (in 2017–2019), t ha−1; Table S4. Yield of leaves of sugar beet plants at harvest depending on the form of silicon (A) and the term of foliar application (B) (in 2017–2019), t ha−1; Table S5. Content of sugar in sugar beet roots depending on the form of silicon (A) and the term of foliar application (B) (in 2017–2019), %; Table S6. The content of α-amino nitrogen in sugar beet roots depending on the form of silicon (A) and the term of foliar application (B) (in 2017–2019), mmol kg−1; Table S7. Potassium content in sugar beet roots depending on the form of silicon (A) and the date of foliar application (B) (2017–2019), mmol kg−1; Table S8. Sodium content in sugar beet roots depending on the form of silicon (A) and the date of foliar application (B) (in 2017–2019), mmol kg−1; Table S9. Biological yield of sugar depending on the form of silicon (A) and the term of foliar application (B) (in 2017–2019), t ha−1; Table S10. Pure sugar yield depending on the form of silicon (A) and the term of foliar application (B) (in 2017–2019), t ha−1.

Author Contributions

Conceptualization, A.S. and A.A.; formal analysis, A.A.; investigation, A.A.; methodology, A.A; supervision, A.A.; visualization, D.G.; writing—original draft, A.S, A.A., D.G. and Z.A.; writing—review & editing, A.A., D.G. and Z.A. All authors have read and agreed to the published version of the manuscript.

Funding

This research received no external funding.

Institutional Review Board Statement

Not applicable.

Data Availability Statement

Data is available on request from the corresponding author.

Acknowledgments

The authors would like to thank KHBC Sp. z o. o. and KWS Polska Sp. z o. o. for technical support in conducting the research.

Conflicts of Interest

The authors declare no conflict of interest.

Abbreviations

potassium silicatePS
calcium silicateCS
sodium metasilicateSM
orthosilicic stabilized acidOSA
ground marine calciteGMC
stabilized silica nanoparticlesSSN

References

  1. Vurukonda, S.S.K.P.; Vardharajula, S.; Shrivastava, M.; Skz, A. Enhancement of drought stress tolerance in crops by plant growth promoting rhizobacteria. Microbiol. Res. 2016, 184, 13–24. [Google Scholar] [CrossRef] [PubMed]
  2. United Nations Convention to Combat Desertification. Drought in numbers 2022—Restoration for readiness and resilience. In Proceedings of the (UNCCD) 15th Session of the Conference of the Parties (COP15), Abidjan, Côte d’Ivoire, 9–20 May 2022. [Google Scholar]
  3. Mancosu, N.; Snyder, R.L.; Kyriakakis, G.; Spano, D. Water scarcity and future challenges for food production. Water 2015, 7, 975–992. [Google Scholar] [CrossRef]
  4. Shirani Rad, A.H.; Eyni-Nargeseh, H.; Shiranirad, S.; Heidarzadeh, A. Effect of Potassium Silicate on Seed Yield and Fatty Acid Composition of Rapeseed (Brassica napus L.) Genotypes Under Different Irrigation Regimes. Silicon 2022, 14, 11927–11938. [Google Scholar] [CrossRef]
  5. Borawska-Jarmułowicz, B.; Mastalerczuk, G.; Janicka, M.; Wróbel, B. Effect of Silicon-Containing Fertilizers on the Nutritional Value of Grass–Legume Mixtures on Temporary Grasslands. Agriculture 2022, 12, 145. [Google Scholar] [CrossRef]
  6. Mastalerczuk, G.; Borawska-Jarmułowicz, B.; Darkalt, A. Changes in the Physiological and Morphometric Characteristics, and Biomass Distribution of Forage Grasses Growing under Conditions of Drought and Silicon Application. Plants 2023, 12, 16. [Google Scholar] [CrossRef]
  7. Szpunar-Krok, E. Physiological Response of Pea (Pisum sativum L.) Plants to Foliar Application of Biostimulants. Agronomy 2022, 12, 3189. [Google Scholar] [CrossRef]
  8. Ahmed, S.; Iqbal, M.; Ahmad, Z.; Iqbal, M.A.; Artyszak, A.; Sabagh, A.E.L.; Alharby, H.F.; Hossain, A. Foliar Application of Silicon-Based Nanoparticles Improve the Adaptability of Maize (Zea mays L.) in Cadmium Contaminated Soils. Environ. Sci. Pollut. Res. 2023, 30, 41002–41013. [Google Scholar] [CrossRef]
  9. Tobiasz-Salach, R.; Mazurek, M.; Jacek, B. Physiological, Biochemical, and Epigenetic Reaction of Maize (Zea mays L.) to Cultivation in Conditions of Varying Soil Salinity and Foliar Application of Silicon. Int. J. Mol. Sci. 2023, 24, 1141. [Google Scholar] [CrossRef]
  10. Elshamly, A.M.S. Interaction Effects of Sowing Date, Irrigation Levels, Chitosan, and Potassium Silicate On Yield and Water Use Efficiency for Maize Grown Under Arid Climate. Gesunde Pflanz. 2023, 75, 1601–1613. [Google Scholar] [CrossRef]
  11. Kalyani, M.; Biswarup Mehera, B.; Kumar, P. Effect of Zinc and Foliar Application of Silicon on Growth and Yield of Maize (Zea mays L.). Int. J. Plant Soil Sci. 2023, 35, 141–146. [Google Scholar] [CrossRef]
  12. Sattar, A.; Cheema, M.A.; Sher, A.; Ijaz, M.; Wasaya, A.; Yasir, T.A.; Abbas, T.; Hussain, M. Foliar Applied Silicon Improves Water Relations, Stay Green and Enzymatic Antioxidants Activity in Late Sown Wheat. Silicon 2020, 12, 223–230. [Google Scholar] [CrossRef]
  13. Bukhari, M.A.; Sharif, M.S.; Ahmad, Z.; Barutçular, C.; Afzal, M.; Hossain, A.; Sabagh, A.E. Silicon Mitigates the Adverse Effect of Drought in Canola (Brassica napus L.) Through Promoting the Physiological and Antioxidants Activity. Silicon 2021, 13, 3817–3826. [Google Scholar] [CrossRef]
  14. Available online: https://www.fao.org/faostat/en/#data/QCL/visualize (accessed on 30 November 2023).
  15. Hřivna, L.; Hernandez Kong, J.; Machálková, L.; Burešová, I.; Sapáková, E.; Kučerová, J.; Šottníková, V. Effect of foliar nutrition of potassium and silicon on yield and quality of sugar beet in unusual windy conditions in 2014 and 2015. Listy Cukrov. Repar. 2017, 133, 182–187. (In Czech) [Google Scholar]
  16. Urban, J.; Pulkrabek, J. Increased yield and quality of sugar beet by means of foliar nutrition and biologically active substances. Listy Cukrov. Repar. 2018, 134, 188–194. (In Czech) [Google Scholar]
  17. Pilon, C.; Soratto, R.P.; Moreno, L.A. Effects of soil and foliar application of soluble silicon on mineral nutrition, gas exchange, and growth of potato plants. Crop Sci. 2013, 53, 1605–1614. [Google Scholar] [CrossRef]
  18. Maghsoudi, K.; Emam, Y.; Ashraf, M. Influence of foliar application of silicon on chlorophyll fluorescence, photosynthetic pigments, and growth in water-stressed wheat cultivars differing in drought tolerance. Turk. J. Bot. 2015, 39, 625–634. [Google Scholar] [CrossRef]
  19. Ahmad, A.; Afzal, M.; Ahmad, A.U.H.; Tahir, M. Effect of foliar application of silicon on yield and quality of rice (Oryza sativa L.). Cercet. Agron. În Mold. 2013, 155, 21–28. [Google Scholar] [CrossRef]
  20. Bijanzadeh, E.; Barati, V.; Egan, T.P. Foliar application of sodium silicate mitigates drought stressed leaf structure in corn (Zea mays L.). S. Afr. J. Bot. 2022, 147, 8–17. [Google Scholar] [CrossRef]
  21. Rea, R.S.; Islam, M.R.; Rahman, M.M.; Nath, B.; Mix, K. Growth, nutrient accumulation, and drought tolerance in crop plants with silicon application: A review. Sustainability 2022, 14, 4525. [Google Scholar] [CrossRef]
  22. IUSS Working Group WRB. World Reference Base for Soil Resources 2014. International Soil Classification System for Naming Soils and Creating Legends for Soil Maps. Update 2015; World Soil Resources Raport 106; FAO: Rome, Italy, 2015. [Google Scholar]
  23. Research Procedure of the Regional Agrochemical Station in Warsaw No. PB 01 ed. 4, 15/10/2009.
  24. PN-ISO 10390:1997; Soil Quality—pH Determination. PKN: Warsaw, Poland, 1997.
  25. Research Procedure of the Regional Agrochemical Station in Warsaw No. PB 46 ed. 4, 23/10/2017.
  26. Polish Standard PN-R-04023:1996; Agro-Chemical Analysis of Soil—Determination of Available Phosphorus Content in Mineral Soils. PKN: Warsaw, Poland, 1996. (In Polish)
  27. Polish Standard PN-R-04022:1996/Az1:2002; Agro-Chemical Analysis of Soil—Determination of Available Potassium Content in Mineral Soils. PKN: Warsaw, Poland, 1996. (In Polish)
  28. Polish Standard PN-R-04020:1994/Az1:2004; Agro-Chemical Analysis of Soil—Determination of Available Magnesium Content in Mineral Soils. PKN: Warsaw, Poland, 1994. (In Polish)
  29. Polish Standard PN-93/R-04018; Agro-Chemical Analysis of Soil. Determination of Available Boron. PKN: Warsaw, Poland, 1993. (In Polish)
  30. Polish Standard PN-92/R-04017; Agro-Chemical Analysis of Soil. Determination of Available Copper. PKN: Warsaw, Poland, 1993. (In Polish)
  31. Polish Standard PN-R-04021:1994; Agro-Chemical Analysis of Soil. Determination of Available Iron. PKN: Warsaw, Poland, 1994. (In Polish)
  32. Polish Standard PN-93/R-04019; Agro-Chemical Analysis of Soil. Determination of Available Manganese. PKN: Warsaw, Poland, 1994. (In Polish)
  33. Polish Standard PN-92/R-04016; Agro-Chemical Analysis of Soil. Determination of Available Zinc. PKN: Warsaw, Poland, 1992. (In Polish)
  34. Research Centre for Cultivat Testing. Descriptive List of Agricultural Plant Varieties. Beetroot, Potato, Oilseeds, Fodder; Research Centre for Cultivat Testing: Słupia Wielka, Poland, 2015; Volume 17. (In Polish) [Google Scholar]
  35. Polish Standard PN-R-74458; Sugar Beet Roots. PKN: Warsaw, Poland, 1999. (In Polish)
  36. Buchholz, K.; Märländer, B.; Puke, H.; Glattkowski, H.; Thielecke, K. Neubewertung des technischen Wertes von Zuckerrben. Zuckerindustrie 1995, 120, 113–121. [Google Scholar]
  37. Artyszak, A.; Gozdowski, D.; Kucińska, K. Effect of foliar fertilization with marine calcite on morphological features of sugar beet. Listy Cukrov. Repar. 2016, 132, 176–179. [Google Scholar]
  38. Rastogi, A.; Yadav, S.; Hussain, S.; Kataria, S.; Hajihashemi, S.; Kumari, P.; Yang, X.; Brestic, M. Does Silicon Really Matter for the Photosynthetic Machinery in Plants? Plant Physiol. Biochem. 2021, 169, 40–48. [Google Scholar] [CrossRef] [PubMed]
  39. Wadas, W. Potato (Solanum tuberosum L.) Growth in Response to Foliar Silicon Application. Agronomy 2021, 11, 2423. [Google Scholar] [CrossRef]
  40. Wadas, W.; Dębski, H. Effect of silicon foliar application on the assimilation area and photosynthetic pigment contents of potato (Solanum tuberosum L.). Appl. Ecol. Environ. Res. 2022, 20, 1369–1384. [Google Scholar] [CrossRef]
  41. Artyszak, A.; Gozdowski, D.; Kucińska, K. The effect of foliar fertilization with marine calcite in sugar beet. Plant Soil Environ. 2014, 60, 413–417. [Google Scholar] [CrossRef]
  42. Artyszak, A.; Gozdowski, D.; Kucińska, K. The effect of silicon foliar fertilization in sugar beet Beta vulgaris (L.) ssp. vulgaris conv. crassa (Alef.) prov. Altissima (Döll). Turk. J. Field Crops 2015, 20, 115–119. [Google Scholar]
  43. Artyszak, A.; Gozdowski, D.; Kucińska, K. The effect of calcium and silicon foliar fertilization in sugar beet. Sugar Tech. 2016, 18, 109–114. [Google Scholar] [CrossRef]
  44. Artyszak, A.; Gozdowski, D. Influence of various forms of foliar application on root yield and technological quality of sugar beet. Agriculture 2021, 11, 693. [Google Scholar] [CrossRef]
  45. Górski, D.; Gaj, R.; Ulatowska, A.; Piszczek, J. Effect of foliar application of silicon and calcium on yields and technological quality sugar beet. Fragm. Agron. 2017, 34, 46–58. (In Polish) [Google Scholar]
  46. Wróbel, S. Effects of fertilization of potato cultivar Jelly with foliar fertilizers YaraVita Ziemniak and Actisil. Biul. IHAR 2012, 266, 295–306. (In Polish) [Google Scholar] [CrossRef]
  47. Trawczyński, C. The influence of foliar fertilization with Herbagreen on potato yield. Ziemn. Pol. 2013, 2, 29–33. (In Polish) [Google Scholar]
  48. Trawczyński, C. The effect of foliar preparation with silicon on the yield and quality of potato tubers in compared to selected biostymulators. Fragm. Agron. 2018, 35, 113–122. (In Polish) [Google Scholar] [CrossRef]
  49. Trawczyński, C. Wpływ biostymulatorów na plon i jakość bulw ziemniaka uprawianego w warunkach suszy i wysokiej temperatury. Biul. IHAR. 2020, 289, 11–19. [Google Scholar] [CrossRef]
  50. Trawczyński, C. Assess of tuber yield and quality after foliar application of silicon and microelements. Agron. Sci. 2021, 76, 9–20. [Google Scholar] [CrossRef]
  51. Trawczyński, C. Effect of foliar fertilization with multicomponent fertilizers in form nanoparticle on the yield and quality of potato tubers. Agron. Sci. 2022, 78, 77–90. [Google Scholar] [CrossRef]
  52. Wadas, W. Possibility of increasing early potato yield with foliar application of silicon. Agron. Sci. 2022, 2, 61–75. [Google Scholar] [CrossRef]
Figure 1. Location of the field experiments.
Agriculture 14 00086 g001
Table 1. Soil conditions before establishing an experiment with sugar beet (2016–2018).
Soil Layer, cm pHKClmg kg−1Nmin, kg ha−1mg kg−1
Corg %N-NO3N-NH4PKMgBCuFeMnZn
2016
0–302.117.320.13.109146104712.806.45401646.3
30–601.387.316.22.17725775751.907.3720935.4
2017
0–301.667.536.21.581478762692.237.34901675.9
30–601.027.86.63.60405721701.495.75201104.8
2018
0–302.767.318.43.119391133995.578.86301578.0
30–602.227.413.22.476749621234.549.27001257.6
Table 2. Weather conditions during the growing season of sugar beet (2017–2019).
MonthPrecipitation, mmAverage Temperature, °CHydrothermal Coefficient, kInsolation, h
2017
April368.61.40156
May4513.51.08229
June3418.20.62299
July9518.91.62246
August1220.80.19303
September11814.52.71127
October10310.13.2975
Sum4431435
2018
April3613.90.86249
May4717.00.89299
June11118.12.04240
July18120.42.86173
August1320.80.20255
September3916.10.81199
October3910.61.19151
Sum466 1566
2019
April199.50.67222
May11814.12.70146
June5921.80.90306
July4518.20.80227
August13719.92.22215
September2413.70.58213
October2411.40.68186
Sum426 1515
multi-year *
April409.31.43192
May7314.31.65257
June7317.71.37294
July10019.71.64285
August6118.91.04287
September6013.81.45202
October518.41.96155
Sum4571672
* Precipitation 1991–2019; temperature: 2002–2019; insolation: 2010–2019. Source: own study based on data from Strzyżów Sugar Factory.
Table 3. Chemical composition of the products used in the experiment.
Product Content in 1 dm3
Agriker Silicium Si (in the form of potassium silicate)—97 g; K—70.6 g
Optysil Si (in the form of sodium metasilicate)—94 g; iron chelate (Fe–EDTA) Fe—24 g
SmartSil SCSi (in the form of calcium silicate)—63 g; Ca—159 g; Fe—8.4 g; K—7.6 g; Mg—4.5 g
YaraVita Actisil Si (in the form of orthosilicic acid)—6 g; Ca—20 g, choline
Source: information provided by producers.
Table 4. Variants applied in the experiment.
Silicon Form (A)Term of Application (B)Quantity of Ingredients Supplied, g ha−1
Potassium silicate (A1)six sugar beet leaf phase (B1)Si—48.5; K—35.3
7 days after the six sugar beet leaf phase (B2)
14 days after the six sugar beet leaf phase (B3)
Sodium metasilicate + iron chelate (A2)B1Si—47; Fe—12
B2
B3
Calcium silicate (A3)B1Si—63; Ca—159; Fe—8.4; K—7.6; Mg—4.5
B2
B3
Orthosilicic acid + choline (A4)B1Si—3; Ca—10, choline
B2
B3
Table 5. p-values based on analysis of variance for the assessed physiological parameters (2017–2019).
Term of MeasurementPhysiological ParameterYears of the Study (Y)Silicon Form (S)Term (T)Y × SY × TS × TY × S × T
ILAI<0.05<0.050.435<0.050.275<0.05<0.05
PAR absorption<0.050.1890.3240.2330.284<0.05<0.05
NDVI<0.05<0.050.484<0.05<0.050.0580.128
IILAI<0.05<0.05<0.05<0.05<0.050.313<0.05
PAR absorption<0.05<0.050.244<0.05<0.050.675<0.05
NDVI<0.05<0.05<0.05<0.050.075<0.050.834
IIILAI<0.05<0.05<0.05<0.05<0.05<0.05<0.05
PAR absorption<0.05<0.05<0.05<0.050.200<0.05<0.05
NDVI<0.05<0.050.254<0.050.1210.056<0.05
IVLAI<0.05<0.050.176<0.05<0.05<0.05<0.05
PAR absorption<0.05<0.050.898<0.05<0.05<0.05<0.05
NDVI<0.05<0.050.466<0.05<0.05<0.05<0.05
I term—six-leaf stage; II term—7 days later, III term—14 days later, IV term—21 days later.
Table 6. Characterization of statistical variability of physiological parameters of sugar beet (2017–2019).
Term of MeasurementPhysiological ParameterMeanMinimumMaximumStandard Deviation (SD)Coefficient of Variation (CV), %
ILAI0.260.040.970.1352.39
PAR absorption17.412.7061.367.8244.94
NDVI0.280.160.500.0519.79
IILAI0.930.232.530.4144.11
PAR absorption42.9715.0074.9312.5129.12
NDVI0.420.170.790.1127.06
IIILAI1.880.424.690.8042.33
PAR absorption64.2318.0097.1018.0228.05
NDVI0.610.270.870.1016.98
IVLAI2.500.954.780.7228.67
PAR absorption78.8153.2095.908.8111.18
NDVI0.740.400.870.0912.02
I term—six-leaf stage; II term—7 days later, III term—14 days later, IV term—21 days later.
Table 7. Characterization of statistical variability of sugar beet yield characteristics (2017–2019).
TraitMeanMinimumMaximumStandard Deviation (SD)Coefficient of Variation (CV), %
Plant density at harvest, thousand plants ha−188.2770.83113.899.3910.64
Yield of roots, t ha−180.7350.25117.7117.8822.14
Yield of leaves, t ha−144.3024.5874.1711.4825.91
Biological yield of sugar, t ha−114.258.3020.753.3923.79
Pure sugar yield, t ha−112.527.1018.433.0424.31
Content of sugar in roots, %17.5515.1019.271.045.94
The content of α-amino nitrogen in the roots, mmol kg−125.4113.4044.006.7826.68
Potassium content in the roots, mmol kg−133.8925.9048.604.4713.19
Sodium content in the roots, mmol kg−13.231.307.201.2538.58
Disclaimer/Publisher’s Note: The statements, opinions and data contained in all publications are solely those of the individual author(s) and contributor(s) and not of MDPI and/or the editor(s). MDPI and/or the editor(s) disclaim responsibility for any injury to people or property resulting from any ideas, methods, instructions or products referred to in the content.

