Article

Long-Term Simulated Direct N2O Emissions from German Oilseed Rape Cultivation below the IPCC Emission Factor

Institute of Crop Science and Plant Breeding, Agronomy and Crop Science, Kiel University, Hermann-Rodewald-Strasse 9, 24118 Kiel, Germany
*
Author to whom correspondence should be addressed.
Agriculture 2024, 14(1), 70; https://doi.org/10.3390/agriculture14010070
Submission received: 29 November 2023 / Revised: 25 December 2023 / Accepted: 27 December 2023 / Published: 29 December 2023

Abstract

:
The low nitrogen (N)-use efficiency of intensive winter oilseed rape (WOSR) cropping systems may cause negative environmental impacts, especially due to N leaching and gaseous losses. The aim of this study was to use data from field experiments (five sites across Germany representing typical WOSR regions) for parametrization of a nitrous oxide (N2O) emission component for implementation into a process-based dynamic plant-soil-atmosphere model (PSAM). After calibration and evaluation with three years of field data from five different N fertilizer treatments, a long-term simulation with 25-year historical weather data was conducted to derive functional relations and emission factors (EFs). The model performed best at higher aggregation levels (cumulative emissions over the entire cropping period, R2 of 0.48/0.77 for calibration/evaluation), but also reasonably simulated short-term dynamics (e.g., fertilizer applications, extreme weather events). Site-specific and year-specific N2O emissions varied within the range of medians from 0.56–4.93 kg N2O-N ha−1. Mineral fertilizer-induced EFs at economic optimal N inputs ranged from 0.16–0.65%, which was markedly below the aggregated IPCC standard value of 1% for direct N2O emissions. Generally, the simulated emissions were consistently higher with finer soil textures and increasing N inputs. The process-based approach, moreover, allowed the identification of the major source of N2O, which mainly originated from nitrification processes.

Graphical Abstract

1. Introduction

Nitrous oxide (N2O) is one of the most important greenhouse gases (GHGs) contributing to climate change, with a 100-year time horizon global-warming potential 273 times greater than that of CO2 [1]. Fifty-two percent of the anthropogenic direct N2O emissions are caused by agriculture and 58% of the natural global annual N2O emissions are from soils [2]. To prevent further global warming, emissions of N2O must be urgently reduced. Therefore, process-based dynamic crop models can help to better understand relevant processes and to identify priorities.
The complex interactions of many soil, microbial, and plant nitrogen (N)-associated processes (volatilization, leaching, mineralization, nitrification, denitrification, immobilization, plant N uptake, litter production) at varying spatial and temporal scales make this a challenging task. The microbial processes of nitrification and denitrification are the most important processes for N2O formation from soils [3,4,5]. Nitrifiers perform the exothermic oxidation of ammonium (NH4+) to nitrite and nitrate. These processes depend on soil NH4 content, soil water content, pH value, and soil temperature [6,7]. Denitrification is the heterotrophic, successive reduction of nitrate (NO3) to nitrite (NO2), nitric oxide (NO), nitrous oxide (N2O), and dinitrogen (N2) by a large community of microbes [8,9]. These processes are also influenced by the oxygen concentration in the soil, the soil temperature, the pH value and the concentrations of the substrates NO3 and microbial available carbon (C) [7,8,10,11]. The NO3 concentration depends on the availability of reactive nitrogen (defined as organically bound N and inorganic N, except N2) and is a key factor triggering N2O soil emissions [7]. The oxygen availability for the soil microbes is mainly influenced by the volumetric soil water content [10], the oxygen consumption of the soil microbiota itself, and plant roots. Increasing soil temperatures stimulates microbial activity and the related oxygen consumption by the microbiome [7]. Therefore, N2O emission peaks under nearly water-saturated conditions and sharply decreases when the soil becomes drier [12]. Maximum N2O emissions occur at values of around 80% water-filled pore space (WFPS) [7]. At WFPS higher than 80%, nitrification is inhibited and denitrification turns to the most important N2O source [13].
Soil-derived N2O emissions are commonly measured using closed chambers, but these measurements are time-consuming, expensive, and, therefore, limited [14]. Simulation models are an option to extrapolate N2O emissions to various temporal and spatial scales and to analyze sensitivities to environmental and management factors [15,16,17]. To calculate GHG balances on national and continental scales, the Intergovernmental Panel on Climate Change (IPCC) recommended a simple empirical emission-factor approach as a robust tool to estimate annual N2O emissions associated with agricultural practices and land-use change [18]. The linear IPCC Tier 1 emission factor (EF) assumes that 1% of the total N input by fertilizers and N in crop residues is emitted directly as N2O [19]. However, as N2O emissions from crop production depend on many site-specific agricultural practices like fertilization, tillage, and residue management [16], such linear Tier 1 approaches are limited. A global meta-analysis revealed a general non-linear response of N2O emissions to N fertilizer [20]. Improvements from Tier 1 replacement by stratified European EFs better reflected spatial variability [21]. Ruser et al. [22] specifically showed that fertilizer-related N2O emissions for WOSR cultivation are not linear and that WOSR-specific EFs are often markedly lower than 1% in Germany. They also emphasized substantial spatio-temporal variation. Mathivanan et al. [23] recently evaluated a Tier 2 regionalization of EFs across Germany, resulting in an average EF of 0.62% (range: 0.38–0.92%), which was markedly below the Tier 1 standard value.
Beyond such Tier 2 approaches, dynamic process-based simulation models allow for the calculation of N2O emissions as a result of different simultaneously occurring N turnover processes [7]. These kinds of models have been proven to be useful for field-scale simulation and analysis of N2O emissions [24] and are requested for future climate inventories under a Tier 3 approach. They further allow causal analysis of processes and driving forces, as well as site-specific scenario calculations. However, a reasonably good simulation of N2O emissions over a range of environmental and management conditions is still challenging. These difficulties arise at least partly from the challenge that processes influencing the boundary conditions need to be properly covered. Thus, an N2O emission model should be integrated into a well-performing, process-oriented plant-soil-atmosphere model (PSAM) under the given pedoclimatic conditions.
The aim of this study was to (i) develop and parametrize a model component for N2O emissions for integration into an existing PSAM model suitable for high-yielding conditions of WOSR cultivation, for simulation of daily and cumulative fluxes. Subsequently, the model was subjected to a site- and fertilizer-specific (ii) calibration and (iii) evaluation with independent observations. Furthermore, (iv) generalized site-specific EFs for varying N fertilizer input based on long-term weather data were derived.

2. Materials and Methods

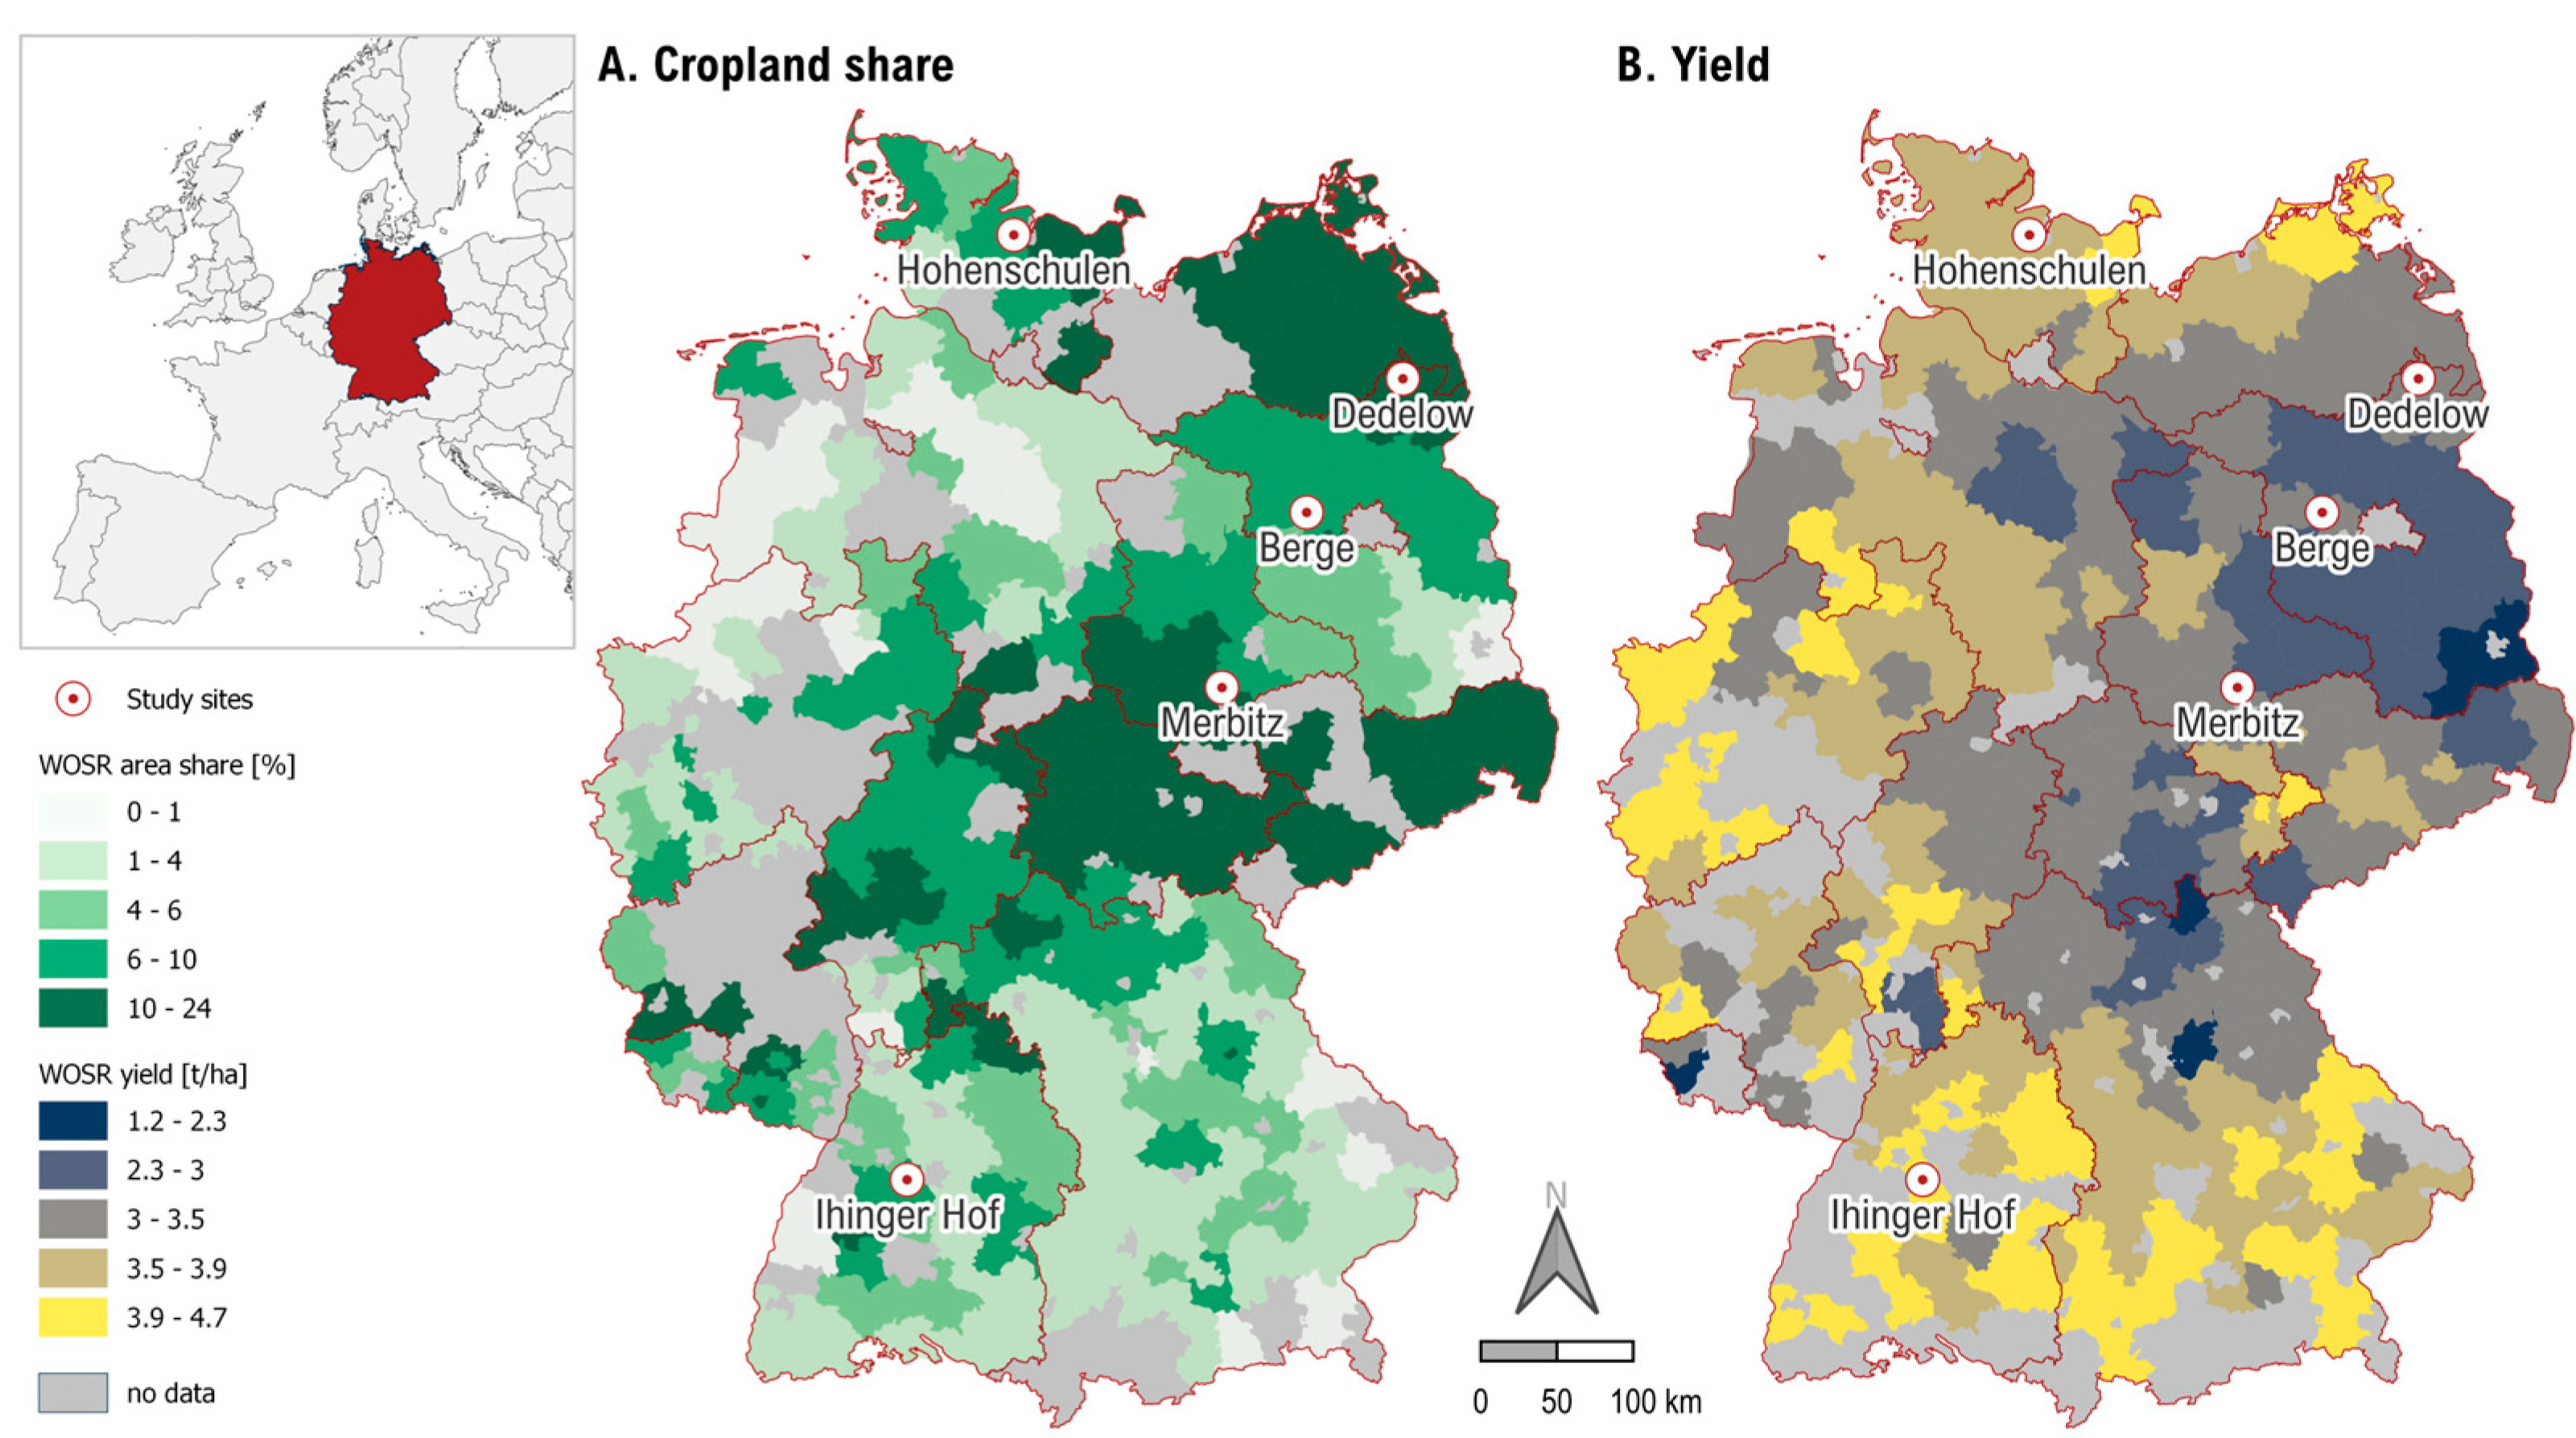
2.1. Experimental Sites and Field Trials

In 2012, field trials with identical crop rotation winter oilseed rape (WOSR)-winter wheat-winter barley were established at five sites across Germany, as a completely randomized block design with four replications. The studied sites represented typical regions with high yields and acreage of WOSR under differing pedoclimatic conditions (Figure 1, Table 1 and Table 2).
Within this study, we only focused on data and simulations for the WOSR cropping period and succeeding wheat until spring fertilization. Winter oilseed rape was sown at densities of 40–45 plants m−2 between the end of August and mid-September. Five N treatments were tested: 0 N (unfertilized control), 120 CAN (60 + 60 kg N ha−1 as calcium ammonium nitrate (CAN), 27% N), 180 CAN (90 + 90 kg N ha−1), 240 CAN (120 + 120 kg N ha−1), and 180 DIG (90 + 90 kg NH4-N ha−1 as biogas digestate (DIG)). Mineral N was applied at the beginning of spring growth and at stem elongation. All other nutrients were site-specifically applied according to regional farmers’ practices, and further crop management was conducted uniformly according to best-practice recommendations for all N treatments. More details about the exact yearly dates for sowing and fertilization and digestate characteristics are presented in the Supplementary Materials.

2.2. Field Data Collection

Soil mineral nitrogen (SMN) and soil moisture in 0–30 cm depth were sampled weekly as the sum of NH4-N and NO3-N. Soil moisture was quantified gravimetrically from subsamples. At each field research station, a meteorological station delivered daily weather data.
The field measurements and the flux calculations of N2O were described in detail by Ruser et al. [22]. In brief, non-steady-state chambers were used to estimate gas fluxes at least weekly in the row interspace of WOSR and within the winter wheat crops. During a maximal closure time of one hour, four gas samples were taken every 20 min using a syringe, transferred into glass exetainers, and then analyzed gas-chromatographically for N2O concentrations. Fluxes were calculated using the R package gasfluxes [26], a procedure combining non-linear and robust linear flux models. After a rigorous quality check [22], N2O fluxes were linear interpolated between weekly sampling dates. Monthly and annual N2O emissions were derived by cumulating interpolated daily fluxes for further model-performance analytics.

2.3. Model Description

Based on existing approaches, a newly tailored conceptual N2O-emission model component was developed for integration into an existing plant-soil-atmosphere model (PSAM) [27]. The previously well-evaluated process-based PSAM combines submodules for the dynamic simulation of crop growth, N uptake of WOSR (HUME-OSR: [28,29]) and winter wheat (HUME-Wheat: [30]), evapotranspiration, soil water and NO3 transport, mineralization, and management events on daily timesteps with weather data as external driving forces. All submodules were implemented in the HUME modeling environment [31,32].

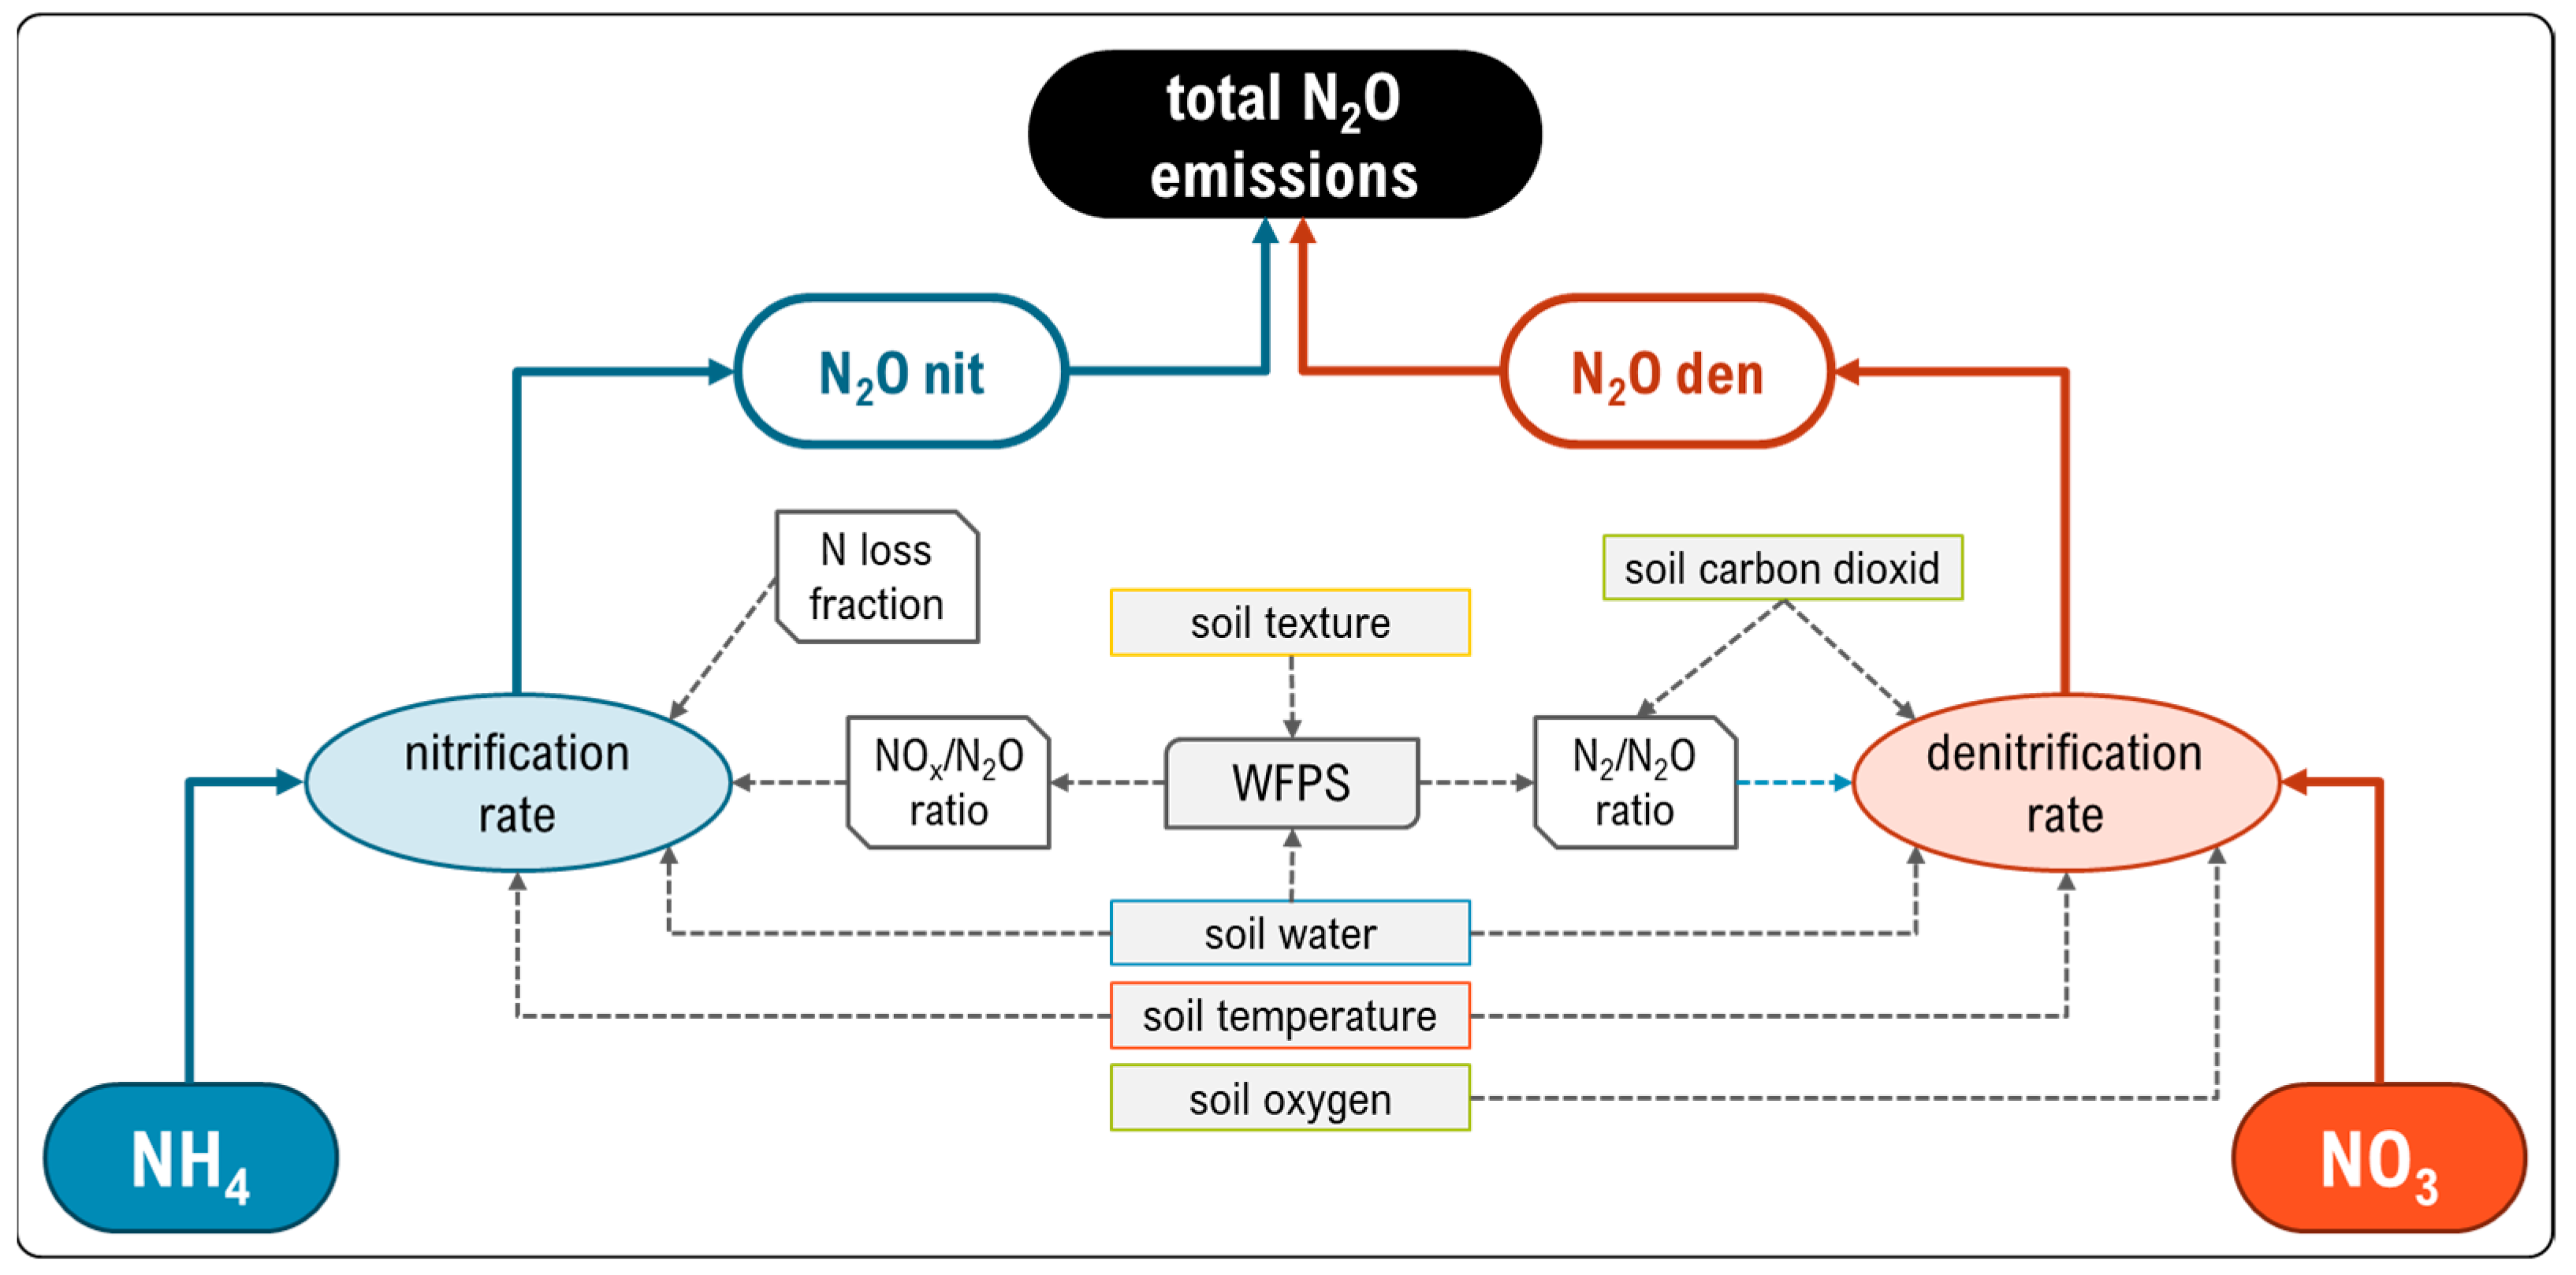
2.3.1. Structure of the N2O Model Component

The N2O-emission model calculates total N2O emissions as the sum of N2O emission rates derived from nitrification and denitrification (Figure 2). Nitrification of ammonium was simulated as a first-order kinetic process that depends on the NH4 pool and the nitrification rate (Equation (1)). Therefore, the potential nitrification rate knit was reduced by an abiotic factor fabiotnit corresponding to the effect of soil temperature and soil water [33,34]. According to the ratio of NOx and N2O RNOx/N2O, emissions from nitrification N2Onit were then derived from the gaseous N loss, calculated by using an N-loss fraction factor frn-loss:
N 2 O n i t = k n i t   ·   f a b i o t n i t   · N H 4   · f r n l o s s   · 1 1 + R N O x / N 2 O
The abiotic factor fabiotnit was calculated from soil water and temperature impacts according to Hansen et al. [34], based on Equations (A1)–(A3) (see Appendix A for details). The ratio of NOx and N2O decreased with increasing water-filled pore space (WFPS) [33], according to Equation (A4).
Denitrification of NO3 was calculated from a potential denitrification rate kpot_den and reduction functions fabiotden for soil temperature, soil water, and oxygen status, according to the APSIM model [35] (Equation (2)). NO3 availability further reduced the denitrification rate based on a Michaelis-Menten kinetics approach, as recommended by Heinen [24]. N2O emission from denitrification N2Oden was calculated as follows:
N 2 O d e n = k p o t d e n   ·   N O 3 K m + N O 3 · f a b i o t d e n ·   1 1 + R N 2 / N 2 O
where Km is the Michaelis constant, fabiotden is the correction factor for abiotic impacts, and RN2/N2O is the ratio of N2 and N2O.
The potential denitrification rate kpot_den is related to the CO2-flux from soil respiration during mineralization as proxy for available organic substrate, using a fit parameter kden [34], according to Equation (A5). The abiotic correction factor fabiotden is the product of factors representing the effect of water and temperature (Equation (A6)). Denitrification only occurs if soil water conditions exceed a critical WFPS (Equations (A7) and (A8)). The temperature impact was calculated according to the APSIM model of Thorburn et al. [35], based on Equation (A9). The ratio of N2 and N2O correlated positively with both water-filled pore space WFPS [cm3 cm−3] and the CO2 emission rate [kg C ha −1 d−1], but decreased with the increasing nitrate amount NO3 [kg N ha−1], according to Del Grosso et al. [36] (for intact soils, following Equations (A10)–(A12)).

2.3.2. Model Initialization and Parametrization

The existing PSAM, with calibrated and evaluated soil water and N processes [27], was further adapted for implementation of the N2O dynamics. At first, parameters describing the soil water retention curve and the unsaturated hydraulic conductivity [37] were deduced from the soil textures. Then, the mineralization parameters were manually fitted to observed SMN dynamics, adjusting the turnover rates for soil organic matter ( k S O M B I O M ) and the tillage effect (Mineff; following Henke et al. [38]). Further turnover rates were taken from Hansen et al. [34]. C/N ratios of the four coupled carbon pools: soil organic matter (SOM), decomposable plant material (DPM), resistant plant material (RPM), and microbial biomass (BIOM) and corresponding microbial substrate use efficiencies (ε)—were adopted from Verberne et al. [39]. The different management events like sowing, fertilization, and harvest date were also considered. Subsequently, the N2O data and the driving forces for both nitrification and denitrification were used for parameterization of the N2O emission model, i.e., adjusting the fraction of N loss during nitrification (fr_Nloss_nit) and the fit parameter (kden) scaling the CO2 flux to potential denitrification. Furthermore, WFPScrit_den was adjusted site-specifically to meet measured N2O (Table A1).
Each model run started after the harvest of the preceding crop (July) before WOSR establishment and ceased at the beginning of spring growth of the subsequent wheat crop (March) after WOSR harvest (∑ 21 months) in order to simulate the entire period of WOSR-related N2O emissions being measured. For model initialization, site-specific soil data (bulk density, organic C and N content, and soil texture) were used. Initial SMN and soil water content were adapted to meet first-measured values. Daily weather data (precipitation, air temperature, humidity, global radiation, and wind speed) from the field weather stations next to the five studied sites were used as external drivers.

2.3.3. Model Calibration and Evaluation

For independent model calibration and evaluation, the data were divided into two subsets. For each site, measured N2O-emission data from the treatments 0 N, 180 CAN, and 180 DIG were used, together with complementary data such as SMN, soil water content at 0–30 cm and N uptake of WOSR during model calibration. Thereafter, the parametrized model was tested, without further adaptations, against the remaining observation data of two other treatments (120 CAN and 240 CAN) that were not used during the calibration for independent model evaluation. This procedure was carried out identically for all sites. Model performance was evaluated based on linear regressions of simulated over measured data (intercept, slope, and R2) and root mean square errors (RMSEs). All calculations were carried out in R [40].

2.4. Long-Term Simulations

To estimate generalized site-specific annual N2O-emission amounts for each studied fertilizer treatment under various climatic conditions, long-term simulations were conducted by model runs with site-specific long-time weather data (1991–2016; German Weather Service). To determine mean dates of specific management events (for tillage, sowing, fertilization, and harvest), site-specific averages of the three investigated years were assumed for each management event. For comparability, the properties of the organic fertilizer (DIG treatment) were regarded as the same for all sites in all years, by averaging across all environments in these 25-year simulations. NH3 losses of the digestates were considered site-specifically, as determined by Räbiger et al. [27]. A 21-month period was calculated for each simulation run, subdivided into six months of warm-up to ensure realistic volumetric water contents and SMN amounts followed by 15 months as a potential balancing period. N2O emissions were then cumulated from 1 January to 31 December, to be comparable to other findings.

2.5. N-Input Sensitivity Analysis and Emission-Factor Calculation

The response of annual direct N2O emissions to fertilizer N input (continuously increased from 0–300 kg N ha−1) was investigated in a sensitivity analysis. Functional relations of N input and N2O emissions could be derived from these modelings. The simulation duration per run and the balancing period for direct N2O emissions were the same as for the long-term simulation with 25 years of weather data. Finally, site-specific fertilizer-induced emission factors (EFs) were calculated from the derived functional relations, as follows:
E F   [   % ] = ( ( E i E 0 ) / i ) · 100
where E0 and Ei are predicted annual emissions [kg N ha−1 a−1] at 0 and i kg N fertilizer amounts (representing background emissions), respectively. To compare the sites at the same N level, i = 200 kg N was chosen. Additionally, the EF at economically optimal N input (EFNopt) was calculated for each site. Economically optimal N (Nopt) was defined as the N fertilizer input with maximum economic gross margins [41,42]. It was determined from site-specific quadratic N-response functions, assuming 0.8 € kg−1 N fertilizer and 360 € t−1 WOSR seed.

3. Results

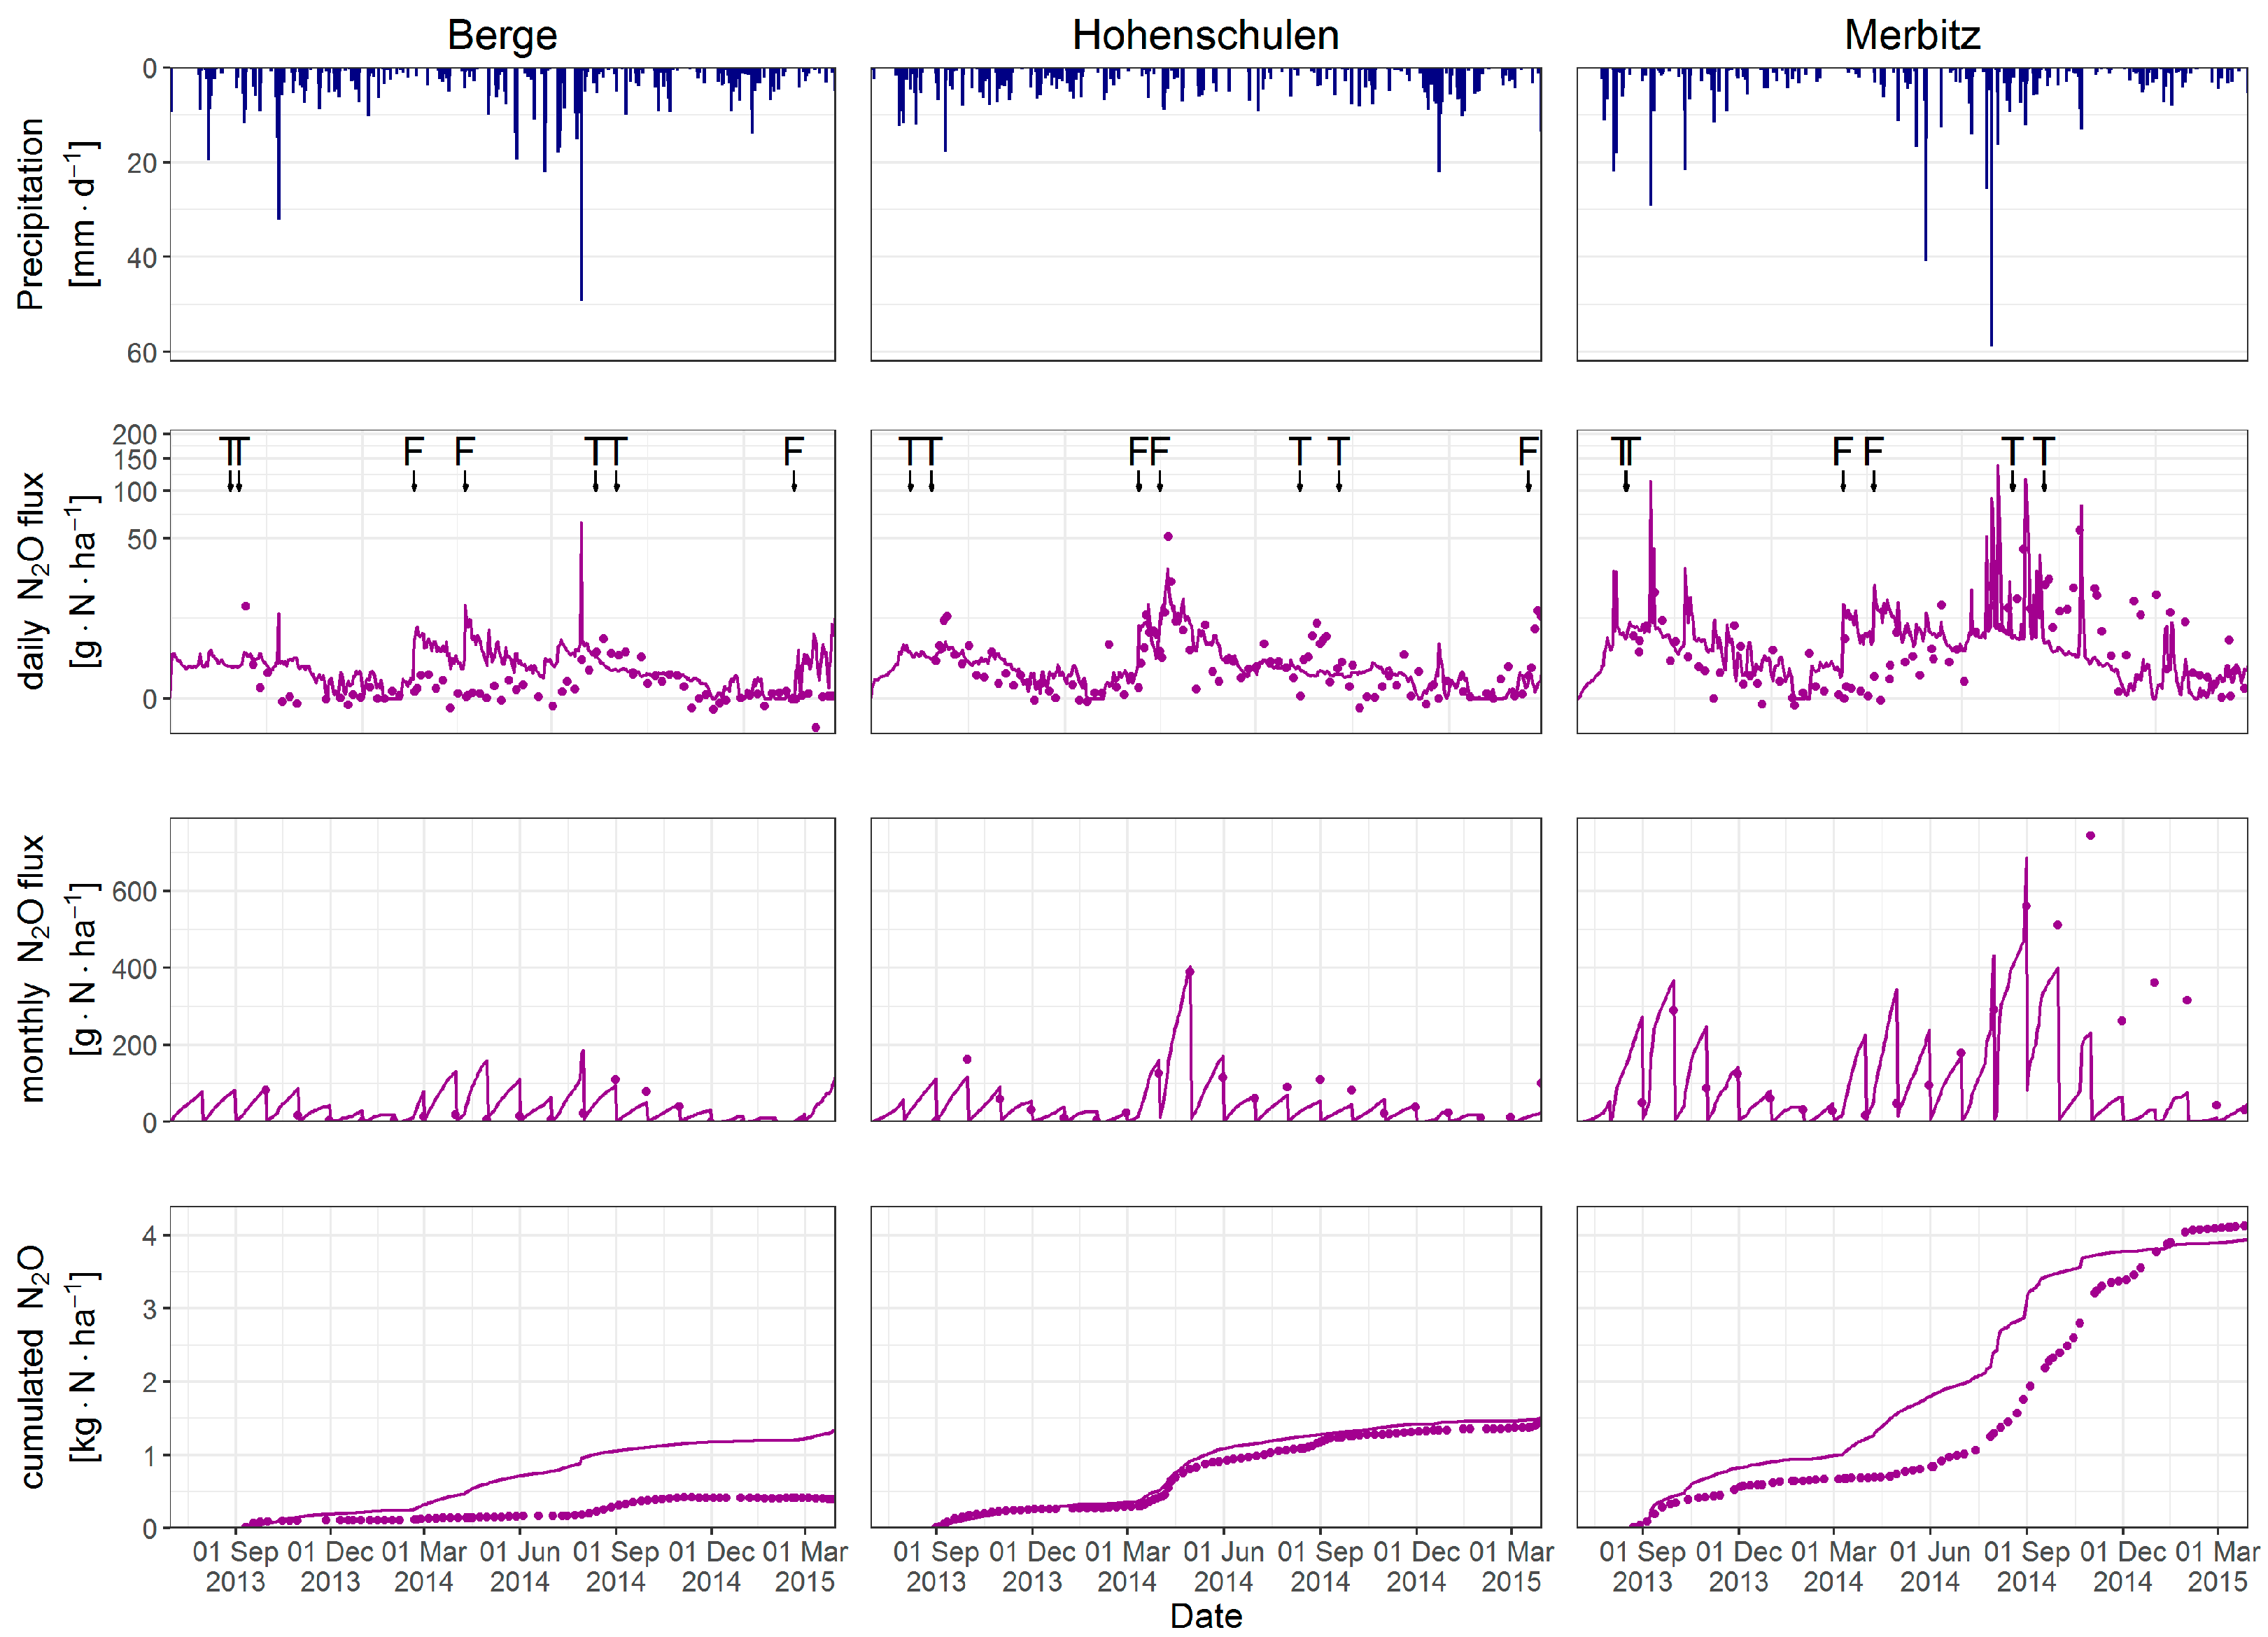
3.1. Dynamics of Daily N2O Fluxes

Based on N2O measurements from five sites over three years, the capability of the model to predict daily and cumulative N2O emissions on a monthly basis, or over the entire period, was tested. Regarding the site-specific magnitude and temporal dynamics, the model generally reproduced the observed daily N2O emissions in an acceptable way (Figure 3 and Figure 4). It simulated spring peak emissions after fertilizer applications, as well as unfertilized control treatments, and correctly predicted low emission rates during dry periods. However, some of the simulated daily N2O emissions differed remarkably from the measured values.
For instance, the simulation of N2O emission peaks that occurred after tillage events and the increased post-harvest emissions from WOSR residues at the Hohenschulen site failed (Figure 3). Contrary, high N2O peaks were simulated after heavy rain events that were not covered by field measurements (Figure 4: daily N2O fluxes at Berge and Merbitz). Furthermore, the observed increase of SMN after tillage was reproduced by the model, as well as the increasing SMN after fertilization events, as shown for Hohenschulen in Figure 3. Generally, the simulation of SMN for all sites and years showed plausible dynamics as necessary for an important driving factor of gaseous N losses (for details of soil-water-nitrogen dynamics, please refer to [27].

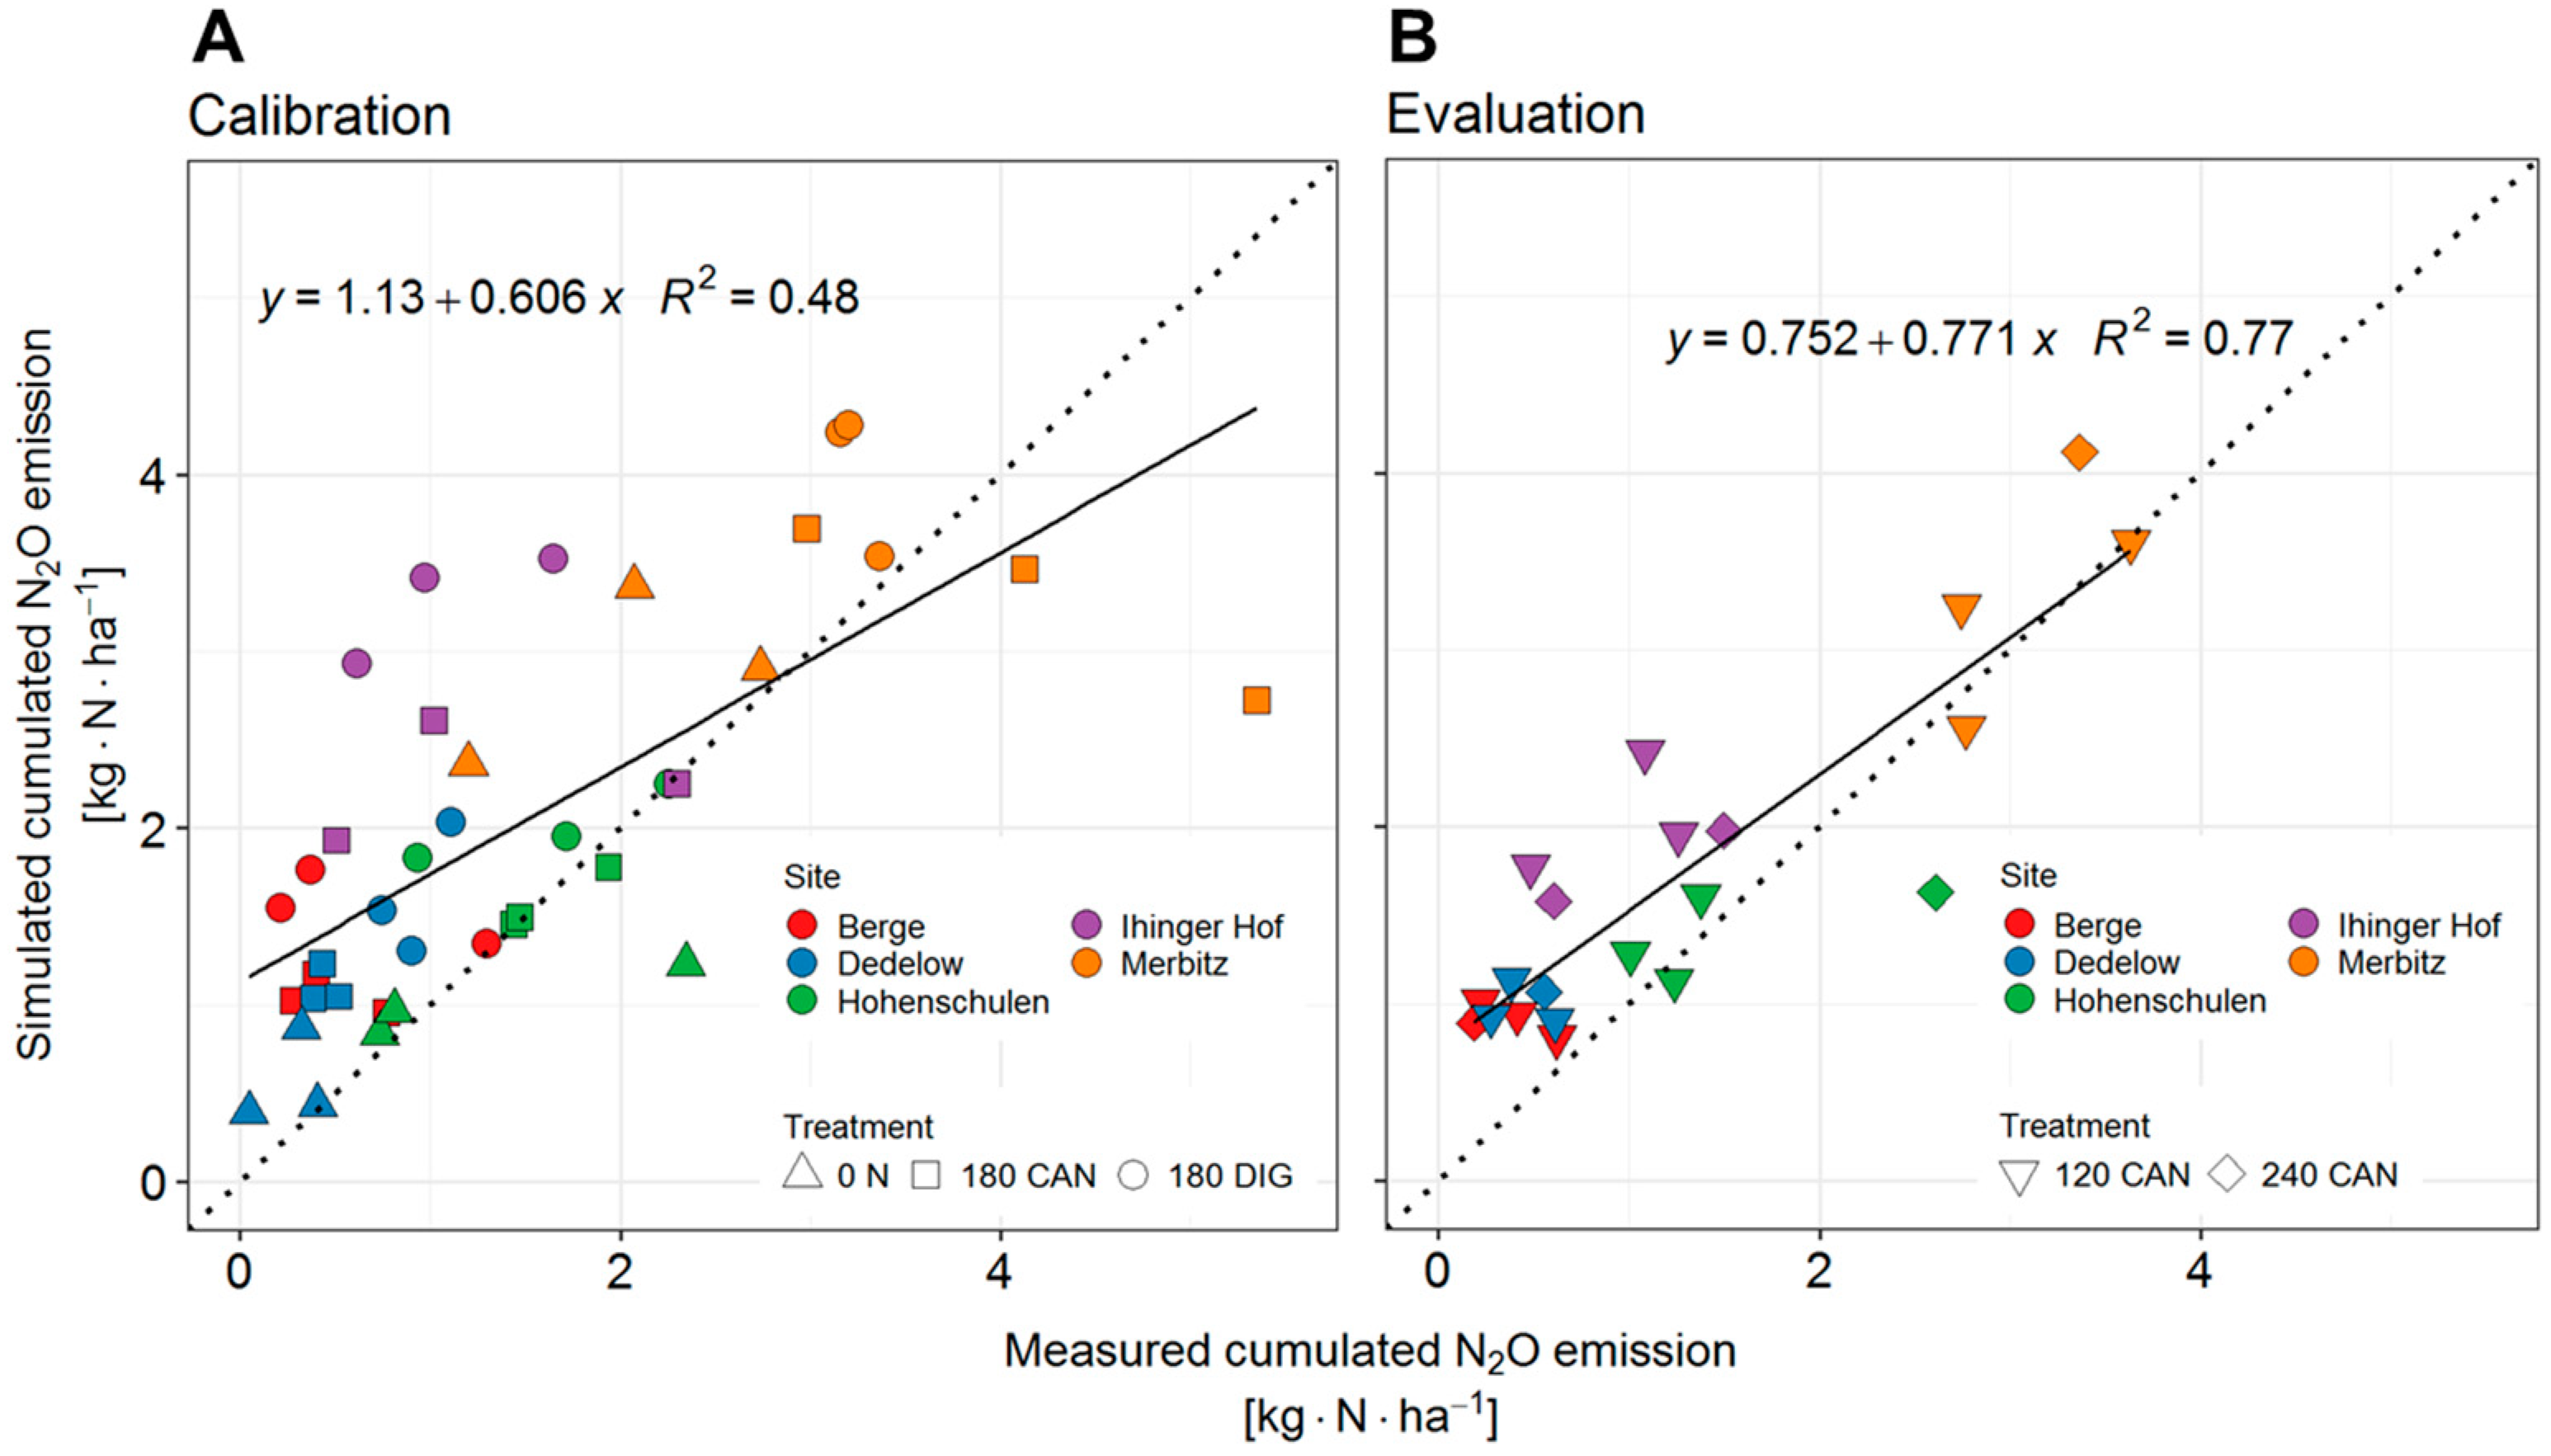
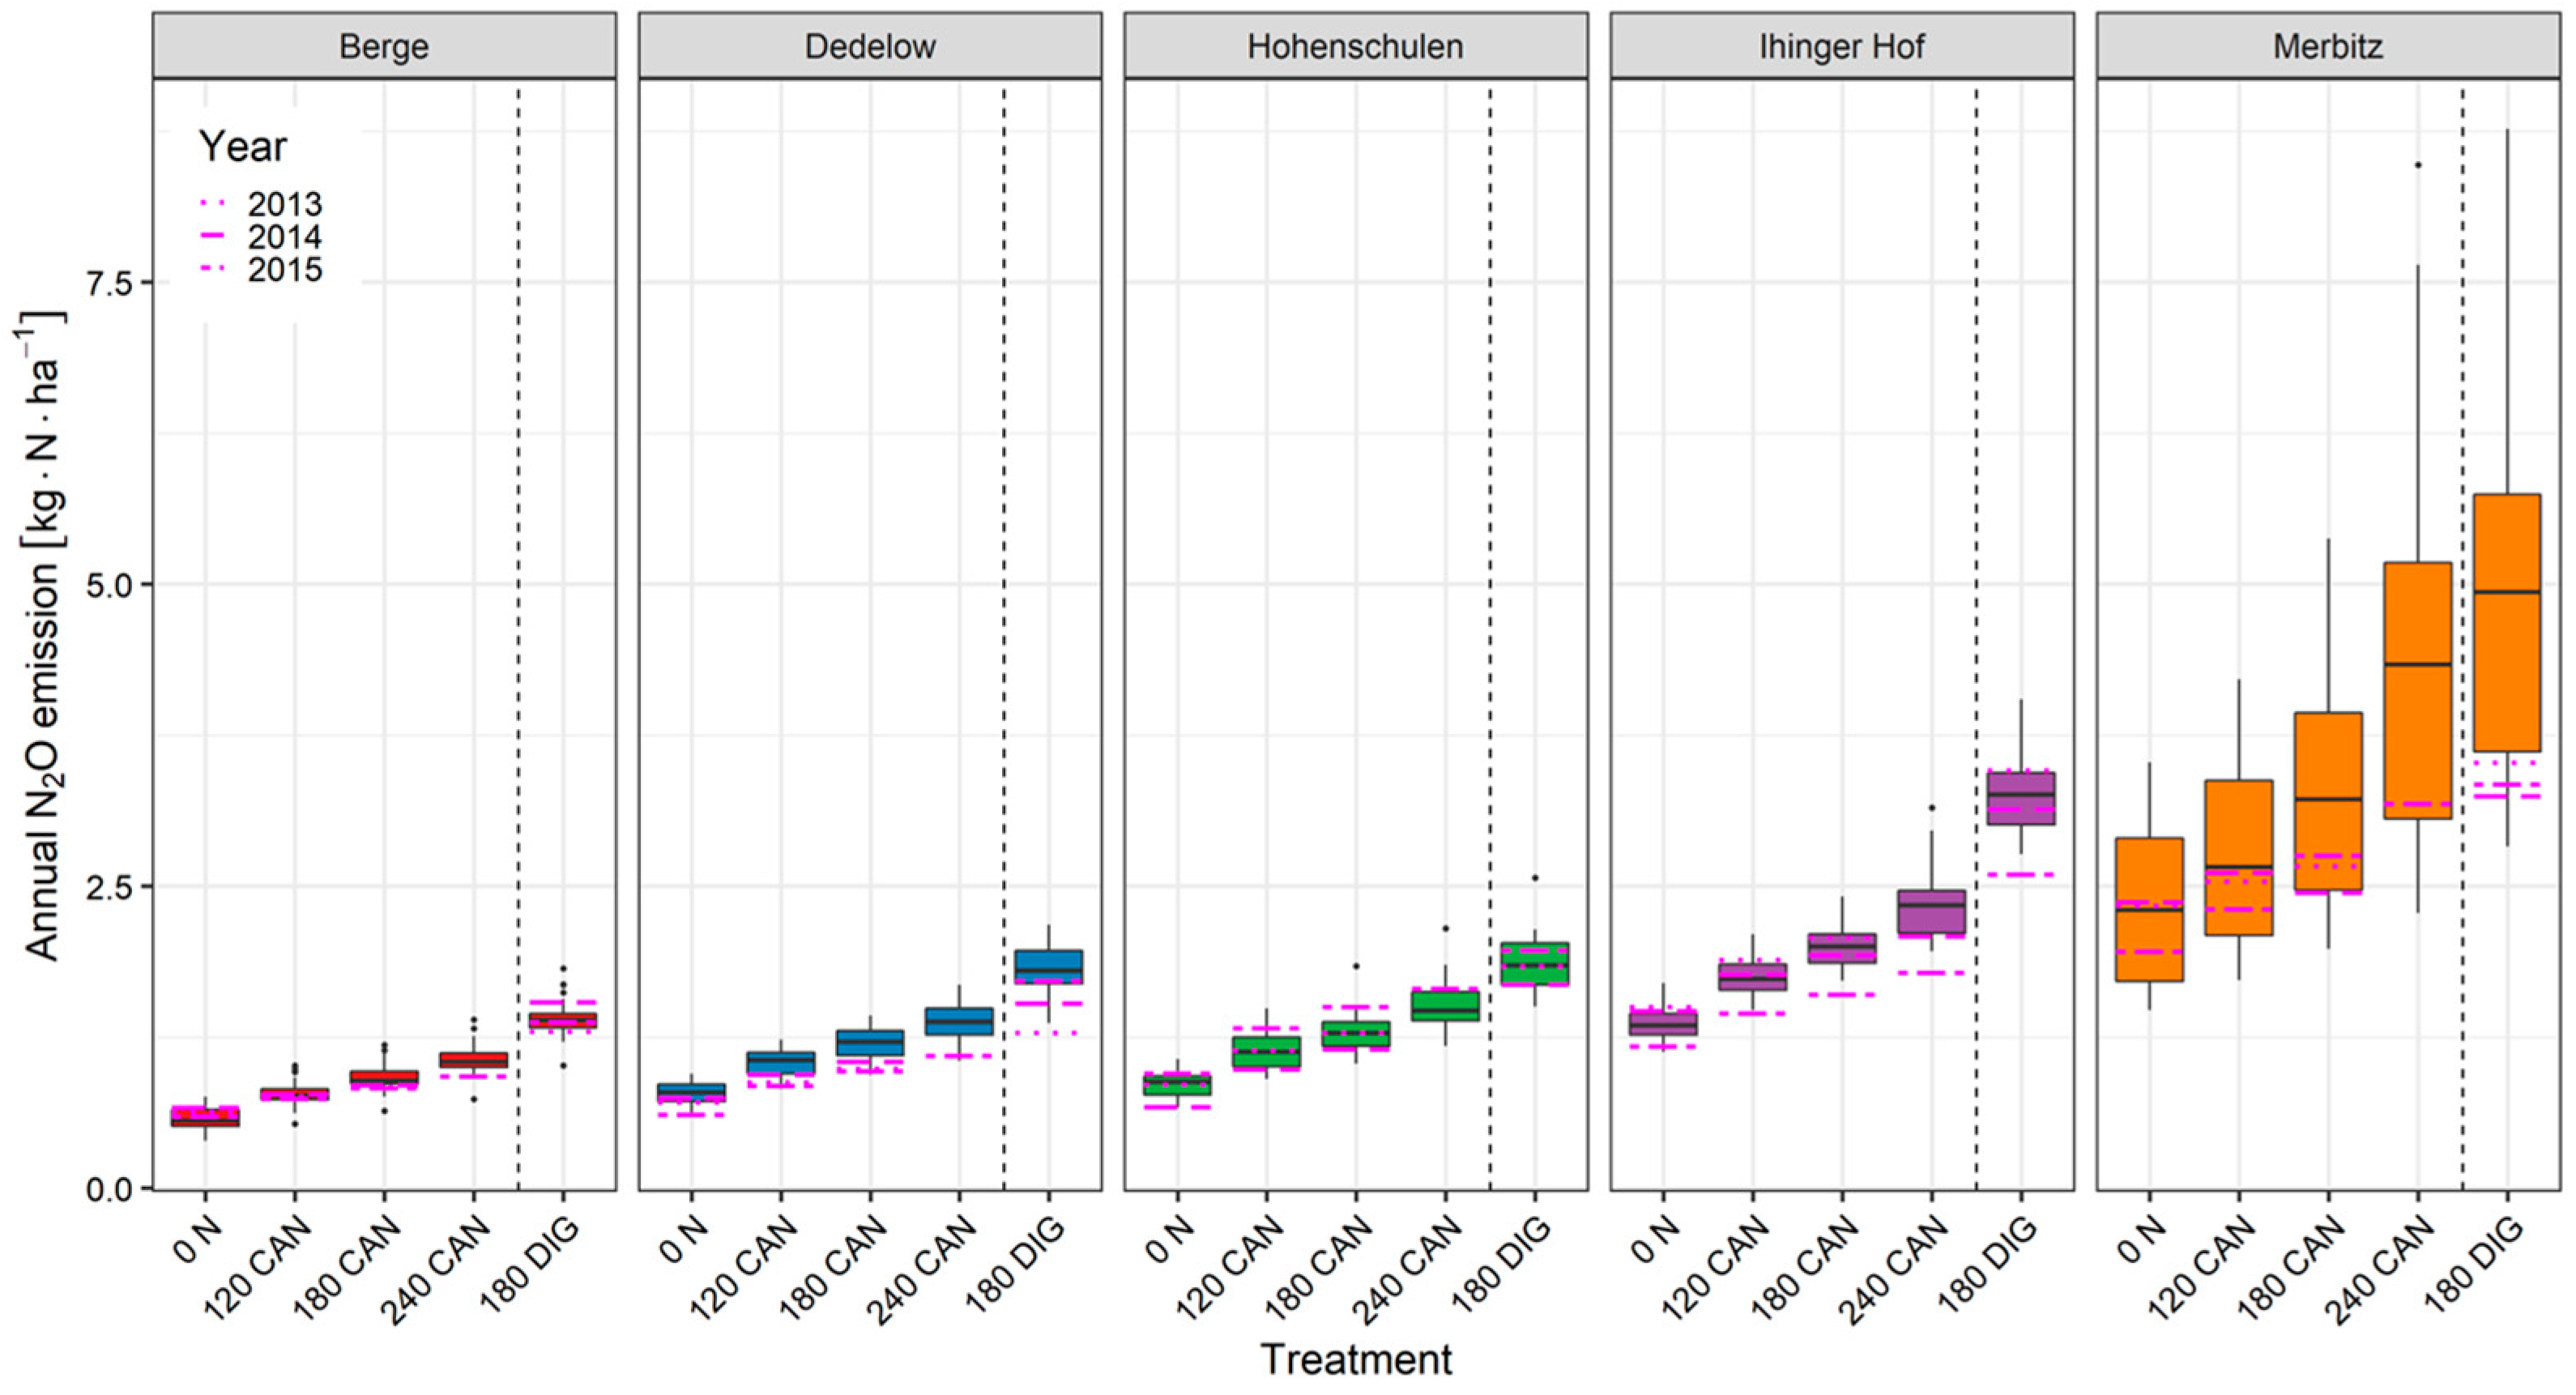
3.2. Cumulative N2O Emissions

Site-specific N2O emissions on three levels of temporal aggregation are shown in Figure 4 for the treatment 180 CAN in 2014 at Berge, Hohenschulen, and Merbitz, representing low-emission, moderate-emission, and high emission sites within our study (according to Ruser et al. [22]). Although the values of statistical criteria (Table 3) showed that, at all sites, daily simulated N2O emission hardly matched the observations after model calibration, the monthly aggregated values were more consistent with measured values in terms of magnitude and pattern, resulting in an acceptable goodness of fit for cumulated N2O emissions during the observed periods. Generally, the simulations slightly overestimated cumulated N2O emissions, especially at Ihinger Hof, Dedelow, and Berge (Figure 5A). Nevertheless, the model was able to reproduce site-specific patterns and differences in N2O emissions and sources after calibration (Figure 6).
Organic fertilization (DIG) resulted in higher means of cumulated emissions compared to the mineral treatments (Figure 5A). A comparison of the goodness of fit for calibration and evaluation data revealed the capability of our model to simulate cumulated N2O emissions reasonably for the five sites without further re-parametrization (Figure 5B).

3.3. Long-Term Simulated Mean Annual Emissions

The long-term simulation over 25 years showed site-specific N2O emissions varying between sites and years within the range of medians from 0.56–4.93 kg N2O-N ha−1 (Figure 7). Generally, emissions increased with increasing N input and were highest for the organic treatment at each site. The emission level was lowest at Berge, while Merbitz showed the highest values. At Berge and Hohenschulen, the emission values of the three investigated years were almost within the interquartile range of the simulation study, meaning that they represented average years. The same applied for Merbitz, except for the organic treatment, where the interquartile range of calculated annual emissions exceeded the measured values of all three years. At Ihinger Hof and Dedelow, the measured N2O emissions were partly below the median level of the long-term simulation, especially in 2015. At Merbitz, the N2O emission levels across all N treatments were the highest, with markedly larger variation, compared to all other sites (Figure 7).

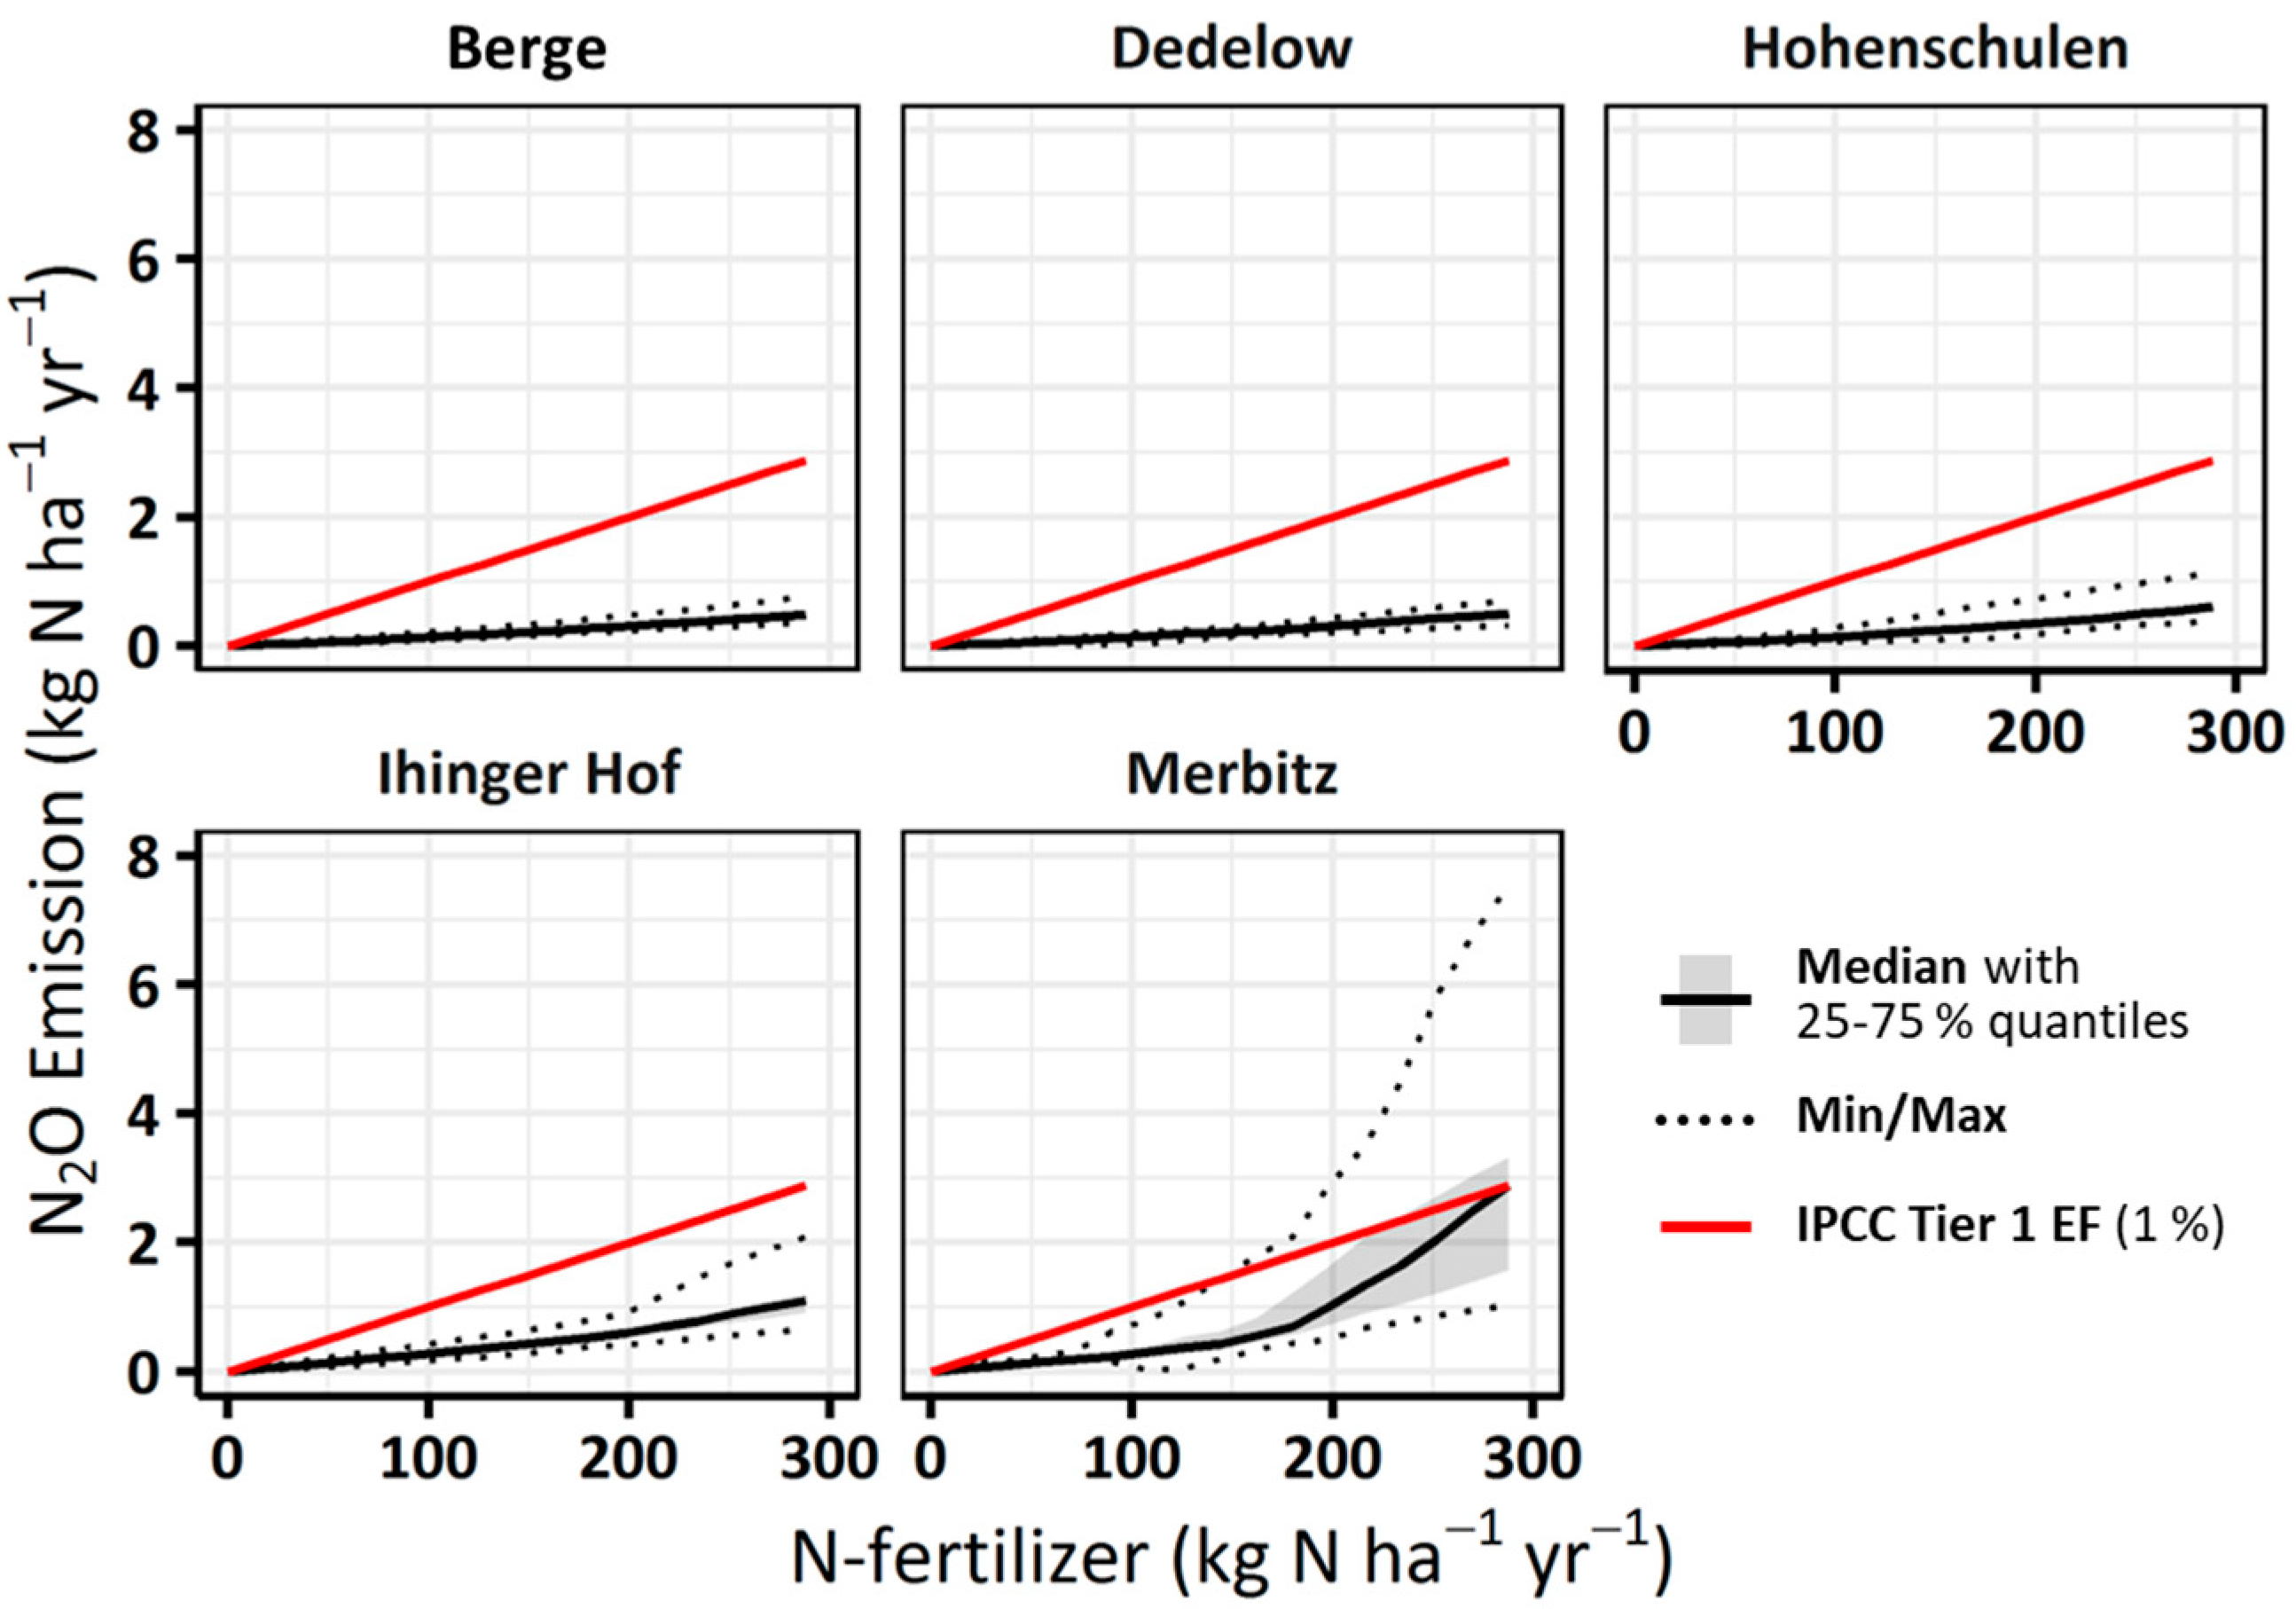
3.4. Fertilizer Related Emission Factors

Furthermore, the conducted long-term simulations for all study sites enabled a sensitivity analysis of continuously increased N fertilizer input between 0 and 300 kg N ha−1. Direct N2O emissions as functions of mineral N input showed a rather non-linear response and were considerably lower than the IPCC standard calculations (Figure 8). Only at the high-emitting Merbitz site, emissions above the economic optimum N input > 200 kg N ha−1 yr−1 reached the IPCC level in a few years of the long-term simulation. The median level exceeded 1% only at a fertilization level > 280 kg N ha−1 yr−1, which was far beyond agricultural practice. At all other sites, maximum simulated emissions were also markedly below the IPCC range for all of the considered N fertilizer inputs.
Based on these results, functional relations between N input and annual direct N2O emission could be successfully fitted from nonlinear functions (second-order polynomials) with coefficients of determination between 0.61 and 0.90 (Table A2). Based on those equations, fertilizer-related EFs were calculated for each site, based on Equation 3, for selected N-input levels (Table 4).
These representative EFs derived from variable weather conditions during the 25-year long-term simulation, reflecting the positive correlation with the used fertilizer amount. At Berge, Dedelow, Hohenschulen, and Ihinger Hof, all derived EFs were clearly below the IPCC default of 1% (Table 4). Obviously, at sites with potentially high annual emissions, the resulting fertilizer-induced EFs were also high. The EF200 increased in the order Dedelow < Berge < Hohenschulen < Ihinger Hof < Merbitz and enabled direct comparability. For site-specific Nopt inputs between 191 and 222 kg N ha−1 (Table A3), EFNopt were similar or slightly higher, but also all clearly below the 1% value according to the IPCC.
For the organic treatments, EFs were calculated at the 180 kg DIG ha−1 level (Table 4), based on the results of the simulated long-term annual N2O emission levels with an average digestate input (Figure 7). Merbitz was the site with the highest organic EF (1.42%); at Ihinger Hof (1.05%), the IPCC factor was slightly exceeded by emissions from digestate. The other study sites were, likewise, around half the aggregated IPCC Tier 1 level for organic N inputs.

4. Discussion

4.1. Driving Forces of N2O Flux Dynamics

Accurate GHG inventories and identification of regionally-tailored mitigation options should consider the spatial variability of soils and climate [43]. Simulations using process-oriented models are, principally, a suitable approach to address these aspects. However, all relevant driving forces of the N2O-producing processes, and the processes themselves, must be simulated with acceptable accuracy to obtain more useful results, rather than results from more simple or aggregated approaches [7,44,45].
The amount of SMN, as a source for N2O-producing microbes, is a key factor influencing N2O formation and varies substantially. Zhou et al. [33] stated that precise simulation of SNM is a prerequisite for sufficiently accurate N2O-emission estimates. The used PSAM provided a plausible simulation of SMN dynamics for all N rates, N forms, sites, and years [27]. The time course and the maximum amount of N uptake by the crops and the level of N mineralization from soil organic matter are key processes in order to estimate SMN, and they were properly covered by our PSAM as well [27]. Some N2O emission-focused models have been reported to sometimes fail in the prediction of crops’ N uptake [46], or to miss information about the performance of N-uptake simulation.
Soil moisture is another major driver of N2O emissions, as it governs the oxygen availability to soil microbes [7,47], in conjunction with soil texture and structure. Soil moisture, therefore, affects both processes—nitrification as well as denitrification—in terms of the total rate and the fraction of N2O emission to the total gaseous N loss for the respective process. Our model often simulated soil water dynamics well [27], presumably because of the soil water diffusivity-based approach [32], which accounts for the temporal oversaturation of soil compartments. Usually, this leads to a better description of water-flow rates, compared to tipping-bucket approaches used in other N2O emission models such as, e.g., DNDC [48].
The critical WFPS for denitrification (WFPScrit_den) was introduced as a site-specific factor controlling the start of denitrification as an extension of the original APSIM approach [49] or as used in the process-based ECOSSE model [47]. In contrast to the calibration of nitrification parameters, where no site-specific calibration was required, for denitrification a site-specific calibration of WFPScrit_densubstantially improved the estimations of N2O emissions [43,47]. For all sites in this study, denitrification starts at soil water contents exceeding field capacity, as indicated by site-specifically calibrated WFPScrit_den. The difference between WFPScrit_den (ranging from 0.8–0.95) and the WFPS at field capacity was higher for the more sandy soils in Berge, Dedelow, and Hohenschulen. Therefore, the use of a simple cascading-layer approach for simulating soil water dynamics seems to be inappropriate [50]. Although the data (Table 1 and Table A1) suggested a correlation between site-specifically calibrated parameters and soil textures, we were not able to establish functional relationships between those two factors. This might indicate that further factors, like soil organic carbon (SOC) content or bulk density, might control mineralization processes and N2O emissions, especially for the denitrification-driven N2O fraction.
The results of Thorburn et al. [35] revealed higher N2O emissions in heavier textured soils, which is in line with our observations at Merbitz, where clay content and the long-term annual N2O emission levels were highest. Moreover, Groffman and Tiedje [51] reported that the smaller pores of earlier fine-textured soils become anaerobic, favoring denitrification. In contrast, the sandy-soil texture at Berge and Dedelow, with the lowest water-holding capacity, caused only small N2O emissions [22]. Velthof et al. [52] measured low N2O emission rates on soil with relatively low organic matter. The lowest SOC concentrations were found at Berge and Dedelow, representing low-emission sites in our experiment. Interestingly, the highest SOC contents were measured at Hohenschulen and Ihinger Hof, while the high-emission Merbitz site showed an intermediate SOC content.
In addition to soil-related parameters, a reliable crop-growth simulation is also important to derive WOSR-specific emission results. The chosen environment of HUME-OSR is known for good predictions of WOSR-yield formation under German conditions [28]. The implementation of allometric partitioning outperformed phenologically driven development in high-yielding environments that are typical in Germany. Therefore, in our study, HUME-OSR as a basic PSAM was superior to the widespread utilized APSIM model under less-intensive production conditions.

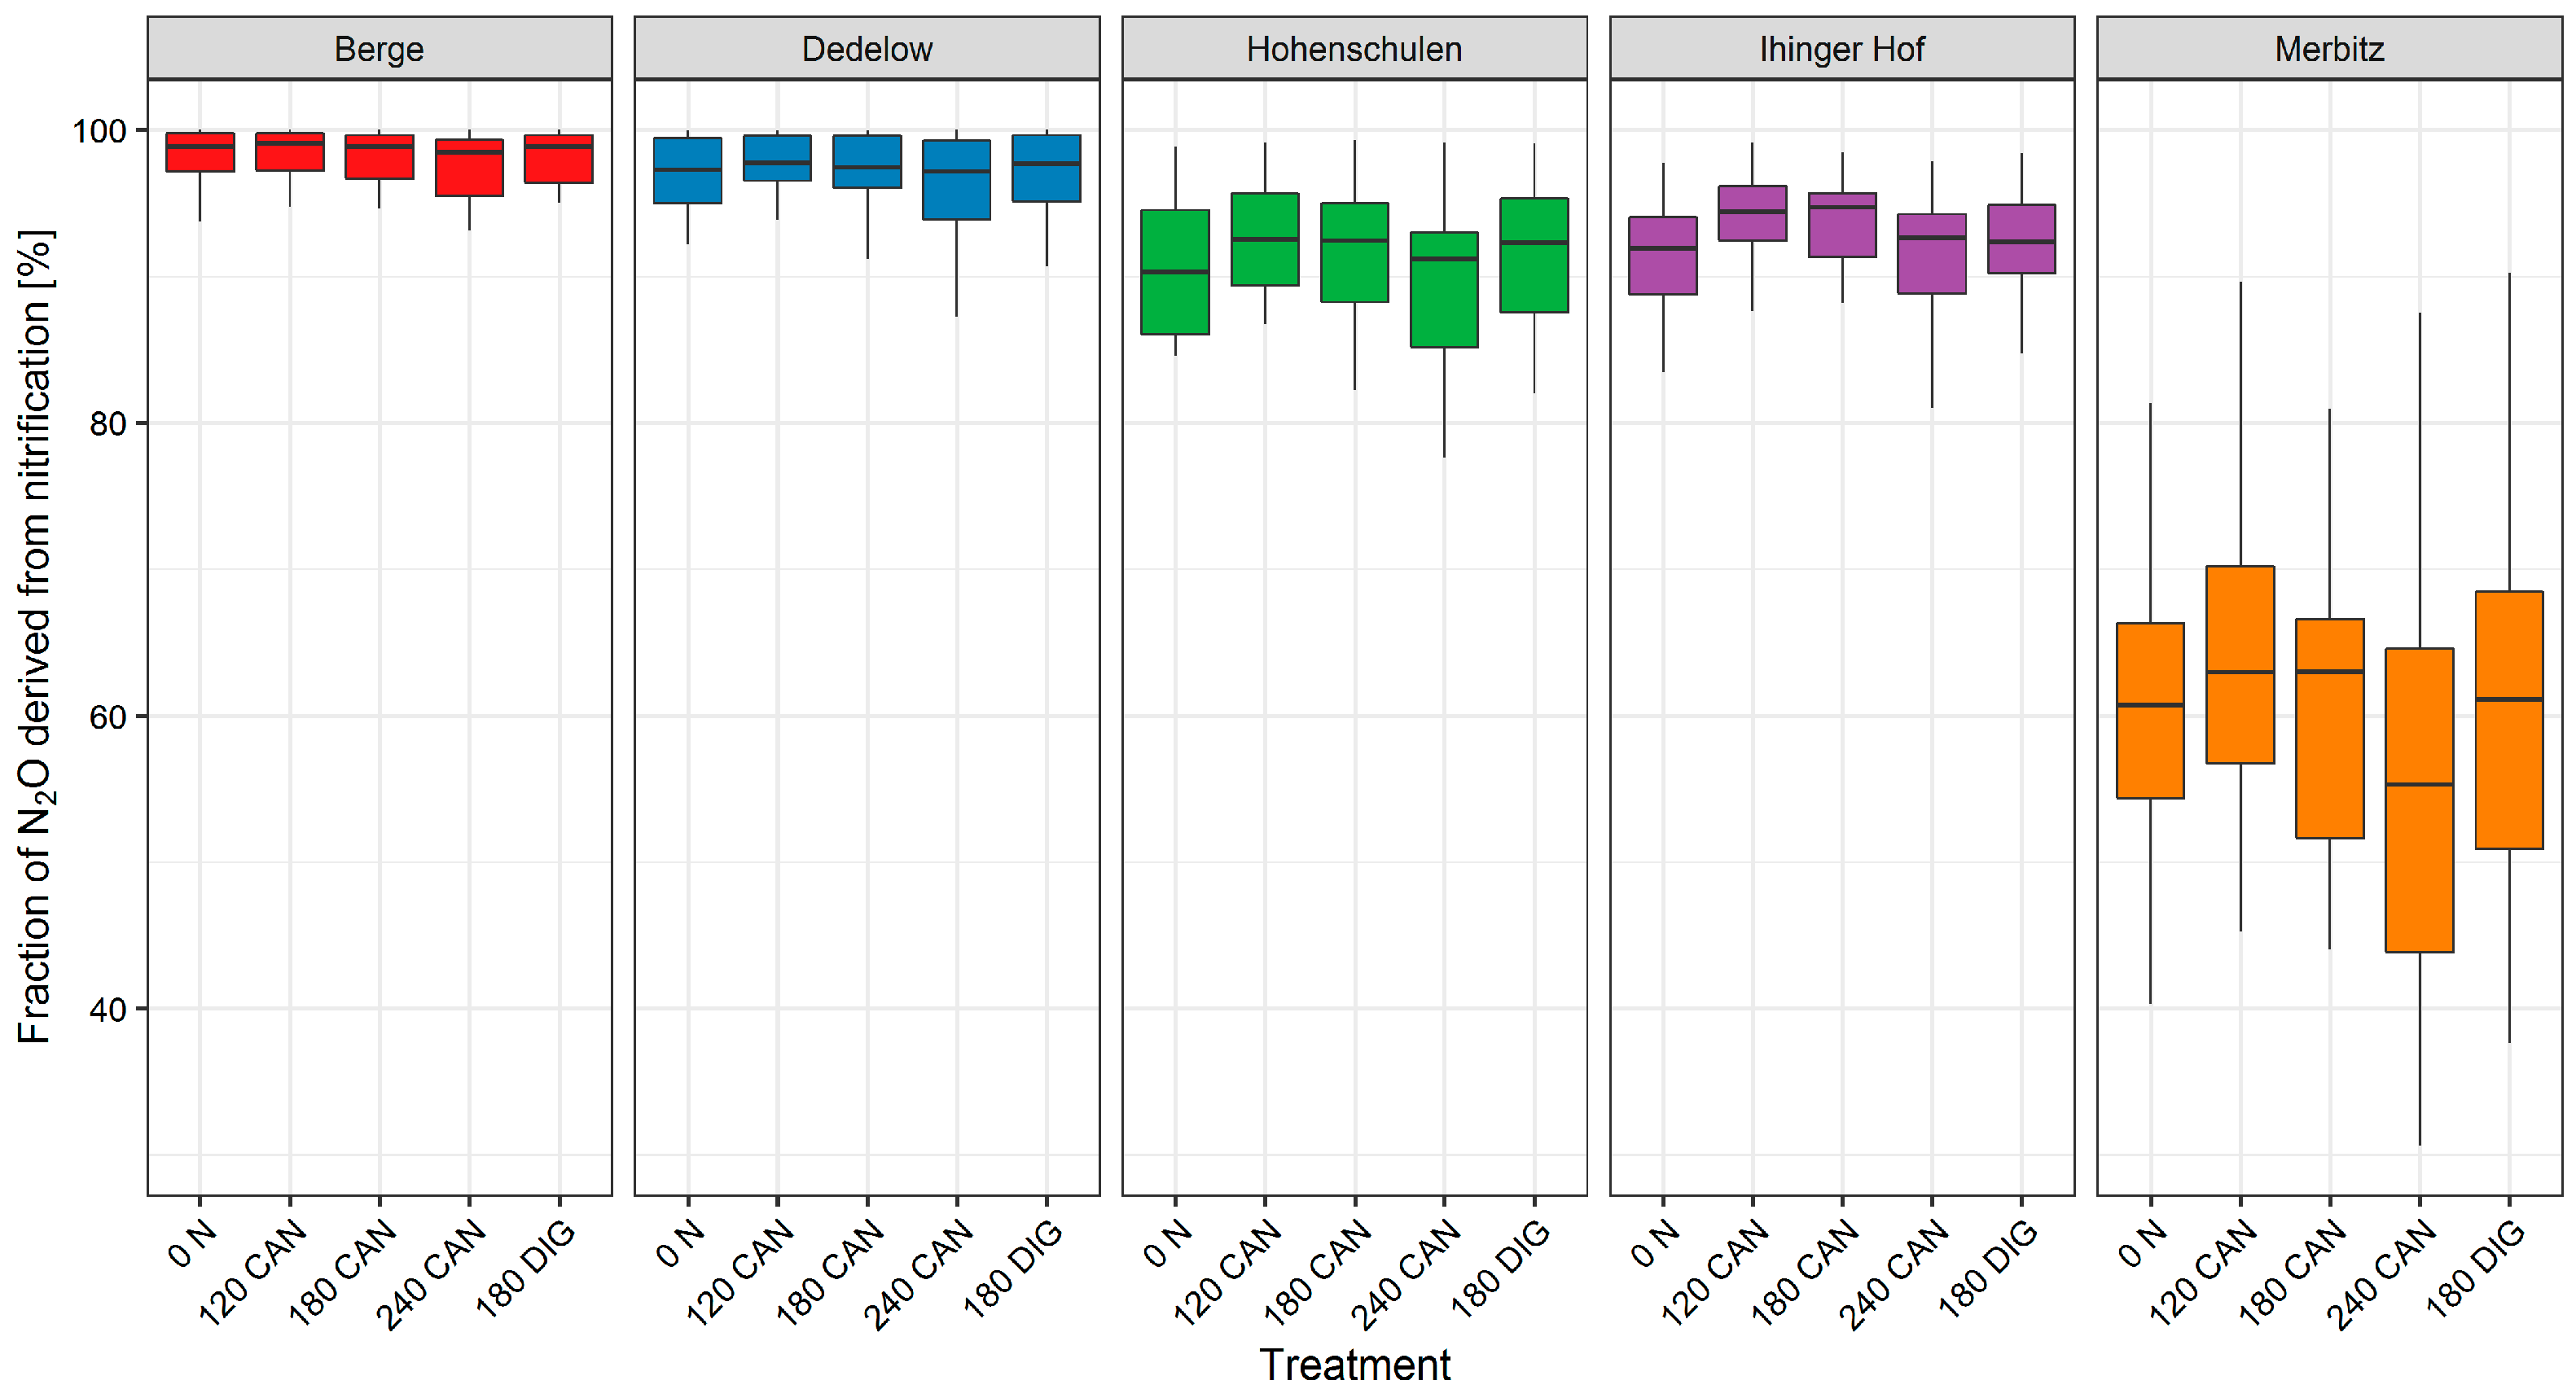
4.2. Source Paths of N2O Emissions

Generally, the used parameterization of the N2O emission model suggests a predominantly nitrification-driven N2O development. This is supported by the observations that N2O emissions peaked after application of fertilizer N (Figure 3) under conditions of only moderate soil water saturation. Furthermore, the model of Li et al. [15] estimated that 68% of total N2O emissions in the unfertilized control derived from nitrification. Nevertheless, large year-specific and site-specific differences in N2O composition occurred (Figure 6), as revealed by the share of nitrification of 62% at Merbitz, whereas at all other sites more than 90% of the emitted N2O was derived from nitrification for long-term medians of the 180 CAN treatment. However, the large boxes and long whiskers of the long-term simulation indicate denitrification as an important source for N2O formation in certain years at Merbitz, especially for the 240 CAN treatment (Figure 6). As a clear correlation, larger shares of denitrification were simulated in years with higher precipitation.
For the digestate treatment, the share of nitrification was generally slightly higher compared to the highest CAN treatment (Figure 6), probably due to high proportions of NH4-N (equivalent to 180 kg N ha−1 as CAN) being the N source of nitrifiers. Additionally, the increased O2 consumption during mineralization of organic-bounded N may have an additional effect on N2O emission rates. Köster et al. [4] showed that bacterial denitrification seems to be the main source of N2O produced after biogas residue application to moist soils. This was due to high amounts of labile carbon feeding denitrifiers and the NO3 supply by the organic fertilizer. High N2O peaks, observed shortly after manure application, were ascribed to increasing denitrification rates and triggered by easily degradable organic substrates [52,53]. Our experimental data did not always show those kinds of N2O peaks shortly after digestate application, but our simulation did so, to some extent, and therefore led to a slight overestimation (Figure 5 and Figure 6).

4.3. Model Purpose and Level of Aggregation

The model provided reasonable estimates of cumulated N2O emissions for increasing N-input levels at the different sites for the three periods (Figure 5). However, further improvements are needed to explain the short-term variability, which is not well covered by the actual parametrization. Since the field measurements in our study were conducted weekly, it may be possible that some peaks were not recorded, especially in sensitive stages such as after fertilization or precipitation. This lack of experimental data from flux measurements was also mentioned as a reason by Goglio et al. [16], using the CERES-EGC model. A model approach should be able to deduce these sensitive stages and calculate the corresponding N2O emission, resulting in an overestimation compared to measured data. Otherwise, underestimation could occur within the modeling process due to model errors from erroneous simplifications of real situations. Whereas more complex models like DNDC [54] take anaerobic microsites in the soil into account (‘anaerobic balloon’), they were not explicitly covered by our modeling approach. Zhou et al. [33] mentioned both possibilities of overestimation and underestimation by modeling approaches, resulting in discrepancies between daily simulated and measured N2O emissions.
Even for monthly aggregated emissions, some discrepancies between our simulations and observations still occurred, resulting in global coefficients of determination of 0.23 and 0.34 for calibration and evaluation data sets, respectively (Table 3). These results are in line with the findings of Yang et al. [55] for N2O modeling with the SWAT model on monthly time steps in corn and switchgrass systems (R2 = 0.2253). Their model performed better (R2 = 0.497) when excluding a month with high N2O emissions, indicating that single high N2O peaks can largely affect model performance on monthly time steps.
Our model performed best for cumulated N2O emissions representing the site-specific amount of N2O being emitted within the measured period. This is comparable to modeling studies of Bell et al. [56] and Molina-Herrera et al. [57], where cumulated emissions were better met from the models than from daily or weekly measurements. For balancing purposes, when N2O emissions are cumulated over longer periods, a model’s ability to simulate the general dynamics of key driving factors controlling N2O emissions is more important than the exact simulation of daily N2O emission rates. Therefore, despite some uncertainties, our PSAM seems to be suitable to simulate cumulative N2O emissions for balancing purposes.

4.4. Nitrogen Input Related Emission Factors

The sensitivity analysis of direct N2O emissions with respect to continuously increased fertilizer N input showed a clear positive correlation and was best covered by quadratic functions (Table A2). These results reflect the fundamental context of available reactive N as a main driving factor for gaseous emissions, as well as the rather non-linear response reported from meta-studies globally [20,58] or under German conditions [59]. Other findings from simulation studies covered this as well [15,16]. For low-emitting sites and low N inputs, the N2O response was nearly linear, but it was exponential at Merbitz due to higher site-specific emission potential. However, the EFs were predominantly much lower than the aggregated IPCC default value of 1%. Despite this generally low emission level, a site-specific response due to differences in pedoclimatic boundary conditions was obviously provided (Figure 8, Table 4). Gabrielle et al. [43] also highlighted this site-specific EF variation for wheat-cropped soils in France ranging from 0.07–0.3%, clearly below the IPCC default value. The 10-year model simulation study of Leip et al. [21] also revealed large spatial variations of fertilizer-induced emissions and related EFs across European countries. However, their average resulting EF was on the level of the IPCC emission factor. It should be noted, that Leip et al. [21] calculated EFs, on average, of up to three crops, representing countries with typical agricultural structures. Accordingly, a direct comparison with our WOSR -pecific simulations for different sites across Germany is limited.
Our estimated EF200 and EFNopt ranged from 0.16% to 0.65% at the investigated sites (Table 4) and were somewhat lower than those calculated by the global exponential model of Ruser et al. [22], including data from more sites as well as data form the meta-analysis by [59]. Thus, there were some sites included with clearly higher-observed N2O emissions than were investigated in our research, leading to higher EFs. The more recent assessment for a Tier 2 regionalization of N2O emission factors in Germany supports our findings, with a range of 0.38–0.92% and a mean value of 0.62% [23].
For the organic treatments with biogas digestate, calculated EFs were higher than the aggregated IPCC factor of 1% at two sites (Table 4). Even more discrepancies occurred when comparing the disaggregated IPCC factor or non-synthetic inputs in wet climates of 0.6%, as published in their refinements in 2019 [19]. One reason for the higher emissions from DIG might be that in addition to 180 kg NH4-N ha−1, on average 108 kg organic-bound N was applied with the digestate [27], leading to real N-input levels of, on average, 260 kg N ha−1 (ammonia emissions were already subtracted). Nevertheless, our PSAM simulation of N2O emissions from organic fertilization overestimated the observed N2O emissions, especially at the high-emitting Merbitz site. Due to the lack of final evidence, a functional-relation study for organic fertilization was not feasible.
However, the reliable estimations of cumulative emissions, as well as the partial losses of applied N fertilizer from mineral sources (EF) based on long-term simulations, are useful tools in comparison to field measurements only. Especially for improvements in WOSR cropping sequences, the optimization of GHG balances, and the development of climate mitigation strategies, such site-specific evaluations are necessary. Particularly due the high GWP of N2O, it is important to calibrate and evaluate such emission models very precisely.

5. Conclusions

Our newly integrated N2O emission component was able to enhance an existing PSAM for predicting gaseous N losses. Specifically, for robust long-term cumulative assessments, the model was helpful for site-specific quantification of N2O emissions from WOSR under high-intensity production conditions, which are typical for Germany. Improved daily flux dynamics must be a key aspect in further model revisions. Our three-year calibrated model enabled long-term simulations with historical weather data to derive reliable functional relations between fertilizer N input and direct N2O emissions. Despite comparatively high typical fertilizer N inputs, simulated EFs were markedly below the IPCC standard value of 1%. In combination with previously published model components for indirect N2O emissions from nitrate leaching and ammonia volatilization, a full set of gaseous N losses is now available to quantify climate impacts from WOSR cropping systems. This could help to improve quantifications as necessary for, e.g., bioenergy certifications, as well as to identify measures for climate-change mitigation in WOSR production. Moreover, future developments in regional and national climate inventories will need dynamic process-based simulation models for Tier 3 approaches. Further applications might also include scenario analysis with climate-change weather predictions to optimize future GHG balances in WOSR cropping sequences.

Supplementary Materials

The following supporting information can be downloaded at: https://www.mdpi.com/article/10.3390/agriculture14010070/s1, Table S1: Geographic locations of the study sites; Table S2: Dates of WOSR sowing and WOSR harvest for the five studied sites and the three investigated cropping periods; Table S3: Main characteristics of the digestates used at the five study sites; Table S4: Values of statistical criteria used to evaluate the SMN submodel relative to observations of SMN (0–30 cm); Table S5: Values of statistical criteria used to evaluate the simulation of soil water content by PSAM.

Author Contributions

Conceptualization: T.R. and H.K.; methodology: T.R., D.N., A.K., U.B. and H.K.; resources: D.N., A.K. and U.B.; supervision: H.K.; investigation: T.R.; validation: T.R.; visualization: T.R. and I.K.; writing—original draft: T.R. and I.K.; writing—review and editing: T.R., I.K., D.N. and H.K.; funding acquisition: H.K. All authors have read and agreed to the published version of the manuscript.

Funding

This work was funded by the German Federal Ministry of Food and Agriculture and managed by the Agency for Renewable Resources under grants 22403212, 22403312, 22403412, 22403512, 22403712, 22403812, and 22403912. We also thank the Union for the Promotion of Oil and Protein Plants, Germany, for its financial support.

Data Availability Statement

The field dataset is available online [60].

Acknowledgments

We thank all technical stuff und students involved for their assiduous work in the field and the labs. Furthermore, we acknowledge financial support by DFG within the funding program ‘Open Access Publikationskosten’.

Conflicts of Interest

The authors declare no conflict of interest.

Appendix A

  • Additional Formulas during Nitrification Processes
f a b i o t n i t = f ( W ) n i t   · f ( T ) n i t
where f(W)nit and f(T)nit represent water and temperature impacts:
f ( W ) n i t = { 1 ( 1.5 p F ) 1.5 p F < 1.5 1 1.5     p F < 2.5 1 0.4   ·   ( p F 2.5 ) 2.5 p F < 5 0 p F 5
where pF describes soil matric potential as the decadic logarithm of its absolute value in hPa.
f ( T ) n i t = { 0 T 2   ° C 0.15 · ( T 2 ) 2   ° C < T 6   ° C 0.1 · T   6   ° C < T 20   ° C e 0.47 0.027 · T + 0.00193 · T 2   20   ° C < T 28   ° C e 0.47 0.027 · 28 + 0.00193 · 28 2   T > 28   ° C
where T describes the soil temperature in °C.
R N O x / N 2 O = e 3.79   ·   W F P S + 2.73
where WFPS represents water-filled pore space [cm3 cm−3].
  • Additional Formulas during Denitrification Processes
k p o t d e n = k d e n   ·   C O 2   f l u x  
f a b i o t d e n = f ( W ) d e n   ·   f ( T ) d e n
where f(W)den and f(T)den represent water and temperature impacts:
f ( W ) d e n = min ( 1 ,   max ( 0 ,   W C W C ( W F P S c r i t _ d e n ) W C s a t W C ( W F P S c r i t _ d e n ) ) )
where water content WC is calculated from water-filled pore space WFPS, taking soil texture dependent saturated water content WCsat into account:
W C ( W F P S ) = W F P S   ·   W C s a t
f ( T ) d e n = 0.1   ·   e 0.046   ·   T
R N 2 / N 2 O   = max ( 0.16   ·   k 1 , k 1 ·   exp ( 0.8   · N O 3 C O 2 f l u x ) ) · max ( 0.1 ,   1.5 · W F P S 0.32 )
where k1 is the parameter controlling the maximum value of the N2/N2O ratio curve:
k 1 = max ( 1.7 ,   38.4 350   ·   D F C )
where DFC represents the soil gas diffusion at field capacity, calculated after Millington and Quirk (1961) in Kristensen et al. [61]
D F C = ε 10 3 Φ 2
where Φ is the total porosity [cm3 cm−3] and ε is the air-filled pore space at field capacity [cm3 cm−3].
Table A1. Parametrization details of the N2O-emission processes.
ParameterUnitValueSource/Fitting
CNDPM-6[39]
CNRPM-150assumption
CNBIOM-8[39]
CNSOM-10[39]
ε D P M -0.4[39]
ε R P M -0.3
ε B I O M . -1
ε S O M . -0.2
k D P M B I O M day−10.07[34]
k R P M B I O M day−10.007
k B I O M S O M day−10.01
k S O M B I O M day−1Berge: 0.00037fitted to SMNmeasured
Dedelow: 0.00090
Hohenschulen: 0.00037
Ihinger Hof: 0.00050
Merbitz: 0.00055
Mineff-Berge: 1.0fitted to SMNmeasured
Dedelow: 1.5
Hohenschulen: 1.0
Ihinger Hof: 1.0
Merbitz: 1.5
fr_n-loss-0.0157
knitday−10.18fitted to NH4-Nmeasured
kdenday−11.9fitted to N2Omeasured
Km-26[36]
WFPScrit_den[%]Berge: 0.90fitted to N2O measured
Dedelow: 0.85
Hohenschulen: 0.80
Ihinger Hof: 0.95
Merbitz: 0.87
Table A2. Site-specific equations and coefficients of determination for the estimated regression lines between N-induced N2O emissions and mineral N input. N2O emissions as long-term medians of respective mineral N-input level from long-term simulations.
Sitex = Mineral N input [kg N ha−1]
y = N2O Emission [kg N2O-N ha−1]
R2
Bergey = 1.163·10−6 x2 + 1.465·10−3 x − 9.575·10−30.90
Dedelowy = 1.343·10−6 x2 + 1.397·10−3 x − 1.033·10−20.87
Hohenschuleny = 3.687·10−6 x2 + 1.083·10−3 x + 4.036·10−30.82
Ihinger Hofy = 6.076·10−6 x2 + 1.952·10−3 x + 8.347·10−30.84
Merbitzy = 2.876·10−5 x2 + 9.143·10−4 x − 3.647·10−20.61
Table A3. Derived economic optimal N fertilizer input (Nopt) and corresponding yield (YNopt) from quadratic response functions at the five study sites.
SiteNopt
[kg N ha−1]
YNopt
[t ha−1]
Berge1913.62
Dedelow1963.92
Hohenschulen2224.54
Ihinger Hof2224.21
Merbitz2014.33

References

  1. IPCC. AR6 WG1; IPCC: Geneva, Switzerland, 2021. [Google Scholar]
  2. Tian, H.; Xu, R.; Canadell, J.G.; Thompson, R.L.; Winiwarter, W.; Suntharalingam, P.; Davidson, E.A.; Ciais, P.; Jackson, R.B.; Janssens-maenhout, G.; et al. A comprehensive quantification of global nitrous oxide sources and sinks. Nature 2020, 586, 248–256. [Google Scholar] [CrossRef]
  3. Conrad, R. Soil microorganisms as controllers of atmospheric trace gases (H2, CO, CH4, OCS, N2O, and NO). Microbiol. Rev. 1996, 60, 609–640. [Google Scholar] [CrossRef]
  4. Köster, J.R.; Cárdenas, L.; Senbayram, M.; Bol, R.; Well, R.; Butler, M.; Mühling, K.H.; Dittert, K. Rapid shift from denitrification to nitrification in soil after biogas residue application as indicated by nitrous oxide isotopomers. Soil Biol. Biochem. 2011, 43, 1671–1677. [Google Scholar] [CrossRef]
  5. Signor, D.; Cerri, C.E.D. Nitrous oxide emissions in agricultural soils: A review. Pesqui. Agropecuária Trop. 2013, 43, 322–338. [Google Scholar] [CrossRef]
  6. Prosser, J.I. NITROGEN IN SOILS|Nitrification. In Encyclopedia of Soils in the Environment; Elsevier: Amsterdam, The Netherlands, 2005; pp. 31–39. ISBN 9780123485304. [Google Scholar]
  7. Butterbach-Bahl, K.; Baggs, E.M.; Dannenmann, M.; Kiese, R.; Zechmeister-Boltenstern, S. Nitrous oxide emissions from soils: How well do we understand the processes and their controls? Phil. Trans. R. Soc. B 2013, 368, 20130122. [Google Scholar] [CrossRef]
  8. Hénault, C.; Germon, J.C. NEMIS, a predictive model of denitrification on the field scale. Eur. J. Soil Sci. 2000, 51, 257–270. [Google Scholar] [CrossRef]
  9. Weier, K.L.; Doran, J.W.; Power, J.F.; Walters, D.T. Denitrification and the Dinitrogen/Nitrous Oxide Ratio as Affected by Soil Water, Available Carbon, and Nitrate. Soil Sci. Soc. Am. J. 1993, 57, 66–72. [Google Scholar] [CrossRef]
  10. Chen, C.; Chen, D.; Pan, J.; Lam, S.K. Analysis of factors controlling soil N2O emission by principal component and path analysis method. Environ. Earth Sci. 2014, 72, 1511–1517. [Google Scholar] [CrossRef]
  11. Zumft, W.G. Cell biology and molecular basis of denitrification. Microbiol. Mol. Biol. Rev. 1997, 61, 533–616. [Google Scholar] [CrossRef]
  12. Ruser, R.; Flessa, H.; Russow, R.; Schmidt, G.; Buegger, F.; Munch, J.C. Emission of N2O, N2 and CO2 from soil fertilized with nitrate: Effect of compaction, soil moisture and rewetting. Soil Biol. Biochem. 2006, 38, 263–274. [Google Scholar] [CrossRef]
  13. Mosier, A.R.; Doran, J.W.; Freney, J.R. Managing soil denitrification. J. Soil Water Conserv. 2002, 57, 505–512. [Google Scholar]
  14. Rochette, P.; Eriksen-Hamel, N.S. Chamber Measurements of Soil Nitrous Oxide Flux: Are Absolute Values Reliable? Soil Sci. Soc. Am. J. 2008, 72, 331–342. [Google Scholar] [CrossRef]
  15. Li, Y.; Barton, L.; Chen, D. Simulating response of N2O emissions to fertiliser N application and climatic variability from a rain-fed and wheat-cropped soil in Western Australia. J. Sci. Food Agric. 2012, 92, 1130–1143. [Google Scholar] [CrossRef]
  16. Goglio, P.; Colnenne-David, C.; Laville, P.; Doré, T.; Gabrielle, B. 29% N2O emission reduction from a modelled low-greenhouse gas cropping system during 2009–2011. Environ. Chem. Lett. 2013, 11, 143–149. [Google Scholar] [CrossRef]
  17. Parton, W.J.; Mosier, A.R.; Ojima, D.S.; Valentine, D.W.; Schimel, D.S.; Weier, K.; Kulmala, A.E. Generalized model for N2 and N2O production from nitrification and denitrification. Glob. Biogeochem. Cycles 1996, 10, 401–412. [Google Scholar] [CrossRef]
  18. IPCC. Chapter 11: N2O emissions from managed soils, and CO2 emissions from lime and urea application. In IPCC Guidelines for National Greenhouse Gas Inventories; IPCC: Geneva, Switzerland, 2006; pp. 11.1–11.54. [Google Scholar]
  19. IPCC. N2O Emissions from Managed Soils, and CO2 Emissions from Lime and Urea Application. In 2019 Refinement to the 2006 IPCC Guidelines for National Greenhouse Gas Inventories; IPCC: Geneva, Switzerland, 2019; pp. 1–48. ISBN 4887880324. [Google Scholar]
  20. Shcherbak, I.; Millar, N.; Robertson, G.P. Global metaanalysis of the nonlinear response of soil nitrous oxide (N2O) emissions to fertilizer nitrogen. Proc. Natl. Acad. Sci. USA 2014, 111, 9199–9204. [Google Scholar] [CrossRef]
  21. Leip, A.; Busto, M.; Winiwarter, W. Developing spatially stratified N2O emission factors for Europe. Environ. Pollut. 2011, 159, 3223–3232. [Google Scholar] [CrossRef]
  22. Ruser, R.; Fuß, R.; Andres, M.; Hegewald, H.; Kesenheimer, K.; Köbke, S.; Räbiger, T.; Quinones, T.S.; Augustin, J.; Christen, O.; et al. Nitrous oxide emissions from winter oilseed rape cultivation. Agric. Ecosyst. Environ. 2017, 249, 57–69. [Google Scholar] [CrossRef]
  23. Mathivanan, G.P.; Eysholdt, M.; Zinnbauer, M.; Rösemann, C.; Fuß, R. New N2O emission factors for crop residues and fertiliser inputs to agricultural soils in Germany. Agric. Ecosyst. Environ. 2021, 322, 107640. [Google Scholar] [CrossRef]
  24. Heinen, M. Simplified denitrification models: Overview and properties. Geoderma 2005, 133, 444–463. [Google Scholar] [CrossRef]
  25. DESTATIS Regional Database Germany Verfügbar Unter. Available online: https://www.regionalstatistik.de/genesis/online (accessed on 21 November 2023).
  26. Fuss, R.; Hueppi, R.; Pedersen, A.R. Package ‘Gasfluxes’. 2019. Available online: https://cran.r-project.org/web/packages/gasfluxes/gasfluxes.pdf (accessed on 29 November 2023).
  27. Räbiger, T.; Andres, M.; Hegewald, H.; Kesenheimer, K.; Köbke, S.; Quinones, T.S.; Böttcher, U.; Kage, H. Indirect nitrous oxide emissions from oilseed rape cropping systems by NH3 volatilization and nitrate leaching as affected by nitrogen source, N rate and site conditions. Eur. J. Agron. 2020, 116, 126039. [Google Scholar] [CrossRef]
  28. Böttcher, U.; Weymann, W.; Pullens, J.W.M.; Olesen, J.E.; Kage, H. Development and evaluation of HUME-OSR: A dynamic crop growth model for winter oilseed rape. Field Crops Res. 2020, 246, 107679. [Google Scholar] [CrossRef]
  29. Weymann, W. Model-Base Analysis of Weather, Soil and Management Effects on Yield Formation of Winter Oilseed Rape; Christian-Albrechts-Universität zu Kiel: Kiel, Germany, 2015. [Google Scholar]
  30. Ratjen, A.M.; Kage, H. Forecasting yield via reference- and scenario calculations. Comput. Electron. Agric. 2015, 114, 212–220. [Google Scholar] [CrossRef]
  31. Kage, H.; Stützel, H. HUME: An object oriented component library for generic modular modelling of dynamic systems. Model. Crop. Syst. 1999, 2–3. [Google Scholar]
  32. Kage, H.; Alt, C.; Stützel, H. Aspects of nitrogen use efficiency of cauliflower I. A simulation modelling based analysis of nitrogen availability under field conditions. J. Agric. Sci. 2003, 141, 1–16. [Google Scholar] [CrossRef]
  33. Zhou, Z.; Zheng, X.; Xie, B.; Han, S.; Liu, C. A process-based model of N2O emission from a rice-winter wheat rotation agro-ecosystem: Structure, validation and sensitivity. Adv. Atmos. Sci. 2010, 27, 137–150. [Google Scholar] [CrossRef]
  34. Hansen, S.; Jensen, H.; NE, N.; Svendsen, H. NPo-Research, A10: DAISY: Soil Plant Atmosphere System Model; Miljoestyrelsen: Copenhagen, Denmark, 1990. [Google Scholar]
  35. Thorburn, P.J.; Biggs, J.S.; Collins, K.; Probert, M.E. Using the APSIM model to estimate nitrous oxide emissions from diverse Australian sugarcane production systems. Agric. Ecosyst. Environ. 2010, 136, 343–350. [Google Scholar] [CrossRef]
  36. Del Grosso, S.J.; Parton, W.J.; Mosier, A.R.; Ojima, D.S.; Kulmala, A.E.; Phongpan, S. General model for N2O and N2 gas emissions from soils due to dentrification. Global Biogeochem. Cycles 2000, 14, 1045–1060. [Google Scholar] [CrossRef]
  37. van Genuchten, M.T. A Closed-form Equation for Predicting the Hydraulic Conductivity of Unsaturated Soils. Soil Sci. Soc. Am. J. 1980, 44, 892–898. [Google Scholar] [CrossRef]
  38. Henke, J.; Böttcher, U.; Neukam, D.; Sieling, K.; Kage, H. Evaluation of different agronomic strategies to reduce nitrate leaching after winter oilseed rape (Brassica napus L.) using a simulation model. Nutr. Cycl. Agroecosyst. 2008, 82, 299–314. [Google Scholar] [CrossRef]
  39. Verberne, E.L.J.; Hassink, J.; de Willigen, P.; Groot, J.J.R.; van Veen, J.A. Modelling organic matter dynamics in different soils. Neth. J. Agric. Sci. 1990, 38, 221–238. [Google Scholar] [CrossRef]
  40. R Core Team. R: A Language and Environment for Statistical Computing R. Foundation for Statistical Computing; Version 4.1.2; R Core Team: Vienna, Austria, 2021. [Google Scholar]
  41. Neeteson, J.J.; Wadman, W.P. Assessment of economically optimum application rates of fertilizer N on the basis of response curves. Fertil. Res. 1987, 12, 37–52. [Google Scholar] [CrossRef]
  42. Dhakal, C.; Lange, K. Crop yield response functions in nutrient application: A review. Agron. J. 2021, 113, 5222–5234. [Google Scholar] [CrossRef]
  43. Gabrielle, B.; Laville, P.; Duval, O.; Nicoullaud, B.; Germon, J.C.; Hénault, C. Process-based modeling of nitrous oxide emissions from wheat-cropped soils at the subregional scale. Global Biogeochem. Cycles 2006, 20, GB4018. [Google Scholar] [CrossRef]
  44. Yuan, F.; Meixner, T.; Fenn, M.E.; Šimůnek, J. Impact of transient soil water simulation to estimated nitrogen leaching and emission at high- and low-deposition forest sites in Southern California. J. Geophys. Res. 2011, 116, G03040. [Google Scholar] [CrossRef]
  45. Cui, J.; Li, C.; Sun, G.; Trettin, C. Linkage of MIKE SHE to Wetland-DNDC for carbon budgeting and anaerobic biogeochemistry simulation. Biogeochemistry 2005, 72, 147–167. [Google Scholar] [CrossRef]
  46. Myrgiotis, V.; Williams, M.; Rees, R.M.; Topp, C.F.E. Estimating the soil N2O emission intensity of croplands in northwest Europe. Biogeosciences 2019, 16, 1641–1655. [Google Scholar] [CrossRef]
  47. Li, X.; Yeluripati, J.; Jones, E.O.; Uchida, Y.; Hatano, R. Hierarchical Bayesian calibration of nitrous oxide (N2O) and nitrogen monoxide (NO) flux module of an agro-ecosystem model: ECOSSE. Ecol. Modell. 2015, 316, 14–27. [Google Scholar] [CrossRef]
  48. Smith, W.; Grant, B.; Qi, Z.; He, W.; VanderZaag, A.; Drury, C.F.; Helmers, M. Development of the DNDC model to improve soil hydrology and incorporate mechanistic tile drainage: A comparative analysis with RZWQM2. Environ. Model. Softw. 2020, 123, 104577. [Google Scholar] [CrossRef]
  49. Mielenz, H.; Thorburn, P.J.; Scheer, C.; De Antoni Migliorati, M.; Grace, P.R.; Bell, M.J. Opportunities for mitigating nitrous oxide emissions in subtropical cereal and fiber cropping systems: A simulation study. Agric. Ecosyst. Environ. 2016, 218, 11–27. [Google Scholar] [CrossRef]
  50. Guest, G.; Kröbel, R.; Grant, B.; Smith, W.; Sansoulet, J.; Pattey, E.; Desjardins, R.; Jégo, G.; Tremblay, N.; Tremblay, G. Model comparison of soil processes in eastern Canada using DayCent, DNDC and STICS. Nutr. Cycl. Agroecosyst. 2017, 109, 211–232. [Google Scholar] [CrossRef]
  51. Groffman, P.M.; Tiedje, J.M. Relationships between denitrification, CO2 production and air-filled porosity in soils of different texture and drainage. Soil Biol. Biochem. 1991, 23, 299–302. [Google Scholar] [CrossRef]
  52. Velthof, G.L.; Kuikman, P.J.; Oenema, O. Nitrous oxide emission from animal manures applied to soil under controlled conditions. Biol. Fertil. Soils 2003, 37, 221–230. [Google Scholar] [CrossRef]
  53. Chadwick, D.R.; Pain, B.F.; Brookman, S.K.E. Nitrous Oxide and Methane Emissions following Application of Animal Manures to Grassland. J. Environ. Qual. 2000, 29, 277–287. [Google Scholar] [CrossRef]
  54. Li, C.; Aber, J.; Stange, F.; Butterbach-Bahl, K.; Papen, H. A process-oriented model of N2O and NO emissions from forest soils: 1. Model development. J. Geophys. Res. Atmos. 2000, 105, 4369–4384. [Google Scholar] [CrossRef]
  55. Yang, Q.; Zhang, X.; Abraha, M.; Del grosso, S.; Robertson, G.P.; Chen, J. Enhancing the soil and water assessment tool model for simulating N2O emissions of three agricultural systems. Ecosyst. Health Sustain. 2017, 3, 11879067. [Google Scholar] [CrossRef]
  56. Bell, M.J.; Jones, E.; Smith, J.; Smith, P.; Yeluripati, J.; Augustin, J.; Juszczak, R.; Olejnik, J.; Sommer, M. Simulation of soil nitrogen, nitrous oxide emissions and mitigation scenarios at 3 European cropland sites using the ECOSSE model. Nutr. Cycl. Agroecosyst. 2012, 92, 161–181. [Google Scholar] [CrossRef]
  57. Molina-Herrera, S.; Haas, E.; Klatt, S.; Kraus, D.; Augustin, J.; Magliulo, V.; Tallec, T.; Ceschia, E.; Ammann, C.; Loubet, B.; et al. A modeling study on mitigation of N2O emissions and NO3 leaching at different agricultural sites across Europe using LandscapeDNDC. Sci. Total Environ. 2016, 553, 128–140. [Google Scholar] [CrossRef]
  58. Kim, D.G.; Hernandez-Ramirez, G.; Giltrap, D. Linear and nonlinear dependency of direct nitrous oxide emissions on fertilizer nitrogen input: A meta-analysis. Agric. Ecosyst. Environ. 2013, 168, 53–65. [Google Scholar] [CrossRef]
  59. Walter, K.; Don, A.; Fuß, R.; Kern, J.; Drewer, J.; Flessa, H. Direct nitrous oxide emissions from oilseed rape cropping—A meta-analysis. GCB Bioenergy 2015, 7, 1260–1271. [Google Scholar] [CrossRef]
  60. Mallast, J.; Stichnothe, H.; Flessa, H.; Fuß, R.; Lucas-Moffat, A.M.; Petersen-Schlapkohl, U.; Augustin, J.; Hagemann, U.; Kesenheimer, K.; Ruser, R.; et al. Multi-variable experimental data set of agronomic data and gaseous soil emissions from maize, oilseed rape and other energy crops at eight sites in Germany. Open Data J. Agric. Res. 2021, 7, 11–19. [Google Scholar] [CrossRef]
  61. Kristensen, A.H.; Thorbjørn, A.; Jensen, M.P.; Pedersen, M. Gas-phase diffusivity and tortuosity of structured soils. J. Contam. Hydrol. 2010, 115, 26–33. [Google Scholar] [CrossRef] [PubMed]
Figure 1. Location of the five study sites in regions with a high winter oilseed rape (WOSR) cropland share (mean 2010–2020) and different yield levels (mean 2018–2022). Data source: [25].
Agriculture 14 00070 g001
Figure 2. Schematic overview of the N2O-emission underlying processes and driving forces.
Agriculture 14 00070 g002
Figure 3. Exemplary simulated (lines) and observed (points) dynamics of soil water content, soil mineral nitrogen (SMN), and N2O emissions, as well as precipitation, in daily time steps for the treatments without N input (0 N) and with typical N input (180 CAN) at the Hohenschulen site for the oilseed rape harvest year 2014. T: tillage event; F: fertilization event; the y axis of daily N2O flux was scaled using log-modulus transformation.
Agriculture 14 00070 g003
Figure 4. Exemplary comparison of site-specific N2O emissions on three levels of aggregation (daily, monthly, and cumulated over the entire measuring period) for the treatment with 180 kg mineral N application from calcium ammonium nitrate (CAN) at three selected sites, indicating low-, medium-, and high-emission conditions. Measured data are shown as points, simulated values are shown as lines. Harvest year of oilseed rape: 2014; T: tillage event; F: fertilization event; y axis of daily N2O flux was scaled using log-modulus transformation.
Agriculture 14 00070 g004
Figure 5. Comparison of measured and simulated cumulated N2O emissions for the five sites and the three periods (>12 months) for both calibration data ((A): n = 39; RMSE = 1.05 kg N ha−1) and evaluation data ((B): n = 21; RMSE = 0.69 kg N ha−1).
Agriculture 14 00070 g005
Figure 6. Simulated fraction of yearly N2O-emissions from nitrification relative to total emissions for all sites and N treatments (kg ha−1 N input; CAN: calcium ammonium nitrate, DIG: biogas digestate with kg NH4-N).
Agriculture 14 00070 g006
Figure 7. Simulated long-term annual levels (1991–2016) of N2O emission of the five study sites and the fertilizer treatments (boxplots) and corresponding simulated values of the three experimental periods (horizontal lines, 2013–2015); CAN = kg N from calcium ammonium nitrate, 180 DIG = 180 kg NH4-N + organic N.
Agriculture 14 00070 g007
Figure 8. Simulated annual long-term N2O emissions of the five sites as a function of mineral N fertilization, in contrast to emissions calculated by the linear IPCC default emission factor (EF).
Agriculture 14 00070 g008
Table 1. Soil conditions of the study sites after IUSS classification.
SiteSoil Type [IUSS]Clay [%]Silt [%]Sand [%]Texture Class [IUSS]pHCorg [%)Nt [%)
BergeLuvisol9.318.572.2SaLo6.51.150.09
DedelowLuvisol1030.959.1Lo7.40.750.10
HohenschulenHaplic Luvisol10.529.460.1Lo6.01.680.20
Ihinger HofHaplic Luvisol/Anthrosol3.278.218.6SiLo6.81.870.12
MerbitzHaplic Chernosem15.867.816.4SiClLo6.61.180.11
Table 2. Annual mean temperature and precipitation sum of the three experimental years together with their long-term average (LTA).
SiteTemperaturePrecipitation
[°C]Yearly Deviation [°C][mm]Yearly Deviation [mm]
LTA201320142015LTA201320142015
Berge8.7+0.7+4.3+1.9503+112−21+67
Dedelow8.4+0.3+1.5+1.3485−39+76−71
Hohenschulen8.9−0.8+0.8−0.1732−78−323+38
Ihinger Hof8.3+0.4+2.2+1.8688+235+75−144
Merbitz9.0+0.1+1.7+1.4520+180−64−91
Table 3. Statistical criteria for simulated and measured N2O emissions for the calibration and evaluation dataset. Statistics are provided for the entire simulation period (total), monthly periods, and daily periods of simulated vs. measured N2O-emissions.
DatasetCalibrationEvaluation
Aggregation leveltotalmonthlydailytotalmonthlydaily
No. of observations396042228213041144
R20.480.230.0650.770.340.064
Slope0.6060.410.160.7710.530.12
Intercept−1.130.090.0040.7520.070.004
RMSE [kg N ha−1]1.050.170.010.690.130.01
Table 4. Mean emission factors (EFs) for selected N input levels (200 kg N ha−1, site specific economic optima (Nopt) from mineral fertilizer and 180 kg NH4-N from organic sources (DIG)).
SiteEF200
[%]
EFNopt
[%]
EF180 DIG
[%]
Berge0.1650.1640.462
Dedelow0.1610.1610.579
Hohenschulen0.1840.1920.542
Ihinger Hof0.3210.3341.050
Merbitz0.6480.6511.419
Disclaimer/Publisher’s Note: The statements, opinions and data contained in all publications are solely those of the individual author(s) and contributor(s) and not of MDPI and/or the editor(s). MDPI and/or the editor(s) disclaim responsibility for any injury to people or property resulting from any ideas, methods, instructions or products referred to in the content.

