Article

Soil Sulfur Deficiency Restricts Canola (Brassica napus) Productivity in Northwestern Russia Regardless of NPK Fertilization Level

by
Aleksei Dobrokhotov
1,2,3,*,
Ludmila Kozyreva
1,
Mariia Fesenko
1,
Victoria Dubovitskaya
1 and
Sofia Sushko
1,3,4
1
Agrophysical Research Institute, Grazhdanskiy Prospect 14, 195220 Saint-Petersburg, Russia
2
Digital Twins Laboratory of Agrolandscapes (AgroDT Lab), V.V. Dokuchaev Soil Science Institute, Pyzhyovskiy Lane 7 Building 2, 119017 Moscow, Russia
3
Agro-Technology Institute, Peoples Friendship University of Russia (RUDN University), Miklukho-Maklaya 6, 117198 Moscow, Russia
4
Institute of Physicochemical and Biological Problems in Soil Science, Russian Academy of Sciences, Institutskaya 2, 142290 Pushchino, Russia
*
Author to whom correspondence should be addressed.
Agriculture 2023, 13(7), 1409; https://doi.org/10.3390/agriculture13071409
Submission received: 25 May 2023 / Revised: 11 July 2023 / Accepted: 14 July 2023 / Published: 15 July 2023

Abstract

:
Canola cultivation at high latitudes is becoming more promising in terms of modern climate change. Sustainable crop production requires an understanding of yield-limiting factors, which need to be adjusted in agricultural management first. Therefore, our study was aimed at examining the effect of climate and soil fertility factors on the canola yield from 2012 to 2015 in northwestern Russia. Simultaneously, effectiveness of chemical fertilizer (N 65 P 50 K 50 and N 100 P 75 K 75 ) rates was tested. Studied soils had light texture, high acidity and severe sulfur deficiency. Canola yield (Y) varied from 0.81 to 1.60 t·ha 1 for the observed period. Applied fertilizer increased Y by around 30%, but this change was not significant. Climate effect testing with the FAO-AquaCrop simulation showed no noticeable water and heat stresses for the study period (0% to 20% reduction in potential Y). Among the tested soil properties, the content of organic carbon, available nitrogen and sulfur significantly correlated with Y (r = 0.58–0.66). Combining these factors together with soil pH in a path model explained 60% of variability in Y. Importantly, sulfur had the highest and most significant effect in this model. Thus, this soil parameter is the main yield-limiting factor in the study area, which must be the first to be adjusted in agricultural practice.

1. Introduction

Canola (Brassica napus L.) is an important crop used for both edible oil and biofuel production [1]. Currently, the global canola harvest reaches 87 million tons [2], making it the third largest oilseed crop after palm oil and soybeans [3]. The leading canola producers are the European Union, Canada, China, India and Australia, which together account for 84% of the global harvest [2]. Although canola is adapted to a wide range of growing environment conditions, it is quite sensitive to heat and drought [4,5]. Therefore, northern regions can be considered as favorable areas for canola cultivation, especially with regard to modern climate change [3,6]. In particular, the expected warming and sufficient rainfall in northwestern Russia make it more promising for canola production compared to southern regions with frequent droughts [7,8]. Nevertheless, anomalous heat waves and severe droughts have also been observed in this area [9,10]. Canola is known to be particularly sensitive to early heat and water stress, resulting in reduced crop quality and quantity [5]. Therefore, assessing the climatic effect on the crop productivity is a relevant issue for the adaptation and expansion of canola cultivation in northwestern Russia.
On the other hand, this region is mainly characterized by acidic and nutrient-poor soils, such as Podzols and Retisols [11]. Canola is known to have higher requirements for nitrogen (N) and sulfur (S) than small-grain cereals [12,13,14,15] and other oilseed crops [16]. Field studies around the world have shown that limited content of available N and S in the soils can reduce canola yields by approx. 50–190% and 30–840%, respectively [17,18,19]. Other nutrients such as phosphorus (P) and potassium (K) are also critical for the crop growth, development and disease resistance [20,21,22,23,24,25]. In turn, soil pH largely determines the availability of these nutrients for the plants [26]. Acidic soils (pH < 4.9–5.8) have been shown to significantly reduce canola productivity [27,28]. Summing up this brief survey, the soil conditions of northwestern Russia can be considered as unfavorable for canola cultivation. Therefore, understanding the specific soil factors limiting canola yield is essential for developing effective agriculture management and sustainable crop production. However, there is only very scarce information about this subject in the scientific literature, which underlines the relevance of such studies.
In practice, nutrient deficiency in soils is often corrected by application of chemical fertilizers [29,30]. Nevertheless, this practice can be ineffective for canola production without maintaining the right balance between soil nutrients, especially the S:N ratio [18,31]. Moreover, in light-textured soils, there is a risk of fertilizer loss caused by leaching [32,33]. Currently, in many regions of Russia, there is an imbalance of nutrients in soils with a predominance of losses over accumulation [34]. Consequently, there is also a demand to develop optimal and cost-effective fertilizer systems to ensure sustainable canola yield and seed quality [35]. Considering all of the above, our study was aimed at assessing the effects of climate, soil fertility parameters and different levels of NPK fertilizer on canola productivity in northwestern Russia.

2. Materials and Methods

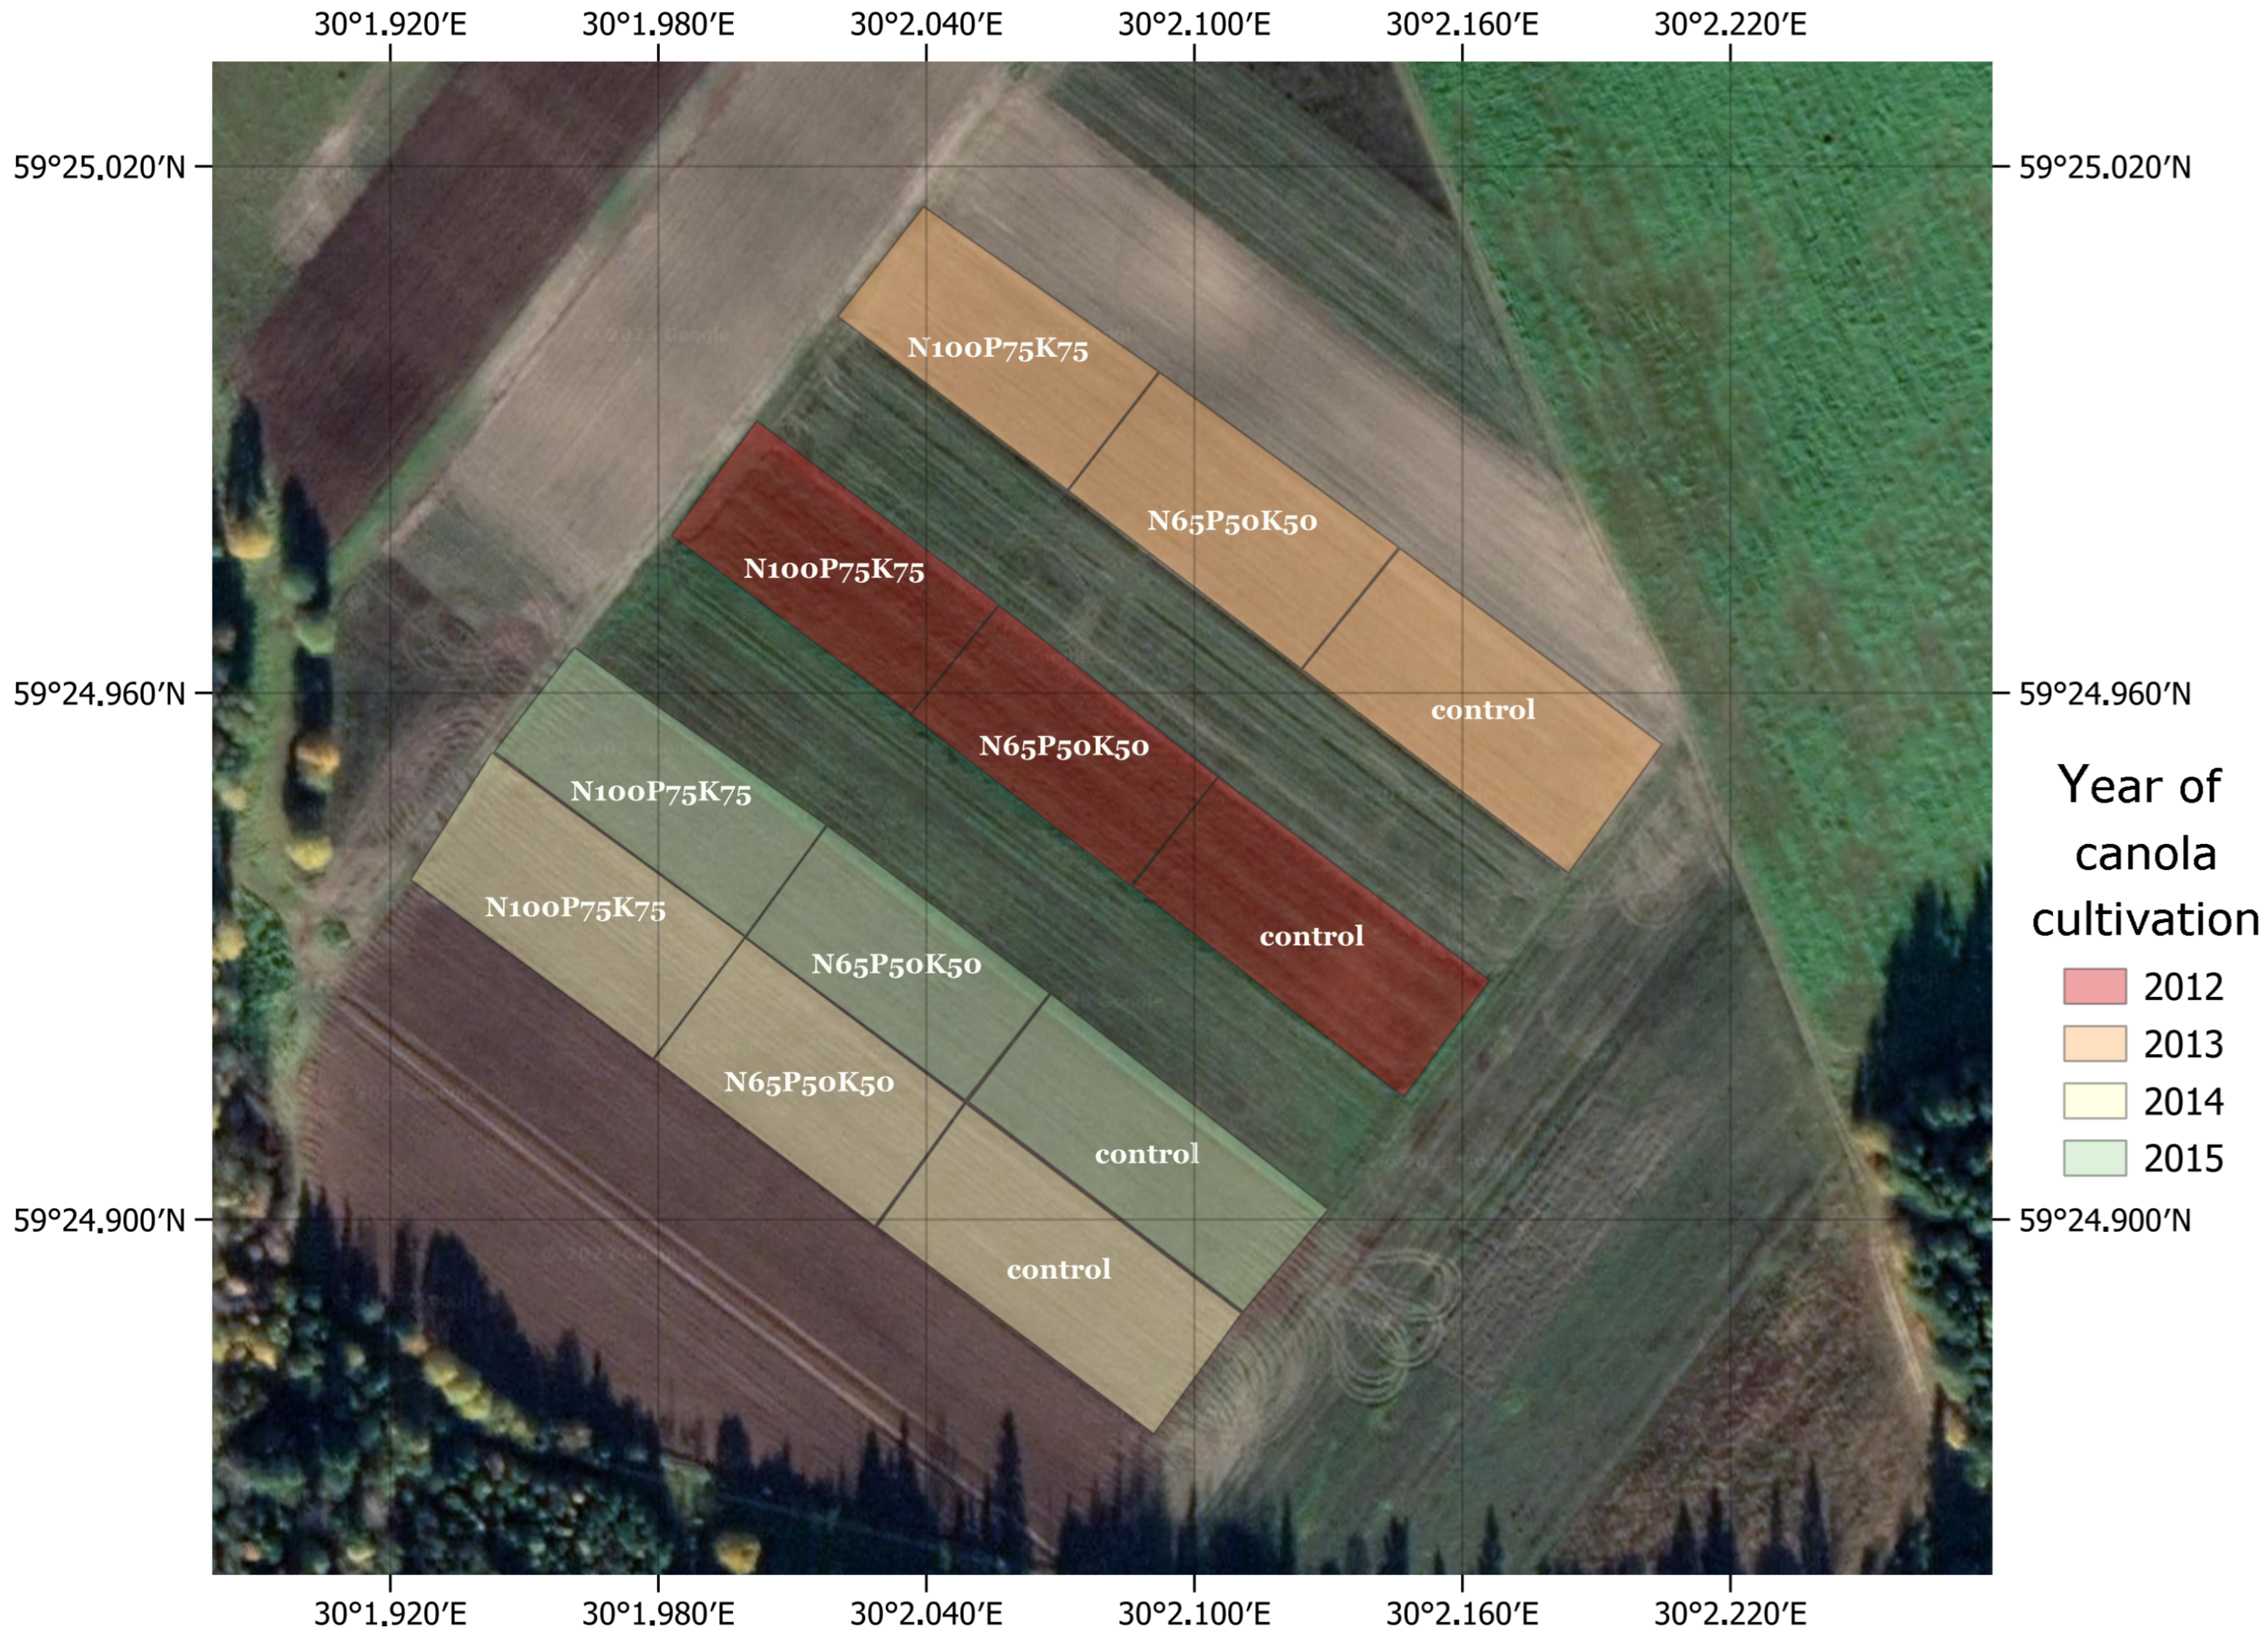
2.1. General Characteristics of Experimental Field

Field experiments were conducted at the Menkovo experimental station of the Agrophysical Research Institute in the Leningrad Region, Russia (59°24 57 N 30°02 04 E). The territory belongs to the southern taiga with a mean annual temperature of 4.9 °C and annual precipitation of 679 mm (1991–2020; data taken from the nearest WMO meteorological station “26069 Belogorka”). The soil at the Menkovo experimental station was sandy Albic Retisol. The parent materials were moraine deposits, lacustrine–glacial sands and sandy loams. Long-term field experiments (since 1982) have been conducted at the station to test the effect of medium and high rates of NPK fertilizers on different crops in the rotation (i.e., winter rye, three mixtures of perennial grasses, potatoes and spring wheat). Since 2012, spring canola has replaced spring wheat in the crop rotation. Conventional tillage (plowing to 22–24 cm) was used in the experimental field.

2.2. Experimental Design

The spring canola (Brassica napus L.) of the Oredezh-4 variety was cultivated at the Agroecological Station in 2012–2015. For this, four experimental plots of 180 m × 90 m were chosen (one for each canola cultivation season). Each plot was divided into three equal sites according to the level of applied NPK fertilizers: 1—unfertilized (N 0 P 0 K 0 ; control), 2—N 65 P 50 K 50 , 3—N 100 P 75 K 75 (Figure 1). Nitroammophosphates (NH 4 H 2 PO 4 -NH 4 NO 3 -KCl) and ammonium nitrate (NH 4 NO 3 ) were used as chemical fertilizers. During canola cultivation period, pesticides (herbicides and insecticides) were applied regularly to minimize the risk of weed or pest infestation. Prior to canola field experiment (autumn 2011), soil samples were taken from the top 0–20 cm layer at all tested sites (total 12 = 4 plots × 3 fertilization levels) to assess the initial soil fertility conditions. The soil sample of each site was composed of 30 spatially distributed subsamples. Overall, the experimental design contributed to the expected variation in canola productivity caused by combination effects of three main factors: climate (seasonal variation), soil fertility and different NPK levels (spatial variation).

2.3. Assessing Canola Yield and Soil Analysis

Canola yield at each test site was measured from an area of 0.7 m × 0.7 m in triplicate. Air-dried soil samples were sieved through a 2 mm mesh and used for further chemical analysis. Soil pH was measured conductometrically in a soil:KCl solution (1:2.5 ratio). Soil organic carbon (SOC) content was determined by dichromate oxidation followed by colorimetry [36]. Available nitrogen (AN) was measured using the dilute sulfuric acid (0.5 M H 2 SO 4 ) extraction method, assessing the N sum of NO 3 , NH 4 + and easily hydrolysable organic compounds [37]. Mobile phosphorus (P) and potassium (K) contents were determined by soil extraction with dilute hydrochloric acid (0.2 M HCl) and then quantified with a photoelectric colorimeter/flame photometer. Mobile sulfur (S) content was determined by soil extraction with potassium chloride solution and subsequent quantification of S-SO 4 2 using the turbidimetric method. The sum of bases (SB) was determined by extracting the absorbed soil bases with dilute hydrochloric acid (0.1 N HCl).

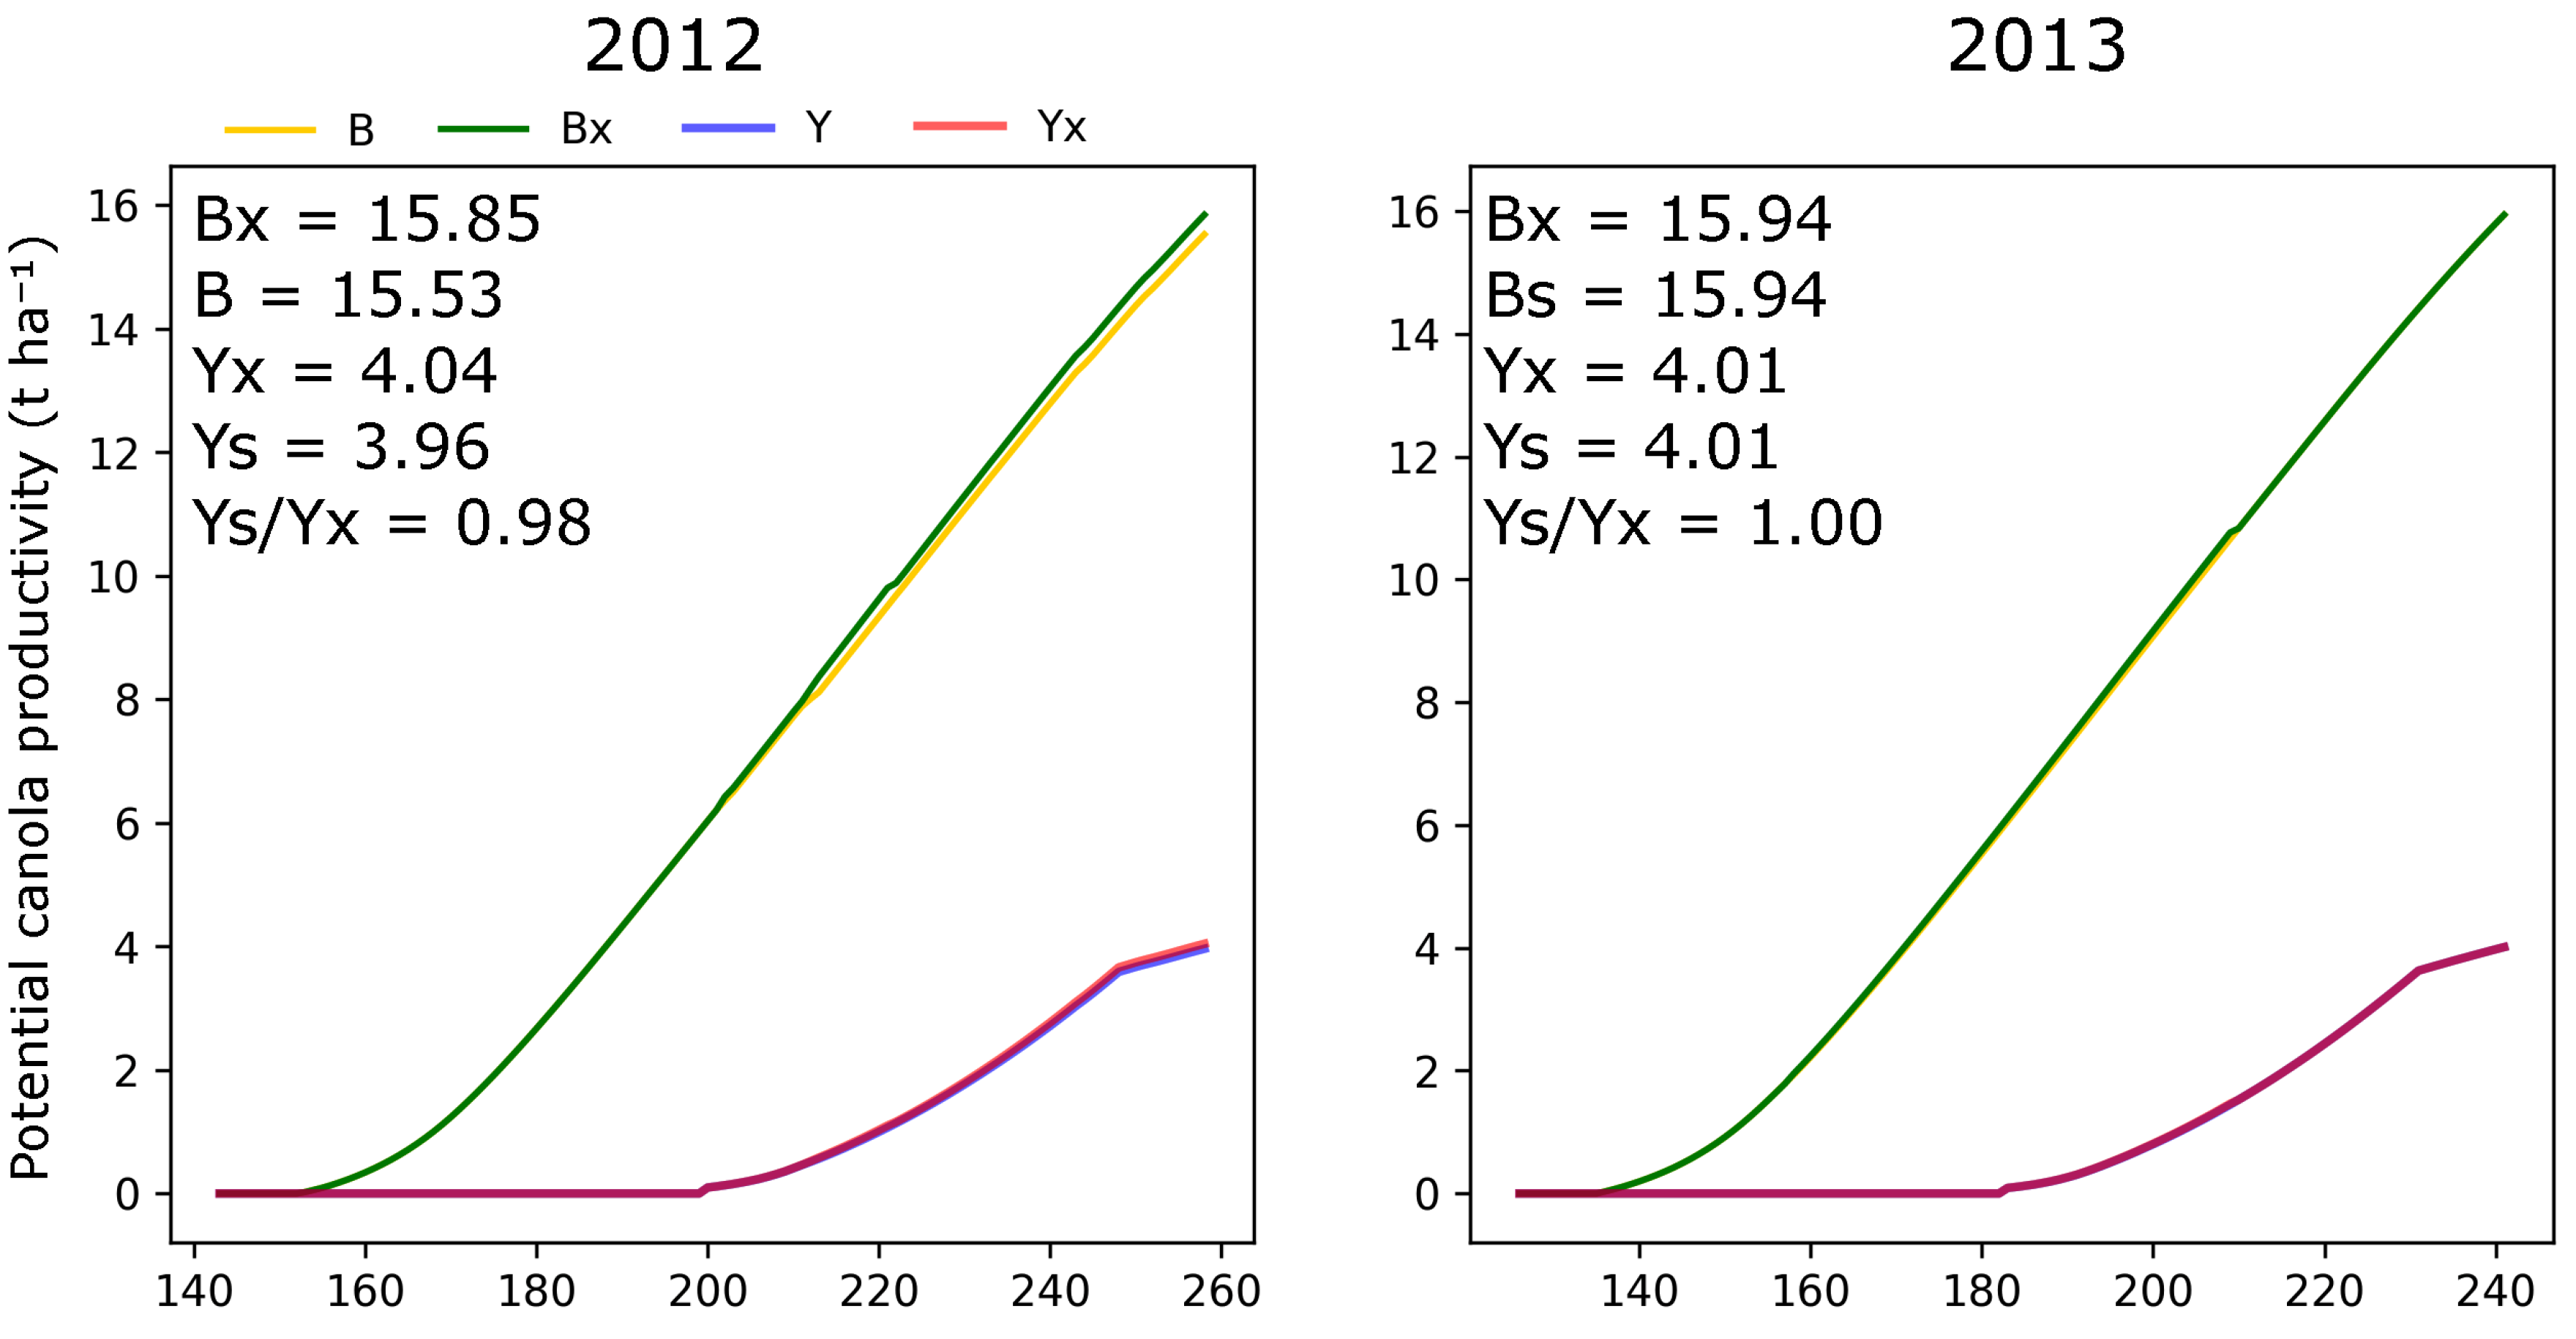
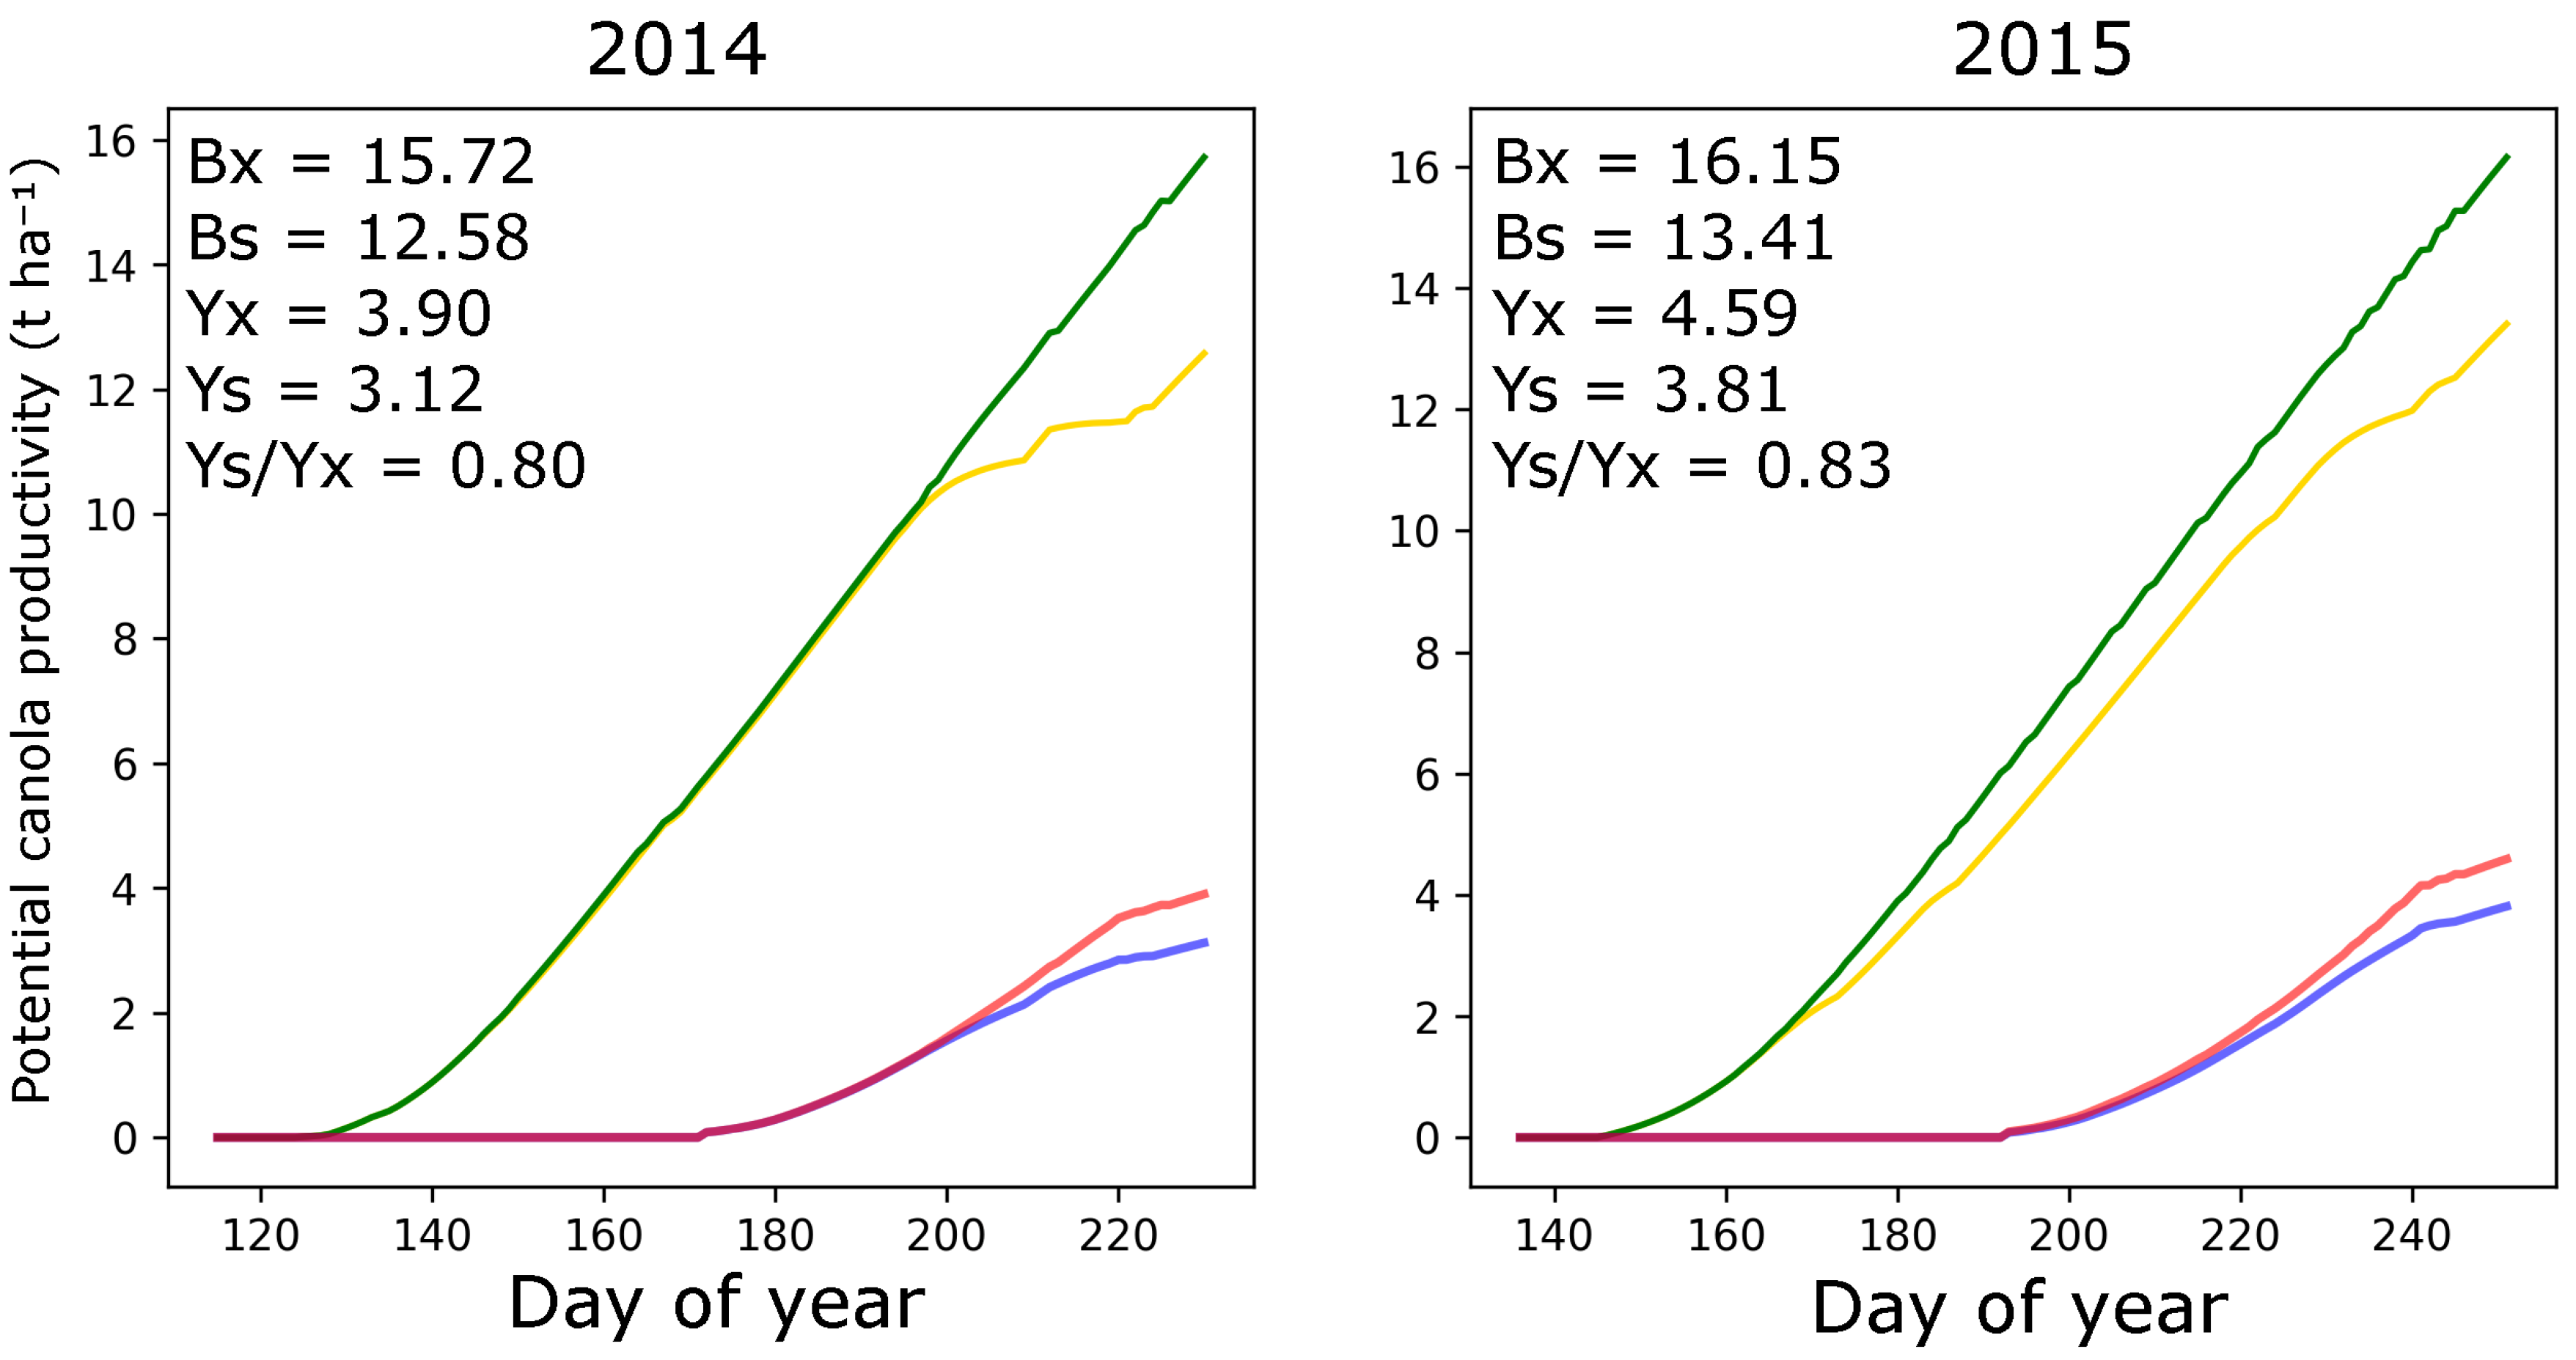
2.4. FAO-AquaCrop Model Calibration and Input Data

The climate effect (i.e., possible water and heat stress) on variation in canola productivity for the studied period was tested using the FAO-AquaCrop crop simulation model version 7.0 [38,39,40]. This is a water-driven process-based multi-crop simulation model with a good balance between simplicity, accuracy and robustness [41]. Crop response to potential water and heat stress occurs through five types of feedback [39]: (1) reduction of canopy expansion rate, (2) acceleration of senescence, (3) closure of stomata, (4) change in normalized water productivity and (5) harvest index.
For initializing the FAO-AquaCrop model, the crop sowing date, physiological parameters of crop growth and development, soil hydraulic characteristics, initial soil moisture content and climate data must be specified. Field measurements and variety testing were used to determine the non-conservative parameters of the model. The conservative parameters were obtained from the analysis of existing articles on canola modeling by FAO-AquaCrop [42,43,44,45,46]. Calibrated canola parameters for this model are presented in Table 1.
The soil hydraulic properties were calculated from pedotransfer functions using soil texture [47]. The texture was determined according to the weight content of particles of various sizes measured by pipette method, using the field soil samples taken from the soil profile (Table S1). The soil hydraulic properties are presented in Table 2. The initial soil moisture conditions were set based on the ERA5-Land climate reanalysis [48]. The data were averaged for each soil horizon for each growing season separately (Table 2).
Climate data (maximum and minimum air temperature, precipitation) for the growing seasons of 2012–2015 were obtained from a meteorological field station located 400 m from the experimental field. The reference evapotranspiration (ET 0 ) was calculated using Penman–Monteith equation [50], which requires sunshine duration data. The latter was calculated using visual observations of the total cloud amount (TCA) [51], which was obtained from the nearest WMO meteorological station (26069 “Belogorka”). TCA was visually determined as a portion of sky cloud cover (from 0.0 to 1.0). Eventually, actual sunshine duration was calculated according to the following equation:
S a = ( 1 T C A ) × S x
where S a is actual sunshine duration (h), TCA is total cloud amount (0–1) and S x is maximum possible sunshine duration (h). S x was calculated depending on geographic location and time [52].
Detailed climate data used for the simulations are summarized in Figure S1.

2.5. Statistical Analysis

The degree of variability of the studied properties was quantified by the coefficient of variation (CV, %), which is the ratio of the standard deviation to the mean. The significance of the effect of different NPK treatments on soil properties and canola yield was checked by one-factor analysis of variance (ANOVA). Prior to the analysis, variance homogeneity was tested by Levene’s test. The relationship between the studied soil properties and canola yield was tested using the Pearson’s correlation. Pathway analysis was used to explore the direct/indirect effects of possible factors on canola yields, considering the causal relationships between them. Statistical analysis and results visualization were performed in the R software system (version 4.1.2) [53] using the following packages: “car” for ANOVA, “ggcorrplot” for correlation matrix, “lavaan” and “lavaanPlot” for the path analysis.

3. Results

3.1. Soil Fertility Parameters at Studied Sites

Soil conditions at the study sites were strongly acidic and extremely poor in terms of available S (Table 3). Thus, long-term application of NPK fertilizers had not significantly changed the soil properties (p > 0.05 for one-way ANOVA). However, this had resulted in a noticeable spatial variation in soil fertility parameters across the studied sites. The coefficient of variation (CV) ranged from 14–49% for most properties, except for the less variable pH (5%) (Table S1).

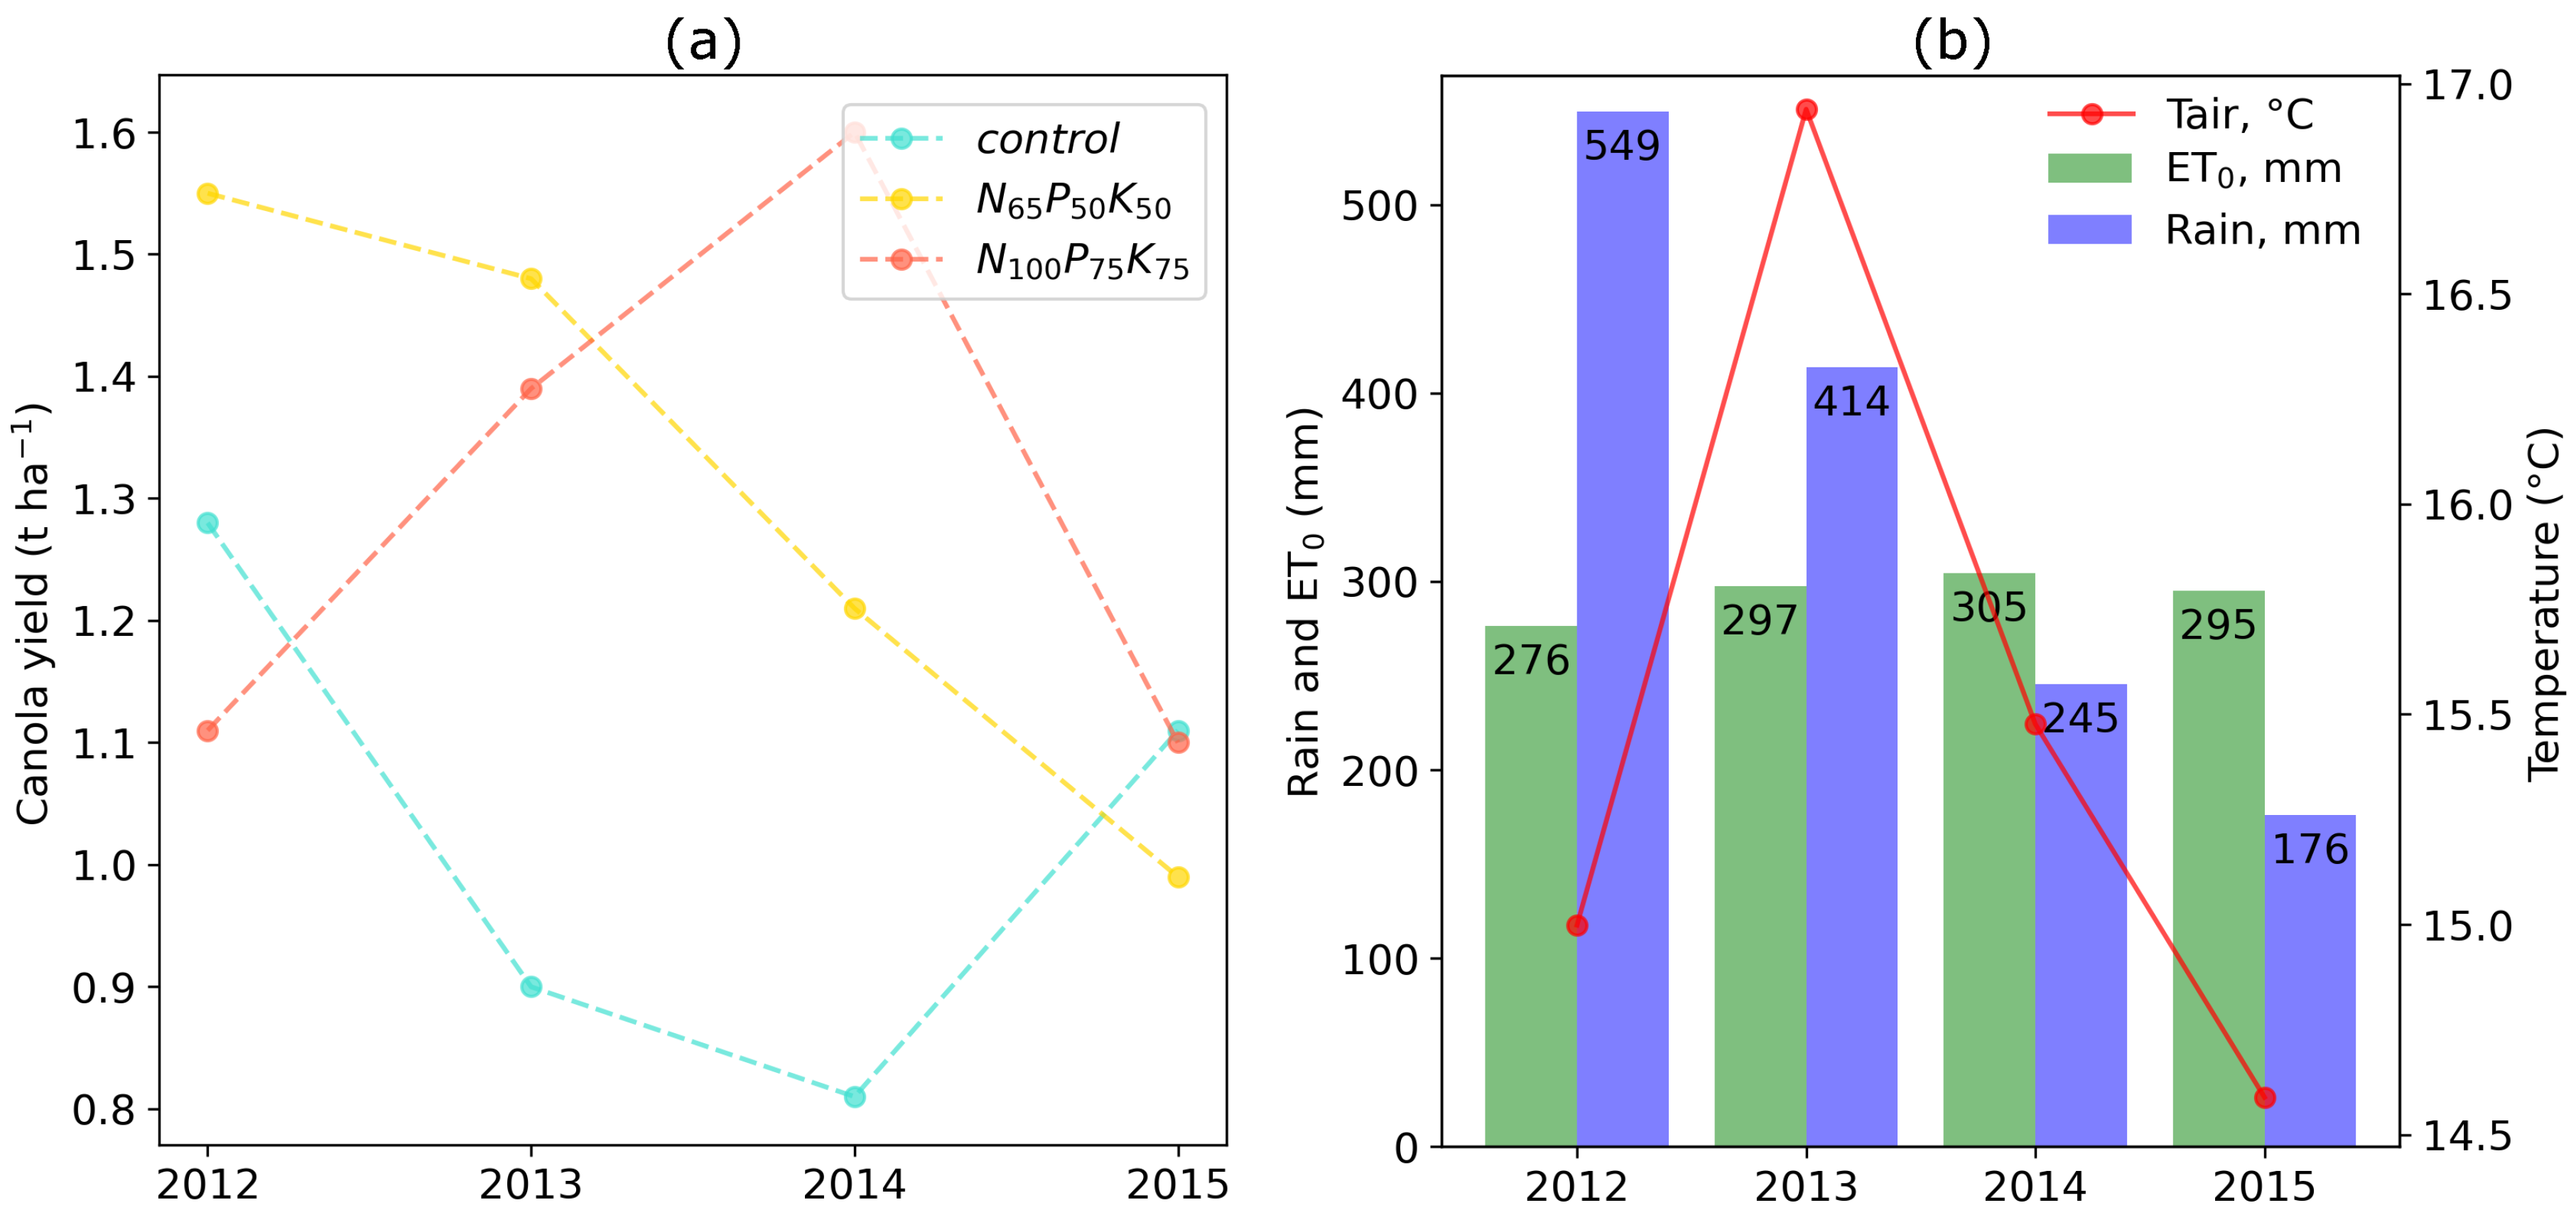
3.2. Temporal Dynamics of Canola Yield and Climatic Characteristics

Over the four-year study period (2012–2015), the canola yield with different NPK rates varied from 0.81 to 1.60 t·ha 1 (Figure 2a). Surprisingly, the patterns of temporal change in canola yield differed among the NPK treatments. At the same time, the degree of this variation was almost similar for each fertilizer treatment (CV = 19–21%; Table S2).
Average air temperatures for canola cultivation seasons (May–August) in the study years ranged from 14.6 to 16.9 °C (Figure 2b). Precipitation (rain) for this period varied considerably, amounting from 176 to 549 mm. In the first two seasons of canola cultivation, the rain exceeded the reference evapotranspiration (ET 0 ) by up to 1.4–2.0 times. However, the reverse was observed in the following two seasons (rain < ET 0 by 1.2–1.7 times), which could result in lower moisture supply to crops.
The possible impact of climate on canola productivity (aboveground biomass and yield) over the studied period was tested using the FAO-AquaCrop simulation model. The simulation results showed no difference between the potential canola productivity under the optimal and the observed climatic conditions in the first two seasons (Figure 3). At the same time, according to the model, there was a slight climatic stress in the following two seasons, which reduced the potential crop yield by 17–20%. However, the real canola yield for the study period was 3–4 times lower than the simulated one under climatic stress. This can indicate that climate played a negligible role in determining canola yield variability for the study area compared to some other factors, e.g., soil fertility and NPK treatment.

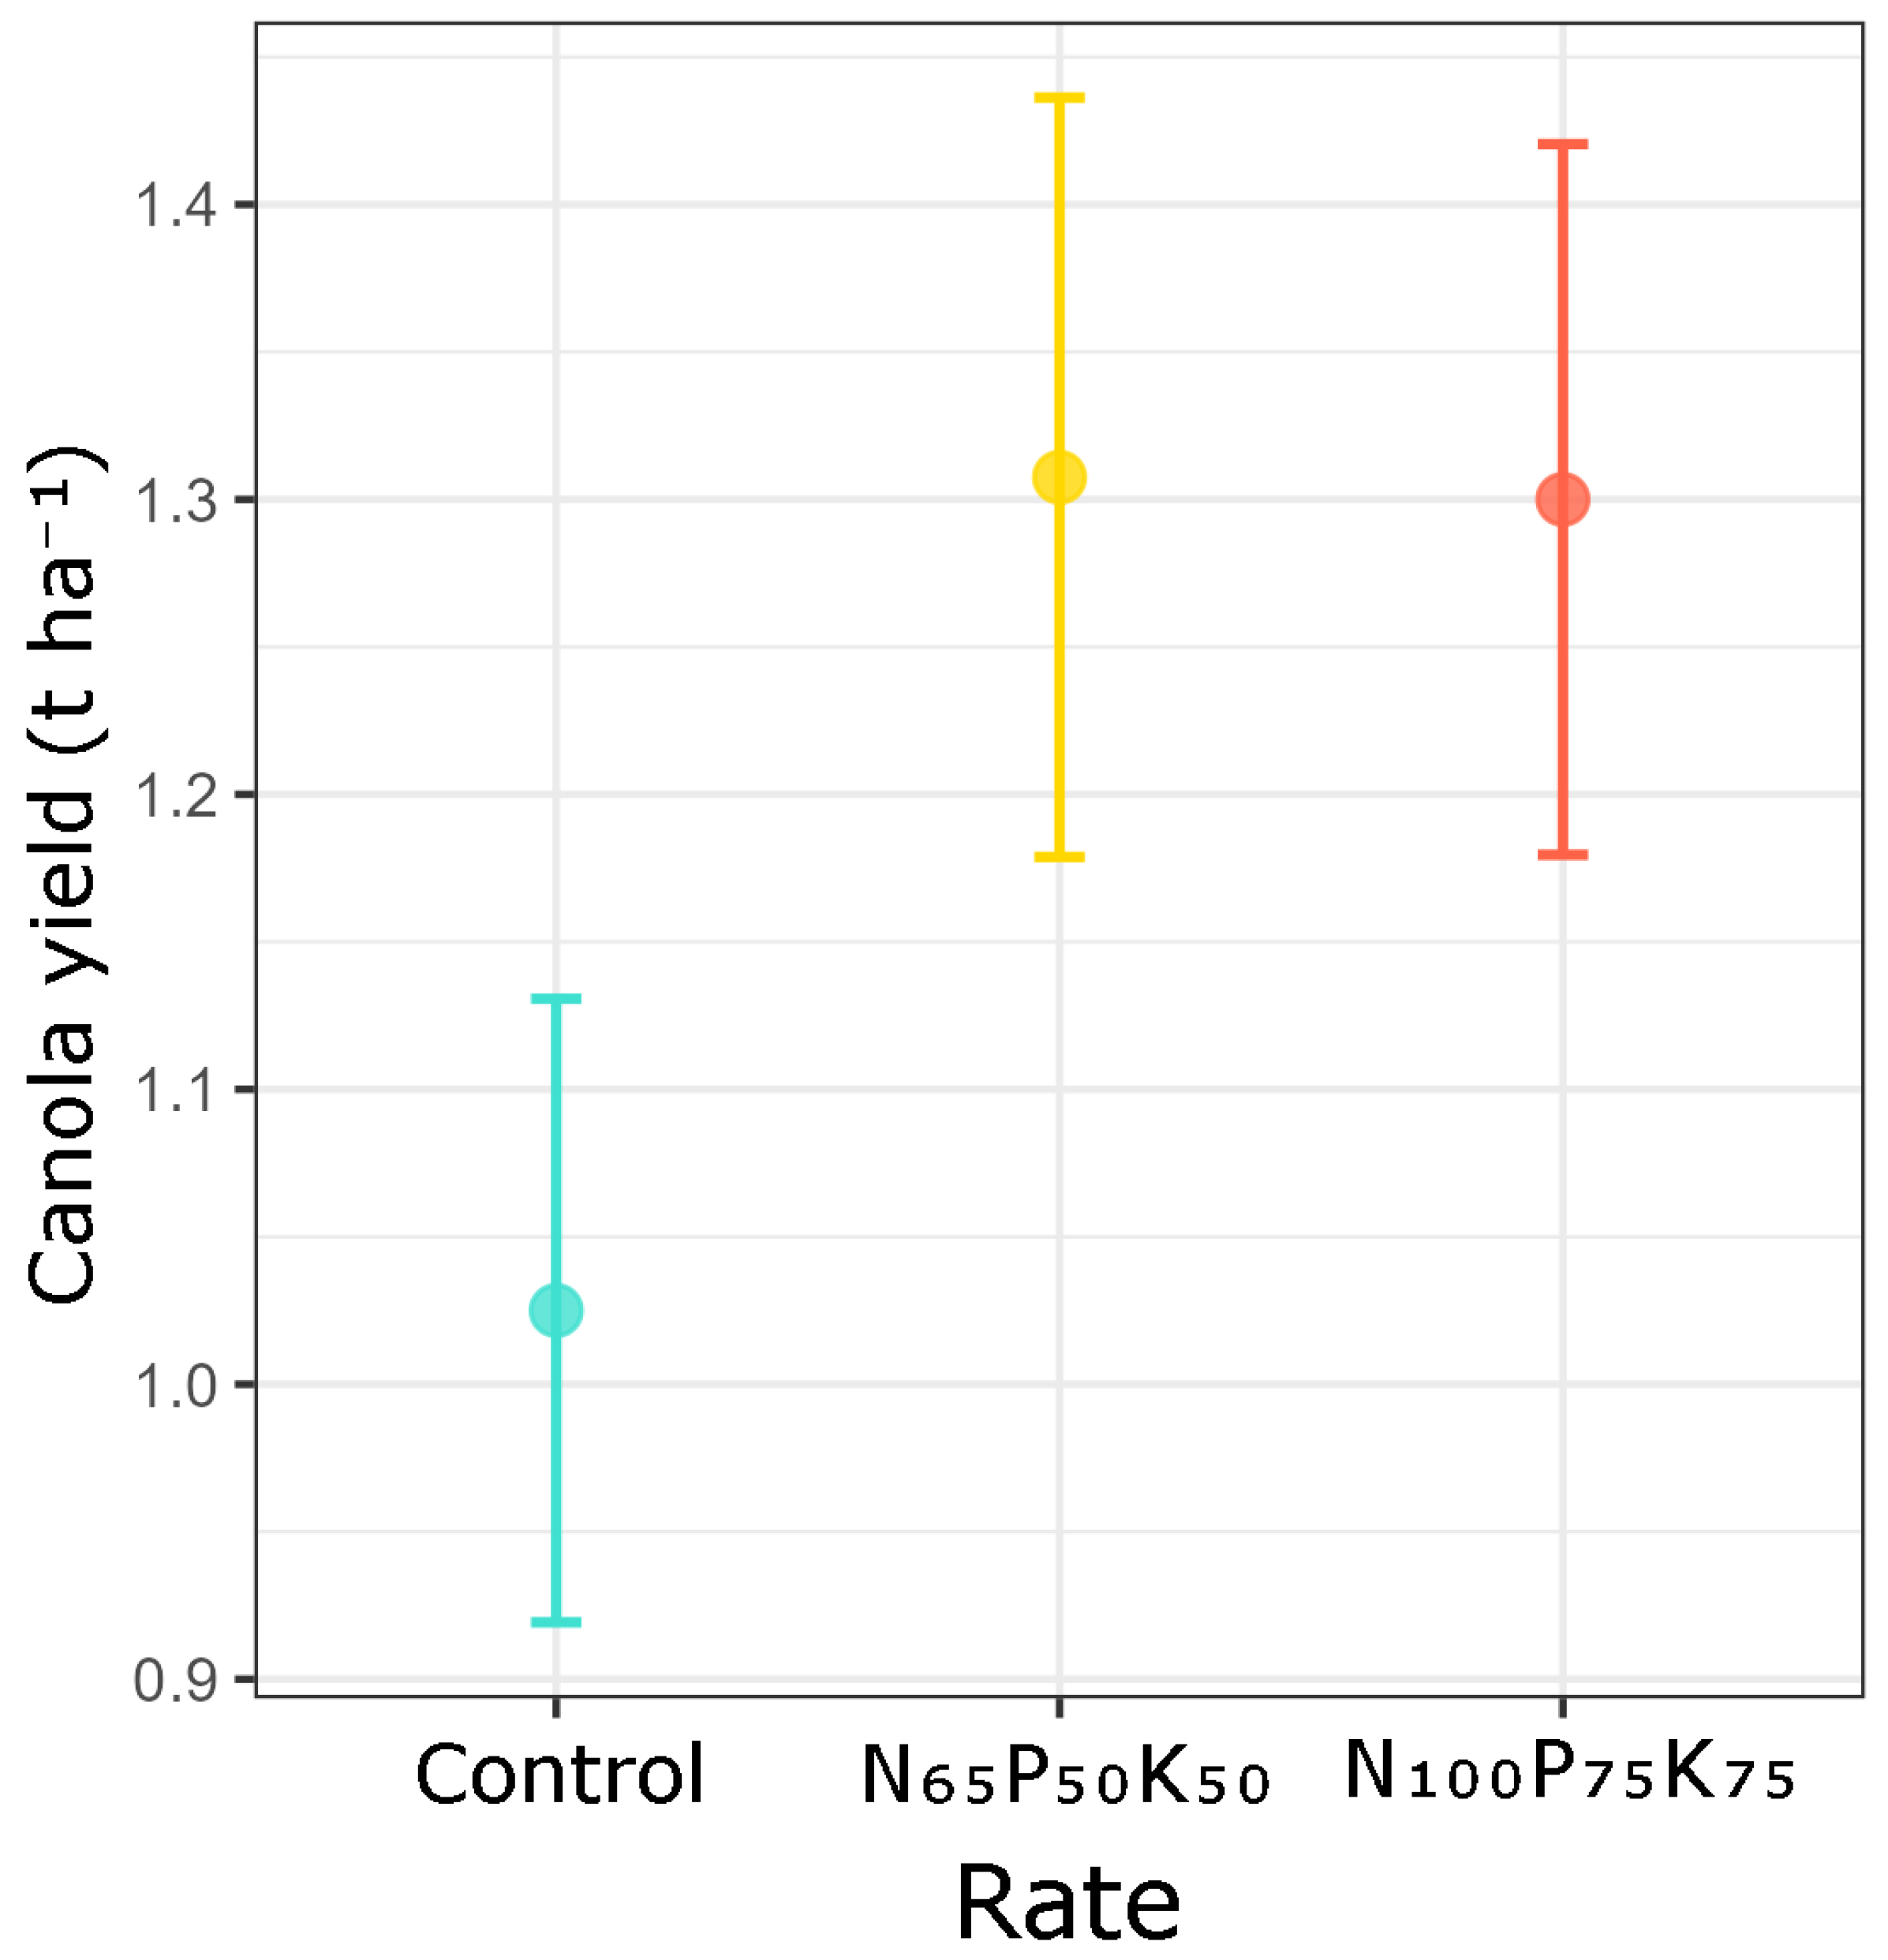
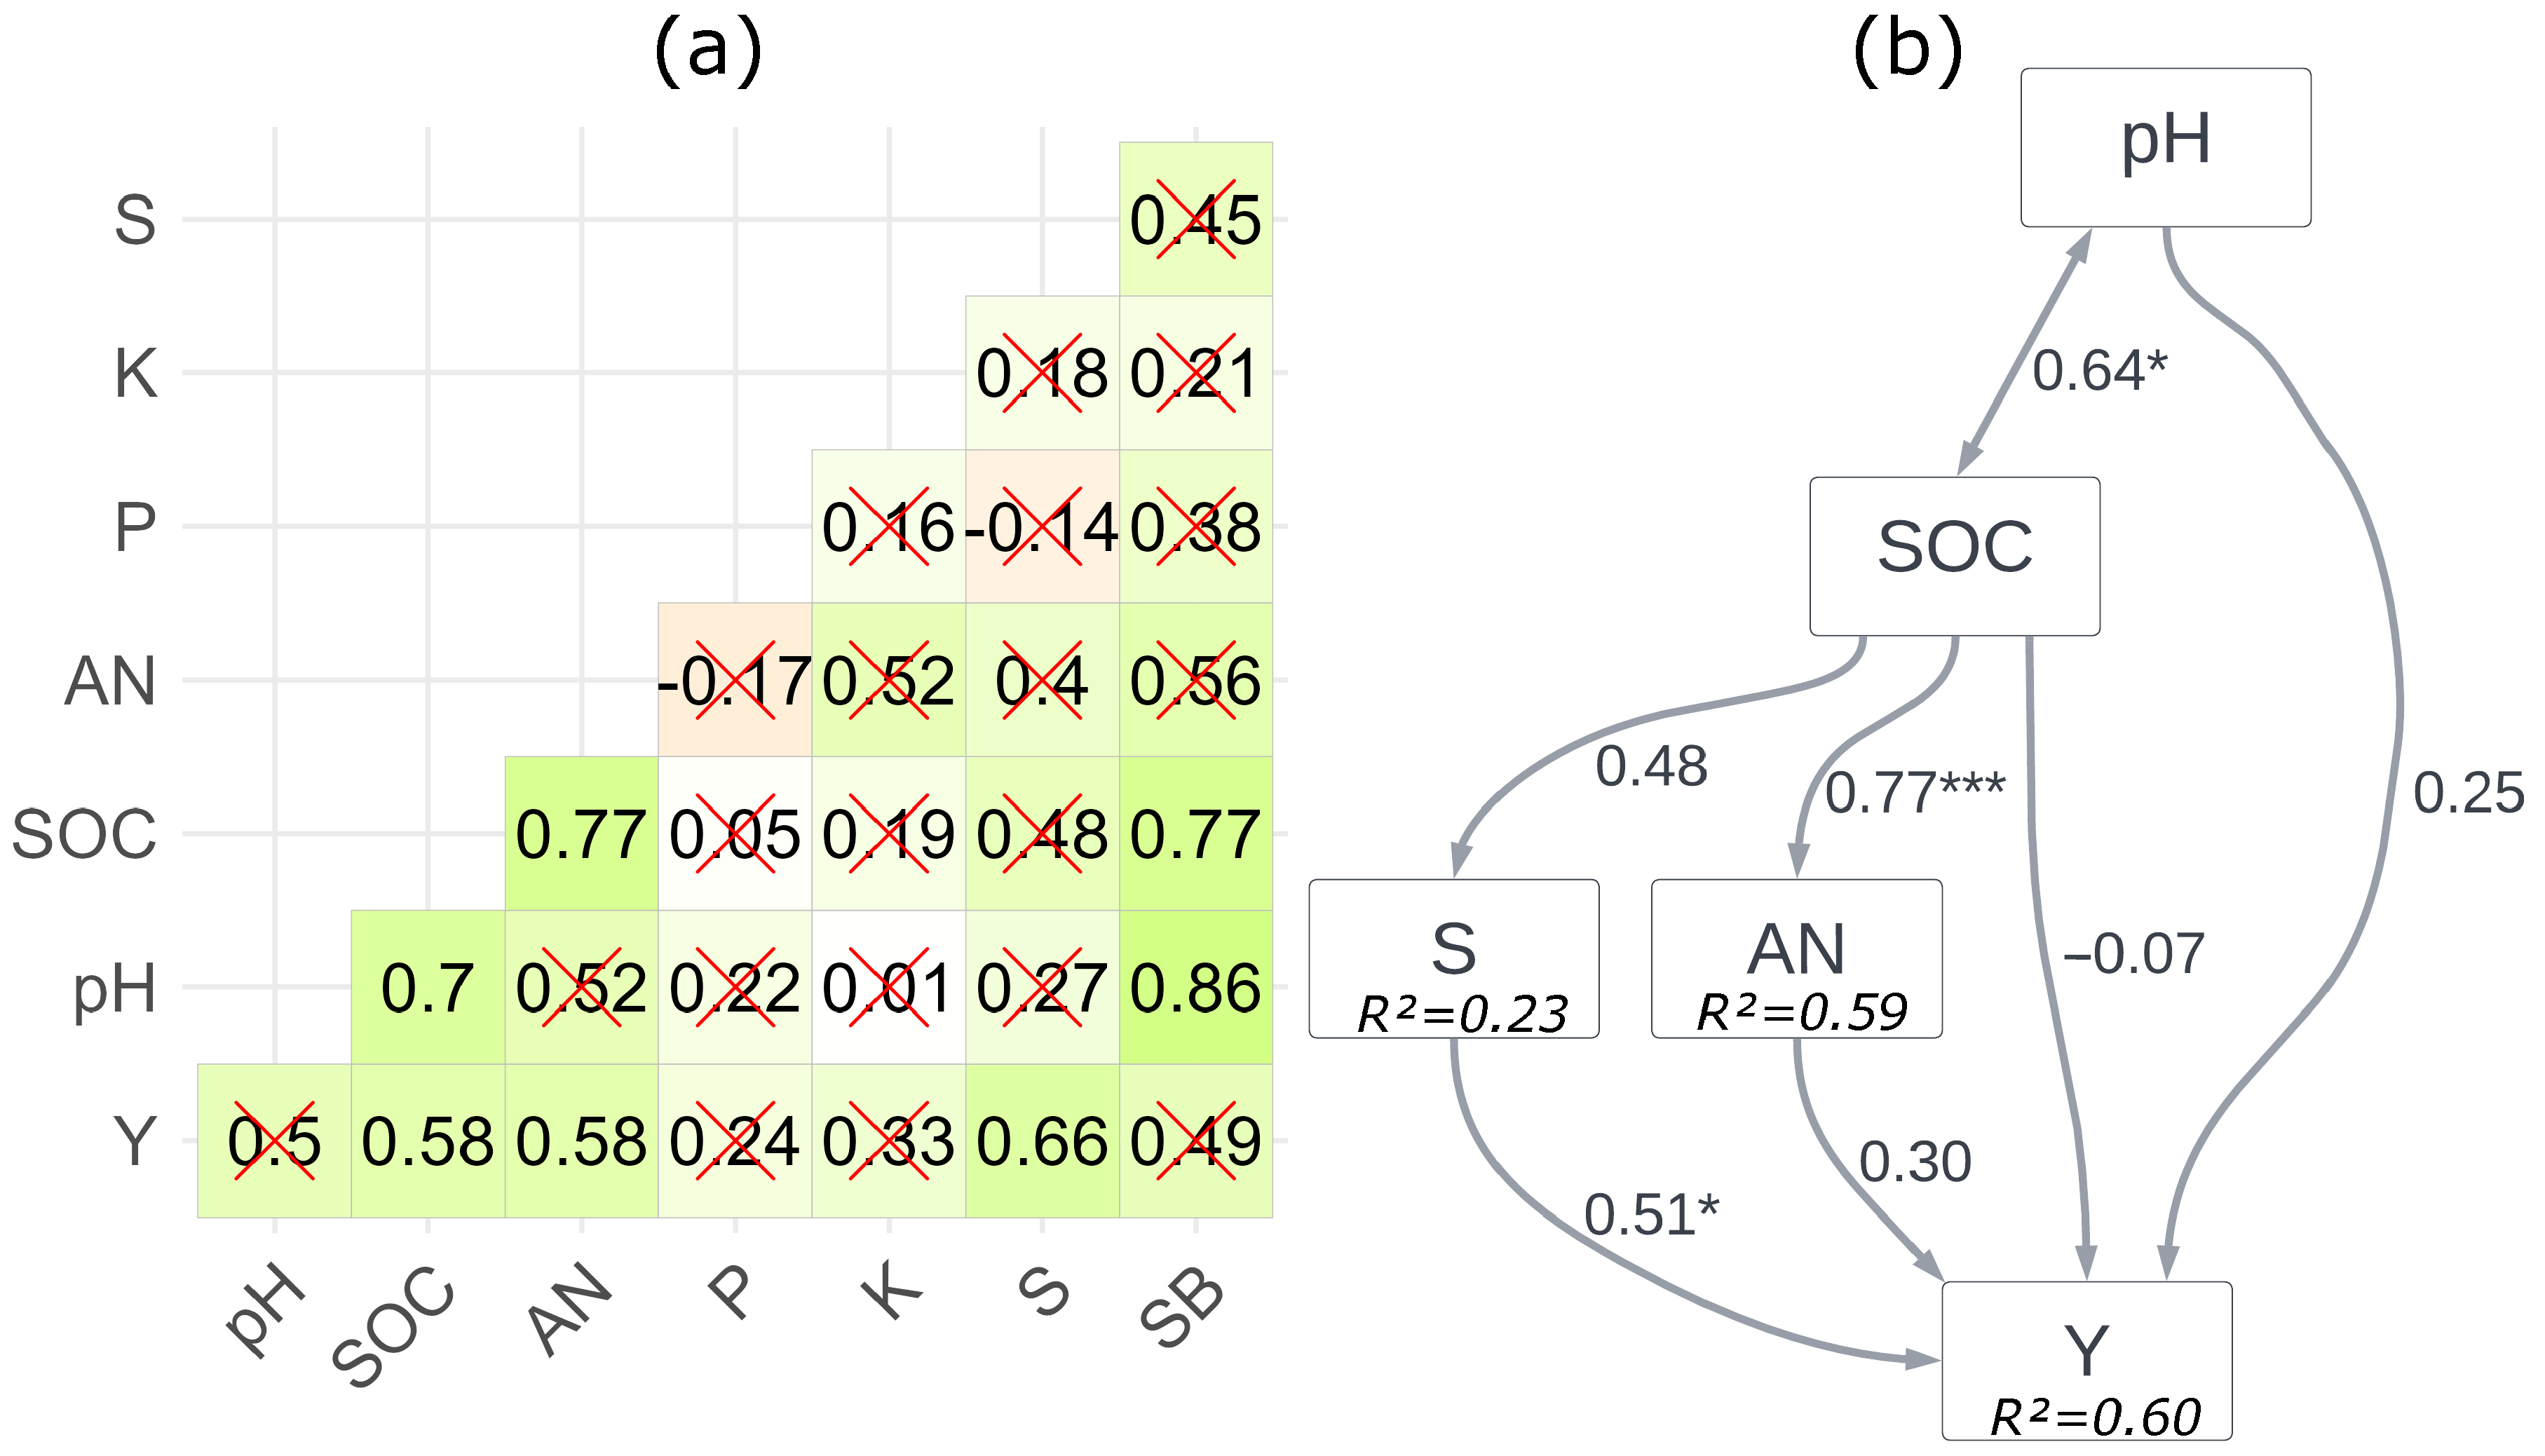
3.3. Effect of NPK Treatment and Soil Fertility on Canola Yield

Fertilization with medium and high NPK rates increased canola yield by an average of 30% compared to the unfertilized sites (Figure 4). However, given the change over the observed period, this effect was not stable (Figure 2a) and therefore not significant (p = 0.21 for one-way ANOVA).
Correlation analysis has shown that canola yield for the four cultivation seasons was related to initial soil fertility conditions at the studied sites (Figure 5a). The most significant relationship of crop productivity was found with S content (r = 0.66). There was also a positive trend between this parameter and the SOC and AN contents (r = 0.58). The combined effect of these soil factors on the canola yield, taking into account the possible causal relationships between them, was examined using path analysis. As the main source of plant-available S and N is soil organic matter, these nutrients were included in the model as SOC-dependent variables (endogenous). Additionally, the pH was included in the model as it can affect the availability of nutrients to plants. In general, the path model explained 60% of canola yield variation for the observed period (Figure 5b). It was found that only the S content of the Albic Retisol sites was decisive for the canola yield variability.

4. Discussion

According to our results, the most important factor in the canola yield variability was the available S content in the studied soil. This nutrient plays an important role in plant physiology as a component of amino acids (cysteine and methionine), oligopeptides, vitamins and secondary metabolites (e.g., glucosinolates) [54,55]. Increased S uptake by canola is associated with the synthesis of cysteine- and methionine-rich proteins, as well as glucosinolates being natural attractants for some pest insects [56,57,58]. Low S levels in the soils inhibit the development of canola reproductive organs and consequently lead to reduced yield and oil content [59]. Moreover, the effective uptake of other nutrients by canola is also related to the soil S content [18,31]. Field studies have shown the crop does not respond to N fertilization if the soils are deficient in S [31,60]. Possibly, this was one of the main reasons for the lack of sustained yield increase with NPK fertilization on the studied sites (Figure 2a). In addition, high rates of N fertilizers can cause rapid depletion of soil S reserves, nutrient imbalances and subsequent yield losses [59,60]. Such relation between S and N in plant nutrition is associated with the inclusion of both elements in the synthesis of chlorophyll and proteins [61]. Therefore, S requirement of the crop even increases with N fertilizer application [62]. Thus, a balanced supply of both nutrients is essential to optimize canola production [57].
The studied light-textured soil was characterized by extreme depletion of the available S (Table 3). This can be the result of both long-term cultivation of various crops without sulfur/organic fertilizer application and S leaching out from the soil. Generally, soil S deficiency is an increasing problem in many agricultural regions of the world, particularly in canola production areas [63,64,65,66,67]. This is mainly due to not paying enough attention to the adjustment of this element in agricultural soils with fertilizers [61,68]. Interestingly, soil S deficiency in European farmland is also associated with a reduction in anthropogenic supply via atmospheric S deposition [69]. Nevertheless, this problem can be corrected by the use of S-containing fertilizers, the effectiveness of which for canola has been reviewed by Grant et al. [57]. Developing an effective fertilizer system should be based on the concept of the four “rights” (“the 4Rs”), i.e., optimizing the applied nutrient form (source), rate, timing and placement [70]. Optimal canola productivity requires available S in the form of sulfate (S-SO 4 2 ) [71]. Consequently, S-SO 4 2 fertilizers have a rapid positive effect on the crop growth and development [72] by alleviating the symptoms of soil S deficiency [73]. A long-term positive effect is characterized by fertilizers containing the elemental S-form (S 0 ), which is gradually oxidized by microorganisms to crop-available S-SO 4 2 [74]. Such S 0 fertilizers can be useful to minimize S-SO 4 2 losses by leaching in high soil moisture conditions [18]. Additional application of organic fertilizers can also contribute to the sustainable storage of available S in the soil through both the temporary immobilization of S-SO 4 2 by organic matter (OM) and the release of organically bound S via OM microbial decomposition [75]. Choosing the “right” fertilizer rates is primarily based on the crop-specific removal balance and soil nutrient content [70]. Canola requires 1.5 kg of S to produce 100 kg of seeds [76]. For S-deficient soils, the recommended fertilizer rate for optimal canola yield is about 15–30 kg of S per hectare [18]. The “right” time to apply S-containing fertilizers is considered to be the sowing period, which ensures maximum canola yield [77]. A more appropriate approach for applying S-SO 4 2 fertilizers is side-banding, and for S 0 fertilizer is broadcast-incorporation [18,78]. Notably, “right” and long-term S fertilization in S-deficient soils can increase soil carbon sequestration [79], which is important for sustainable use of agricultural land.
FAO-AquaCrop modeling showed no significant water and heat stress that could affect canola productivity over the observed four growing seasons (Figure 3), despite a significant variation in weather conditions, with periods of both sufficient and less favorable moisture supply (Figure 2b). Possibly, the spring moisture storage and the seasonal distribution of precipitation were sufficient to provide near-optimal climatic conditions for canola growth and development. However, to thoroughly understand the effect of local climate on canola productivity, further research is needed over a longer period. Periodically occurring abnormal heat and droughts in northwestern Russia [9,10] can be extremely detrimental to canola growth and development [80,81]. Accounting for the effects of such extreme weather events is also important for the development of locally adapted crop simulation models. These models, coupled with weather forecasting, can be used in canola management decision making systems to prevent climate-related plant deaths. In this way, a long-term study of climate effects, together with the developing effective fertilizer systems, can be promoted for sustainable canola production in the northwest of Russia.

5. Conclusions

In this study, the effects of different NPK fertilization levels, climatic conditions and initial soil fertility on four-year canola yields in northwestern Russia were explored. Overall, the tested medium and high rates of the NPK fertilizers had no sustained positive effect on canola yield. Among the considered environmental factors, soil available sulfur content had a more significant effect on the canola productivity. Consequently, sulfur deficiency in the studied soils could be the main reason for the ineffectiveness of the applied NPK fertilizers. Further research should be focused on testing the effect of sulfur fertilizers on canola productivity in northwestern Russia to justify optimal application forms and rates to improve nutrient use efficiency and crop yield.

Supplementary Materials

The following supporting information can be downloaded at: www.mdpi.com/article/10.3390/agriculture13071409/s1, Table S1. Content of sand fraction (0.05–2.0 mm) in different soil horizons of Albic Retisol in the studied area.; Table S2. Descriptive statistics of soil properties (0–20 cm; n = 12) at the studied sites.; Table S3. Descriptive statistics of canola yield (t·ha 1 ) under different NPK treatments at the studied sites for 2012–2015; Figure S1. Climate data for the 2012–2015 canola growing seasons (May–August) used for the FAO-AquaCrop simulation; Tx—daily maximum air temperature (°C), Tn—daily minimum air temperature (°C), ET 0 —reference evapotranspiration (mm·d 1 ), Rain—amount of precipitation (mm·d 1 ).

Author Contributions

Conceptualization, A.D. and L.K.; methodology, A.D and L.K.; software, A.D.; validation, A.D. and L.K.; formal analysis, M.F. and V.D.; investigation, M.F.; resources, M.F. and V.D.; data curation, M.F. and V.D.; writing—original draft preparation, A.D. and S.S.; writing—review and editing, A.D., L.K. and S.S. ; visualization, A.D.; supervision, M.F.; project administration, A.D.; funding acquisition, A.D. and S.S. All authors have read and agreed to the published version of the manuscript.

Funding

Soil agrochemical and textural analysis were carried out within the state assignment of the Ministry of Science and Higher Education of the Russian Federation, theme No. FGEG-2022-0007. FAO-AquaCrop calibration, calculations of climatic and soil parameters were carried out within the state assignment of the Ministry of Science and Higher Education of the Russian Federation, theme No. 0439-2022-0019. Data processing and modeling were supported by the RUDN University Scientific Project Grant System, project No. 202195-2-174.

Institutional Review Board Statement

Not applicable.

Informed Consent Statement

Not applicable.

Data Availability Statement

The data presented in this study are available on request from the corresponding author.

Acknowledgments

The authors wish to acknowledge the support from the Men’kovo Branch of Agrophysical Research Institute staff and Chemical Laboratory of Agrophysical Research Institute.

Conflicts of Interest

The authors declare no conflict of interest.

References

  1. McVetty, P.B.; Duncan, R.W. Canola, rapeseed, and mustard: For biofuels and bioproducts. In Industrial Crops Breeding for BioEnergy and Bioproducts; Cruz, V.M.V., Dierig, D.A., Eds.; Springer: New York, NY, USA, 2015; pp. 133–156. [Google Scholar]
  2. USDA. World Agricultural Production Circulars. 2023. Available online: https://apps.fas.usda.gov/psdonline/circulars/production.pdf (accessed on 1 July 2023).
  3. Kirkegaard, J.A.; Lilley, J.M.; Brill, R.D.; Ware, A.H.; Walela, C.K. The critical period for yield and quality determination in canola (Brassica napus L.). Field Crop. Res. 2018, 222, 180–188. [Google Scholar] [CrossRef]
  4. Raza, A.; Su, W.; Hussain, M.A.; Mehmood, S.S.; Zhang, X.; Cheng, Y.; Zou, X.; Lv, Y. Integrated analysis of metabolome and transcriptome reveals insights for cold tolerance in rapeseed (Brassica napus L.). Front. Plant Sci. 2021, 12, 1796. [Google Scholar] [CrossRef]
  5. Secchi, M.A.; Fernandez, J.A.; Stamm, M.J.; Durrett, T.; Prasad, P.V.; Messina, C.D.; Ciampitti, I.A. Effects of heat and drought on canola (Brassica napus L.) yield, oil, and protein: A meta-analysis. Field Crop. Res. 2023, 293, 108848. [Google Scholar] [CrossRef]
  6. Ray, D.K.; West, P.C.; Clark, M.; Gerber, J.S.; Prishchepov, A.V.; Chatterjee, S. Climate change has likely already affected global food production. PLoS ONE 2019, 14, e0217148. [Google Scholar] [CrossRef] [PubMed]
  7. Sharmina, M.; Anderson, K.; Bows-Larkin, A. Climate change regional review: Russia. Wiley Interdiscip. Rev. Clim. Chang. 2013, 4, 373–396. [Google Scholar] [CrossRef] [Green Version]
  8. Naumann, G.; Alfieri, L.; Wyser, K.; Mentaschi, L.; Betts, R.A.; Carrao, H.; Spinoni, J.; Vogt, J.; Feyen, L. Global changes in drought conditions under different levels of warming. Geophys. Res. Lett. 2018, 45, 3285–3296. [Google Scholar] [CrossRef]
  9. Cherenkova, E.; Kononova, N.; Muratova, N. Summer drought 2010 in the European Russia. Geogr. Environ. Sustain. 2013, 6, 55–66. [Google Scholar] [CrossRef] [Green Version]
  10. Trenberth, K.E.; Fasullo, J.T. Climate extremes and climate change: The Russian heat wave and other climate extremes of 2010. J. Geophys. Res. Atmos. 2012, 117, D17103. [Google Scholar] [CrossRef]
  11. IUSS Working Group WRB. World Reference Base for Soil Resources 2014. International Soil Classification System for Naming Soils and Creating Legends for Soil Maps; update 2015; FAO: Rome, Italy, 2015; pp. 95–108. [Google Scholar]
  12. Reuter, D.; Robinson, J.B. Plant Analysis: An Interpretation Manual, 2nd ed.; CSIRO Publishing: Collingwood, Australia, 1997; pp. 102–270. [Google Scholar]
  13. Haneklaus, S.; Bloem, E.; Schnug, E.; De Kok, L.J.; Stulen, I. Sulfur. In Handbook of Plant Nutrition; Barker, A.V., Pilbeam, D.J., Eds.; CRC Press: Boca Raton, FL, USA, 2007; pp. 183–238. [Google Scholar]
  14. Abdallah, M.; Dubousset, L.; Meuriot, F.; Etienne, P.; Avice, J.C.; Ourry, A. Effect of mineral sulphur availability on nitrogen and sulphur uptake and remobilization during the vegetative growth of Brassica napus L. J. Exp. Bot. 2010, 61, 2635–2646. [Google Scholar] [CrossRef]
  15. Liyanage, D.W.; Bandara, M.S.; Konschuh, M.N. Main factors affecting nutrient and water use efficiencies in spring canola in North America: A review of literature and analysis. Can. J. Plant Sci. 2022, 102, 799–811. [Google Scholar] [CrossRef]
  16. Gan, Y.; Malhi, S.S.; Brandt, S.; Katepa-Mupondwa, F.; Stevenson, C. Nitrogen use efficiency and nitrogen uptake of juncea canola under diverse environments. Agron. J. 2008, 100, 285–295. [Google Scholar] [CrossRef]
  17. Hocking, P.J.; Randall, P.J.; DeMarco, D. The response of dryland canola to nitrogen fertilizer: Partitioning and mobilization of dry matter and nitrogen, and nitrogen effects on yield components. Field Crop. Res. 1997, 54, 201–220. [Google Scholar] [CrossRef]
  18. Malhi, S.S.; Schoenau, J.J.; Grant, C.A. A review of sulphur fertilizer management for optimum yield and quality of canola in the Canadian Great Plains. Can. J. Plant Sci. 2005, 85, 297–307. [Google Scholar] [CrossRef]
  19. Al-Solaimani, S.G.; Alghabari, F.; Ihsan, M.Z. Effect of different rates of nitrogen fertilizer on growth, seed yield, yield components and quality of canola (Brassica napus L.) under arid environment of Saudi Arabia. Int. J. Agron. Agric. Res. 2015, 6, 268–274. [Google Scholar]
  20. Grant, C.A.; Flaten, D.N.; Tomasiewicz, D.J.; Sheppard, S.C. The importance of early season phosphorus nutrition. Can. J. Plant Sci. 2001, 81, 211–224. [Google Scholar] [CrossRef]
  21. Grant, C.A.; Monreal, M.A.; Irvine, R.B.; Mohr, R.M.; McLaren, D.L.; Khakbazan, M. Crop response to current and previous season applications of phosphorus as affected by crop sequence and tillage. Can. J. Plant Sci. 2009, 89, 49–66. [Google Scholar] [CrossRef] [Green Version]
  22. Bélanger, G.; Ziadi, N.; Pageau, D.; Grant, C.; Lafond, J.; Nyiraneza, J. Shoot growth, phosphorus–nitrogen relationships, and yield of canola in response to mineral phosphorus fertilization. Agron. J. 2015, 107, 1458–1464. [Google Scholar] [CrossRef]
  23. Vicianová, M.; Ducsay, L.; Ryant, P.; Provazník, M.; Zapletalová, A.; Slepčan, M. Oilseed rape (Brassica Napus L.) nutrition by nitrogen and phosphorus and its effect on yield of seed, oil and higher fatty acids content. Acta Univ. Agric. Silvic. Mendel. Brun. 2020, 68, 129–136. [Google Scholar] [CrossRef] [Green Version]
  24. Marschner, H. Mineral Nutrition of Higher Plants, 1st ed.; Academic Press: San Diego, CA, USA, 1995; pp. 135–190. [Google Scholar]
  25. Reddy, A.R.; Chaitanya, K.V.; Vivekanandan, M. Drought-induced responses of photosynthesis and antioxidant metabolism in higher plants. J. Plant Physiol. 2004, 161, 1189–1202. [Google Scholar] [CrossRef]
  26. Pan, X.Y.; Li, J.Y.; Deng, K.Y.; Xu, R.K.; Shen, R.F. Four-year effects of soil acidity amelioration on the yields of canola seeds and sweet potato and N fertilizer efficiency in an ultisol. Field Crop. Res. 2019, 237, 1–11. [Google Scholar] [CrossRef]
  27. Lofton, J.; Godsey, C.B.; Zhang, H. Determining aluminum tolerance and critical soil pH for winter canola production for acidic soils in temperate regions. Agron. J. 2010, 102, 327–332. [Google Scholar] [CrossRef]
  28. Baquy, M.; Li, J.Y.; Xu, C.Y.; Mehmood, K.; Xu, R.K. Determination of critical pH and Al concentration of acidic Ultisols for wheat and canola crops. Solid Earth 2017, 8, 149–159. [Google Scholar] [CrossRef] [Green Version]
  29. Sharma, A.; Chetani, R. A review on the effect of organic and chemical fertilizers on plants. Int. J. Res. Appl. Sci. Eng. Technol. 2017, 5, 677–680. [Google Scholar] [CrossRef]
  30. Wang, Y.; Zhu, Y.; Zhang, S.; Wang, Y. What could promote farmers to replace chemical fertilizers with organic fertilizers? J. Clean. Prod. 2018, 199, 882–890. [Google Scholar] [CrossRef]
  31. Jones, C.; Olson-Rutz, K. Montana State University Extension. Soil Nutrient Management for Canola. 2016. EB0224. Available online: https://agresearch.montana.edu/wtarc/producerinfo/agronomy-nutrient-management/Canola/MSUExtensionBulletin.pdf (accessed on 1 July 2023).
  32. Gaines, T.P.; Gaines, S.T. Soil texture effect on nitrate leaching in soil percolates. Commun. Soil Sci. Plant Anal. 1994, 25, 2561–2570. [Google Scholar] [CrossRef]
  33. Sitthaphanit, S.; Limpinuntana, V.; Toomsan, B.; Panchaban, S.; Bell, R.W. Fertiliser strategies for improved nutrient use efficiency on sandy soils in high rainfall regimes. Nutr. Cycl. Agroecosyst. 2009, 85, 123–139. [Google Scholar] [CrossRef]
  34. Kidin, V.V.; Shibalkin, A.E.; Kagirova, M.V. Imbalance of nutritional substances of the soil at the modern stage of development of agricultural production in Russia. Eurasian J. Soil Sci. 2019, 8, 167–175. [Google Scholar] [CrossRef]
  35. Monastyrsky, O.A.; Glinushkin, A.P.; Sokolov, M.S. Problems of ensuring food security of Russia and ways to solve it. Agrochemistry 2016, 11, 3–11. [Google Scholar]
  36. FAO. Measuring and Modelling Soil Carbon Stocks and Stock Changes in Livestock Production Systems: Guidelines for Assessment (Version 1), 1st ed.; Livestock Environmental Assessment and Performance (LEAP) Partnership: Rome, Italy, 2018; pp. 9–37. [Google Scholar]
  37. Sahrawat, K.L. Correlations between indexes of soil nitrogen availability and nitrogen percent in plant, nitrogen uptake, and dry-matter yield of rice grown in the greenhouse. Plant Soil 1983, 74, 223–228. [Google Scholar] [CrossRef]
  38. Steduto, P.; Hsiao, T.C.; Raes, D.; Fereres, E. AquaCrop—The FAO crop model to simulate yield response to water: I. Concepts and underlying principles. Agron. J. 2009, 101, 426–437. [Google Scholar] [CrossRef] [Green Version]
  39. Raes, D.; Steduto, P.; Hsiao, T.C.; Fereres, E. AquaCrop—The FAO crop model to simulate yield response to water: II. Main algorithms and software description. Agron. J. 2009, 101, 438–447. [Google Scholar] [CrossRef] [Green Version]
  40. Hsiao, T.C.; Heng, L.; Steduto, P.; Rojas-Lara, B.; Raes, D.; Fereres, E. AquaCrop—the FAO crop model to simulate yield response to water: III. Parameterization and testing for maize. Agron. J. 2009, 101, 448–459. [Google Scholar] [CrossRef]
  41. Vanuytrecht, E.; Raes, D.; Steduto, P.; Hsiao, T.C.; Fereres, E.; Heng, L.K.; Vila, M.G.; Moreno, P.M. AquaCrop: FAO’s crop water productivity and yield response model. Environ. Model. Softw. 2014, 62, 351–360. [Google Scholar] [CrossRef]
  42. Zeleke, K.T.; Luckett, D.; Cowley, R. Calibration and testing of the FAO AquaCrop model for canola. Agron. J. 2011, 103, 1610–1618. [Google Scholar] [CrossRef]
  43. Mousavizadeh, S.F.; Honar, T.; Ahmadi, S.H. Assessment of the AquaCrop Model for simulating Canola under different irrigation managements in a semiarid area. Int. J. Plant Prod. 2016, 10, 425–445. [Google Scholar]
  44. Ebrahimipak, N.A.; Egdernezhad, A.; Davoud, A.T.; Dehkordi, K. Evaluation of AquaCrop Model to Simulate Canola (Brassica napus) Yield under Deficit Irrigation Scenarios in Gazvin Plain. Iran. J. Soil Water Res. 2018, 49, 1003–1015. [Google Scholar]
  45. Egdernezhad, A.; Ebrahimipak, N.A.; Tafteh, A.; Ahmadee, M. Canola irrigation scheduling using AquaCrop model in Qazvin Plain. Water Manag. Agric. 2019, 5, 53–64. [Google Scholar]
  46. Dirwai, T.L.; Senzanje, A.; Mabhaudhi, T. Calibration and evaluation of the FAO AquaCrop model for Canola (Brassica napus) under varied moistube irrigation regimes. Agriculture 2021, 11, 410. [Google Scholar] [CrossRef]
  47. Saxton, K.E.; Rawls, W.J. Soil water characteristic estimates by texture and organic matter for hydrologic solutions. Soil Sci. Soc. Am. J. 2006, 70, 1569–1578. [Google Scholar] [CrossRef] [Green Version]
  48. Muñoz-Sabater, J.; Dutra, E.; Agustí-Panareda, A.; Albergel, C.; Arduini, G.; Balsamo, G.; Boussetta, S.; Choulga, M.; Harrigan, S.; Hersbach, H.; et al. ERA5-Land: A state-of-the-art global reanalysis dataset for land applications. Earth Syst. Sci. Data 2021, 13, 4349–4383. [Google Scholar] [CrossRef]
  49. IUSS Working Group WRB. World Reference Base for Soil Resources 2006. World Soil Resources Report No. 103, 2nd ed.; FAO: Rome, Italy, 2006. [Google Scholar]
  50. Allen, R.G.; Walter, I.A.; Elliott, R.; Howell, T.A.; Itenfisu, D.; Jensen, M.E. The ASCE’s Standardized Reference Evapotranspiration Equation; American Society of Civil Engineers: Reston, VA, USA, 2005; pp. 1–214. [Google Scholar]
  51. Badescu, V. A new kind of cloudy sky model to compute instantaneous values of diffuse and global solar irradiance. Theor. Appl. Climatol. 2002, 72, 127–136. [Google Scholar] [CrossRef]
  52. Allen, R.G.; Pereira, L.S.; Raes, D.; Smith, M. FAO Irrigation and Drainage Paper No. 56; Food and Agriculture Organization of the United Nations: Rome, Italy, 1998; pp. 41–54. [Google Scholar]
  53. RStudio Team. RStudio: Integrated Development for R. RStudio, PBC, Boston, MA. Available online: http://www.rstudio.com/ (accessed on 1 July 2023).
  54. Saito, K. Sulfur assimilatory metabolism. The long and smelling road. Plant Physiol. 2004, 136, 2443–2450. [Google Scholar] [CrossRef] [Green Version]
  55. Droux, M. Sulfur assimilation and the role of sulfur in plant metabolism: A survey. Photosynth. Res. 2004, 79, 331–348. [Google Scholar] [CrossRef]
  56. Clandinin, D.R. Canola Meal for Livestock and Poultry; Canola Council of Canada: Winnipeg, MB, Canada, 1989. [Google Scholar]
  57. Grant, C.A.; Mahli, S.S.; Karamanos, R.E. Sulfur management for rapeseed. Field Crop. Res. 2012, 128, 119–128. [Google Scholar] [CrossRef]
  58. Liu, Y.; Rossi, M.; Liang, X.; Zhang, H.; Zou, L.; Ong, C.N. An integrated metabolomics study of glucosinolate metabolism in different Brassicaceae genera. Metabolites 2020, 10, 313. [Google Scholar] [CrossRef]
  59. Süzer, S. Effects of plant nutrition on canola (Brassica napus L.) growth. Trak. Univ. J. Nat. Sci. 2015, 16, 87–90. [Google Scholar]
  60. Malhi, S.S.; Gill, K.S. Interactive effects of N and S fertilizers on canola yield and seed quality on S-deficient Gray Luvisol soils in northeastern Saskatchewan. Can. J. Plant Sci. 2007, 87, 211–222. [Google Scholar] [CrossRef] [Green Version]
  61. Lisowska, A.; Filipek-Mazur, B.; Kalisz, A.; Gorczyca, O.; Kowalczyk, A. Changes in Soil Sulfate Sulfur Content as an Effect of Fertilizer Granules Containing Elemental Sulfur, Halloysite and Phosphate Rock. Agronomy 2023, 13, 1410. [Google Scholar] [CrossRef]
  62. Janzen, H.H.; Bettany, J.R. Sulfur nutrition of rapeseed: I. Influence of fertilizer nitrogen and sulfur rates. Soil Sci. Soc. Am. J. 1984, 48, 100–107. [Google Scholar] [CrossRef]
  63. Eriksen, J.; Thorup-Kristensen, K.; Askegaard, M. Plant availability of catch crop sulfur following spring incorporation. J. Plant Nutr. Soil Sci. 2004, 167, 609–615. [Google Scholar] [CrossRef]
  64. Girma, K.; Mosali, J.; Freeman, K.W.; Raun, W.R.; Martin, K.L.; Thomason, W.E. Forage and grain yield response to applied sulfur in winter wheat as influenced by source and rate. J. Plant Nutr. 2005, 28, 1541–1553. [Google Scholar] [CrossRef]
  65. Schonhof, I.; Blankenburg, D.; Müller, S.; Krumbein, A. Sulfur and nitrogen supply influence growth, product appearance, and glucosinolate concentration of broccoli. J. Plant Nutr. Soil Sci. 2007, 170, 65–72. [Google Scholar] [CrossRef]
  66. Mascagni Jr, H.J.; Harrison, S.A.; Padgett, G.B. Influence of sulfur fertility on wheat yield performance on alluvial and upland soils. Commun. Soil Sci. Plant Anal. 2008, 39, 2133–2145. [Google Scholar] [CrossRef]
  67. Camberato, J.; Casteel, S. Sulfur Deficiency. Purdue Univ. Dep. of Agronomy, Soil Fertility Update. 2017. Available online: https://www.agry.purdue.edu/ext/corn/news/timeless/sulfurdeficiency.pdf (accessed on 1 July 2023).
  68. Scherer, H.W. Sulphur in crop production. Eur. J. Agron. 2001, 14, 81–111. [Google Scholar] [CrossRef]
  69. Haneklaus, S.; Bloem, E.; Schnug, E. History of sulfur deficiency in crops. In Sulfur: A Missing Link between Soils, Crops, and Nutrition, 50; Jez, J., Ed.; American Society of Agronomy: Madison, WI, USA, 2008; pp. 45–58. [Google Scholar]
  70. IFA Task Force. The Global “4R” Nutrient Stewardship Framework. Developing Fertilizer Best Management Practices for Delivering Economic, Social and Environmental Benefits; International Fertilizer Industry Association: Paris, France, 2009. [Google Scholar]
  71. Nyborg, M. Sulfur deficiency in cereal grains. Can. J. Soil Sci. 1968, 48, 37–41. [Google Scholar] [CrossRef] [Green Version]
  72. Grant, C.A.; Johnston, A.M.; Clayton, G.W. Sulphur fertilizer and tillage management of canola and wheat in western Canada. Can. J. Plant Sci. 2004, 84, 453–462. [Google Scholar] [CrossRef]
  73. Janzen, H.H.; Bettany, J.R. Sulfur nutrition of rapeseed II. Effect of time of sulfur application. Soil Sci. Soc. Am. J. 1984, 48, 107–112. [Google Scholar] [CrossRef]
  74. Wen, G.; Schoenau, J.J.; Yamamoto, T.; Inoue, M. A model of oxidation of an elemental sulfur fertilizer in soils. Soil Sci. 2001, 166, 607–613. [Google Scholar] [CrossRef]
  75. Schoenau, J.J.; Malhi, S.S. Sulfur forms and cycling processes in soil and their relationship to sulfur fertility. In Sulfur: A Missing Link between Soils, Crops, and Nutrition, 50; Jez, J., Ed.; American Society of Agronomy: Madison, WI, USA, 2008; pp. 1–10. [Google Scholar]
  76. Nyborg, M.; Bentley, C.F.; Hoyt, P.B. Effect of sulphur deficiency. Sulphur Inst. J. 1974, 10, 14–15. [Google Scholar]
  77. Malhi, S.S.; Gill, K.S. Effectiveness of sulphate-S fertilization at different growth stages for yield, seed quality and S uptake of canola. Can. J. Plant Sci. 2002, 82, 665–674. [Google Scholar] [CrossRef]
  78. Swan, M.; Soper, R.J.; Morden, G. The effect of elemental sulfur, gypsum and ammonium thiosulfate as sulfur sources on yield of rapeseed. Commun. Soil Sci. Plant Anal. 1986, 17, 1383–1390. [Google Scholar] [CrossRef]
  79. Giweta, M.; Dyck, M.F.; Malhi, S.S.; Puurveen, D.; Robertson, J.A. Long-term S-fertilization increases carbon sequestration in a sulfur-deficient soil. Can. J. Soil Sci. 2014, 94, 295–301. [Google Scholar] [CrossRef]
  80. Morrison, M.J.; Stewart, D.W. Heat stress during flowering in summer Brassica. Crop. Sci. 2002, 42, 797–803. [Google Scholar] [CrossRef]
  81. Qian, B.; De Jong, R.; Gameda, S. Multivariate analysis of water-related agroclimatic factors limiting spring wheat yields on the Canadian prairies. Eur. J. Agron. 2009, 30, 140–150. [Google Scholar] [CrossRef]
Figure 1. Scheme of spatial distribution of the canola tested sites in 2012–2015.
Agriculture 13 01409 g001
Figure 2. Temporal dynamics of canola yield with different NPK treatments (a) and climatic characteristics averaged for the canola growing season May–August (b). Notes: air temperature (Tair), precipitation (Rain) and reference evapotranspiration (ET 0 ).
Agriculture 13 01409 g002
Figure 3. AquaCrop model results showing potential aboveground biomass without and with climate stress (Bx and Bs) and potential canola yield without and with climate stress (Yx and Ys) for the growing seasons 2012–2015.
Agriculture 13 01409 g003aAgriculture 13 01409 g003b
Figure 4. Canola yield with different NPK treatments at the studied sites for 2012–2015. Dots with error bars are mean with standard error for n = 4.
Agriculture 13 01409 g004
Figure 5. Pearson correlation matrix (a) and path model (b) between canola yield for 2012–2015 (Y, t·ha 1 ) and initial soil fertility conditions in 2011 (n = 12). In the correlation matrix, the crossed out values are not significant at p ≤ 0.05. In the path model, numbers within double-headed arrows are correlation coefficients between variables, numbers within one-way arrows are standardized path coefficients indicating the size effect of the causal relationship among variables (* p ≤ 0.05; *** 0.001). Model fit indexes: Chi-square = 0.182 (p = 0.98); comparative fit index = 1.0; standardized root mean square residual = 0.022.
Agriculture 13 01409 g005
Table 1. Locally calibrated FAO-AquaCrop model parameters for canola.
ParameterValue
Conservative:
Crop water productivity—normalized for climate and CO 2   W P * (g·m 2 )18.6
Adjustment W P * for yield formation (%)100
Base temperature (°C)0
Upper temperature (°C)30
Canopy growth coefficient C G C (%·day 1 )8.9
Canopy decline coefficient C D C (%·day 1 )5.2
Soil water depletion factor for canopy expansion, upper limit0.2
Soil water depletion factor for canopy expansion, lower limit0.55
Shape factor for water stress coefficient for canopy expansion3.5
Soil water depletion factor for stomatal closure, upper limit0.6
Shape factor for water stress coefficient for stomatal closure5.0
Soil water depletion factor for early canopy senescence, upper limit0.7
Shape factor for water stress coefficient for early canopy senescence3.0
Maximum crop transpiration coefficient K c T r 0.95
Non-conservative:
Plant density (plants m 2 )200
Initial canopy cover C C 0 (%)10
Time to emergence (days)10
Time to flowering (days)54
Time to maximum rooting depth (days)59
Time to maximum canopy cover (days)63
Time to senescence (days)97
Time to maturity (days)116
Length building up H I (days)51
Duration of flowering (days)19
Minimum effective rooting depth (m)0.3
Maximum effective rooting depth (m)1.0
Reference harvest index H I 0 (%)25
Table 2. Hydraulic properties along soil profile at the study field: horizon depth (Depth, m); total available water (TAW, mm·m 1 ); water content at permanent wilting point (PWP, vol%); water content at field capacity (FC, vol%); water content at saturation (SAT, vol%); saturated hydraulic conductivity (Ksat, mm·day 1 ); initial soil moisture content (SMC, vol%).
SH *DepthTAWPWPFCSATKsatInitial SMC
2012201320142015
Ap + A/E0.00–0.47778.516.347.0164331.836.033.336.2
B0.47–0.66412.06.141.0268534.039.036.038.0
C10.66–0.72382.36.141.0257334.039.036.038.0
C20.72–1.44414.68.739.8169537.739.637.838.6
C31.44–1.70310.13.242.8645639.839.839.039.0
* SH, soil horizon according to FAO Guidelines for Soil Description [49]; Ap, surface humus-accumulative plough mineral horizon; A/E, humus-eluvial mineral horizon with slight loss of silicate clay, iron, aluminium; B, underlying illuvial mineral horizon; C1, C2 and C3, different layers of parent material represented by moraine deposit, lacustrine–glacial sands.
Table 3. Soil chemical properties (0–20 cm) of the study sites with different NPK rates prior to the canola cultivation. Values are means with standard errors for n = 4.
TreatmentpH KCl SOC
%
ANPKSSB
cmol·kg 1
mg·kg 1
Control *4.5 ± 0.11.8 ± 0.195 ± 453 ± 1037 ± 10.75 ± 0.101.90 ± 0.54
N 65 P 50 K 50 4.6 ± 0.12.0 ± 0.2109 ± 1663 ± 643 ± 51.04 ± 0.212.85 ± 0.72
N 100 P 75 K 75 4.7 ± 0.12.3 ± 0.1118 ± 658 ± 236 ± 10.94 ± 0.113.10 ± 0.64
* Unfertilized; SOC, total organic carbon; AN, available nitrogen; SB, sum of bases.
Disclaimer/Publisher’s Note: The statements, opinions and data contained in all publications are solely those of the individual author(s) and contributor(s) and not of MDPI and/or the editor(s). MDPI and/or the editor(s) disclaim responsibility for any injury to people or property resulting from any ideas, methods, instructions or products referred to in the content.

