Abstract
The purpose of this study was to address the problem of the poor quality of rotary cutting and soil collection during the process of mechanical ridge building in paddy fields. In order to improve the soil collection rate and decrease the coefficient of variation of soil collection uniformity, the present work mainly combined the advanced rotary-cutting and tillage technology and the rotary-cutting soil collection device, at domestic and international, to study the motion characteristics and distribution situation of soil particles during rotary-cutting and soil collection operations. The test of rotary-cutting soil collection device was simulated by using the EDEM2018 Version: 4.0.0, the accuracy of numerical model was validated by the data of trial test. The results of the single-factor experiment indicated that the working speed level of the rotary blades was 450 r/min to 550 r/min, the operating speed level of the rotary blades was 0.6 km/h to 1.0 km/h, and the tilling depth level of the rotary blades was 180 mm to 200 mm. Moreover, the operating parameter of the rotary-cutting soil collection device were obtained by a multi-factor test, and it was proved that the rotary-cutting soil collection device performed better and the soil collection quality was higher, with a soil collection rate and a coefficient of variation of soil collection uniformity of 87.22% and 6.73%. This study could provide technical support for the research of rotary tillage devices and improve the level of mechanized ridge building in paddy fields.
1. Introduction
Rice is one of China’s major grain crops, and the mechanized production of rice is of great strategic significance for ensuring national food production safety, achieving agricultural efficiency improvement, and increasing farmers’ income. Mechanized ridge construction is the key to ensuring water supply for rice growth and an important means of water storage in paddy fields [1]. Dense and reasonable ridges can prevent soil nutrient loss and ensure water demand during rice growth. The main problem with mechanized embankment construction in paddy fields is poor soil collection performance, which is reflected in the uneven distribution of soil during the soil collection process. A study on the mechanism of rotary cutting and soil collection in paddy fields is of great significance for reducing water resource waste and reducing the risk of rice production [2,3].
The soil involved in agricultural engineering is granular, with characteristics between solid and liquid, and has complex mechanical properties [4,5,6]. These properties are related to the movement state, geometric shape, and size of the grains, and have been researched using both theoretical research and experimental research methods [7,8,9,10,11,12,13]. Studying the interaction between soil and agricultural tillage components can effectively reduce the energy consumption of agricultural tillage components and maintain good soil tillage effects [14,15,16,17,18]. Foreign research on the flow of loose particles has achieved certain results, and research in this area has gradually begun in China.
Fang et al. [19] established a model for rotary tillage operation based on the discrete element method and compared the experimental and simulated soil particle motion behavior. Marking the position of soil particle movements using a tracer method in soil tank experiments, and in the corresponding simulation experiment process, particle movement was observed to obtain a soil movement law to clarify the soil movement mechanism. Fang et al. [20] modeled soil and rotary tiller cutting with and without straw conditions using the EDEM2018 Version: 4.0.0 and analyzed the motion process in both cases. Finally, it was determined that the cutting resistance of soil under the conditions of no straw coverage was lower than the soil with straw coverage. Xiong et al. [21] calculated the parameters of rotary blades suitable for soil cultivation in southern China by measuring the parameters of soil particles, and established a corresponding three-dimensional model to conduct soil-cutting simulation experiments. They analyzed the three-dimensional working resistance and its variation law during the working process of rotary blades. Guo et al. [22] labeled aluminum blocks and straw by using the tracer method and used the coordinate changes in aluminum blocks and straw to replace the displacement changes in soil and longitudinal and transverse straw within the operating width of the machinery, and analyzed and compared the distribution of the surface soil and straw after tillage with land preparation machinery. An improved method was proposed by Zhu et al. [23] to address the issue of the high energy consumption of rotary burying rollers during the tillage of rice fields in the middle and lower reaches of the Yangtze River region using land preparation equipment. The deformation and damage characteristics of soil under load were combined to establish a power consumption prediction model for rotary burying rollers based on the discrete element method.
In summary, most of the research on cultivation equipment by domestic and foreign scholars is currently focused on the field of cultivation and land preparation machinery, such as rotary tillers for dry and paddy fields and crop straw returning machines. The mechanisms and resistance of soil covering, overturning, and crushing was studied to improve the quality of soil covering, overturning, and crushing operations, as well as reduce operational power consumption. The main function of the rotary-cutting soil collection device of the ridge building machine is to collect, break, and discard soil. The finely cut soil needs to be throwed to the designated compaction area to provide sufficient soil for subsequent compaction devices. The ridge building machine studied by the research group has been widely promoted and used in northeast China. However, the rotary tillage device still suffer from poor soil collection, which farmers are unable to resolve during operation. Therefore, it is necessary to explore the motion characteristics of the soil particles after cutting to improve the soil collection performance of the rotary-cutting soil collection device and provide good conditions for soil compaction operations subsequently.
In this study, a discrete element simulation model of the interaction between soil particles and a rotary tillage soil collection device was established using the EDEM simulation software to optimize the working parameters of the rotary-cutting soil collection device. The optimal working parameter combination of the rotary-cutting soil collection device was obtained through the analysis of motion characteristics and distribution status of soil particles in simulation experiments, and the accuracy of the numerical simulations was verified through field experiments.
2. Materials and Methods
2.1. Structure and Working Principle
The rotary-cutting soil collection device designed by the research group mainly consists of a soil-burrowing blade, a soil-throwing blade, a cutting blade, a soil-burrowing blade holder, a soil-throwing blade holder, a cutting blade holder, a soil-retaining shell and a rotary tillage cutter shaft (as shown in Figure 1). From the rotary tiller shaft, four soil-burrowing blades, two soil-throwing blades, and two cutting blades are installed in sequence from the inside out. The axis of the rotating blade is divided into three areas from the inside out: the soil-burrowing area, the soil-throwing area, and the cutting area. Four soil-burrowing blades are installed in the soil-burrowing area, corresponding to four soil-burrowing blade holders. The soil-burrowing blades are arranged in a double spiral arrangement, with a phase angle of 90° between the blade holders. In the soil-throwing area, two soil-throwing blade holders are installed with four soil-throwing blades, which are arranged in a double spiral arrangement and have a phase angle of 90° between the blade holders. Two soil-cutting blade holders are installed with two soil-cutting blades, with a phase angle of 180° between the blade holders, the rotary tillage cutter shaft and blades are covered by the soil-retaining shell.
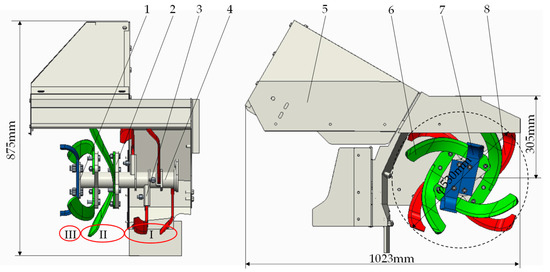
Figure 1.
The whole structure of rotary cutting and soil collection device. 1. cutting blade holder; 2. Soil-throwing blade holder; 3. soil-burrowing blade holder; 4. rotary tillage cutter shaft; 5. soil-retaining shell; 6. soil-throwing blade; 7. cutting blade; 8. soil-burrowing blade; I. burrowing area; II. throwing area; III. cutting area. The red part indicates the soil-burrowing blades and burrowing area, the green part indicates soil-throwing blades and throwing area, the blue part indicates cutting blades and cutting area.
During the rotary cutting and soil collection operation, the soil-burrowing blade first cuts the surface soil and then throws it to the compaction area towards the inclined rear. When the soil-throwing blade is carrying out a shallow soil-burrowing operation, it will crush the large pieces of uncrushed soil thrown by the soil-burrowing blade for the second time, and finally throw the chopped soil to the rear of the slope. It will cooperate with the soil-retaining shell to gather the soil to the compaction area, and then the compaction device will compact the soil into ridges.
2.2. Simulation Modeling
2.2.1. Establishment of EDEM Simulation Model
In this study, simulation modelling of the rotary-cutting soil collection device, soil particles, and soil groove were established to simulate the actual scenes in the field (as shown in Figure 2). The movement characteristics and trajectories of soil particles during the process of rotary cutting and soil collection were studied.
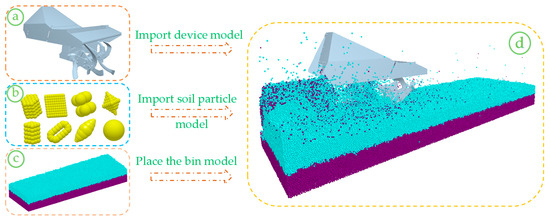
Figure 2.
EDEM virtual rotary tillage soil collection process. (a) Rotary tillage soil collection device model; (b) the soil particle model; (c) trough model; (d) simulation process.
- (1)
- Establishment of rotary-cutting soil collection device
The overall structure of the rotary-cutting soil collection device was designed, and the soil-retaining shell was added to the model due to the drainage effect on the soil during the rotary cutting and soil collection process. For the sake of observing and analyzing soil movement patterns at each stage of the rotary cutting and soil collection operation, the internal structural characteristics of the soil-retaining shell were displayed in filled and mesh forms, respectively (as shown in Figure 2a). The material setup of each part of the rotary-cutting soil collection device was referenced to the experimental requirements. Each cutter of the cutter rolls shaft and the soil-retaining shell were made of 1566 steel. The contact mechanics relationships (Table 1) are created by the preprocessing module (creator). According to the actual operation situation, the rotary-cutting soil collection device was set as a rotating component, and the soil-retaining cover was a fixed component. In this study, the Hertz–Mindlin with bonding contact model was used to construct a contact model between soil particles and geometric models in a virtual experiment. This model can simultaneously reflect the discontinuity and agglomeration characteristics of soil, and effectively solve the nonlinear problem of the interaction between agricultural tools and soil. In addition, in this model, the bonds between soil particles cannot be regenerated after being loaded and broken, which is consistent with the mechanical behavior characteristics of soil remaining loose after being broken in paddy fields.

Table 1.
Rotary-cutting soil collection device material properties.
Based on the parameters measured in the early stage and the relevant literature [24], the contact parameters between the soil’s discrete element particles and the materials of the rotary-cutting soil collection components and soil particles were set (as shown in Table 2).
Table 2.
Contact parameters of discrete element model of soil and rotary-cutting soil collection device.
- (2)
- Soil particle modeling
The parameters in a pure soil environment were selected for the spring plowing period and a discrete element model of soil particles was established in a spherical form [24], the type of soil was loam. In this paper, soil particles were simplified and filled into 8 shapes using the multi-spherical combination method in the EDEM software (as shown in Figure 2b), and the size of the soil particle models was set between 5 mm and 10 mm. The parameters of the soil particles used are shown in Table 3.
Table 3.
Discrete element model contact parameters of rotary-cutting soil collection device.
In the simulation, a soil tank with dimensions of 3000 mm × 1000 mm × 300 mm was created based on geometric relations. The soil particles in the soil tank were treated in layers, with 0–100 mm being the cultivation layer and 100–300 mm being the bottom layer of the soil (as shown in Figure 2c). The critical stresses of the particle bonding strength in shallow cultivation areas and bottom soil were set to 3 × 10⁵ Pa and 5 × 10⁵ Pa, respectively. It needs to be ensured that the number of particles in the soil tank meets the requirements of the rotary-cutting soil collection simulation operation; a soil particle model was generated with an initial velocity of 2 m/s, a rate of 400,000 particles/s, and a total of 760,000 soil particles.
2.2.2. The Single-Factor Test
In this study, the soil collection performance of the rotary-cutting soil collection device was investigated using a single-factor test. The operating speed, working speed, and rotary tillage depth were selected as factors in the test, the soil collection uniformity and soil collection rate were selected as the indicators of the test.
Under the guidance of agronomic requirements and actual production experience in soil collection, the levels of each factor were set as follows: working speed from 350 to 550 r/min; operating speed from 0.4 to 1.2 km/h; and tilling depth from 170 to 210 mm. Single-factor tests were conducted on three factors: the working speed, operating speed, and tillage depth. The obtained data were converted into relevant curves and equations using the Design Expert 11.0.4 software (as shown in Table 4).
Table 4.
Factor level coding table of single-factor test.
2.2.3. The Multi-Factor Experiment
The laws of the influence of the working speed, operating speed, and tilling depth on the soil collection uniformity and soil collection rate were investigated in the single-factor test, and a range of levels for different factors was identified. A three-factor, three-level orthogonal test was conducted to obtain a better combination of the operating parameters. The factors level coding table for the multi-factor test is shown in Table 5.
Table 5.
Factors level coding table of the multi-factor test.
Based on the distribution characteristics of soil particles during the simulation operation process and the actual agricultural requirements of paddy field mechanical soil collection, the soil collection rate and uniformity were selected as evaluation indicators for the soil collection performance in order to measure the quality of the soil collection performance of the rotary-cutting soil collection device.
- (1)
- Soil collection rate
Before the operation of the rotary-cutting soil collection device, a grid of size 1000 mm × 440 mm × 200 mm was established in the soil tank to obtain the total number of soil particles in the cultivated area. After the device ran smoothly, a grid of size 1000 mm × 500 mm × 500 mm was established in the soil tank to obtain the total number of soil particles in the soil compaction area. According to the definition of the soil collection rate, Equation (1) can be obtained:
where is the soil collection rate, %; is the total number of soil particles within the sampling volume, in pieces; and is the total number of soil particles within the compacted area within the sampling volume, pieces.
- (2)
- Coefficient of variation of soil collection uniformity
To facilitate measurement, the established grid in the soil compaction area was divided into an average of 10 parts (the size of each grid was 100 mm × 500 mm × 200 mm) and the number of soil particles in each grid was extracted. According to the definition of soil collection uniformity, Equation (2) can be obtained:
where is the number of tests; is the standard deviation of the soil particle quantity; and is the average number of soil particles.
Five repeated experiments were conducted for each group while keeping the parameters unchanged, and the average values of the experimental data on soil collection uniformity and soil collection rate were used as the experimental results for a multi-factor orthogonal experimental study.
3. Results and Discussion
3.1. Simulation Analysis
Based on practical operational requirements, the rotary-cutting soil collection device’s operating speed was defined as 0.8 km/h, the working speed was defined as 500 r/min, and the rotary-cutting soil collection device’s tilling depth was defined as 200 mm. Throughout the operation process, the rotary-cutting soil collection device always maintains a positive rotation for soil sampling. The total time of the virtual simulation was set to 15 s, with 0–2.1 s being the time for soil particle generation and 2.1–15 s being the time taken for the rotary-cutting soil collection device to move out of the soil groove. The actual effective operation time was 12 s. During the simulation experiment, the simulation data were saved every 0.01 s for subsequent data processing (as shown in Figure 3). When the virtual simulation experiment was completed, the trial test was conducted under the same operating parameters.
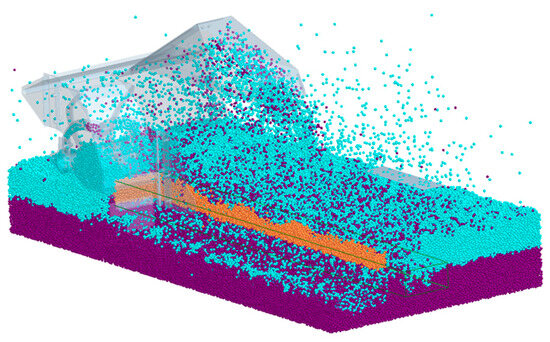
Figure 3.
Simulation results of rotary-cutting soil collection.
The operating state was extracted at a certain moment after the stable operation of the rotary-cutting soil collection device; the movement process was divided into four regions according to the position of the soil in the retaining shell and the movement of soil particles (as shown in Figure 4).
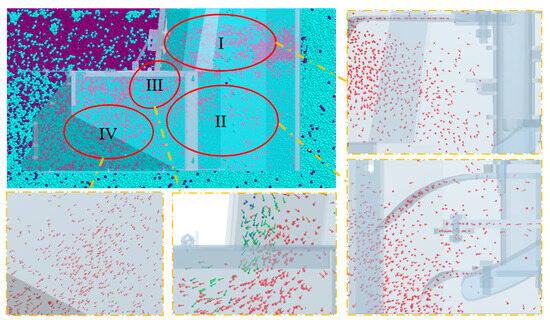
Figure 4.
Regional distribution of soil particles. I. Scope of soil-cutting blade operation; II. scope of soil-throwing blade operation; III. left range of soil-retaining shell; IV. right range of soil-retaining shell.
In region I, the soil particles were farthest from the effective soil collection area, most of the soil particles were thrown to the right rear along the direction of the side cutting edge under the action of the cutting blade; a small portion of soil particles were mainly affected by the lateral cutting edge, and due to their small initial velocity, their movement direction was mainly towards the rear, directly impacting the left front of the retaining shell, which can easily cause soil blockage and affect the soil collection performance. Therefore, in terms of working parameters, increasing the working speed threw more soil to the inclined rear and reduced the number of soil particles accumulated in front of the left side of the retaining shell; with the combined action of the tangent and side cutting edges of the soil-throwing blade, the main tendency of the soil particles’ movement in region II was to the right and back. Due to the close distance between the soil-throwing area and the compaction area, and the wider cutting edge of the soil-throwing blade, it is more conducive to soil throwing. The soil in this area was basically thrown into the designated compaction area. Therefore, the more soil particles in this area showed that the soil-throwing performance of the soil-throwing blade directly affected the throwing motion of the soil particles. In region III, a large amount of soil particles were concentrated on the left front side of the retaining shell, with some falling back into the groove. The direction of movement was basically consistent with the inclination angle of the left side of the retaining shell. As the rotary-cutting soil collection device moved forward, the soil particles flowed along the inclination angle of the left front of the retaining cover to the right rear; the soil in this area mainly converged on the left side of the suppression area. The soil particles in region IV were basically located above the suppression area, and their movement speed decreased gradually. Soil particles tended to move upwards, backward, and right. The upward-moving soil particles rebounded and fell into the suppression area after hitting the soil-retaining shell, and the soil particles moving in a backward direction also directly fell into the suppression area. Some soil particles that moved to the right fell outside the suppression area, resulting in lost soil, this was also one of the reasons for the low soil collection rate.
The simulation and trial test results showed that the soil collection rates of the rotary-cutting soil collection component under this working condition were 82.32% and 81.47%, and the coefficients of variation of soil collection uniformity under this working condition were 7.27% and 7.93%, respectively. The similar results proved that the establishment of the simulation model is effective.
3.2. Analysis of Single-Factor Test Results
- (1)
- Influence on each indicator by working speed
At the operating speed of 1.0 km/h and the tilling depth of 200 mm, the single-factor test was conducted. The working speed of the rotary blades was set at five levels of 350 r/min, 400 r/min, 450 r/min, 500 r/min, and 550 r/min, individually. Five replications of each group of tests were conducted while keeping the parameters constant, and the trends in the effect of different working speeds on the soil collection uniformity and soil collection rate were obtained (as shown in Figure 5).
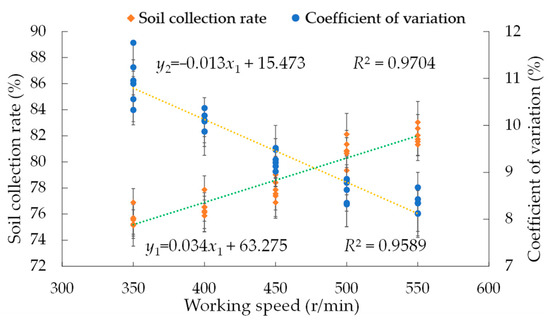
Figure 5.
The influence of working speed on the soil collection rate and the coefficient of variation of soil collection uniformity.
The maximum soil collection rate and the minimum coefficient of variation of soil collection uniformity were achieved at a working speed of 550 r/min. With the increase in working speed, the soil collection rate rose, and the coefficient of variation of soil collection uniformity fell. The main reason for this situation was that when the working speed of the rotary blades was low, at 350–400 r/min, the linear speed of the soil sampling and throwing blades was relatively small, and the soil particles’ kinetic energy was low, resulting in more soil particles falling into the invalid region and greater soil loss. The left front of the soil-retaining shell was prone to soil blockage. When the working speed of the rotary blades was higher than 450 r/min, the soil sampling and throwing blades accelerated the rotation, increasing the linear speed of soil sampling and throwing, and enhancing the throwing effect on soil particles. The soil collection rate was above 75%, meeting the requirements of standard field ridge construction operations.
For the purpose of building the mathematical relationships of the working speed of the rotary-cutting soil collection device and the test index of soil collection uniformity and soil collection rate, the regression equation and coefficient of determination were obtained after fitting and analyzing the data:
where is the soil collection rate, %; is the coefficient of variation of soil collection uniformity, %; and is the working speed of the rotary blades, m/s.
From Equation (3), the coefficient of determination of the regression equation of the soil collection rate and soil collection uniformity were equal to 0.9589 and 0.9704, respectively, which was within acceptable limits. The impact of the working speed on the soil collection performance testing indicators was studied through analysis of variance (as shown in Table 6).
Table 6.
Analysis of variance of effect of working speed on various indicators.
For the regression model of the soil collection rate and coefficient of variation of soil collection uniformity, the impact of the working speed on it was very significant. According to the results of the single-factor test, the working speed level of the rotary blades was determined to be from 450 r/min to 550 r/min.
- (2)
- Impact on each indicator by operating speed
The rotary-cutting soil collection device was operated at 450 r/min with a tilling depth of 200 mm, and the operating speed was set at five levels of 0.4 km/h, 0.6 km/h, 0.8 km/h, 1.0 km/h, and 1.2 km/h, individually. Five replications of each group of tests were conducted while keeping the parameters constant, and the trends in the soil collection uniformity and soil collection rate could be obtained at different operating speeds (as shown in Figure 6).
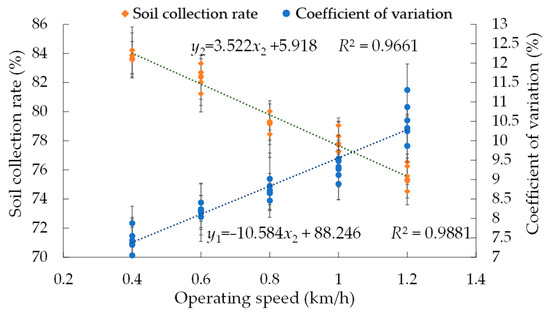
Figure 6.
The influence of operating speed on the soil collection rate and the coefficient of variation of soil collection uniformity.
The maximum soil collection rate and the minimum coefficient of variation of soil collection uniformity were achieved at an operating speed of 0.4 km/h. With the increase in operating speed, the soil collection rate fell, and the coefficient of variation of soil collection uniformity rose. The main reason for this situation was that when the operating speed of the rotary-cutting soil collection device was low, at 0.4–0.8 km/h, the soil-sampling operating speed and throwing blades were relatively low, and the soil was repeatedly cut by various rotary blades, causing some soil particles that should have fallen into the ineffective area to be thrown into the effective area, resulting in less soil loss. When the operating speed of the rotary blades was higher than 1.0 km/h, the soil sampling operating speed and throwing blades were faster, which weakened the throwing effect of soil particles in the same area, leading to an increase in the number of soil particles falling into ineffective areas and a decrease in the soil collection rate. The soil collection rate was higher than 83.56% and the coefficient of variation of soil collection uniformity was less than 7.88%, meeting the requirements of standard field ridge construction operations.
To build the mathematical relationships of the operating speed of the rotary-cutting soil collection device and the test index of soil collection uniformity and soil collection rate, the regression equation and coefficient of determination could be obtained after fitting and analyzing the data:
where is the operating speed of the rotary-cutting soil collection device, km/h.
From Equation (4), the coefficient of determination of the regression equation of the soil collection rate and soil collection uniformity were equal to 0.9661 and 0.9881, respectively, which was within acceptable limits. The impact of the operating speed on the soil collection performance testing indicators was studied through analysis of variance (as shown in Table 7).
Table 7.
Analysis of variance of effect of operating speed on various indicators.
For the regression model of soil collection rate and coefficient of variation of soil collection uniformity, the impact of the operating speed on it was very significant. According to the results of the single-factor test, the operating speed level of the rotary blades was determined to be from 0.6 km/h to 1.0 km/h.
- (3)
- Impact of tilling depth on each indicator
At a working speed of 450 r/min and an operating speed of 1.0 km/h, the single-factor test was conducted. The tilling depth was set at five levels of 170 mm, 180 mm, 190 mm, 200 mm, and 210 mm. Five replications of each group of tests were conducted while keeping the parameters constant, and the trends in the soil collection uniformity and soil collection rate could be obtained at different tilling depths (as shown in Figure 7).
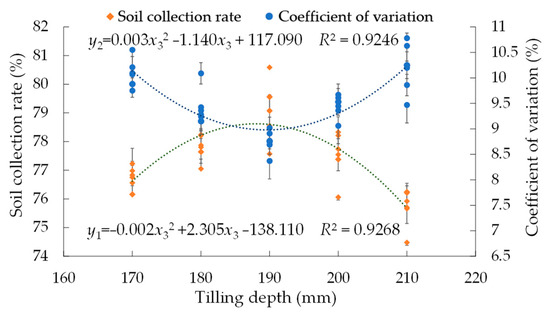
Figure 7.
The influence of tilling depth on the soil collection rate and the coefficient of variation of soil collection uniformity.
As the depth of tilling increased, the soil collection rate first increased and then decreased, and the coefficient of variation of soil collection uniformity first decreased and then increased. The main reason for this situation was that when the tilling depth of the rotary-cutting soil collection device was shallow, at 170 mm, the rotary blades had less contact with the soil, the throwing effect on soil particles was weakened, and the soil collection rate was reduced. When the tilling depth of the rotary-cutting soil collection device was 210 mm, the contact surface between the rotary blades and soil was larger, with many soil particles falling into the trench after soil sampling, resulting in a decrease in the soil collection rate. The maximum soil collection rate and the minimum coefficient of variation for soil collection uniformity were observed at a tilling depth of 190 mm. The soil collection rate was above 77.57%, and the coefficient of variation of soil collection uniformity was less than 9.02%, meeting the requirements of standard field ridge construction operations.
For building the mathematical model of the tilling depth of the rotary-cutting soil collection device and the test index of soil collection uniformity and soil collection rate, the regression equation and coefficient of determination could be obtained after fitting and analyzing the data:
where is the tilling depth of the rotary-cutting soil collection device, mm.
From Equation (5), the coefficient of determination of the regression equation of the soil collection rate and soil collection uniformity were equal to 0.9268 and 0.9246, respectively, which was within acceptable limits. The impact of the tillage depth on soil collection performance testing indicators was studied through analysis of variance (as shown in Table 8).
Table 8.
Analysis of variance of effect of tillage depth on various indicators.
With respect to the soil collection rate and coefficient of variation of soil collection uniformity, the regression model of tilling depth was extremely important, which showed that tilling depth was a significant factor affecting soil collection performance. According to the results of the single-factor test, the range of tilling depth level for rotary blades was determined to be from 180 mm to 200 mm.
3.3. Analysis of Multi-Factor Test Results
In this study, to comprehensively evaluate the indicators of soil collection uniformity and stability, a three-factor, three-level orthogonal test was conducted to investigate the optimal operating parameters of the rotary-cutting soil collection device, the regression model between various factors was optimized and validated, and each experiment was repeated five times while keeping the parameters unchanged. The experimental results of the three factors of working speed, operating speed, and tillage depth were analyzed (as shown in Table 9).
Table 9.
Protocol and results of multi-factor test.
- (1)
- Analysis of the influence of various factors on the soil collection rate
The experimental data were regressed and analyzed using the Design Expert 11.0.4 software with factorial ANOVA to screen for factors that had a more significant impact (as shown in Table 10), and the corresponding response surfaces were obtained (as shown in Figure 8); the regression equation between the performance index and the coded values of factors was
Table 10.
Analysis of variance of effects of factors affecting soil collection rate.
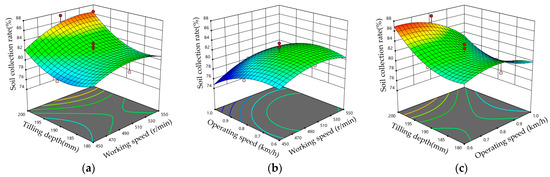
Figure 8.
Response surface of each factor to the soil collection rate. (a) Working speed and tilling depth; (b) operating speed and working speed; (c) operating speed and tilling depth.
When the working speed was kept constant, the soil collection rate of the rotary blades decreased and then increased as the tilling depth increased; when the tillage depth remained constant, the soil collection rate of the rotary blades increased and then decreased as the working speed increased; the soil collection rate of the rotary blades changed within a larger range when the depth of tillage changed, so the tilling depth was more significantly affected by the soil collection rate (as shown in Figure 8a). When the working speed remained unchanged, the soil collection rate of the rotary blades gradually increased and then decreased as the operating speed increased; when the operating speed remained unchanged, the soil collection rate of the rotary blades increased and then decreased as the working speed increased; the soil collection rate of the rotary blades varied greatly within the range when the operating speed changed, so the effect of operating speed on the soil collection rate was more obvious (as shown in Figure 8b). When the operating speed remained constant, the soil collection rate of the rotary blades presented an upward changing trend as the tilling depth increased; when the tilling depth was determined, the soil collection rate of the rotary blades increased and then decreased as the operating speed increased; the soil collection rate of the rotary blades varied over a larger range when the tilling depth changed. Therefore, the effect of tilling depth on the soil collection rate of the rotary blades was more important (as shown in Figure 8c). In conclusion, the importance of the effects on soil collection rate is listed in the following order: tilling depth, operating speed, and working speed.
- (2)
- Analysis of the impact of various factors on the soil collection uniformity
In order to screen for factors that had a more significant impact, the statistical analysis software Design Expert 11.0.4 was used to process and analyze the experimental data, and an analysis of variance of the factors was conducted (as shown in Table 11). The level values of each factor were used as the dependent variable, and the coefficient of variation of soil collection uniformity was used as the response function to derive the following regression mathematical equation:
Table 11.
Analysis of variance of effects of factors affecting soil collection uniformity.
When the working speed remained constant, the coefficient of variation of soil collection uniformity presented an upward changing trend with increasing operating speed. When the operating speed remained constant, the coefficient of variation of soil collection uniformity decreased firstly and then increased as the working speed increased. When the working speed changed, the coefficient of variation of soil collection uniformity varied over a larger range, so the coefficient of variation of soil collection uniformity was more significantly affected by the working speed (as shown in Figure 9a). When the working speed was determined, the coefficient of variation of soil collection uniformity firstly increased and then decreased as the tilling depth increased; when the tilling depth remained unchanged, the coefficient of variation of soil collection uniformity dropped and then increased with increasing working speed; the coefficient of variation of soil collection uniformity varied greatly within the range when the working speed changed; therefore, the effect of working speed on the coefficient of variation of soil collection uniformity was more obvious (as shown in Figure 9b). When the operating speed remained constant, the coefficient of variation of soil collection uniformity showed a gradually decreasing trend as the tilling depth increased; when the tilling depth was determined, the coefficient of variation of soil collection uniformity presented an upward changing trend as the operating speed increased; the coefficient of variation of soil collection uniformity changed within a larger range when the operating speed changed, so the effect of operating speed on the coefficient of variation of soil collection uniformity was more significant (as shown in Figure 9c). In summary, the order of importance of the effect on the coefficient of variation of soil collection uniformity was as follows: working speed, operating speed, and tilling depth.
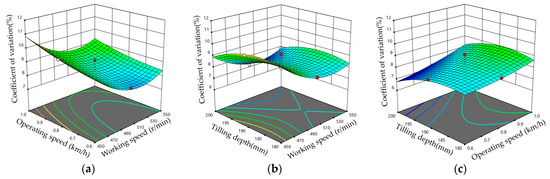
Figure 9.
Response surface of each factor to the coefficient of variation of soil collection uniformity. (a) Operating speed and working speed; (b) tilling depth and working speed; (c) tilling depth and operating speed.
3.4. Optimization of Multi-Factor Experiment
A parameterized mathematical model was established based on multi-factor experimental research, following the principle of high-quality and efficient operation. The experimental data were optimized and solved using the data analysis software Design Expert 11.0.4. The nonlinear programming parameter model is shown in Equation (8):
The optimal combination of operating parameters for the device was obtained through comprehensive analyses; when the operating speed of the device was 0.6 km/h, the working speed was 515.02 r/min, and the tilling depth was 200 mm, the designed rotary-cutting soil collection device had better soil collection performance, with a soil collection rate of 87.22% and a coefficient of variation of soil collection uniformity of 6.73%.
4. Verification Test in the Field
Performance testing of the rotary-cutting soil collection device in a paddy field were conducted in Harbin, Heilongjiang Province, in October 2022. The ambient temperature was 14 °C, the ambient humidity was 56%, and the wind force was 3–4 levels in the field. The type of soil selected for the test in the field was loam, with a soil solidity of 101–124 kPa and a soil moisture content of 25–27%, and the supporting driving machine was a John Deere 904 tractor. The main measuring instruments included a ruler, a tape measure, and an electronic scale (with a range of 0–20 kg). According to agronomic requirements in paddy fields, the testing area was divided into the starting, testing, and stopping areas. The length of the testing area was set to 30 m, with 5 m for each starting and stopping area (as shown in Figure 10). During the field testing, the machine’s operating speed, the working speed, and the tilling depth were set at 0.6 km/h, 515 r/min, and 200 mm, respectively, and five repeated experiments were conducted under these conditions. The average values were taken as the final measurement results.
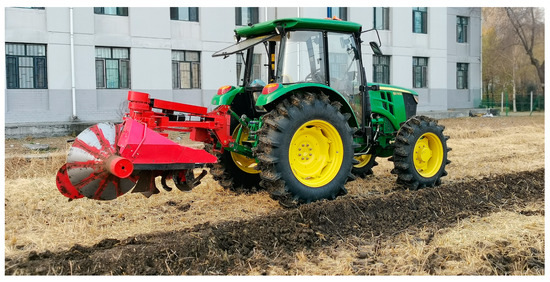
Figure 10.
The operational effect of rotary-cutting soil collection device in paddy field.
The results of the test in the field indicated that the soil collection rate of the rotary-cutting soil collection device was 85.37%, and the coefficient of variation of soil collection uniformity was 7.02%, which corresponded with the simulation test results. The main reason for the error is that the moisture content of the field soil is difficult to maintain consistency with the simulation results.
5. Conclusions
In this study, the operation parameters of the rotary-cutting soil collection device were optimized. The working reliability and stability of soil collection were verified through simulation and field tests. In order to analyze the performance of the rotary-cutting soil collection device, single-factor and multi-factor tests were carried out, with the following conclusions:
(1) A simulation model of the interaction between the rotary-cutting soil collection device and the soil particles was established based on the discrete element method. The simulation and trial test results showed that the soil collection rates were 82.32% and 81.47%, and the coefficients of variation of soil collection uniformity were 7.27% and 7.93%. The similar results of the tests indicated that the simulation model established was accurate.
(2) A single-factor test was conducted to investigate the effect of various factors on the performance of soil collection under different levels of conditions. The results showed that the soil collection rate and the coefficient of variation of soil collection uniformity were strongly influenced by three factors, and the optimum range of parameters was determined. The working speed was determined to range from 450 r/min to 550 r/min, the operating speed was determined to range from 0.6 km/h to 1.0 km/h, and the tilling depth was determined to range from 180 mm to 200 mm.
(3) The results of the multi-factor test showed that when the operating speed of the device was 0.6 km/h, the working speed was 515.02 r/min, and the tilling depth was 200 mm, the performance of soil collection in the rotary-cutting soil collection device was best, with a soil collection rate of 87.22% and a coefficient of variation of soil collection uniformity of 6.73%. The results of tests in the field showed that the soil collection rate was 85.37% and the coefficient of variation of soil collection uniformity was 7.02%, which corresponded with the simulation test.
Author Contributions
Conceptualization, W.W.; methodology, M.H., W.C. and L.C.; software, W.C.; validation, W.W.; formal analysis, W.W.; investigation, W.C. and M.H.; resources, W.W., J.W. and S.Z.; data curation, W.W. and M.H.; writing—original draft preparation, W.W.; writing—review and editing, W.C., M.H. and L.C.; visualization, L.C.; project administration, W.W., S.Z. and J.W.; funding acquisition, W.W. All authors have read and agreed to the published version of the manuscript.
Funding
This work was supported by the Guiding Project of Fujian Provincial Department of Science and Technology (grant number 2022N0009); Cross Disciplinary Project of Fujian Agriculture and Forestry University (grant number K1520005A05).
Institutional Review Board Statement
Not applicable.
Informed Consent Statement
Not applicable.
Data Availability Statement
All data are presented in this article in the form of figures and tables.
Acknowledgments
The authors would like to acknowledge the College of Mechanical Electronic Engineering, Fujian Agriculture and Forestry University and the College of Engineering, Northeast Agricultural University.
Conflicts of Interest
The authors declare no conflict of interest.
References
- Li, H.L.; Liu, G.; Chen, M.C. Discussion on the Technique of Rice Production Mechanization in China. Agric. Sci. Technol. Equip. 2014, 12, 38–39. [Google Scholar]
- Wang, J.; Xiang, Y.; Wang, C.; Xu, C.; Zhu, G.; Gu, Z.; Wang, J.; Tang, H. The Method and Experiment of Kinetic Determination for the Rotary Soil-Engaging Components of Agricultural Machinery Using a Compacting Device in a Paddy Field as an Example. Agronomy 2023, 13, 775. [Google Scholar] [CrossRef]
- Liu, M.; Ku, H.; Cai, H. Optimization Design and Analysis of the Blade Laminated Ridger for Paddy Field. Trans. Chin. Soc. Agric. Mach. 2019, 40, 31–36. [Google Scholar]
- Ucgul, M.; Fielke, J.M.; Saunders, C. Three-dimensional Discrete Element Modelling of Tillage: Determination of a Suitable Contact Model and Parameters for a Cohesionless Soil. Biosyst. Eng. 2014, 121, 105–117. [Google Scholar] [CrossRef]
- Horabik, J.; Molenda, M. Parameters and Contact Models for DEM Simulations of Agricultural Granular Materials: A Review. Biosyst. Eng. 2016, 147, 206–225. [Google Scholar] [CrossRef]
- Li, J.; Tong, J.; Hu, B.; Wang, H.; Mao, C.; Ma, Y. Calibration of Parameters of Interaction between Clayey Black Soil with Different Moisture Content and Soil-engaging Component in Northeast China. Trans. Chin. Soc. Agric. Eng. 2019, 35, 130–140. [Google Scholar] [CrossRef]
- Yang, Y.; Hu, Z.; Gu, F.; Ding, Q. Simulation and Experimental Study of the Tillage Mechanism for the Optimal Design of Wheat Rotary Strip–Tiller Blades. Agriculture 2023, 13, 632. [Google Scholar] [CrossRef]
- Fang, H.M.; Ji, C.Y.; Farman, A.C.; Guo, J.; Zhang, Q.Y.; Chaudhry, A. Analysis of Soil Dynamic Behavior During Rotary Tillage Based on Distinct Element Method. Trans. Chin. Soc. Agric. Mach. 2016, 47, 22–28. [Google Scholar]
- Mustafa, U.; Chris, S.; Li, P. Analyzing the Mixing Performance of a Rotary Spader Using Digital Image Processing and Discrete Element Modelling. Comput. Electron. Agric. 2018, 151, 1–10. [Google Scholar]
- Aikins, K.A.; Antille, D.L.; Ucgul, M.; Barr, J.B.; Jensen, T.A.; Desbiolles, J.M.A. Analysis of Effects of Operating Speed and Depth on Bentleg Opener Performance in Cohesive Soil Using the Discrete Element Method. Comput. Electron. Agric. 2021, 187, 106–236. [Google Scholar] [CrossRef]
- Aikins, K.A.; Barr, J.B.; Antille, D.L.; Ucgul, M.; Jensen, T.A.; Desbiolles, J.M.A. Analysis of Effect of Bentleg Opener Geometry on Performance in Cohesive Soil Using the Discrete Element Method. Biosyst. Eng. 2021, 209, 106–124. [Google Scholar] [CrossRef]
- Wang, L.; Liao, J.; Hu, H. Research Status and the Prospect of Adhesion Reduction and Desorption Technology for Agricultural Machinery Parts Touching Soil. Trans. Chin. Soc. Agric. Mach. 2021, 42, 214–221. [Google Scholar]
- Wang, X.; Zhang, Q.; Huang, Y.; Ji, J. An efficient method for determining DEM parameters of a loose cohesive soil modelled using hysteretic spring and linear cohesion contact models. Biosyst. Eng. 2022, 215, 283–294. [Google Scholar] [CrossRef]
- You, Y.; He, C.; Wang, D.; Wang, G. Interaction Relationship between Soil and Very Narrow Tine during Penetration Process. Trans. Chin. Soc. Agric. Mach. 2017, 48, 50–58. [Google Scholar]
- Zhang, J.; Xia, M.; Chen, W.; Yuan, D.; Wu, C.; Zhu, J. Simulation Analysis and Experiments for Blade-Soil-Straw Interaction under Deep Ploughing Based on the Discrete Element Method. Agriculture 2023, 13, 136. [Google Scholar] [CrossRef]
- Matin, M.A.; Hossain, M.I.; Mahesh, K. Optimal Design and Setting of Rotary Strip-Tiller Blades to Intensify Dry Season Cropping in Asian Wet Clay Soil Conditions. Soil Till Res. 2021, 207, 104854. [Google Scholar] [CrossRef]
- Hao, J.; Yu, H.; Zhao, J.; Li, J.; Ma, Z.; Cai, J. Design and Test of Wedge Drag Reduction Rotary Blade. Trans. Chinese Soc. Agric. Eng. 2019, 35, 55–64. [Google Scholar] [CrossRef]
- Liu, G.; Xia, J.; Zheng, K.; Cheng, J.; Wei, Y.; Guo, L.; Li, X.; Zhang, J. Design and Experiments of the Barrier Type Rotary Anti-adhesion Blade Roller with Vibration Crosspiece. Trans. Chinese Soc. Agric. Eng. 2022, 38, 29–40. [Google Scholar] [CrossRef]
- Fang, H.; Ji, C.; Zhang, Q.; Guo, J. Force Analysis of Rotary Blade Based on Distinct Element Method. Trans. Chin. Soc. Agric. Eng. 2016, 32, 54–59. [Google Scholar] [CrossRef]
- Fang, H.; Ji, C.; Ahmed, A.T.; Zhang, Q.; Guo, J. Simulation Analysis of Straw Movement in Straw-Soil-Rotary Blade System. Trans. Chin. Soc. Agric. Mach. 2016, 47, 60–67. [Google Scholar]
- Xiong, P.; Yang, Z.; Sun, Z.; Zhang, Q.; Huang, Y.; Zhang, Z. Simulation Analysis and Experiment for Three-Axis Working Resistances of Rotary Blade Based on Discrete Element Method. Trans. Chin. Soc. Agric. Eng. 2018, 34, 113–121. [Google Scholar] [CrossRef]
- Guo, J.; Ji, C.; Fang, H.; Zhang, Q.; Hua, F.; Zhang, C. Experimental Analysis of Soil and Straw Displacement after Up-cut and Down-cut Rotary Tillage. Trans. Chin. Soc. Agric. Mach. 2016, 47, 21–26. [Google Scholar]
- Zhu, Y.; Xia, J.; Zeng, R.; Zheng, K.; Du, J.; Liu, Z. Prediction Model of Rotary Tillage Power Consumption in Paddy Stubble Field Based on Discrete Element Method. Trans. Chin. Soc. Agric. Mach. 2020, 51, 42–50. [Google Scholar]
- Wang, J.; Tang, H.; Wang, J.; Huang, H.; Lin, N.; Zhao, Y. Numerical Analysis and Performance Optimization Experiment on Hanging Unilateral Ridger for Paddy Field. Trans. Chin. Soc. Agric. Mach. 2017, 48, 72–80. [Google Scholar]
Disclaimer/Publisher’s Note: The statements, opinions and data contained in all publications are solely those of the individual author(s) and contributor(s) and not of MDPI and/or the editor(s). MDPI and/or the editor(s) disclaim responsibility for any injury to people or property resulting from any ideas, methods, instructions or products referred to in the content. |
© 2023 by the authors. Licensee MDPI, Basel, Switzerland. This article is an open access article distributed under the terms and conditions of the Creative Commons Attribution (CC BY) license (https://creativecommons.org/licenses/by/4.0/).