Abstract
In recent years, the primary sector in Italy and elsewhere has been profoundly affected by climate change and a deep economic crisis, mainly linked to stagnating prices and rising production costs. Because of this situation, we are witnessing renewed interest in alternative agricultural productions, which are characterized by their resilience and sustainability, including medicinal and aromatic plants (MAPs). This sector is characterized by a certain heterogeneity due to the great variety of species and their wide range of uses. Although these characteristics contribute to the sector’s economic success, they also hinder its study due to commodity complexity and limited data availability. At the farm level, the situation is complicated by the fact that MAP cultivation is often embedded in complex cropping systems, and more rarely, is practiced exclusively or predominantly. In light of these considerations, we concentrated solely on the agricultural phase of the supply chain, using data available in the Farm Accountancy Data Network. We aimed to examine the main structural characteristics and economic outcomes of Italian farms that grow MAP, as well as the profitability of some of the species. To ensure accurate species classification, only MAPs exclusively designated for botanical use in the Italian National List were considered. The analysis of farm economic performance indicators (gross output, variable costs, gross margins, etc.) focused mainly on the species most represented in the sample: saffron, rosemary, lavender, oregano, and sage. The results indicate that the total gross output and gross margin show the best performance in the case of saffron (66,200 and 57,600 EUR/ha, respectively) and rosemary (27,500 and 22,000 EUR/ha, respectively). However, for saffron, the biggest cost concerns propagation (purchase of bulbs), amounting to 50% of the variable costs, whereas fertilization ones are particularly high for sage and rosemary.
1. Introduction
Medicinal and aromatic plants (MAPs) are plants or portions thereof used primarily for their medicinal or aromatic properties in pharmaceutical, nutraceutical, phytotherapeutical, cosmeceutical, etc., industries [1]. This is due to the multitude of biologically active secondary metabolites present in these plants, which allow them to be formulated into a wide range of commercial products [2], to the extent that these species are globally considered an important source of income for farmers in rural areas, fostering enormous trade from the local to the international level [3]. World trade in MAP resources is expected to grow annually at a rate of between 10 and 12%, driven by the phytotherapy sector, whose sales, according to Future Market Insights, will approach USD 500 billion by 2033, with a growth rate of around (%) over the forecast period [4]. Globally, the main suppliers of MAPs are, for Asia, China and India, for Africa, Egypt and Morocco, and for South America, Peru and Chile, while the most important suppliers of MAPs in Europe are Poland and Bulgaria [5]. At the European level, at the end of 2020, MAPs were cultivated on an area of more than 200,000 hectares, remaining a niche phenomenon compared to other crops [6], even though Mediterranean countries benefit from a number of favorable agro-climatic conditions, which make them ideal for MAP production and harvesting [3,7,8,9,10,11,12]. As far as Italy is concerned, the MAP sector is a niche industry that is gaining more attention due to the growing demand for natural products for people, pets, and home care [13,14,15]. This sector is becoming increasingly popular among agricultural and industrial enterprises [6], which are actively seeking new markets, especially during the current global crisis that began a decade ago and has intensified due to the pandemic. This crisis threatens the future of younger generations, making it more important to explore alternative industries like MAPs. Italy enjoys an enormous heritage of plant biodiversity [16], which can be enhanced and protected through the growth of an innovative and sustainable Italian MAP supply chain [17]. In 1987, the United Nations Brundtland Commission defined the term “sustainability” as “meeting the needs of the present without compromising the ability of future generations to meet their own needs” [18,19]. This implies that to preserve the conditions and vital resources necessary for the survival of future generations, a commitment to the adoption of sustainable practices by both consumers and companies is essential. To achieve this goal, the adoption of sustainable practices throughout the entire supply chain, including the careful selection of cultivation sites based on species needs, embracing conservative agriculture, and incorporating innovative techniques like hydroponic cultivation [20], as well as leveraging new technologies in post-harvest processing, can markedly diminish the sector’s environmental impact, thereby positively influencing biodiversity conservation [17,21,22,23,24,25]. To this end, the cultivation of MAPs in Italy is regulated, as of 2018, by the Testo Unico in materia di coltivazione, raccolta e prima trasformazione delle piante officinali, pursuant to the Legislative Decree 75/2018.
According to the crop data available for 52 plant species from the farm files of the Italian Agricultural Payments Agency (AGEA), the total area planted with MAPs in Italy amounted to approximately 38,970 hectares (ha) in 2019 (Figure 1). As can be seen from the graph, the available data show a certain concentration of MAPs in specific areas, which is well highlighted in the case of some regions. However, over the five-year period from 2015 to 2019, the cultivated area for MAPs in Italy experienced a decline of approximately 5%. This variation may be attributable to the impacts of climate change, which are altering the agro-ecological conditions of many agricultural landscapes in the Mediterranean basin [26,27,28].
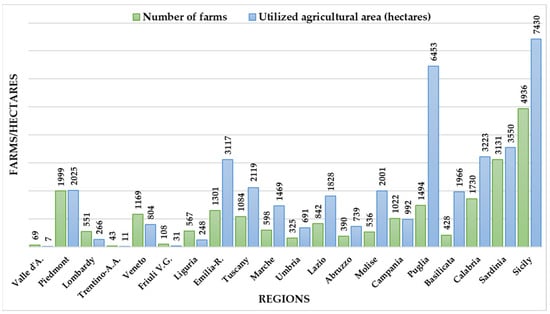
Figure 1.
Number of farms with medicinal and aromatic plants and Utilized Agricultural Area (2019 campaign) (source: own elaboration on AGEA data).
In the last available year, most of the production areas were localized in the southern regions, which accounted for more than two-thirds of the total area. Sicily, Puglia, and Sardinia accounted for 45% of the total invested surface area. Calabria, Molise, and Basilicata had a share of around 5% each. In the center, Tuscany had the greatest weight with 5.4%, followed by Lazio (4.7%). In the north, the most significant shares were found in Emilia-Romagna and Piedmont, with 8% and 5.2%, respectively (Figure 2).
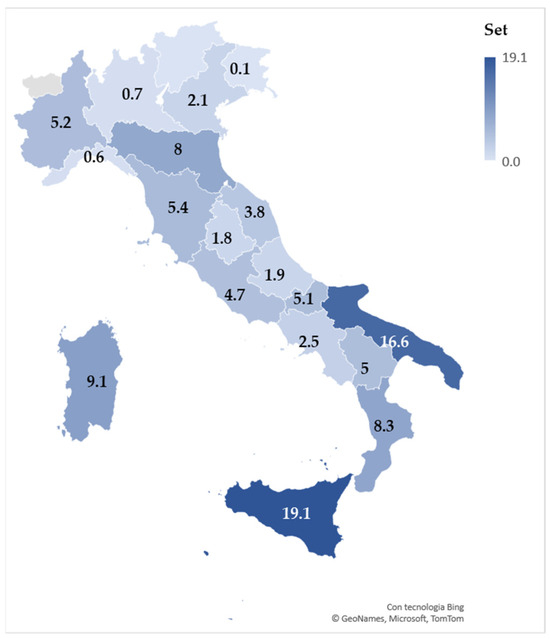
Figure 2.
Distribution of the Utilized Agricultural Area under medicinal and aromatic plants in Italy (2019, values in %) (source: own elaboration on AGEA data). Notes: data for Valle d’Aosta and Trentino-Alto Adige are negligible.
Concerning farms, the data extracted from AGEA files indicate a figure of 22,323, reflecting a 10.3% increase compared to the data recorded in 2018. Similarly to what has already been observed for cultivated areas, the farms involved in MAP show that they are concentrated in certain regions, with clear leadership in island areas (Sicily has 4936 units and Sardinia has 3131 units). The northern regions have an incidence on the national total of just over 25%, while Central Italy accounts for 13% of the producing holdings (2849 units).
The average size of a farm in Italy is 1.7 ha, but this varies between regions. The largest farms can be found in Basilicata and Puglia, where they are around 4.6 and 4.3 ha per farm, respectively. However, in Valle d’Aosta, Piedmont, Lombardy, Trentino-Alto Adige, Friuli Venezia Giulia, Liguria, Campania, Sicily, and Sardinia, the farm sizes are generally smaller, ranging from a minimum of 0.1 ha per farm in Valle d’Aosta to 1.5 ha per farm in Sicily.
Considering the ten most cultivated MAP species in Italy according to AGEA data (see Table A1 in Appendix A), coriander, with 11,188.4 ha, intercepts 28.7% of the total surface area, although showing a decrease of 13.2% compared to the reference year. The cultivation of this species is localized, in particular, in Puglia (3820.6 ha), Emilia-Romagna (1923 ha), and Molise (1760 ha), which account for 68.5% of the Italian surface area for this species. It is followed, in order of importance, by eucalyptus, with 5044.4 ha and a weight on the total of medicinal plants of approximately 13%. In the five years under review, there was a significant increase (+38.5%), with the production areas concentrated mainly (83%) in just two regions: Sardinia (2764.1 ha) and Calabria (1425.9 ha).
The area of carob production (4221.4 ha) suffered the greatest contraction during the observation period, i.e., 71%. With 4167.4 ha, the Sicilian region holds the most prominent position in its cultivation in Italy (98.7%). While carob is the MAP that has suffered the greatest decrease, flax is the species that has seen production areas more than double compared to 2015. Cultivation, which is particularly widespread in Puglia (1196.3 ha) and Tuscany (605.3 ha), covers 3356.6 ha and accounts for 8.6% of Italy’s MAP area. A similar weight to flax is maintained by the cultivation of fenugreek, which with 3204.1 ha affects 8.2% of the total area, showing a 3% reduction compared to 2015. Sicily is also the most suited region for this species (2017.6 ha).
For the other species covered, three of which are aromatic (garlic, parsley, and basil), the total weight on the total area under MAPs was just over 16%, and, except for bergamot, the growth trend was positive over the five years under review.
Recently, Spina et al. have conducted an interesting study to identify the key factors and possible strategies to be adopted, at a national level, in the medium term, for the development of the supply chain, pointing out that the national MAP sector suffers from competition from low-priced production and several shortcomings, most of which are of an organizational nature [13]. Nevertheless, the authors foresee an expansion of MAP cultivation, particularly of herbs (e.g., thyme, rosemary, and sage), especially if action is taken to train farmers and increase the information available to them.
However, to the best of our knowledge, compared to the abovementioned study, there is no research on the economic performance of the sector in the specific Italian context. At the national level, there is also some difficulty in finding up-to-date statistical sources.
Based on these considerations, the present study aimed to analyze the economic structure of Italian farms interested in growing MAPs, offering the reader a key to understanding the productivity and profitability of these alternative crops.
The remainder of this paper is organized as follows. Section 2 explains the data used and provides essential information on the research strategy. Section 3 presents the main results of the analysis and the discussion. The last section (Conclusions) describes the main practical implications, limitations, and future lines of research.
2. Materials and Methods
2.1. The Database Used
The information used for the analysis was sourced from the Farm Accountancy Data Network (FADN) database. Established by the European Economic Commission in 1965 and recently regulated by EU Regulation No. 1652/2020, this annual sample survey has been conducted in Italy since 1968, following a similar approach in all European Union (EU) Member States. The EU is responsible for the regulatory framework within which the FADN operates, as well as funding.
The FADN is used for processing quantitative data, providing valuable insights into the investigation of the structural and economic characteristics of farms. The collected information includes both structural data (e.g., cropped surface, workforce, etc.) and economic data (e.g., production value, goods and services purchased and sold, etc.). Specifically, the collected information paints a picture of farm structures, their financial and economic aspects, environmental considerations, social issues, labor, machinery, and more. The database also contains information related to social aspects (e.g., the level of education, age of farmers, gender, etc.), while other data are associated with environmental factors and land use, as well as livestock.
It serves as the unique harmonized data source for monitoring income trends and economic–structural dynamics of farms, playing a pivotal role as a fundamental informational resource in the decision-making processes related to the formulation of the EU Common Agricultural Policy.
The methodology in use aims to provide representative data regarding the territorial level and specific nature of farming, particularly concerning farm size and the activities undertaken. The last two attributes, considered from an economic perspective, constitute the criteria utilized by the EU’s agricultural company classification system, known as the Farm Typology. It was delineated in Commission Decision 78/463, and its subsequent additions and revisions are to be utilized for both the periodic Farm Structures Surveys (FSSs) and the annual FADN surveys, thus enabling the presentation of collected data on a uniform basis. This classification is based on the concept of standard output (SO), which represents the average monetary value at the farm gate price of an agricultural product (crop or livestock) and is expressed in EUR per hectare or per head of livestock. SO coefficients are computed for each product at the regional level as an average value over a reference period of five years. The economic size of a farm corresponds to its total SO, which is derived by summing all SOs for each activity on the farm. In addition, SO is used to determine the type of farming (TF) of an agricultural or livestock farm. Types of farming are defined based on the relative importance of the different activities within the farm and are quantitatively calculated as the proportion of each activity’s SO to the total SO of the farm.
The FADN data are disclosed based on economic size classes and TF groupings, as indicated in Table 1 and Table A2 in Appendix A, respectively.

Table 1.
Economic size classes adopted in the Italian FADN (source: own elaboration).
The FADN’s field of observation covers all farms that meet a specific economic size threshold (currently set at EUR 8000 in Italy), thereby predominantly encompassing market-oriented farms. Moreover, it is structured upon a stratified random sample design, ensuring statistical validity across three key dimensions: geographical region, economic size, and farming type. It serves as the primary source for monitoring the economic performance of EU farms [29,30], enabling the Commission to conduct cross-country comparisons and shape policy decisions.
Each EU Member State has an official liaison agency that coordinates the collection and processing of the FADN. In Italy, data collection and maintenance are conducted by the Council for Research in Agriculture and Agricultural Economic Analysis (CREA), which manages the processing and data collection of the survey. The Italian FADN provides data to the EU Commission, as mandated by the regulations, as well as to a wide range of stakeholders, including public institutions and universities. Furthermore, the Italian FADN collects data and information far beyond the regulatory obligation (approximately 2500 variables compared to around 1000 mandated by the regulations).
A distinctive feature of the Italian FADN lies in the computation of the gross margin (GM), which reflects the profitability of each farm’s production activities, encompassing both crops and livestock. This is derived by subtracting the variable costs (VCs) incurred in production from the total gross output value (TGO). Variable costs, spanning specific costs (SCs), general costs, and additional expenses (AEs), are linked to the procurement of fertilizers, soil improvers, defense products, seeds, and seedlings (or other propagation materials), contracting, irrigation water consumption, insurance, and certifications.
Concerning crops specifically, SCs incorporate expenditures on fertilizers, soil improvers, defense products, seeds, and seedlings (or other propagation materials), contracting, irrigation water consumption, insurance, and certifications for crops. Notably, expenses related to the reuse of farm products (such as fertilizers, manure, seeds, and other self-produced propagation materials) fall under the distinct category of farm use (FU) and are excluded from SCs.
AEs encompass the costs related to energy (fuels, electricity, and heating), marketing of company products (materials for marketing, transport, and intermediation), acquisition of other technical means (materials for protection and conservation, poles and other support elements, substrates, and soil), and telephone usage.
Within the context of Italy, several studies have employed the FADN to analyze productivity and its environmental implications [31,32]. Additionally, it has been employed to assess the impact of rural development policies and programs [33,34,35,36], with a specific focus on organic farming [37,38,39]. Other studies have explored agricultural sustainability [40,41,42,43], delved into on-farm diversification and multifunctionality [44,45,46,47,48], compared technical efficiency between organic and conventional farming practices [49,50,51], and investigated the profitability of farms, both broadly and when considering distinct farming practices or specific production processes [52,53,54,55,56,57].
2.2. The Statistical Analysis: The Dataset and Variables Used
The Italian FADN classification of crops comprises 47 plant types, which can be attributed to the following three groups (see Table A2 in Appendix A):
- Aromatic plants;
- Officinal and medicinal plants;
- Sugar and other industrial plants.
This classification does not specify the botanical names of the species, which can result in a lack of strict correspondence between crops and the MAPs. Therefore, a single crop may include multiple species. Furthermore, the number of observations available in the Italian FADN database varies considerably over time. Consequently, crops with fewer than five observations per year were excluded from the subsequent analyses.
The analysis of crop profitability was performed using gross margin data associated with the species from the three groups mentioned above. In total, 623 observations were available for 30 different species, along with the “Other aromatic, officinal, and medicinal plants” group, during the period from 2015 to 2020 (see Table A3 in Appendix A).
Within the constraints of a minimum requirement of five observations to adhere to data protection and privacy policies, the analysis of gross margins has concentrated on a specific group of species: saffron, rosemary, lavender, oregano, and sage, alongside the species grouped in the ‘not elsewhere classified’ category under the label of ‘other aromatic, officinal, and medicinal plants’.
In the Italian FADN sample collected from 2015 to 2020, 253 farms were identified for integrating MAPs in their crop systems. However, the mere presence of MAPs on a farm does not guarantee a significant contribution to the overall economic results. The cultivation of MAPs is typically integrated into complex crop systems and is less commonly practiced exclusively. This characteristic is evident in both the reference literature [3,58,59,60] and FADN data. Based on the initial analysis of the data, it has been found that around 66% of the chosen farms have a low degree of specialization, meaning that less than 15% of their Utilized Agricultural Area (UAA) is dedicated to cultivating MAPs. Additionally, it was observed that the number of farms cultivating MAPs decreased as their degree of specialization increased. Thus, it is essential to pinpoint the companies that possess the relevant characteristics required for this study.
As demonstrated by ISMEA (2013), a significant relationship exists between a farm’s UAA and the degree of specialization. Consequently, the identified farms were categorized into three classes of UAA (small, <10 ha; medium, 10–50 ha; large, >50 ha) and three classes of specialization, which were determined based on the percentage ratio between the area cultivated with MAPs and the farm’s total UAA (low, <13.4%; medium, 13.4–30%; high, >30%).
The contingency table, built to highlight the relationship between the two categorical variables under consideration, displays frequencies by UAA and specialization class (Table 2).

Table 2.
Contingency table by class of UAA and specialization (own elaboration on FADN data).
The difference between the observed frequencies in the sample of farms with MAPs and the corresponding expected frequencies highlights a notably strong positive relationship between the two variables for three specific combinations that we have identified as farm profiles for further profitability analysis:
- Farms with less than 10 ha of UAA and a degree of specialization higher than 30% (small, highly specialized farms).
- Farms with UAA ranging from 10 to 50 ha and a degree of specialization between 13.4% and 30% (medium-sized farms with a medium degree of specialization).
- Farms with 50 ha of UAA or more and a degree of specialization lower than 13.4% (large farms with low specialization).
The values of the differences between the observed and expected frequencies are indicated in Table 3 and graphically represented in Figure 3.

Table 3.
Incidence of expenditure items on variable costs of crops (years 2015–2020, values in %) (source: own elaboration on FADN data).
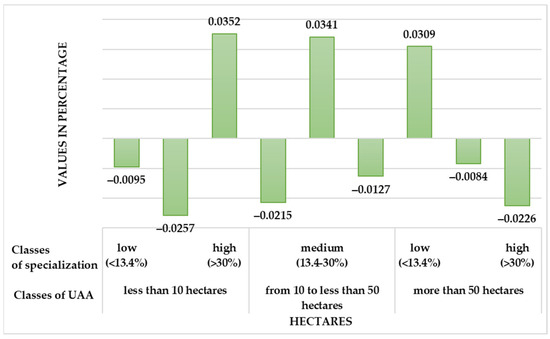
Figure 3.
Difference between the observed frequencies in the sample of farms with MAPs and the relative expected frequencies (source: own elaboration of FADN data).
These profiles allow for a comprehensive analysis of the economic impacts of MAP cultivation on various types of agricultural operations. Understanding these profiles can help policymakers and researchers develop targeted strategies to support and promote sustainable agricultural practices in each category.
The Profitability Indexes Used
To evaluate the company’s profitability, the analysis focused on the following indices:
Farm Net Income (FNI) per ha of UAA (1) is an index of the net land profitability given by the ratio between net income (NI) and UAA, which measures the value of the net income generated by one hectare of UAA. FNI corresponds to the overall economic result of the farm, which includes, in addition to costs and revenues originating from production processes and services related to agricultural activities (the so-called area of characteristic management), costs and revenues originating from activities not typically considered agricultural (extra-characteristic management: financial and extraordinary management, along with public subsidies for rural development). The index measures the farms’ capability to remunerate all productive factors used.
Index (2), FNI per work unit, given by the ratio between the NI and work units (AWUs), measures the net profitability of the company’s work, that is the value of the NI that remains available for each AWU. One AWU is equal to 2200 h of family work or 1800 h of dependent work.
3. Results and Discussion
3.1. The Link to Related Activities in Diversified Agricultural Holdings
In the FADN sample, most of the MAPs are involved in mixed production systems. Out of the selected farms, over 75% belong to only five types of farming (TFs), with the “Various field crops combined” TF having the highest representation at 52.7% (Figure 4). Regarding small, highly specialized farms and medium-sized farms, with a moderate degree of specialization, the prevalence of the most represented TF increased significantly, exceeding 80%. Conversely, it decreased for large farms with low specialization (61%), where only five TFs have limited representation: “Permanent crops and grazing livestock combined”, “Specialist cereals (other than rice), oilseeds and protein crops”, “Field crops and vineyards combined”, and “Specialist quality wine” (each accounting for approximately 5–6% of the total representation).
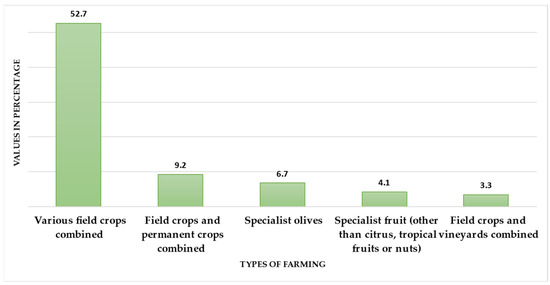
Figure 4.
Distribution of companies observed by TF (years 2015–2020, values in%) (source: own elaboration on FADN data).
Based on the available data, the first piece of evidence is the complementary function of MAPs within production systems, which should be considered as part of business strategies aimed at diversifying the farm’s offer [6,14,61]. The proof of this is that MAP crops are frequently associated with more evolved business models oriented towards multifunctionality. Indeed, the comparison between the selected farms and the rest of the FADN sample shows that the frequency of farms that practice agriculture-related activities (Figure 5) is decidedly higher when there are cultivations of MAPs (27% versus the 16% found in the rest of the FADN sample). Even when considering agritourism alone, the difference is evident (9% versus 4%), but it is even more marked in the case of companies that rely on direct sales (25% versus 12%).
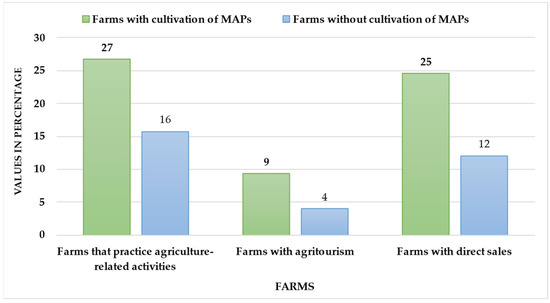
Figure 5.
Farms that practice agriculture-related activities with and without the cultivation of medicinal and aromatic plants (2015–2020, values in %) (source: own elaboration on FADN data).
In addition, the analysis of the incidence of revenues from connected activities on total company revenues shows that the differences mainly concern revenues from agriculture-related activities (7% versus 5%) and from agritourism (about 3% versus 1%). Moreover, it is particularly noteworthy that the data regarding the value of production sold through direct channels reveal that, for companies involved in the cultivation of MAPs, this represents 13% of their gross marketable production. This figure is more than twice the corresponding percentage for other companies, which is 5%.
Regarding economic size, 45% of the companies belong to class III, which represents the smallest category (with a company’s standard production value ranging from EUR 8000 to 25,000), whereas 27% fall into class VI (with a company’s standard production value between EUR 100,000 and 500,000). This confirms that the sector is primarily composed of small- and medium-sized companies.
It is worth noting, however, that within the three identified company profiles, economic size tends to shift towards higher classes (Figure 6). This occurs not only with the increase in the UAA, but also because, evidently, within TFs and with increasing levels of specialization, MAPs with higher average unit values of standard production become more prominent.
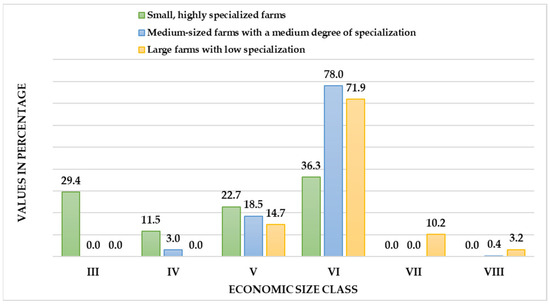
Figure 6.
Distribution of observed companies by economic size class and farm profile (2015–2020, values in %) (source: elaboration of FADN data).
3.2. Profitability Analysis for Some Species
Concerning the FNI of the land (Figure 7), the best results were found in small, highly specialized farms (about EUR 4100 per ha). In comparison, they were considerably reduced as the UAA increased. The degree of specialization decreased (EUR 1200 and 800 per ha, respectively, in medium-sized farms with a medium degree of specialization and in large ones with a low degree of specialization).
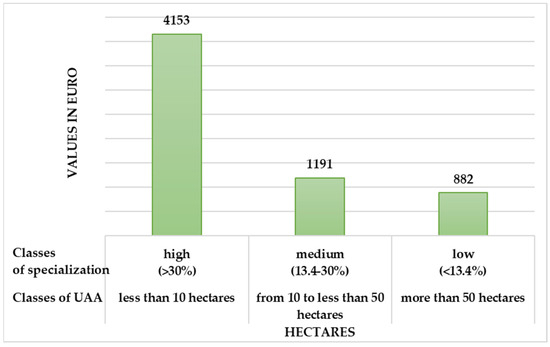
Figure 7.
FNI per hectare of UAA by farm size (years 2015–2020, values in EUR per hectare) (source: own elaboration on FADN data).
On the contrary, it is the largest and least specialized companies that show the best performances in terms of the FNI per worker unit (Figure 8). The values of the index increase as the cultivated area increases and the degree of specialization decreases, probably as a result of greater efficiency in the use of the labor factor connected to economies of scale: it goes from just over EUR 10,000 per work unit in small, highly specialized companies to around EUR 30,000 per work unit in medium-sized farms with a medium degree of specialization and almost EUR 90,000 per work unit in large farms with low specialization.
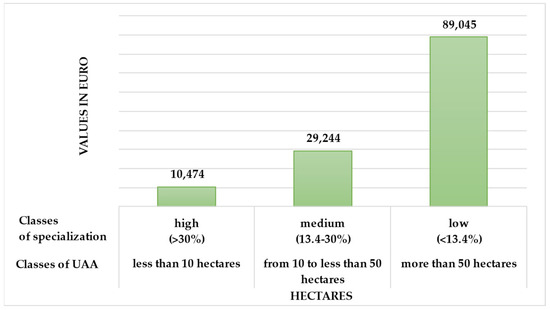
Figure 8.
FNI per worker unit by farm size (years 2015–2020, values in EUR per hectare) (source: elaboration of FADN data).
The examination of the profitability of the individual production processes focused on those species most represented in the sample: saffron, rosemary, lavender, oregano, sage, and the group “other aromatic, officinal, and medicinal plants”.
The values of the profitability of the farm’s production activities are expressed in terms of gross margin (GM), given by the difference between the value of total gross output (TGO) and the costs incurred for production, the variable costs (VCs), in turn, attributable to specific expenses (SEs), other expenses (OEs), and farm use (FU).
The examination of production values and crop costs yields a rather clear picture of the most profitable species within the Italian FADN sample (Figure 9). In particular, the TGO and the GM show the best performances in the case of saffron (66,200 EUR/hectare and 57,600 EUR/hectare, respectively), echoed by rosemary and sage with values equal to less than half of those achieved by saffron and, precisely, 27,500 EUR/hectare of TGO and 22,000 EUR/hectare of GM for rosemary and 23,500 EUR/hectare of TGO and 18,800 EUR/hectare of GM for sage. The results of the cultivation of oregano and those relating to the group “other aromatic, officinal, and medicinal plants” were decidedly more contained.
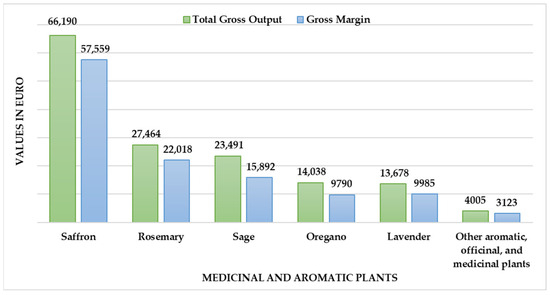
Figure 9.
TGO and GM values (years 2015–2020, values in EUR per hectare) (source: own elaboration on FADN data).
Although in absolute terms the VCs associated with saffron (about 8600 EUR/hectare) exceed those of the other crops, in relative terms, compared to the value of the TGO (13%), they are the lowest (Figure 10). It follows that the production process, which manages to retain 87% of the production value, appears to be the most efficient one. This is followed by the cultivation of rosemary, the GM of which equals 80% of the TGO, while in the other cases, this share settles on more modest values, falling into the range of 68–78%.
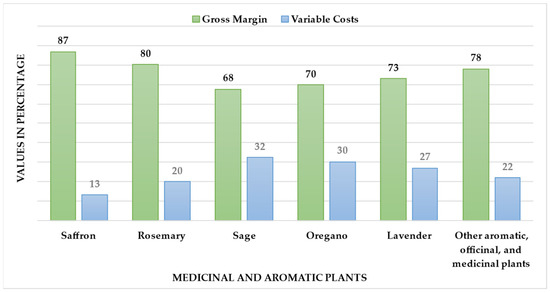
Figure 10.
Incidence of GM and VCs on TGO (years 2015–2020, values in%) (source: own elaboration on FADN data).
Analyzing the incidence of the single cost items on the total VCs (Table 3), it can be observed that for saffron, the higher cost concerns propagation (expenditure for “Seeds and Seedlings”), which in this specific case refers to the purchase of bulbs, which is equal to 50% of VCs.
The costs of fertilization are particularly significant for various crops, sage and rosemary in particular, although they do not always represent the prevailing share. For some of the production processes examined, marketing costs also play a significant role: for oregano, for example, they represent the first cost item (40% of VCs), but the incidence remains significant in the case of sage (21%) and rosemary (20%).
In the cultivation set under investigation, lavender constitutes an exception since the most important part of the expenses concerns the item “Other costs” (48%), which includes the purchase of other technical means (materials for protection and storage, poles and other support materials, substrates, and soil) and telephone charges.
Farm work understood as the contribution of manpower and use of machines is a particularly important factor, especially, as is known, for the cultivation of saffron, which absorbs a considerable amount of manpower for harvesting operations [62].
Based on the available data (Table 4), it is possible to show that for this cultivation, approximately 2800 h of manpower per ha is required, in addition to 250 h of machine work per ha, for a total cost of approximately EUR 37,000 per ha. The operating margin (OM), given by the difference between the GM and the farm labor cost, amounts to just over EUR 20,000 per ha, equal to 31% of the TGO (Figure 11).

Table 4.
Labor requirement and OM of crops (years 2015–2020, values in EUR per hectare and number of hours per hectare) (source: own elaboration on FADN data).
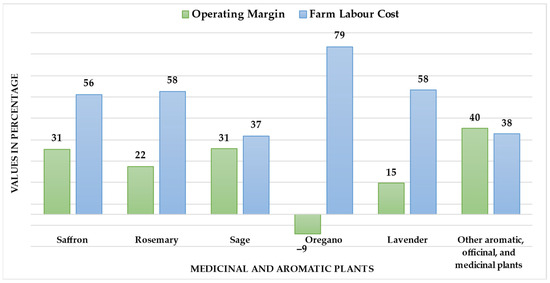
Figure 11.
Incidence of OM and farm labor costs on TGO (years 2015–2020, values in%) (source: own elaboration on FADN data).
Despite oregano requiring notably fewer hours of labor and machine usage compared to other crops, the cost of labor has a considerable impact in relative terms, accounting for just under 80% of TGO. It stands out among the crops examined as the only case where OM is negative.
In terms of effectiveness, saffron consistently yields the best results, even when evaluating the OM. However, when considering the overall share of TGO, the group of other aromatic plants claims the largest percentage at 40%, while saffron and sage share second place, each accounting for 31%.
4. Conclusions
In the global market, where countries like India and China are MAP major players with a significant share of the offer, Italy finds itself as a net importer. To balance national trade, it is essential to increase and promote domestic production.
MAPs offer farmers opportunities to increase their income, diversify their production, and enhance marginal lands. They can also serve as alternatives to traditional crops that have been affected by the recent economic crisis and will be increasingly impacted by climate change. Climate change will significantly influence cultivation choices in the coming years, leading to a redistribution of geographical areas suitable for various species. Many medicinal and aromatic plants are known for their high resilience and ability to thrive in harsh and arid climates, as seen in the case of coriander or saffron, for example, which can adapt to harsh and arid climates and even saline soils, offering good margins. However, recent studies have produced conflicting results regarding the impact of climate change on the quality and yield of the MAPs studied. For instance, the levels of phenolic compounds and their different classes were positively affected by an increase in carbon dioxide and a decrease in precipitation. However, they were inhibited by an increase in nitrogen deposition. Although there was an overall positive effect on phenolic content, an increase in temperature was found to largely suppress total flavonoid levels. The diversity of species within the MAPs family, their complex interactions with the environment, and the abundance of biologically active secondary metabolites that define their value make it challenging to establish general rules regarding their behavior in response to climate change. Objective analysis is hindered by the scarcity of studies and meta-analyses on the topic. The choice of species to be cultivated should only be made after a careful analysis of the soil and climatic conditions of the chosen cultivation area and the final use of the botanical product. This will help to make the most of even adverse environmental conditions to obtain a high-quality end product, for example, products with a high phenolic compound content.
However, it is important to bear in mind that this is a complex market. Although Italy has experienced growth in recent years, production volumes remain limited due to factors such as insufficient technical knowledge, high production costs (including energy and labor), and a lack of internal supply demand assets based on knowledge of the final characteristics of the raw materials required by the processing industry. In addition, there is significant variability in production quality, making standardization challenging when creating botanical products tailored to the needs of modern consumers, particularly in personalized healthcare and skincare. To tackle future challenges, it is essential to grow knowledge, digitize farms to reduce management costs, effectively address climate change, and adopt a well-planned growth strategy supported by institutions with targeted accompanying measures. This will facilitate the development of the entire supply chain, ensuring standardized and continuous product supply while guaranteeing quality. Due to its nature, this sector lends itself to the adoption of circular economy models where every part of the plant can be appropriately enhanced, guaranteeing farm income diversification and environmental protection. Similarly, innovative cultivation systems, such as hydroponic cultivation, can provide a sustainable approach to cultivating MAPs. This method can also result in a higher content of secondary metabolites in some species compared to wild and soil-grown plants, which can increase production value.
Finally, we would like to point out that the data used in this work have some limitations from a statistical point of view. This is mainly due to the way the information is managed and updated in the AGEA farm file. For example, the dossier includes data from farms that are no longer active, and there are complexities in the product matrix used in the information systems. In many cases, producers do not declare or update all the various species because the areas are not eligible for public subsidies unless they are agri-environmental premiums or new plantings co-financed by EU aid. This is especially true when it comes to new production areas.
The work highlighted some reasons why only certain crops were examined for farm economic performance indicators. This is mainly due to the large number of cases available; nevertheless, the analysis conducted can serve as a useful reference for studying the profitability of farms dedicated to these crops. However, it is important to exercise some caution in extending the results to the universe of MAPs cultivation and to note that this statement should not be interpreted in opposition to the statistical representativeness of the FADN, whose generalizability of the results to the population is ensured when they refer to the entire sample of farms falling within the predefined field of observation.
Finally, we aim to conduct additional studies and investigate the feasibility of selecting a more constrained yet homogeneous sample, consistent throughout the observed period, in order to undertake a panel data or multilevel analysis.
Author Contributions
Conceptualization, D.M., F.L. and K.C.; methodology, F.L.; software, D.M.; validation, D.M. and F.L.; data curation, D.M.; writing—original draft preparation, D.M., F.L. and K.C.; writing—review and editing, K.C.; supervision, F.L. All authors have read and agreed to the published version of the manuscript.
Funding
This research received no external funding.
Institutional Review Board Statement
Not Applicable.
Data Availability Statement
Restrictions apply to the availability of these data. The data were obtained from the Council for Agricultural Research and Economics (CREA) and are accessible at the URL https://bancadatirica.crea.gov.it/Account/Login.aspx (accessed on 9 March 2023) with the permission of CREA.
Conflicts of Interest
The authors declare no conflicts of interest.
Appendix A

Table A1.
The most important species in Italy by Utilized Agricultural Area in 2019 (source: own elaboration on AGEA data).
Table A1.
The most important species in Italy by Utilized Agricultural Area in 2019 (source: own elaboration on AGEA data).
| Species | 2019 | % of Total |
|---|---|---|
| Cilantro | 11,188.4 | 28.7 |
| Eucalyptus | 5044.4 | 12.9 |
| Carob tree | 4221.4 | 10.8 |
| Flav | 3356.6 | 8.6 |
| Fenugreek | 3204.1 | 8.2 |
| Garlic | 1885.8 | 4.8 |
| Bergamot | 1557.9 | 4 |
| Parsley | 1007.4 | 2.6 |
| Basil | 979.1 | 2.5 |
| Thistle | 879.3 | 2.3 |
| Chamomile | 629.9 | 1.6 |
| Lavender | 610.8 | 1.6 |
| Oregano | 529.4 | 1.4 |
| Safflower | 508.7 | 1.3 |
| Mint | 362.2 | 0.9 |
| Horseradish | 334.8 | 0.9 |
| Rosemary | 322.1 | 0.8 |
| Melilot | 279.3 | 0.7 |
| Saffron | 249.8 | 0.6 |
| Valerian | 228,6 | 0.6 |
| Passion flower | 186.0 | 0,5 |
| Sage | 160.4 | 0.4 |
| Gorse | 158,9 | 0.4 |
| Helichrysum | 112.5 | 0.3 |
| Lemon balm | 111.8 | 0.3 |
| Nettle | 108.2 | 0.3 |
| Chives | 101.8 | 0.3 |
| Thyme | 85.9 | 0.2 |
| Dandelion | 75.2 | 0.2 |
| Althea | 71.2 | 0.2 |
| Mallow | 67.0 | 0.2 |
| Borage | 58.8 | 0.2 |
| Liquorice | 50.8 | 0.1 |
| Hawthorn | 42.0 | 0.1 |
| Absinthe | 37.5 | 0.1 |
| Rose hip | 36.2 | 0.1 |
| Aloe | 30.5 | 0.1 |
| Peppermint | 23.9 | 0.1 |
| Marigold | 16.8 | 0 |
| Laurel | 16.3 | 0 |
| Summer savory | 11.7 | 0 |
| Hyssop | 11.2 | 0 |
| Mugwort | 10.2 | 0 |
| Hypericum | 9.8 | 0 |
| Tilia | 6.8 | 0 |
| Elder | 5.6 | 0 |
| Juniper | 4.1 | 0 |
| Burdock | 3.7 | 0 |
| Rhubarb | 2.2 | 0 |
| Angelica | 0.7 | 0 |
| Witch-hazel | 0.2 | 0 |
| Gentian | 0.1 | 0 |
| Total | 38,998.3 | 100 |

Table A2.
Type of farming groupings adopted in FADN (source: Commission Regulation (EC) No. 1242/2008 of 8 December 2008).
Table A2.
Type of farming groupings adopted in FADN (source: Commission Regulation (EC) No. 1242/2008 of 8 December 2008).
| General Types of Farming | Principal Types of Farming | Particular Types of Farming |
|---|---|---|
| Specialist field crops | Specialist cereals, oilseeds, and protein crops | Specialist cereals (other than rice), oilseeds, and protein crops |
| Specialist rice | ||
| Cereals, oilseeds, protein crops, and rice combined | ||
| General field cropping | Specialist root crops | |
| Cereals, oilseeds, protein crops, and root crops combined | ||
| Specialist field vegetables | ||
| Specialist tobacco | ||
| Specialist cotton | ||
| Various field crops combined | ||
| Specialist horticulture | Specialist horticulture indoor | Specialist vegetables indoor |
| Specialist flowers and ornamentals indoor | ||
| Mixed horticulture indoor specialist | ||
| Specialist horticulture outdoor | Specialist vegetables outdoor | |
| Specialist flowers and ornamentals outdoor | ||
| Mixed horticulture outdoor specialist | ||
| Other horticulture | Specialist mushrooms | |
| Specialist nurseries | ||
| Various horticulture | ||
| Specialist permanent crops | Specialist vineyards | Specialist quality wine |
| Specialist wine other than quality wine | ||
| Specialist table grapes | ||
| Other vineyards | ||
| Specialist fruit and citrus fruit | Specialist fruit (other than citrus, tropical and subtropical fruits, and nuts) | |
| Specialist citrus fruit | ||
| Specialist nuts | ||
| Specialist tropical and subtropical fruits | ||
| Specialist fruit, citrus, tropical and subtropical fruits, and nuts: mixed production | ||
| Specialist olives | Specialist olives | |
| Various permanent crops combined | Various permanent crops combined | |
| Specialist grazing livestock | Specialist dairying | Specialist dairying |
| Specialist cattle—rearing and fattening | Specialist cattle—rearing and fattening | |
| Cattle—dairying, rearing and fattening combined | Cattle—dairying, rearing, and fattening combined | |
| Sheep, goats, and other grazing livestock | Specialist sheep | |
| Sheep and cattle combined | ||
| Specialist goats | ||
| Various grazing livestock | ||
| Specialist granivores | Specialist pigs | Specialist pig rearing |
| Specialist pig fattening | ||
| Pig rearing and fattening combined | ||
| Specialist poultry | Specialist laying hens | |
| Specialist poultry meat | ||
| Laying hens and poultry meat combined | ||
| Various granivores combined | Various granivores combined | |
| Mixed cropping | Mixed cropping | Horticulture and permanent crops combined |
| Field crops and horticulture combined | ||
| Field crops and vineyards combined | ||
| Field crops and permanent crops combined | ||
| Mixed cropping, mainly field crops | ||
| Other mixed cropping | ||
| Mixed livestock | Mixed livestock, mainly grazing livestock | Mixed livestock, mainly dairying |
| Mixed livestock, mainly non-dairying grazing livestock | ||
| Mixed livestock, mainly granivores | Mixed livestock: granivores and dairying combined | |
| Mixed livestock: granivores and non-dairying grazing livestock | ||
| Mixed crops—livestock | Field crops—grazing livestock combined | Field crops combined with dairying |
| Dairying combined with field crops | ||
| Field crops combined with non-dairying grazing livestock | ||
| Non-dairying grazing livestock combined with field crops | ||
| Various crops and livestock combined | Field crops and granivores combined | |
| Permanent crops and grazing livestock combined | ||
| Apiculture | ||
| Various mixed crops and livestock |

Table A3.
MAPs included in the Italian FADN classification (source: own elaboration on FADN data).
Table A3.
MAPs included in the Italian FADN classification (source: own elaboration on FADN data).
| MAP Common Name | Classification |
|---|---|
| Absinthe | Aromatic plants |
| Angelica | Officinal and medicinal plants |
| Anise | Aromatic plants |
| Arnica | Officinal and medicinal plants |
| Arugula | Aromatic plants |
| Belladonna | Officinal and medicinal plants |
| Burdock | Officinal and medicinal plants |
| Caper | Aromatic plants |
| Chamomile | Officinal and medicinal plants |
| Chervil | Officinal and medicinal plants |
| Chicory coffee | Officinal and medicinal plants |
| Clary sage | Officinal and medicinal plants |
| Colchicum | Officinal and medicinal plants |
| Cress | Aromatic plants |
| Cumin | Aromatic plants |
| Dill | Aromatic plants |
| Ergot | Officinal and medicinal plants |
| Foxglove | Officinal and medicinal plants |
| Gentian | Officinal and medicinal plants |
| Horseradish | Aromatic plants |
| Hypericum | Officinal and medicinal plants |
| Hyssop | Officinal and medicinal plants |
| Iris | Officinal and medicinal plants |
| Ivy | Officinal and medicinal plants |
| Jasmin | Officinal and medicinal plants |
| Lavender | Officinal and medicinal plants |
| Licorice | Officinal and medicinal plants |
| Lily of the valley | Officinal and medicinal plants |
| Marigold | Officinal and medicinal plants |
| Marjoram | Aromatic plants |
| Mauve | Officinal and medicinal plants |
| Melissa | Officinal and medicinal plants |
| Mint | Aromatic plants |
| Oregano | Aromatic plants |
| Passionflower | Officinal and medicinal plants |
| Pyrethrum | Officinal and medicinal plants |
| Rhubarb | Aromatic plants |
| Rosmary | Aromatic plants |
| Saffron | Aromatic plants |
| Sage | Aromatic plants |
| Tarragon | Aromatic plants |
| Thistle | Officinal and medicinal plants |
| Thyme | Aromatic plants |
| Valerian | Aromatic plants |
| Witch hazel | Officinal and medicinal plants |
| Yarrow | Officinal and medicinal plants |
| Other aromatic, officinal, and medicinal plants | Sugar and other industrial plants * |
*: “sugar and other industrial plants” group encompasses: sugar beet, hop, broomcorn, green heather, sweet sorghum, tobacco, other industrial plants, other aromatic, officinal and medicinal plants. Of those, just the category “Other aromatic, officinal and medicinal plants” has been included, because the other crops are characterized by a prevalent use different from the aromatic, officinal or medicinal ones. Furthermore, excluding sugar beet and tobacco which are not relevant for the analysis, for the other crops the number of available observations is rather limited.
References
- Lubbe, A.; Verpoorte, R. Cultivation of Medicinal and Aromatic Plants for Specialty Industrial Materials. Ind. Crops Prod. 2011, 34, 785–801. [Google Scholar] [CrossRef]
- Ramazzina, I.; Macchioni, V.; Carbone, K. Antioxidant and Pro-Oxidant Phytochemicals in Ultrasound and Microwave Assisted Extracts from Hop Cones: A Statistical Modelling Approach. Food Funct. 2022, 13, 9589–9601. [Google Scholar] [CrossRef] [PubMed]
- Taghouti, I.; Cristobal, R.; Brenko, A.; Stara, K.; Markos, N.; Chapelet, B.; Hamrouni, L.; Buršić, D.; Bonet, J.-A.A. The Market Evolution of Medicinal and Aromatic Plants: A Global Supply Chain Analysis and an Application of the Delphi Method in the Mediterranean Area. Forests 2022, 13, 808. [Google Scholar] [CrossRef]
- Futuremarketinsights.com. Available online: https://www.futuremarketinsights.com/reports/herbal-medicinal-products-market (accessed on 16 January 2024).
- Parvin, S.; Reza, A.; Das, S.; Main, M.; Miah, U.; Karim, S. Potential Role and International Trade of Medicinal and Aromatic Plants in the World. Eur. J. Agric. Food Sci. 2023, 5, 89–99. [Google Scholar] [CrossRef]
- Argyropoulos, D.; Carmody, K.; Cogliandro, A.; Cortegano, M.; Jongh, W.; Paoli, A.; Fernández-Moya, J.; Cavaleiro, C.; Frémondière, G.; Grigoriadou, K.; et al. EIP-AGRI Focus Group Plant-Based Medicinal and Cosmetic Products: Final Report; EIP Agri: Bruxelles, Belgium, 2020. [Google Scholar]
- Di Vita, G.; Spina, D.; De Cianni, R.; Carbone, R.; D’Amico, M.; Zanchini, R. Enhancing the Extended Value Chain of the Aromatic Plant Sector in Italy: A Multiple Correspondence Analysis Based on Stakeholders’ Opinions. Agric. Food Econ. 2023, 11, 15. [Google Scholar] [CrossRef]
- Bernard-Mongin, C.; Hoxha, V.; Lerin, F. From Total State to Anarchic Market: Management of Medicinal and Aromatic Plants in Albania. Reg. Environ. Chang. 2021, 21, 5. [Google Scholar] [CrossRef]
- Camejo-Rodrigues, J.; Ascensão, L.; Bonet, M.À.; Vallès, J. An Ethnobotanical Study of Medicinal and Aromatic Plants in the Natural Park of “Serra de São Mamede” (Portugal). J. Ethnopharmacol. 2003, 89, 199–209. [Google Scholar] [CrossRef]
- Bourgou, S.; Jilani, I.B.H.; Karous, O.; Megdiche-Ksouri, W.; Ghrabi-Gammar, Z.; Libiad, M.; Khabbach, A.; El Haissoufi, M.; Lamchouri, F.; Greveniotis, V.; et al. Medicinal-Cosmetic Potential of the Local Endemic Plants of Crete (Greece), Northern Morocco and Tunisia: Priorities for Conservation and Sustainable Exploitation of Neglected and Underutilized Phytogenetic Resources. Biology 2021, 10, 1344. [Google Scholar] [CrossRef]
- Garreta, R.; Morisson, B. La Cueillette Des Plantes Sauvages En Pyrénées. Phase 2. Conservatoire Botanique National des Pyrénées et de Midi-Pyrénées: Midi-Pyrénées, France, 2014. [Google Scholar]
- Garreta, R.; Morisson, B. La Cueillette Des Plantes Sauvages En Pyrénées et Midi-Pyrénées—Phase 1: État Des Lieux (2010–2011); Conservatoire Botanique National des Pyrénées et de Midi-Pyrénées: Chavaniac-Lafayette, France, 2011. [Google Scholar]
- Spina, D.; Barbieri, C.; Carbone, R.; Hamam, M.; D’Amico, M.; Di Vita, G. Market Trends of Medicinal and Aromatic Plants in Italy: Future Scenarios Based on the Delphi Method. Agronomy 2023, 13, 1703. [Google Scholar] [CrossRef]
- Carruba, A. Sustainability and Multifunctionality in Mediterranean Cropping Systems: The Role of Medicinal and Aromatic Plants. In Proceedings of the 3rd IRT International Scientific Conference-Integrated Relational Tourism-Territories and Development in the Mediterranean Area, Helwan, Egypt, 24–26 October 2009; Volume 2. [Google Scholar]
- Carrubba, A.; Catalano, C.; Bontempo, R. Multifunctional Role of Medicinal and Aromatic Plants: Perspectives and Constraints. Ital. J. Agron. 2008, 3, 438–440. [Google Scholar]
- Bartolucci, F.; Galasso, G.; Peruzzi, L.; Conti, F. Report 2021 on Plant Biodiversity in Italy: Native and Alien Vascular Flora. Nat. Hist. Sci. 2022, 10, 41–50. [Google Scholar] [CrossRef]
- Marcelino, S.; Hamdane, S.; Gaspar, P.D.; Paço, A. Sustainable Agricultural Practices for the Production of Medicinal and Aromatic Plants: Evidence and Recommendations. Sustainability 2023, 15, 14095. [Google Scholar] [CrossRef]
- Brundtland, G.H. Our Common Future—Call for Action. Environ. Conserv. 1987, 14, 291–294. [Google Scholar] [CrossRef]
- World Commission on Environment and Development Our Common Future: Report of the World Commission on Environment and Development. Available online: https://sustainabledevelopment.un.org/content/documents/5987our-common-future.pdf (accessed on 10 January 2024).
- Atherton, H.R.; Li, P. Hydroponic Cultivation of Medicinal Plants—Plant Organs and Hydroponic Systems: Techniques and Trends. Horticulturae 2023, 9, 349. [Google Scholar] [CrossRef]
- World Health Organization WHO. Guidelines on Good Agricultural and Collection Practices (GACP) for Medicinal Plants; World Health Organization WHO: Geneva, Switzerland, 2003; Volume 99. [Google Scholar]
- European Herb Growers Association (EUROPAM). A Practical Implementation Guide to Good Agricultural and Wild Collection Practices (GACP); European Herb Growers Association (EUROPAM): Wien, Austria, 2016. [Google Scholar]
- European Herb Growers Association (EUROPAM). Guidelines for Good Agricultural and Wild Collection Practices for Medicinal and Aromatic Plants (GACP—MAP); European Herb Growers Association (EUROPAM): Wien, Austria, 2022. [Google Scholar]
- EMEA. Guideline on Good Agricultural and Collection Practice (GACP) for Starting Materials of Herbal Origin; EMEA: Amsterdam, The Netherlands, 2006. [Google Scholar]
- FAO. FAO Conservation Agriculture Principles; FAO: Rome, Italy, 2022. [Google Scholar]
- Paciello, M.C. Building Sustainable Agriculture for Food Security in the Euro-Mediterranean Area; Paciello, M.C., Ed.; Edizioni Nuova Cultura: Rome, Italy, 2015. [Google Scholar]
- Alrteimei, H.A.; Ash’aari, Z.H.; Muharram, F.M. Last Decade Assessment of the Impacts of Regional Climate Change on Crop Yield Variations in the Mediterranean Region. Agriculture 2022, 12, 1787. [Google Scholar] [CrossRef]
- Noto, L.V.; Cipolla, G.; Pumo, D.; Francipane, A. Climate Change in the Mediterranean Basin (Part II): A Review of Challenges and Uncertainties in Climate Change Modeling and Impact Analyses. Water Resour. Manag. 2023, 37, 2307–2323. [Google Scholar] [CrossRef]
- Farm Accountancy Data Network. Available online: https://agridata.ec.europa.eu/extensions/FarmEconomyFocus/FarmEconomyFocus.html (accessed on 10 October 2023).
- Bassi, I.; Iseppi, L.; Nassivera, F.; Peccol, E.; Cisilino, F.; Bassi, I.; Iseppi, L.; Nassivera, F.; Peccol, E.; Cisilino, F. Alpine Agriculture Today: Evidence from the Italian Alps. Qual. Success 2020, 21, 122–127. [Google Scholar]
- Coderoni, S.; Esposti, R.; Baldoni, E. The Productivity and Environment Nexus with Farm-Level Data: The Case of Carbon Footprint Applied FADN to Italian Farms. In Proceedings of the ICAS VII Seventh International Conference on Agricultural Statistics, Rome, Italy, 26–28 October 2016. [Google Scholar]
- Bazzani, G.M.; Vitali, G.; Cardillo, C.; Canavari, M. Using FADN Data to Estimate CO2 Abatement Costs from Italian Arable Crops. Sustainability 2021, 13, 5148. [Google Scholar] [CrossRef]
- Cisilino, F.; Bassi, I. I Dati RICA per La Valutazione Di Piani e Programmi Di Sviluppo Rurale: Il Caso Del PSR Del Friuli Venezia Giulia 2000–2006—Analisi Regionali; Istituto Nazionale di Economia Agraria: Rome, Italy, 2010. [Google Scholar]
- Cagliero, R.; Cisilino, F.; Scardera, A. Evaluating Rural Development Programmes Using FADN Data; Ministry of Agriculture and Forestry: Rome, Italy, 2011. [Google Scholar]
- Cagliero, R.; Arzeni, A.; Cisilino, F.; Montelelone, A.; Borsotto, P. Ten Years after: Diffusion, Criticism and Potential Improvements in the Use of FADN for Rural Development Assessment in Italy. Econ. Agro-Aliment. 2022, 23, 1–24. [Google Scholar] [CrossRef]
- Cisilino, F.; Giampaolo, A.; Licciardo, F.; Orlando, M.; Tarangioli, S. The Tuscany Integrated Supply Chain Projects 2014–2022: A New Path to Support the Agri-Food Industry. Land 2023, 12, 1230. [Google Scholar] [CrossRef]
- Arfini, F.; Donati, M. Organic Production and the Capacity to Respond to Market Signals and Policies: An Empirical Analysis of a Sample of FADN Farms. Agroecol. Sustain. Food Syst. 2013, 37, 149–171. [Google Scholar] [CrossRef]
- Cisilino, F.; Bodini, A.; Zanoli, A. Rural Development Programs’ Impact on Environment: An Ex-Post Evaluation of Organic Faming. Land Use Policy 2019, 85, 454–462. [Google Scholar] [CrossRef]
- Cisilino, F.; Cesaro, L. Organic versus Conventional Farming: A Marketing Survey on Wine Production. In The Crisis of Food Brands; Hingley, M.K., Ed.; Routledge: Abingdon, UK, 2009; p. 15. ISBN 9781315615134. [Google Scholar]
- Kelly, E.; Latruffe, L.; Desjeux, Y.; Ryan, M.; Uthes, S.; Diazabakana, A.; Dillon, E.; Finn, J. Sustainability Indicators for Improved Assessment of the Effects of Agricultural Policy across the EU: Is FADN the Answer? Ecol. Indic. 2018, 89, 903–911. [Google Scholar] [CrossRef]
- Cardillo, C.; Cimino, O. Small Farms in Italy: What Is Their Impact on the Sustainability of Rural Areas? Land 2022, 11, 2142. [Google Scholar] [CrossRef]
- Cardillo, C.; Di Fonzo, A.; Liberati, C. The Farm’s Orientation towards Sustainability: An Assessment Using FADN Data in Italy. Land 2023, 12, 301. [Google Scholar] [CrossRef]
- Turchetti, L.; Gastaldin, N.; Marongiu, S. Enhancing the Italian FADN for Sustainability Assessment: The State of Art and Perspectives. Econ. Agro-Aliment. Food Econ. 2021, 23, 1–21. [Google Scholar] [CrossRef]
- Cardillo, C.; Cimino, O.; De Rosa, M.; Francescone, M. The Evolution of Multifunctional Agriculture in Italy. Sustainability 2023, 15, 11403. [Google Scholar] [CrossRef]
- Bonfiglio, A.; Abitabile, C.; Henke, R. A Choice Model-Based Analysis of Diversification in Organic and Conventional Farms. Bio-Based Appl. Econ. 2022, 11, 131–146. [Google Scholar] [CrossRef]
- Forleo, M.B.; Giaccio, V.; Mastronardi, L.; Romagnoli, L. Analysing the Efficiency of Diversified Farms: Evidences from Italian FADN Data. J. Rural Stud. 2021, 82, 262–270. [Google Scholar] [CrossRef]
- Aguglia, L.; Henke, R.; Poppe, K.; Roest, A.; Salvioni, C. Diversification and Multifunctionality in Italy and the Netherlands: A Comparative Analysis. In Proceedings of the Second meeting Wye City Group Conference, FAO, Rome, Italy, 11–12 June 2009. [Google Scholar]
- Finocchio, R.; Esposti, R. Determinants of Farm Diversification and Interaction with the CAP. In Proceedings of the An Application to FADN of Marche Region (Italy), European Association of Agricultural Economists International Congress, Ghent, Belgium, 26–29 August 2008. [Google Scholar]
- Cisilino, F.; Madau, F.A.; Furesi, R.; Pulina, P.; Arru, B. Organic and Conventional Grape Growing in Italy: A Technical Efficiency Comparison Using a Parametric Approach. Wine Econ. Policy 2021, 10, 15–28. [Google Scholar] [CrossRef]
- D’Oronzio, M.A.; De Vivo, C. Organic and Conventional Farms in the Basilicata Region: A Comparison of Structural and Economic Variables Using Fadn Data. Econ. Agro-Aliment. 2021, 23, 1–17. [Google Scholar] [CrossRef]
- Raimondo, M.; Caracciolo, F.; Nazzaro, C.; Marotta, G. Organic Farming Increases the Technical Efficiency of Olive Farms in Italy. Agriculture 2021, 11, 209. [Google Scholar] [CrossRef]
- Coppola, A.; Amato, M.; Vistocco, D.; Verneau, F. Measuring the Economic Sustainability of Italian Farms Using FADN Data. Agric. Econ. 2022, 68, 327–337. [Google Scholar] [CrossRef]
- Buttinelli, R.; Cortignani, R.; Dono, G. Financial Sustainability in Italian Organic Farms: An Analysis of the Fadn Sample. Econ. Agro-Aliment. 2021, 23, 1–32. [Google Scholar] [CrossRef]
- Dono, G.; Buttinelli, R.; Cortignani, R. Financial Sustainability in Italian Farms: An Analysis of the FADN Sample. Agric. Financ. Rev. 2021, 81, 719–745. [Google Scholar] [CrossRef]
- Varia, F.; Macaluso, D.; Vaccaro, A.; Caruso, P.; Guccione, G.D. The Adoption of Landraces of Durum Wheat in Sicilian Organic Cereal Farming Analysed Using a System Dynamics Approach. Agronomy 2021, 11, 319. [Google Scholar] [CrossRef]
- Coppola, A.; Scardera, A.; Amato, M.; Verneau, F. Income Levels and Farm Economic Viability in Italian Farms: An Analysis of FADN Data. Sustainability 2020, 12, 4898. [Google Scholar] [CrossRef]
- Coppola, A.; Scardera, A.; Tosco, D. Economic Profitability and Long-Term Viability in Italian Agriculture; Polit. Politica Agric. Internazionale Int. Agric. Policy 2013, 2013, 1–38. [Google Scholar] [CrossRef]
- Un’istantanea Della Filiera e Dei Rapporti Tra i Diversi Attori; ISMEA Piante Officinali in Italia: Rome, Italy, 2013.
- Florou-Paneri, P.; Christaki, E.; Giannenas, I. Feed Additives: Aromatic Plants and Herbs in Animal Nutrition and Health; Florou-Paneri, P., Christaki, E., Giannenas, I., Eds.; Academic Press: Cambridge, MA, USA, 2019; ISBN 9780128147016. [Google Scholar]
- Nicola, S.; Scarpa, G.M. Le Piante Officinali—Vol. 1. Produzione e Prima Trasformazione; Edagricole-New Business Media: Milano, Italy, 2022; ISBN 9788850656196. [Google Scholar]
- Carbone, K.; Licciardo, F.; Tarangioli, S.; D’Oronzio, M.A.; Assirelli, A.; Manzo, A. Le Piante Officinali, Colture Alternative Da Reddito. L’informatore Agrar. 2022, 78, 51–54. [Google Scholar]
- Gresta, F.; Lombardo, M.; Siracusa, L.; Ruberto, G. Saffron, an Alternative Crop for Sustainable Agricultural Systems. A Review. Agron. Sustain. Dev. 2008, 28, 95–112. [Google Scholar] [CrossRef]
Disclaimer/Publisher’s Note: The statements, opinions and data contained in all publications are solely those of the individual author(s) and contributor(s) and not of MDPI and/or the editor(s). MDPI and/or the editor(s) disclaim responsibility for any injury to people or property resulting from any ideas, methods, instructions or products referred to in the content. |
© 2024 by the authors. Licensee MDPI, Basel, Switzerland. This article is an open access article distributed under the terms and conditions of the Creative Commons Attribution (CC BY) license (https://creativecommons.org/licenses/by/4.0/).