Article

Evaluation of Agricultural BMPs’ Impact on Water Quality and Crop Production Using SWAT+ Model

1
Department of Agricultural and Biological Engineering, University of Illinois at Urbana-Champaign, Urbana, IL 61801, USA
2
Agricultural Research Service, United States Department of Agriculture, Temple, TX 76502, USA
*
Author to whom correspondence should be addressed.
Agriculture 2023, 13(8), 1484; https://doi.org/10.3390/agriculture13081484
Submission received: 9 June 2023 / Revised: 23 July 2023 / Accepted: 24 July 2023 / Published: 26 July 2023
(This article belongs to the Special Issue Agroecosystem Modeling)

Abstract

:
Subsurface (or tile) drainage improves land productivity by enhancing soil aeration and preventing water-logged conditions. However, the continuous expansion of drained agricultural lands and reliance on synthetic fertilizer in the Midwestern United States have increasingly facilitated nitrate transport from agricultural fields to surface water bodies. Hence, there is a need to implement various agricultural best management practices (BMPs) in order to reduce the adverse water quality impacts resulting from excess nitrate, such as eutrophication and the formation of hypoxic zones. In this study, we used a SWAT+ model to assess the overall impacts on the riverine nitrate load and crop yield in the corn–soybean cropping system based on a combination of different management practices. The corn and soybean yields simulated with the model were found to be in good agreement with the observed yields for both the calibration and validation periods. The long-term simulation over a period of 30 years showed a reduction in the nitrate load of up to 32% without impacting the crop yield. The model results suggest that by reducing the current N application rate by 20% and using a 40:60 split between spring pre-plant and side-dressing N applications combined with cereal rye as a cover crop in corn–soybean rotation, one can potentially reduce nitrate losses without impacting crop yields. This study will help researchers, stakeholders, and farmers to explore and adopt alternative management practices beneficial for offsetting the environmental impacts of agricultural productions on the watershed scale.

1. Introduction

Nutrient loadings from intensively managed agricultural watersheds continue to deteriorate surface and groundwater quality globally [1]. Even if there is considerable concern about excessive nutrient loss from agricultural land and its impacts on public health and the environment, the supply and management of adequate nutrients are still challenges in ensuring crop productivity [2]. As highlighted by Breitburg et al. [1] and Lal et al. [3], sustainable agriculture practices can only be effective when their long-term implications are well understood. In other words, the rational and scientific decision should be based on an understanding of the long-term effect of the management practices and the components constituting the natural resource system [3]. Hence, many researchers are working to examine the long-term scenario with various nutrient management and environmental protection practices and to seek solutions to this issue for sustainable agriculture.
The nutrients, mainly nitrogen (N) in the form of soluble nitrate, transported from the Midwest region of the United States, where intensive row crop production is practiced, are associated with algal blooms in the Gulf of Mexico [4,5,6]. Approximately 70% of the N load delivered to the Gulf is from agricultural lands [6,7]. Efforts to reduce nitrate losses from agricultural fields remain critically important in the United States. As a result, collaborative initiatives like the Mississippi River/Gulf of Mexico Hypoxia Task Force were established to evaluate the progress and recommend short-term and long-term N reduction strategies. With the goal of reducing N losses by 15% and 45% in the short-term and long-term, the state of Illinois implemented the Illinois Nutrient Loss Reduction Strategy (Illinois NLRS), guided by the Illinois Environmental Protection Agency (EPA), Illinois Department of Agriculture, and University of Illinois [8]. The Illinois NLRS proposed several conservation management practices to mitigate N losses from agricultural lands. The various conservation management practices that are considered to influence N losses from agricultural lands include the management of N application rates, sources, placement, and timing; planting cover crops; or a combination of N management with cover crops [9,10,11,12]. The evaluation of the effectiveness of these conservation practices and their implementation is increasingly important due to changing climate and local conditions.
Several field-scale studies on N management (N application rates and timing) have shown the potential of optimizing N rates and timing to reduce N losses from agricultural lands without affecting crop yield [13,14,15,16]. These studies endorsed the concept of 4R nutrient stewardship. In this concept, 4R refers to the four fertilizer rights: the right fertilizer source, the right rate, the right time, and the right place. However, few studies have been conducted to evaluate the effectiveness of this method on the watershed scale, and the findings varied across different studies. Gowda et al. [17] reported a 17% N loss reduction on the watershed scale when the N application rate was reduced by 20% and the application timing was switched from fall to spring using the ADAPT model. Jaynes et al. [18] reported a 30% N loss reduction on the watershed scale after reducing the N application rate within the sub-basin by 23% and switching the application timing from fall to spring.
The implementation of cover crops improves not only soil quality but also water quality by reducing soil erosion and N leaching [10,19,20,21,22]. Cover crops reduce N leaching losses by immobilizing N through plant N uptake from the soil during growth [23,24] and reduce tile flow through increased water loss via evapotranspiration [9,25]. Field-scale studies showed that cover crops have the potential to reduce N leaching losses from tile-drained fields by up to 60% compared to fields with non-cover crops [26,27,28]. However, limited studies have also been conducted on cover crop effectiveness in reducing N losses on the watershed scale, mainly in the tile-drain-dominated agricultural watersheds. An experimental conducted study by Hanrahan et al. [22] reported a median nitrate loss reduction of 69–90% from fields with cover crops compared to the fields without cover crops in two small agricultural watersheds in the Midwestern US. Although these studies showed that cover crops have the potential to decrease nitrate losses, there is a need to investigate the effectiveness of this practice for N reduction and crop yield in combination with N management practices in intensively managed systems on the watershed scale.
When exploring the long-term effectiveness of various agricultural BMPs, the modeling study is an essential and inseparable part of the process, carried out to support decision making with efficient if–then–else studies. The Soil and Water Assessment Tool (SWAT) has been extensively used for analyzing and assessing the effectiveness of various agricultural BMPs [29,30,31]. The SWAT+ model is a comprehensive continuous-time semi-distributed hydrological model and has recently been updated from the SWAT model to provide a more flexible spatial representation of the interactions and processes within a watershed [32]. According to our understanding, there has been no study that investigated how water quality BMPs’ implementation in an intensively managed agricultural watershed can impact hydrology, nitrate, and crop yield using this newly developed SWAT+ model. Hence, the goal of this study was to assess the long-term impacts (30 years) of three field-implemented agricultural management practices (conventional, fertilizer management (4R), and a cover crop combined with fertilizer management (4R)) using the SWAT+ model. We utilized the updated process-based, semi-spatially distributed model to simulate the hydrological process, nitrate, and crop yield of an agricultural watershed in Illinois. To our knowledge, this is the first study to evaluate the effects of agricultural practices on water quality and crop production using the SWAT+ model.

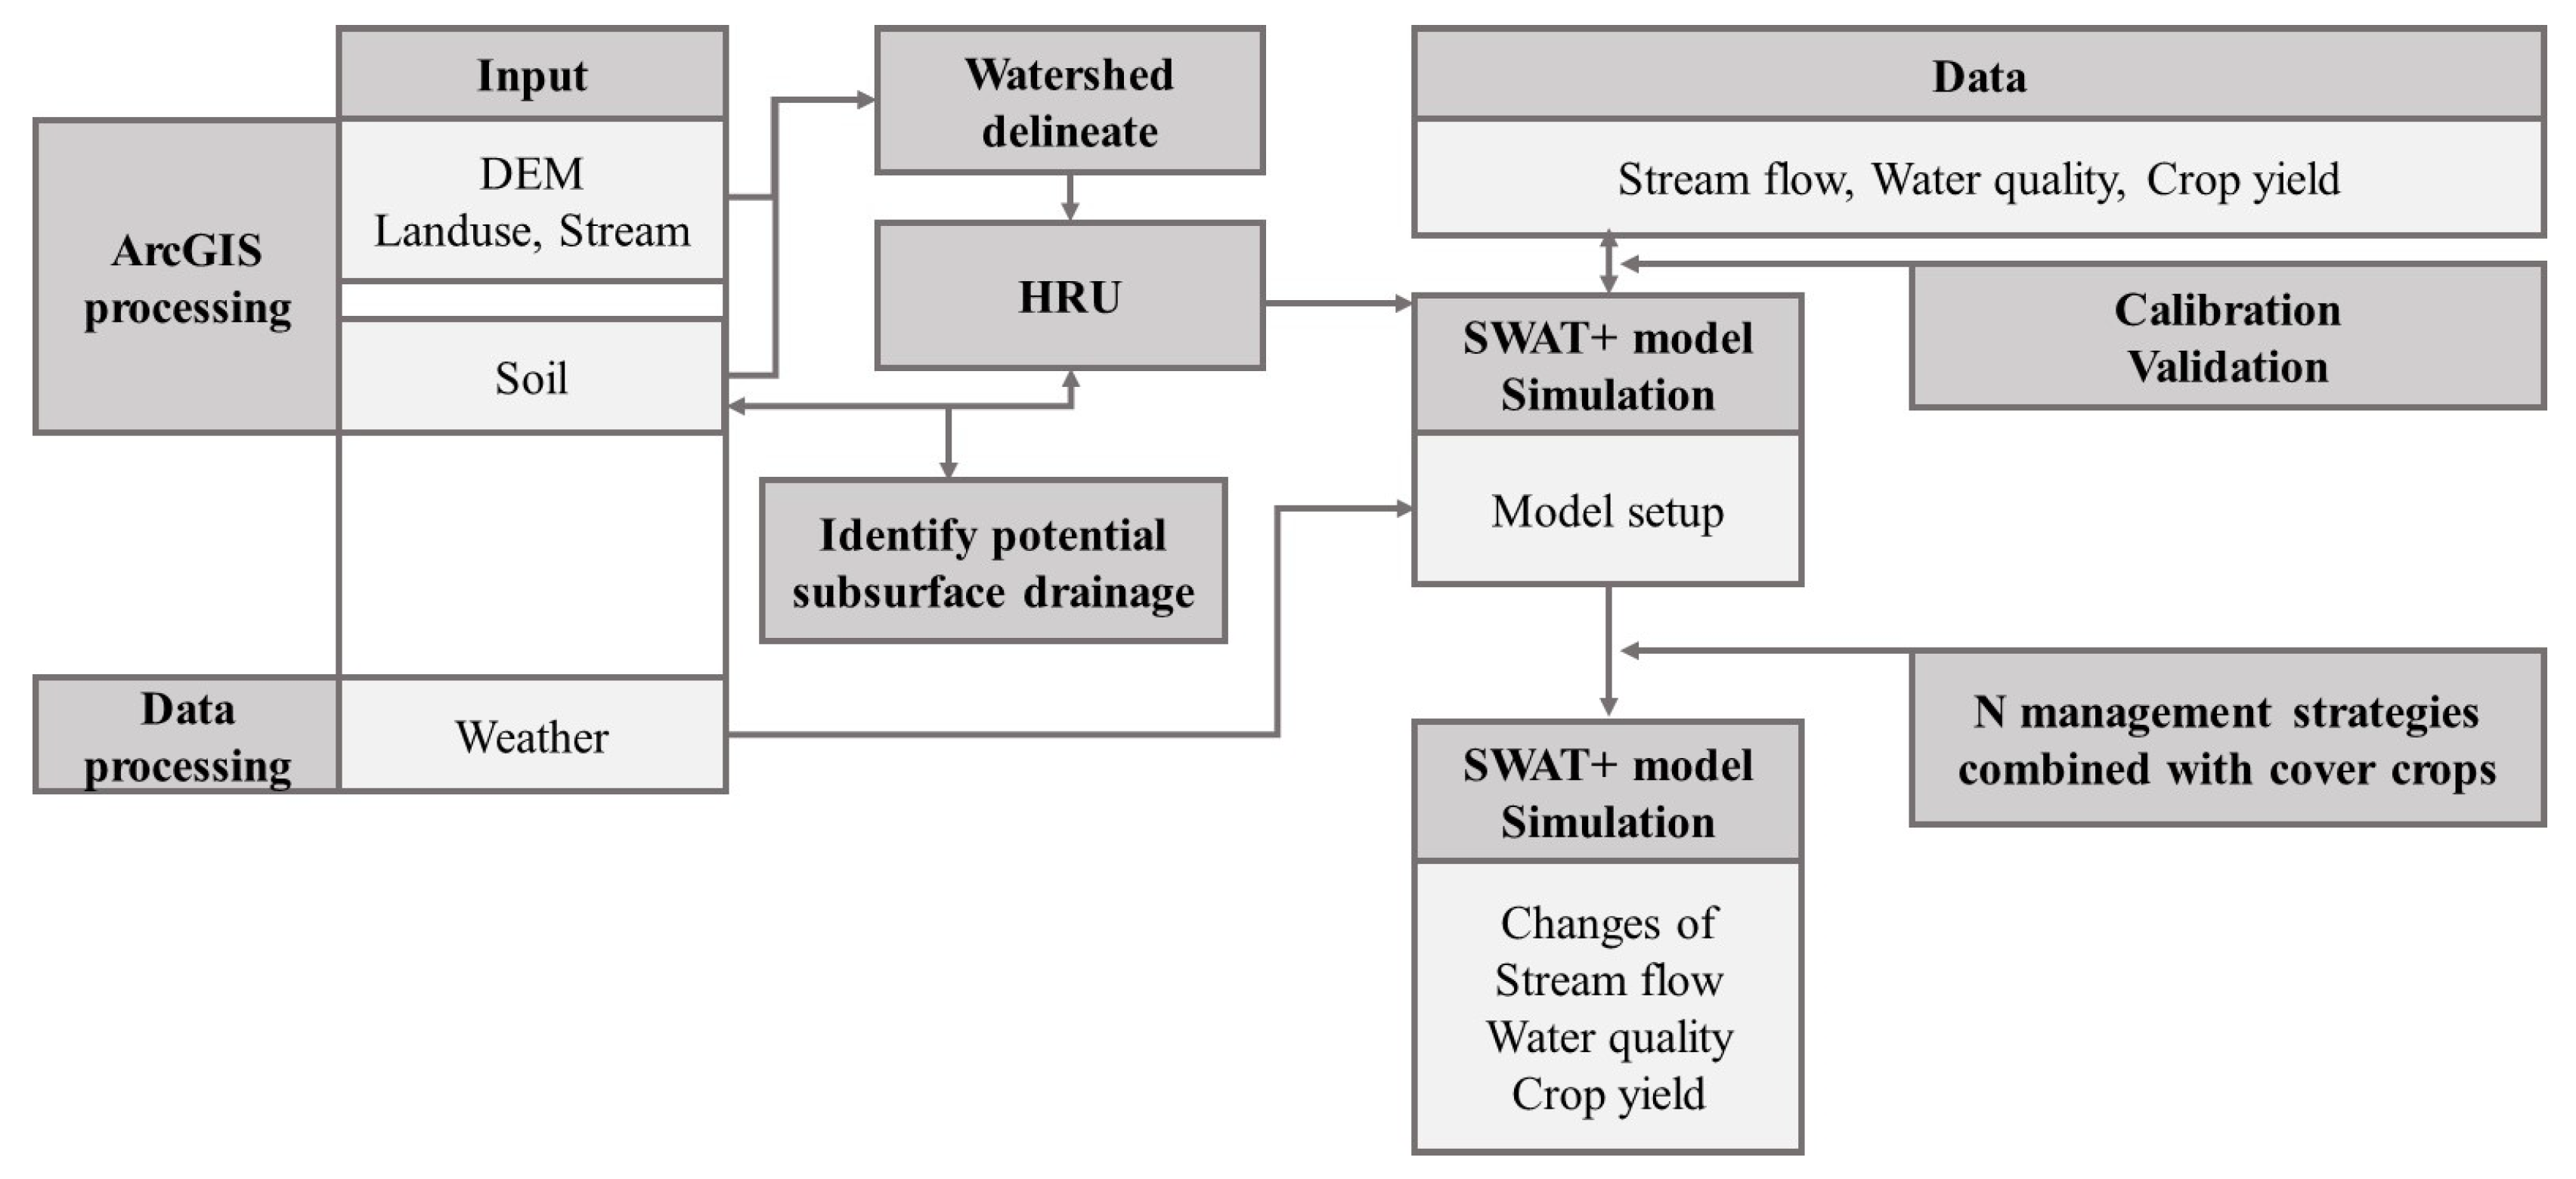
2. Materials and Methods

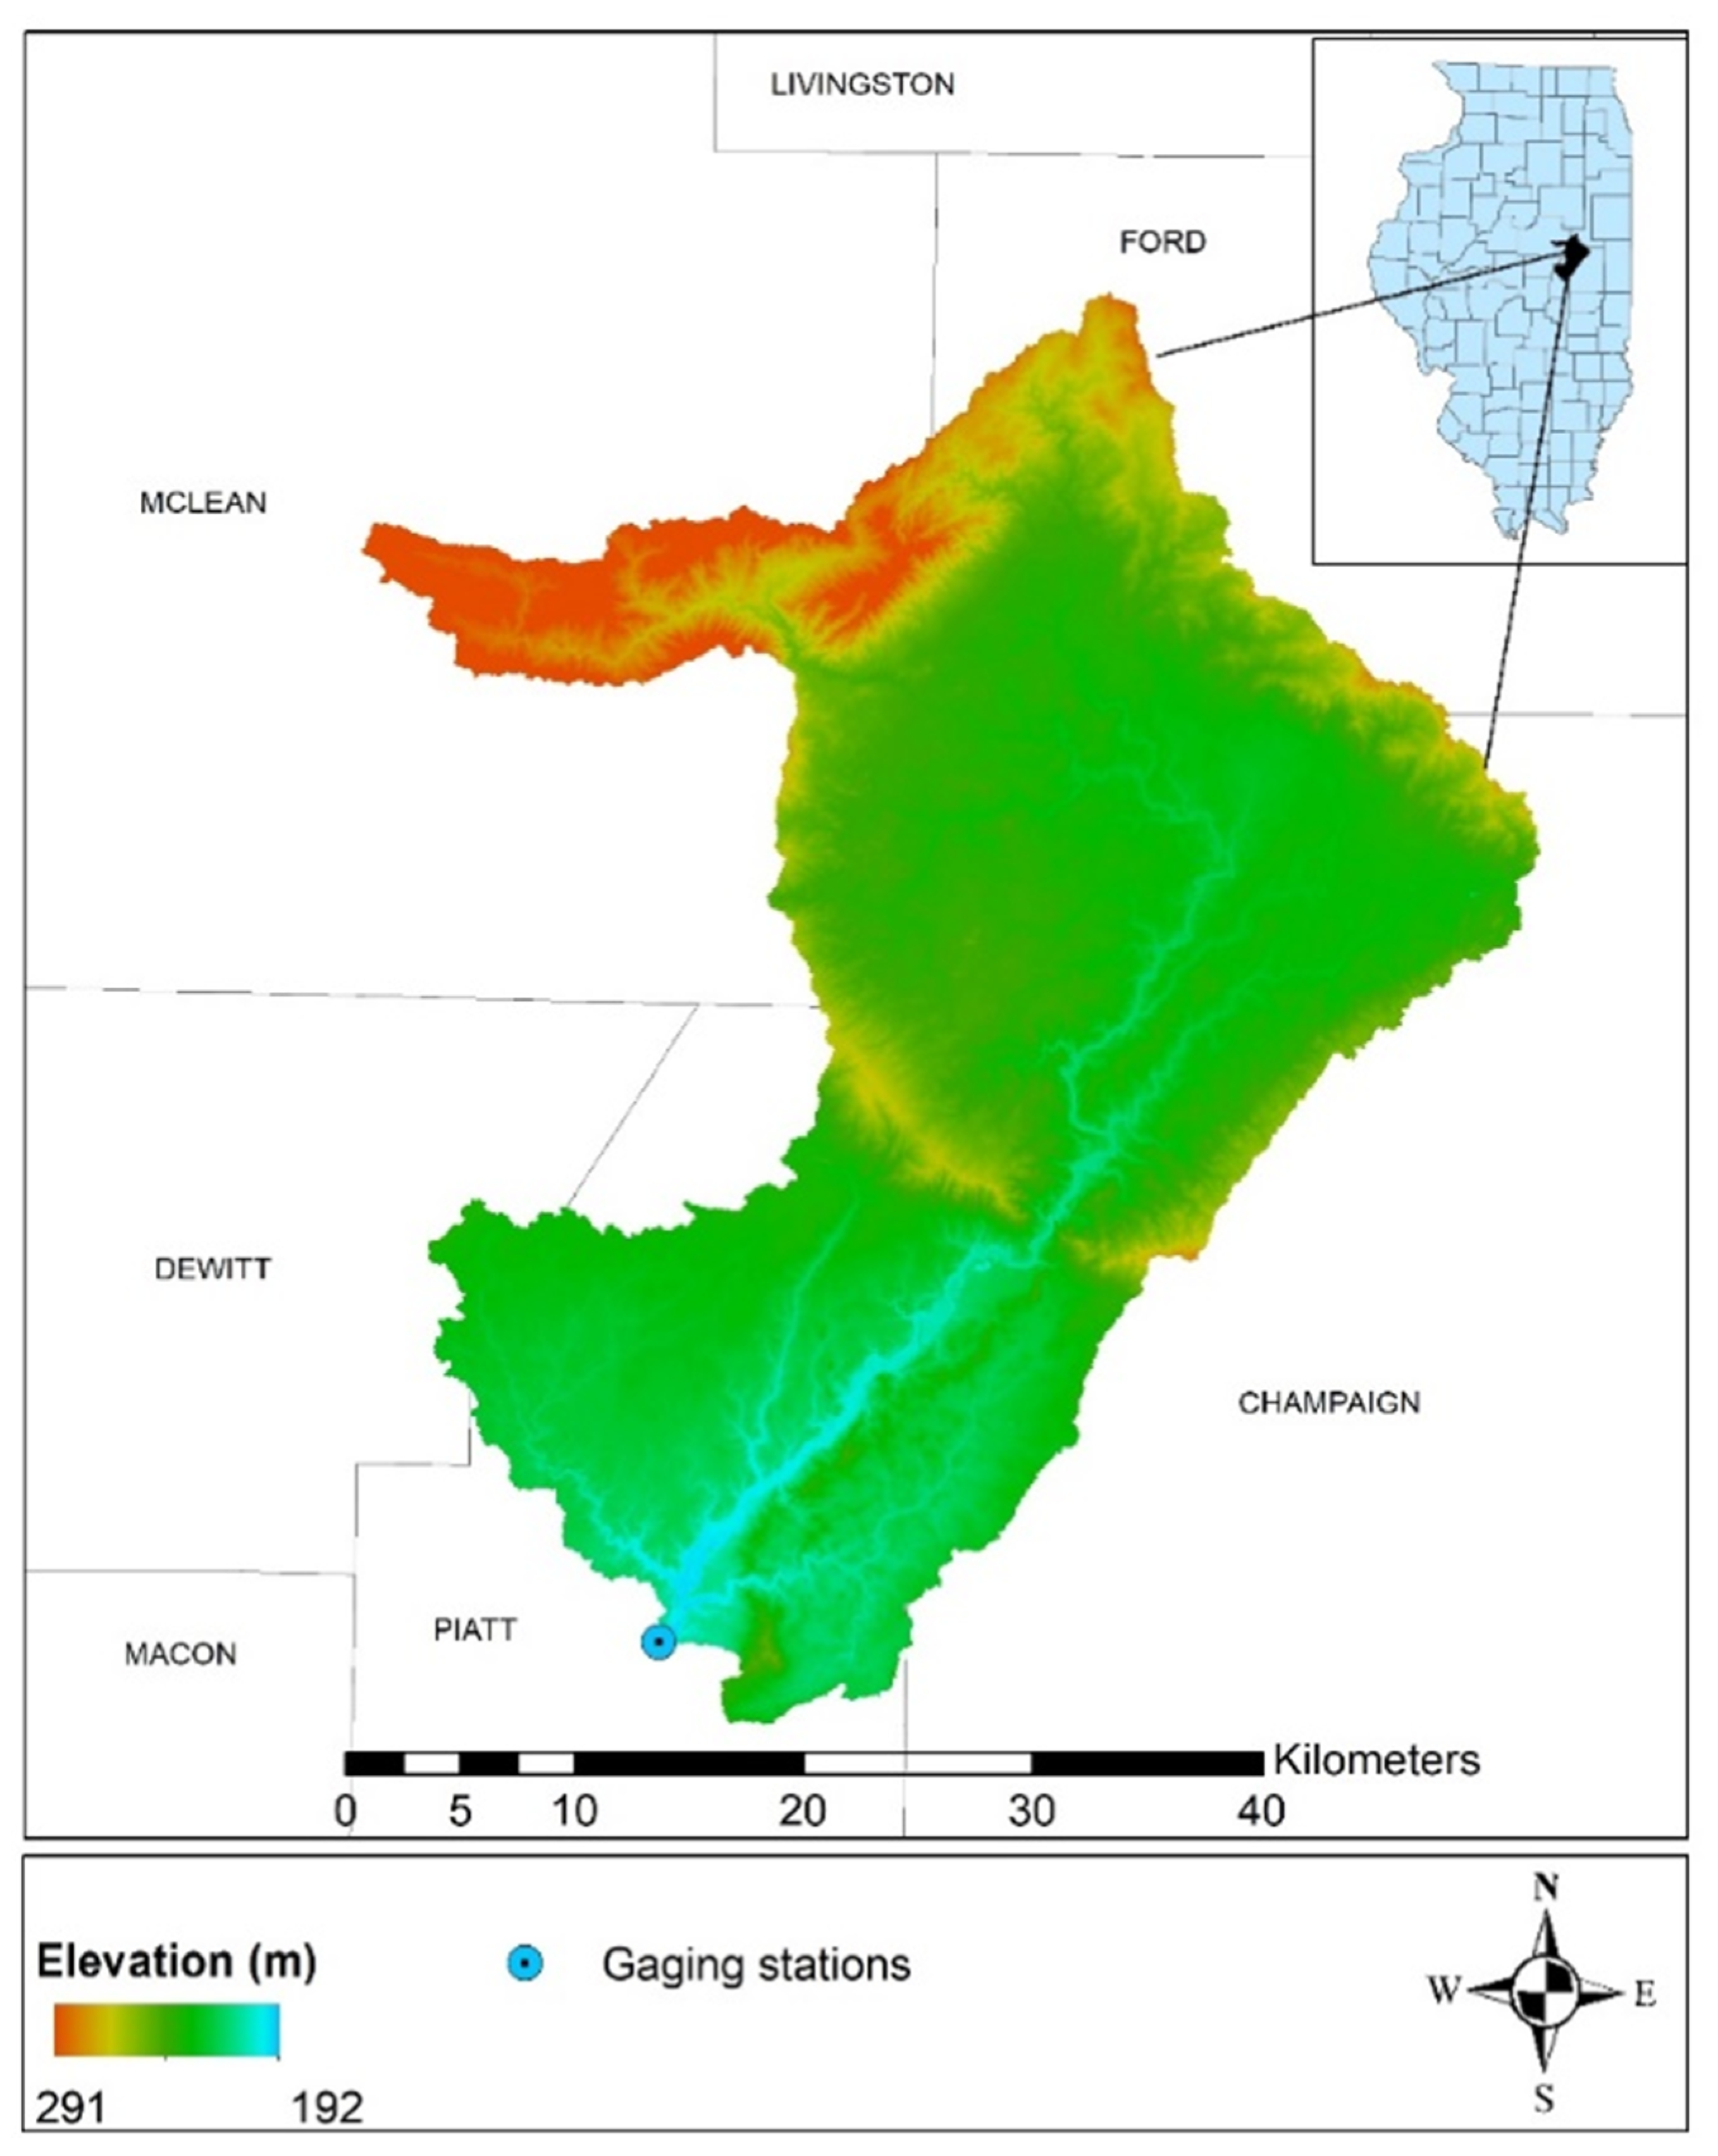
2.1. Study Area Description and Study Flow

The Upper Sangamon River Basin (USRB) is located in east-central Illinois and is part of the Illinois River basin. The watershed encompasses, partially or wholly, 8 counties and has a total drainage area of approximately 2400 km2, draining into Lake Decatur. The part of the USRB considered in this study has its outlet at Monticello and partially encompasses 5 counties (Champaign, Ford, Mclean, De Witt, and Piatt), with a total drainage area of 1425 km2 (Figure 1). The USRB is a predominantly agricultural watershed, and the urban area covers less than 5% of the watershed. In the last two decades, the USRB has undergone substantial alterations due to increased human activities, including the transformation of the prairie and savannah landscape into agricultural cropland and the expansion of subsurface tile drains. In the present conditions, more than 56% (803 km2) of the study area is devoted to row crop production, primarily corn and soybean rotation, and the rest of the agricultural lands form a continuous corn or soybean system. The watershed has a temperate climate with hot summers and cold, snowy winters and receives an average annual precipitation of approximately 1048 mm [33].
Figure 2 shows the overall study flow of the research. In this study, a SWAT+ model was adopted to explore the long-term effect of the N management strategies combined with cover crops.

2.2. SWAT+ Model Description

SWAT+, an updated version of the Soil and Water Assessment Tool (SWAT) model, is a comprehensive, continuous-time, semi-distributed hydrological model developed for simulating streamflow and pollutant transport under different environmental conditions, land management practices, and climate change scenarios across a wide range of spatial and temporal scales [34,35,36,37]. The SWAT+ model consists of the same basic algorithms used to compute the processes in the SWAT model; however, the structure and organization of both the source code and the input files have undergone considerable modification. SWAT+ provides more flexibility compared to SWAT with regard to the spatial representation of interactions and processes within the watershed. In this model, hydrologic response units (HRUs), aquifers, channels, reservoirs, and point sources and inlets are separate spatial objects, whose hydrologic interactions can be defined by the user to represent the physical characteristics of the watershed as realistically as possible. A detailed description of the watershed configuration in SWAT+ can be found in [38]. Briefly, the simulation of watershed hydrology in SWAT+ is separated into two phases: the land phase and the in-stream or routing phase. The land phase of the hydrologic cycle is based on the water balance equation and controls the size of the water, sediment, nutrient, and pesticide loadings for the main channel in each sub-basin, and the in-stream or routing phase controls the movement of water, sediments, nutrients, etc., through the channel network of the watershed to the outlet [35]. Detailed descriptions of these processes are provided in the SWAT and SWAT+ documentation [32].

2.3. SWAT+ Model Input Data

The data used to develop the SWAT+ model for this study area are summarized in Table S1 (Supplementary Materials). A total of 11 sub-basins were delineated based on the Digital Elevation Model (DEM). An HRU definition threshold was selected to include only agricultural HRUs in the study area. Crop rotation was identified for each HRU using four years of crop data layers from [39]. The crop data layers were combined to determine the crop rotation pattern (for example, 1515 for corn–soybean–corn–soybean rotation and 5151 for soybean–corn–soybean–corn rotation) using the raster calculator tool in ArcGIS. After creating the crop rotation layer for the watershed, the zonal statistics tool in ArcGIS was used to determine the crop rotation on the HRU level by overlapping the HRU shapefile and crop rotation layer. The HRUs with potential tile drainage were identified based on the soil drainage class obtained from the NRCS web soil survey. The HRUs with a soil drainage class of very poorly drained to somewhat poorly drained and a soil slope <5% were considered as the HRUs with potential tile drainage. A total of 326 out of 446 agricultural HRUs were found to have potential tile drainage systems.
Daily precipitation, maximum and minimum temperature, solar radiation, wind speed, and relative humidity data were obtained from gridMET [40]. GRIDMET is a dataset of daily high-spatial-resolution (~4 km, 1/24th degree) surface meteorological data covering the contiguous US from 1979 to the present day. This dataset is generated by blending Parameter-elevation Regressions on Independent Slopes Model (PRISM) data with North American Land Data Assimilation System (NLDAS-2) reanalysis data, applying a climatically aided interpolation technique. GRIDMET data are also validated using weather station data from Remote Automatic Weather Stations (RAWS), AgriMet, AgWeatherNet (AWN), and the US Historical Climatology Network (USHCN).

2.4. SWAT+ Model Calibration and Validation

The input parameters of hydrological models like SWAT+ are process-based, and thus, calibration is required to maintain the input parameters within a realistic uncertainty range [31]. The calibration and validation of SWAT+ follow a similar approach to SWAT. The first step in the calibration process is to determine the most sensitive parameters for a given watershed or sub-watershed. The user can use their self-judgment to determine which parameter needs to be adjusted or conduct a parameter sensitivity analysis. In this study, a parameter sensitivity analysis was performed using the Sobol method [41] in SWATplusR [42] to determine the key parameters and the precision required for calibration.
In the second step of the calibration process, the model input parameters were adjusted to reduce the prediction uncertainty by comparing the simulated values with the observed values. The hydrologic component (streamflow) was calibrated first, followed by nutrients (riverine nitrate), and, finally, crop yield calibration. The model validation was performed using the parameters determined during the calibration process and comparing the model simulations with the observed data not used in the calibration. The calibration and validation of the model for the hydrologic and nitrate components were performed using SWATplusR [42], whereas crop yield calibration and validation were performed manually by adjusting the plant parameters (harvest index and potential leaf area index). The model calibration period was from 1994 to 2000 and the validation period was from 2001 to 2007.
The model performance evaluation was performed using both statistical and graphical analyses. The model evaluation criteria follow the guidelines suggested in [43,44]. The model performance was assessed using Nash–Sutcliffe efficiency (NSE) [45], R-square (R2), and the percent bias (PBIAS). In general, the performance of a watershed-scale model on a monthly time scale is considered satisfactory if 0.50 < NSE ≤ 0.70, 0.60 < R2 ≤ 0.75, and ±10 < NSE ≤ ±15 for flow and 0.35 < NSE ≤ 0.50, 0.30 < R2 ≤ 0.60, and ±20 < NSE ≤ ±30 for N or P, respectively [44]. Likewise, the model performance is considered good if 0.70 < NSE ≤ 0.80, 0.75 < R2 ≤ 0.85, and ±5 < NSE ≤ ±10 for flow and 0.50 < NSE ≤ 0.65, 0.60 < R2 ≤ 0.70, and ±15 < NSE ≤ ±20 for N or P, respectively. The PBIAS and normalized root mean square error (n-RMSE) are commonly used to evaluate model performance in predicting crop yield [46]. In general, the model’s performance is considered excellent if nRMSE <10%; good if 10% ≤ nRMSE < 20%; satisfactory if 20% ≤ nRMSE < 30%; and poor if nRMSE ≥ 30% [47]. The graphical technique for model behavior validation used in this study includes time series and scatter plots of the simulated and observed values.

2.5. SWAT+ Model Long-Term Simulation Scenarios

After successful calibration and validation, the model was used to evaluate the long-term impacts of the N management strategies combined with cover crops using 30 years of weather data. To assess the effects of the N application rates and timing combined with a cover crop, nine simulation scenarios were developed (Table 1). In this study, the 100% pre-plant N application timing corresponds to the conventional method, and the 40:60 split N application refers to 40% pre-plant N application and 60% N as a side-dressing application in spring in the corn years. No N fertilizers were applied in the soybean years. Furthermore, the N application rates of 224 kg N ha−1, 202 kg N ha−1, and 179 kg N ha−1 correspond to the maximum, average, and minimum N application rates calculated using the Nitrogen Rate Calculator based on the maximum return to N (MRTN) approach for Central Illinois. The details of the Nitrogen Rate Calculator can be found at http://cnrc.agron.iastate.edu/ accessed on 8 July 2023. Anhydrous ammonia, the most commonly used N fertilizer in this region, was used in this study. The winter cover crop was implemented in the corn years alone and in both the corn and soybean years when combined with the 4R practice (cereal rye was used as the cover crop in this study). The conventional N application rate of 224 kg N ha−1 applied as a 100% spring pre-plant application in the corn year was considered as a baseline for comparing all the other scenarios and evaluating their effectiveness in reducing nitrate losses and increasing crop production.

3. Results and Discussion

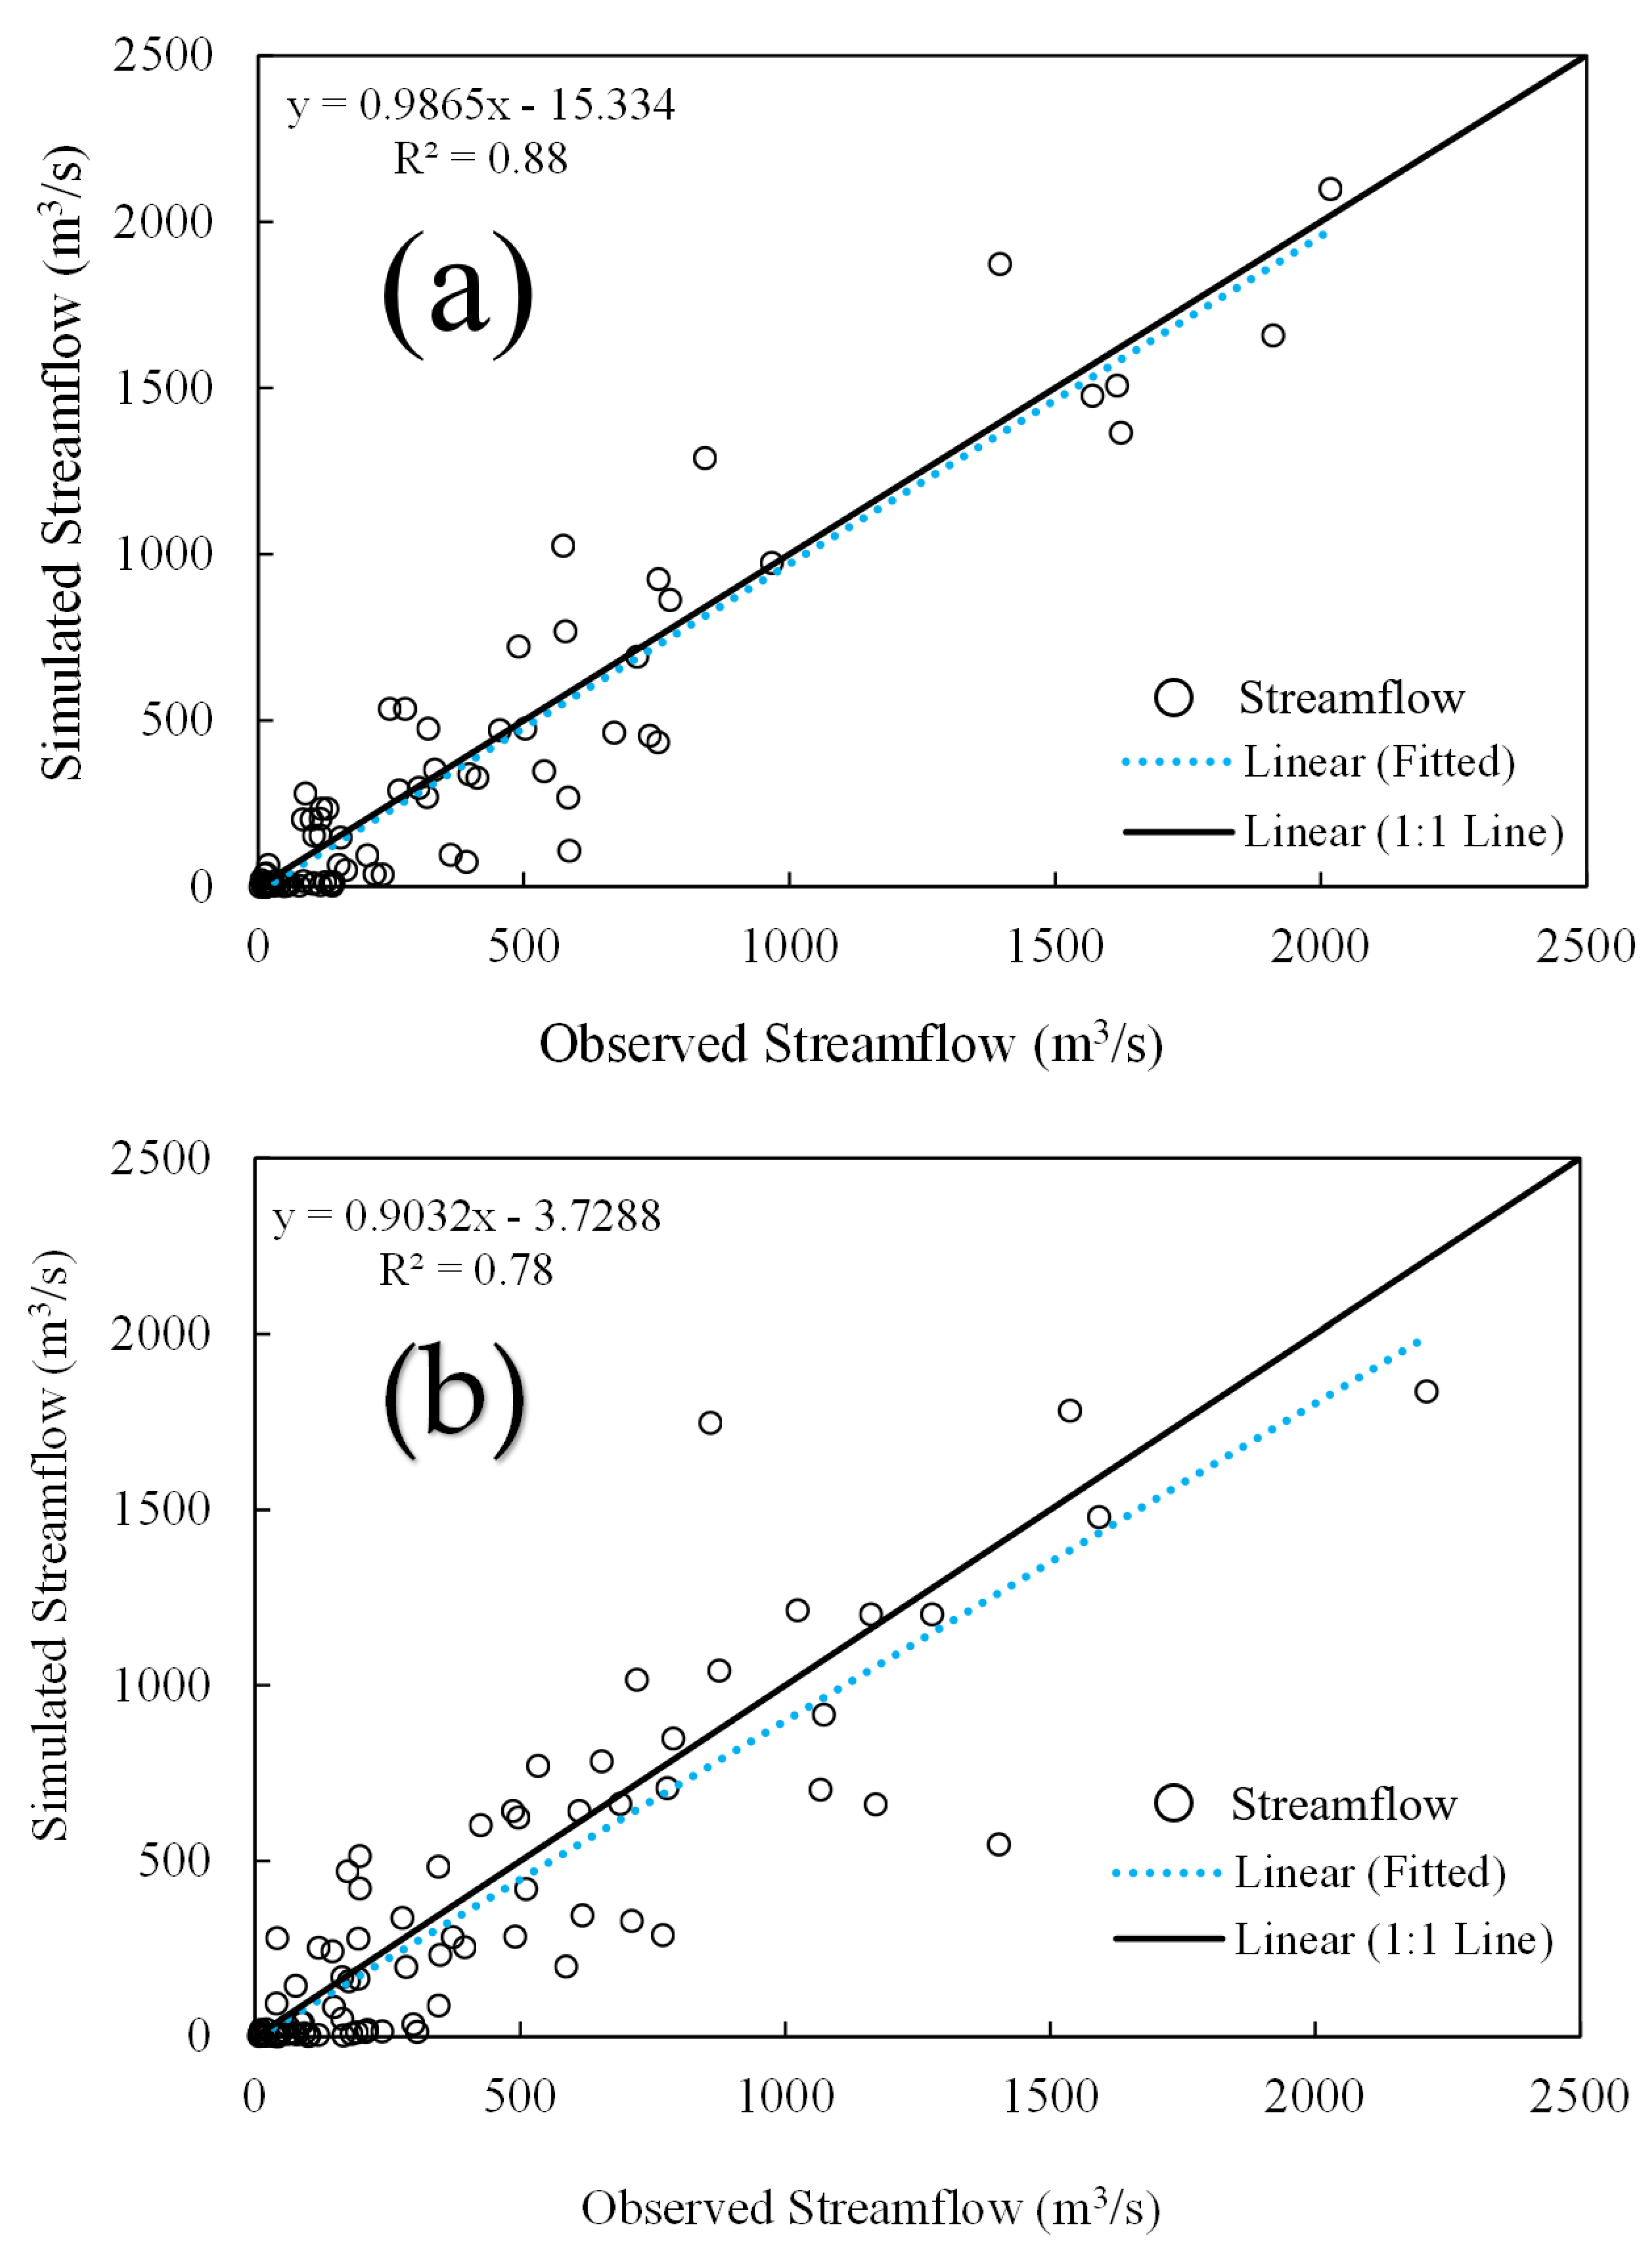
3.1. Hydrologic Calibration and Validation

The hydrologic parameters of the model were calibrated for a period of 7 years from 1994 to 2000 and validated over a period of 7 years from 2001 to 2007. To accurately quantify the overland and subsurface flow components, several model parameters, including the curve number (CN), available soil water capacity (AWC), saturated hydraulic conductivity (k), and percolation coefficient (PERCO), were calibrated. In the process, 21 model parameters were adjusted to improve the model’s ability to simulate the hydrologic components and simulate the observed flow at the watershed outlet (Table S2).
During the model’s evaluation period (1994–2007), the watershed received an average annual precipitation of 1027 mm, of which around 95 mm was snowfall. Using the Hargreaves method [48], the model simulated an average annual actual evapotranspiration (ET) of 666 mm, which accounted for 64% of the total annual rainfall. The simulated ET value was found to be within the reported ET range of 60–69% for Central Illinois [49]. Various field-scale modeling studies have also reported an ET range of 60–65% for nearby sites [15,16]. The model simulated an average annual potential evapotranspiration (PET) of 1050 mm, which was also found to be within the expected range.
The model’s default tile drainage configuration (tile depth of 1.1 m and spacing of 20 m) was used in this study. The other tile drainage parameters, such as the multiplication factor for tile lateral saturated hydraulic conductivity (tile_latk) and tile lag time (tile_lag), were adjusted during the calibration process. The model simulated an average tile flow of 189 mm over a period of 14 years (1994–2007). This accounts for approximately 18% of the average annual precipitation. The model-simulated tile drain flow was found to be within the reasonable range for tile-dominated agricultural watersheds. Past field and watershed-scale studies of this region have shown partitioning of rainfall to tile drainage at a level of up to 39% [13,15,16,50]. The other hydrologic components simulated with the model, such as overland surface runoff and lateral flow, account for only a small percentage of the average annual rainfall. A summary of the model-simulated hydrologic components and water balance is presented in Figure 3 and Table S3.
In terms of spatial variability, the model simulation results indicated that the surface flow was lower for the flatter sub-watersheds (in the southern part of the watershed) than the steeper sub-watersheds (in the northern part of the watershed) during both the calibration and validation periods. On the contrary, the tile flow was higher for the flatter sub-watersheds compared to the steeper sub-watersheds. It was observed that the streamflow was higher during the spring and summer seasons compared to fall and winter for both the calibration and validation periods. As indicated by the water balance results (Table S3), the average annual precipitation during the validation period (2001–2007) was higher than that in the calibration period (1994–2000). This increase in the annual precipitation resulted in an increase in ET, surface runoff, and tile flow. However, the increase in tile flow was more substantial (197.90 mm during 2001–2007 compared to 180.51 mm during 1994–2000) than the changes in the other water flow components. This indicates that tile drainage can critically influence the total flow in the study watershed. It can also influence the stream water quality more significantly than the other hydrological components in the study watershed.
The model-simulated monthly streamflow was compared with the observed streamflow values during the calibration (1994–2000) and validation (2001–2007) processes. For a graphical evaluation, a scatterplot was used for the model’s evaluation in the calibration and validation periods (Figure 4). The comparison of the observed streamflow and model-simulated streamflow showed that model underpredicted the streamflow during both the calibration and validation periods. The scatterplot shows that most of the observed and predicted values are along the linear fitted line, with very few outliers in the validation period. The scatterplot shows that the model was able to capture both low and high streamflow events well.
The accuracy of the simulated monthly streamflow for the calibration period of 1994–2000 was found to be very good, with an NSE of 0.87, R2 of 0.88, and PBIAS of −5.9%. For the validation period of 2001–2007, the model performed well, with an NSE of 0.75, R2 of 0.78, and PBIAS of −10.6%. The model’s performance in simulating the monthly streamflow for the watershed is summarized in Table 2.

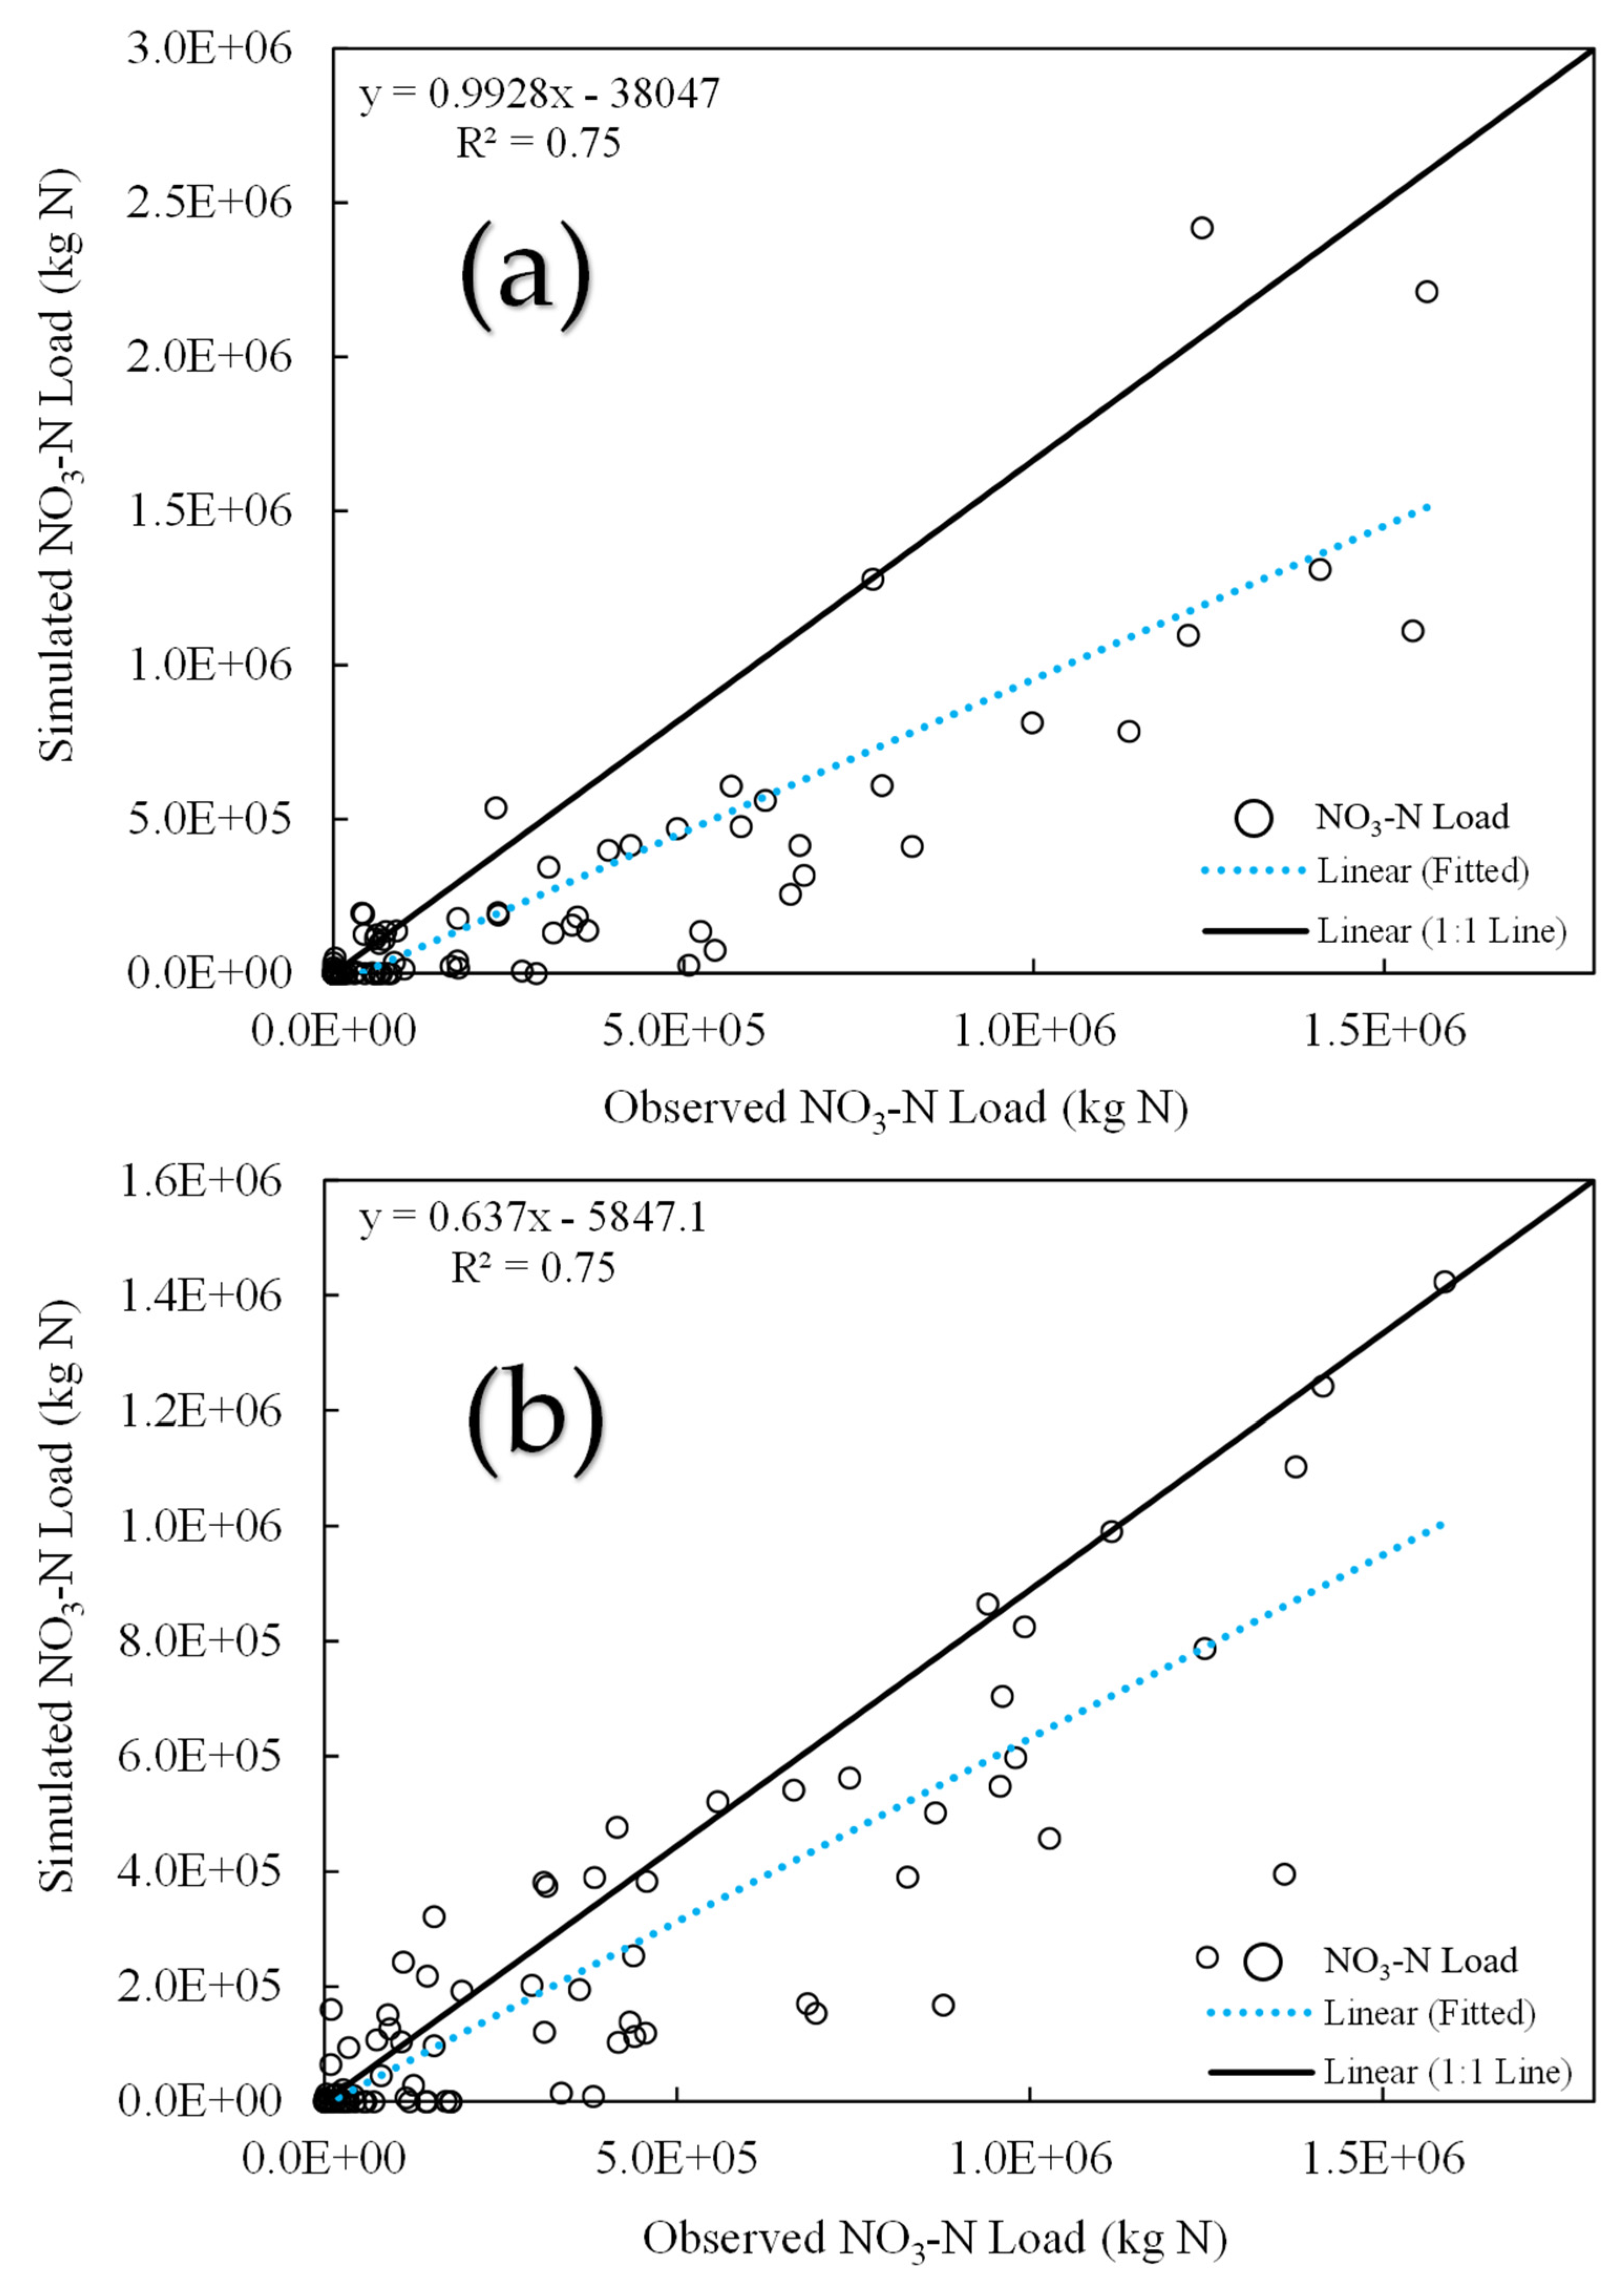
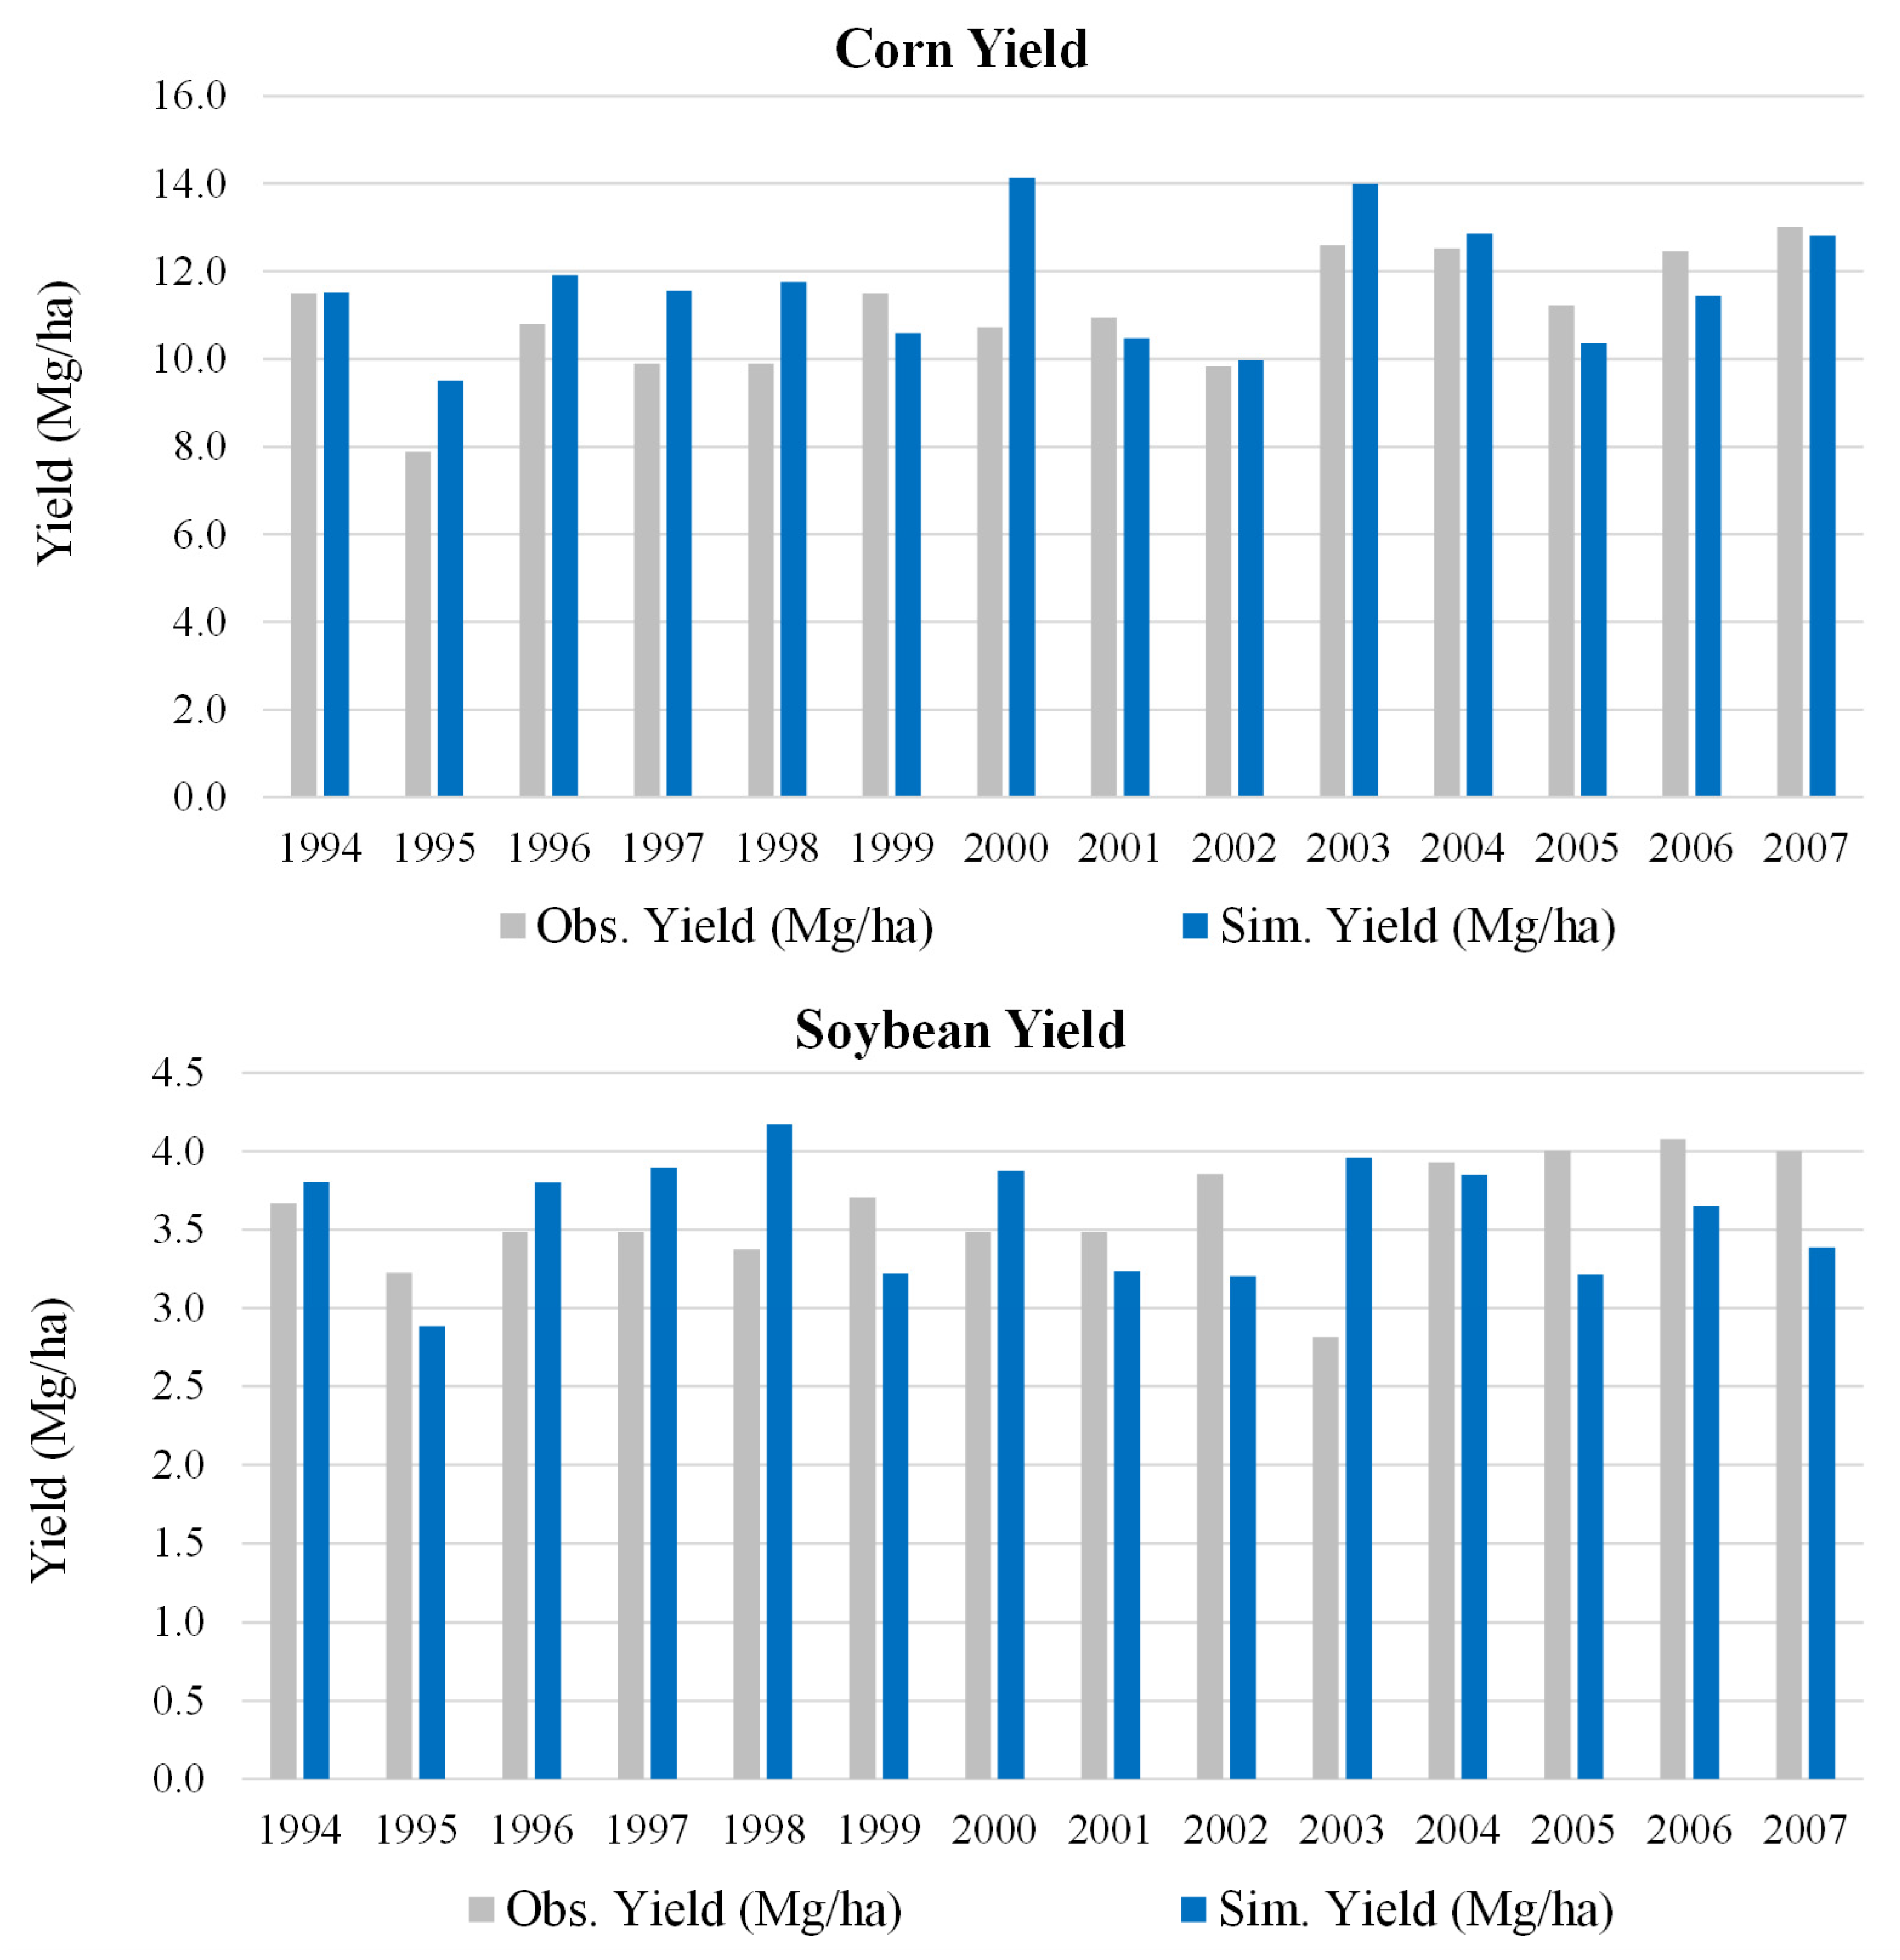
3.2. Nitrate and Crop Yield Calibration and Validation

Following the hydrologic calibration, the model was calibrated simultaneously for both the riverine nitrate (NO3-N) load and crop yield. The simultaneous calibration of the crop yield and NO3-N is important because nutrient uptake by plants is one of the critical components of soil nutrient dynamics, which greatly influences the model’s performance in simulating NO3-N transport. Four model parameters were adjusted during the NO3-N calibration process, and three were adjusted during crop yield calibration (Table S2). The rate factors for the humus mineralization of active organic nutrients (cmn) and denitrification exponential rate coefficient (cdn) were found to be very sensitive in the NO3-N simulations. On the monthly scale, the model performed very well during the calibration period, with as NSE of 0.66, R-square of 0.75, and PBIAS of −14.5%. The model validation results showed a good model performance, with an NSE of 0.63, R-square of 0.75, and PBIAS of −37.9% (Table 3). The simulated results showed that the majority of the NO3-N in the water is channeled through the tile drainage route to the stream. Since the N fertilizers applied to the crops are highly dissolvable in water, tile drainage provides a preferential pathway for the transport of NO3-N from the soil to the surface water bodies. The scatterplot for the comparison of the monthly observed and simulated NO3-N for both the calibration and validation periods showed that the model underpredicted the NO3-N loads in the stream water (Figure 5). Although the model was able to capture the majority of the variability in the observed values, this finding suggests that the model was unable to capture some of the peak events, mainly those in the validation years.
The crop rotation in each agricultural HRU was approximated using four years of cropland data layers. The annual crop yield on the county level was averaged for all the counties encompassed by the watershed. Two statistical goodness of fit measures, the n-RMSE and PBIAS, were used to evaluate the model performance’s in simulating the crop yield. For the calibration period, the model’s performance in simulating the corn and soybean yields was good, with n-RMSE values of 16% and 13% and PBIAS values of 12% and 5%, respectively. During the validation years, the model performance’s in simulating the corn yield was very good, with an n-RMSE of 7% and PBIAS of −1%, and its performance in simulating the soybean yield was also good, with an n-RMSE of 19% and PBIAS of −6%. A bar chart was used to visually compare the simulated crop yield with the observed yield (Figure 6). The simulated results showed that the model over-predicted the corn yield in the period of 1995 to 1998, 2000, and 2003, whereas the model over-predicted the soybean yield in 1996, 1997, 1998, 2000, and 2003. A significant difference in the simulated corn and soybean yields was observed in 2000, when the model over-predicted the corn yield by 32%, and in the year 2003, when the model over-predicted the soybean yield by 41%. Similarly, the model under-predicted the soybean yield in 2002, 2005, and 2007, with differences ranging from 15% to 20%. The model-simulated crop yields were found to be sensitive to the N and P application rates and timing.
The accuracy of the simulated monthly nitrate load for the calibration period of 1994–2000 was found to be very good, with an NSE of 0.66, R2 of 0.75, and PBIAS of −14.5%. For the validation period of 2001–2007, the model performed well, with an NSE of 0.63, R2 of 0.75, and PBIAS of −37.9%. The model’s performance in simulating the monthly nitrate and crop yield for the watershed is summarized in Table 3.

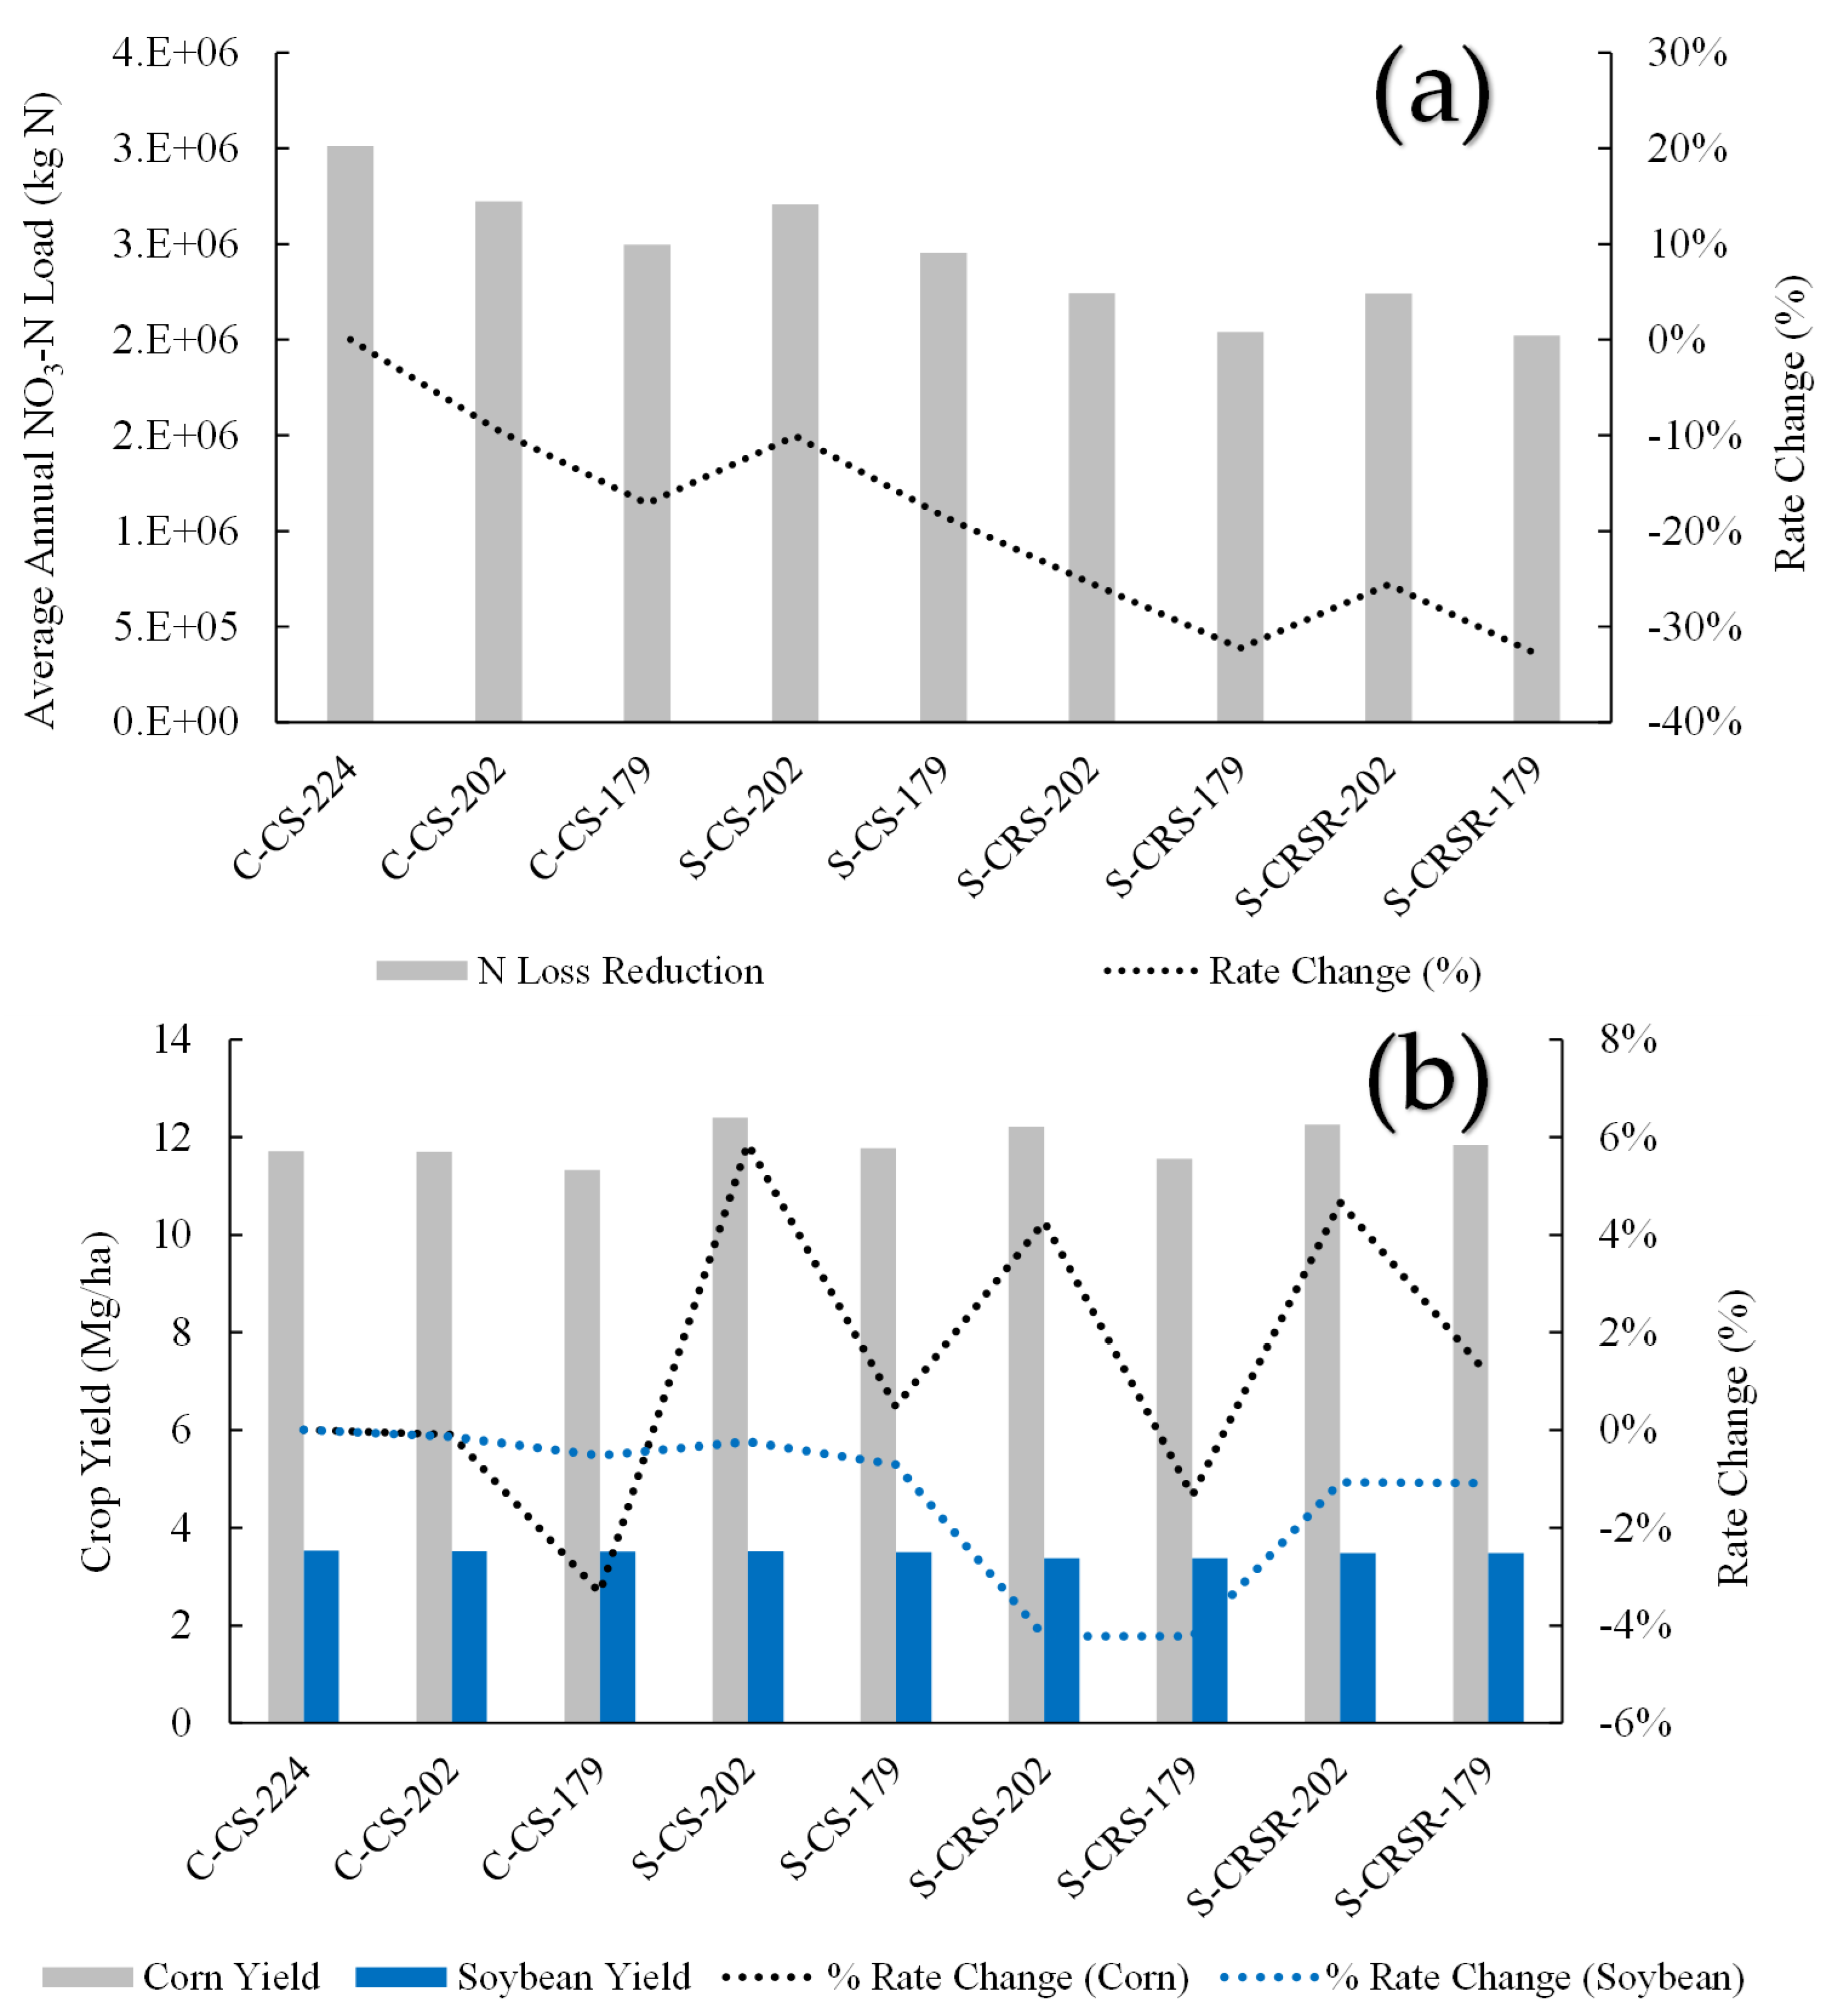
3.3. Effects of the Combined BMPs on Water Quality and Crop Yield

The long-term simulation was performed using 30-year (1990–2019) weather data, and the effects of different management scenarios were evaluated. The conventional method, which was defined as a 100% spring pre-plant N application in the corn year at the rate of 224 kg N ha−1 with no N application in the soybean year, was used as a baseline, and all the other management scenarios were compared with the baseline. Two N application rates (202 kg N ha−1 and 179 kg N ha−1) and two N application timings (100% spring pre-plant (the conventional method) and a 40:60 split between spring pre-plant and side-dressing N applications (the split method)) with and without cover crops were evaluated. The two N application rates (202 kg N ha−1 and 179 kg N ha−1) correspond to the average and minimum N application rates, and the baseline N application rate of 224 kg N ha−1 corresponds to the maximum N application rate calculated using the MRTN calculator for Central Illinois. Two cover crop implementations were tested, specifically, corn–cereal rye–soybean and corn–cereal rye–soybean–cereal rye, combined with two N application rates and two N application timings. The impacts of each management scenario on the NO3-N load and corn yield are presented in Figure 7.
Based on the long-term simulation, we found that higher N application rates do not necessarily increase crop yield. The conventional practice of applying more N to improve crop productivity mainly results in higher losses of NO3-N from agricultural fields, mostly tile-drained fields. Our analysis showed that both the N application rate and timing play a critical role in improving corn production and reducing NO3-N losses. We found that there is room for reducing N application rates by at least 20% without losing part of the corn yield. Reducing the N application rate by 10% (from 224 kg N ha−1 to 202 kg N ha−1) and using a 100% pre-plant N application method (C-CS-202) could potentially reduce the N load by 10% without impacting the crop yield. Furthermore, reducing the N application rate by 20% (from 224 kg N ha−1 to 179 kg N ha−1) and using a 100% pre-plant N application method (C-CS-179) could potentially reduce the NO3-N load by 17% with a corn yield reduction of 3%. This finding was found to be consistent with research studies showing that when the N application rate exceeds a certain amount, the corn yield reaches a plateau [15,51]. However, with the right N application timing, both NO3-N loss reduction and crop yield improvement are achievable. The model simulation results showed that using a 40:60 split N application and a reduced N rate of 10% (S-CS-202) can potentially reduce the NO3-N load by 10% and increase the corn yield by 6%. A further reduction in the N application rate by 20% and the use of split N application method (S-CS-179) can reduce the NO3-N load by 18% without negatively impacting the corn yield, as compared to the conventional method. The soybean yield does not show any response to changes in the N application rates or time.
Moreover, the planting of a winter cover crop after corn harvesting and the termination of the cover crop before the planting of soybean, combined with a 20% N rate reduction and split N application (S-CRS-179), will further reduce the NO3-N load by 32%, the corn yield by 1%, and the soybean yield by 4%. The reduction in the crop yield might be associated with a delay in cover crop termination. The timely termination of the cover crop is important for minimizing the impact on both the corn and soybean yields. Research studies have found that the delayed termination of cover crops can potentially reduce crop yield [52]. The model simulation results also showed that the adoption of a cover crop in both the corn and soybean years does not further reduce the NO3-N loads compared to the adoption of a cover crop in the corn year alone.

4. Limitations of This Study

We were not able to calibrate the SWAT model for hydrology and water quality assessment on the sub-watershed scale due to data limitations. In future studies, the model could be calibrated and validated for multiple sub-watersheds to improve the reliability of the predictions. Similarly, we had to calibrate the crop yield on the county level due to data limitations. A sub-watershed level comparison (modeled vs. observed) of the crop yield might provide a more reliable estimate of the crop yield. Similarly, the impacts of implementing other cover crops (radish, legumes) on hydrology and water quality could be investigated in future studies.

5. Conclusions

This study focused on evaluating the effects of combined management practices on riverine nitrate loads and crop production on the watershed scale and sought to identify the effectiveness of these management practices. Our findings suggest that there is room for a further reduction in the conventional N application rate by 20%, without negatively impacting crop production. With proper N application timing and rates, the level of riverine nitrate can be potentially reduced by 18%. The adoption of cover crops in corn–soybean rotation, combined with N management strategies, could potentially reduce the nitrate load by 32%. However, the timing of cover crop termination is important for offsetting the effect on the crop yield. Our model simulation results indicate that the use of cover crops planted after corn harvesting and terminated before soybean planting (corn–cereal rye–soybean) in tile-drainage-dominated agricultural watersheds is more beneficial. On the other hand, cover crop treatment in both the corn and soybean years (corn–cereal rye–soybean–cereal rye) was not found to be very effective in reducing nitrate losses compared to cover crop treatment in the corn years alone. The findings presented in this study provide important information for decision making, aiding in the effective implementation of combined management practices to reduce N losses without negatively impacting crop production. From a practical perspective, this study will help farmers and stakeholders to achieve their agricultural production goals and minimize the off-site environmental impacts of nitrate transport from agricultural lands.

Supplementary Materials

The following supporting information can be downloaded at: https://www.mdpi.com/article/10.3390/agriculture13081484/s1, Table S1: Spatial and temporal input datasets used in the study; Table S2: Final calibrated SWAT+ parameters for hydrology, nutrient dynamics, and crop yield; Table S3: Model-simulated hydrologic components for calibration period, 1994–2000, and validation period, 2001–2007.

Author Contributions

Conceptualization, S.S. and R.B.; methodology, R.B.; software, S.S. and J.G.A.; validation, S.S., S.H. and R.B.; formal analysis, S.S.; resources, R.B.; data curation, S.S.; writing—original draft preparation, S.S.; writing—review and editing, S.H. and J.G.A.; visualization, S.S.; supervision, R.B.; project administration, R.B.; funding acquisition, R.B. All authors have read and agreed to the published version of the manuscript.

Funding

This work was supported by the National Institute of Food and Agriculture, U.S. Department of Agriculture, the Hatch project (ILLU-741-337), and the Dudley Smith Initiative in the College of Agricultural, Consumer, and Environmental Sciences at the University of Illinois at Urbana-Champaign.

Data Availability Statement

The data (DEM, soil, landuse, rainfall, temperature, flow, water quality, crop yield) and the model (SWAT+) used in this study are publicly available as described in the paper. The data that support the findings of this study are available from the authors upon reasonable request.

Conflicts of Interest

The authors declare no conflict of interest.

References

  1. Breitburg, D.; Levin, L.A.; Oschlies, A.; Grégoire, M.; Chavez, F.P.; Conley, D.J.; Garçon, V.; Gilbert, D.; Gutiérrez, D.; Isensee, K.; et al. Declining oxygen in the global ocean and coastal waters. Science 2018, 359, eaam7240. [Google Scholar] [CrossRef] [Green Version]
  2. Follett, R.F. (Ed.) Nitrogen Management and Ground Water Protection; Elsevier: Amsterdam, The Netherlands, 2012. [Google Scholar]
  3. Lal, R. Soils and sustainable agriculture. A review. Agron. Sustain. Dev. 2008, 28, 57–64. [Google Scholar] [CrossRef]
  4. Donner, S.D.; Kucharik, C.J. Evaluating the impacts of land management and climate variability on crop production and nitrate export across the Upper Mississippi Basin. Glob. Biogeochem. Cycles 2003, 17, 1–18. [Google Scholar] [CrossRef] [Green Version]
  5. Robertson, D.M.; Saad, D.A. SPARROW Models Used to Understand Nutrient Sources in the Mississippi/Atchafalaya River Basin. J. Environ. Qual. 2013, 42, 1422–1440. [Google Scholar] [CrossRef]
  6. Porter, P.A.; Mitchell, R.B.; Moore, K.J. Reducing hypoxia in the Gulf of Mexico: Reimagining a more resilient agricultural landscape in the Mississippi River Watershed. J. Soil. Water Conserv. 2015, 70, 63A–68A. [Google Scholar] [CrossRef] [Green Version]
  7. Alexander, R.B.; Smith, R.A.; Schwarz, G.E.; Boyer, E.W.; Nolan, J.V.; Brakebill, J.W. Differences in phosphorus and nitrogen delivery to the Gulf of Mexico from the Mississippi River Basin. Environ. Sci. Technol. 2008, 42, 822–830. [Google Scholar] [CrossRef] [PubMed] [Green Version]
  8. IEPA. Illinois Department of Agriculture, 2015, Illinois Nutrient Loss Reduction Strategy; Illinois Environmental Protection Agency: Springfield, IL, USA, 2015. [Google Scholar]
  9. Strock, J.S.; Porter, P.M.; Russelle, M.P. Cover Cropping to Reduce Nitrate Loss through Subsurface Drainage in the Northern U.S. Corn Belt. J. Environ. Qual. 2004, 33, 1010. [Google Scholar] [CrossRef] [PubMed]
  10. Kaspar, T.C.; Jaynes, D.B.; Parkin, T.B.; Moorman, T.B. Rye Cover Crop and Gamagrass Strip Effects on NO 3 Concentration and Load in Tile Drainage. J. Environ. Qual. 2007, 36, 1503–1511. [Google Scholar] [CrossRef] [Green Version]
  11. King, K.; Williams, M.; LaBarge, G.; Smith, D.; Reutter, J.; Duncan, E.; Pease, L. Addressing agricultural phosphorus loss in artificially drained landscapes with 4R nutrient management practices. J. Soil. Water Conserv. 2018, 73, 35–47. [Google Scholar] [CrossRef]
  12. Daryanto, S.; Fu, B.; Wang, L.; Jacinthe, P.A.; Zhao, W. Quantitative synthesis on the ecosystem services of cover crops. Earth Sci. Rev. 2018, 185, 357–373. [Google Scholar] [CrossRef]
  13. Thorp, K.R.; Malone, R.W.; Jaynes, D.B. Simulating long-term effects of nitrogen fertilizer application rates on corn yield and nitrogen dynamics. Trans. ASABE 2007, 50, 1287–1303. [Google Scholar] [CrossRef] [Green Version]
  14. Fang, Q.X.; Malone, R.W.; Ma, L.; Jaynes, D.B.; Thorp, K.R.; Green, T.R.; Ahuja, L.R. Modeling the effects of controlled drainage, N rate and weather on nitrate loss to subsurface drainage. Agric. Water Manag. 2012, 103, 150–161. [Google Scholar] [CrossRef]
  15. Jeong, H.; Bhattarai, R. Exploring the effects of nitrogen fertilization management alternatives on nitrate loss and crop yields in tile-drained fields in Illinois. J. Environ. Manag. 2018, 213, 341–352. [Google Scholar] [CrossRef] [PubMed]
  16. Singh, S.; Bhattarai, R.; Negm, L.M.; Youssef, M.A.; Pittelkow, C.M. Evaluation of nitrogen loss reduction strategies using DRAINMOD-DSSAT in east-central Illinois. Agric. Water Manag. 2020, 240, 106322. [Google Scholar] [CrossRef]
  17. Gowda, P.H.; Mulla, D.J.; Jaynes, D.B. Simulated long-term nitrogen losses for a midwestern agricultural watershed in the United States. Agric. Water Manag. 2008, 95, 616–624. [Google Scholar] [CrossRef]
  18. Jaynes, D.B.; Dinnes, D.L.; Meek, D.W.; Karlen, D.L.; Cambardella, C.A.; Colvin, T.S. Using the Late Spring Nitrate Test to Reduce Nitrate Loss within a Watershed. J. Environ. Qual. 2004, 33, 669–677. [Google Scholar] [CrossRef] [Green Version]
  19. Kaspar, T.C.; Jaynes, D.B.; Parkin, T.B.; Moorman, T.B.; Singer, J.W. Effectiveness of oat and rye cover crops in reducing nitrate losses in drainage water. Agric. Water Manag. 2012, 110, 25–33. [Google Scholar] [CrossRef]
  20. Krueger, E.S.; Ochsner, T.E.; Baker, J.M.; Porter, P.M.; Reicosky, D.C. Rye-corn silage double-cropping reduces corn yield but improves environmental impacts. Agron. J. 2012, 104, 888–896. [Google Scholar] [CrossRef] [Green Version]
  21. Blanco-Canqui, H. Cover crops and water quality. Agron. J. 2018, 110, 1633–1647. [Google Scholar] [CrossRef]
  22. Hanrahan, B.R.; Tank, J.L.; Christopher, S.F.; Mahl, U.H.; Trentman, M.T.; Royer, T.V. Winter cover crops reduce nitrate loss in an agricultural watershed in the central U.S. Agric. Ecosyst. Environ. 2018, 265, 513–523. [Google Scholar] [CrossRef]
  23. Dinnes, D.L.; Karlen, D.L.; Jaynes, D.B.; Kaspar, T.C.; Hatfield, J.L.; Colvin, T.S.; Cambardella, C.A. Nitrogen Management Strategies to Reduce Nitrate Leaching in Tile-Drained Midwestern Soils. Agron. J. 2002, 94, 153–171. [Google Scholar] [CrossRef]
  24. Staver, K.W.; Brinsfield, R.B. Using Cereal Grain Winter Cover Crops to Reduce Groundwater Nitrate Contamination in the Mid Atlantic Coastal Plain; SWCS: Hong Kong, China, 1998. [Google Scholar]
  25. Qi, Z.; Helmers, M.J. Soil Water Dynamics under Winter Rye Cover Crop in Central Iowa. Vadose Zone J. 2010, 9, 53. [Google Scholar] [CrossRef]
  26. Li, L.; Malone, R.W.; Ma, L.; Kaspar, T.C.; Jaynes, D.B.; Saseendran, S.A.; Thorp, K.R.; Yu, Q.; Ahuja, L.R. Winter Cover Crop Effects on Nitrate Leaching in Subsurface Drainage as Simulated by RZWQM-DSSAT. Trans. ASABE 2008, 51, 1575–1583. [Google Scholar] [CrossRef]
  27. Drury, C.F.; Tan, C.S.; Welacky, T.W.; Reynolds, W.D.; Zhang, T.Q.; Oloya, T.O.; McLaughlin, N.B.; Gaynor, J.D. Reducing Nitrate Loss in Tile Drainage Water with Cover Crops and Water-Table Management Systems. J. Environ. Qual. 2014, 43, 587–598. [Google Scholar] [CrossRef] [PubMed]
  28. Martinez-Feria, R.A.; Dietzel, R.; Liebman, M.; Helmers, M.J.; Archontoulis, S.V. Rye cover crop effects on maize: A system-level analysis. Field Crop. Res. 2016, 196, 145–159. [Google Scholar] [CrossRef]
  29. Parajuli, P.B.; Nelson, N.O.; Frees, L.D.; Mankin, K.R. Comparison of AnnAGNPS and SWAT model simulation results in USDA-CEAP agricultural watersheds in south-central Kansas. Hydrol. Process. 2009, 23, 748–763. [Google Scholar]
  30. Lee, S.; Yeo, I.-Y.; Sadeghi, A.M.; McCarty, G.W.; Hively, W.D.; Lang, M.W. Impacts of Watershed Characteristics and Crop Rotations on Winter Cover Crop Nitrateitrogen Uptake Capacity within Agricultural Watersheds in the Chesapeake Bay Region. PLoS ONE 2016, 11, e0157637. [Google Scholar] [CrossRef] [Green Version]
  31. Venishetty, V.; Parajuli, P.B. Assessment of BMPs by Estimating Hydrologic and Water Quality Outputs Using SWAT in Yazoo River Watershed. Agriculture 2022, 12, 477. [Google Scholar] [CrossRef]
  32. SWAT Homepage. SWAT Documentation. Available online: https://swat.tamu.edu/docs/ (accessed on 8 July 2023).
  33. MRCC. Annual Precipitation Data Summary; Midwestern Regional Climate Center: West Lafayette, IN, USA, 2020. [Google Scholar]
  34. Arnold, J.G.; Srinivasan, R.; Muttiah, R.S.; Williams, J.R. Large area hydrologic modeling and assessment part I: Model development. J. Am. Water Resour. Assoc. 1998, 34, 73–89. [Google Scholar] [CrossRef]
  35. Arnold, J.G.; Moriasi, D.N.; Gassman, P.W.; Abbaspour, K.C.; White, M.J.; Srinivasan, R.; Santhi, C.; Harmel, R.D.; Van Griensven, A.; Van Liew, M.W.; et al. SWAT: Model use, calibration, and validation. Trans. ASABE 2012, 55, 1491–1508. [Google Scholar] [CrossRef]
  36. Gassman, P.W.; Reyes, M.R.; Green, C.H.; Arnold, J.G.; Gassman, P.W. The soil and water assessment tool: Historical development, applications, and future research directions. Trans. ASABE 2007, 50, 1211–1250. [Google Scholar] [CrossRef] [Green Version]
  37. Gassman, P.W.; Sadeghi, A.M.; Srinivasan, R. Applications of the SWAT Model Special Section: Overview and Insights. J. Environ. Qual. 2014, 43, 1–8. [Google Scholar] [CrossRef]
  38. Bieger, K.; Arnold, J.G.; Rathjens, H.; White, M.J.; Bosch, D.D.; Allen, P.M.; Volk, M.; Srinivasan, R. Introduction to SWAT+, A Completely Restructured Version of the Soil and Water Assessment Tool. J. Am. Water Resour. Assoc. 2017, 53, 115–130. [Google Scholar] [CrossRef]
  39. USDA NASS (United States Department of Agriculture National Agricultural Statistics Service). Available online: https://www.nass.usda.gov/ (accessed on 8 July 2023).
  40. Abatzoglou, J.T. Development of gridded surface meteorological data for ecological applications and modelling. Int. J. Climatol. 2013, 33, 121–131. [Google Scholar] [CrossRef]
  41. Sobol, I.M. Sensitivity analysis for non-linear mathematical models. Math. Modeling Comput. Experiment. 1993, 1, 407–414. [Google Scholar]
  42. Schürz, C. Development of Tools and Interfaces for the Implementation, Pre-Processing, and Sensitivity Analysis of the SWAT Model in an R Programming Environment; Austrian Marshall Plan Foundation: Vienna, Austria, 2019. [Google Scholar]
  43. Moriasi, D.N.; Arnold, J.G.; Van Liew, M.W.; Bingner, R.L.; Harmel, R.D.; Veith, T.L. Model Evaluation Guidelines for Systematic Quantification of Accuracy in Watershed Simulations. Trans. ASABE 2007, 50, 885–900. [Google Scholar] [CrossRef]
  44. Moriasi, D.N.; Gitau, M.W.; Pai, N.; Daggupati, P. Hydrologic and water quality models: Performance measures and evaluation criteria. Trans. ASABE 2015, 58, 1763–1785. [Google Scholar] [CrossRef] [Green Version]
  45. Nash, J.E.; Sutcliffe, J.V. River flow forecasting through conceptual models part I—A discussion of principles. J. Hydrol. 1970, 10, 282–290. [Google Scholar] [CrossRef]
  46. Liu, H.L.; Yang, J.Y.; Tan, C.S.; Drury, C.F.; Reynolds, W.D.; Zhang, T.Q.; Bai, Y.L.; Jin, J.; He, P.; Hoogenboom, G. Simulating water content, crop yield and nitrate loss under free and controlled tile drainage with subsurface irrigation using the DSSAT model. Agric. Water Manag. 2011, 98, 1105–1111. [Google Scholar] [CrossRef]
  47. Jamieson, P.D.; Porter, J.R.; Wilson, D.R. A test of the computer simulation model ARCWHEAT1 on wheat crops grown in New Zealand. Field Crops Res. 1991, 27, 337–350. [Google Scholar] [CrossRef]
  48. Hargreaves, G.H.; Allen, R.G. History and evaluation of Hargreaves evapotranspiration equation. J. Irrig. Drain. Eng. 2003, 129, 53–63. [Google Scholar] [CrossRef]
  49. Sanford, W.E.; Selnick, D.L. Erratum to Estimation of Evapotranspiration across the Conterminous United States Using a Regression with Climate and Land-Cover Data. J. Am. Water Resour. Assoc. 2013, 49, 479. [Google Scholar] [CrossRef]
  50. Moriasi, D.N.; Gowda, P.H.; Arnold, J.G.; Mulla, D.J.; Ale, S.; Steiner, J.L. Modeling the impact of nitrogen fertilizer application and tile drain configuration on nitrate leaching using SWAT. Agric. Water Manag. 2013, 130, 36–43. [Google Scholar] [CrossRef]
  51. Bakhsh, A.; Kanwar, R.S.; Jaynes, D.B.; Colvin, T.S.; Ahuja, L.R. Simulating effects of variable nitrogen application rates on corn yields and NO3–N losses in subsurface drain water. Trans. ASAE 2001, 44, 269. [Google Scholar] [CrossRef]
  52. Rosa, A.T.; Creech, C.F.; Elmore, R.W.; Rudnick, D.R.; Lindquist, J.L.; Fudolig, M.; Butts, L.; Werle, R. Implications of cover crop planting and termination timing on rainfed maize production in semi-arid cropping systems. Field Crops Res. 2021, 271, 108251. [Google Scholar] [CrossRef]
Figure 1. USRB study area, streamflow monitoring station, and county coverage.
Agriculture 13 01484 g001
Figure 2. Flow chart of the methodology used in the study.
Agriculture 13 01484 g002
Figure 3. Model simulated hydrologic water balance for calibration period, 1994–2000, and validation period, 2001–2007 (Rest of flow = Surface Runoff + Lateral Flow+ Percolation).
Agriculture 13 01484 g003
Figure 4. Comparison of monthly observed and simulated streamflow: (a) calibration period, 1994–2000, and (b) validation period, 2001–2007.
Agriculture 13 01484 g004
Figure 5. Comparison of monthly observed and simulated NO3-N: (a) calibration period, 1994–2000, and (b) validation period, 2001–2007.
Agriculture 13 01484 g005
Figure 6. Comparison of model-simulated corn and soybean yields for both the calibration and validation periods, from 1994–2007.
Agriculture 13 01484 g006
Figure 7. Impacts of various management practices on (a) the average riverine NO3-N load and (b) corn-soybean yield.
Agriculture 13 01484 g007
Table 1. Long-term simulation scenarios.
MethodsScenarioN Application
Rates
Crop
Rotation
Description
ConventionalC-CS224, 202, 179Corn–soybean100% spring pre-plant N
application
40:60 split N
application
S-CS202, 179Corn–soybean40% spring pre-plant application and 60%
as side-dressing
40:60 split N
application
S-CRS202, 179Corn–rye–soybean
40:60 split N
application
S-CRSR202, 179Corn–rye–soybean–rye
Table 2. Model’s performance for streamflow.
ComponentsMonthly Statistics
Calibration Period (1994–2000)NSER-SquarePBIAS (%)n-RMSE (%)
Streamflow0.870.88−5.9-
Validation Period (2001–2007)NSER-SquarePBIAS (%)n-RMSE (%)
Streamflow0.750.78−10.6-
Table 3. Model performance for nitrate and crop yield.
ComponentsMonthly Statistics
Calibration Period (1994–2000)NSER-SquarePBIAS (%)n-RMSE (%)
Nitrate Load0.660.75−14.5-
Crop Yield
Corn--1216
Soybean--513
Validation Period (2001–2007)NSER-SquarePBIAS (%)n-RMSE (%)
Nitrate Load0.630.75−37.9-
Crop Yield
Corn--−17
Soybean--−619
Disclaimer/Publisher’s Note: The statements, opinions and data contained in all publications are solely those of the individual author(s) and contributor(s) and not of MDPI and/or the editor(s). MDPI and/or the editor(s) disclaim responsibility for any injury to people or property resulting from any ideas, methods, instructions or products referred to in the content.

