Article

Insecticide Monitoring in Cattle Dip with an E-Nose System and Room Temperature Screen-Printed ZnO Gas Sensors

by
Archibald W. Rohde
1,*,
Jacqueline M. Nel
2 and
Trudi-Heleen Joubert
1
1
Carl and Emily Fuchs Institute for Microelectronics (CEFIM), Department of Electrical, Electronic and Computer Engineering, University of Pretoria, Pretoria 0002, South Africa
2
Department of Physics, University of Pretoria, Pretoria 0002, South Africa
*
Author to whom correspondence should be addressed.
Agriculture 2023, 13(8), 1483; https://doi.org/10.3390/agriculture13081483
Submission received: 30 April 2023 / Revised: 20 June 2023 / Accepted: 18 July 2023 / Published: 26 July 2023
(This article belongs to the Section Agricultural Technology)

Abstract

:
Taktic, an Amitraz-based insecticide, is commonly used in sub-Saharan Africa to treat cattle for ticks. Due to misuse in rural dipping pools, some ticks are showing resistance to Taktic. This work presents a low-cost e-nose with commercial sensors to monitor Taktic levels in dipping pool water. The device shows distinctly different measurements for the odours of air, distilled water, farm water, and four levels of Taktic insecticide in farm water. A naive Bayes algorithm with a Gaussian distribution is trained on the data and a validation set achieves a 96.5% accuracy. This work also compares two sol-gel ZnO nanoparticle solutions with an off-the-shelf ZnO nanoparticle ink for use as active material in chemiresistive gas sensors to be employed in an e-nose array. The ZnO solutions are screen-printed onto gold electrodes, auto-sintered with a built in heater, and used with UV illumination to operate as low-power, room temperature gas sensors. All of the screen-printed ZnO sensors show distinct changes in resistance when exposed to Taktic vapours under room temperature and humidity conditions. The custom room temperature ZnO gas sensors fabricated via facile and low-cost processes are suitable for future integration in a point-of-need microsystem for the detection of Taktic in water.

1. Introduction

Amitraz, an acaricide, is a commonly used active ingredient in insecticides that target ticks. Amitraz-based insecticides are widely used to treat ticks in livestock [1], most commonly cattle. A common way this insecticide is applied is by spraying cattle with an insecticide–water mixture. This works well to treat most livestock [2]. However, poor rural communities in South Africa and the greater sub-Saharan African region still rely on communal dipping tanks. Community farmers drive their livestock through these troughs, submerging them in the insecticide–water mixture [1].
Amitraz-based insecticides, like the commercial Taktic, which is common in South Africa [3], have been showing declining efficacy against ticks as a consequence of continued misuse [4]. Misuse of acaricides contributes greatly to tick resistance. Many tick species are building a resistance to acaricides globally [5]. Studies also show that Amitraz-based insecticides, like Taktic, are no longer efficient when used below 23% of the recommended concentration [6]. Due to improper control of acaricide concentrations at dipping facilities, ticks do not fall from the host cattle and are responsible for life-threatening tick-borne diseases [7]. This could be due to cattle splashing out insecticide water from the dipping trough, causing it to be refilled with water, thereby reducing the effective insecticide concentration. Tick-borne diseases also affect humans, and the control of tick populations is not only important to livestock, but also to farm workers [8]. This study focuses on the insecticide with the brand name Taktic, which contains 12.5% of the active ingredient Amitraz. Taktic is a proprietary mixture of chemicals and the exact concentration of any chemical component is not known.
Traditional methods for testing insecticide concentrations can cost upwards of USD 21 per test [9] (reported in 2017) and require the sample to be transported to a centralised laboratory. Because dipping may be required more often than once a week during the rainy season [1,10], such tests are unsuitable to rural dipping facilities. Due to the remote nature of rural dipping facilities and the sensitivity to cost, an alternative to laboratory-based concentration monitoring must be found. Field monitoring of insecticide usage at communal cattle dipping facilities in disadvantaged and rural communities will be an invaluable tool. A low-cost and portable device that can estimate the Taktic insecticide concentration in the dip wash could empower rural small-scale farmers in Africa to actively and rapidly track dip insecticide concentrations. Feedback regarding the efficacy of their communal dipping facilities will enable them to optimise costs and keep insecticide levels where animals and the environment are less adversely affected, but ticks are effectively eradicated. Taktic has a strong odour and smells stronger to humans when mixed in higher concentrations. The strong odour of Taktic lends itself to detection with a gas-sensing modality.
An electronic nose (e-nose) is a device that mimics the human olfactory system [11]. The device passes the sample gas over an array of sensors and recognises specific odours based on their gas patterns using previously trained classifiers. Commercially available e-nose systems often used in research are the PEN3 (Airsense Analytics) [12,13] and the Cyranose 320 (Sensigent) [14]. A key driver in e-nose technology is portability and fast response [11] and, since these are very expensive and large, they are not suitable for low-cost rural usage. They are also not suited to wearable or low-power use cases. E-noses have recently been used in agriculture to detect mouldy apples [12] and volatile organic compounds in cheese [14], among others. They have also been used widely in medical research, most recently classifying patients with COVID-19 [13].
However, e-noses have not been used widely in the literature to detect insecticides. A recent e-nose paper [15] discriminates between five concentration levels of insecticides on apples using a standard PEN3 e-nose. The odour of the apples has a minimal effect on the sensors and the sensors respond almost linearly to an increase in insecticide. Another paper [16] uses the PEN3 e-nose to quantify pyrethroid pesticide contamination in tea using an artificial neural network (ANN). Most current works on insecticide detection with e-noses use commercial e-noses, and no known works use printed gas sensors to detect insecticides. The only known work for the detection of Taktic in water with an e-nose is our initial study [17]. In our previous work, it was found that metal oxide gas sensors are responsive to the gases produced by Taktic and water mixtures at the sample headspace [17]. In this work, an ANN is used to distinguish different concentrations of Taktic in distilled water in a laboratory environment. The paper does not take environmental effects, such as debris carried into the water by cattle, into account, and has to use time as an input variable for the artificial neural network classifier to distinguish between insecticide concentrations. Furthermore, this work uses expensive commercial sensors from Figaro [18].
At the core of an e-nose lies the gas sensors. There exist many different gas sensing technologies including optical gas sensors [19] and chemiresistive gas sensors such as metal oxide or organic chemiresistive sensors [20]. Other technologies include acoustic gas sensors and photonic crystal gas sensors [21], or piezoelectric chemical sensors [22]. A technology commonly used to detect odours and gases is chemiresistive metal oxide gas sensors. These are specifically attractive due to their low cost, facile fabrication, miniature size, and high sensitivity to diverse target gases [23]. In these semiconductor materials, oxygen (in reaction with the target gas) is adsorbed at the surface, generating electrical charges that change the impedance of the metal oxide layer [24]. The chemisorption process is generally catalysed by high temperature [21,25]. The sensor works by heating the active layer deposited on an electrode and measuring the change in impedance as chemicals in a gas reduce or oxidise on the surface [26].
Many recent works aim to improve current sensing technology. Since metal oxide gas sensors are not very selective to specific gases on their own, one could opt for methods to make the sensors more selective. Some methods include doping the metal oxides so they become more selective [27] or varying the temperature of sensors dynamically and getting a richer data output [28]. Highly integrated on-chip e-nose systems have been proposed where different metal oxide sensors are both doped and used together to increase system selectivity to different gases [29]. Hybrid nano-carbon structures also show improved selectivity [30,31]. However, in an e-nose configuration where multiple gas sensor materials are used, highly selective sensors are not needed, because system selectivity comes from a classification algorithm trained on data from less specific sensors. To reduce power dissipation in e-noses, one could look towards low-power micropumps or enhanced gas path design. To improve current e-nose technology, one could also reduce the power usage of the metal oxide gas sensors, as heating them dissipates a lot of energy. More recent studies suggest using UV light as a replacement for heating the metal oxide [32], since UV radiation can also increase the intra-grain conductivity and generate electron hole pairs [33]. This improves gas sensing reactivity at room temperature while significantly reducing the sensor power dissipation. UV illumination allows facile and fast oxidation and reduction [32], allowing such gas sensors to operate at near-room temperatures.
ZnO, a common metal oxide used in gas sensing, can be activated by a wide range of light irradiation wavelengths, including the visible spectrum. However, the highest activation response is for UV light. Lower wavelengths generally perform better, but one could even use visible light to activate the metal oxide, with 429 nm blue light achieving the same effect as heating ZnO to 200 °C [34]. UV light has also been used to completely anneal carbon nanofibres in gas sensors, and these may operate as a more stable gas sensor compared to ones that are sintered and activated by heat transfer [35]. It has been demonstrated that not only are the dynamics of recovery assisted by UV irradiation, but continuous irradiation also improves the sensing performance for some gas species. By enhancing oxidation or reduction with light irradiation, sensors show improved gas response and can rapidly recover after being exposed to a target gas [36]. Because the physical mechanisms are not yet understood, the irradiation parameters of wavelength and optical power must currently be optimised empirically for a sensor–analyte pair.
Current research clearly tends towards improved sensitivity (e.g., increased porous surface area [37]), improved response and recovery times [36], low-temperature operation [32], improved power dissipation, tuning of materials for improved selectivity (doping the metal-oxides so they become specific to certain chemicals [27]), or improved long-term drift, miniature, and flexible form factor. Printing technologies provide the impetus to many of these research trends. A number of low-cost, chemical methods for the deposition of metal oxide thin films have been used in the literature, such as spray pyrolysis, chemical bath deposition, sol-gel spin coating, screen printing, electrodeposition, doctor blading, and inkjet printing [38,39,40]. Other metal oxide deposition methods include dip coating and drop coating, as well as aerosol jet printing [40,41]. The latest techniques for deposition are electrohydrodynamic (EHD) [42], microextrusion [43] and roll-to-roll gravure printing [44] for upscaling to mass manufacturing. By using chemical solutions like the sol-gel method [45,46] to prepare metal oxide nanoparticles, it is also possible for the films to be doped and the dopant is distributed uniformly throughout the thin film. Deposition using chemical solutions minimises the processing costs of the films used for the gas sensors using these techniques mentioned above.
Screen printing is a mature technology [47] that is well suited to fast prototyping, due to its fast printing speed [48]. It is also easily scalable to mass manufacturing and can be used with a vast range of functional materials. Another reason screen printing is an attractive means of making low-cost gas sensors is that it is an accessible and decentralised means of manufacturing. Sensors can be made on-site or anywhere in the world. This is specifically important if sensors will be made or used rurally. Printed sensors usually operate at elevated temperatures, or with keen material engineering to prevent slow response times. Few printed sensors consider UV irradiation [35,49]. A recent paper [35] uses UV irradiation to both sinter and activate carbon nanofibres in a flexible gas sensor.
If one considers low-cost deposition techniques for metal oxides, combined with low-cost UV illumination to facilitate room temperature sensor activation, metal oxide gas sensors yield a suitable solution for monitoring gases in rural areas and producing those sensors close by.
ZnO is reactive to a wide range of gases including certain solvents and a range of hydro-carbons [26]. It is very likely that ZnO should respond to Taktic and was, therefore, chosen to manufacture the gas sensors. ZnO can react as a gas sensor at room temperature and can be photo-activated under UV light to increase sensitivity [33]. By operating a metal-oxide gas sensor at room temperature, several benefits are achieved, namely that it reduces the long term drift caused by the sintering effect, reduces sensor instability, and drastically reduces power usage [50].
In this work, it is important to show if a sensor array of commercial low-cost sensors would be sufficient to distinguish the odour of Taktic from other odours that are expected at a dipping facility. Furthermore, it is important to assess whether screen-printed, room temperature ZnO gas sensors are responsive to Taktic, because these could allow lower-cost sensing systems, which would be more accessible to rural small-scale farmers.
Section 2 presents the materials and methods for the experiments of this work. Section 3 presents the results of the experiments, and Section 4 provides a discussion of the results and gives insight to proposed future work.
The general structure of this paper is presented in Figure 1. Section 2, Section 3 and Section 4 are split into two subsections each: a subsection for an e-nose that is made with commercial gas sensors, and a subsection for screen printed ZnO gas sensors.

2. Materials and Methods

2.1. Materials and Methods for an E-Nose That Is Made with Commercial Gas Sensors

In this section, the materials and methods for the fabrication and experiments for an e-nose that is made with commercial gas sensors are described.

2.1.1. Design of E-Nose with Commercial Sensors

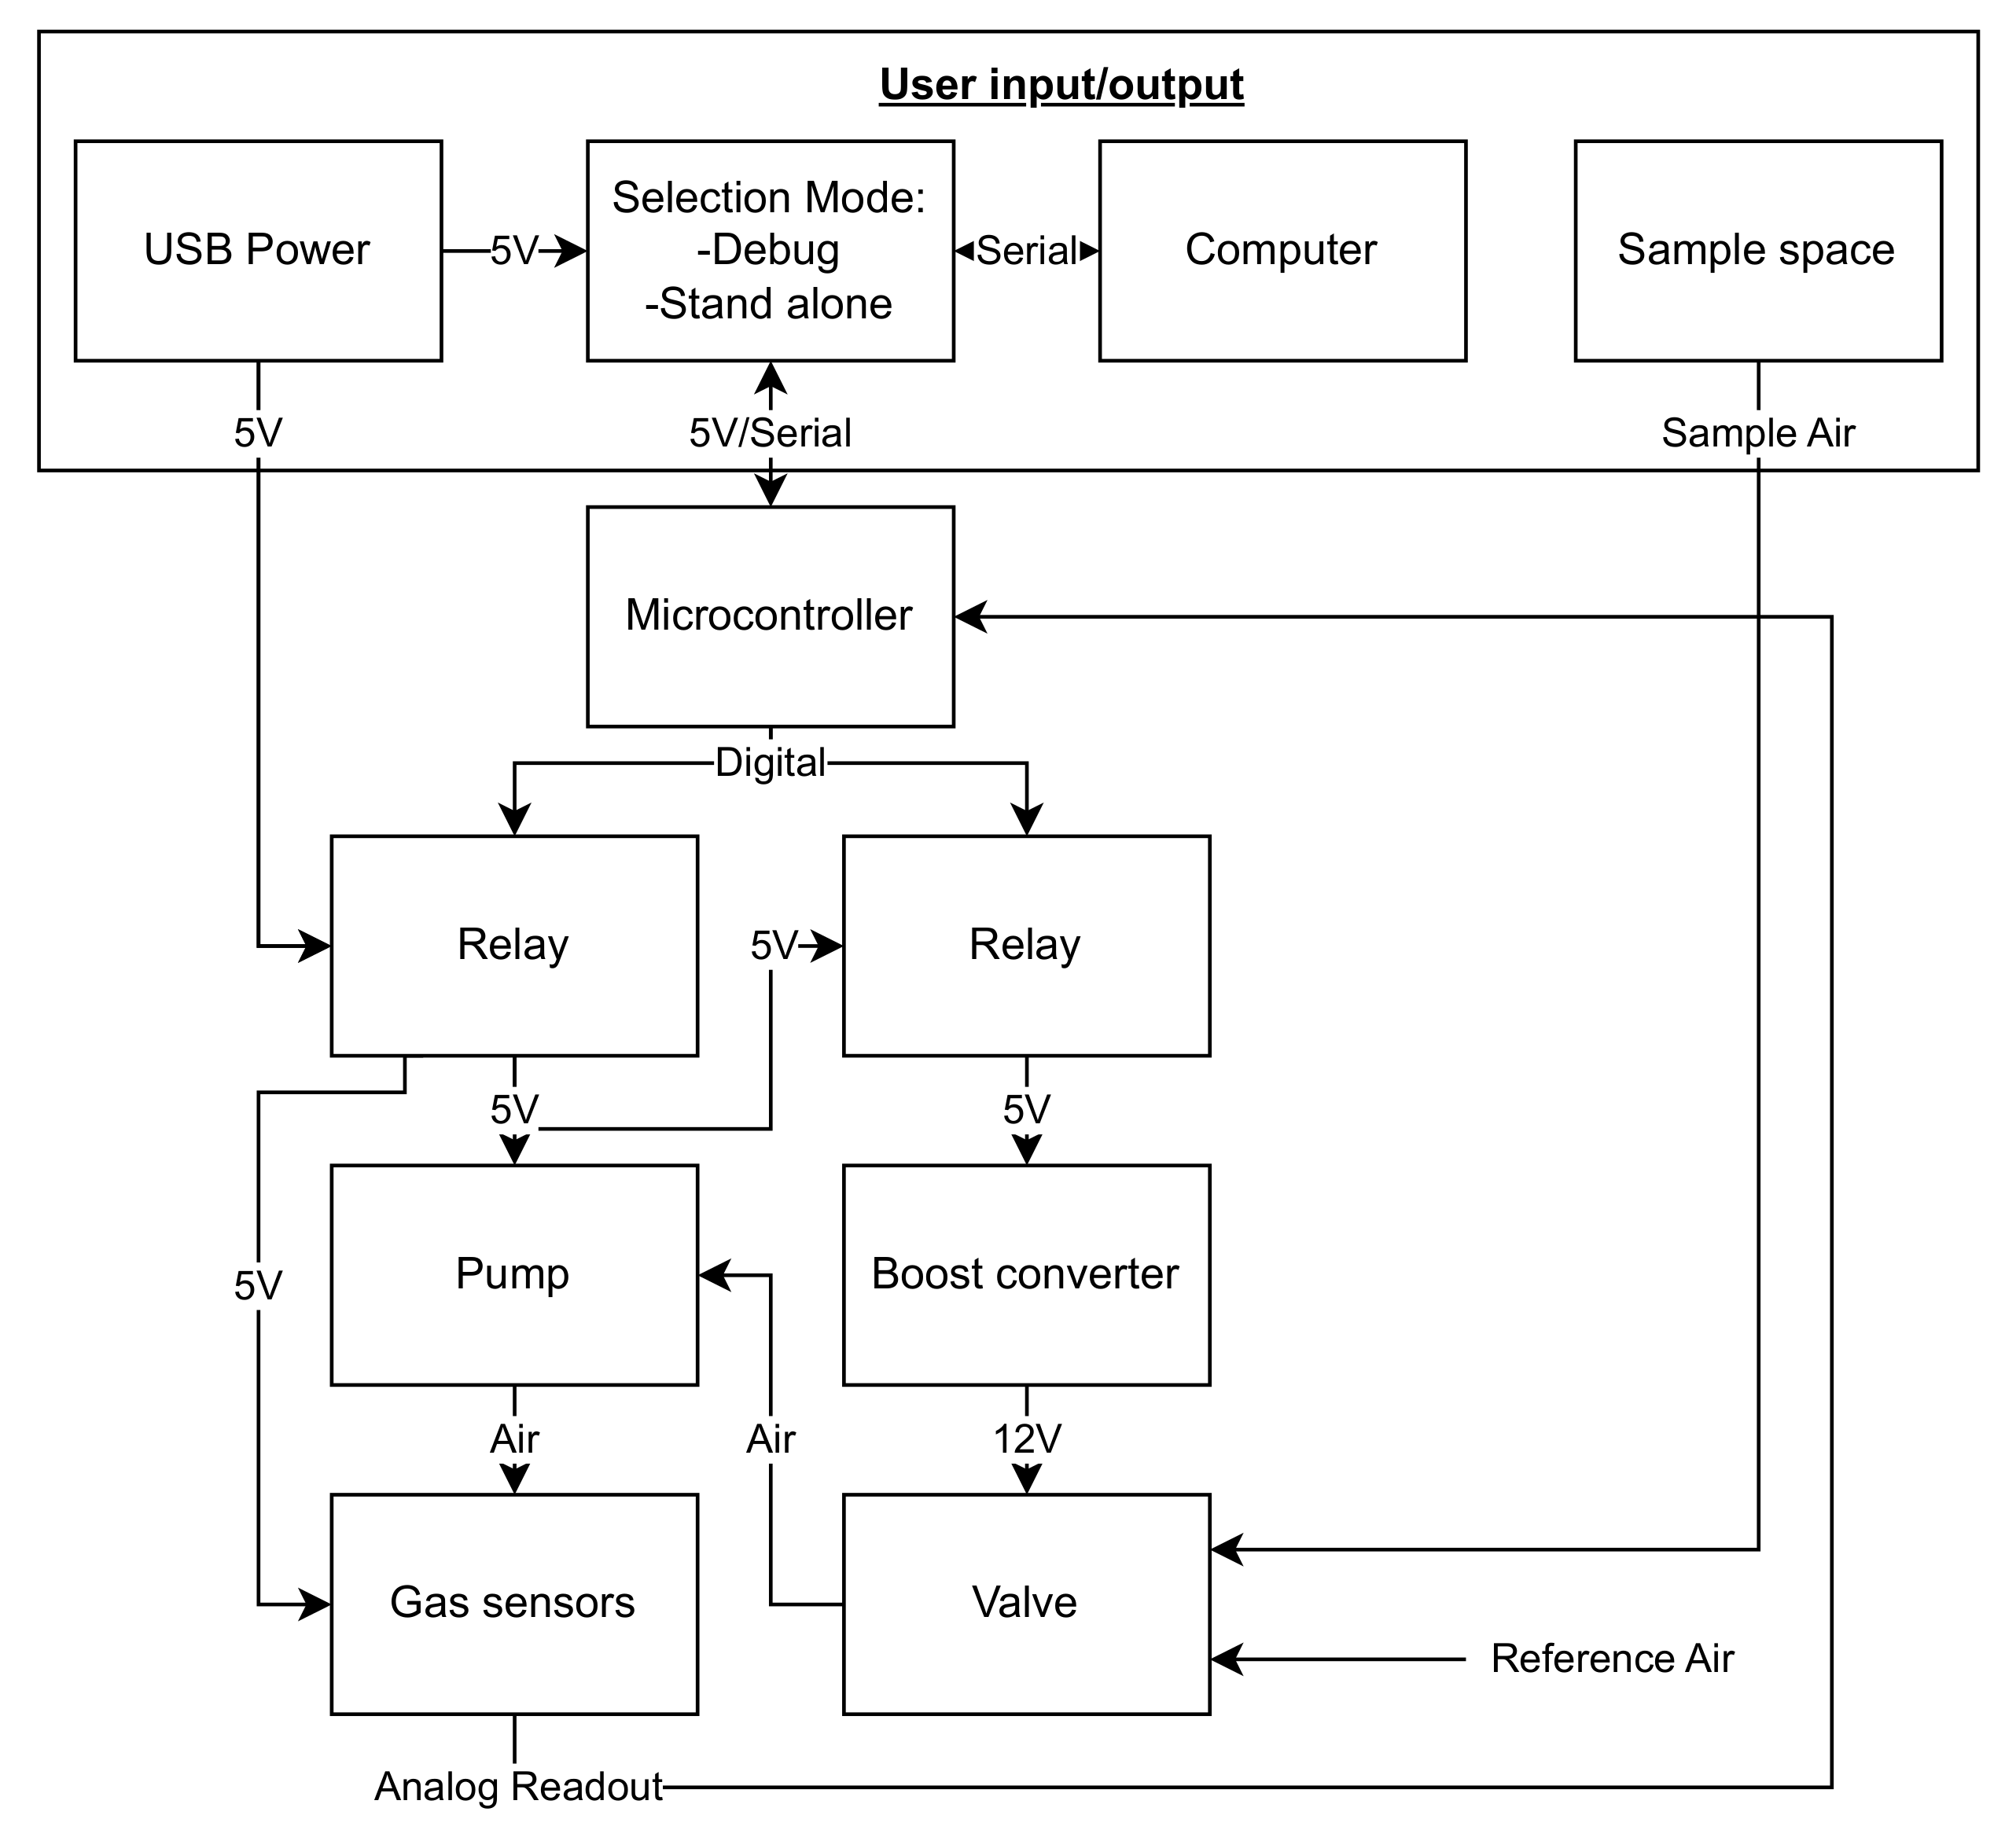
A low-cost e-nose is constructed with off-the-shelf components. These are chosen for price and availability. The system uses the low-cost MQ series of sensors for gas detection. Since the MQ sensors are unlabelled and unmarked, an assortment of 6 different sensors, from the range MQ2-MQ9, are used in the system. The sensor analogue outputs are read by the analogue-to-digital converter (ADC) pins of an Arduino Nano Every. To ensure previous samples do not affect the sensor readout, the sensor space needs to be purged of sample air by replacing it with reference air. This microcontroller also controls the airflow in the system, switching gas delivery to the sensors from reference air to sample air after every measurement to ensure the sensors are adequately purged. This is done by controlling a 3-way valve and a pump with relay circuits. The relays protect the microcontroller from back electromagnetic fields (EMF), and allow a higher power draw from the valve and pump than can be given by the microcontroller. The relays could be substituted for Mosfets with lower power consumption and form factor, but since the commercial gas sensors dominate the size and power constraints of the system, relays are a good choice. Relays are easier to replace and are more widely available, making self-service in a farm setting more straightforward and accessible. The valve uses a 12V power rail and needs a boost converter to run on the 5V system rail voltage. The system is powered by USB so that it can be made portable with a USB power bank. A system diagram is shown in Figure 2.
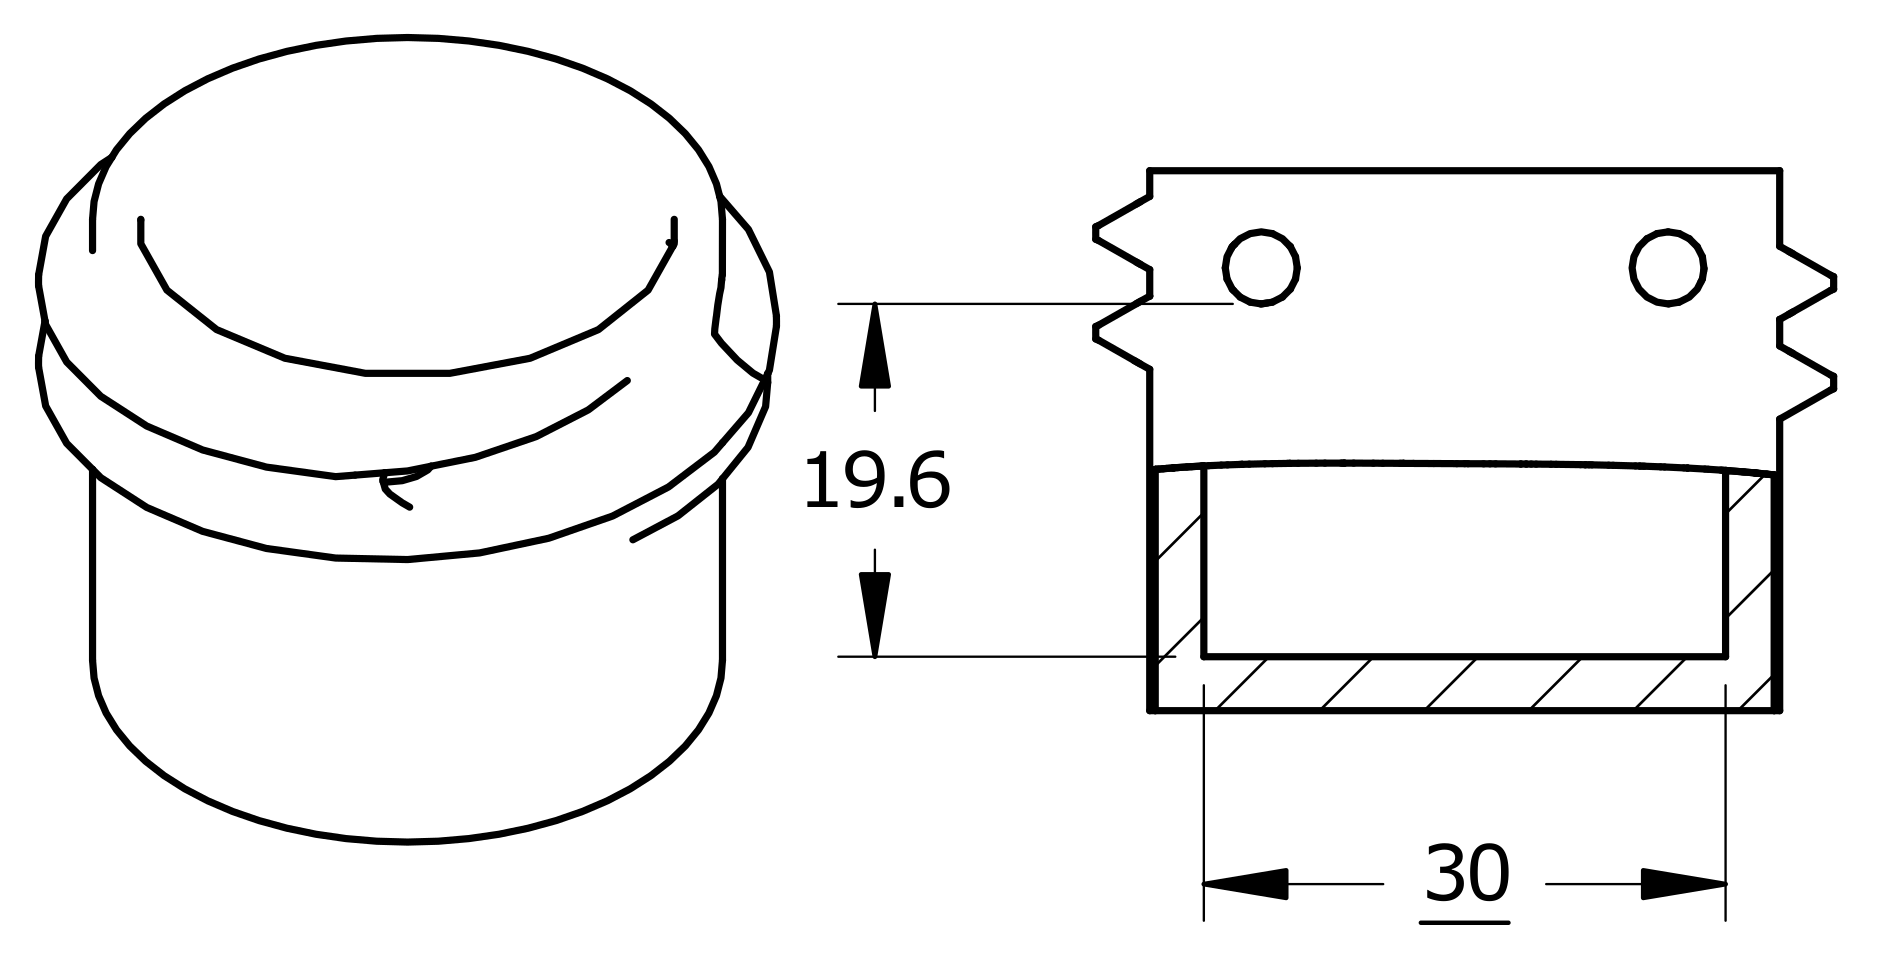
When used in the field, farmers will collect dipping tank water and bring it to the e-nose for measurement. For this reason, an easy-to-use sampling system is designed. For every measurement, 10 mL of sample fluid is transferred to the sample holder in Figure 3. The sample holder has holes through the screw thread. The sample holder, with an inner diameter of 30 mm, holds 10 mL fluid up to approximately 14.1 mm from the base. This leaves 5.5 mm of headspace from the bottom of the holes for a 10 mL sample. A lid, with corresponding holes, is screwed over the sample holder and the e-nose then sucks air through one of the holes, creating a circular flow over the fluid surface interface, allowing for optimal gas transfer to the e-nose.
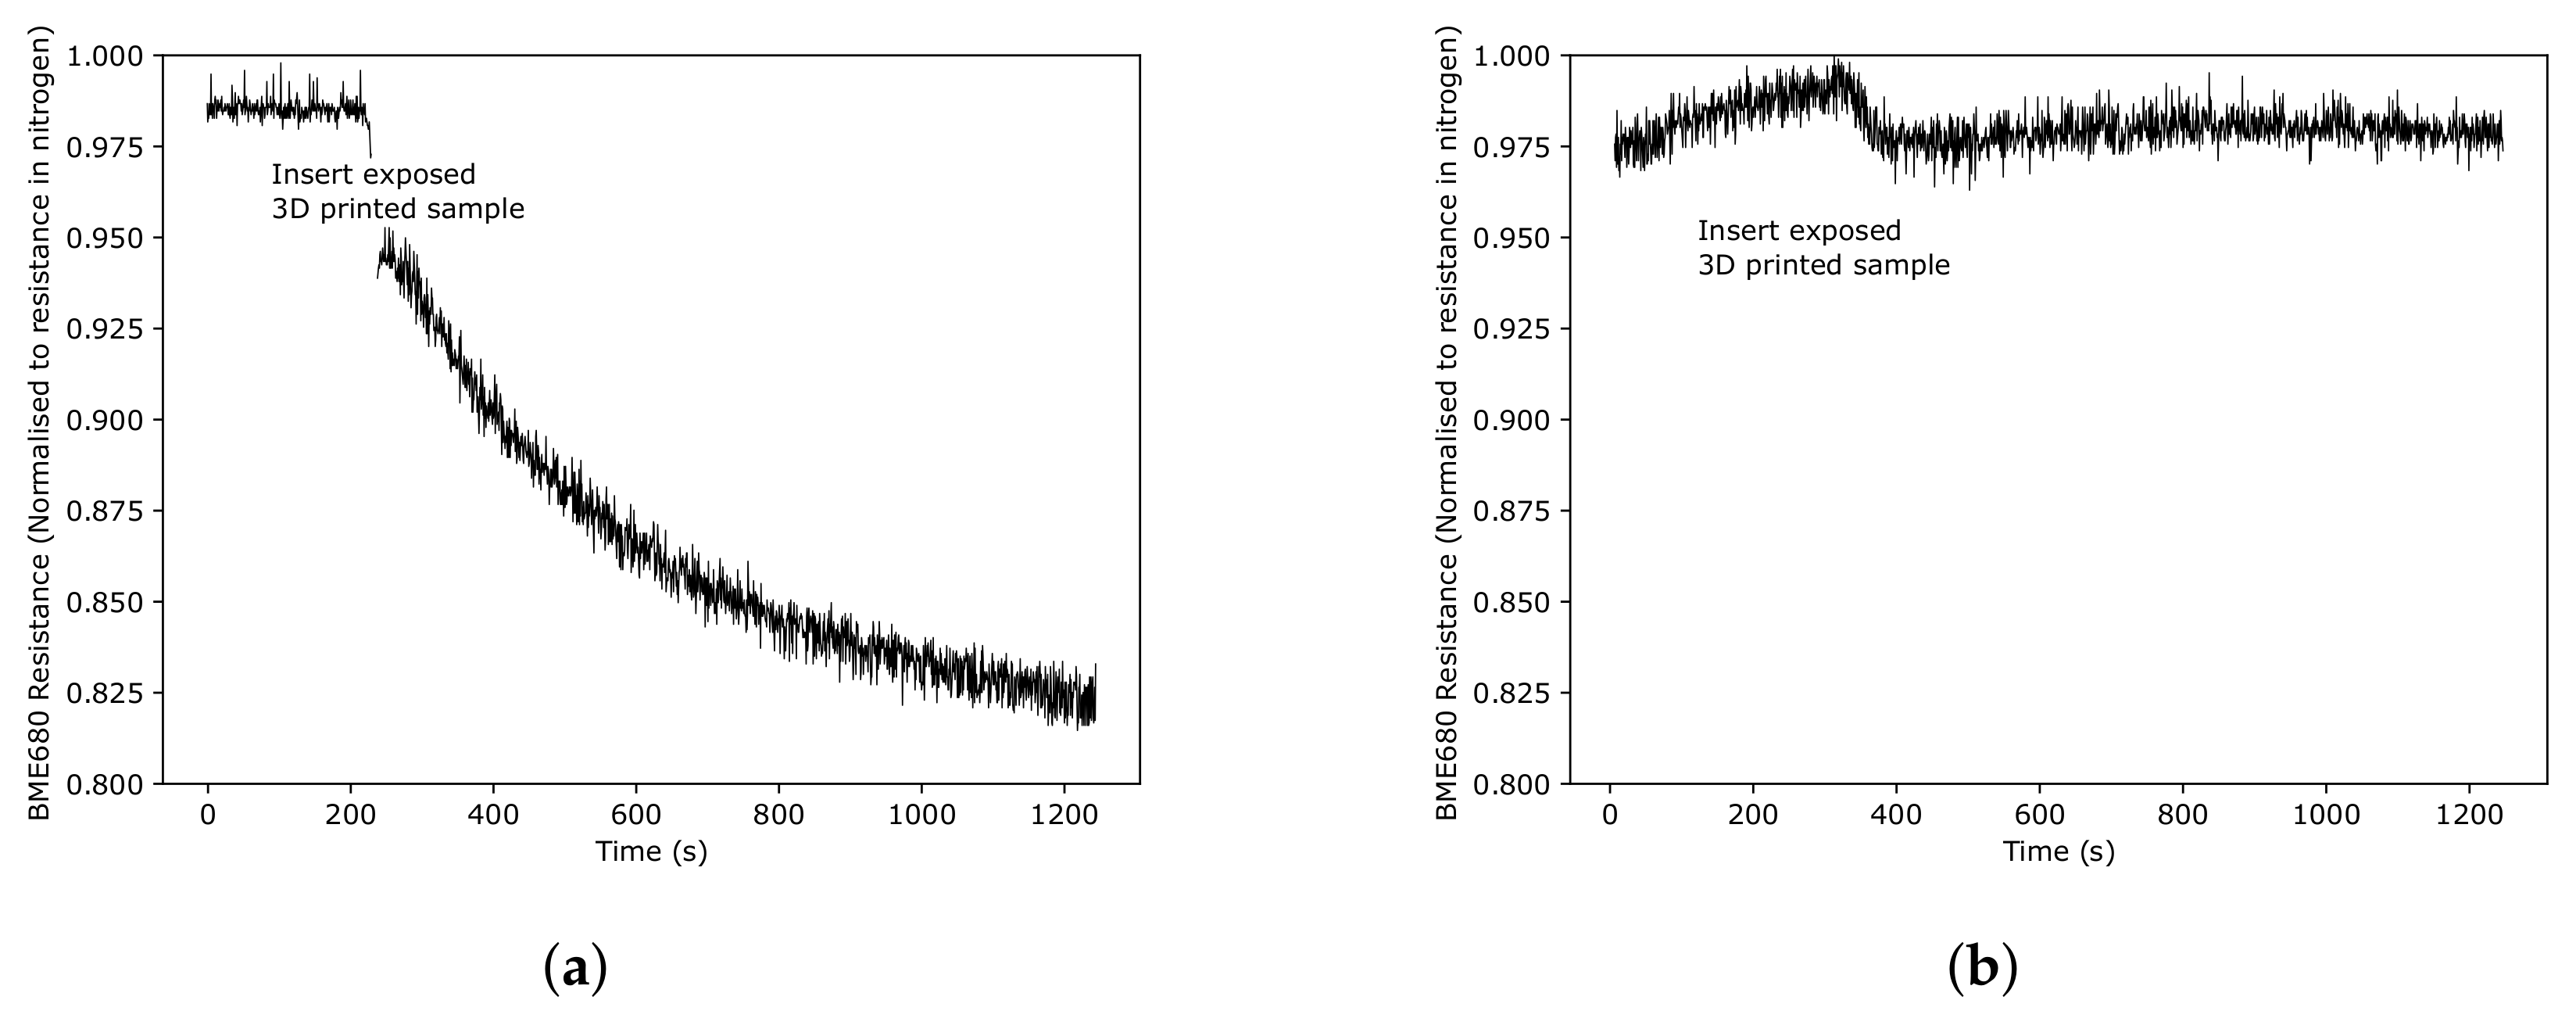
This holder is printed with the standard white printing resin from Formlabs [51]. From the technical datasheet of the resin, it is non-reactive with most solvents and mostly inert [52]. The relative inert nature of the resin is proven by exposing a printed resin component to the gases from Taktic during experimentation, measuring the immediate out-gassing with a Bosch BME680, and comparing that to the out-gassing after 12 h. The BME680 sensor was exposed to pure nitrogen in a glass jar until a stable readout was achieved. The exposed resin is then placed in the glass jar with the gas sensor. The immediate out-gassing of the resin is shown in Figure 4a. The same experiment is performed 12 h later and is shown in Figure 4b. In Figure 4, the sensor responses are normalised to the stabilised measurement of nitrogen. From experimentation, there is an expected 10% variation in sensor resistance when exposed to pure nitrogen.
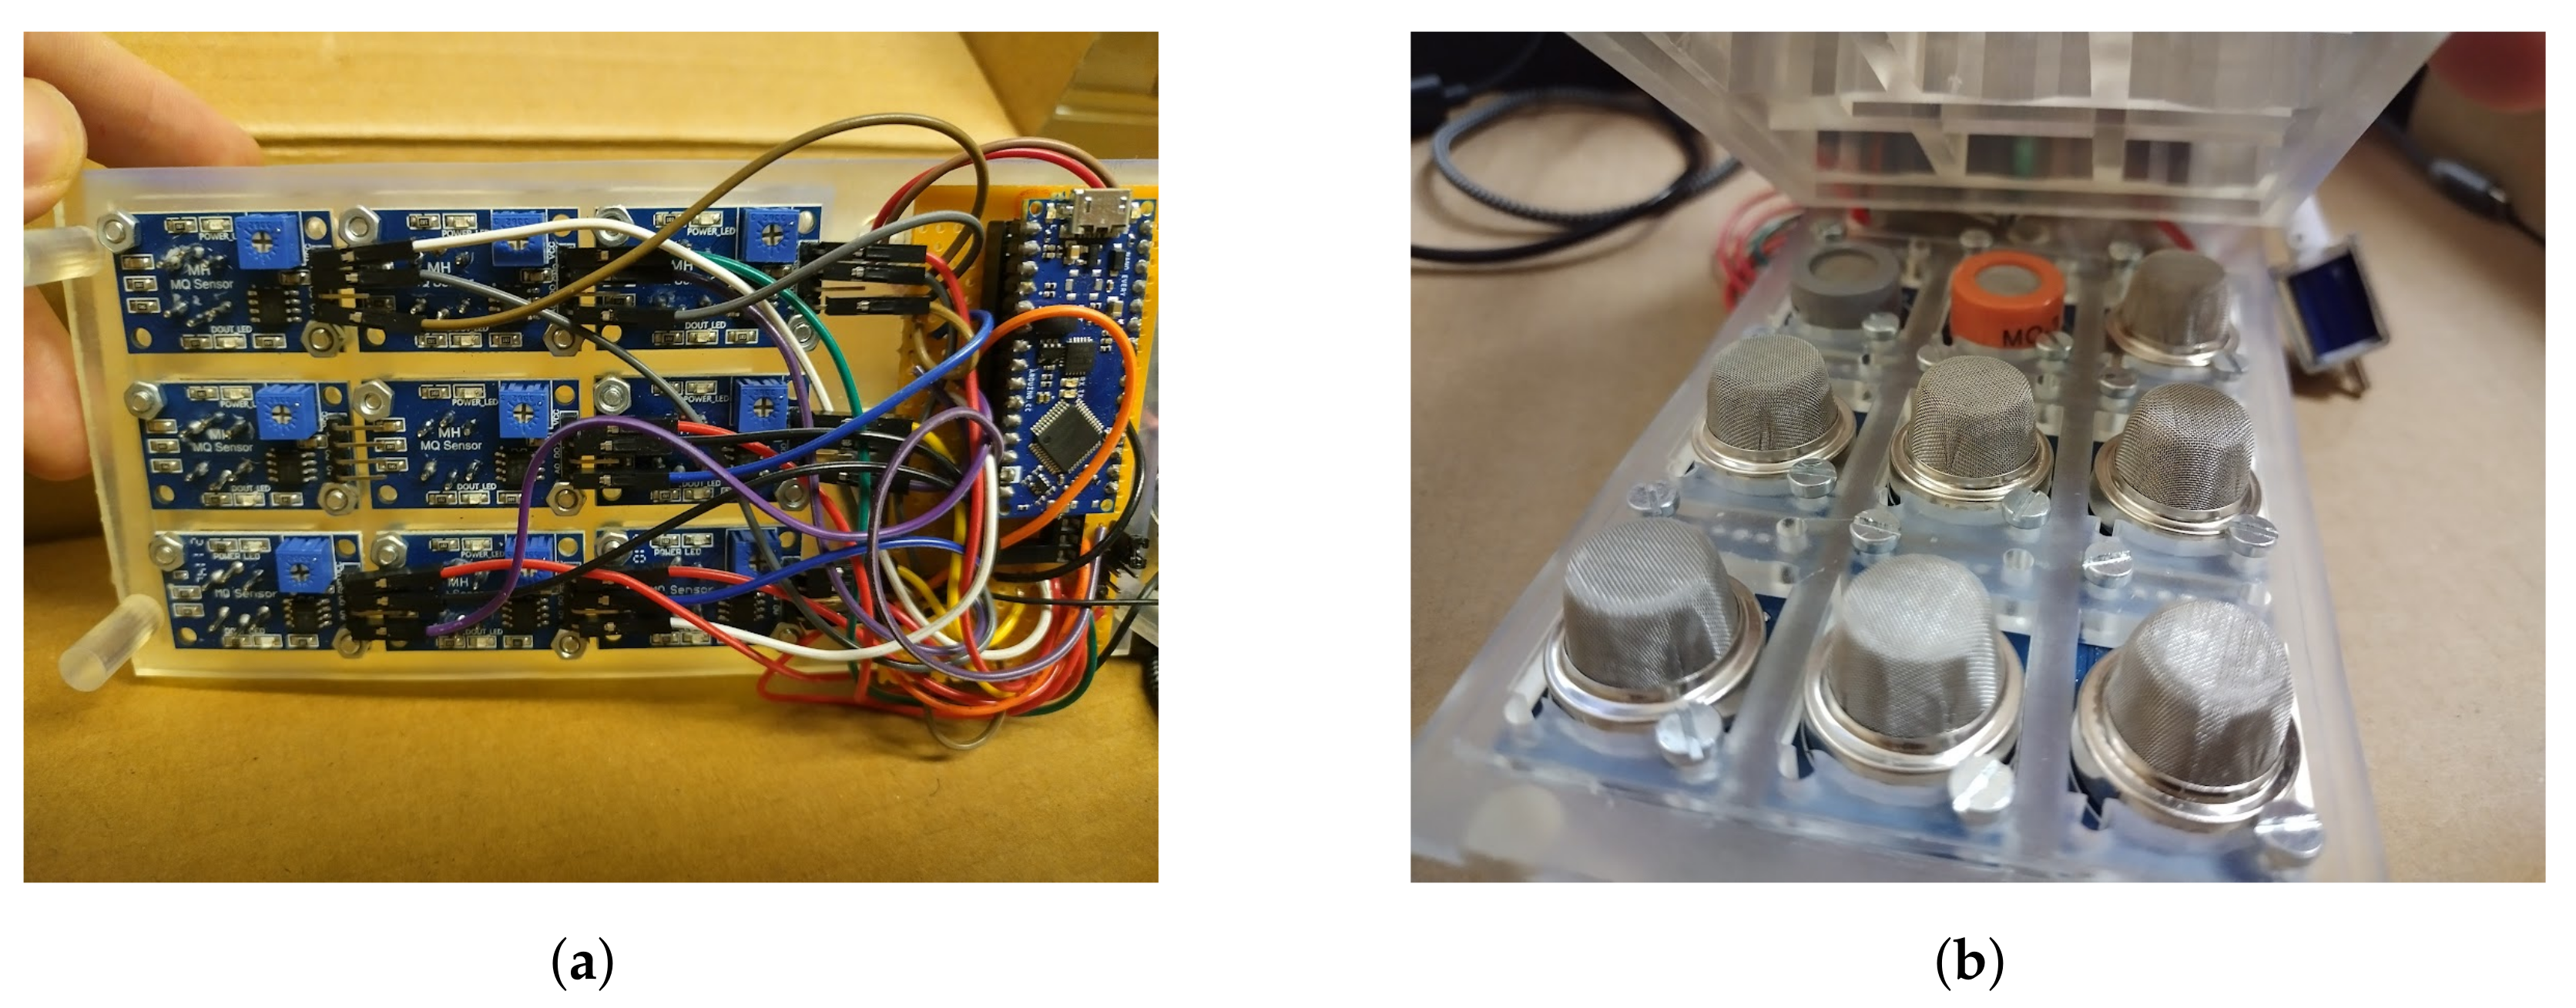
From Figure 4, it is clear that the 3D-printed components will not affect the device measurements if the device is not used to measure in rapid succession. The gas is pumped through Teflon tubes to the sensor enclosure and the gas sensors give readout to a microcontroller. Images of the completed e-nose can be seen in Figure 5.

2.1.2. Sample Preparation for E-Nose with Commercial Sensors

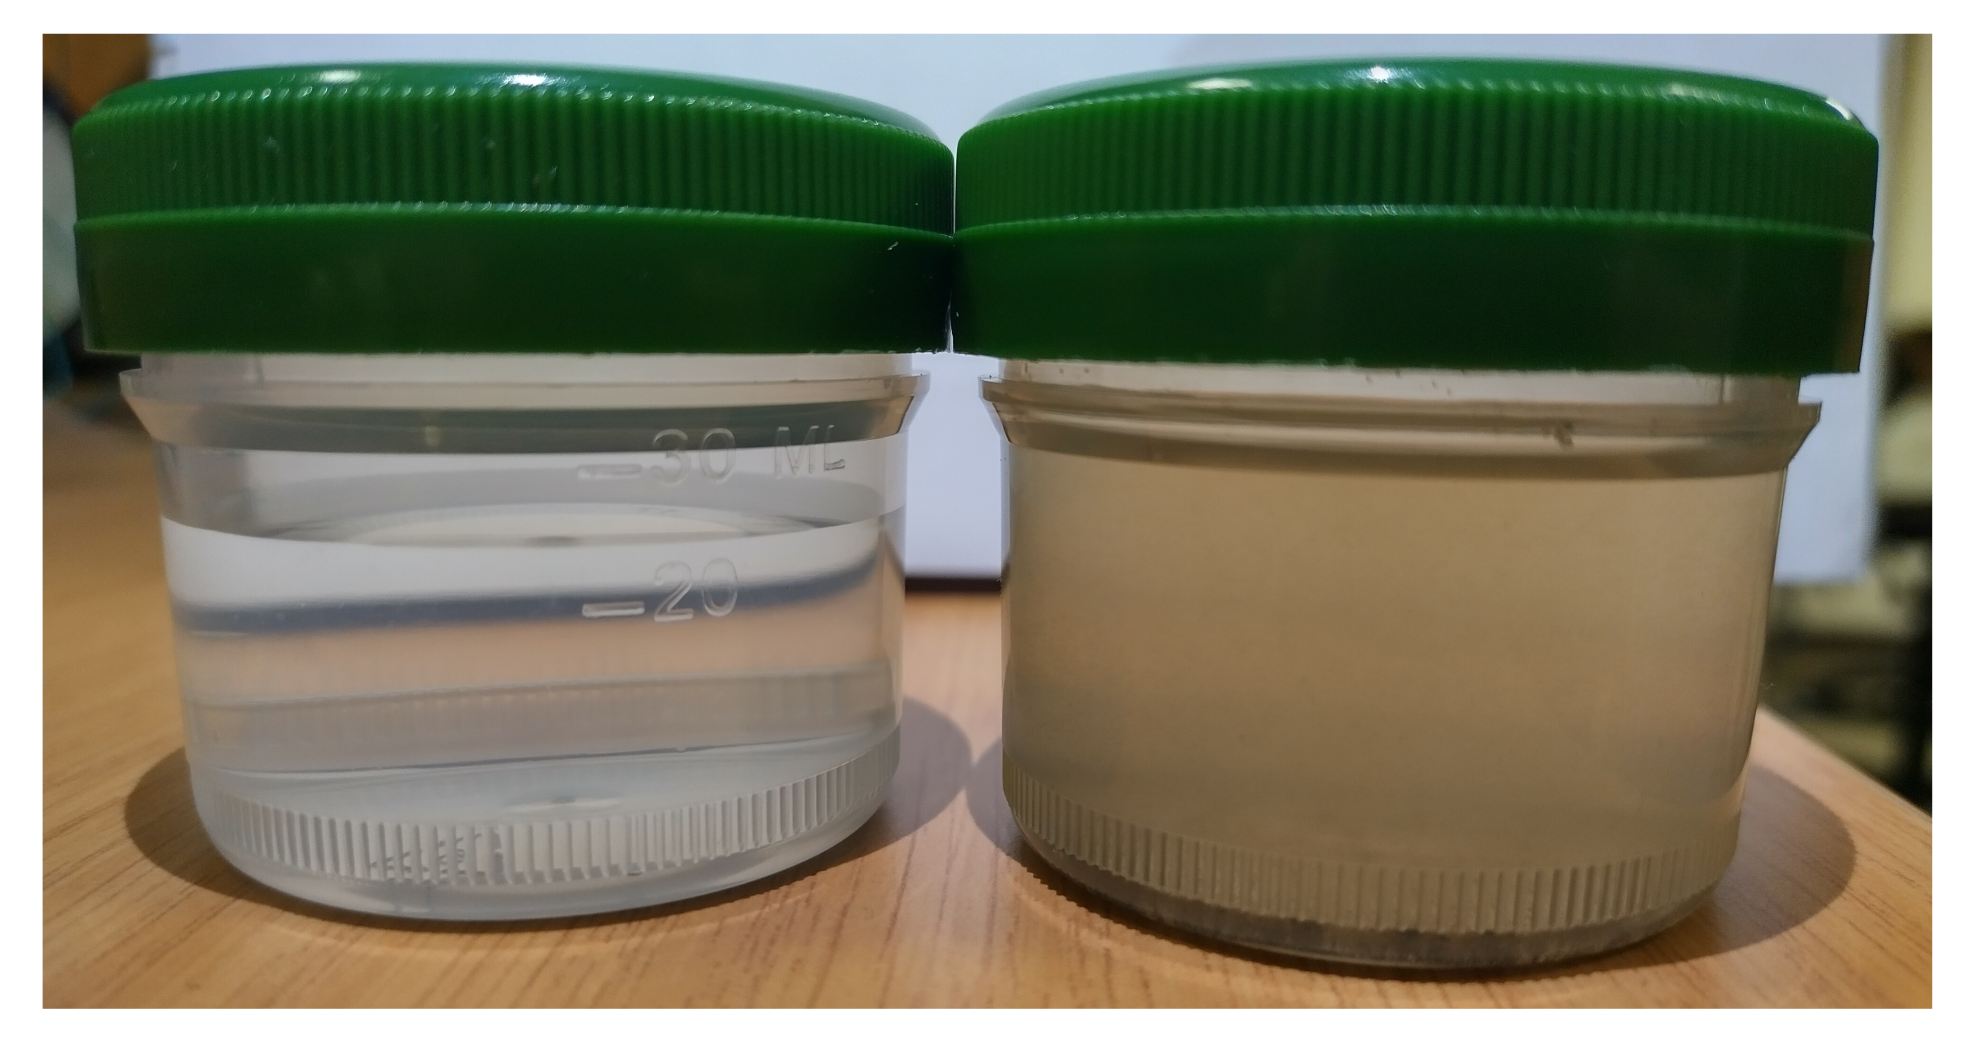
Cattle dipping pools often do not have foot baths, and this leads to mud and debris entering the dipping pools [1]. The e-nose needs to be able to discriminate between the baseline contaminated farm water, clean water, air, and farm water with different concentrations of insecticide. Since the insecticide becomes inefficient when used below 23% of the recommended concentration [6], this is a key concentration the system must be able to warn the user against. The prepared samples for the experiment are chosen as 0%, 25%, 50%, 100%, and 200% of the recommended insecticide concentration. In addition to this, the response to air and distilled water is also recorded. If the system can discriminate between the odours of these samples, it should be able to warn the user if there is too much or too little insecticide before the solution becomes inefficient. Soil, debris, and manure are collected from the Univeristy of Pretoria Experimental Farm cattle enclosure and mixed with tap water (Pretoria). This should mimic the debris carried into dipping pools by cattle [1] and is further referred to as ’farm water’ in this paper. It is distinguishable from distilled water, not only in odour, but also in appearance. This can be seen in Figure 6.
Taktic is added to the farm water with a 10   μ L precision Agilent gold standard autosampler syringe. The recommended concentration of Taktic is 2000 ppm in water. The samples were, therefore, prepared as in Table 1. In addition to the samples in Table 1, the system is also presented with samples of distilled water and air.

2.1.3. Experimental Setup for E-Nose with Commercial Sensors

The e-nose with commercial gas sensors is exposed to the samples prepared in Section 2.1.2. The samples are contained in the sample holder in Figure 3 during the measurements. The final e-nose with commercial gas sensors can be seen in Figure 7, where it is measuring a sample.

2.2. Materials and Methods for Screen-Printed ZnO Gas Sensors

In this section, the materials and methods for the fabrication and experiments with screen printed ZnO gas sensors are described. ZnO gas sensors are made by depositing nanoparticle ZnO solutions onto gold electrodes. These are then also tested for their detection capabilities of Taktic in water.

2.2.1. Fabrication of Screen Printed ZnO Gas Sensors

Three ZnO nanoparticle solutions are compared for use as gas sensors with the proposed insecticide, Taktic:
  • The first ZnO solution was prepared by dissolving zinc acetate dihydrate (Saarchem UnivAR, Mumbai, India) in isopropanol (ACE Platinum line (AR), Johannesburg, South Africa) [45]. Monoethanolamine (MEA) (ACE Gold line (CP), Johannesburg, South Africa) was added to the solution, maintaining a molar ratio of MEA to zinc acetate dihydrate of 1.0 and the concentration of zinc acetate of 0.5 M. All precursors were used as received, without further processing. The solution was continuously stirred for 2 h at 60 °C to obtain a homogeneous and clear solution. This solution was aged for 48 h before use;
  • The second ZnO solution was also made with the sol-gel process, but substituted isopropanol with ethanol (Merck/Sigma-Aldrich, Darmstadt, Germany) (as in [46]). For this solution, the concentration of the zinc acetate dihydrate (Merck/Sigma-Aldrich, Darmstadt, Germany) was 1.5 M;
  • As a validation metric, the final solution is an off-the-shelf ZnO nanoparticle ink. Avantama N-10, Nanograde N-10, ZnO suspension was purchased from Merck/Sigma-Aldrich, Darmstadt, Germany, and was used without further processing.
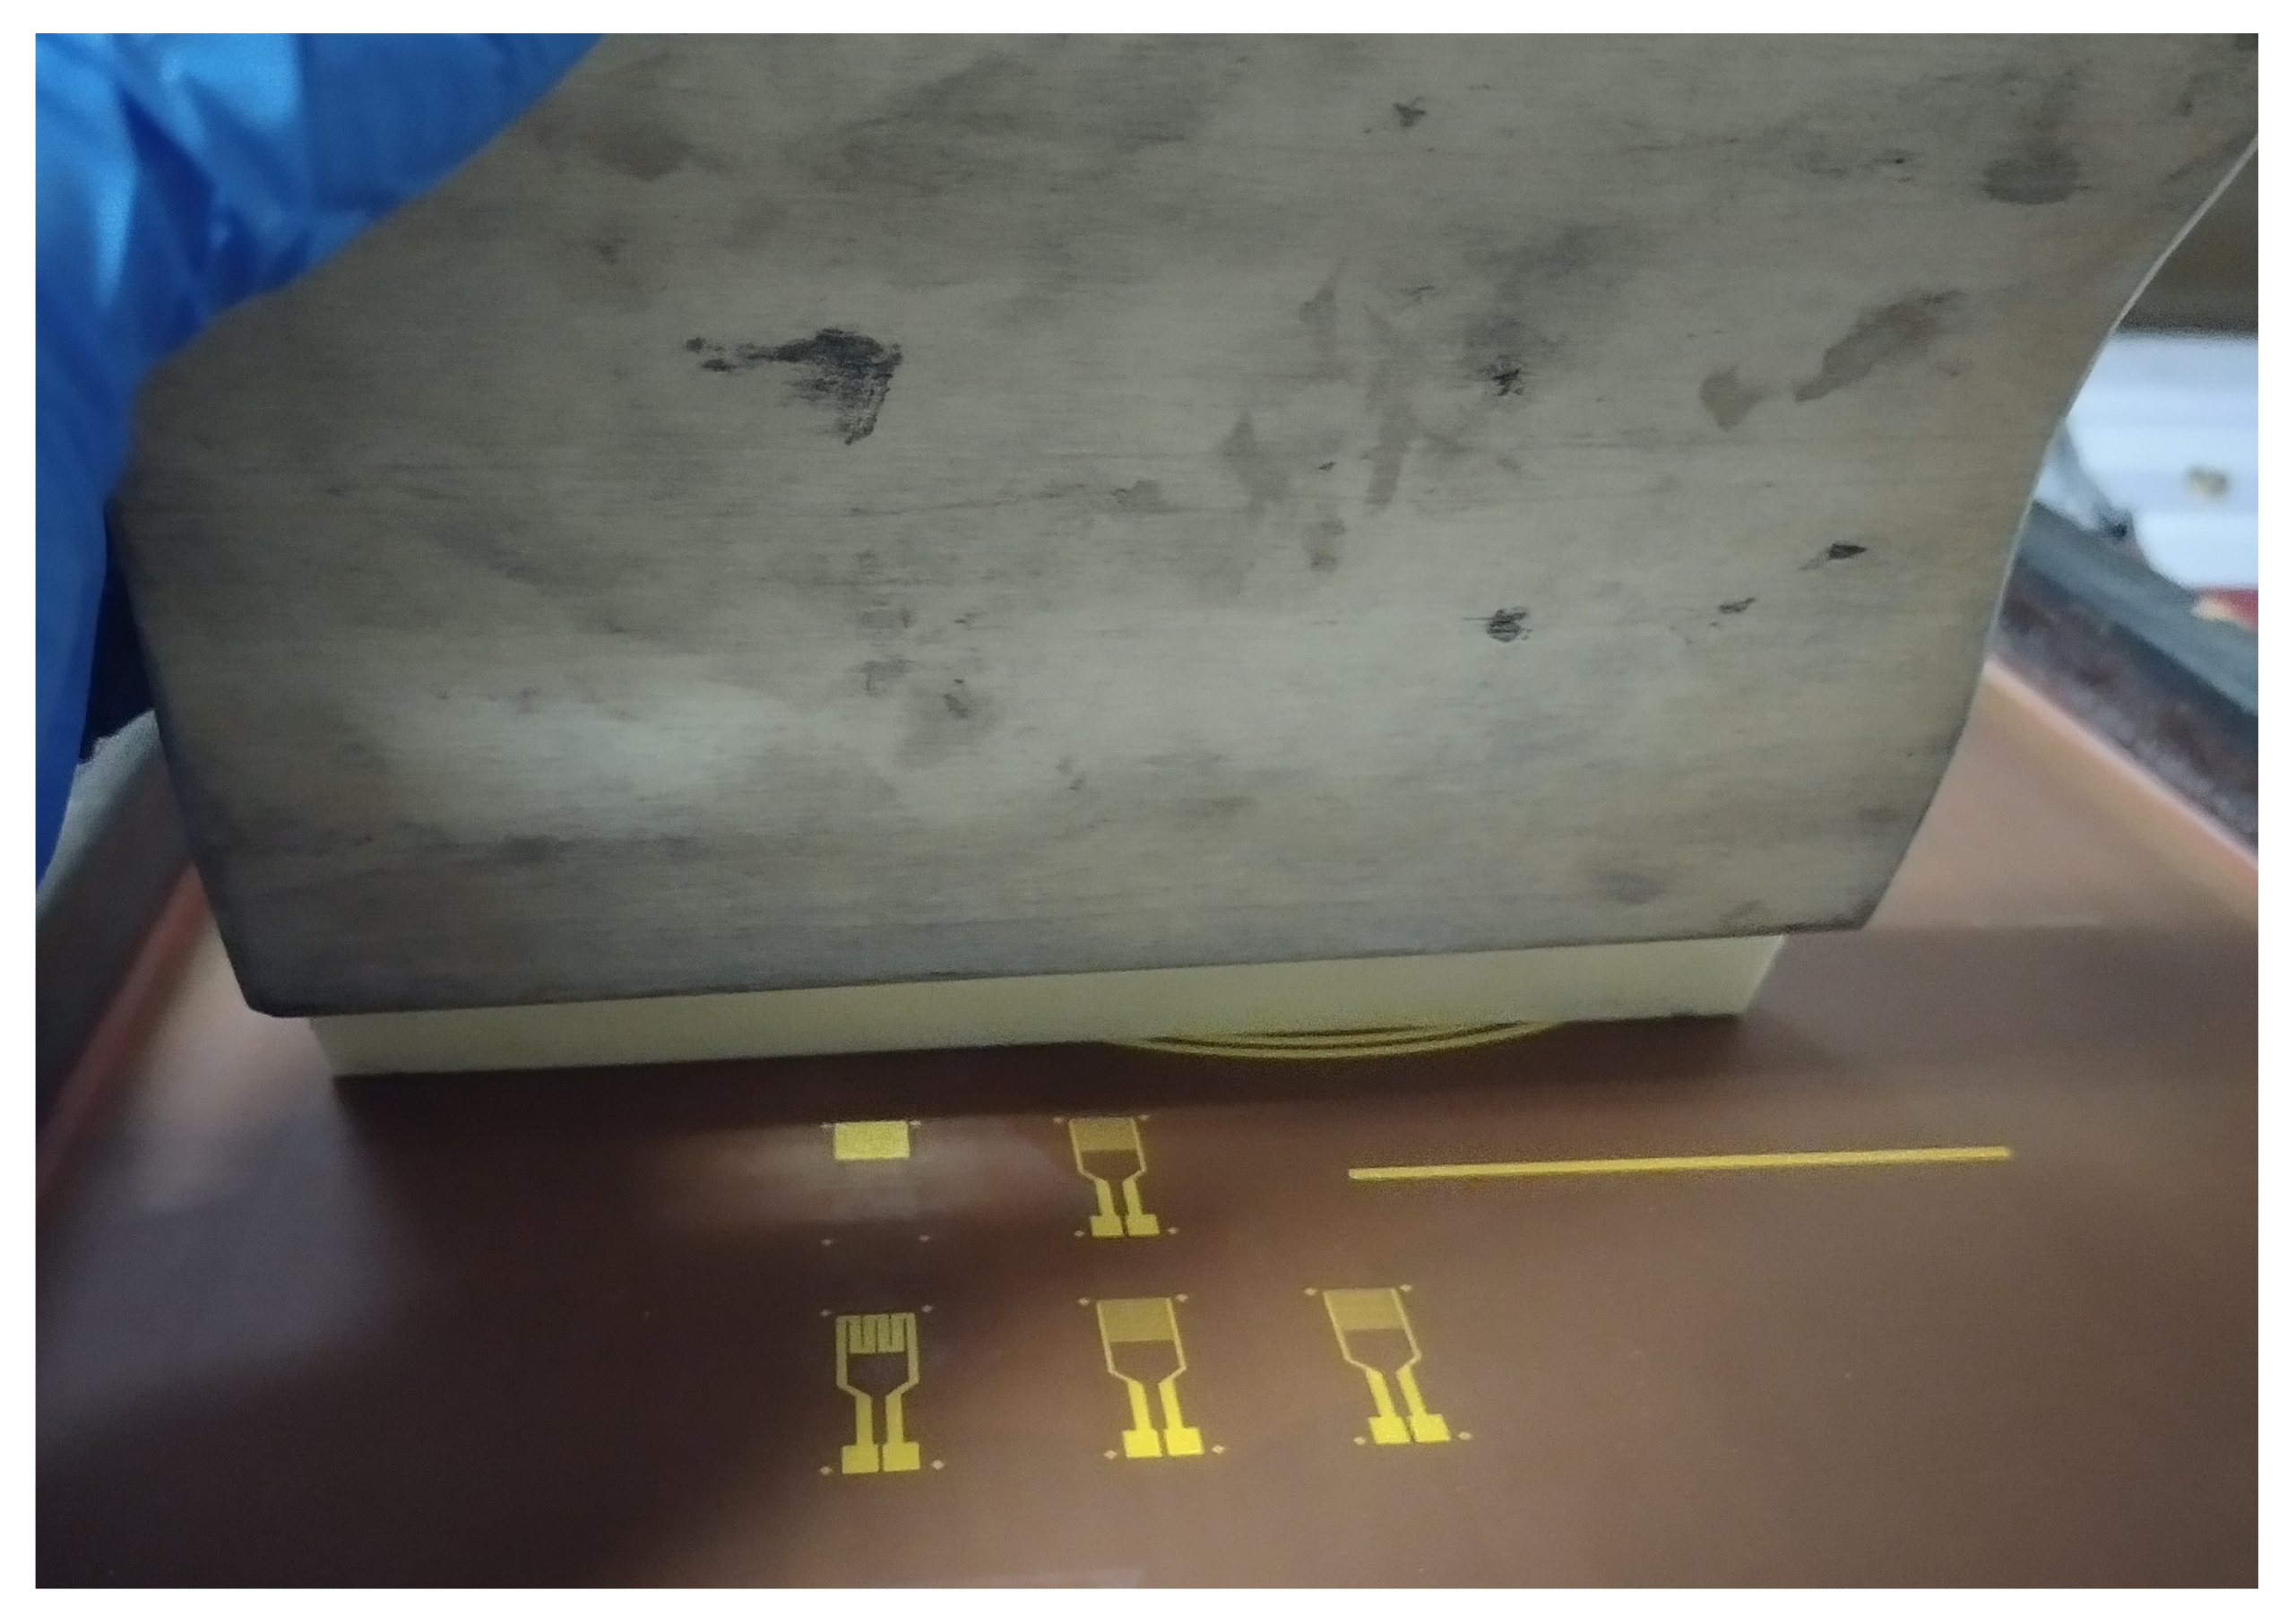
All of the ZnO inks were deposited by screen printing, as in Figure 8, onto a 200 μ m gold interdigitated electrode (IDE) on an Al 2 O 3 (alumina) ceramic substrate with a built in platinum heater, commercially obtainable from Dropsens (Spain) [53].
The heater is then used to auto-sinter the ZnO after deposition. The heaters were powered with 15 V at 0.6 A. This caused the sensors to heat between 400 °C and 500 °C. Each ZnO layer was sintered at >400 °C for 1 min before cooling and using as a sensor. An FLIR TG167 thermal imaging camera was used to capture the thermal image of a screen printed ZnO gas sensor while auto-sintering in Figure 9a. A conventional image was also taken of a screen printed ZnO gas sensor while auto-sintering, and this can be seen in Figure 9b. While sintering, a precision UNI-T UT325 thermometer was used to measure the sintering temperature on the electrode side of the substrates.

2.2.2. Sample Preparation for Screen-Printed ZnO Gas Sensors

Initial tests for the screen-printed gas sensors must determine whether the screen printed gas sensors are reactive to the odours produced by Taktic. It must also be confirmed if the response to water with Taktic can be differentiated from the response to water without Taktic, as well as the response to reference air. The recommended dip concentration of Taktic in water is 2000 ppm, which is used to compare the response of a screen printed gas sensor to that of clean water and air. Screen printed gas sensor responses are noted for Taktic gases alone and the system is presented with 10 mL Taktic. Each sensor is further presented three samples, namely reference air, clean municipal tap water (Pretoria), and municipal tap water with 2000 ppm Taktic. As in Section 2.1.2, Taktic is added to the water with a 10   μ L precision Agilent gold standard autosampler syringe.
The screen printed gas sensors are not yet used in a sensor array and do not form part of an e-nose.

2.2.3. Experimental Setup for Screen Printed ZnO Gas Sensors

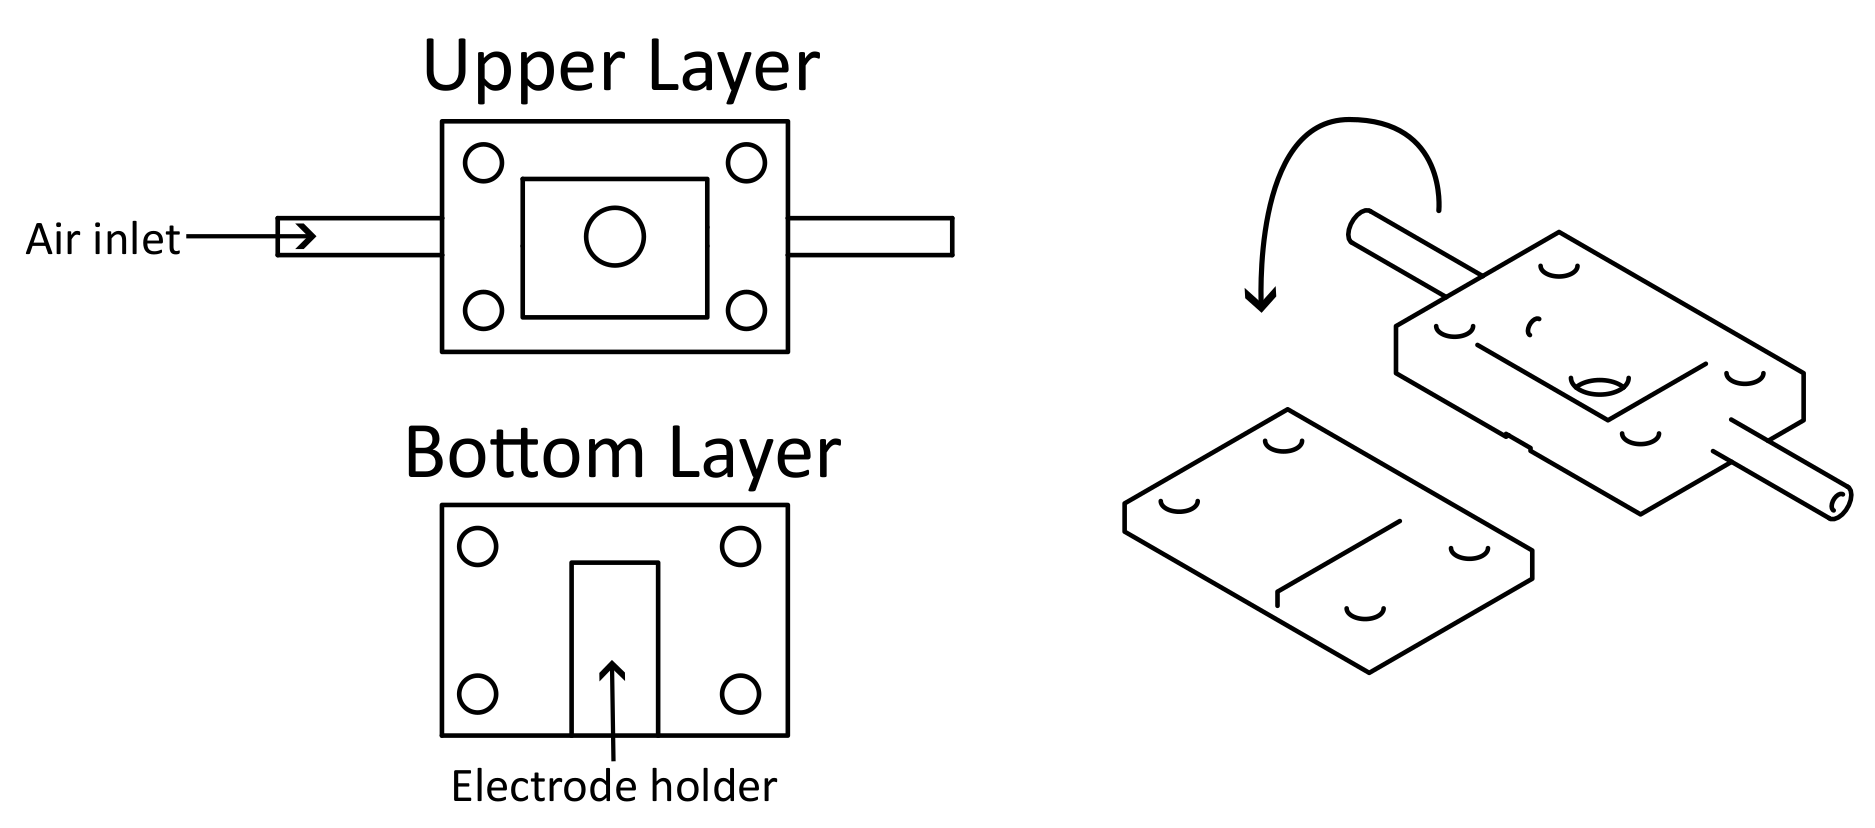
A sensor test chamber, depicted in Figure 10, is designed to hold the sensor while exposing it to UV light and the target gas. The gas is pumped using the same pump as was used in the low-cost e-nose system described in Section 2.1.1. The pump is connected to the end of the sensor test chamber. The hole at the top of the sensor chamber allows UV light from an external source to reach the target sensing area.
The sensors are held in place and measured by pogo pins, and the impedance is measured with a GW Instek LCR-811OG precision LCR meter. The sensors are then exposed to the odours from specified samples, while being illuminated by approximately 405 nm UV light from two comparable inexpensive UV nail studios, RapidCure [54] and SunR9 [55]. This should reveal if room temperature UV-activated ZnO gas sensors can be used to detect Taktic in water. The final experimental setup is shown in Figure 11. A screen-printed ZnO gas sensor is held by pogo pins on the left, the gas chamber is shown in the middle, and the sample holder is shown on the right.

3. Results

3.1. Results for E-Nose with Commercial Gas Sensors

This section presents the results for an e-nose that is made with commercial gas sensors.
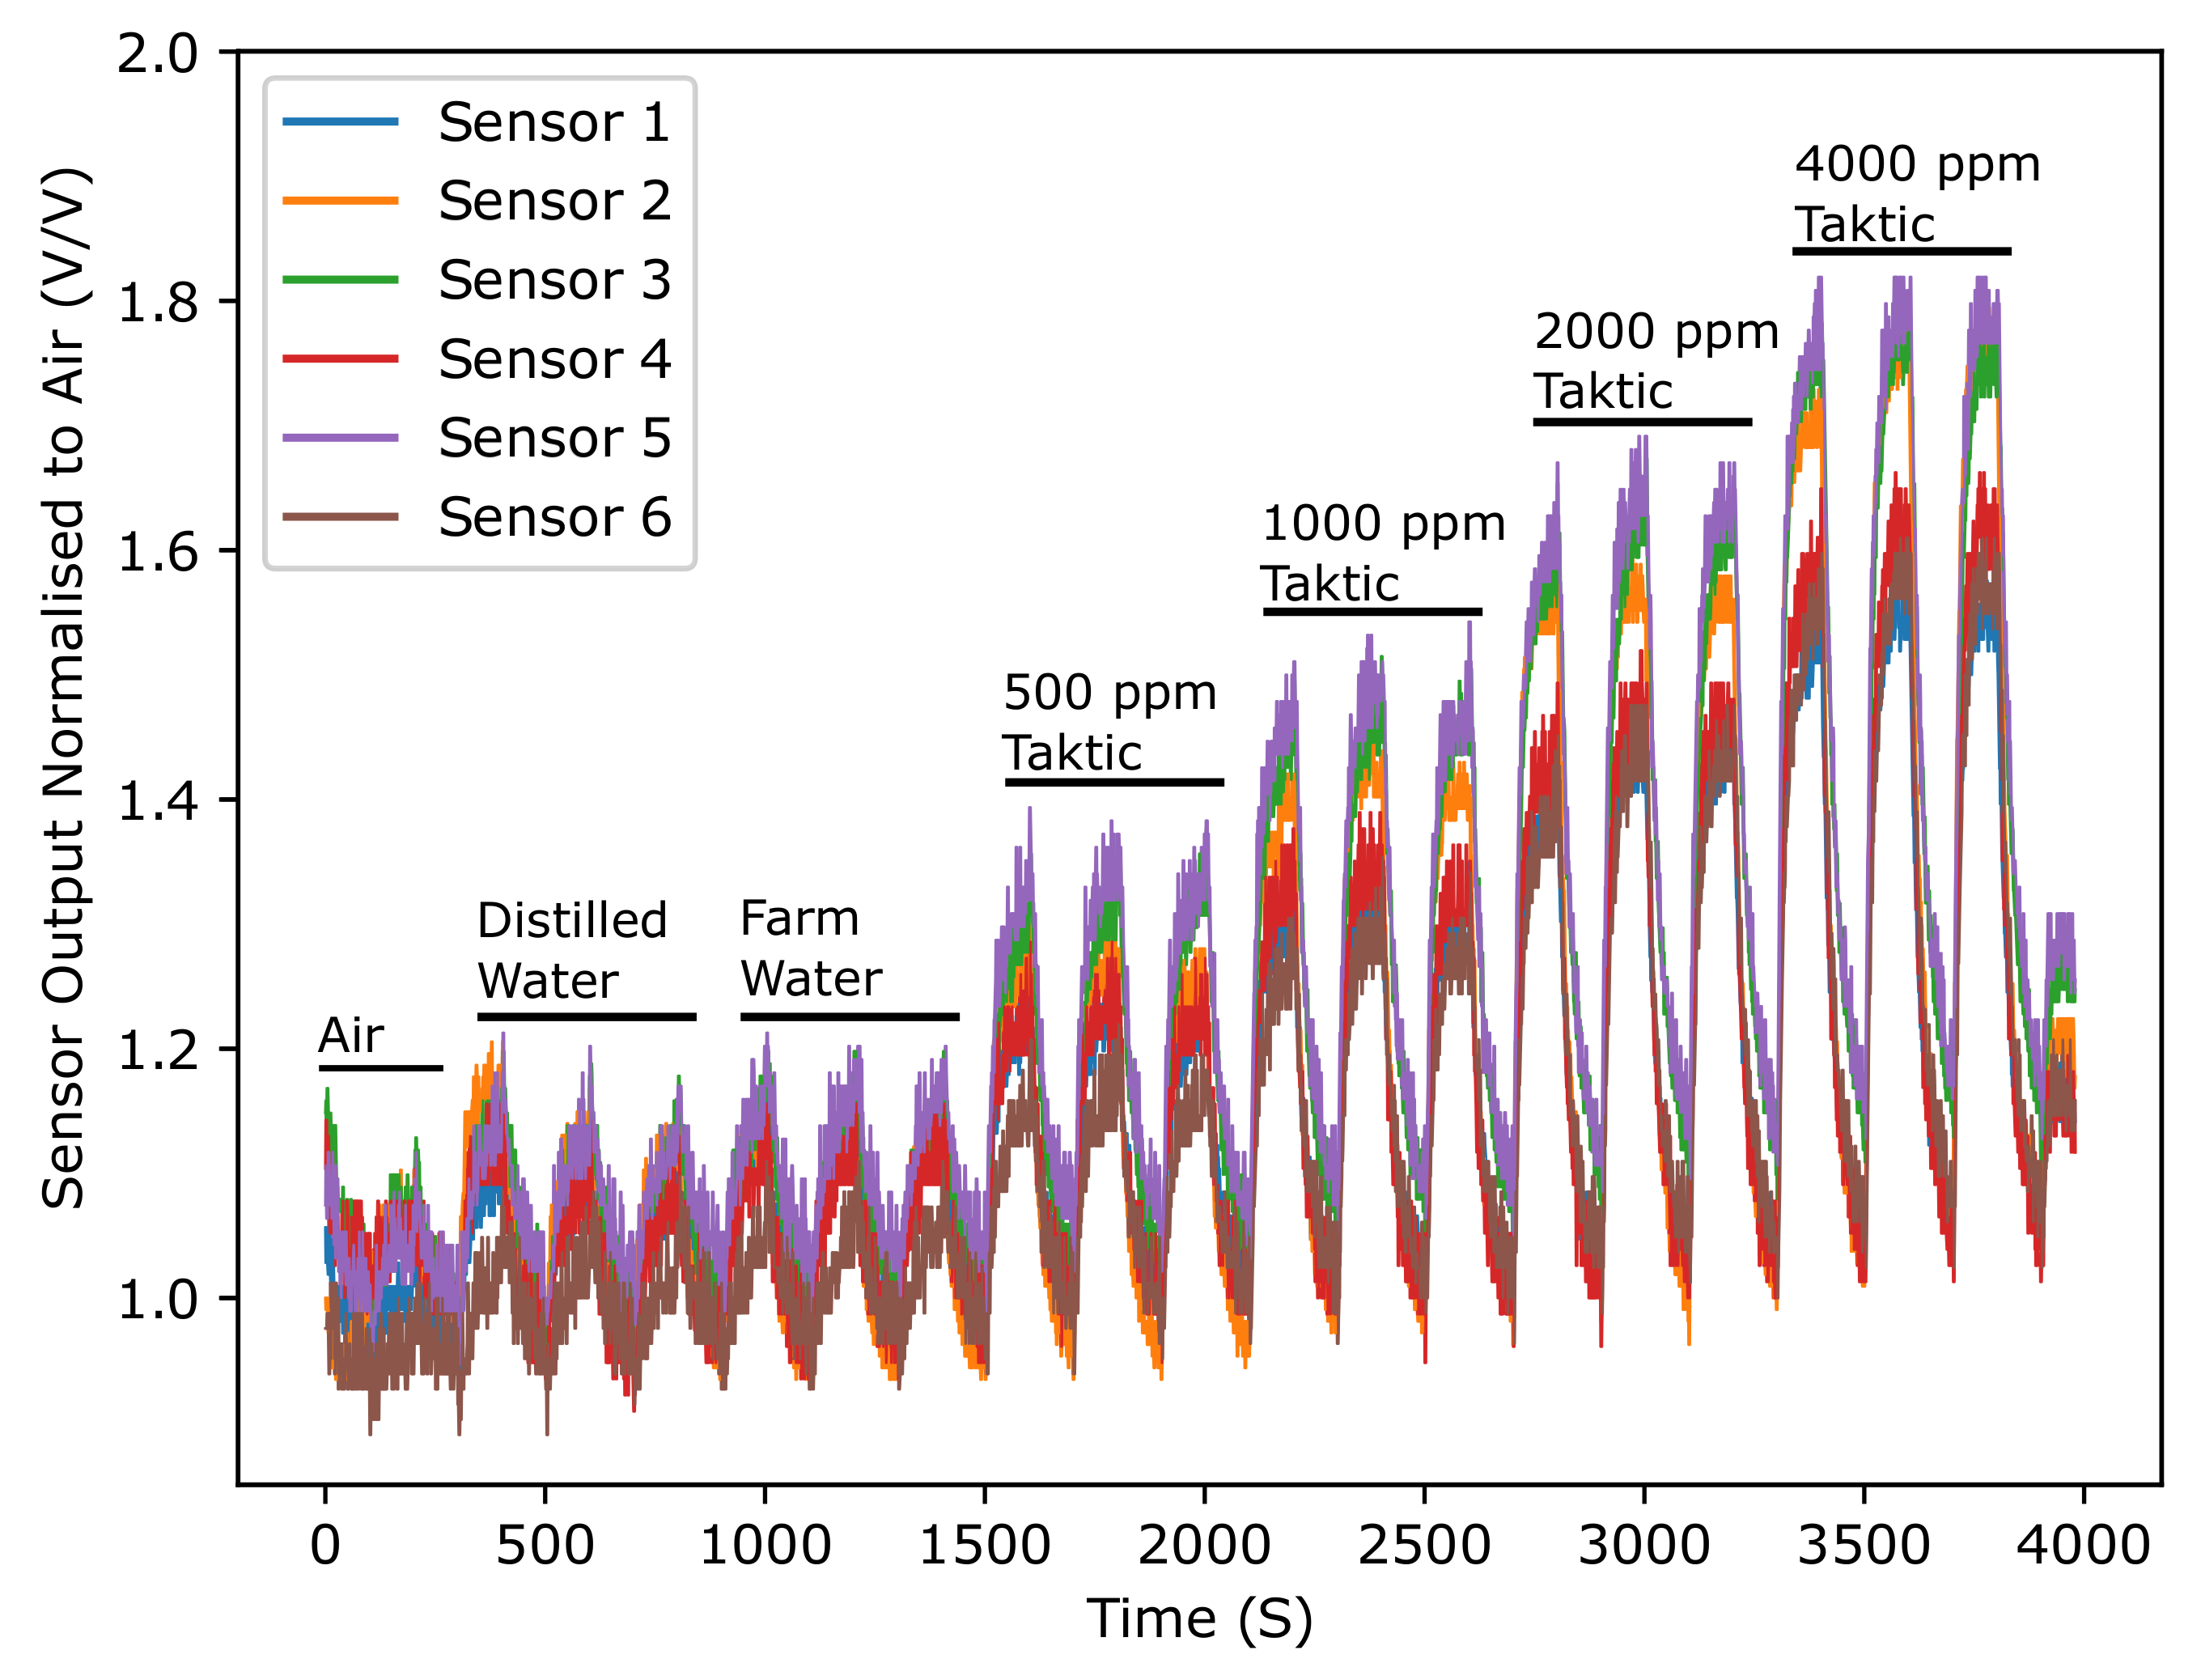
The six MQ gas sensors in the low-cost e-nose were exposed to different concentrations of Taktic in farm water, as well as to samples of distilled water and air. The e-nose system exposes the sensor array to the target sample headspace air for a duration of 100 s, taking 117 measurements. Thereafter, the sensors are purged for 100 s while the e-nose takes another 117 measurements. The measured response of all the commercial gas sensors in the e-nose array can be seen in Figure 12. All measurements are normalised to the average measurement for air. The sensor space is purged of the target sample air between each target sample measurement. Each target concentration is measured in triplicate via three consecutive sample measurements. The sensor response time must be considered after a new sample is introduced. Therefore, only the final 100 measurement points of each sample are considered as stabilised results. In total, there are 300 measurement points for each target sample.
The triplicate measurements have repeatable results. The non-deal measured sensor recovery is typical of heated sensors and could be improved with UV irradiation. A calibration curve could also be extracted to counter sensor drift.
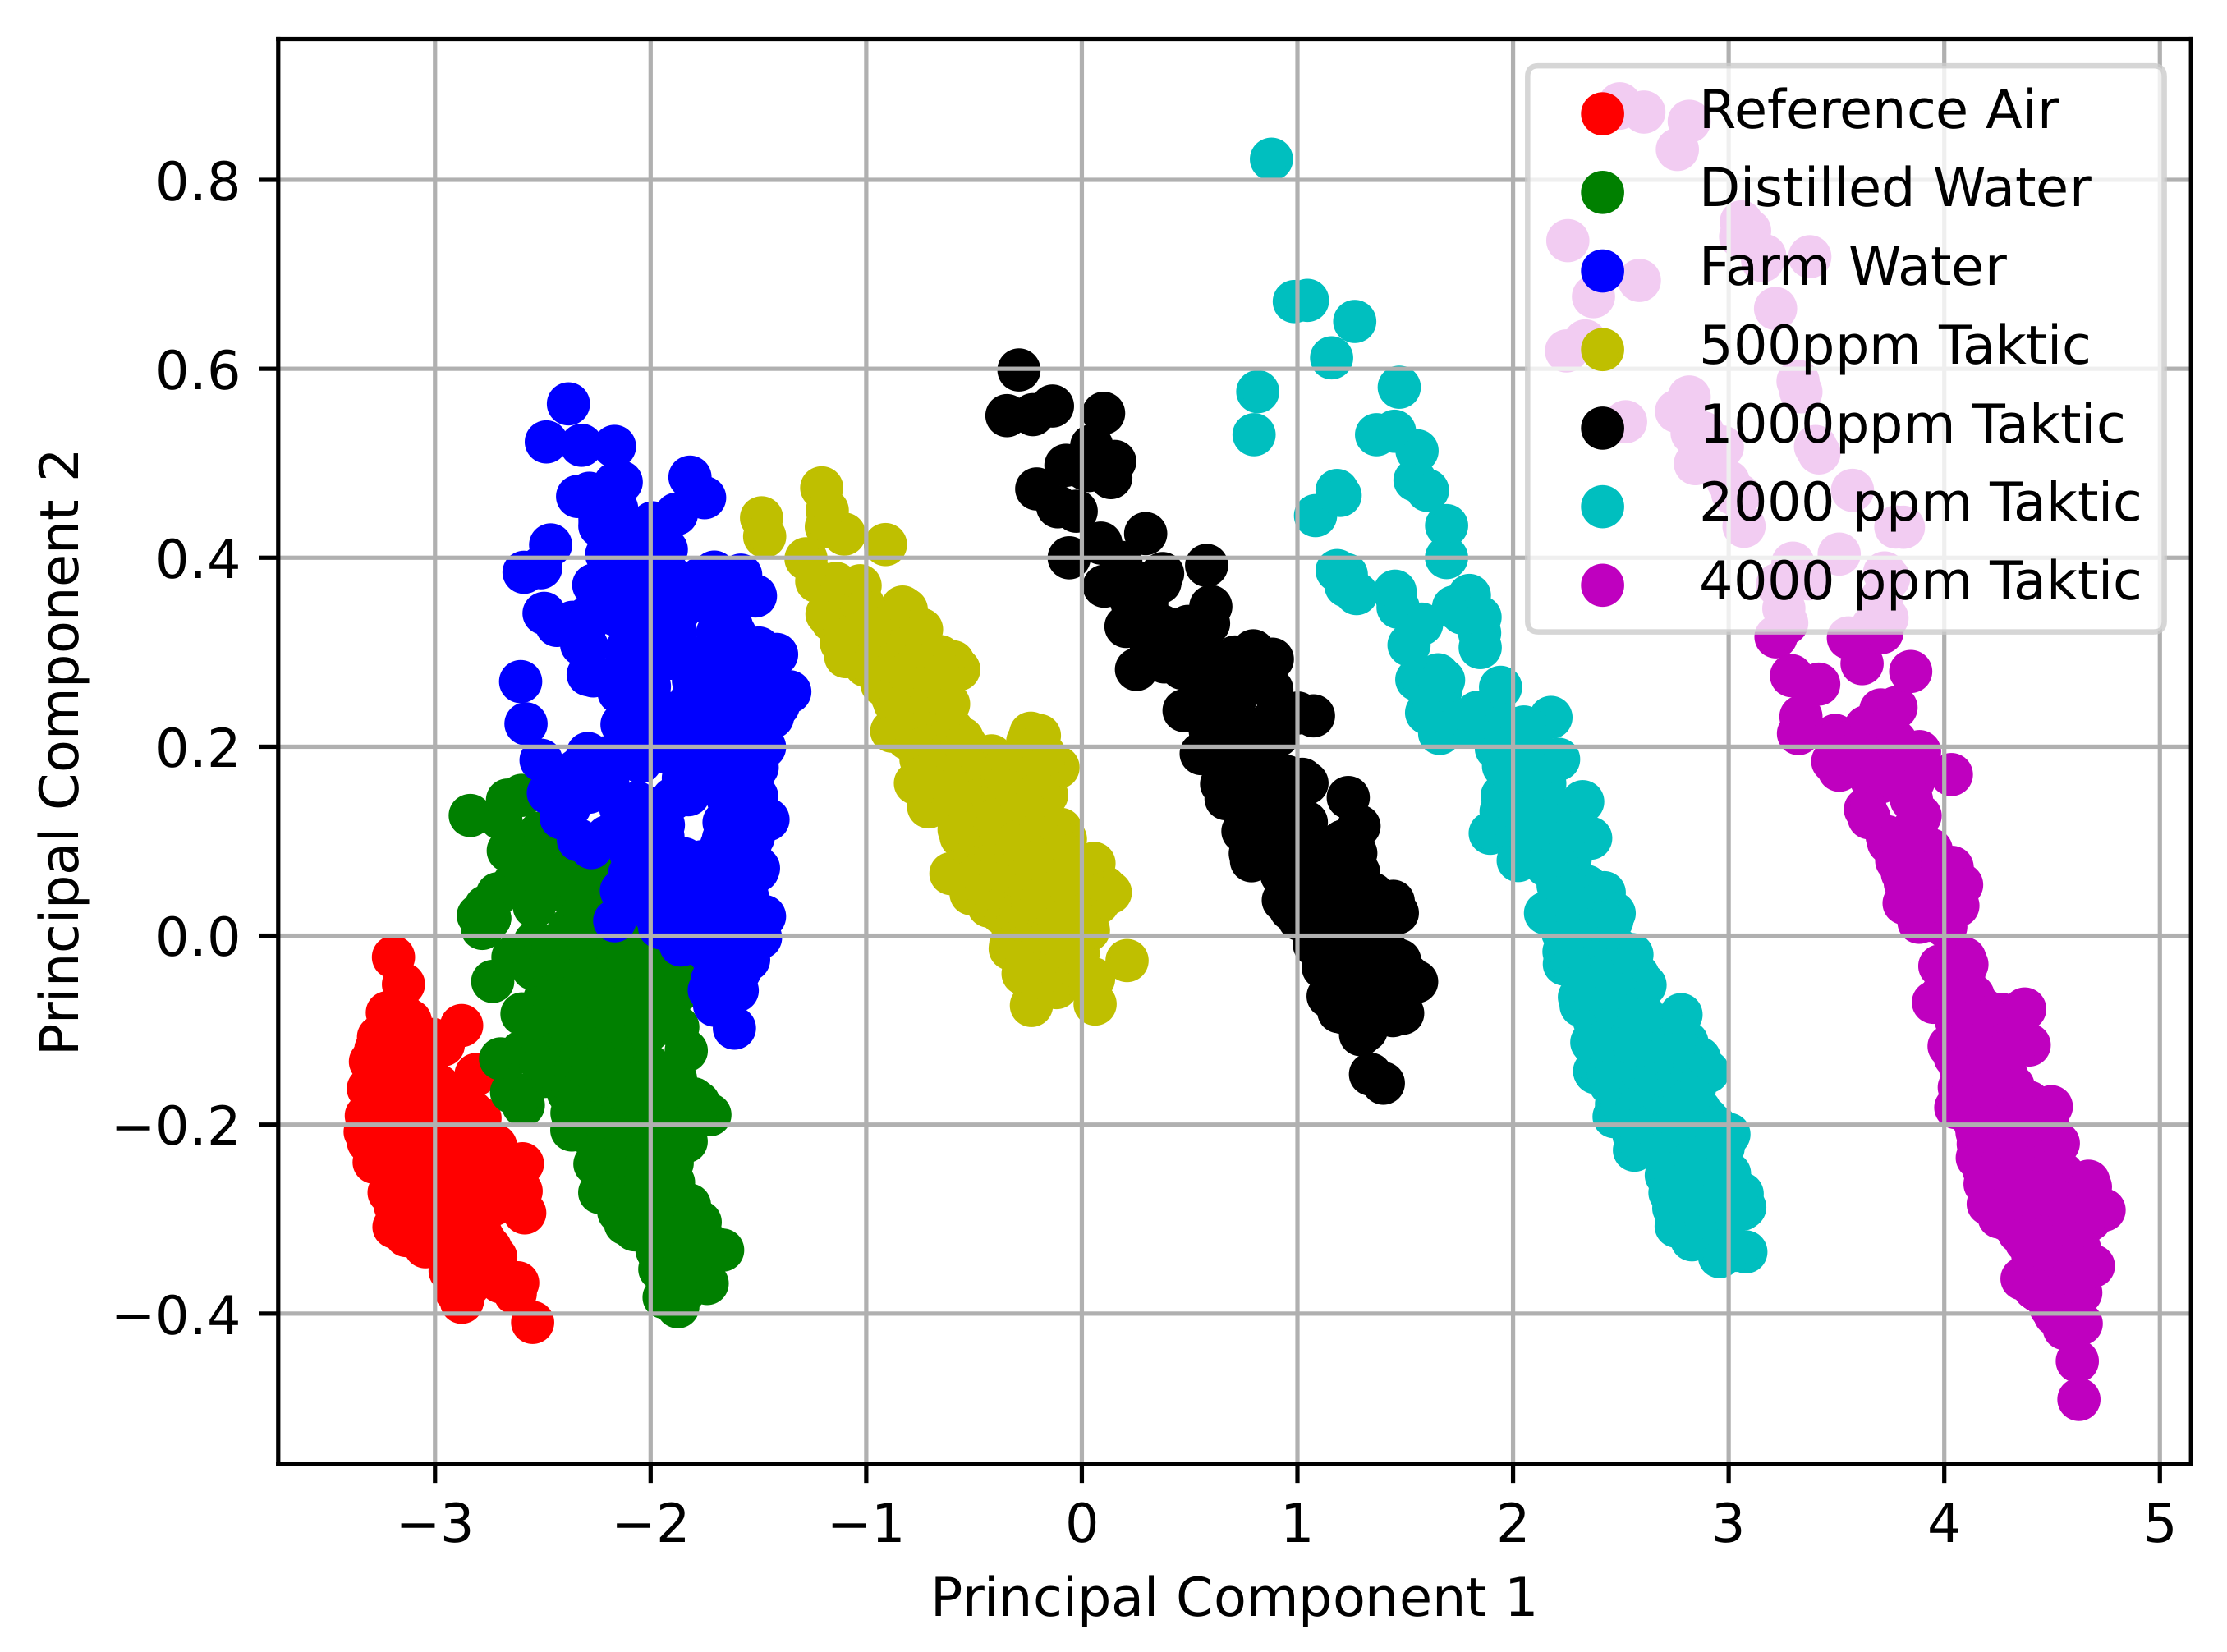
Principle component analysis (PCA) [56] is a very mature and frequently used data analysis tool that is often performed on data sets as an initial test to see if data is significantly varied so that a classifier algorithm can be trained. This is very common in e-nose research [30,57]. A PCA from the standard Python package SciKitLearn is completed on the measured target sample data (excluding the purging measurements) to establish whether a classifier algorithm would be able to distinguish different samples.
The PCA data in Figure 13 shows distinct groupings in a fairly linear progression, which indicates conditional independence between features that are well suited to a naive classifier algorithm.
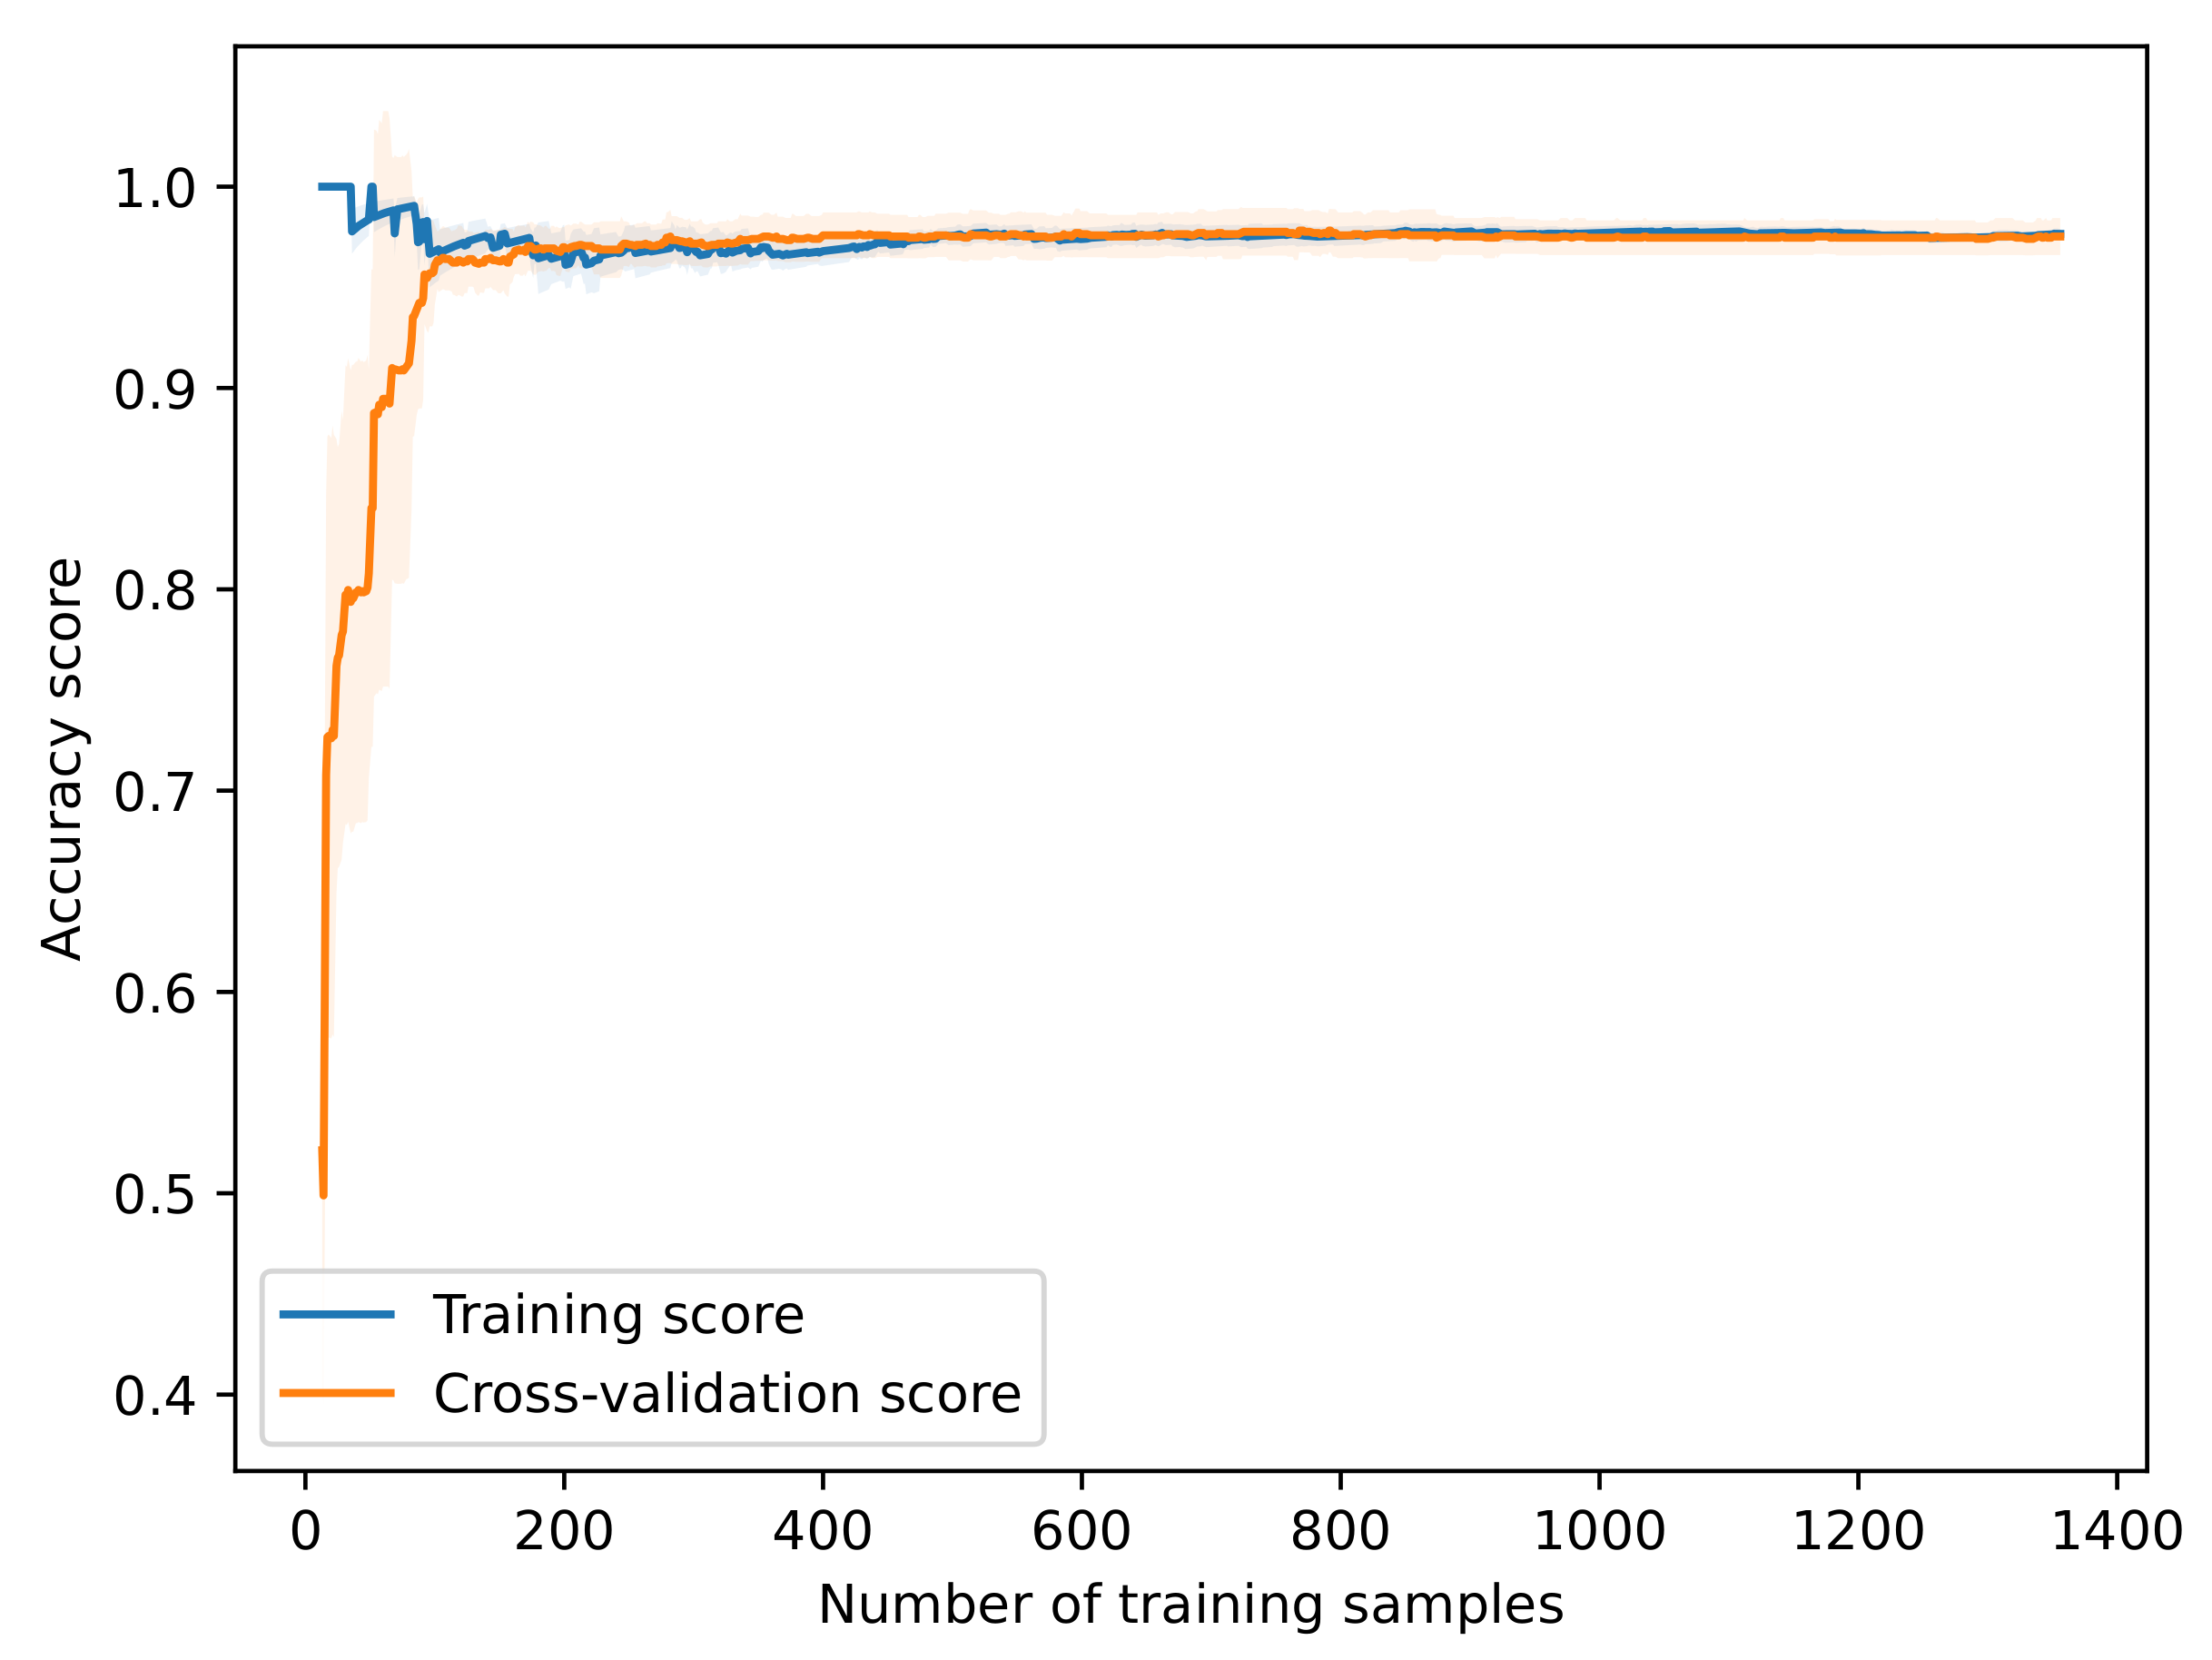
A naive Bayes classifier with an assumed Gaussian data distribution is trained on the data with a randomised 80%/20% data validation split. After training completely, the validation data achieves an accuracy of 96.46%. The training accuracy converges after about 500 samples, and this can be seen in Figure 14.

3.2. Results for Screen Printed ZnO Gas Sensors

This section presents the results for screen printed ZnO gas sensors.

3.2.1. Microscopy

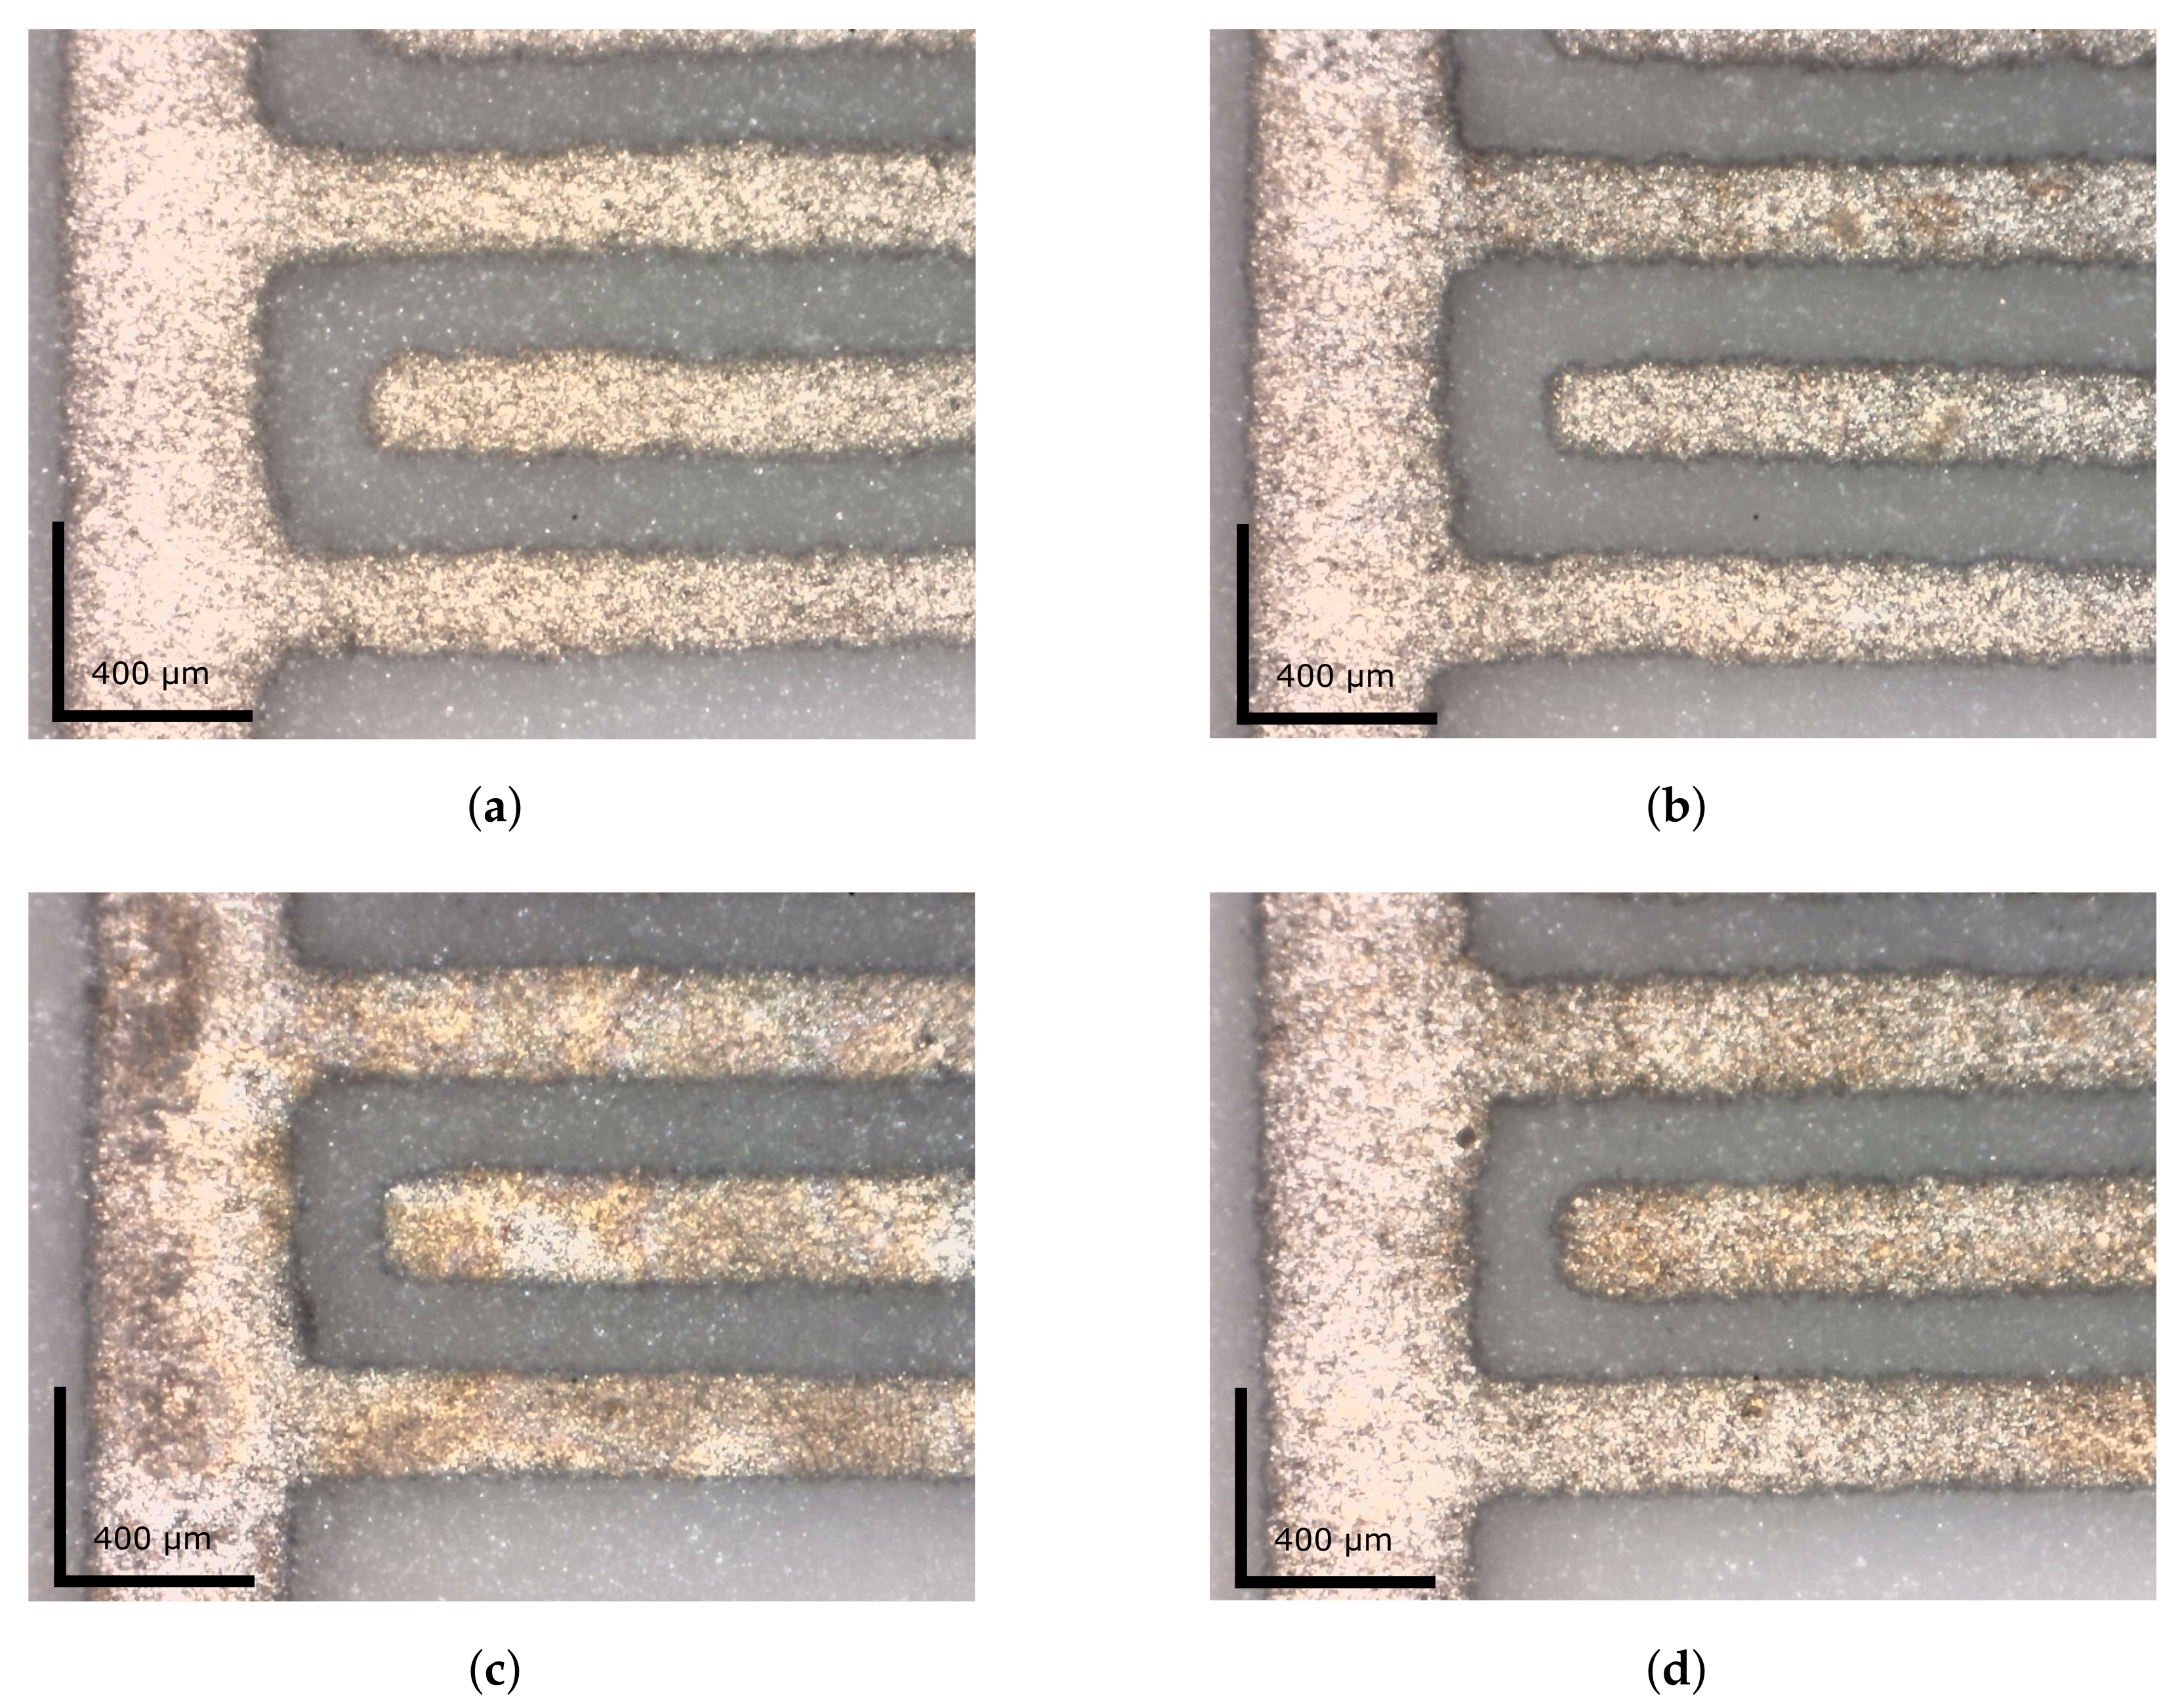
The coated electrodes are investigated under light microscopes and shown in Figure 15 and Figure 16. A Dinolite UB503-LH1 microscope is used to take the images in Figure 15, and each of these show three interdigitated legs of the coated IDEs compared to an uncoated IDE in Figure 15a. The IDEs have 200 μ m lines and spaces.
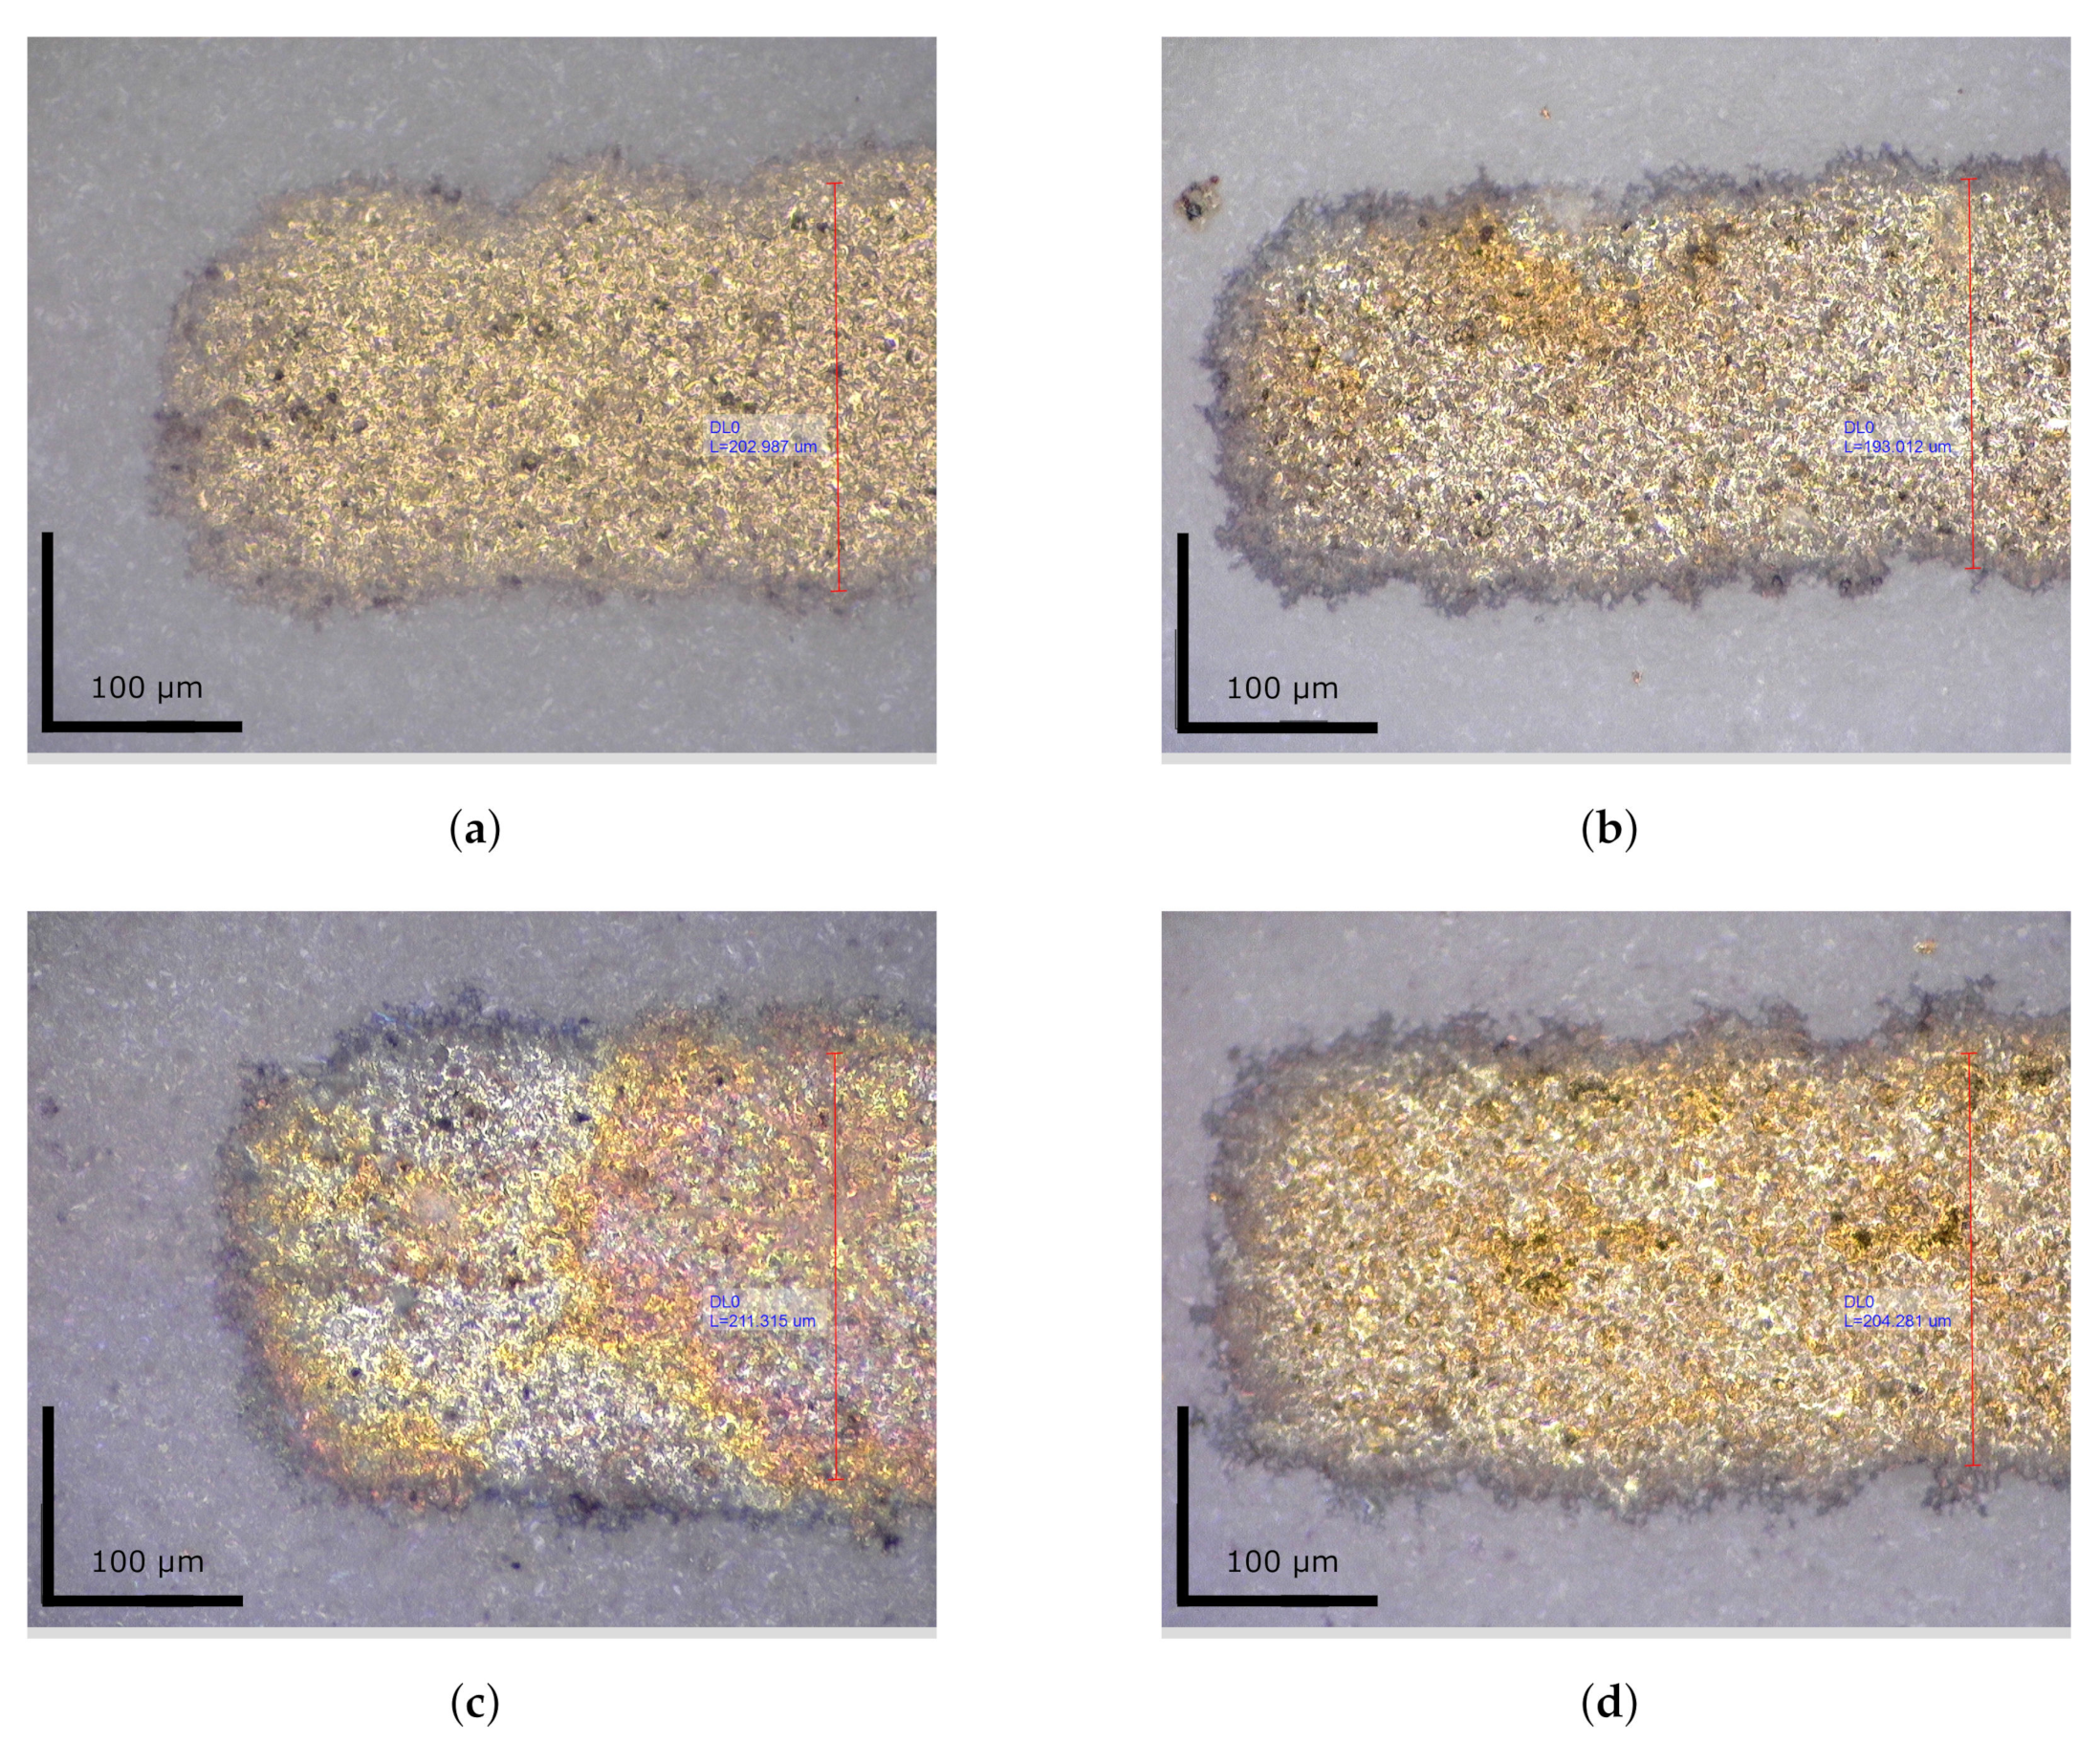
A Dinolite AM4515T8 microscope with an AM7025X camera is used to take the images in Figure 16, and each of these show one leg of the coated IDEs compared to an uncoated IDE in Figure 16a.
SEM images (FEGSEM: Zeiss 540 Xbeam) were taken for the off-the-shelf ZnO nanoparticles after deposition and sintering on the gold electrodes. The samples were coated in carbon to allow SEM imaging. The SEM image can be seen in Figure 17a, where it is compared to a similar SEM image (FEGSEM: Zeiss 540 Xbeam) taken for the sol-gel ZnO nanoparticles in Figure 17b.
It can be noted that the nanoparticles produced by the commercial ZnO (Figure 17a) are at least 10 times larger than those produced by sol-gel ZnO (Figure 17b). It is also apparent from the images that the pore sizes in the layer of commercial ZnO is larger than that of the sol-gel ZnO, which may be predictive of better sensitivity.

3.2.2. Response of ZnO Gas Sensors to Pure Taktic Fumes

The screen-printed gas sensors were exposed to the fumes of Taktic in triplicate by filling the sample chamber with 10 mL Taktic and measuring the response three times with purging stages in between measurements. All of the sensors responded to Taktic and were able to purge using air. The sensor responses can be seen in Figure 18.
In Figure 18, it is clear that the commercial ZnO responds most strongly to Taktic and has the least drift over time, but is also less conductive for air. The maximum resistance (sensor purged with air) and minimum resistance (sensor final response to Taktic) measurements for each sample and sensor are compared in Table 2.
Important metrics to take into account besides the amplitude are the purging time (rise time 10–90%) and measurement time (fall time 90–10%). The purging and measurement times for each sensor are shown in Table 3.

3.2.3. Gas Sensor Response over Long Periods of Time

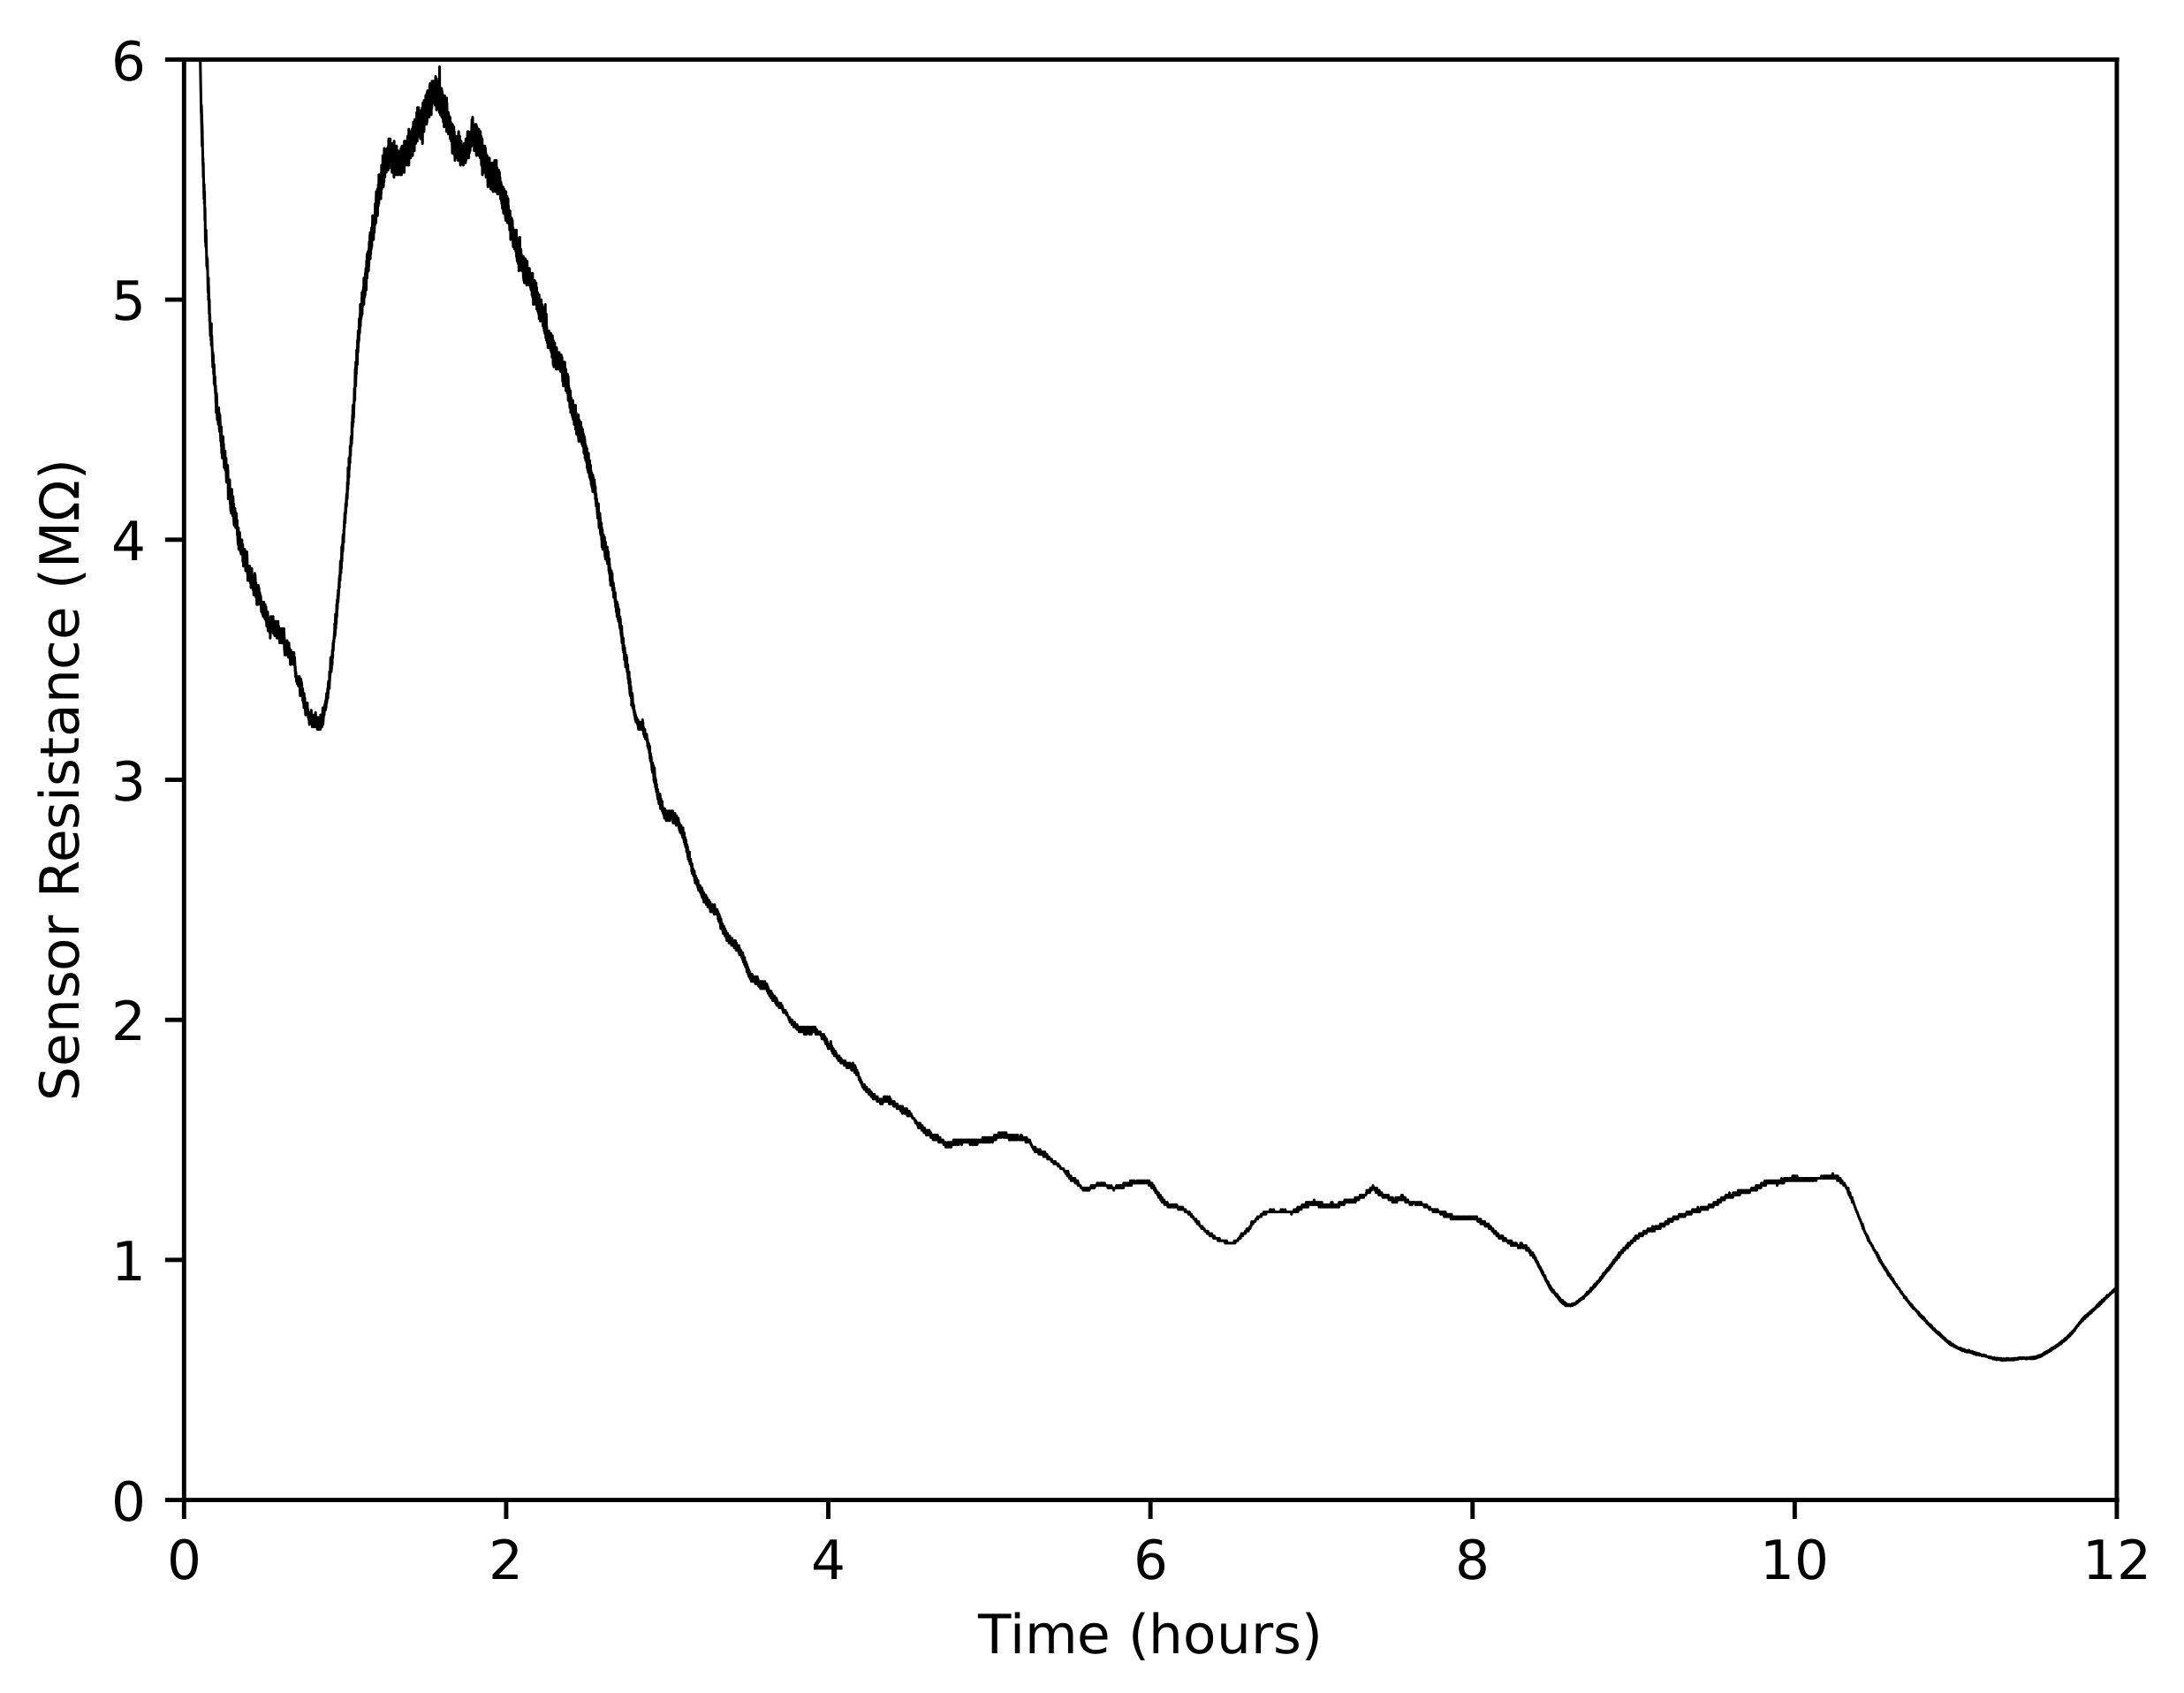
It was noted that the gas sensors stabilise over time after sintering. To ensure stability of measurements, freshly sintered sensors with the commercial ZnO nanoparticles were subject to exposure to UV light and the odours of air, water, and 2000 ppm Taktic in water. The time response of a sensor exposed only to air and UV light can be seen in Figure 19.
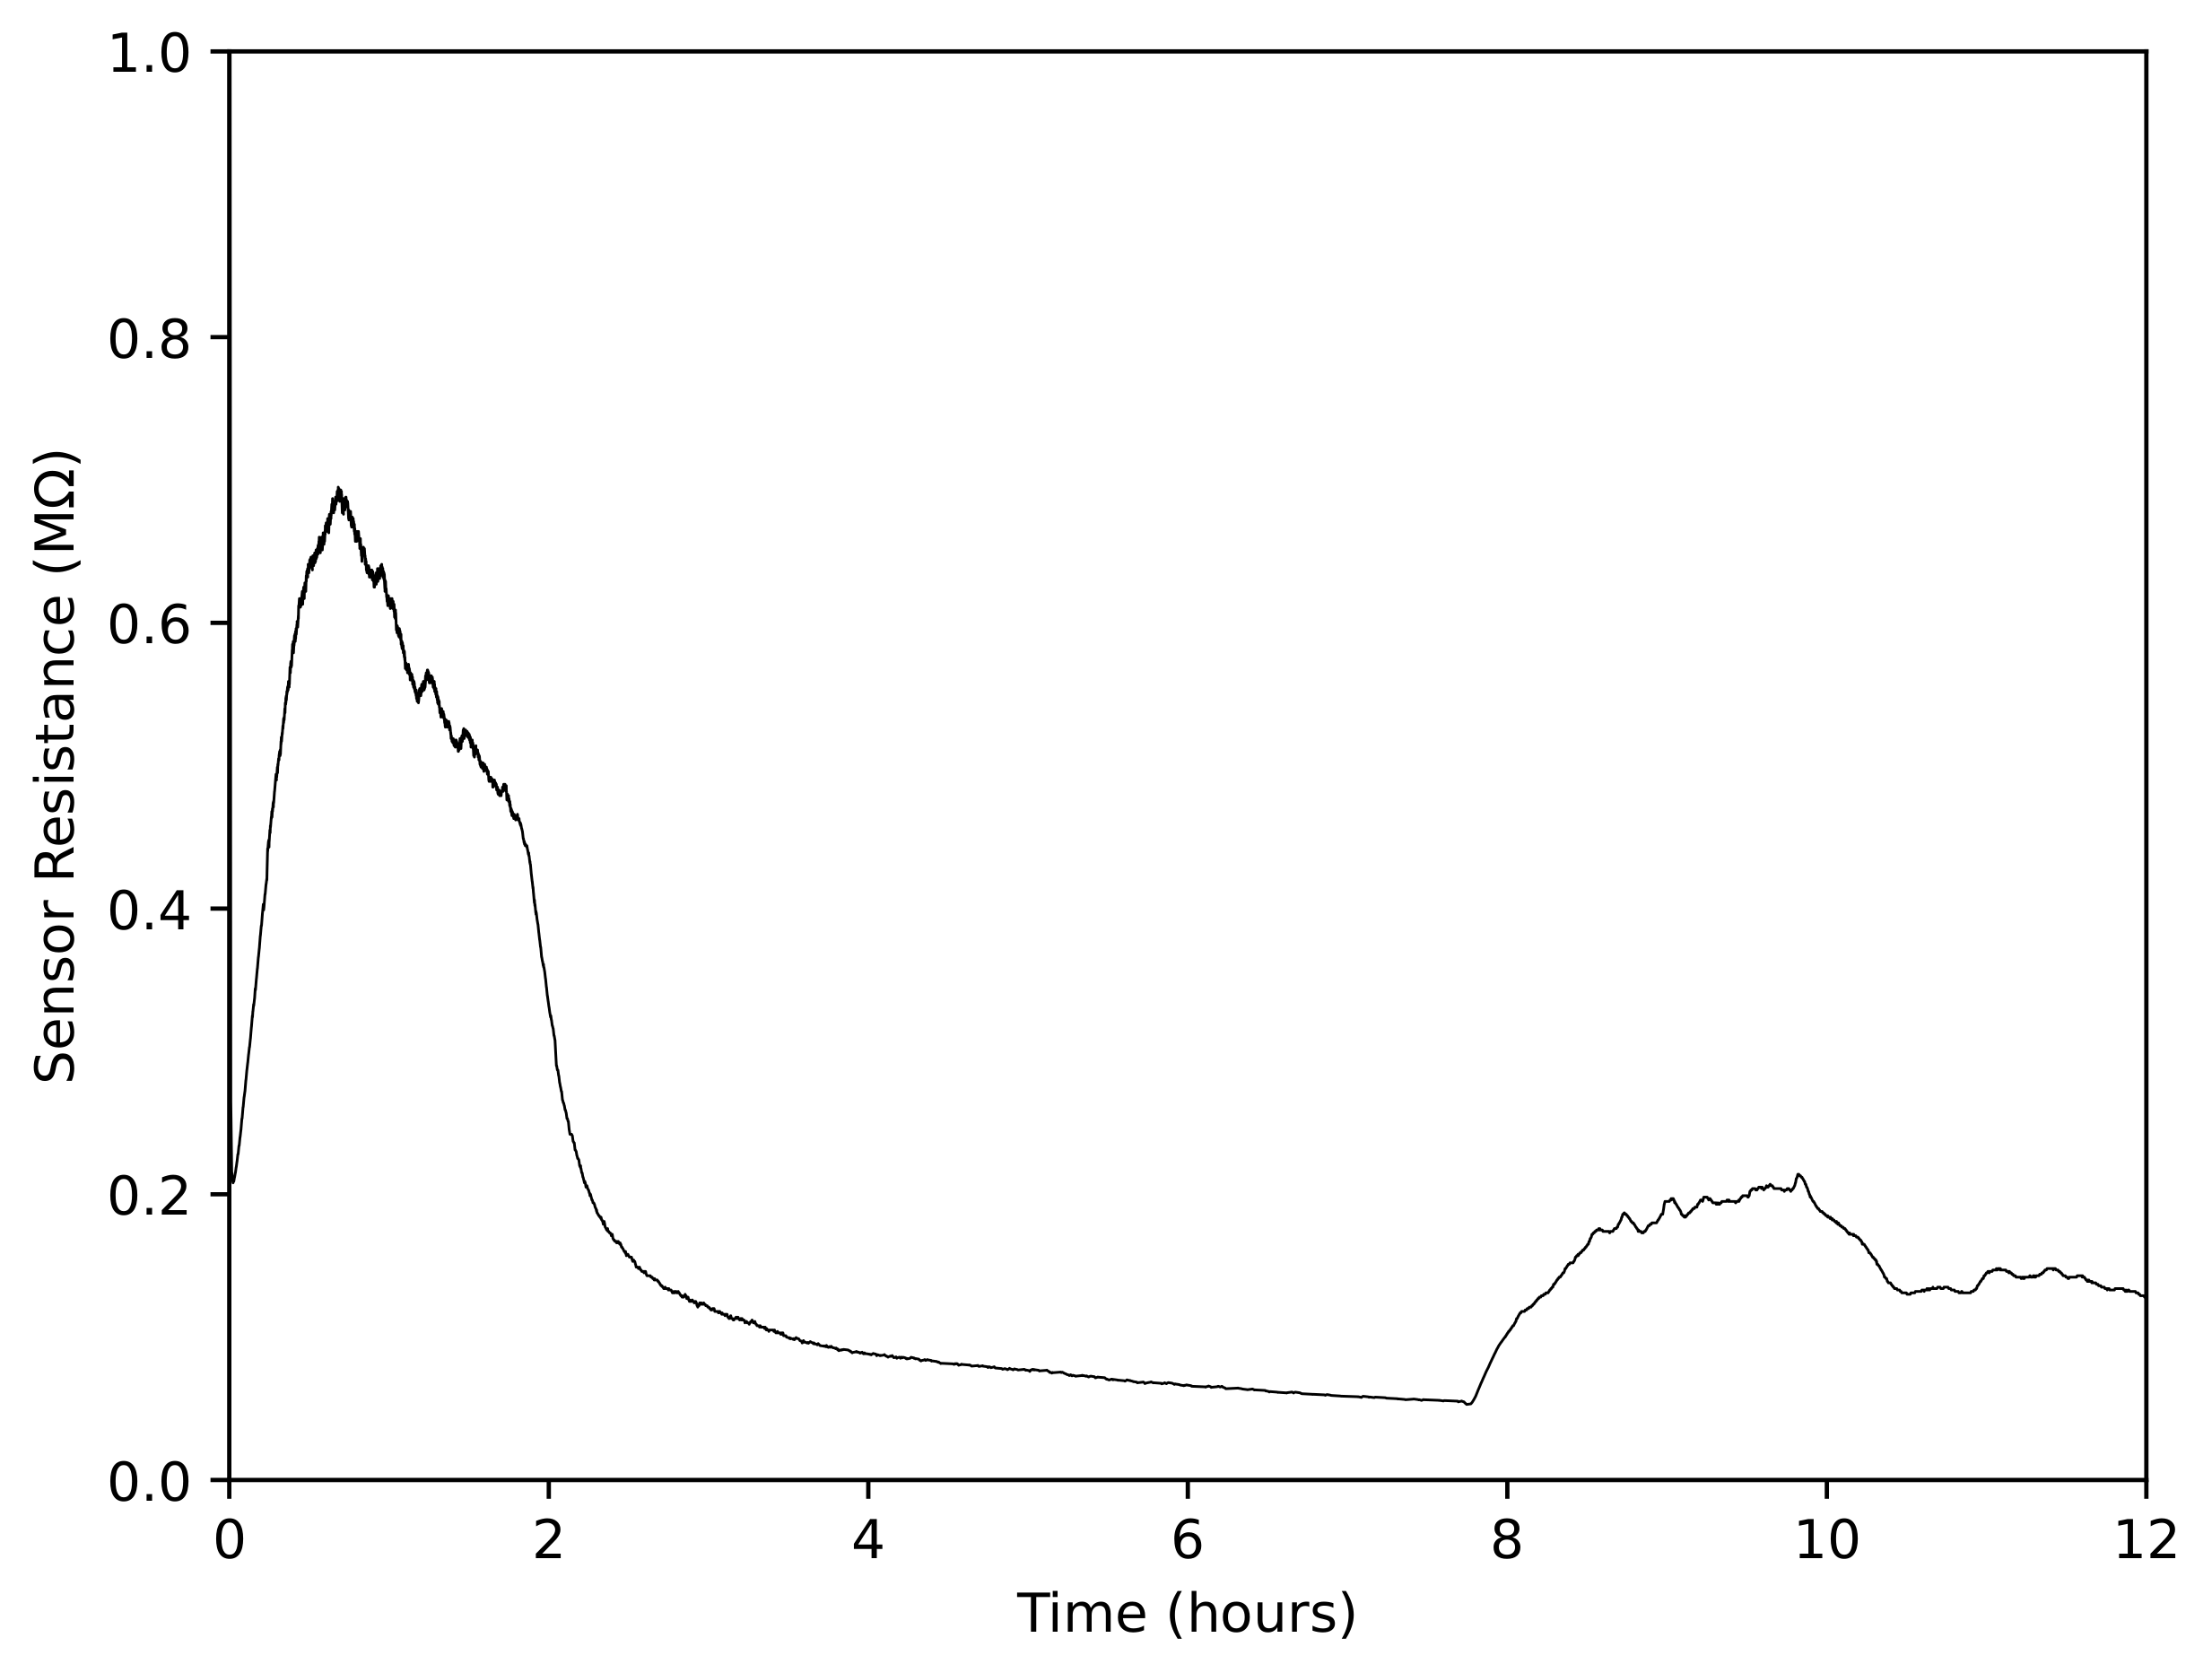
Similarly, the screen-printed gas sensor with commercial ZnO nanoparticles was re-sintered and subjected to the odours of water over time. The time response of the sensor exposed to the odour of water and UV light can be seen in Figure 20.
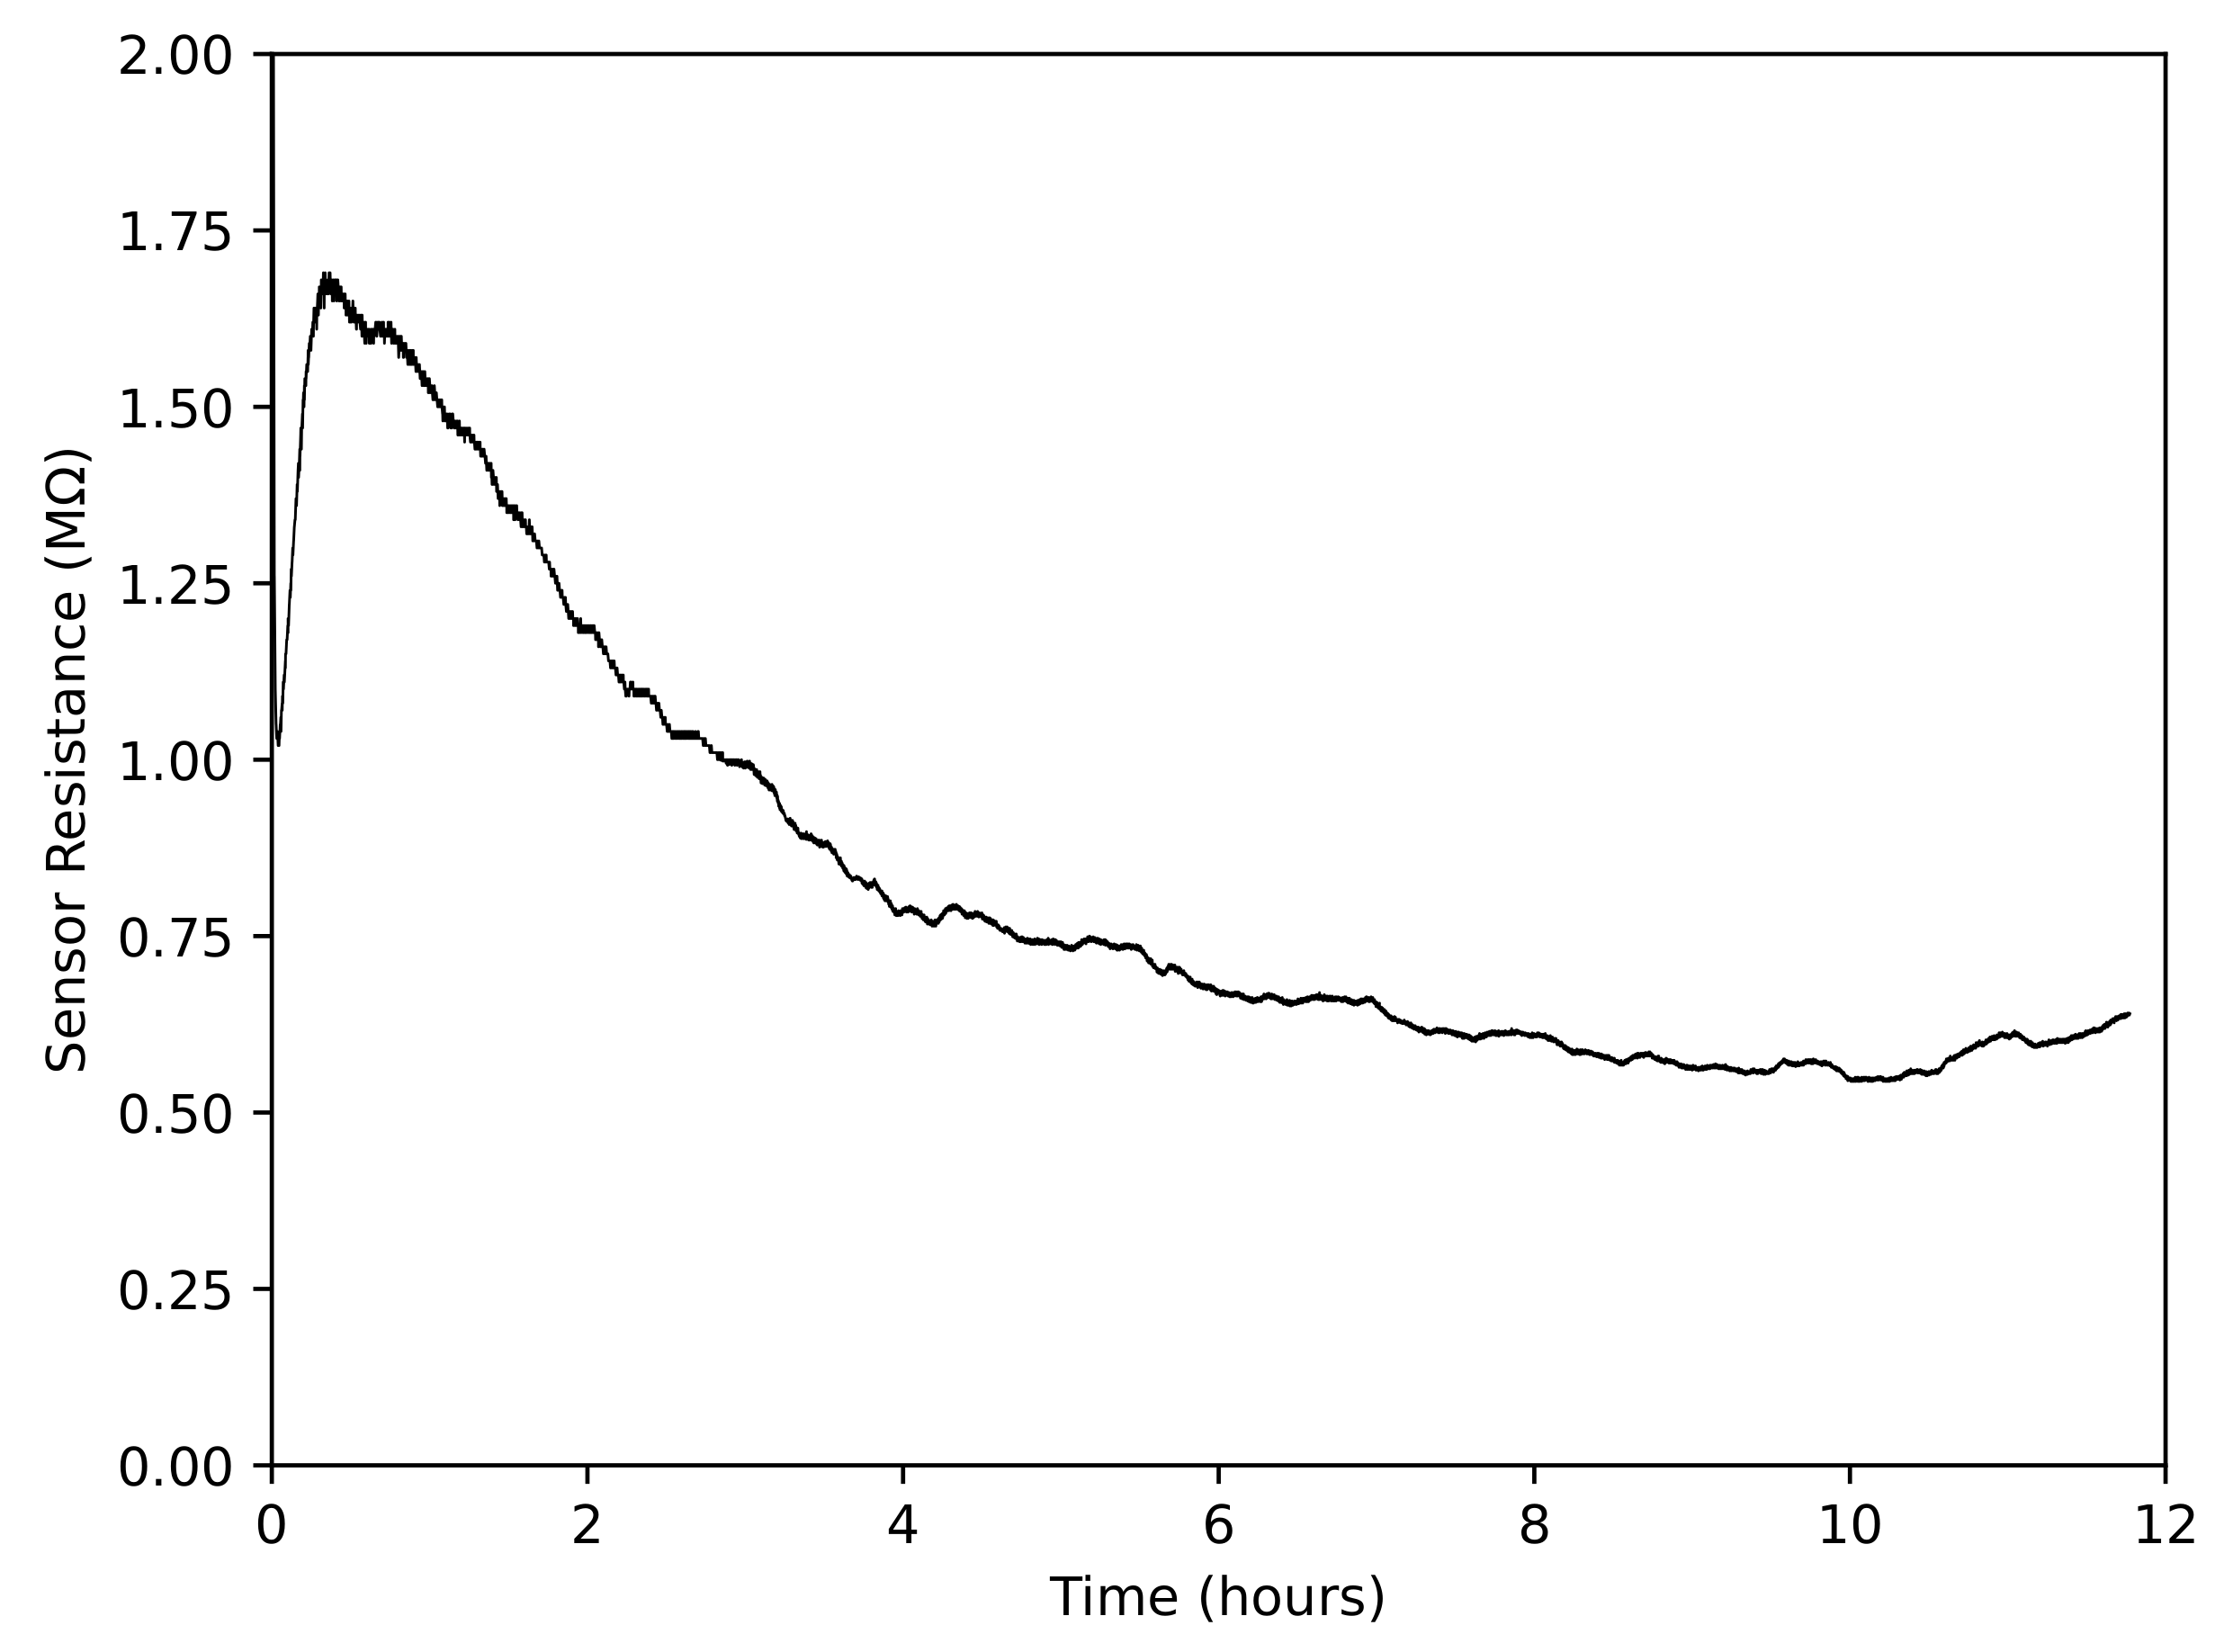
This was also repeated for a 2000 ppm sample of Taktic in water. The time response of the sensor exposed to the odour of Taktic in water and UV light can be seen in Figure 21.
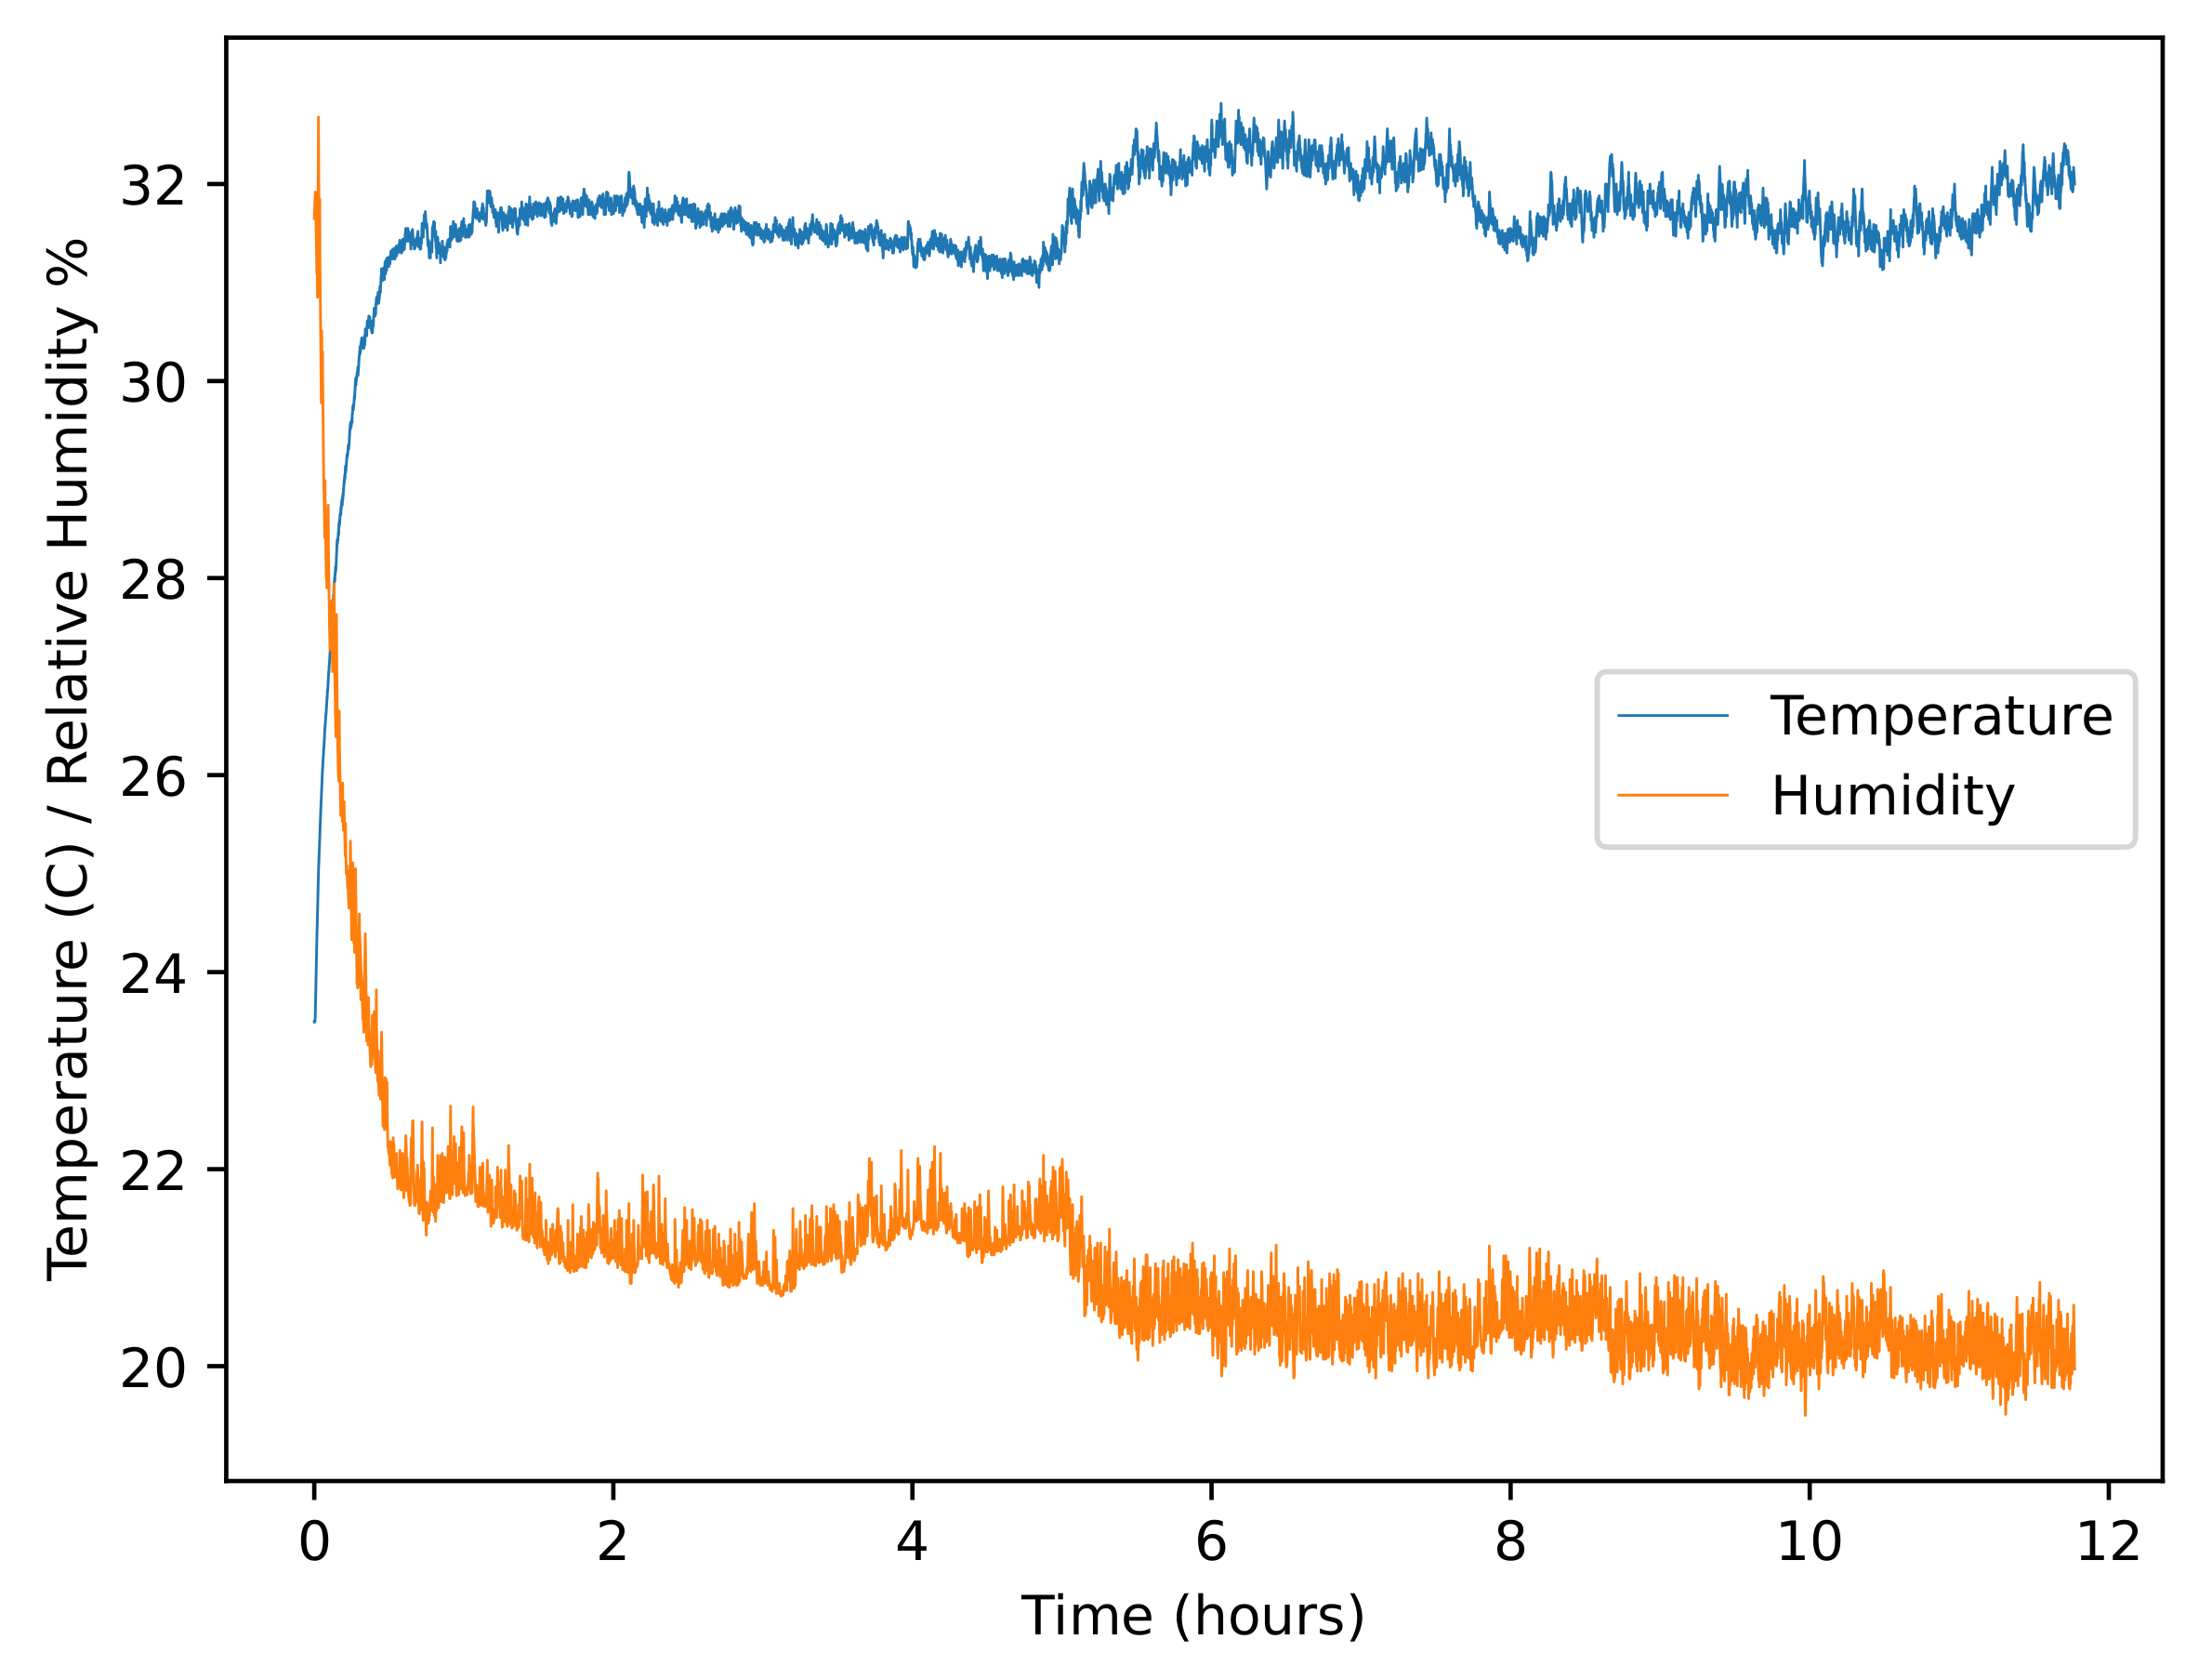
It was noted that the humidity of water plays a significant role in the response of sensors. This was expected, as ZnO becomes hydrophilic under UV radiation [59]. Other works also reference the effect of humidity on metal oxide gas sensors [29]. However, humidity and the odour of Taktic together also affects the sensor response. For this reason, humidity and temperature were controlled in the laboratory and measured in the sensor chamber during measurements. It was found that the temperature and humidity in the UV nail studio stabilise after time, with the mean temperature being 31.77 °C with a standard deviation of 0.35 °C. The relative humidity also stabilises to a mean of 20.66% with a standard deviation of 0.50%. This can be seen in Figure 22, where the temperature and humidity were logged during the measurement in Figure 21.

3.2.4. UV Light Intensity

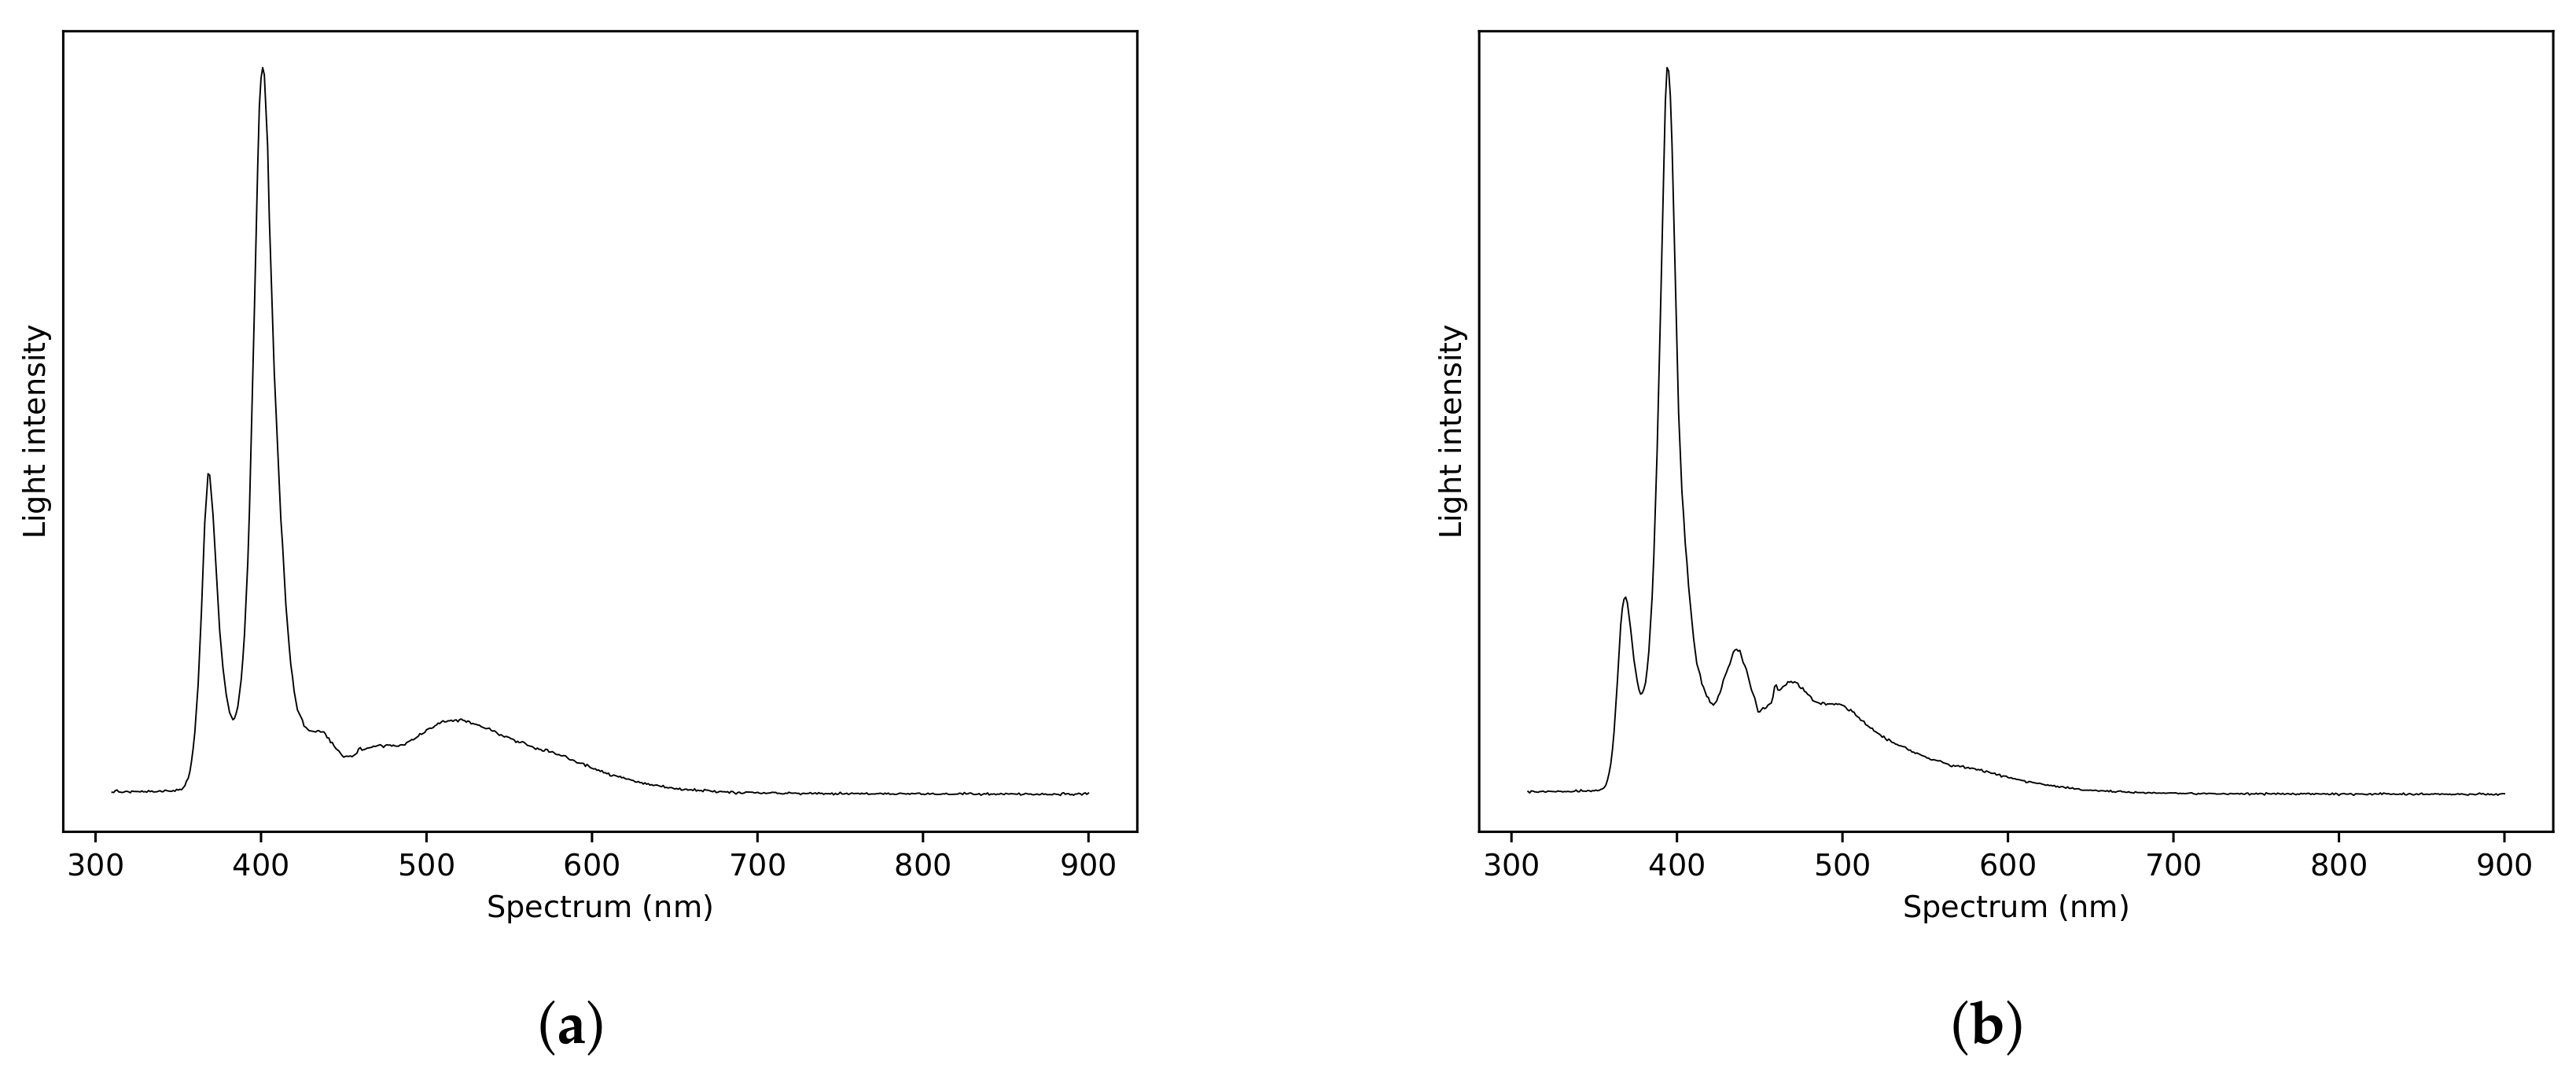
The intensity of the UV light was also found to influence the sensor response. Two UV light sources were compared for use with the screen-printed gas sensors and a mixture of Taktic in water: the RapidCure [54] and SunR9 [55] nail studios. The response of the screen-printed gas sensor with commercial ZnO nanoparticles was exposed to air, the odour of water, and 2000 ppm Taktic in water under the exposure of the RapidCure UV nail studio (Figure 23a). This was repeated with the SUNR9 UV nail studio, which has a higher light intensity (Figure 23b). Using an Rk-3260 Laser Power Meter, it was determined that the SUNR9 UV light source had an intensity 4x larger than the Rapidcure UV light source.
The spectrum of the UV light sources was also measured and can be seen in Figure 24.

3.2.5. ZnO Gas Sensor Response to Taktic in Water

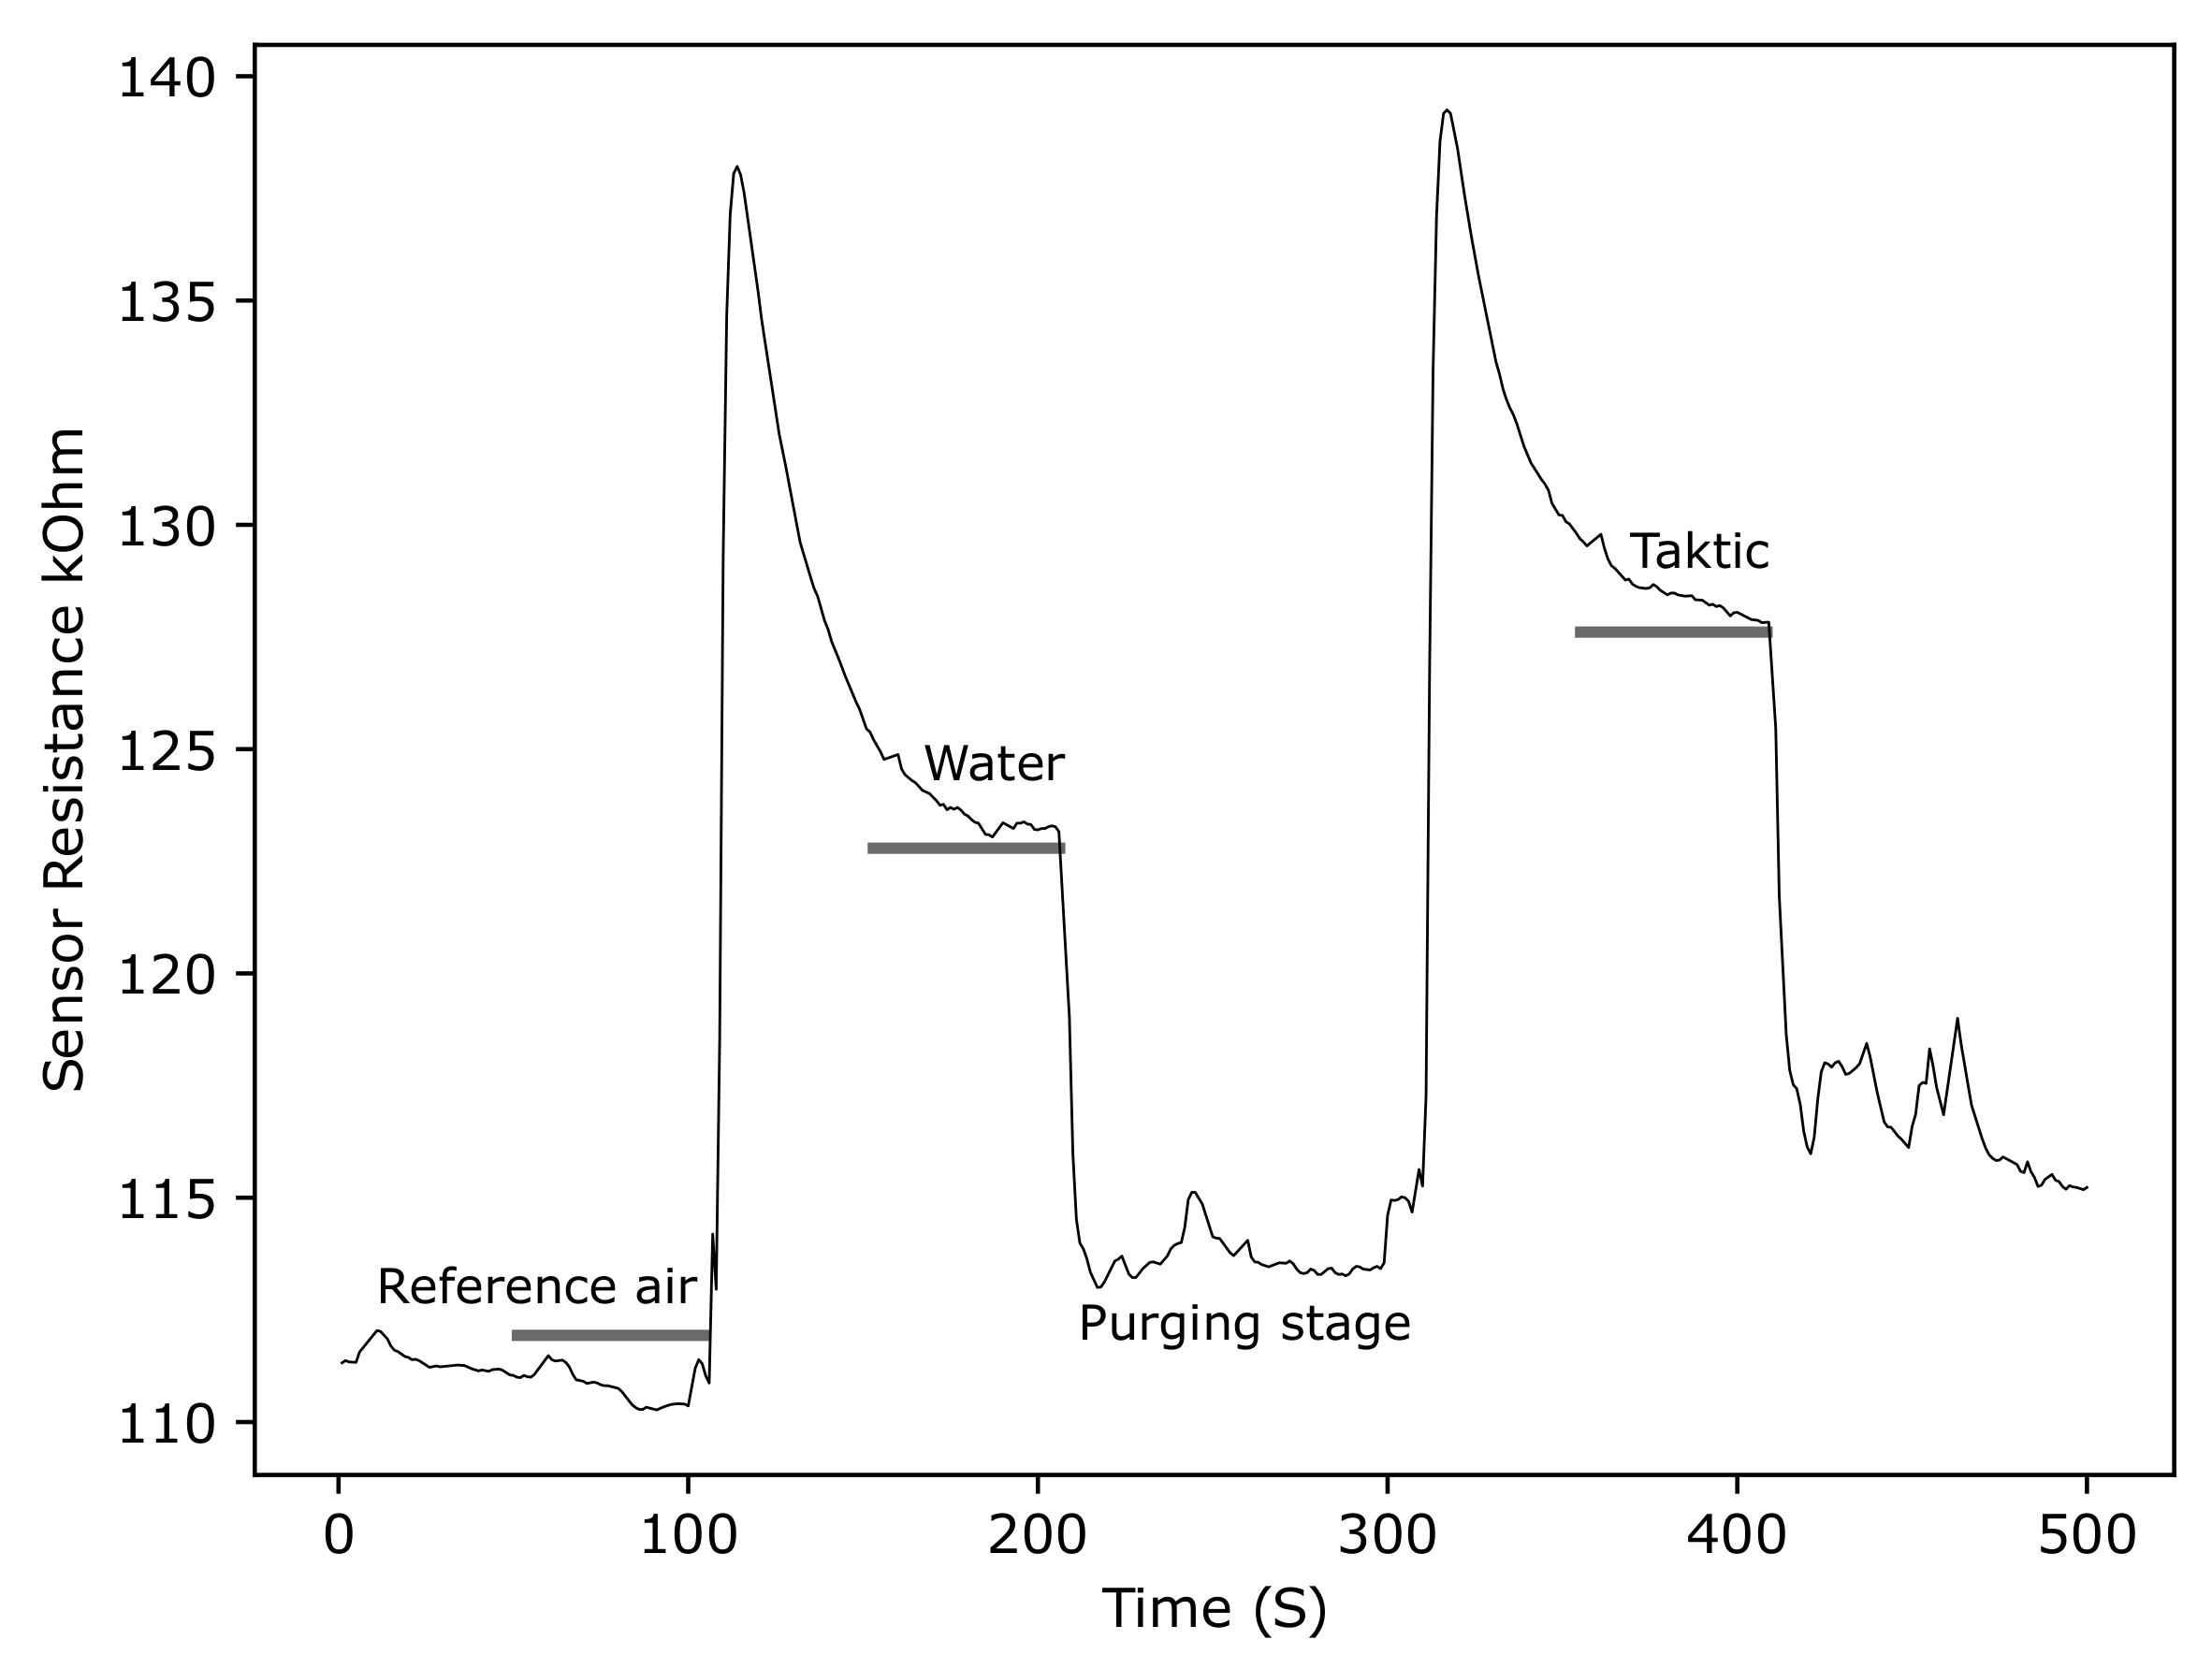
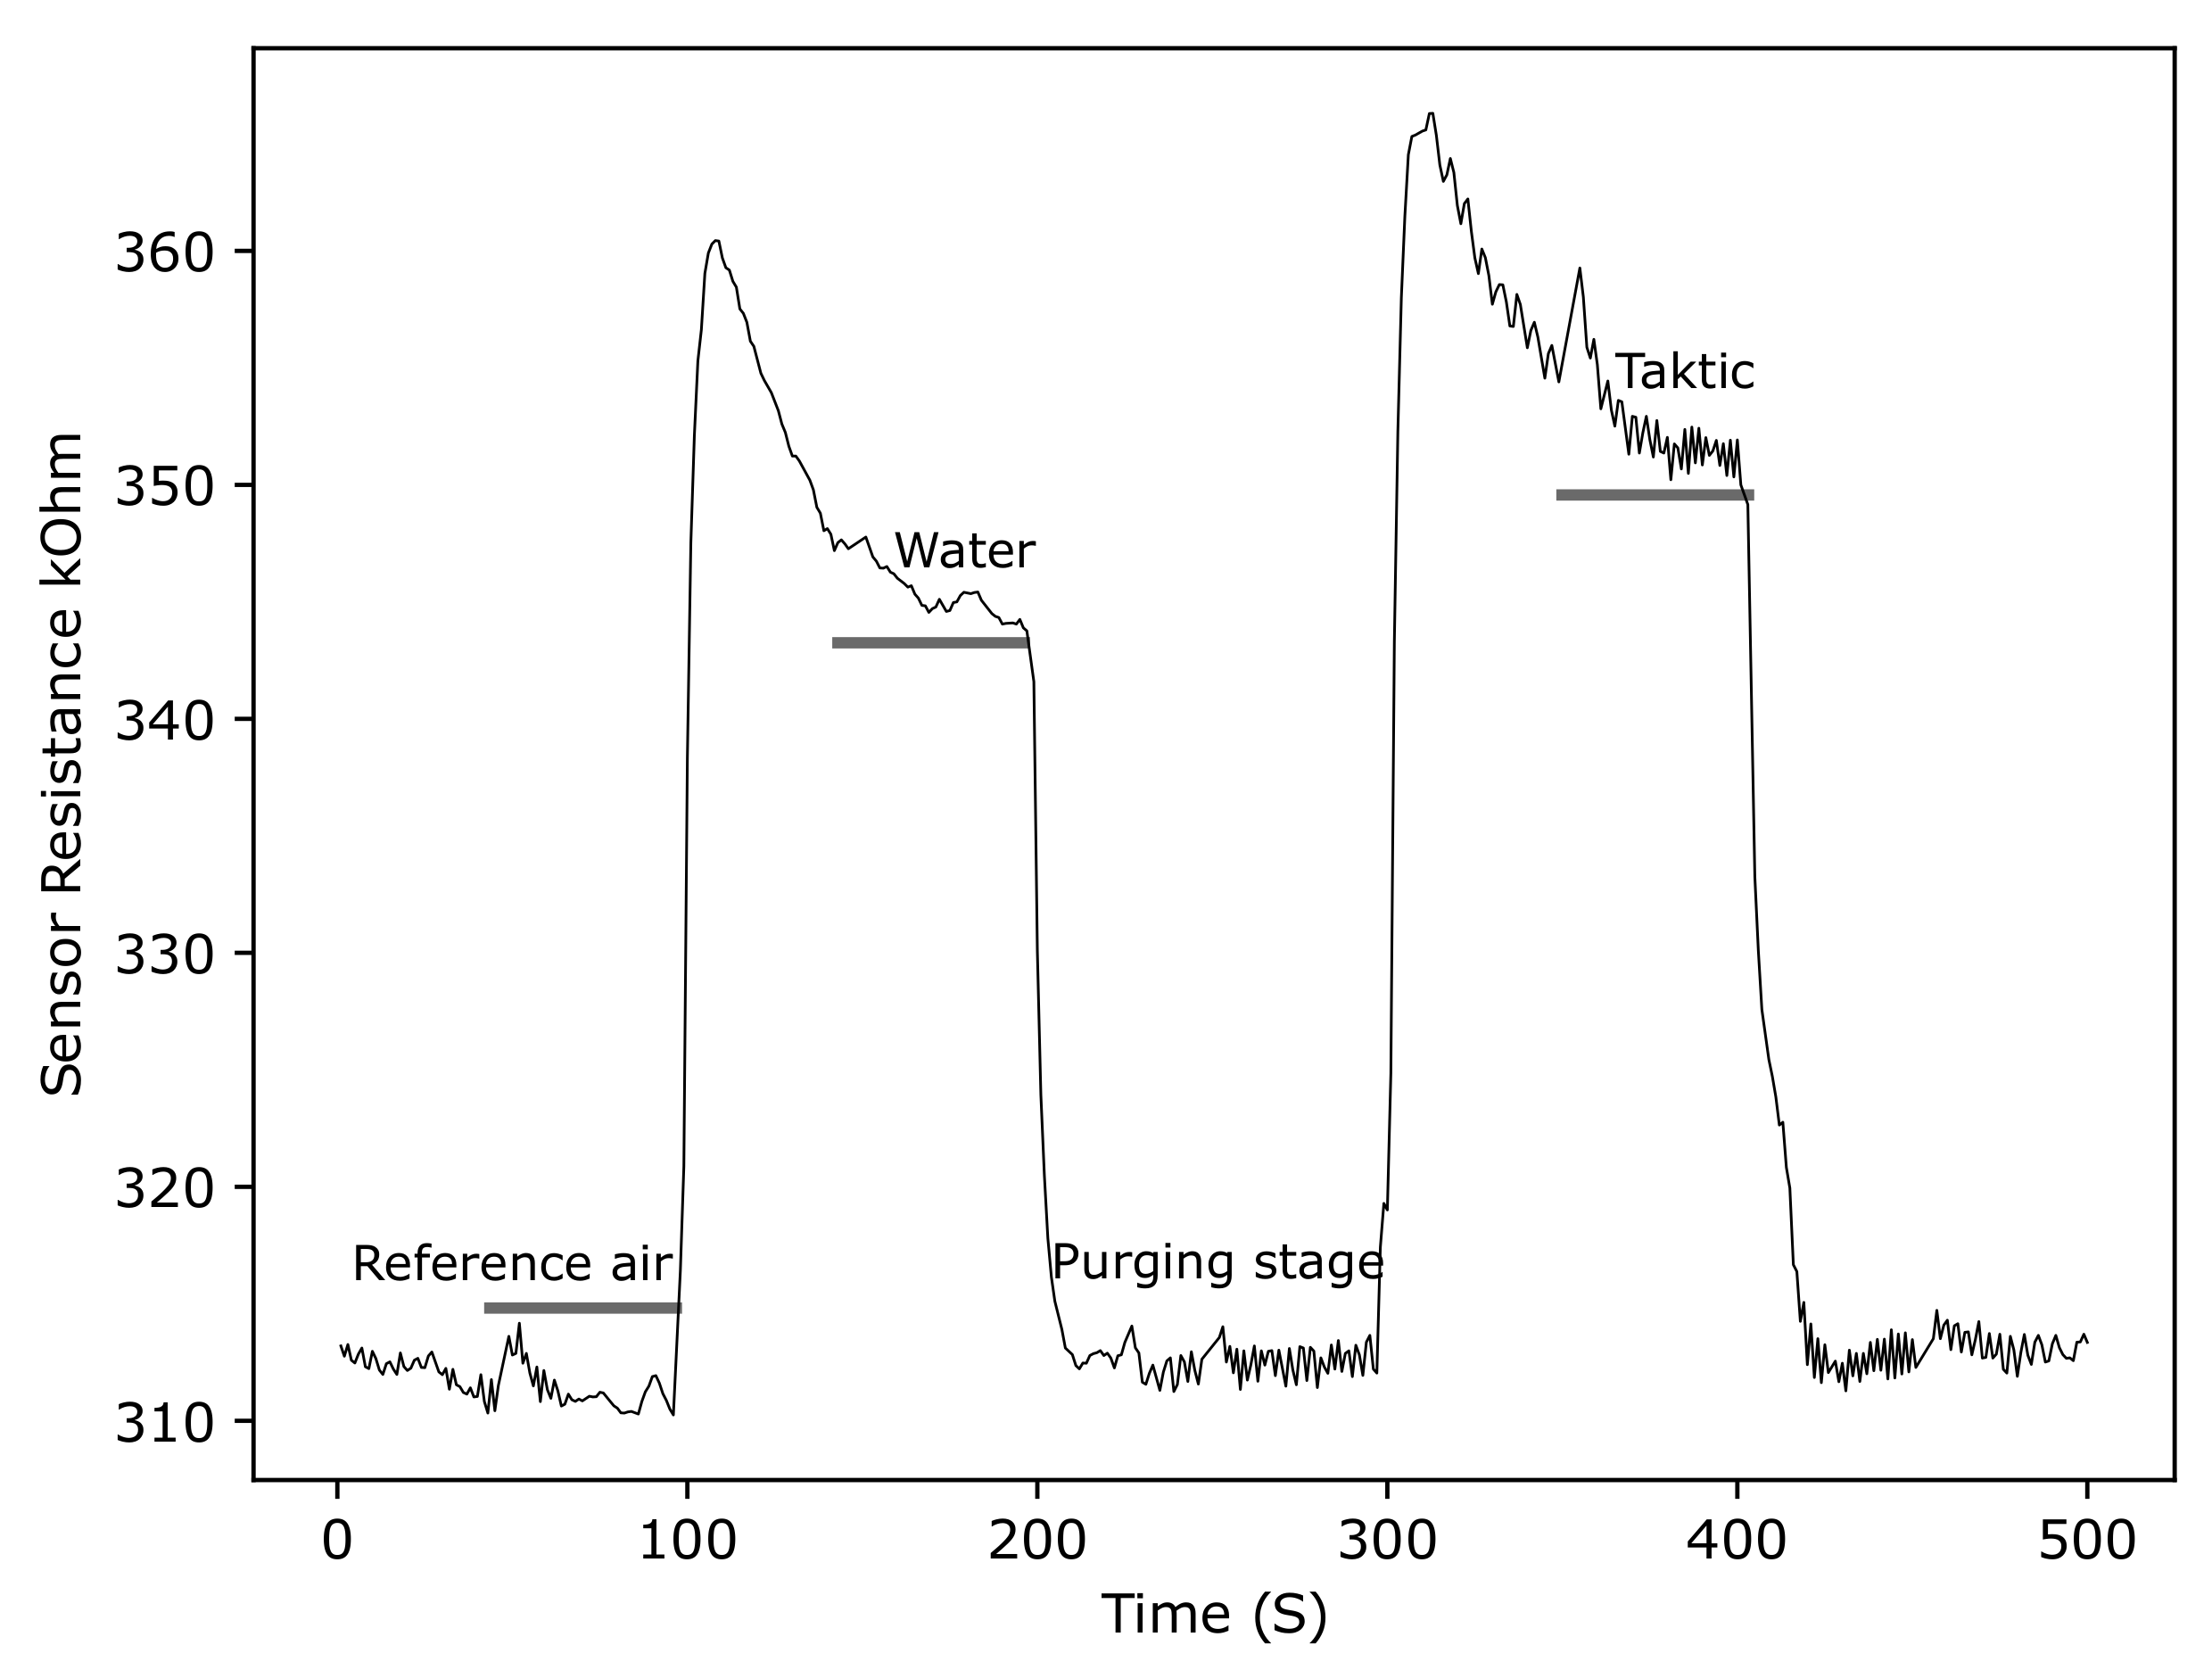
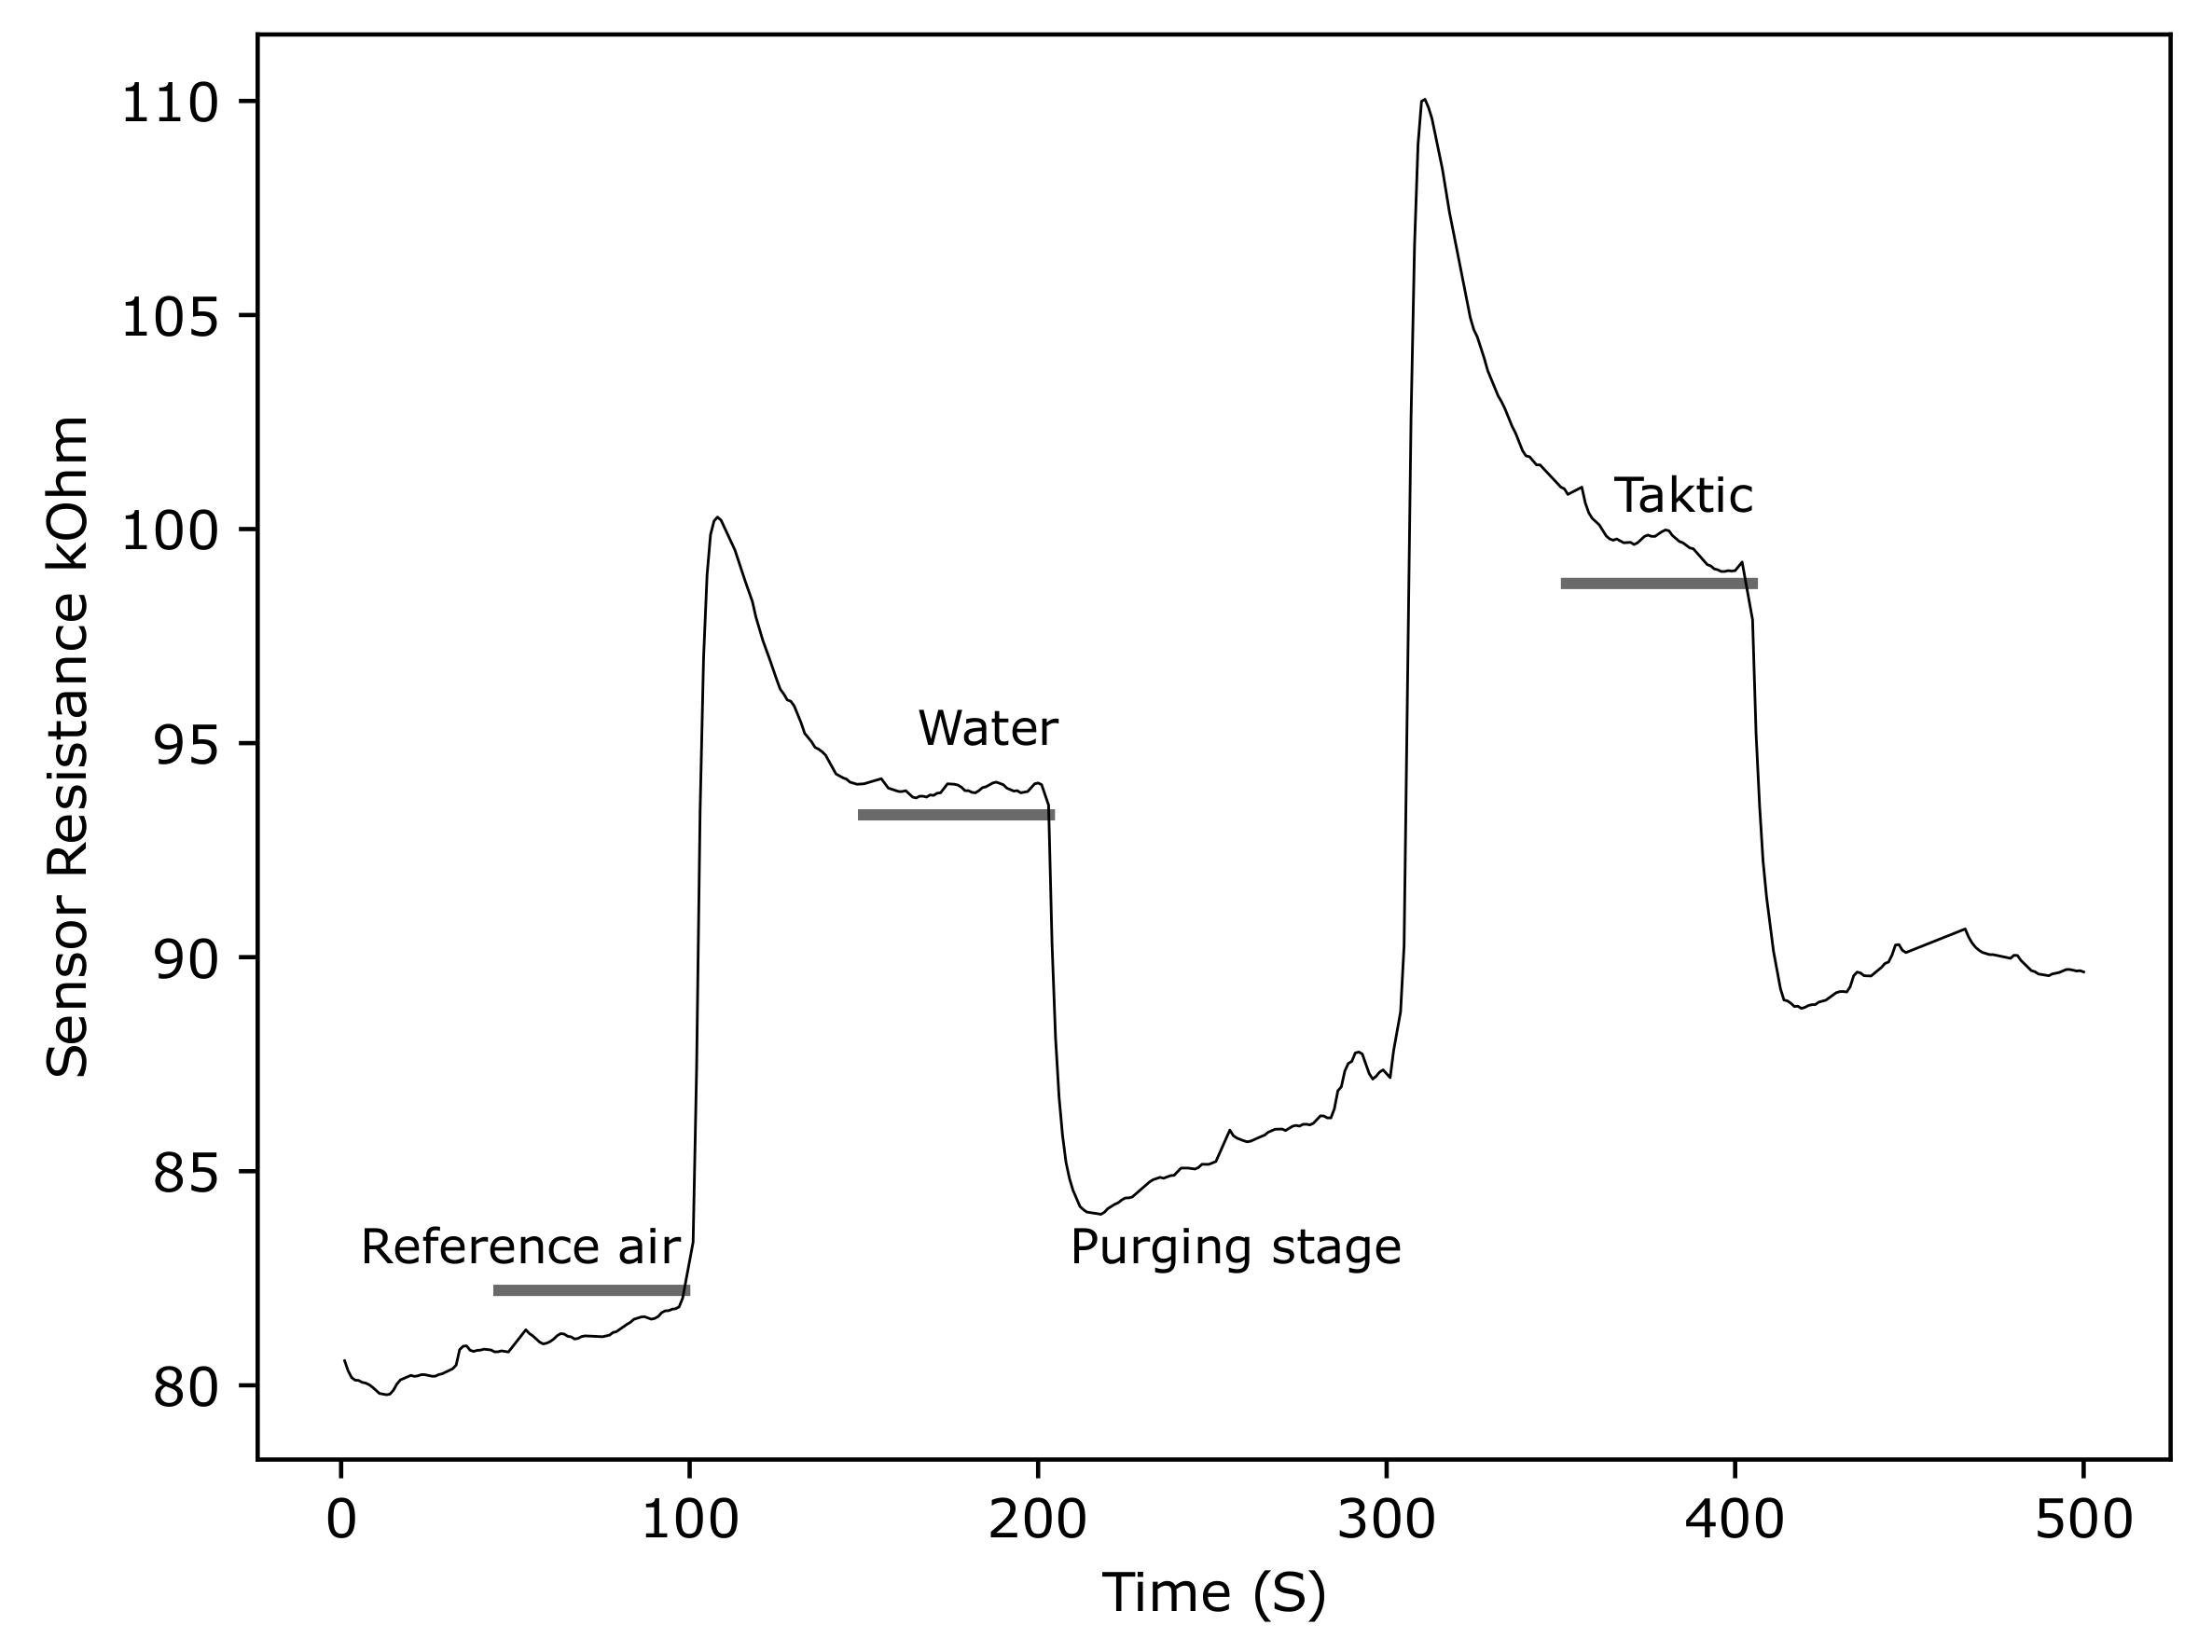
The ZnO gas sensors were exposed to the odours from the reference air, clean tap water, and a 2000 ppm Taktic in tap water mixture. If the measurements for air, water, and Taktic are distinguishable, the sensor could be used to detect Taktic in water. Each sensor was exposed to the reference air for 100 s and then to the odour of water and Taktic with a sensor purge after each measurement. The SUNR9 UV light source used to illuminate the gas sensors resets every 50 s and creates small outliers in the sensor response. UV light exposure is directly related to sensor resistance and, as the light turns off momentarily, a small spike in resistance is observed. Since the sensor responses will only be used after settling (which only occurs after the sample has been read for 50 s), these outliers can be removed and are not shown in Figure 25, Figure 26 and Figure 27.
The response of the screen printed 0.5 M sol-gel ZnO gas sensor can be seen in Figure 25.
The response of the screen-printed 1.5 M sol-gel ZnO gas sensor can be seen in Figure 26.
The response of the screen-printed off-the-shelf ZnO nanoparticle ink gas sensor, can be seen in Figure 27.
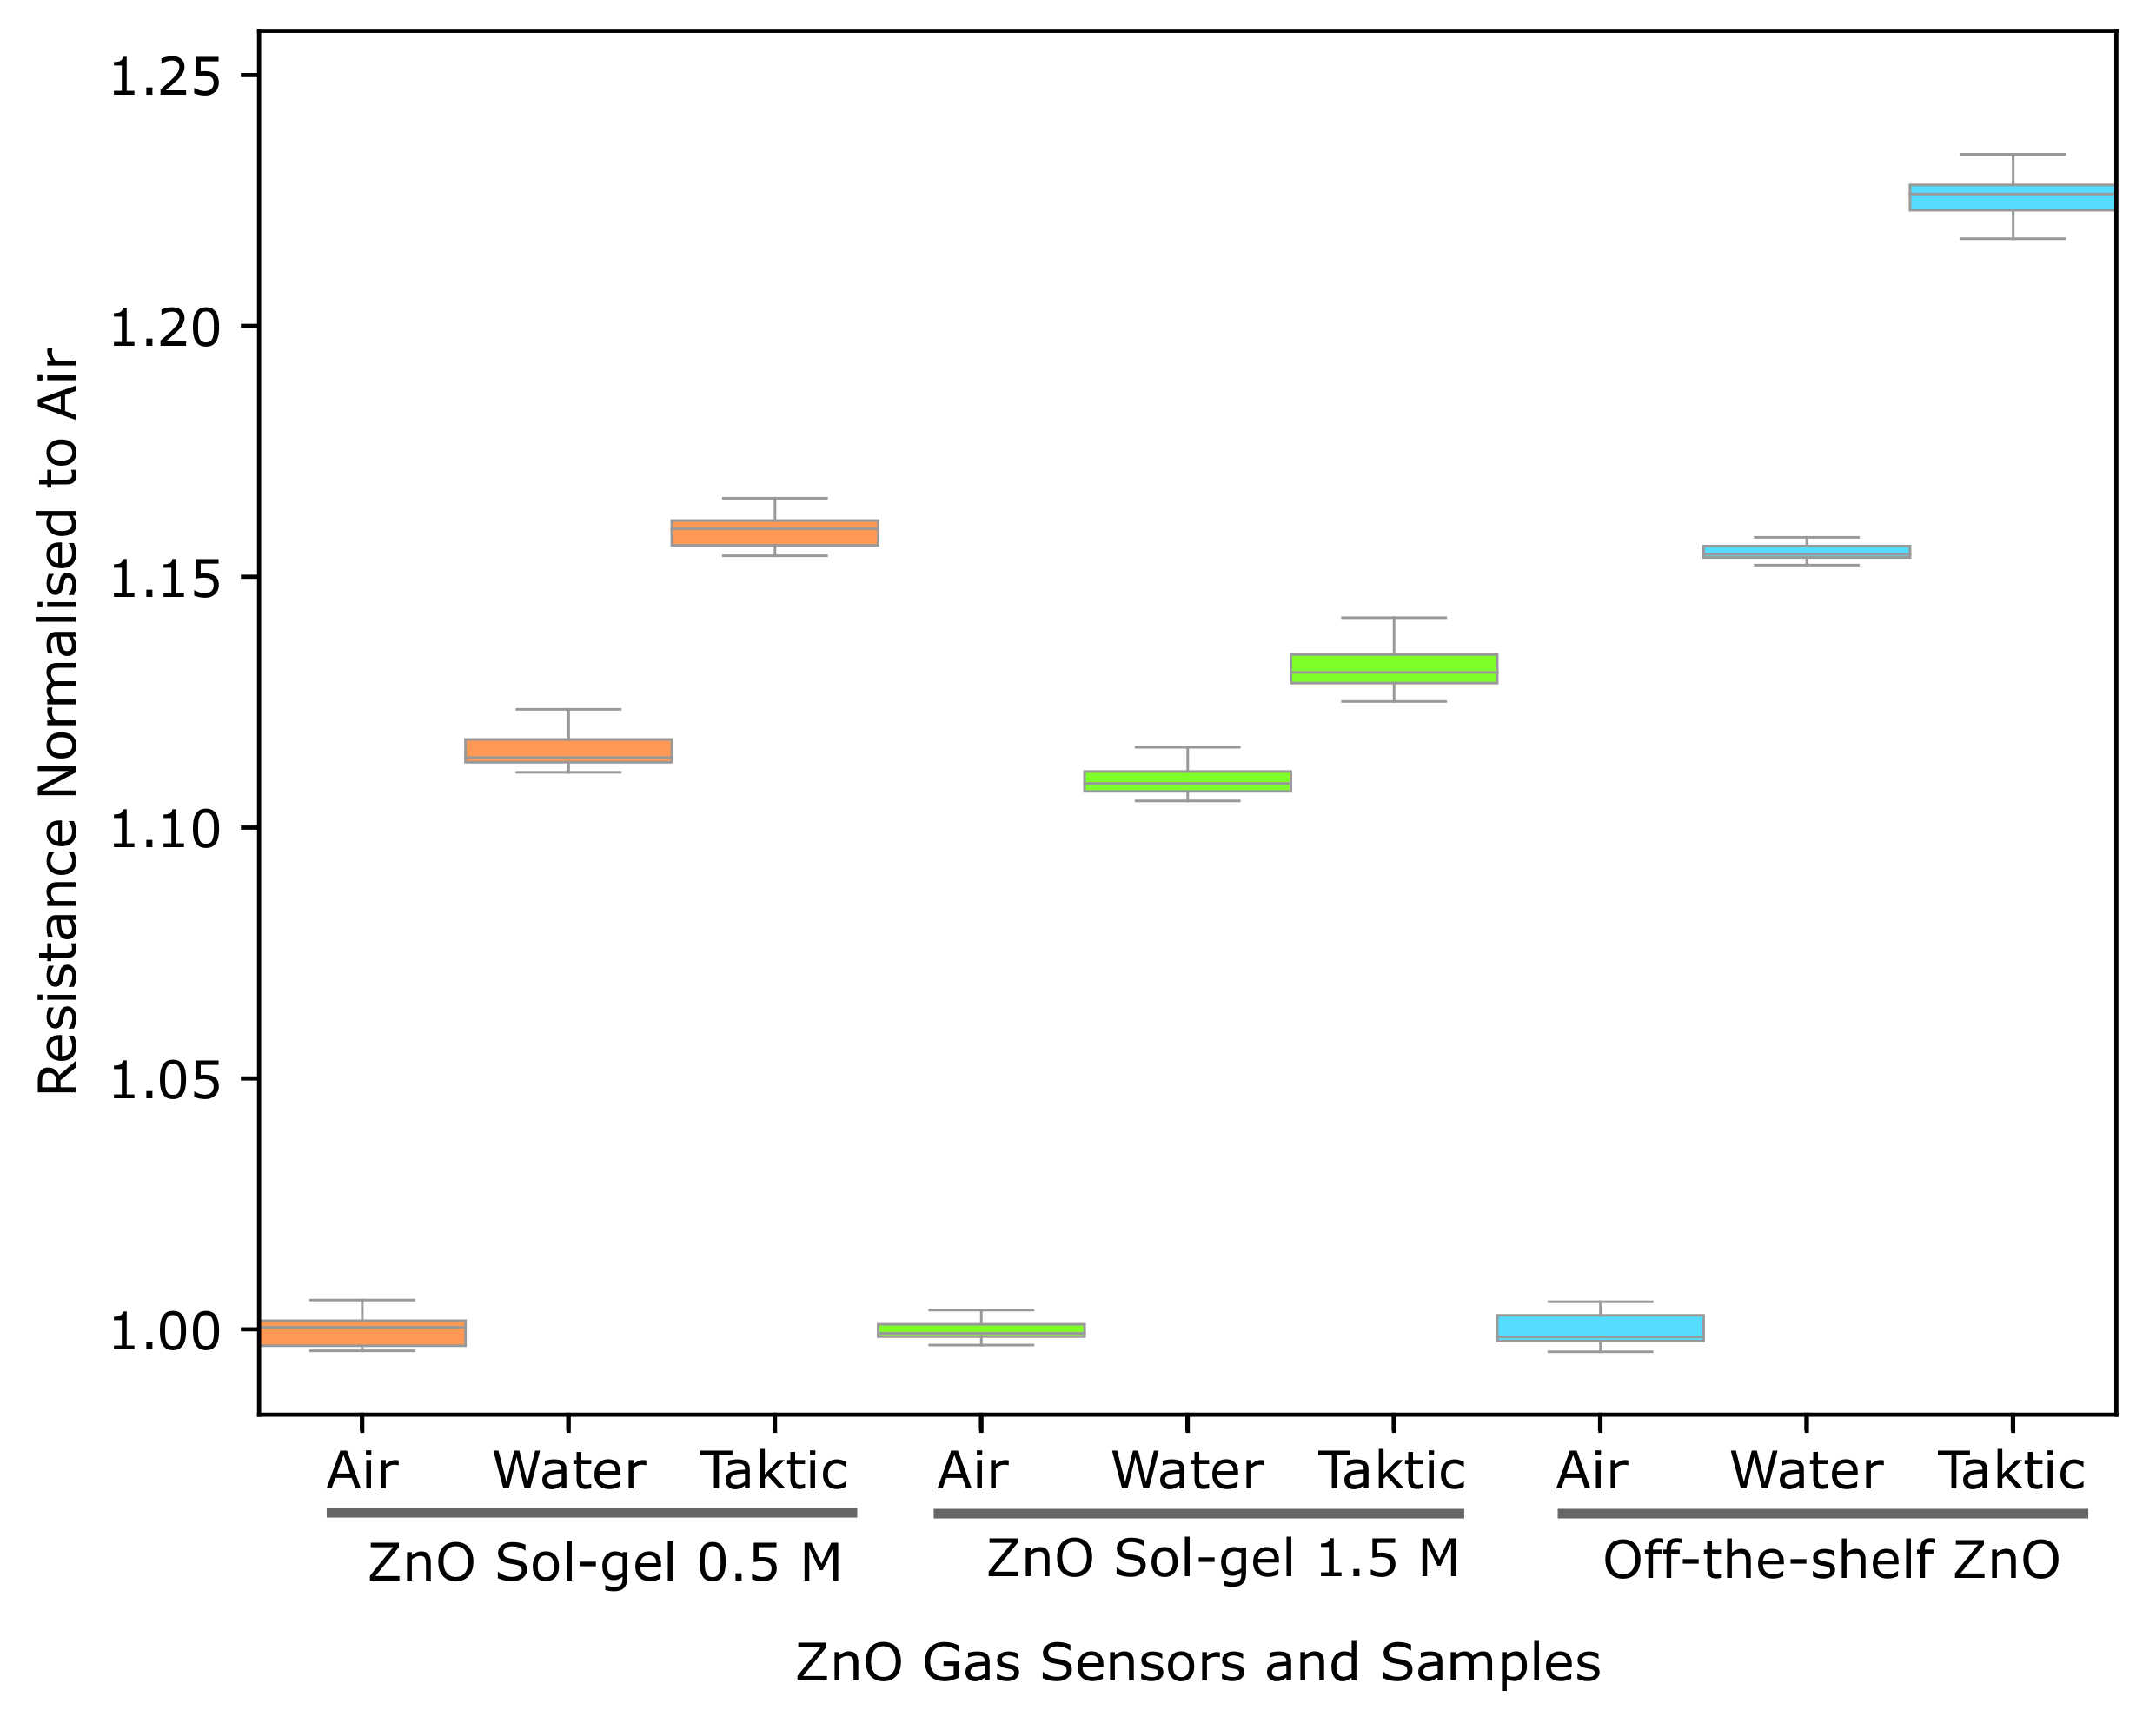
For all of the sensors, it can be seen that the sensor responses stabilised after 50 s. The 45 s directly after stabilisation were recorded for each sensor. The resultant stable resistance measurements from each sensor were normalised to air, compared, and are shown in a box plot in Figure 28.
The sensors all showed tight groupings around the average measurement, with few outliers. This can also be seen in Table 4, where the distributions of the data are compared.
The decreasing resistance of the screen-printed gas sensors with Taktic indicates a p-type behaviour, i.e., an oxidising gas. This is in contrast with the n-type behaviour, i.e., a reducing behaviour of pure Taktic. The effect of humidity on all screen printed ZnO gas sensors is very large.

4. Discussion

4.1. Insecticide Monitoring with an E-Nose and Commercial Gas Sensors

An e-nose was constructed with commercial gas sensors. These sensors generally showed differing responses to the odours of the reference air, distilled water, farm water, and four concentrations of Taktic (an Amitraz-based insecticide). In Figure 12, it is clear that most sensors are reactive to the odour of Taktic in water. One can also observe that the sensors show a bigger response to the Taktic odour than the difference between farm water and distilled water. This would allow such an e-nose to work with little interference from external odours. A principle component analysis was performed on the data, and the result in Figure 13 confirms that the commercial e-nose can be used to detect different levels of Taktic insecticide in farm water. This was further confirmed by training a naive Bayes classifier with a Gaussian distribution on the data. This classifier achieved a 96.46% accuracy on validation data.
The e-nose with commercial sensors was not tested at a dipping facility for this work. Possible future work could aim to train the e-nose on data from real-world dipping facilities. Access to such rural facilities could prove difficult, and validating the concentration of insecticide would require specialist equipment to be taken to a dipping facility. Alternatively, samples would have to be transported to a centralised laboratory for validation. Remote monitoring of the e-nose sensor values could also be implemented with a communication technique suited to long-distance water quality management [60]. This would enable researchers to log large amounts of sensor data without being at the dipping facility for extended periods of time. Many communal dipping tanks use a mixture of Amitraz and pyrethroids. Training an e-nose on mixtures of insecticides could also be a worthwhile improvement to the work presented in this paper. From the results, it might not be needed to use a complex array of sensors for the monitoring of Amitraz, as most of the sensors respond almost linearly to an increase in concentration. A miniature e-nose could also be made with printed sensors to reduce power usage and size while maintaining an attractive low-cost point.
The e-nose achieves selectivity to Taktic odours by training a classifier. The classifier in this work is able to distinguish very clearly between different levels of Taktic in farm water, and also to the farm water itself. The farm water is generated with actual farm debris, because this is all that one expects to smell other than Taktic at a dipping site. Selectivity to other gases is largely unnecessary, because Taktic will be the dominating odour in the field. Taktic is also not a known chemical, but a proprietary mixture of chemicals meant to serve as an insecticide as a whole. This is why an e-nose could be a good solution, because it does not have to be selective to a specific chemical, but can be trained on an odour profile.

4.2. Room Temperature Screen-Printed ZnO Gas Sensors for Insecticide Detection

Gas sensors were screen-printed using three ZnO nanoparticle solutions. The sensors were auto-sintered at temperatures exceeding 400 °C using a built-in platinum heater. This eliminated the need for a laboratory oven or hot plate and improved the gas sensor fabrication process by reducing the cost of equipment. The sensors were also not heated during measurements and were run at room temperature. By illuminating the ZnO layer with 405 nm UV light, a similar effect was achieved to heating and the ZnO coated IDE functioned as a gas sensor. By building sensor enclosures with built-in UV LEDs, the sensor power usage could be decreased by an order of magnitude, further reducing the environmental impact and cost of such sensors.
The screen-printed ZnO sensors all showed distinct responses to the odour of Taktic. The sensors show drift over time. This is characteristic of ZnO gas sensors. The same sensors showed differing responses to the odours of water and 2000 ppm Taktic insecticide in water. However, the sensors are very sensitive to humidity and the response of the sensors to Taktic in water is dominated by the oxidation reaction caused by the humidity. In Section 3, the effects of UV light intensity and the out-gassing of 3D-printed resin material is also discussed. Future work should aim to improve sensor responses over time and the effects of humidity. By doping the metal oxides, heating the sensors while exposing them to UV, or removing the humidity in the sensor enclosure, one could improve the sensor responses to humidity. However, it is important to note that the aim of these sensors is to use them in a multi-sensor e-nose configuration so that selectivity to the target gas can be trained with a classifier. The classifier could also be trained to take relative humidity into account if one adds a humidity sensor to the e-nose device. In future work, the sensors could also be manufactured with a reference electrode. This would reduce the effect of temperature and humidity on the sensor. The sensors could also be sintered at different temperatures and times to determine the ultimate effectiveness of the auto-sintering, compared to more standard techniques. This also applies to the effect of the gas sensing layer thickness, which could be investigated for better selectivity to insecticide odours. UV wavelength and power density (or intensity of energy) could be varied for more selective sensitivity to the insecticide gas component(s). Visible light irradiation could also be investigated to create sensors with an even lower cost [34]. Screen-printed ZnO gas sensors could be used in an e-nose as part of an array of other sensors to show their efficacy in an on-site device for insecticide monitoring.

5. Conclusions

An e-nose was constructed with commercial gas sensors. This e-nose was able to estimate the concentration of five levels of Taktic insecticide in farm water and distinguish it from the odours of distilled water, farm water, and air. Using a naive Bayes classifier algorithm, the system achieved a 96.46% accuracy on an unseen validation data set. Except for our previous work [17], there are no studies in the literature where an e-nose is used to estimate the concentration of Taktic in water. This work improves on the previous study by estimating the concentration of Taktic in spiked farm water samples. This work also improves on other research where e-noses detect insecticide [15,16] by providing a bespoke low-cost e-nose, rather than using an expensive general-purpose industrial e-nose. At the e-nose application level, further work includes the validation of the bespoke low-cost e-nose with a larger number of spiked real farm water samples, followed by testing in the farm environment. Although Taktic is the most prevalently used acaricide in sub-Saharan Africa, other acaricides, as well as mixtures of insecticides, must also be investigated in future. Furthermore, the overall aim of our work is to enable decentralised manufacture of sensors and microsystems with facile and low-cost processes for use in point-of-need applications. Towards the employment of custom gas sensors in such an e-nose microsystem, three custom gas sensors were fabricated via screen printing using ZnO nanoparticles that were prepared using the sol-gel [45,46] method, as well as with a printable off-the-shelf ZnO particulate solution. The custom screen-printed ZnO sensors are operated at much lower power than the commercial sensors used in our low-cost e-nose by utilising UV radiation, rather than heating, to activate the ZnO layers for gas sensing. These sensors show clear responses to Taktic odours and are able to purge with air. The sensors are also shown to detect Taktic in water with differing measurements for water and the recommended concentration of 2000 ppm Taktic in water. Because the response to humidity dominates the sensor response, future work includes the reduction of the influence of humidity and the improvement of the sensitivity of the sensors to the odour of Taktic in water. Further attention is also required regarding passivation of the sensor surface to ensure stable long-term sensing. Nevertheless, the screen-printed ZnO sensors are suitable to include in the array within an e-nose configuration for the detection of the Taktic acaricide. Development of the point-of-need e-nose microsystem requires expanding research into more gas sensor devices that can be fabricated with low-cost printing processes using materials that can be easily prepared.

Author Contributions

Conceptualization, T.-H.J.; methodology, A.W.R. and J.M.N.; software, A.W.R.; validation, A.W.R.; formal analysis, A.W.R.; investigation, A.W.R.; resources, J.M.N. and T.-H.J.; data curation, A.W.R.; writing—original draft preparation, A.W.R.; writing—review and editing, T.-H.J., J.M.N. and A.W.R.; visualization, A.W.R.; supervision, T.-H.J.; project administration, T.-H.J.; funding acquisition, J.M.N. and T.-H.J. All authors have read and agreed to the published version of the manuscript.

Funding

This research was funded by the National Research Foundation, grant number 137977 “Characterization of chemically deposited thin film semiconductor devices”. This research was co-funded by the University of Pretoria under the Additive Manufacturing for Electronic Systems grant and the Department of Science and Innovation Nano and Micro Manufacturing Facility grant.

Data Availability Statement

The sensor readout data for the e-nose with commercial sensors and the screen printed ZnO sensors are available at Rohde, Archibald Wishard (2023), “Data for “Insecticide Monitoring in Cattle Dip with an E-Nose System and Room Temperature Screen-Printed ZnO Gas Sensors”.”, Mendeley Data, V2, doi: 10.17632/pfs488kjyg.2.

Acknowledgments

The authors would like to thank Abdulraoof I. A. Ali, University of Pretoria, for the synthesis of the 0.5 M sol-gel ZnO solution and SEM images. The authors would also like to thank Chaoyu Wu, Karlsruhe Institute of Technology, for the synthesis of the 1.5 M sol-gel ZnO solution. Finally, the authors would like to thank Christine Maritz-Olivier, University of Pretoria, for the concept.

Conflicts of Interest

The authors declare no conflict of interest. The funders had no role in the design of the study; in the collection, analyses, or interpretation of data; in the writing of the manuscript; or in the decision to publish the results.

Abbreviations

The following abbreviations are used in this manuscript:
MDPIMultidisciplinary Digital Publishing Institute
E-noseElectronic nose
ADCAnalogue-to-digital converter
ANNArtificial neural network
UVUltra violet
EHDElectrohydrodynamic
EMFElectromagnetic fields
ppmParts per million
MEAMonoethanolamine
IDEInterdigitated electrode
PCAPrinciple component analysis

References

  1. Moyo, B.; Masika, P. Tick control methods used by resource-limited farmers and the effect of ticks on cattle in rural areas of the Eastern Cape Province, South Africa. Trop. Anim. Health Prod. 2009, 41, 517–523. [Google Scholar] [CrossRef] [PubMed]
  2. Murigu, M.M.; Waruiru, R.M. Comparative Efficacy of Metarhizium anisopliae and Amitraz in Control of Rhipicephalus decoloratus on Cattle under Field Conditions in Kenya. Alex. J. Vet. Sci. 2020, 66, 52–59. [Google Scholar]
  3. De Meneghi, D.; Stachurski, F.; Adakal, H. Experiences in tick control by acaricide in the traditional cattle sector in Zambia and Burkina Faso: Possible environmental and public health implications. Front. Public Health 2016, 4, 1–11. [Google Scholar] [CrossRef] [PubMed] [Green Version]
  4. Kumar, R. Molecular markers and their application in the monitoring of acaricide resistance in Rhipicephalus microplus. Exp. Appl. Acarol. 2019, 78, 149–172. [Google Scholar] [CrossRef] [PubMed]
  5. Baron, S.; Barrero, R.A.; Black, M.; Bellgard, M.I.; van Dalen, E.M.; Fourie, J.; Maritz-Olivier, C. Differentially expressed genes in response to amitraz treatment suggests a proposed model of resistance to amitraz in R. decoloratus ticks. Int. J. Parasitol. Drugs Drug Resist. 2018, 8, 361–371. [Google Scholar] [CrossRef]
  6. George, J.; Davey, R.; Ahrens, E.; Pound, J.; Drummond, R. Efficacy of amitraz (Taktic® 12.5% EC) as a dip for the control of Boophilus microplus (Canestrini) (Acari: Ixodidae) on cattle. Prev. Vet. Med. 1998, 37, 55–67. [Google Scholar] [CrossRef]
  7. Muvhuringi, P.B.; Murisa, R.; Sylvester, D.; Chigede, N.; Mafunga, K. Factors worsening tick borne diseases occurrence in rural communities. A case of Bindura district, Zimbabwe. Cogent Food Agric. 2022, 8, 2082058. [Google Scholar] [CrossRef]
  8. Msimang, V.; Rostal, M.K.; Cordel, C.; Machalaba, C.; Tempia, S.; Bagge, W.; Burt, F.J.; Karesh, W.B.; Paweska, J.T.; Thompson, P.N. Factors affecting the use of biosecurity measures for the protection of ruminant livestock and farm workers against infectious diseases in central South Africa. Transbound. Emerg. Dis. 2022, 69, e1899–e1912. [Google Scholar] [CrossRef]
  9. Delaire, C.; Peletz, R.; Kumpel, E.; Kisiangani, J.; Bain, R.; Khush, R. How Much Will It Cost to Monitor Microbial Drinking Water Quality in Sub-Saharan Africa? Environ. Sci. Technol. 2017, 51, 5869–5878. [Google Scholar] [CrossRef] [Green Version]
  10. Sungirai, M.; Baron, S.; Moyo, D.Z.; De Clercq, P.; Maritz-Olivier, C.; Madder, M. Genotyping acaricide resistance profiles of Rhipicephalus microplus tick populations from communal land areas of Zimbabwe. Ticks Tick-Borne Dis. 2018, 9, 2–9. [Google Scholar] [CrossRef] [Green Version]
  11. Cheng, L.; Meng, Q.H.; Lilienthal, A.J.; Qi, P.F. Development of compact electronic noses: A review. Meas. Sci. Technol. 2021, 32, 062002. [Google Scholar] [CrossRef]
  12. Jia, W.; Liang, G.; Tian, H.; Sun, J.; Wan, C. Electronic nose-based technique for rapid detection and recognition of moldy apples. Sensors 2019, 19, 1526. [Google Scholar] [CrossRef] [Green Version]
  13. Snitz, K.; Andelman-Gur, M.; Pinchover, L.; Weissgross, R.; Weissbrod, A.; Mishor, E.; Zoller, R.; Linetsky, V.; Medhanie, A.; Shushan, S.; et al. Proof of concept for real-time detection of SARS CoV-2 infection with an electronic nose. PLoS ONE 2021, 16, e0252121. [Google Scholar] [CrossRef] [PubMed]
  14. Lee-Rangel, H.A.; Mendoza-Martinez, G.D.; Diaz de León-Martínez, L.; Relling, A.E.; Vazquez-Valladolid, A.; Palacios-Martínez, M.; Hernández-García, P.A.; Chay-Canul, A.J.; Flores-Ramirez, R.; Roque-Jiménez, J.A. Application of an electronic nose and HS-SPME/GC-MS to determine volatile organic compounds in fresh mexican cheese. Foods 2022, 11, 1887. [Google Scholar] [CrossRef]
  15. Tang, Y.; Xu, K.; Zhao, B.; Zhang, M.; Gong, C.; Wan, H.; Wang, Y.; Yang, Z. A novel electronic nose for the detection and classification of pesticide residue on apples. RSC Adv. 2021, 11, 20874–20883. [Google Scholar] [CrossRef]
  16. Tang, X.; Xiao, W.; Shang, T.; Zhang, S.; Han, X.; Wang, Y.; Sun, H. An Electronic Nose Technology to Quantify Pyrethroid Pesticide Contamination in Tea. Chemosensors 2020, 8, 30. [Google Scholar] [CrossRef]
  17. Rohde, A.; Joubert, T.H. A Portable e-nose for Monitoring Amitraz Insecticide in Cattle Dip. In Proceedings of the 2021 IEEE AFRICON, Arusha, Tanzania, 13–15 September 2021; pp. 1–6. [Google Scholar]
  18. Figaro Gas Sensors & Modules. Available online: https://www.figarosensor.com/ (accessed on 12 June 2023).
  19. Popa, D.; Udrea, F. Towards Integrated Mid-Infrared Gas Sensors. Sensors 2019, 19, 2076. [Google Scholar] [CrossRef] [PubMed] [Green Version]
  20. Yao, M.S.; Li, W.H.; Xu, G. Metal–organic frameworks and their derivatives for electrically-transduced gas sensors. Coord. Chem. Rev. 2021, 426, 213479. [Google Scholar] [CrossRef]
  21. Nazemi, H.; Joseph, A.; Park, J.; Emadi, A. Advanced Micro- and Nano-Gas Sensor Technology: A Review. Sensors 2019, 19, 1285. [Google Scholar] [CrossRef]
  22. Kuchmenko, T.A.; Lvova, L.B. A Perspective on Recent Advances in Piezoelectric Chemical Sensors for Environmental Monitoring and Foodstuffs Analysis. Chemosensors 2019, 7, 39. [Google Scholar] [CrossRef] [Green Version]
  23. Chen, Y.; Li, M.; Yan, W.; Zhuang, X.; Ng, K.W.; Cheng, X. Sensitive and low-power metal oxide gas sensors with a low-cost microelectromechanical heater. ACS Omega 2021, 6, 1216–1222. [Google Scholar] [CrossRef] [PubMed]
  24. Wagner, R.; Schönauer-Kamin, D.; Moos, R. Novel Operation Strategy to Obtain a Fast Gas Sensor for Continuous ppb-Level NO2 Detection at Room Temperature Using ZnO—A Concept Study with Experimental Proof. Sensors 2019, 19, 4104. [Google Scholar] [CrossRef] [PubMed] [Green Version]
  25. Wang, Z.; Bu, M.; Hu, N.; Zhao, L. An overview on room-temperature chemiresistor gas sensors based on 2D materials: Research status and challenge. Compos. Part B Eng. 2023, 248, 110378. [Google Scholar] [CrossRef]
  26. Ji, H.; Zeng, W.; Li, Y. Gas sensing mechanisms of metal oxide semiconductors: A focus review. Nanoscale 2019, 11, 22664–22684. [Google Scholar] [CrossRef] [PubMed]
  27. Li, T.; Yin, W.; Gao, S.; Sun, Y.; Xu, P.; Wu, S.; Kong, H.; Yang, G.; Wei, G. The Combination of Two-Dimensional Nanomaterials with Metal Oxide Nanoparticles for Gas Sensors: A Review. Nanomaterials 2022, 12, 982. [Google Scholar] [CrossRef]
  28. Wu, Z.; Zhang, H.; Ji, H.; Yuan, Z.; Meng, F. Novel combined waveform temperature modulation method of NiO-In2O3 based gas sensor for measuring and identifying VOC gases. J. Alloys Compd. 2022, 918, 165510. [Google Scholar] [CrossRef]
  29. Li, Z.; Yu, J.; Dong, D.; Yao, G.; Wei, G.; He, A.; Wu, H.; Zhu, H.; Huang, Z.; Tang, Z. E-nose based on a high-integrated and low-power metal oxide gas sensor array. Sens. Actuators B Chem. 2023, 380, 133289. [Google Scholar] [CrossRef]
  30. Shooshtari, M.; Salehi, A. An electronic nose based on carbon nanotube-titanium dioxide hybrid nanostructures for detection and discrimination of volatile organic compounds. Sens. Actuators B Chem. 2022, 357, 131418. [Google Scholar] [CrossRef]
  31. Lee, S.W.; Lee, W.; Hong, Y.; Lee, G.; Yoon, D.S. Recent advances in carbon material-based NO2 gas sensors. Sens. Actuators B Chem. 2018, 255, 1788–1804. [Google Scholar] [CrossRef]
  32. Lee, D.H.; Yoo, H. Recent Advances in Photo-Activated Chemical Sensors. Sensors 2022, 22, 9228. [Google Scholar] [CrossRef]
  33. Mishra, S.; Ghanshyam, C.; Ram, N.; Bajpai, R.; Bedi, R. Detection mechanism of metal oxide gas sensor under UV radiation. Sens. Actuators B Chem. 2004, 97, 387–390. [Google Scholar] [CrossRef]
  34. Chinh, N.D.; Hien, T.T.; Do Van, L.; Hieu, N.M.; Quang, N.D.; Lee, S.M.; Kim, C.; Kim, D. Adsorption/desorption kinetics of nitric oxide on zinc oxide nano film sensor enhanced by light irradiation and gold-nanoparticles decoration. Sens. Actuators B Chem. 2019, 281, 262–272. [Google Scholar] [CrossRef]
  35. Monereo, O.; Claramunt, S.; Vescio, G.; Lahlou, H.; Leghrib, R.; Prades, J.; Cornet, A.; Cirera, A. Carbon nanofiber flexible gas sensor modulated by UV light. In Proceedings of the 2013 Transducers & Eurosensors XXVII: The 17th International Conference on Solid-State Sensors, Actuators and Microsystems (TRANSDUCERS & EUROSENSORS XXVII), Barcelona, Spain, 16–20 June 2013; pp. 1154–1157. [Google Scholar]
  36. Peña, Á.; Matatagui, D.; Ricciardella, F.; Sacco, L.; Vollebregt, S.; Otero, D.; López-Sánchez, J.; Marín, P.; Horrillo, M.C. Optimization of multilayer graphene-based gas sensors by ultraviolet photoactivation. Appl. Surf. Sci. 2023, 610, 155393. [Google Scholar] [CrossRef]
  37. Sik Choi, M.; Young Kim, M.; Mirzaei, A.; Kim, H.S.; il Kim, S.; Baek, S.H.; Won Chun, D.; Jin, C.; Hyoung Lee, K. Selective, sensitive, and stable NO2 gas sensor based on porous ZnO nanosheets. Appl. Surf. Sci. 2021, 568, 150910. [Google Scholar] [CrossRef]
  38. Reker, J.; Meyers, T.; Vidor, F.F.; Joubert, T.H.; Hilleringmann, U. Influence of electrode metallization on thin-film transistor performance. In Proceedings of the 2021 IEEE AFRICON, Arusha, Tanzania, 13–15 September 2021; pp. 1–5. [Google Scholar]
  39. Sahner, K.; Tuller, H. Novel deposition techniques for metal oxide: Prospects for gas sensing. J. Electroceram. 2010, 24, 177–199. [Google Scholar] [CrossRef]
  40. Simonenko, N.P.; Fisenko, N.A.; Fedorov, F.S.; Simonenko, T.L.; Mokrushin, A.S.; Simonenko, E.P.; Korotcenkov, G.; Sysoev, V.V.; Sevastyanov, V.G.; Kuznetsov, N.T. Printing Technologies as an Emerging Approach in Gas Sensors: Survey of Literature. Sensors 2022, 22, 3473. [Google Scholar] [CrossRef]
  41. Khan, S.; Briand, D. All-printed low-power metal oxide gas sensors on polymeric substrates. Flex. Print. Electron. 2019, 4, 015002. [Google Scholar] [CrossRef]
  42. Kwon, H.j.; Hong, J.; Nam, S.Y.; Choi, H.H.; Li, X.; Jeong, Y.J.; Kim, S.H. Overview of recent progress in electrohydrodynamic jet printing in practical printed electronics: Focus on the variety of printable materials for each component. Mater. Adv. 2021, 2, 5593–5615. [Google Scholar] [CrossRef]
  43. Mokrushin, A.S.; Simonenko, T.L.; Simonenko, N.P.; Gorobtsov, P.Y.; Bocharova, V.A.; Kozodaev, M.G.; Markeev, A.M.; Lizunova, A.A.; Volkov, I.A.; Simonenko, E.P.; et al. Microextrusion printing of gas-sensitive planar anisotropic NiO nanostructures and their surface modification in an H2S atmosphere. Appl. Surf. Sci. 2022, 578, 151984. [Google Scholar] [CrossRef]
  44. Jeong, H.; Noh, Y.; Lee, D. Highly stable and sensitive resistive flexible humidity sensors by means of roll-to-roll printed electrodes and flower-like TiO2 nanostructures. Ceram. Int. 2019, 45, 985–992. [Google Scholar] [CrossRef]
  45. Ahmed, M.; Taghizadeh, F.; Auret, F.; Meyer, W.; Nel, J. The effect of alpha particle irradiation on electrical properties and defects of ZnO thin films prepared by sol-gel spin coating. Mater. Sci. Semicond. Process. 2019, 101, 82–86. [Google Scholar] [CrossRef]
  46. Znaidi, L.; Touam, T.; Vrel, D.; Souded, N.; Ben Yahia, S.; Brinza, O.; Fischer, A.; Boudrioua, A. ZnO thin films synthesized by sol-gel process for photonic applications. Acta Phys. Pol. A 2012, 121, 165–168. [Google Scholar] [CrossRef]
  47. Dutronc, P.; Carbonne, B.; Menil, F.; Lucat, C. Influence of the nature of the screen-printed electrode metal on the transport and detection properties of thick-film semiconductor gas sensors. Sens. Actuators B Chem. 1992, 6, 279–284. [Google Scholar] [CrossRef]
  48. Barandun, G.; Gonzalez-Macia, L.; Lee, H.S.; Dincer, C.; Güder, F. Challenges and Opportunities for Printed Electrical Gas Sensors. ACS Sens. 2022, 7, 2804–2822. [Google Scholar] [CrossRef] [PubMed]
  49. He, H.; Guo, J.; Zhao, J.; Xu, J.; Zhao, C.; Gao, Z.; Song, Y.Y. Engineering CuMOF in TiO2 Nanochannels as Flexible Gas Sensor for High-Performance NO Detection at Room Temperature. ACS Sens. 2022, 7, 2750–2758. [Google Scholar] [CrossRef]
  50. Zhu, L.; Zeng, W. Room-temperature gas sensing of ZnO-based gas sensor: A review. Sens. Actuators A Phys. 2017, 267, 242–261. [Google Scholar] [CrossRef]
  51. Formlabs-Buy 3D Printing Materials. Available online: https://formlabs.com/store/materials/ (accessed on 29 April 2023).
  52. Standard Datasheet-Formlabs. Available online: https://formlabs-media.formlabs.com/datasheets/Standard-DataSheet.pdf (accessed on 29 April 2023).
  53. Metrohm Dropsens Spectroelectrochemical Instruments. Available online: https://www.dropsens.com/ (accessed on 29 April 2023).
  54. Planet Nails-Rapidcure 9W UV/LED Lamp. Available online: https://www.nails-beauty.co.za/product/9w-uv-lamp-pni-white/ (accessed on 13 June 2023).
  55. Takealot-SUNR9. Available online: https://www.takealot.com/r9-uv-led-nail-lamp-110w/PLID71575494 (accessed on 13 June 2023).
  56. Hotelling, H. Analysis of a complex of statistical variables into principal components. J. Educ. Psychol. 1933, 24, 417. [Google Scholar] [CrossRef]
  57. Chen, H.; Huo, D.; Zhang, J. Gas Recognition in E-Nose System: A Review. IEEE Trans. Biomed. Circuits Syst. 2022, 16, 169–184. [Google Scholar] [CrossRef]
  58. Ahmed, M.E.I. Characterization of Electrical Properties and Defects in Er- and Yb-Doped ZnO Thin Films Grown by Sol-Gel Spin Coating. Ph.D. Thesis, University of Pretoria, Pretoria, South Africa, 2022. [Google Scholar]
  59. Myint, M.T.Z.; Kumar, N.S.; Hornyak, G.L.; Dutta, J. Hydrophobic/hydrophilic switching on zinc oxide micro-textured surface. Appl. Surf. Sci. 2013, 264, 344–348. [Google Scholar] [CrossRef]
  60. Olatinwo, S.O.; Joubert, T.H. Enabling Communication Networks for Water Quality Monitoring Applications: A Survey. IEEE Access 2019, 7, 100332–100362. [Google Scholar] [CrossRef]
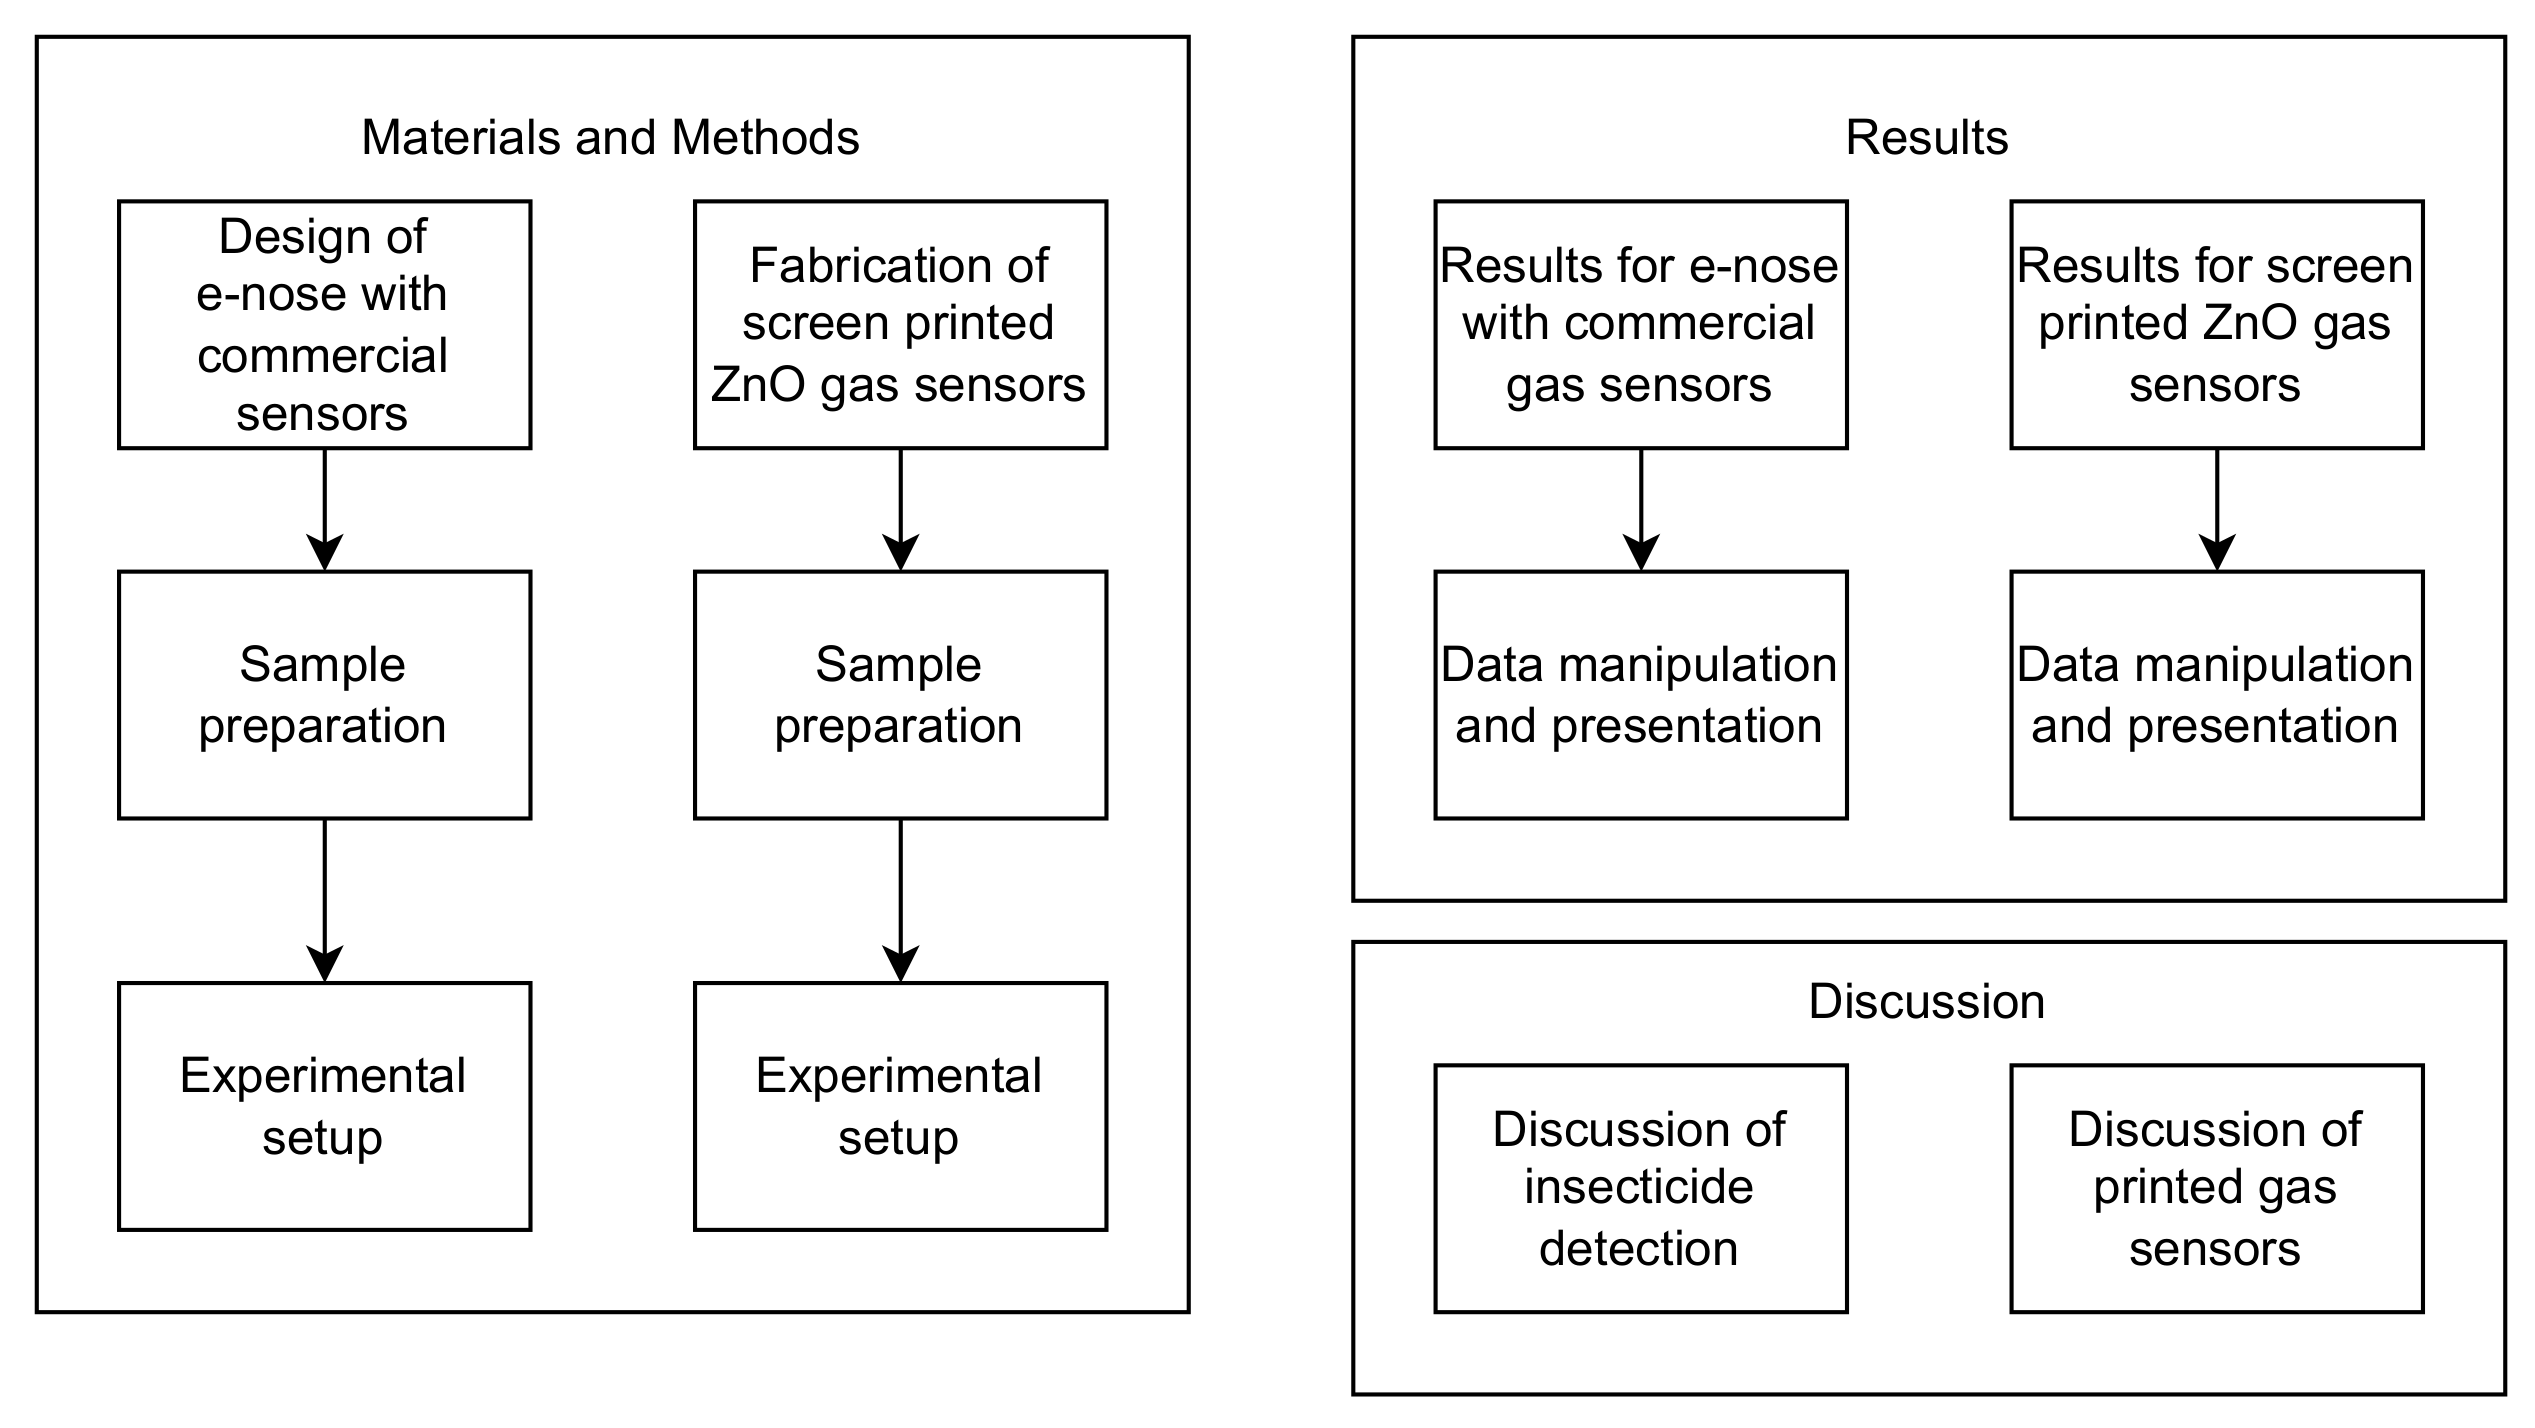
Figure 1. Overall organisational structure of the paper.
Agriculture 13 01483 g001
Figure 2. E-nose with array of commercial gas sensors system diagram.
Agriculture 13 01483 g002
Figure 3. Drawing of the sample holder design.
Agriculture 13 01483 g003
Figure 4. The response of a Bosch BME680 gas sensor to the out-gassing of 3D printed components. (a) Sensor response to 3D printed sample immediately after exposure to Taktic gases. (b) Sensor response to 3D printed sample 12 h after exposure to Taktic gases.
Agriculture 13 01483 g004
Figure 5. Images of the designed e-nose with commercial gas sensors from below (a) and above (b). (a) Array of commercial gas sensors in the e-nose viewed from below, showing the e-nose internal wiring. (b) Array of commercial sensors in the e-nose viewed from above, showing the e-nose sensing chamber.
Agriculture 13 01483 g005
Figure 6. Samples of distilled water (left) and farm water (right).
Agriculture 13 01483 g006
Figure 7. The e-nose with commercial gas sensors while measuring a sample.
Agriculture 13 01483 g007
Figure 8. Screen for printing of the ZnO sensors.
Agriculture 13 01483 g008
Figure 9. Auto-sintering of a screen printed ZnO gas sensor captured with a thermal camera (a) and a conventional camera (b).
Agriculture 13 01483 g009
Figure 10. Drawing of the sensor test chamber for the screen printed ZnO gas sensors.
Agriculture 13 01483 g010
Figure 11. Experimental setup for ZnO gas sensors.
Agriculture 13 01483 g011
Figure 12. Commercial sensor responses to target samples over time, normalised to the mean sensor output voltages for air. After a sample is introduced, it is measured for 100 s, with a purging time of 100 s between samples.
Agriculture 13 01483 g012
Figure 13. PCA results for the e-nose with commercial gas sensors with farm water and varying levels of Taktic insecticide.
Agriculture 13 01483 g013
Figure 14. Training accuracy on a naive Bayes classifier in the e-nose with commercial gas sensors for samples of air, distilled water, and different concentrations of Taktic in farm water.
Agriculture 13 01483 g014
Figure 15. ZnO-coated IDEs with 200 μ m lines and spaces. An uncoated (a) IDE is compared to IDEs coated with the 0.5 M ZnO sol-gel solution (b), 1.5 M ZnO sol-gel solution (c) and an IDE coated with an off-the-shelf ZnO nanoparticle ink (d).
Agriculture 13 01483 g015
Figure 16. The edge of a single IDE line coated with ZnO. An uncoated IDE line (a) is compared to IDEs coated with the 0.5 M ZnO sol-gel solution (b), 1.5 M ZnO sol-gel solution (c) and an IDE coated with an off-the-shelf ZnO nanoparticle ink (d).
Agriculture 13 01483 g016
Figure 17. SEM image of commercial ZnO nanoparticles (a) compared to SEM image of sol-gel ZnO nanoparticles (b), as adapted from [58].
Agriculture 13 01483 g017
Figure 18. Response of screen-printed ZnO nanoparticle ink gas sensor to pure Taktic insecticide.
Agriculture 13 01483 g018
Figure 19. Screen-printed commercial ZnO gas sensor exposed to air and UV light over time.
Agriculture 13 01483 g019
Figure 20. Screen-printed commercial ZnO gas sensor exposed to the odour of water and UV light over time.
Agriculture 13 01483 g020
Figure 21. Screen-printed commercial ZnO gas sensor exposed to the odour of Taktic in water and UV light over time.
Agriculture 13 01483 g021
Figure 22. Temperature and relative humidity in UV nail studio over time.
Agriculture 13 01483 g022
Figure 23. Screen-printed gas sensor with commercial ZnO nanoparticles exposed to air, the odour of water, and 2000ppm Taktic under lower UV radiation intensity from the Rapidcure nail studio (a) and higher (b) UV radiation intensity from the SUNR9 nail studio.
Agriculture 13 01483 g023
Figure 24. Comparison of UV light sources with device with lower UV radiation intensity from the Rapidcure nail studio (a) and higher UV radiation intensity SUNR9 nail studio (b).
Agriculture 13 01483 g024
Figure 25. Response of the screen-printed 0.5 M sol-gel ZnO gas sensor.
Agriculture 13 01483 g025
Figure 26. Response of screen-printed 1.5 M sol-gel ZnO gas sensor.
Agriculture 13 01483 g026
Figure 27. Response of screen-printed off-the-shelf ZnO nanoparticle ink gas sensor.
Agriculture 13 01483 g027
Figure 28. Box plot of normalised resistance values for ZnO gas sensors.
Agriculture 13 01483 g028
Table 1. Sample generation for the experiment.
% of Recommended Concentrationppm Taktic in Farm WaterTaktic in 10 mL Water ( μ L)
000
255005
50100010
100200020
200400040
Table 2. Maximum and minimum resistance for screen printed gas sensors.
Measurement 1
Resistance (k)
Measurement 2
Resistance (k)
Measurement 3
Resistance (k)
Average
Resistance (k)
Variation %
0.5 MResistance for Air66.6657.81351.23358.5726.35
sol-gel ZnOResistance for Taktic42.2537.4534.0437.9121.66
1.5 MResistance for Air223.97195.36161.81193.7132.09
sol-gel ZnOResistance for Taktic128.8109.6394.46110.9630.95
CommercialResistance for Air457.47457.88441.4452.253.64
ZnOResistance for Taktic229.24222.2217.26222.95.37
Table 3. Recovery and measurement times for screen-printed gas sensors.
Measurement 1Measurement 2Measurement 3AverageVariation %
0.5 MRecovery time (min)5.255.676.375.7619.43
sol-gel ZnOMeasurement time (min)4.784.354.824.6510.11
1.5 MRecovery time (min)6.985.936.56.4716.23
sol-gel ZnOMeasurement time (min)3.74.283.933.9714.61
CommercialRecovery time (min)7.487.458.77.8815.87
ZnOMeasurement time (min)3.63.653.773.674.63
Table 4. Distribution of normalised resistance values for ZnO gas sensors.
0.5 M Sol-Gel1.5 M Sol-GelOff-the-Shelf
AirWaterTakticAirWaterTakticAirWaterTaktic
Standard Deviation0.00340.00370.00310.00260.00340.00620.00340.00130.0061
Average1.01.11571.15901.01.10951.13271.01.15481.2261
Minimum0.99571.11101.15420.99691.10531.12510.99551.15231.2174
Maximum1.00581.12471.16571.00931.12081.15421.01101.15791.2463
Disclaimer/Publisher’s Note: The statements, opinions and data contained in all publications are solely those of the individual author(s) and contributor(s) and not of MDPI and/or the editor(s). MDPI and/or the editor(s) disclaim responsibility for any injury to people or property resulting from any ideas, methods, instructions or products referred to in the content.