Abstract
Currently, optical imaging techniques are extensively employed to automatically sort agricultural products based on various quality parameters such as size, shape, color, ripeness, sugar content, and acidity. This methodological review article examined different machine vision techniques, with a specific focus on exploring the potential of fluorescence imaging for non-destructive assessment of agricultural product quality attributes. The article discussed the concepts and methodology of fluorescence, providing a comprehensive understanding of fluorescence spectroscopy and offering a logical approach to determine the optimal wavelength for constructing an optimized fluorescence imaging system. Furthermore, the article showcased the application of fluorescence imaging in detecting peel defects in a diverse range of citrus as an example of this imaging modality. Additionally, the article outlined potential areas for future investigation into fluorescence imaging applications for the quality assessment of agricultural products.
1. Introduction
Awareness about maintaining food safety has risen in the public’s mind, such that it is now of great concern. As a result, customers have become more discerning about the quality of the food they consume and more demanding of “just in time” delivery. Therefore, to ensure the reputation of a supplier’s brand and the supply of quality products to the consumer, agricultural products are now being automatically graded and sorted in commercial and cooperative facilities of many countries using a machine vision system with image processing capabilities. This system can inspect products according to different parameters such as size, shape, color, weight, ripeness, presence of defects, and disease [1,2,3]. Machine vision systems in the packing lines perform repetitive tasks quicker, more accurately, and with greater consistency over time than humans, reduce the labor associated with grading, and maintain the reputation of supplier brand names, enhancing the supply of high-quality food to the market. Energy, labor, and materials costs are reduced, and packing is continuously performed 24 h a day, ultimately increasing the productivity of the packing house [1,4,5]. Research on machine vision application has become more and more common place in postharvest product quality evaluation and safety control, field robotic guidance, automated harvesting, and packing and wrapping [1,6,7].
Optical imaging techniques, in particular machine vision systems, have been widely utilized in the design of non-destructive biological product inspection equipment. Considering the recent importance of product quality detection, several techniques were studied using machine vision systems equipped with different monochrome, color, multispectral, and hyperspectral imaging sensors. Monochrome or grayscale imaging-based machine vision systems are used for the detection of postharvest quality of fruits [8,9,10,11] and vegetables [12], and examining meat quality [13,14,15,16,17]. The application in color imaging, i.e., the composition of fundamental color components RGB for the detection and grading of agricultural product quality, found vast and extensive applications [18,19,20,21,22,23,24,25], and researchers mostly used this means of imaging for the image classification process [4].
Spectral imaging is defined as a combination of imaging and spectroscopy, where a complete spectrum is collected at every location of an image plane. This powerful technique is known as multispectral (i.e., number of bands) or hyperspectral (i.e., much narrower bands: 10~20 nm) imaging [26]. Nowadays, there are many applications in the fields of agriculture, biomedical, ecology, oil and gas, oceanography, and atmospheric studies where multispectral [27,28,29,30,31] and hyperspectral [16,17,32,33,34,35] sensing techniques are being widely used. Hyperspectral imaging technology is used to acquire both spatial and spectral information on an object over the ultraviolet (UV), visible (VIS), and near-infrared (NIR) spectral regions at the same time. Due to the limitations of regular machine vision and spectroscopic techniques, this technology attracted the interest of researchers as a powerful tool used in a variety of scientific areas, including agriculture, pharmaceutical, and material science [32,34,36]. The study and research work on the application of hyperspectral imaging in reflectance mode has become more and more popular recently in food quality and safety control, such as the detection of defects [32,37,38,39,40,41], identification of contaminations [32,42,43], and quantification of meat ingredients [44,45].
Alternatively, apart from categorizing machine vision systems based on the electromagnetic wavelength they operate on, we can also utilize imaging systems that employ different modes or principles of measurement. While reflectance is the most commonly used in machine vision, another principle called fluorescence can be employed. Fluorescence imaging is an optical imaging methodology that is widely accepted and has been proven to be one of the most powerful techniques used in a variety of scientific areas, including environmental, industrial, and biotechnology applications. In particular, fluorescence imaging emerged as a promising adjunctive nondestructive technique for postharvest quality research for agricultural and food products and has been demonstrated to be a very useful technique for building generic inspection systems that can meet the speed requirements of commercial production lines [46,47]. Since fluorescence imaging can provide spatial information about fluorescence emission from a product item, it may offer a new opportunity for assessing the postharvest quality of horticultural products [48]. However, the application of fluorescence imaging to this date has not been fully explored to assess food quality and safety.
Recent research involved fluorescence imaging for measuring the quality and safety of food and agricultural products. A study was conducted to identify the optimum wavelengths for fluorescence excitation and the resulting fluorescence wavelengths in the range of 300–700 nm with citrus peels, which was concerned with the detection of surface defects of citrus fruits [46]. The physical causes for the fluorescent signatures that caused the citrus fruits to be rejected by the commercial packing house, even though their external appearance was fresh or normal to the naked eye under visible light, were examined. The study showed that UV-induced fluorescence imaging could detect unseen injuries or defects in undamaged-appearing citrus fruits and cull them from the packing line [49]. UV-induced fluorescence imaging could also reveal different image features that could not be seen in reflectance-based imaging, including color and texture. Both techniques also could be combined to improve the accuracy of prediction or classification [50,51]. Hyperspectral fluorescence imaging techniques were used to detect early bruises on pears [52], inspect fungal infection of stored apples [53], and measure laser-induced fluorescence scattering to assess the postharvest quality of apples [48]. To measure the freshness of rice quickly and conveniently, a fluorescence imaging method with ultraviolet (UV) excitation was designed and developed [54]. The feasibility of using light-emitting-diode (LED)-induced fluorescence imaging was investigated for rapid inspection of common organic poultry residues on poultry processing (i.e., chicken fat, blood, and feces) and stainless-steel equipment surfaces [55]. A recent study suggested a sanitation monitoring and management system using fluorescence imaging techniques to detect fruit residues on the surface of food processing equipment [56].
In the remainder of the review paper, the fundamental aspects underlying fluorescence will be described to further understanding of this type of imaging, primarily to determine the best wavelength for designing and constructing an optimized fluorescence imaging system. Following this, examples of its use in the evaluation of citrus are provided. It is hoped that these examples will provide methodologies that would be pertinent for both citrus and other biological products. Finally, an overview of areas of future investigation of fluorescence imaging applications for quality assessment of agricultural products is given. The overall goal of this review is to provide a logical methodology that is commonly used to apply fluorescence imaging for the quality assessment of agricultural products. This information will be very useful for researchers, scientists, and commercial packing houses in understanding, designing, constructing, and demonstrating an optimized fluorescence imaging system.
2. Fluorescence Concepts and Methodology
Fluorescence is a very useful property of some chemical substances and it is increasingly used in biosciences. Fluorescence is the emission of light by a substance that has absorbed light or other electromagnetic radiation. It is the molecular absorption of light energy at one wavelength and its nearly instantaneous re-emission at a longer wavelength or lower frequency. Some molecules fluoresce naturally, and others can be modified to make fluorescent compounds.
Fluorescence occurs when a fluorophore (fluorescent molecule, atom, or nanostructure) relaxes to its ground state after absorbing a photon. Usually, the absorbed photon is in the UV range, and the emitted light is in the visible range, but this depends on the absorbance curve and Stokes’s shift of the particular fluorophore. Once a molecule has absorbed photon energy in its ground state, i.e., the statistically most common energy state for room-temperature chemical reactions, it will be excited to a higher singlet state and often to a higher vibrational level in the excited states. Since excited states are unstable, the molecule will lose its excess energy and return to its ground state via several routes. Figure 1, termed a Jablonski diagram [57], shows a few of these energy dissipation processes. Following the absorption of a photon, the molecule will relax to a lower energy level in various pathways. The most likely is the relaxation to the lowest vibrational energy level of the first excited singlet states, (e.g., Sn → S1), which is called internal conversion (IC). The molecule will finally return from the lowest excited energy state to the ground state, i.e., if the photon emission occurs between states of the same spin state (e.g., S1 → S0), this is termed fluorescence (line F). If it occurs between different spin states, i.e., from triplet state to the ground state (e.g., T1 → S0), the process is called phosphorescence (line P) [54,58].
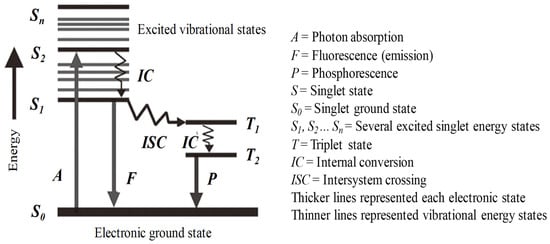
Figure 1.
Jablonski diagram showing energy distribution pathways in organic molecules. Adapted from [54,57].
Fluorescent compounds have two characteristic spectra in common: an excitation spectrum, i.e., the wavelength and amount of light absorbed, and an emission spectrum, i.e., the wavelength and amount of light emitted, as shown in Figure 2. These spectra are often referred to as a compound’s fluorescence signature or fingerprint. No two compounds have the same fluorescence signature. The fluorescence excitation spectrum of a single fluorophore species in dilute solution is usually identical to its absorption spectrum. The absorption spectrum can, therefore, be used as a surrogate for the excitation spectrum. Under the same conditions, the fluorescence emission spectrum is independent of the excitation wavelength due to rapid internal conversion from a higher initial excited state to the lowest vibrational energy level in the lowest (S1) excited state. For many common fluorophores, the vibrational energy level spacing is similar for both the ground and excited states, which results in a fluorescence spectrum that strongly mirrors the absorption spectrum. This is because the same transitions are the most favorable for both absorption and emission. However, in solution (where fluorophores are generally studied), the details of the vibrational structure are typically lost, and the emission spectrum is a broadband [59].
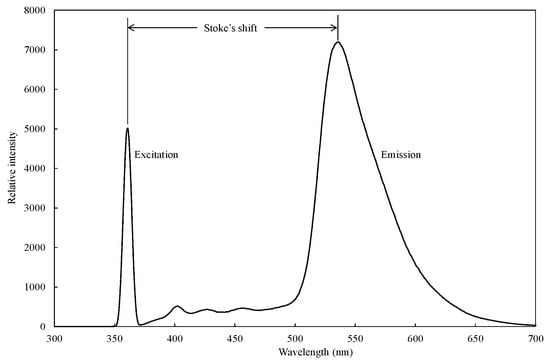
Figure 2.
A representative excitation in the UV region and emission in the visible region spectrum of citrus (variety: dekopon) peel extract measured by using a fluoro-spectrophotometer. Adapted from [60].
3. Fluorescence Basis and Imaging Configuration
Fluorescence may be excited by X-rays, UV, or visible radiation. The fluorescence’s spectral distribution may range from the UV to the infrared, and the emitted light is always at a longer wavelength than the absorbed light due to limited energy loss by the molecule before emission. The most striking examples of fluorescence occur when the absorbed radiation is in the UV region of the spectrum, thus invisible to the human eye, and then emitted in the visible region [61,62]. For instance, most citrus species accumulate substantial quantities of fluorescent substances, most of which are associated with peel oil [63,64,65,66]. When the oil glands or cells of citrus are damaged or ruptured, the peel oil is released and migrates closer to the peel surface, allowing it to fluoresce and become visible when excited by UV light. For example, tangeretin, a component of peel oil, is a polymethoxylated flavone that fluoresces under UV light and is the likely source of the yellow fluorescence visible from damaged or decayed oranges [67]. Another example is heptamethoxy flavone, one of the major fluorescent substances in rotten citrus fruit that exhibits greenish fluorescence under UV excitation [68]. Except in rare instances, however, fluorescence from intact or unruptured cells is not observed. The application of fluorescence to detect surface defects, such as rotten, damaged, decayed, or injured parts, in a wide variety of citrus is, therefore, made feasible by the presence of these fluorescent substances that are associated with the rupturing of surface cells.
Fluorescence is a spectrochemical phenomenon where the molecules of the analyte (component) are excited by irradiation at a certain wavelength and emit radiation of a different wavelength, usually at a longer wavelength. The excitation and fluorescence spectra represent the relative photon intensity per wavelength interval. The excitation spectrum is a plot of the luminescence versus excitation wavelength with a constant emission wavelength. It is used to determine the best excitation wavelength for analysis. A plot of the luminescence signal versus emission wavelength with a constant excitation wavelength is denoted an emission spectrum. Fluorescence spectral data are generally presented as emission spectra [69]. The measurement of optimal excitation wavelength for the best fluorescent signature of sixteen common and leading varieties of Japanese citrus was studied by [46] using a fluoro-spectrophotometer (F-4500, Hitachi, Ltd., Tokyo, Japan). The study found that, except for one variety, fifteen varieties had general or good trends of fluorescence spectra in the UV and VIS regions with high, medium, and weak level of fluorescent signatures. The performance of a fluorescence image processing-based inspection system is highly dependent on the accurate selection of hardware specifically configured to the fluorescent characteristics such as lighting sources, lighting arrangements and lighting geometry, and camera resolutions [1]. Figure 3 shows energy flow from a lighting device to a TV camera [70]. The image obtained has a final energy of ERTLS. By selecting suitable “E”, “T”, “L”, and “S”, but not “R” reflectance, since it is an optical property of the target object, we can manipulate the final energy of the image. When a color camera is used, only “E” can be manipulated, because the optical filters are located on the color image sensor. Since “E” is the most important parameter, the spectral energy of light, lighting method, number of lighting devices and other factors should be carefully optimized. Moreover, the degree of peel defect fluorescence emission differs by variety, the variation between varieties can be classified as none, slight, medium, strong, and intense. Hence, it is important to discriminate selectively between the fluorescence emission wavelengths and the excitation wavelengths for the different varieties in order to identify defects in as many varieties as possible using the same system.
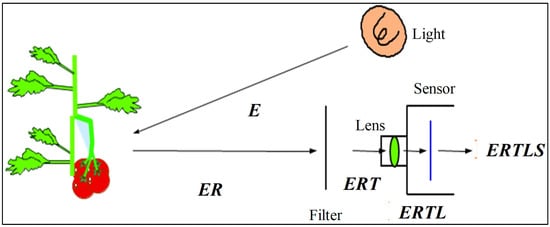
Figure 3.
Energy flow from lighting device to TV camera, where E: Energy of light source, R: Reflectance of object, T: Transmittance of filter, L: Transmittance of lens, S: Sensitivity of image sensor. Adapted from [70].
Therefore, the proper selection of a lighting system and categorization of different citrus varieties based on fluorescence emission characteristics is the key and critical part for optimizing a fluorescence imaging technique capable of being applied to a wide variety of citrus. The fluorescence and excitation spectra information presented in [46] enables the selection of the optimum hardware configuration for designing the image acquisition device. Thus, in order to effectively detect the fluorescent components associated with peel defects on the surface of the citrus fruits, a fluorescence imaging-based machine vision system with a combination of a normal color camera and an incident light source emitting rays in between 330 and 380 nm is needed. With the information observed from spectral study results of the selected citrus varieties, excitation wavelengths of the greenish fluorescence group are around 365 nm [46]. To acquire the fluorescence images of these groups of citrus, 365 nm UV LED excitation source could be used for illuminations. In order to observe the excitation illumination of bluish group citrus, 320~340 nm is required, or more appropriately at 330 nm. Since greenish and bluish fluorescence are emitted from peel extracts, it is possible that a color TV camera used for color imaging can also be used for fluorescence imaging.
4. Fluorescence Imaging Application—An Example
The fluorescence images of intact greenish group citrus were acquired using an image acquisition system composed of three sets of 365 nm UV LEDs (Figure 4) to compare with the spectral information results. The VGA format CCD camera (Sony ICX424AQ, Sony Corporation, Tokyo, Japan) of 8-bit gray levels fitted with a C mount lens of 6 mm focal length was placed 150 mm above from the fruit surface. To examine fluorescence oil cells, 10 mm × 10 mm area on the fruit skins was intentionally injured. Finally, after adjusted camera operation parameters such as iris: 1.4, shutter speed: 1/60 s, gain: 12 db, and gamma correction: 0.6, the target objects were oriented manually towards the camera and the image was captured.
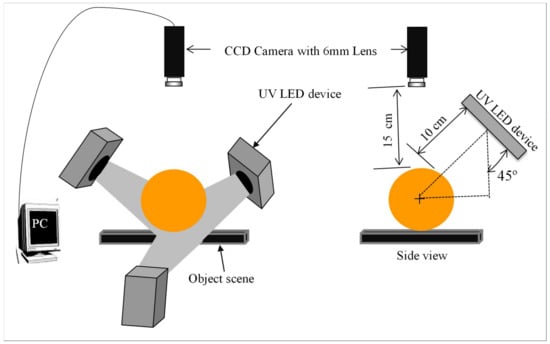
Figure 4.
Layout of the 365 nm UV–LEDs image acquisition system. Adapted from [60].
The observed fluorescence grade of the citrus is shown in Figure 5, and it is apparent that the extent of peel defect UV-fluorescence highlighted by the white square was found to vary substantially. Peel defects for amanatsu, buntan, and dekopon varieties appeared as strong green fluorescence (top row of Figure 5); hassaku, iyokan, kiyomi, navel, sanpoukan, sweet springs, and unshu fluoresced moderately (first to second row of Figure 5), while harumi and setoka fluoresced only slightly (second row of Figure 5). These fluorescence images of twelve citrus varieties are in good agreement with spectral information described in [46]. In each image, the fluorescent substance on the surface of the injury part of fruit was caught as greenish color pixels highlighted by the white square. The purple color pixels were the halation of light reflection from the glossy surface (cuticular layers). The machine vision test results revealed that the fluorescence excitation information to select the wavelength of the incident light for inspecting citrus peel defects worked properly. When such a system was trialed, greenish type fluorescence was observed from injured areas on the surface of the peel; consistent with the in vitro fluorescence spectra results obtained.
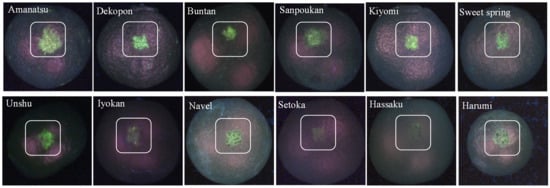
Figure 5.
Example of fluorescence images of the mechanically injured citrus peel captured by 365 nm UV-LEDs. Adapted from [60].
5. Comparisons of Different Imaging Options for Quality Assessment
Non-destructive inspection equipment for agricultural products postharvest quality assessment has extensively employed different optical imaging techniques, including monochrome, color, and spectral. In cases where color is not a significant factor, monochromatic imaging can be utilized, requiring less data storage. In most cases, color imaging is highly efficient and powerful in extracting visible information of products such as color, bruise, shape, size, etc. Color imaging, which involves analyzing various color components (e.g., RGB, HSI, CIELab) to detect and grade agricultural product quality, has widespread and extensive applications in the commercial packing house [71]. The main drawback of color imaging is that it is limited to three color bands, providing limited multi-constituent information and often missing the most relevant surface features completely [72,73], as shown in Figure 6a,c. Thus, spectral imaging was used to overcome the limitation and is used extensively for the quality analysis of agricultural products. However, spectral imaging has some drawbacks, such as requiring expensive hardware for image acquisition, large data size for the processing step, and a time-consuming algorithm for image post-processing [74,75]. On the other hand, fluorescence imaging technology has various advantages, such as being relatively cheap, simple to use, rapid non-destructive measurements, creating high contrast, etc. [49,50,51]. For example, the acquired color images (Figure 6a,c) did not show any presence of surface damage. In contrast, the damage was readily visible in fluorescence imaging with a clear contrast between damaged and undamaged surfaces (Figure 6b,d).
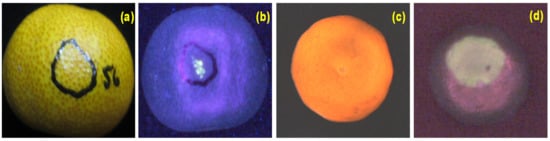
Figure 6.
Example of color (a,c) and fluorescence images (b,d) of the damaged citrus peel. Adapted from [49,60].
6. Areas for Future Investigation
The fluorescence principle-based machine vision has been used for various kinds of applications in the last couple of decades. There are numerous advantages of fluorescence machine vision, especially for some cases that could not be solved using normal color imaging. The implementation of the fluorescence machine vision system varies from defect detection, antioxidant and freshness evaluation, to authentication of bioproducts [76,77,78]. Cases which use the exposure of the fluorescence substances on the surface of the object or the presence of the fluorophore on the surface of an object are commonly solved with fluorescence machine vision [79,80]. On the other hand, there are also uses related to the structure of the objects, for example, the existence of a thin cuticle layer on citrus, green bell pepper, tomato, and tea leaves, or a bran layer of rice, which could also affect the results of the fluorescence image [81,82,83]. There are still a lot of bioproducts containing fluorophore which have not been investigated. The structure of the bioproducts also varies, which will gives different results of light–object interaction including fluorescence. The investigation of the fluorescence characteristics of various bioproducts and the making of a database related to this will be useful for the development of proper fluorescence-based machine vision design. For instance, synthesizing an extensive database of fluorescence properties for the unique fresh produce varieties growing worldwide will enable the development of rapid, simple, and uniform fluorescence imaging systems for the online screening of fresh produce quality. Such a database will promote and enhance fluorescence characteristics research, particularly comparative studies and construction of customized systems and strengthen networking among fresh produce researchers, producers, policy makers, grading facilities, company personnel, and practitioners globally by sharing information in the future agricultural cloud technologies. Most of the applications mentioned before are using autofluorescence of bioproducts. On the other hand, fluorescence dye development for bio-molecule markers may also be necessary [84,85].
In terms of the instrumentation devices, lower-cost devices are necessary to implement the fluorescence techniques widely. More sensitive sensors are required, especially in the case of fluorescence lifetime imaging to avoid photodamage due to high-intensity ultraviolet light [86]. Among various sensor materials, the sensor based on the quantum principle has more potential to be improved especially for detection in the ultraviolet region [87,88]. For the light source, an ultraviolet range spectrum light source is often needed. UV LED has already replaced UV lamp for many applications, and it still could be improved in terms of intensity and efficiency [89]. In addition to the development of sensors and light sources, other optical devices such as high-quality filters (e.g., visible cut-band filter) and lenses also need to be improved. Multispectral fluorescence imaging techniques are another area of research that could be pursued in the future as an aid in the quality assessment of agricultural products [4].
Moreover, the X-ray fluorescence technique (XRFT) was recently used in food and agricultural research, such as evaluating food safety inspection, plant diseases, and Ca-related disorders in fruits and vegetables. More exhaustive work is needed to increase the application of XRFT widely and successfully [90,91] for quality evaluation of fruits and vegetables. Some other potential future investigations of fluorescence imaging applications for product quality assessment could be machine-learning-based fluorescence lifetime microscopy imaging [92], low-cost-smartphone-based fluorescence system [93], chlorophyll fluorescence imaging [94], and fluorescence spectroscopy [95].
In parallel to the hardware, the software is equally important for developing a generic machine vision system for the quality inspection of agricultural products. Recently, image processing coupled with machine learning algorithms (e.g., ANN, DNN, CNN) was successfully applied for food quality assessment and contamination detection [96,97]. The software aspect mainly includes image preprocessing, segmentation, feature extraction, and classification [71]. The image preprocessing involves color space transformation using the color space conversion relationships and noise reduction using smoothing, opening, closing, de-bridging, hole-filling, filtering, etc. Image segmentation is a process of pixel classification, one of the most difficult initial tasks in image processing. Though there is no unique standard approach to image segmentation, considerable care should be taken to select the proper segmentation method based on the source image characteristics, as the degree of segmentation accuracy affects the eventual success or failure of the overall image processing results [98,99]. The image segmentation algorithms are mainly categorized into three techniques namely: thresholding, pattern recognition, and deformable models [100]. Thresholding is one of the most popular approaches for image segmentation, and thresholding segmentation aims to search for an optimum grey level threshold value for distinguishing target objects and image background based on their grey value distribution patterns. The Otsu global thresholding selection method (proposed by Scholar Nobuyuki Otsu in 1979) is usually applied because it is a simple and effective idea [101]. CNN-based, state-of-the-art semantic segmentation approach, such as U-Net, FPN, LinkNet, etc., was successfully deployed for image segmentation operation [97,102]. After segmenting operation, target objects’ various features (e.g., color, texture, morphological) are calculated for image perception, interpretation, and classification. Object classification is an essential feature for evaluating agricultural product quality. Various popular machine learning algorithms, such as SVM, KNN, ANN, DNN, CNN, decision tree, and random decision forest, were applied for object classification [71].
In today’s business world, execution speed is important. Setting up defect sorting lines optimized for individual varieties would entail high capital expenditure and would lack the flexibility to rapidly switch a sorting line from one variety to another. An alternative would be to develop a generic system that can handle a wide range of varieties on the limited floor space of the packing house, thus maximizing utilization of facilities. This is in line with one of the current challenges for companies in the fresh produce industry of how to achieve more flexibility in the line configurations so that the sorting line operations are not a critical path to new product introductions. Considering the need for flexibility in the packing line, as well as for economic viability, it is important to develop a detection system configuration that is capable of detecting surface defects of a wide variety of products with minimal or quick reconfiguration of hardware and software. It may also be able to sort out not only product damaged by biotic factors, but also another product that is apparently undamaged but has in fact sustained damage caused by abiotic reasons.
7. Conclusions
The performance of a fluorescence imaging system for quality assessment is highly dependent on the accurate selection of hardware specifically configured to the fluorescent characteristics of agricultural products, such as the spectral energy of light, lighting arrangement, and number of lighting devices, camera resolutions, etc. For instance, the appropriate fluorescence excitation wavelength for optimal fluorescence emission and the resulting peak fluorescence wavelength was observed in the range 330–380 nm and 400–550 nm, respectively, for citrus peels collected from sixteen varieties. It is apparent that to effectively detect the fluorescent components associated with citrus peel defects, a fluorescence imaging system with a combination of a UV light source emitting rays between 330 and 380 nm and a standard RGB camera is needed. We envision that this methodology for developing a generic and unique system can also be applied to other products with proper image acquisition adjustment based on the spectra information.
Author Contributions
Conceptualization, A.M., N.K. and Y.O.; methodology, A.M., N.K. and Y.O.; validation, A.M.; investigation, A.M.; resources, A.M. and D.F.A.R.; data curation, A.M.; writing—original draft preparation, A.M.; writing—review and editing, D.F.A.R., D.O. and A.M.; supervision, N.K., Y.O. and D.O. All authors have read and agreed to the published version of the manuscript.
Funding
This research received no external funding.
Institutional Review Board Statement
Not applicable.
Data Availability Statement
Not applicable.
Conflicts of Interest
The authors declare no conflict of interest.
References
- Chen, Y.-R.; Chao, K.; Kim, M.S. Machine Vision Technology for Agricultural Applications. Comput. Electron. Agric. 2002, 36, 173–191. [Google Scholar] [CrossRef]
- Blasco, J.; Aleixos, N.; Moltó, E. Machine Vision System for Automatic Quality Grading of Fruit. Biosyst. Eng. 2003, 85, 415–423. [Google Scholar] [CrossRef]
- Momin, M.A.; Rahman, M.T.; Sultana, M.S.; Igathinathane, C.; Ziauddin, A.T.M.; Grift, T.E. Geometry-Based Mass Grading of Mango Fruits Using Image Processing. Inf. Process. Agric. 2017, 4, 150–160. [Google Scholar] [CrossRef]
- Li, J.; Rao, X.; Ying, Y. Detection of Common Defects on Oranges Using Hyperspectral Reflectance Imaging. Comput. Electron. Agric. 2011, 78, 38–48. [Google Scholar] [CrossRef]
- Prabhakar, C.J.; Mohana, S.H. Computer Vision Based Technique for Surface Defect Detection of Apples. In Research Developments in Computer Vision and Image Processing: Methodologies and Applications; Srivastava, R., Singh, S.K., Shukla, K.K., Eds.; IGI Global: Hershey, PA, USA, 2014; pp. 111–121. ISBN 9781466645585. [Google Scholar]
- Kondo, N.; Yamamoto, K.; Yata, K.; Kurita, M. A Machine Vision for Tomato Cluster Harvesting Robot. In Proceedings of the ASABE Annual International Meeting Sponsored by ASABE, Providence, RI, USA, 29 June–2 July 2008. Paper Number: 084044. [Google Scholar]
- Xue, J.; Zhang, L.; Grift, T.E. Variable Field-of-View Machine Vision Based Row Guidance of an Agricultural Robot. Comput. Electron. Agric. 2012, 84, 85–91. [Google Scholar] [CrossRef]
- Davenel, A.; Guizard, C.H.; Labarre, T.; Sevila, F. Automatic Detection of Surface Defects on Fruit by Using a Vision System. J. Agric. Eng. Res. 1988, 41, 1–9. [Google Scholar] [CrossRef]
- Rehkugler, G.E.; Throopmann, J.A. Image Processing Algorithm for Apple Defect Detection. Trans. ASAE 1989, 32, 267–272. [Google Scholar] [CrossRef]
- Singh, N.; Delwiche, M.J. Machine Vision Algorithms for Defect Sorting Stonefruit. Trans. ASAE 1994, 37, 1989–1997. [Google Scholar] [CrossRef]
- Throop, J.A.; Aneshansley, D.J.; Upchurch, B.L. An Image Processing Algorithm to Find New and Old Bruises. Appl. Eng. Agric. 1995, 11, 751–757. [Google Scholar] [CrossRef]
- Rigney, M.P.; Brusewitz, G.H.; Kranzler, G.A. Asparagus Defect Inspection with Machine Vision. Trans. ASAE 1992, 35, 1873–1878. [Google Scholar] [CrossRef]
- McDonald, T.P.; Chen, Y.R. A Geometric Model of Marbling in Beef Longissimus Dorsi. Trans. ASAE 1992, 35, 1057–1062. [Google Scholar] [CrossRef]
- McDonald, T.P.; Chen, Y.R. Visual Characterization of Marbling in Beef Ribeyes and Its Relationship to Taste R\Rameters. Trans. ASAE 1990, 34, 2499–2504. [Google Scholar] [CrossRef]
- Hwang, H.; Park, B.; Nguyen, M.; Chen, Y.-R. Hybrid Image Processing for Robust Extraction of Lean Tissue on Beef Cut Surfaces. Comput. Electron. Agric. 1997, 17, 281–294. [Google Scholar] [CrossRef]
- Feng, L.; Zhu, S.; Liu, F.; He, Y.; Bao, Y.; Zhang, C. Hyperspectral Imaging for Seed Quality and Safety Inspection: A Review. Plant Methods 2019, 15, 91. [Google Scholar] [CrossRef] [PubMed]
- Chen, H.; Qiao, H.; Feng, Q.; Xu, L.; Lin, Q.; Cai, K. Rapid Detection of Pomelo Fruit Quality Using Near-Infrared Hyperspectral Imaging Combined with Chemometric Methods. Front. Bioeng. Biotechnol. 2021, 8, 616943. [Google Scholar] [CrossRef]
- Heinemann, P.H.; Varghese, Z.A.; Morrow, C.T.; Sommer, H.J., III; Crassweller, R.M. Machine Vision Inspection of ‘Golden Delicious’ Apples. Appl. Eng. Agric. 1995, 11, 901–906. [Google Scholar] [CrossRef]
- Leemans, V.; Magein, H.; Destain, M.-F. Defect Segmentation on ‘Jonagold’ Apples Using Colour Vision and a Bayesian Classification Method. Comput. Electron. Agric. 1999, 23, 43–53. [Google Scholar] [CrossRef]
- Mendoza, F.; Aguilera, J.M. Application of Image Analysis for Classification of Ripening Bananas. J. Food Sci. 2004, 69, E471–E477. [Google Scholar] [CrossRef]
- Lee, D.J.; Archibald, J.K. Color Image Processing for Date Quality Evaluation. In Proceedings of the Intelligent Robots and Computer Vision XXVII: Algorithms and Techniques, San Jose, CA, USA, 18–19 January 2010; Casasent, D.P., Hall, E.L., Röning, J., Eds.; SPIE: Bellingham, WA, USA, 2010; Volume 7539, p. 75390V. [Google Scholar]
- Bejo, S.K.; Kamaruddin, S. Determination of Chokanan Mango Sweetness (Mangifera Indica) Using Non-Destructive Image Processing Technique. Aust. J. Crop Sci. 2014, 8, 475–480. [Google Scholar]
- Momin, M.A.; Yamamoto, K.; Miyamoto, M.; Kondo, N.; Grift, T. Machine Vision Based Soybean Quality Evaluation. Comput. Electron. Agric. 2017, 140, 452–460. [Google Scholar] [CrossRef]
- Ali, M.; Hashim, N.; Khairunniza-Bejo, S.; Shamsudin, R.; Wan Sembak, W.N.F.H. RGB Imaging System for Monitoring Quality Changes of Seedless Watermelon during Storage. Acta Hortic. 2017, 1152, 361–366. [Google Scholar]
- Rady, A.M.; Adedeji, A.; Watson, N.J. Feasibility of Utilizing Color Imaging and Machine Learning for Adulteration Detection in Minced Meat. J. Agric. Food Res. 2021, 6, 100251. [Google Scholar] [CrossRef]
- GIS Geography. Multispectral vs. Hyperspectral Imagery Explained. Available online: https://gisgeography.com/multispectral-vs-hyperspectral-imagery-explained/ (accessed on 20 November 2022).
- Park, B.; Chen, Y.R.; Nguyen, M. Multi-Spectral Image Analysis Using Neural Network Algorithm for Inspection of Poultry Carcasses. J. Agric. Eng. Res. 1998, 69, 351–363. [Google Scholar] [CrossRef]
- Aleixos, N.; Blasco, J.; Navarró, F.; Moltó, E. Multispectral Inspection of Citrus in Real-Time Using. Machine Vision. and Digital Signal Processors. Comput. Electron. Agric. 2002, 33, 121–137. [Google Scholar] [CrossRef]
- Blasco, J.; Aleixos, N.; Gómez, J.; Moltó, E. Citrus Sorting by Identification of the Most Common Defects Using Multispectral Computer Vision. J. Food Eng. 2007, 83, 384–393. [Google Scholar] [CrossRef]
- Blasco, J.; Aleixos, N.; Gómez-Sanchís, J.; Moltó, E. Recognition and Classification of External Skin Damage in Citrus Fruits Using Multispectral Data and Morphological Features. Biosyst. Eng. 2009, 103, 137–145. [Google Scholar] [CrossRef]
- Su, W.-H.; Sun, D.-W. Multispectral Imaging for Plant Food Quality Analysis and Visualization. Compr. Rev. Food Sci. Food Saf. 2018, 17, 220–239. [Google Scholar] [CrossRef]
- Kim, M.S.; Chen, Y.R.; Mehl, P.M. Hyperspectral Reflectance and Fluorescence Imaging System for Food Quality and Safety. Trans. ASAE 2001, 44, 721–729. [Google Scholar]
- Zavattini, G.; Vecchi, S.; Leahy, R.M.; Smith, D.J.; Cherry, S.R. A Hyperspectral Fluorescence Imaging System for Biological Applications. In Proceedings of the IEEE Nuclear Science Symposium. Conference Record (IEEE Cat. No.03CH37515), Portland, OR, USA, 19–25 October 2003; pp. 942–946. [Google Scholar]
- Huang, H.; Liu, L.; Ngadi, M.O. Recent Developments in Hyperspectral Imaging for Assessment of Food Quality and Safety. Sensors 2014, 14, 7248–7276. [Google Scholar] [CrossRef]
- Li, J.B.; Rao, X.Q.; Ying, Y.B. Advance on Application of Hyperspectral Imaging to Nondestructive Detection of Agricultural Products External Quality. Guang Pu Xue Yu Guang Pu Fen Xi 2011, 31, 2021–2026. [Google Scholar]
- Gowen, A.; O’donnell, C.; Taghizadeh, M.; Cullen, P.; Frias, J.; Downey, G. Hyperspectral Imaging Combined with Principal Component Analysis for Bruise Damage Detection on White Mushrooms (Agaricus Bisporus). J. Chemom. 2008, 22, 259–267. [Google Scholar] [CrossRef]
- Xing, J.; Bravo, C.; Jancsók, P.T.; Ramon, H.; de Baerdemaeker, J. Detecting Bruises on “Golden Delicious” Apples Using Hyperspectral Imaging with Multiple Wavebands. Biosyst. Eng. 2005, 90, 27–36. [Google Scholar] [CrossRef]
- Nagata, M.; Tallada, J.G.; Kobayashi, T. Bruise Detection Using NIR Hyperspectral Imaging for Strawberry (Fragaria x Ananassa Duch.). Environ. Control Biol. 2006, 44, 133–142. [Google Scholar] [CrossRef]
- Qin, J.; Burks, T.F.; Kim, M.S.; Chao, K.; Ritenour, M.A. Citrus Canker Detection Using Hyperspectral Reflectance Imaging and PCA-Based Image Classification Method. Sens. Instrum. Food Qual. Saf. 2008, 2, 168–177. [Google Scholar] [CrossRef]
- Gómez-Sanchis, J.; Gómez-Chova, L.; Aleixos, N.; Camps-Valls, G.; Montesinos-Herrero, C.; Moltó, E.; Blasco, J. Hyperspectral System for Early Detection of Rottenness Caused by Penicillium Digitatum in Mandarins. J. Food Eng. 2008, 89, 80–86. [Google Scholar] [CrossRef]
- López-García, F.; Andreu-García, G.; Blasco, J.; Aleixos, N.; Valiente, J.-M. Automatic Detection of Skin Defects in Citrus Fruits Using a Multivariate Image Analysis Approach. Comput. Electron. Agric. 2010, 71, 189–197. [Google Scholar] [CrossRef]
- Kim, I.; Kim, M.S.; Chen, Y.R.; Kong, S.G. Detection of Skin Tumors on Chicken Carcasses Using Hyperspectral Fluorescence Imaging. Trans. ASAE 2004, 47, 1785–1792. [Google Scholar] [CrossRef]
- Yao, H.; Hruska, Z.; Kincaid, R.; Brown, R.L.; Bhatnagar, D.; Cleveland, T.E. Detecting Maize Inoculated with Toxigenic and Atoxigenic Fungal Strains with Fluorescence Hyperspectral Imagery. Biosyst. Eng. 2013, 115, 125–135. [Google Scholar] [CrossRef]
- Qiao, J.; Ngadi, M.O.; Wang, N.; Gariépy, C.; Prasher, S.O. Pork Quality and Marbling Level Assessment Using a Hyperspectral Imaging System. J. Food Eng. 2007, 83, 10–16. [Google Scholar] [CrossRef]
- Barbin, D.F.; El Masry, G.; Sun, D.; Allen, P. Near-Infrared Hyperspectral Imaging for Grading and Classification of Pork. Meat Sci. 2012, 90, 259–268. [Google Scholar] [CrossRef]
- Momin, M.A.; Kondo, N.; Kuramoto, M.; Ogawa, Y.; Yamamoto, K.; Shiigi, T. Investigation of Excitation Wavelength for Fluorescence Emission of Citrus Peels Based on UV-VIS Spectra. Eng. Agric. Environ. Food 2012, 5, 126–132. [Google Scholar] [CrossRef]
- Chen, W.-T.; Kuo, Y.-F. Detecting Bran Residue Distribution on Rice Surface Using Fluorescence Imaging. In Proceedings of the An ASABE—CSBE/ASABE Joint Meeting Presentation, Montreal, QC, Canada, 13–16 July 2014; Paper Number 00860; Annual International Meeting Sponsored by ASABE. 1419. [Google Scholar]
- Noh, H.K.; Lu, R. Hyperspectral Laser-Induced Fluorescence Imaging for Assessing Apple Fruit Quality. Postharvest Biol. Technol. 2007, 43, 193–201. [Google Scholar] [CrossRef]
- Momin, M.A.; Kondo, N.; Ogawa, Y.; Ido, K.; Ninomiya, K. Patterns of Fluorescence Associated with Citrus Peel Defects. Eng. Agric. Environ. Food 2013, 6, 54–60. [Google Scholar] [CrossRef]
- Al Riza, D.F.; Rulin, C.; Tun, N.T.T.; Yi, P.P.L.; Thwe, A.A.; Myint, K.T.; Kondo, N. Mango (Mangifera Indica Cv. Sein Ta Lone) Ripeness Level Prediction Using Color and Textural Features of Combined Reflectance-Fluorescence Images. J. Agric. Food Res. 2023, 11, 100477. [Google Scholar] [CrossRef]
- Nie, S.; Al Riza, D.F.; Ogawa, Y.; Suzuki, T.; Kuramoto, M.; Miyata, N.; Kondo, N. Potential of a Double Lighting Imaging System for Characterization of “Hayward” Kiwifruit Harvest Indices. Postharvest Biol. Technol. 2020, 162, 111113. [Google Scholar] [CrossRef]
- Fu, X.; Wang, M. Detection of Early Bruises on Pears Using Fluorescence Hyperspectral Imaging Technique. Food Anal. Methods 2022, 15, 115–123. [Google Scholar] [CrossRef]
- Pieczywek, P.M.; Cybulska, J.; Szymańska-Chargot, M.; Siedliska, A.; Zdunek, A.; Nosalewicz, A.; Baranowski, P.; Kurenda, A. Early Detection of Fungal Infection of Stored Apple Fruit with Optical Sensors—Comparison of Biospeckle, Hyperspectral Imaging and Chlorophyll Fluorescence. Food Control 2018, 85, 327–338. [Google Scholar] [CrossRef]
- Hachiya, M.; Asanome, N.; Goto, T.; Noda, T. Fluorescence Imaging with UV-Excitation for Evaluating Freshness of Rice. Jpn. Agric. Res. Q. 2009, 43, 193–198. [Google Scholar] [CrossRef]
- Qin, J.; Chao, K.; Kim, M.S.; Kang, S.; Cho, B.-K.; Jun, W. Detection of Organic Residues on Poultry Processing Equipment Surfaces by LED-Induced Fluorescence Imaging. Appl. Eng. Agric. 2011, 27, 153–161. [Google Scholar] [CrossRef]
- Hwang, C.; Mo, C.; Seo, Y.; Lim, J.; Baek, I.; Kim, M.S. Development of Fluorescence Imaging Technique to Detect Fresh-Cut Food Organic Residue on Processing Equipment Surface. Appl. Sci. 2021, 11, 458. [Google Scholar] [CrossRef]
- Chasteen, T.G. Jablonski Diagram. Available online: https://www.shsu.edu/chm_tgc/chemilumdir/JABLONSKI.html (accessed on 1 July 2021).
- Zhu, C.; Palmer, G.M.; Breslin, T.M.; Harter, J.; Ramanujam, N. Diagnosis of Breast Cancer Using Fluorescence and Diffuse Reflectance Spectroscopy: A Monte-Carlo-Model-Based Approach. J. Biomed. Opt. 2008, 13, 034015. [Google Scholar] [CrossRef]
- Herman, B.; Lakowicz, J.R.; Murphy, D.B.; Fellers, T.J.; Davidson, M.W. Fluorescence Excitation and Emission Fundamentals. Available online: https://www.olympus-lifescience.com/en/microscope-resource/primer/techniques/confocal/fluoroexciteemit/ (accessed on 10 July 2022).
- Momin, M.A. Fluorescence Imaging for Defect Inspection of Citrus Fruits. Ph.D. Thesis, Kyoto University, Kyoto, Japan, 2013, unpublished. [Google Scholar]
- Goodwin, R.H. Fluorescent Substances in Plants. Annu. Rev. Plant Physiol. 1953, 4, 283–304. [Google Scholar] [CrossRef]
- Lakowicz, J.R. Principles of Fluorescence Spectroscopy, 3rd ed.; Springer: Baltimore, MD, USA, 2010. [Google Scholar]
- Latz, H.W.; Ernes, D.A. Selective Fluorescence Detection of Citrus Oil Components Separated by High-Performance Liquid Chromatography. J. Chromatogr. A 1978, 166, 189–199. [Google Scholar] [CrossRef]
- Uozumi, J.; Kawano, S.; Iwamoto, M.; Nishinari, K. Spectrophotometric System for the Quality Evaluation of Unevenly Colored Food. J. Food Sci. Technol.-Mysore 1987, 34, 163–170. [Google Scholar] [CrossRef]
- Castillo, J.; Benavente, O.; del Río, J.A. Naringin and Neohesperidin Levels during Development of Leaves, Flower Buds, and Fruits of Citrus Aurantium. Plant Physiol. 1992, 99, 67–73. [Google Scholar] [CrossRef]
- Benavente-Garcia, O.; Castillo, J.; del Rio, J. Changes in Neodiosmin Levels during the Development of Citrus Aurantium Leaves and Fruits. Postulation of a Neodiosmin Biosynthetic Pathway. J. Agric. Food Chem. 1993, 41, 1916–1919. [Google Scholar] [CrossRef]
- Swift, L.J. Thin-Layer Chromatographic-Spectrophotometric Analysis for Neutral Fraction Flavones in Orange Peel Juice. J. Agric. Food Chem. 1967, 15, 99–101. [Google Scholar] [CrossRef]
- Kondo, N.; Kuramoto, M.; Shimizu, H.; Ogawa, Y.; Kurita, M.; Nishizu, T.; Chong, V.K.; Yamamoto, K. Identification of Fluorescent Substance in Mandarin Orange Skin for Machine Vision System to Detect Rotten Citrus Fruits. Eng. Agric. Environ. Food 2009, 2, 54–59. [Google Scholar] [CrossRef]
- Ingle, J.D.; Crouch, S.R. Spectrochemical Analysis, 1st ed.; Prentice Hall: Hoboken, NJ, USA, 1988. [Google Scholar]
- Kondo, N.; Ting, K. Robotics for Bio Production Systems; Kondo, N., Ting, K., Eds.; Amer Society of Agricultural and Biological Engineers: St. Joseph, MI, USA, 1998. [Google Scholar]
- Bhargava, A.; Bansal, A. Fruits and Vegetables Quality Evaluation Using Computer Vision: A Review. J. King Saud Univ. Comput. Inf. Sci. 2021, 33, 243–257. [Google Scholar] [CrossRef]
- Specim. Hyperspectral Technology vs. RGB. Available online: https://www.specim.com/hyperspectral-technology-vs-rgb/ (accessed on 27 May 2023).
- Gowen, A.A.; Burger, J.; O’Callaghan, D.; O’Donnell, C.P. Potential Applications of Hyperspectral Imaging for Quality Control in Dairy Foods. Bornimer Agrartech. Berichte 2009, 65–81. Available online: http://www2.atb-potsdam.de/CIGR-ImageAnalysis/images/07_125_%20Gowen.pdf (accessed on 20 May 2023).
- Di Paolo Emilio, M. Hyperspectral Imaging for Agriculture. Available online: https://www.eetimes.eu/hyperspectral-imaging-for-agriculture/ (accessed on 26 May 2023).
- Unispectral. Breaking Hyperspectral Barriers. Available online: https://www.imveurope.com/viewpoint/breaking-hyperspectral-barriers (accessed on 25 May 2023).
- Omwange, K.A.; al Riza, D.F.; Sen, N.; Shiigi, T.; Kuramoto, M.; Ogawa, Y.; Kondo, N.; Suzuki, T. Fish Freshness Monitoring Using UV-Fluorescence Imaging on Japanese Dace (Tribolodon Hakonensis) Fisheye. J. Food Eng. 2020, 287, 110111. [Google Scholar] [CrossRef]
- Khaliduzzaman, A.; Omwange, K.A.; Al Riza, D.F.; Konagaya, K.; Kamruzzaman, M.; Alom, M.S.; Gao, T.; Saito, Y.; Kondo, N. Antioxidant Assessment of Agricultural Produce Using Fluorescence Techniques: A Review. Crit. Rev. Food Sci. Nutr. 2021, 63, 3704–3715. [Google Scholar] [CrossRef] [PubMed]
- Al Riza, D.F.; Widodo, S.; Purwanto, Y.A.; Kondo, N. Combined Fluorescence-Transmittance Imaging System for Geographical Authentication of Patchouli Oil. Spectrochim. Acta A Mol. Biomol. Spectrosc. 2019, 218, 155–160. [Google Scholar] [CrossRef] [PubMed]
- Fatchurrahman, D.; Kuramoto, M.; Kondo, N.; Ogawa, Y.; Suzuki, T. Identification of UV-Fluorescence Components Associated with and Detection of Surface Damage in Green Pepper (Capsicum annum L.). In Proceedings of the 23rd International Conference in Central Europe on Computer Graphics, Visualization and Computer Vision, Plzeň, Czechia, 8–12 June 2015. [Google Scholar]
- Momin, M.A.; Kuramoto, M.; Kondo, N.; Ido, K.; Ogawa, Y.; Shiigi, T.; Ahmad, U. Identification of UV-Fluorescence Components for Detecting Peel Defects of Lemon and Yuzu Using Machine Vision. Eng. Agric. Environ. Food 2013, 6, 165–171. [Google Scholar] [CrossRef]
- Muharfiza; Al Riza, D.F.; Saito, Y.; Itakura, K.; Kohno, Y.; Suzuki, T.; Kuramoto, M.; Kondo, N. Monitoring of Fluorescence Characteristics of Satsuma Mandarin (Citrus unshiu Marc.) during the Maturation Period. Horticulturae 2017, 3, 51. [Google Scholar] [CrossRef]
- Konagaya, K.; Al Riza, D.F.; Nie, S.; Yoneda, M.; Hirata, T.; Takahashi, N.; Kuramoto, M.; Ogawa, Y.; Suzuki, T.; Kondo, N. Monitoring Mature Tomato (Red Stage) Quality during Storage Using Ultraviolet-Induced Visible Fluorescence Image. Postharvest Biol. Technol. 2020, 160, 111031. [Google Scholar] [CrossRef]
- Al Riza, D.F.; Kumar, S.K.; Suzuki, T.; Ogawa, Y.; Kondo, N. Preliminary Investigation on Rice Bran Residue Detection Using Ultraviolet Fluorescence Imaging. In Proceedings of the Fourth International Seminar on Photonics, Optics, and Its Applications (ISPhOA 2020), Virtual, 12 March 2021; Nasution, A.M.T., Wahyuono, R.A., Hatta, A.M., Eds.; SPIE: Bellingham, WA, USA, 2021; Volume 11789, p. 117890I. [Google Scholar]
- Langhals, H. Fluorescence and Fluorescent Dyes. Phys. Sci. Rev. 2020, 5, 20190100. [Google Scholar] [CrossRef]
- Park, S.Y.; Yoon, S.A.; Cha, Y.; Lee, M.H. Recent Advances in Fluorescent Probes for Cellular Antioxidants: Detection of NADH, HNQO1, H2S, and Other Redox Biomolecules. Coord. Chem. Rev. 2021, 428, 213613. [Google Scholar] [CrossRef]
- Ulku, A.; Ardelean, A.; Antolovic, M.; Weiss, S.; Charbon, E.; Bruschini, C.; Michalet, X. Wide-Field Time-Gated SPAD Imager for Phasor-Based FLIM Applications. Methods Appl. Fluoresc. 2020, 8, 24002. [Google Scholar] [CrossRef]
- Chen, H.; Liu, K.; Hu, L.; Al-Ghamdi, A.A.; Fang, X. New Concept Ultraviolet Photodetectors. Mater. Today 2015, 18, 493–502. [Google Scholar] [CrossRef]
- Council, N.R. Seeing Photons: Progress and Limits of Visible and Infrared Sensor Arrays; The National Academies Press: Washington, DC, USA, 2010; ISBN 978-0-309-15304-1. [Google Scholar]
- Muramoto, Y.; Kimura, M.; Nouda, S. Development and Future of Ultraviolet Light-Emitting Diodes: UV-LED Will Replace the UV Lamp. Semicond. Sci. Technol. 2014, 29, 84004. [Google Scholar] [CrossRef]
- Feng, X.; Zhang, H.; Yu, P. X-Ray Fluorescence Application in Food, Feed, and Agricultural Science: A Critical Review. Crit. Rev. Food Sci. Nutr. 2021, 61, 2340–2350. [Google Scholar] [CrossRef]
- Singh, K.V.; Sharma, N.; Singh, K.V. Application of Wavelength Dispersive X-Ray Fluorescence to Agricultural Disease Research. X-ray Spectrosc. Methods Appl. Today’s Spectrosc. 2021, 36, 23–30. [Google Scholar]
- Mannam, V.; Zhang, Y.; Yuan, X.; Ravasio, C.; Howard, S.S. Machine Learning for Faster and Smarter Fluorescence Lifetime Imaging Microscopy. J. Phys. Photonics 2020, 2, 42005. [Google Scholar] [CrossRef]
- Schaefer, M.A.; Nelson, H.N.; Butrum, J.L.; Gronseth, J.R.; Hines, J.H. A Low-Cost Smartphone Fluorescence Microscope for Research, Life Science Education, and STEM Outreach. Sci. Rep. 2023, 13, 2722. [Google Scholar] [CrossRef]
- Herppich, W.B. Chlorophyll Fluorescence Imaging for Process Optimisation in Horticulture and Fresh Food Production. Photosynthetica 2021, 59, 422–437. [Google Scholar] [CrossRef]
- Matveyeva, T.A.; Sarimov, R.M.; Simakin, A.V.; Astashev, M.E.; Burmistrov, D.E.; Lednev, V.N.; Sdvizhenskii, P.A.; Grishin, M.Y.; Pershin, S.M.; Chilingaryan, N.O.; et al. Using Fluorescence Spectroscopy to Detect Rot in Fruit and Vegetable Crops. Appl. Sci. 2022, 12, 3391. [Google Scholar] [CrossRef]
- Liu, Z.; Wang, S.; Zhang, Y.; Feng, Y.; Liu, J.; Zhu, H. Artificial Intelligence in Food Safety: A Decade Review and Bibliometric Analysis. Foods 2023, 12, 1242. [Google Scholar] [CrossRef]
- Gorji, H.T.; Van Kessel, J.A.S.; Haley, B.J.; Husarik, K.; Sonnier, J.; Shahabi, S.M.; Zadeh, H.K.; Chan, D.E.; Qin, J.; Baek, I.; et al. Deep Learning and Multiwavelength Fluorescence Imaging for Cleanliness Assessment and Disinfection in Food Services. Front. Sens. 2022, 3, 977770. [Google Scholar] [CrossRef]
- Gonzalez, R.C.; Woods, R.E. Digital Image Processing, 2nd ed.; Prentice-Hall, Inc.: Upper Saddle River, NJ, USA, 2002; p. 07458. [Google Scholar]
- Mul, Y.G.; Gokhale, A.V. Color Image Segmentation Based on Automatic Seed Pixel Selection. Int. J. Comput. Eng. Manag. 2012, 15, 11–14. [Google Scholar]
- Ma, Z.; Tavares, J.M.R.S.; Jorge, R.N.; Mascarenhas, T. A Review of Algorithms for Medical Image Segmentation and Their Applications to the Female Pelvic Cavity. Comput. Methods Biomech. Biomed. Eng. 2010, 13, 235–246. [Google Scholar] [CrossRef]
- Vala, H.J.; Baxi, A. A Review on Otsu Image Segmentation Algorithm. J. Adv. Res. Comput. Eng. Technol. 2013, 2, 387–389. [Google Scholar]
- Martins Crispi, G.; Valente, D.S.M.; de Queiroz, D.M.; Momin, A.; Fernandes-Filho, E.I.; Picanço, M.C. Using Deep Neural Networks to Evaluate Leafminer Fly Attacks on Tomato Plants. AgriEngineering 2023, 5, 273–286. [Google Scholar] [CrossRef]


Disclaimer/Publisher’s Note: The statements, opinions and data contained in all publications are solely those of the individual author(s) and contributor(s) and not of MDPI and/or the editor(s). MDPI and/or the editor(s) disclaim responsibility for any injury to people or property resulting from any ideas, methods, instructions or products referred to in the content. |
© 2023 by the authors. Licensee MDPI, Basel, Switzerland. This article is an open access article distributed under the terms and conditions of the Creative Commons Attribution (CC BY) license (https://creativecommons.org/licenses/by/4.0/).