1. Introduction
The use of optical technologies for diagnostics is an urgent task and a topic of many studies; however, the introduction of these technologies is currently not widespread [
1].
One of the most common recognition tasks is the task of identifying objects in an image. If it is known in advance what exactly the object of interest is and its descriptions are set (images from different shooting angles and geometric dimensions, and other parameters of the object are set), then the recognition task is independent and can be reduced to the task of comparing existing descriptions with incoming data, and in cases of coincidence, the object is considered recognized [
2]. The definition of the objects of analysis also significantly depends on the technical characteristics of a particular object, such as varietal characteristics, size, the quality of the crop at that time period and the presence or absence of diseases [
3,
4,
5]. At the moment, it is not known a priori which object can be present in the image, but it is known that an object can be an object of a certain class [
6,
7,
8,
9]. As a rule, it is necessary to recognize an object with accuracy to the class level, i.e., to attribute the object in question to one of the listed classes or to conclude that this object does not belong to any of them. The most effective method of solving existing recognition problems is to compare the image in question with a certain set of standards, i.e., a graphical database. Such a database contains all possible variants of images (standards) or other objects of interest belonging to certain classes, and the task is reduced to comparing the image in question with the reference base [
10,
11,
12,
13]. The basic principles of the existing methods are divided into two types: using some descriptions and characteristics of objects that allow indexing the contents of the database to further speed up the search process, and search methods based on finding the most “similar” image to the standard in the image under consideration. Methods of the first type are used when there is some specificity of the desired objects that describes them in a unique way. These methods generate algorithms for describing objects of interest, which allow the formation of a certain numerical characteristic of the object, or a set of them [
14,
15,
16,
17,
18,
19,
20,
21]. The recognition process is reduced to comparing the obtained numerical characteristics of objects, which can include the area of the object, the length of the contour of the object, the distance of the contour elements relative to the axis of symmetry of the object, the ratio of the area to the length of the contour, etc. Depending on which set of parameters is selected and which methods of comparing them are used, the appropriate private recognition algorithm can be specified [
22,
23,
24,
25,
26].
The methods of the second type produce a sequential enumeration of standards with different scales and orientations relative to the analyzed image, i.e., the reference image of the object is run through the entire analyzed image with a sliding window, and for each offset there is a measure of compliance according to a certain law. Next, the reference image is rotated around its own axis by a small value, and the run-through process is repeated. Similar operations are repeated for all values of angles from 0 to 360 degrees and a large range of scales [
3]. A set of methods and techniques of non-destructive multiparametric surface analysis is proposed as a technology for scanning a variety of biological objects, such as potato tubers and apple fruits, from different angles [
27,
28,
29].
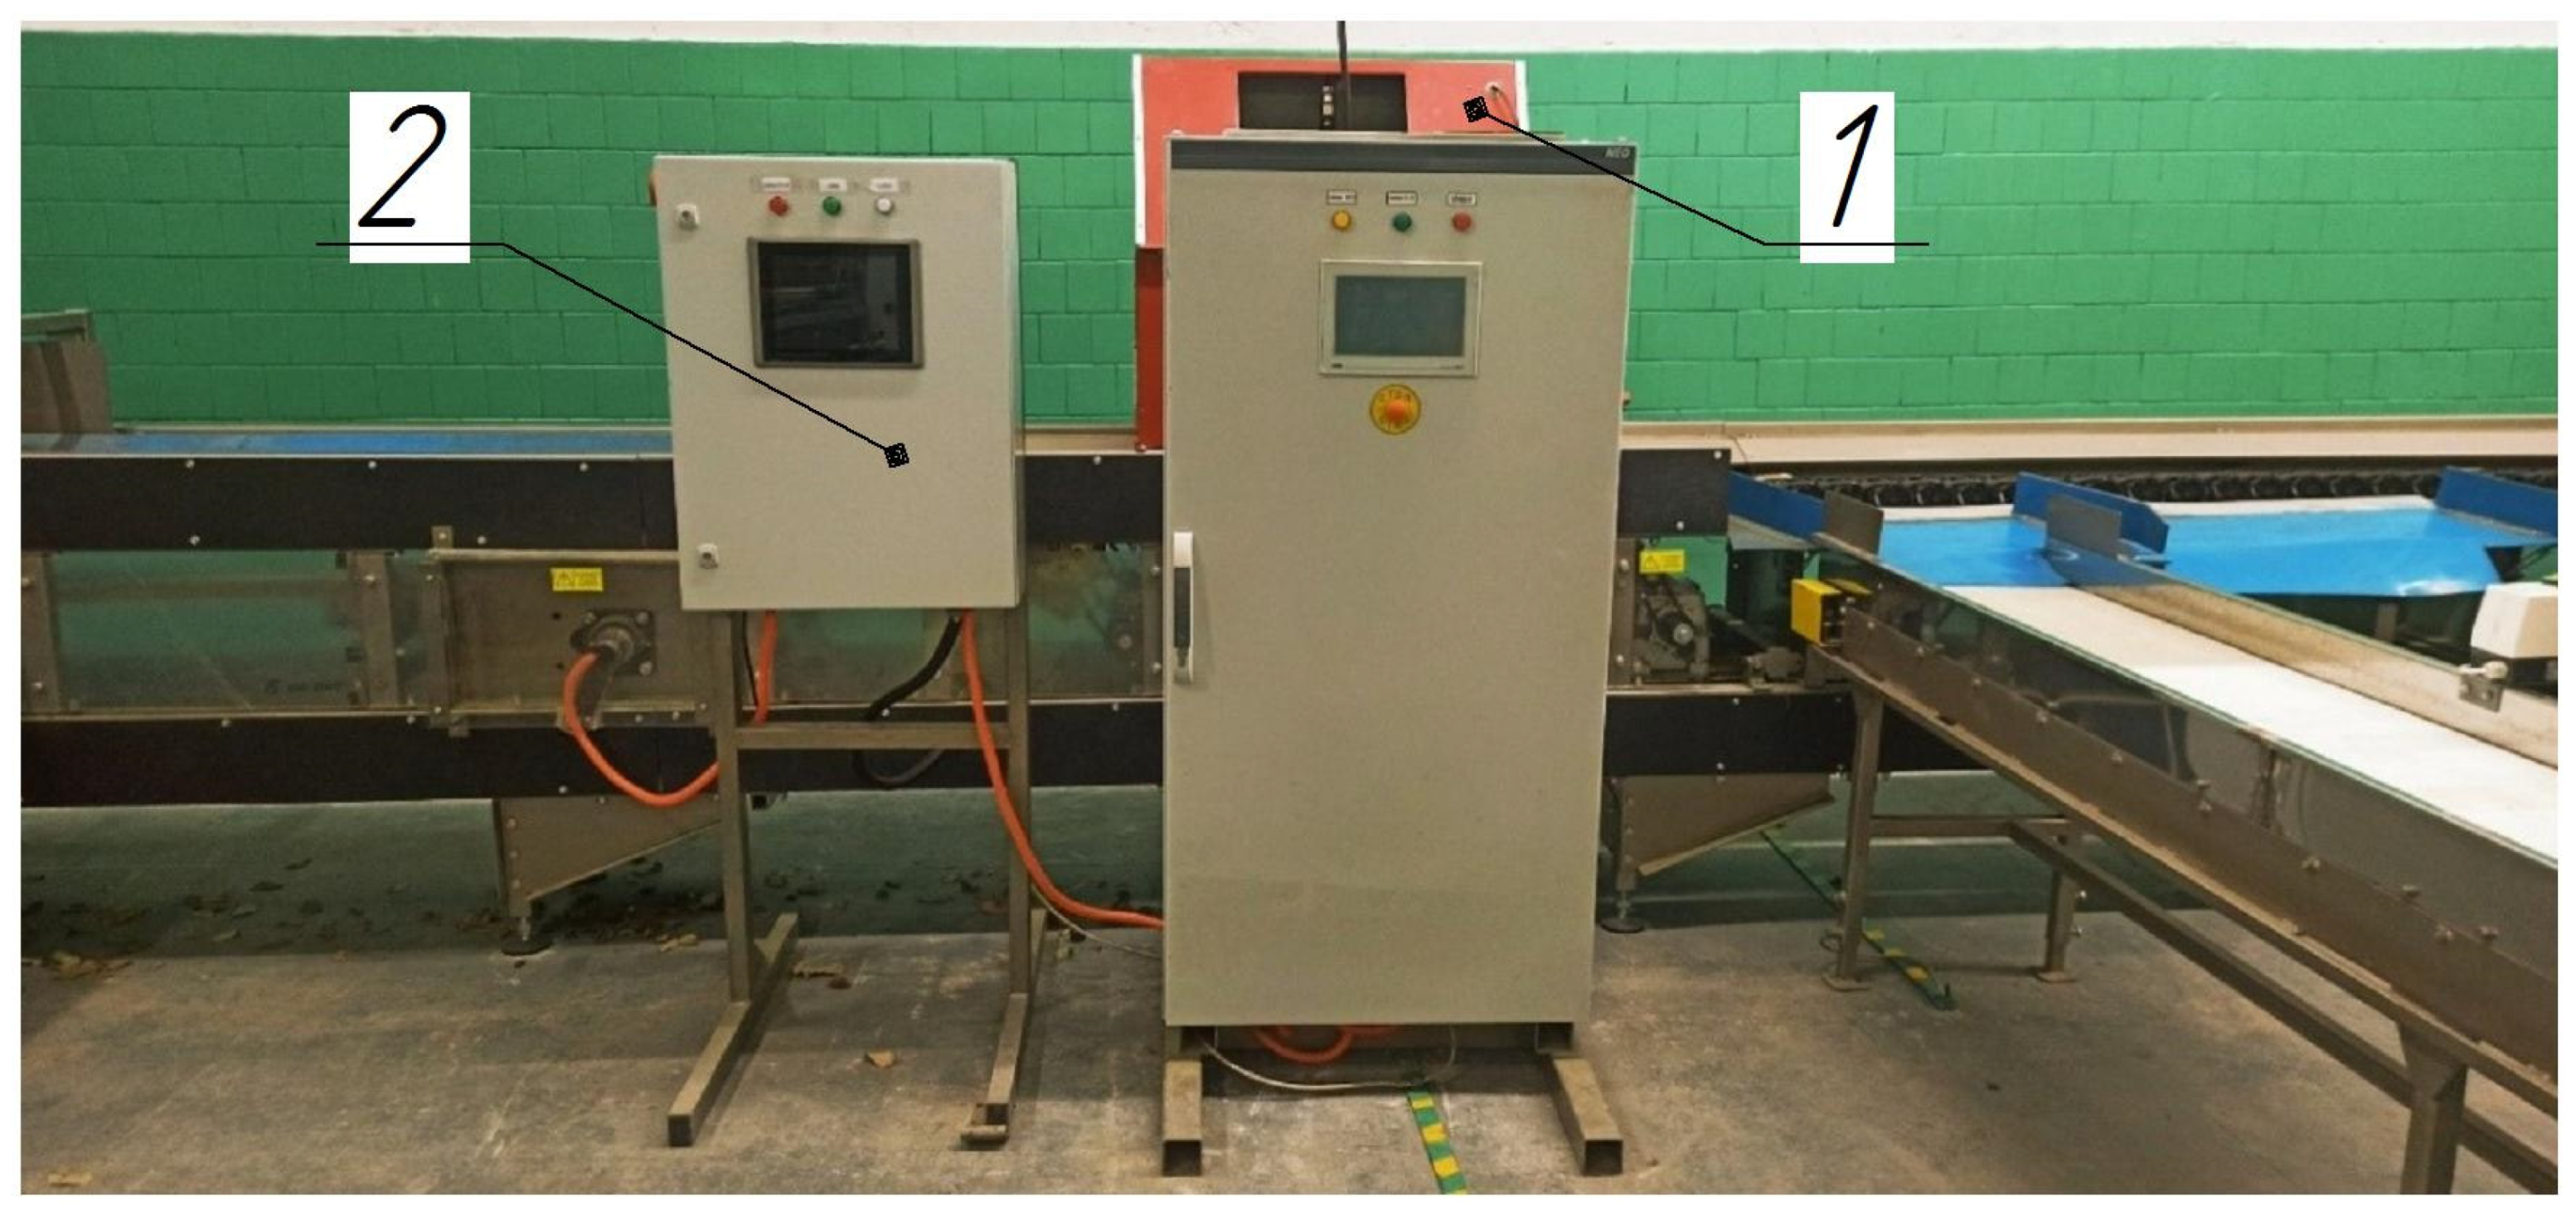
A widespread vision system for the sorting line LSP-4 (National Academy of Sciences of Belarus for agricultural mechanization) already exists and provides a high efficiency of apple sorting, with an accuracy of sorting fruits by size of 75.4% (
Figure 1). However, one of the significant drawbacks of this system is the low accuracy of determining the presence of defects—73.1% [
27].
Presently, the most suitable method for the automation of fruit quality identification is the method of optical control using technical vision systems, since it provides a high accuracy of quality assessment and meets the conditions required of the technology.
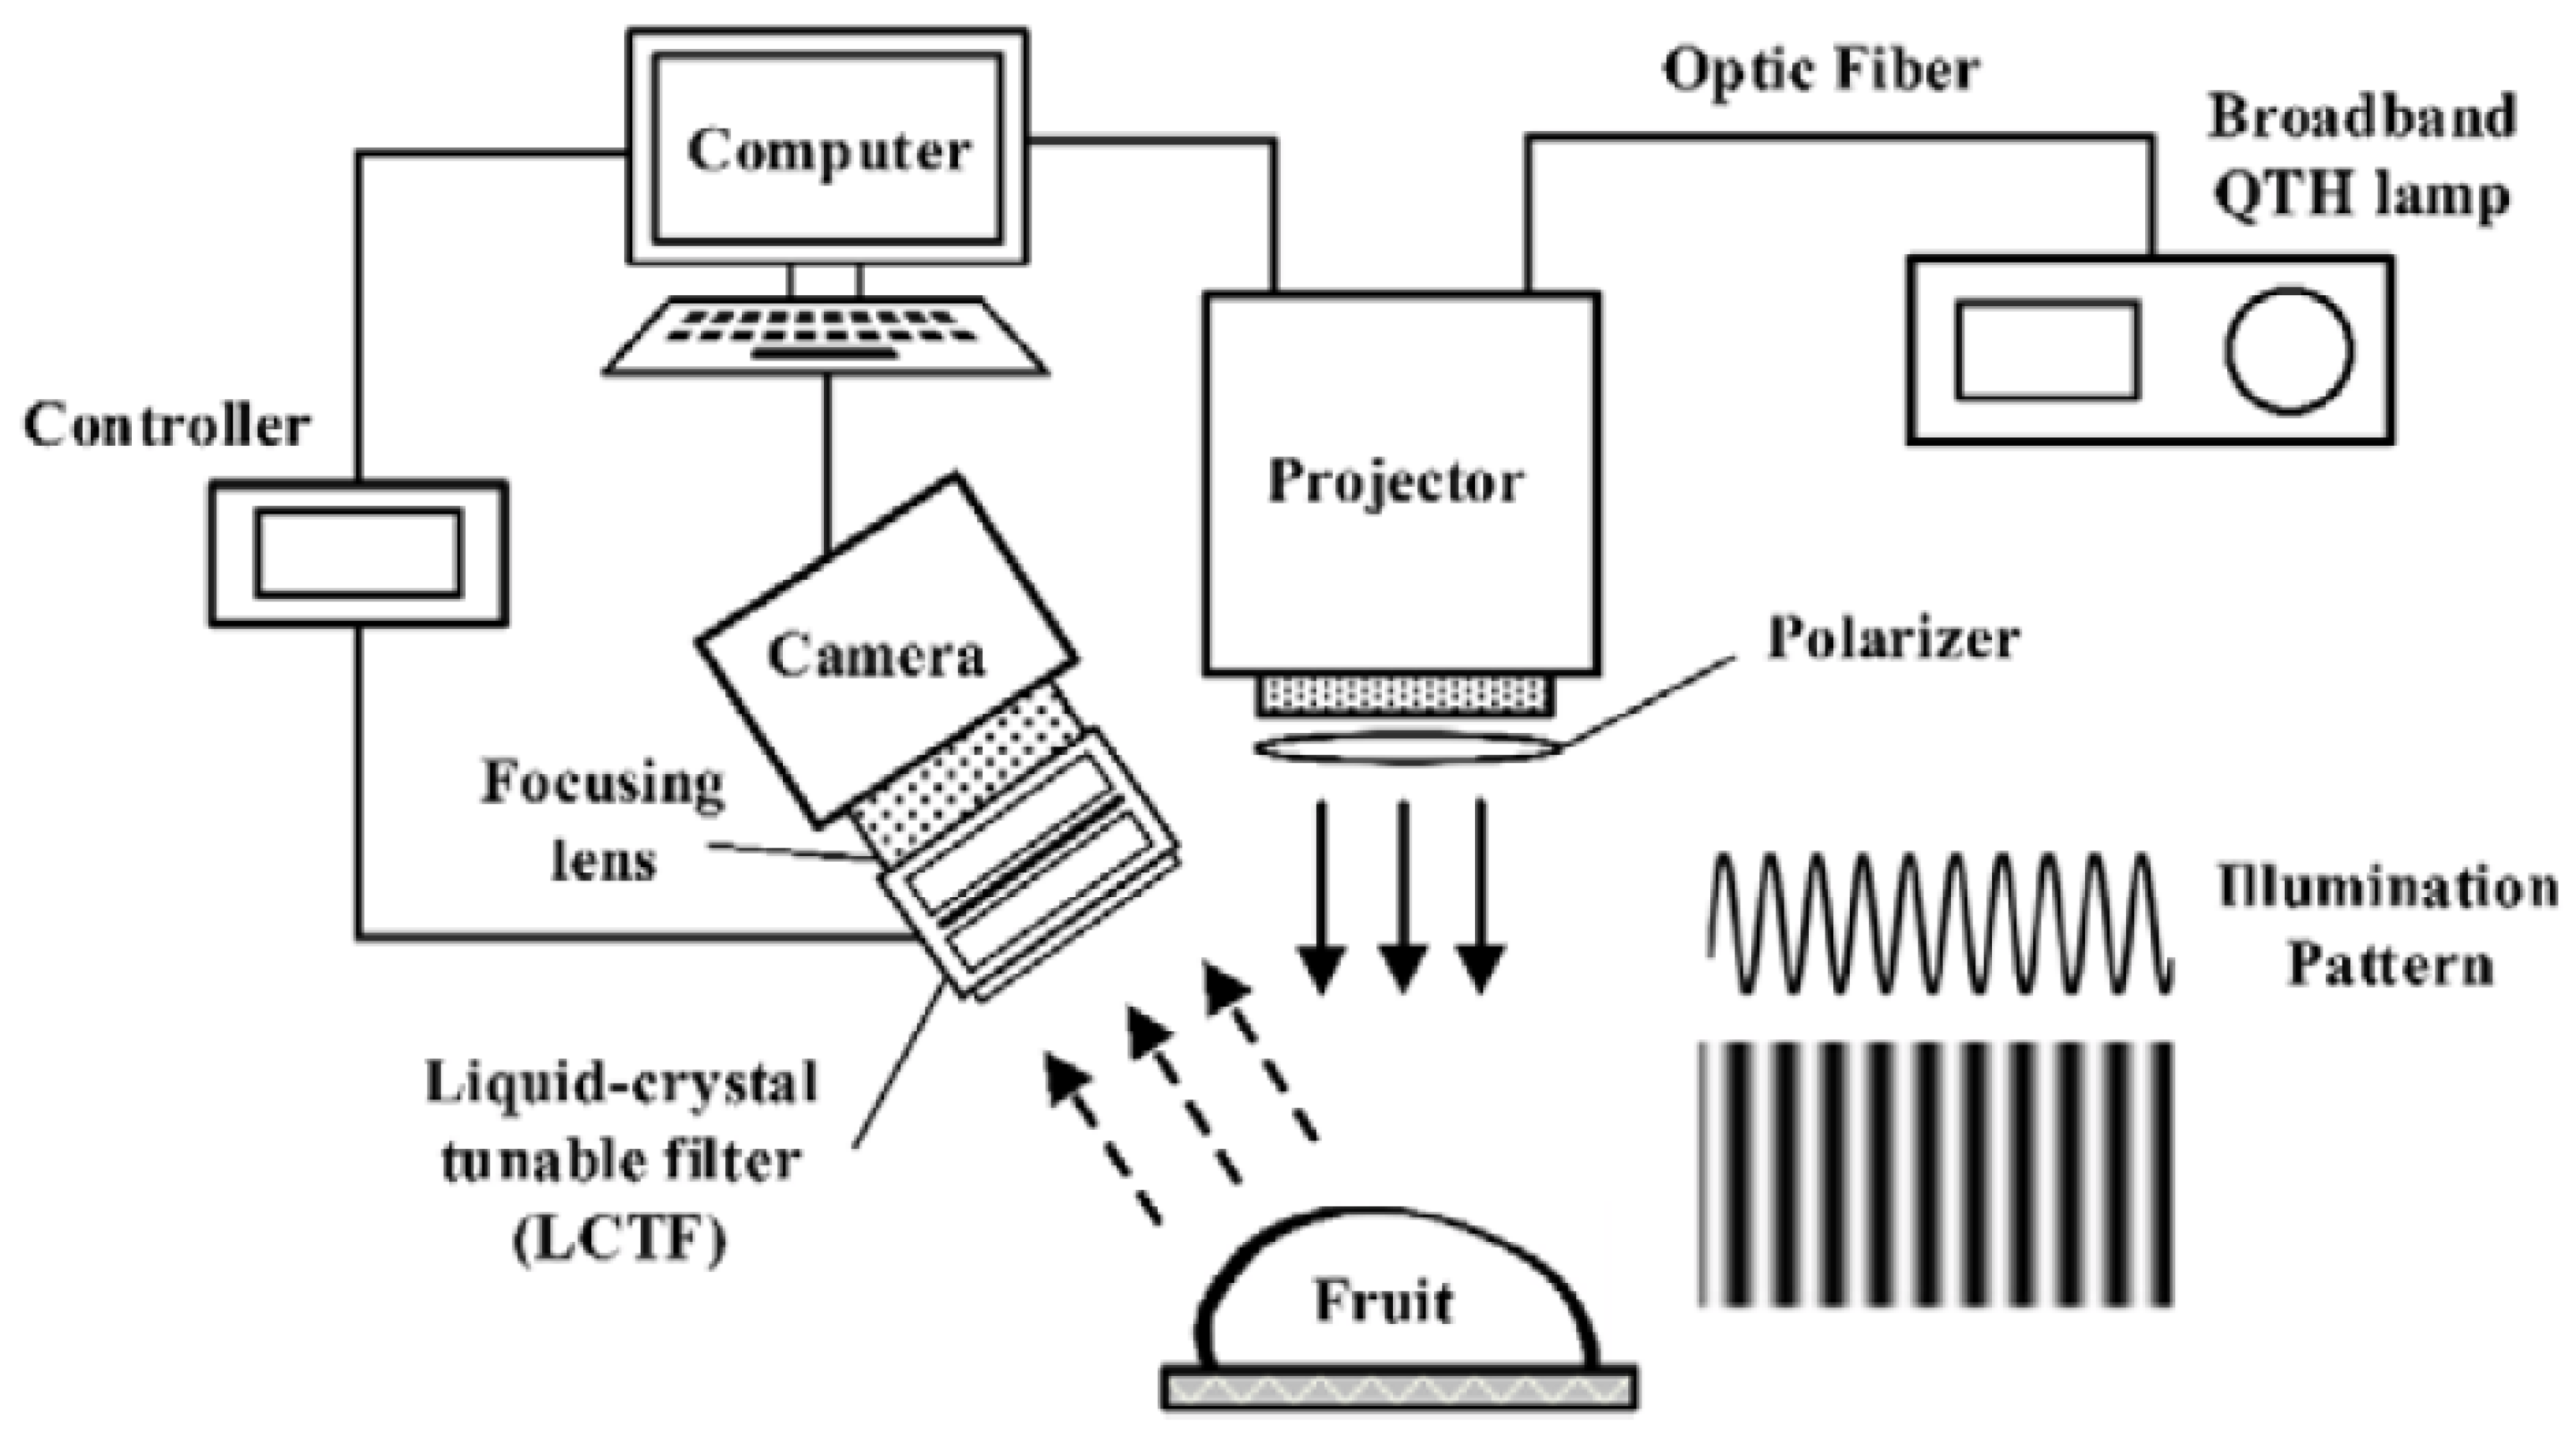
The known system mainly consists of a computer [
28], a DMD-based digital light projector (DLiCEL5500, Digital Light Innovations, Austin, TX, USA) for pattern projection, a 250 W DC-regulated quartz–tungsten–halogen (QTH) lamp (Oriel Instruments, Stratford, CT, USA), a 12-bit high-performance charge-coupled device (CCD) camera with 1376 1040 effective pixels (SensiCam QE, Cooke Corp., Auburn Hills, MI, USA) attached to a C-mount focusing lens (Electrophysics 25 mm F/1.4 macro lens, Sofradir, Palaiseau, France), and an LCTF (Varispec, Cambridge Research and Instrumentation, Inc., Woburn, MS, USA) that was placed in front of the focusing lens (
Figure 2).
By using a modified Otsu thresholding algorithm (
Figure 2), fresh bruises were detected at each wavelength from 710 to 810 nm in 20 nm increments, with overall detection errors of 11.7% to 14.2%.
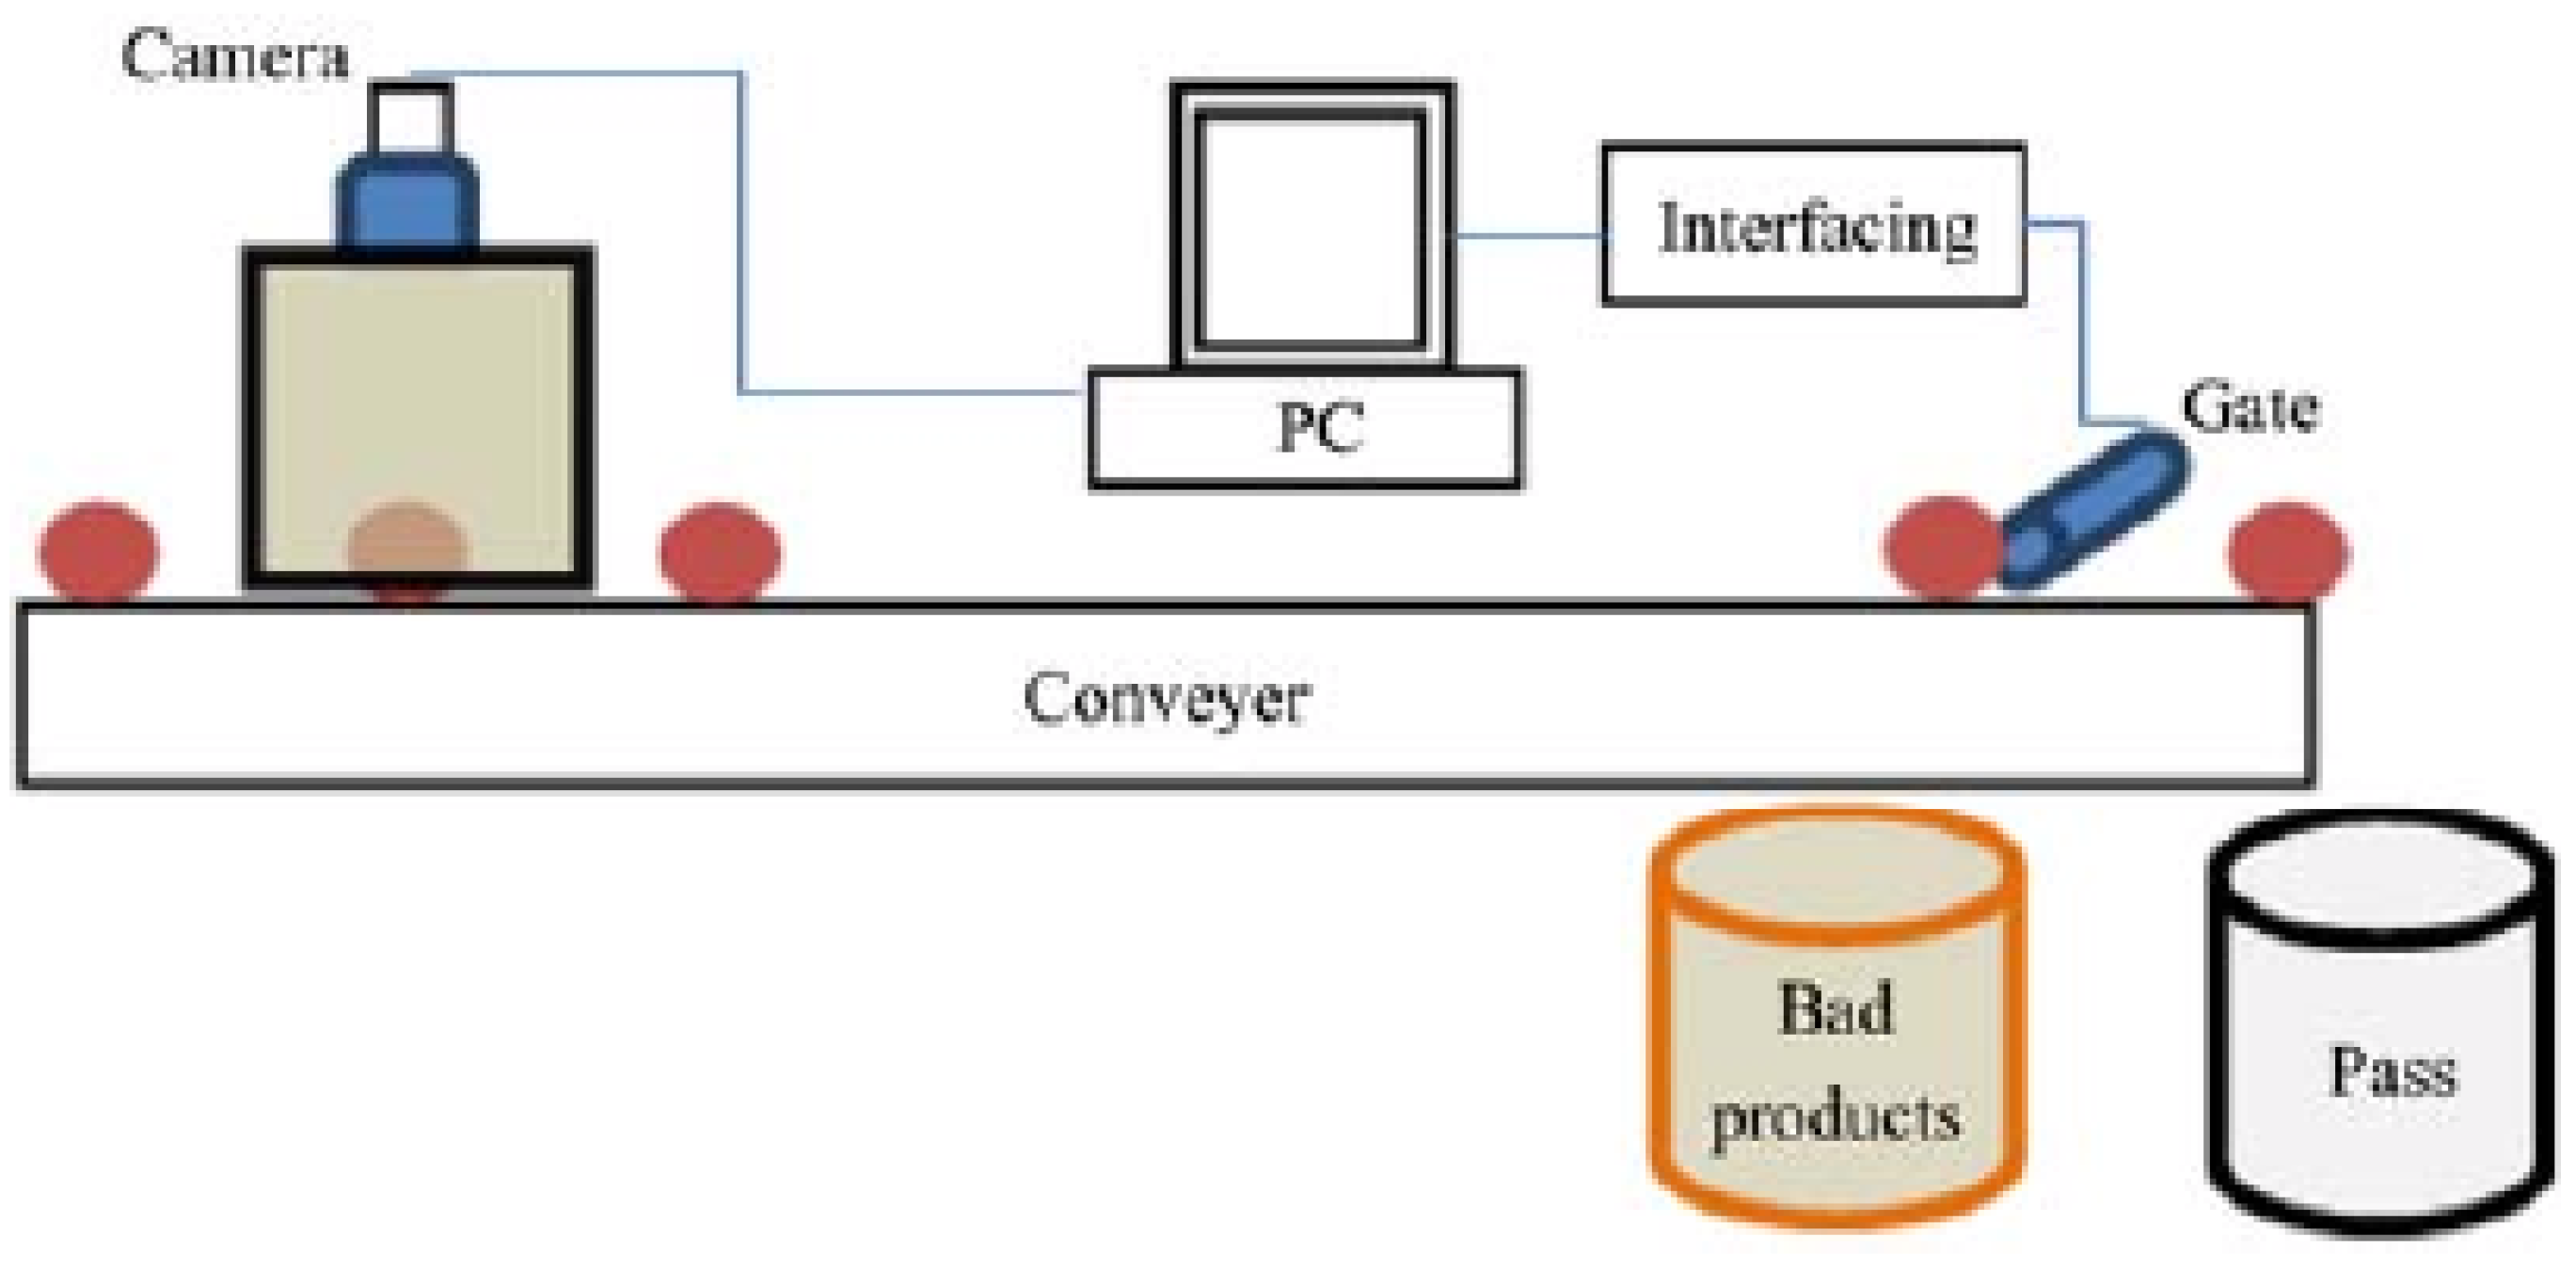
Based on this, an intelligent computer vision system was developed for vegetable and fruit quality inspection using soft computing techniques (
Figure 3).
The vision-based quality inspection system consists of different sub-systems.
Figure 3 shows the various components of the system. A fast single camera or multiple cameras are used to capture the images of the products. A single camera with mirrors can be used to check the different sides of the product, while various cameras fixed in different directions obtain more precise images [
29].
The obtained accuracy ranges from 85.00% to 95.00% for orange, lemon, sweet lime, and tomato used soft computing techniques such as the backpropagation neural network and probabilistic neural network (
Figure 3).
The increasing proportion of mechanical effects on tubers during cultivation, harvesting, and storage has resulted in the need to conduct breeding for the increased endurance of potatoes to mechanical loads. The main factors that inflict damage to potato tubers during mechanized harvesting are the design of potato harvesters and the material [
30] from which the working bodies of the machines and operating modes are made [
31]. An important role is played by the physical and mechanical properties of tubers, which, in turn, depend on the variety, agricultural techniques of cultivation, soil structure, and climatic conditions.
A wide range of methods have been developed for both the remote and proximal non-invasive monitoring of plants, based on the registration of light reflected by plant objects. These devices use the features of laser radiation, which allow the development of a variety of methods for the remote study of objects using the principles of lidar sensing. One of the most significant limitations of the methods for recording light reflected by plant objects is associated with their limited spatial resolution. With the advent of affordable imaging spectrometers, a breakthrough has been made in this area: such devices record spatially resolved information about an object. However, the relationship between changes in parameters collectively perceived as representing the “quality” of plants and hyperspectral data remains in many cases uncertain. This is aggravated by the significant heterogeneity of the recorded parameters, which manifests itself even within the same fruit or tuber. One of the key innovations that underlies optical scanning systems is a deep learning neural network modified for agrotechnical tasks. Carrying out research on this topic will make it possible to design and create new types of devices, taking into account the characteristics of laser radiation, which are in demand in many industries and individual segments of science and technology.
This paper is organized as follows:
Section 2 introduces the quality inspection and sorting system and the different components used to sort food products using computer vision, described in the materials and methods.
Section 3 reports the experiments and results. Finally,
Section 4 presents the conclusion.
2. Materials and Methods
To improve the image quality, both when taking a conventional image and in fluorescence spectroscopy, systems for highlighting a biological object are provided, as well as the other optical elements necessary to improve the image quality or the spectra being taken (light filters, lenses, etc.). It is possible to rotate a biological object 360 degrees around the axis as a result of the action of the rollers of the orienting module on the tuber/fruit, providing simultaneous translational and rotational (around its axis) movement. The measurement zone on the surface can be selected and adjusted using the drives of the sample scanning system, which allow moving the magnetic carrier with the sample on the scanner in a vertical plane. After taking measurements, the scanning system is removed from the surface and the next iteration of scanning the surface of the biological sample is performed [
10,
11]. This algorithm scanning the actions of biological objects can be repeated in a cycle, as a result of which a series of layered images will be obtained after the successive scanning of images from different angles. On this basis, and with the help of specialized software, the three-dimensional structure of the studied sample including volume can be recreated. To achieve the required measurement quality, it is necessary to limit the influence of mechanical vibration and acoustic noise on the system. Reducing the influence of mechanical vibration and acoustic noise is achieved by increasing the rigidity and reducing the mass of the system elements, which leads to an increase in resonant frequencies and a decrease in sensitivity to low-frequency vibrations. As part of the optical scanning system being developed, it is necessary to use mirror lenses. This choice is due to the absence of chromatic aberrations in these lenses, which makes it possible to use identical lenses (serial production) in the formed autonomous spectral channels; there is one common lens for several spectral channels. The data received from the three-dimensional scanning element after scanning the surface of the object are represented by a discrete set of points with three-dimensional coordinates, i.e., in the form of a discrete surface model [
13,
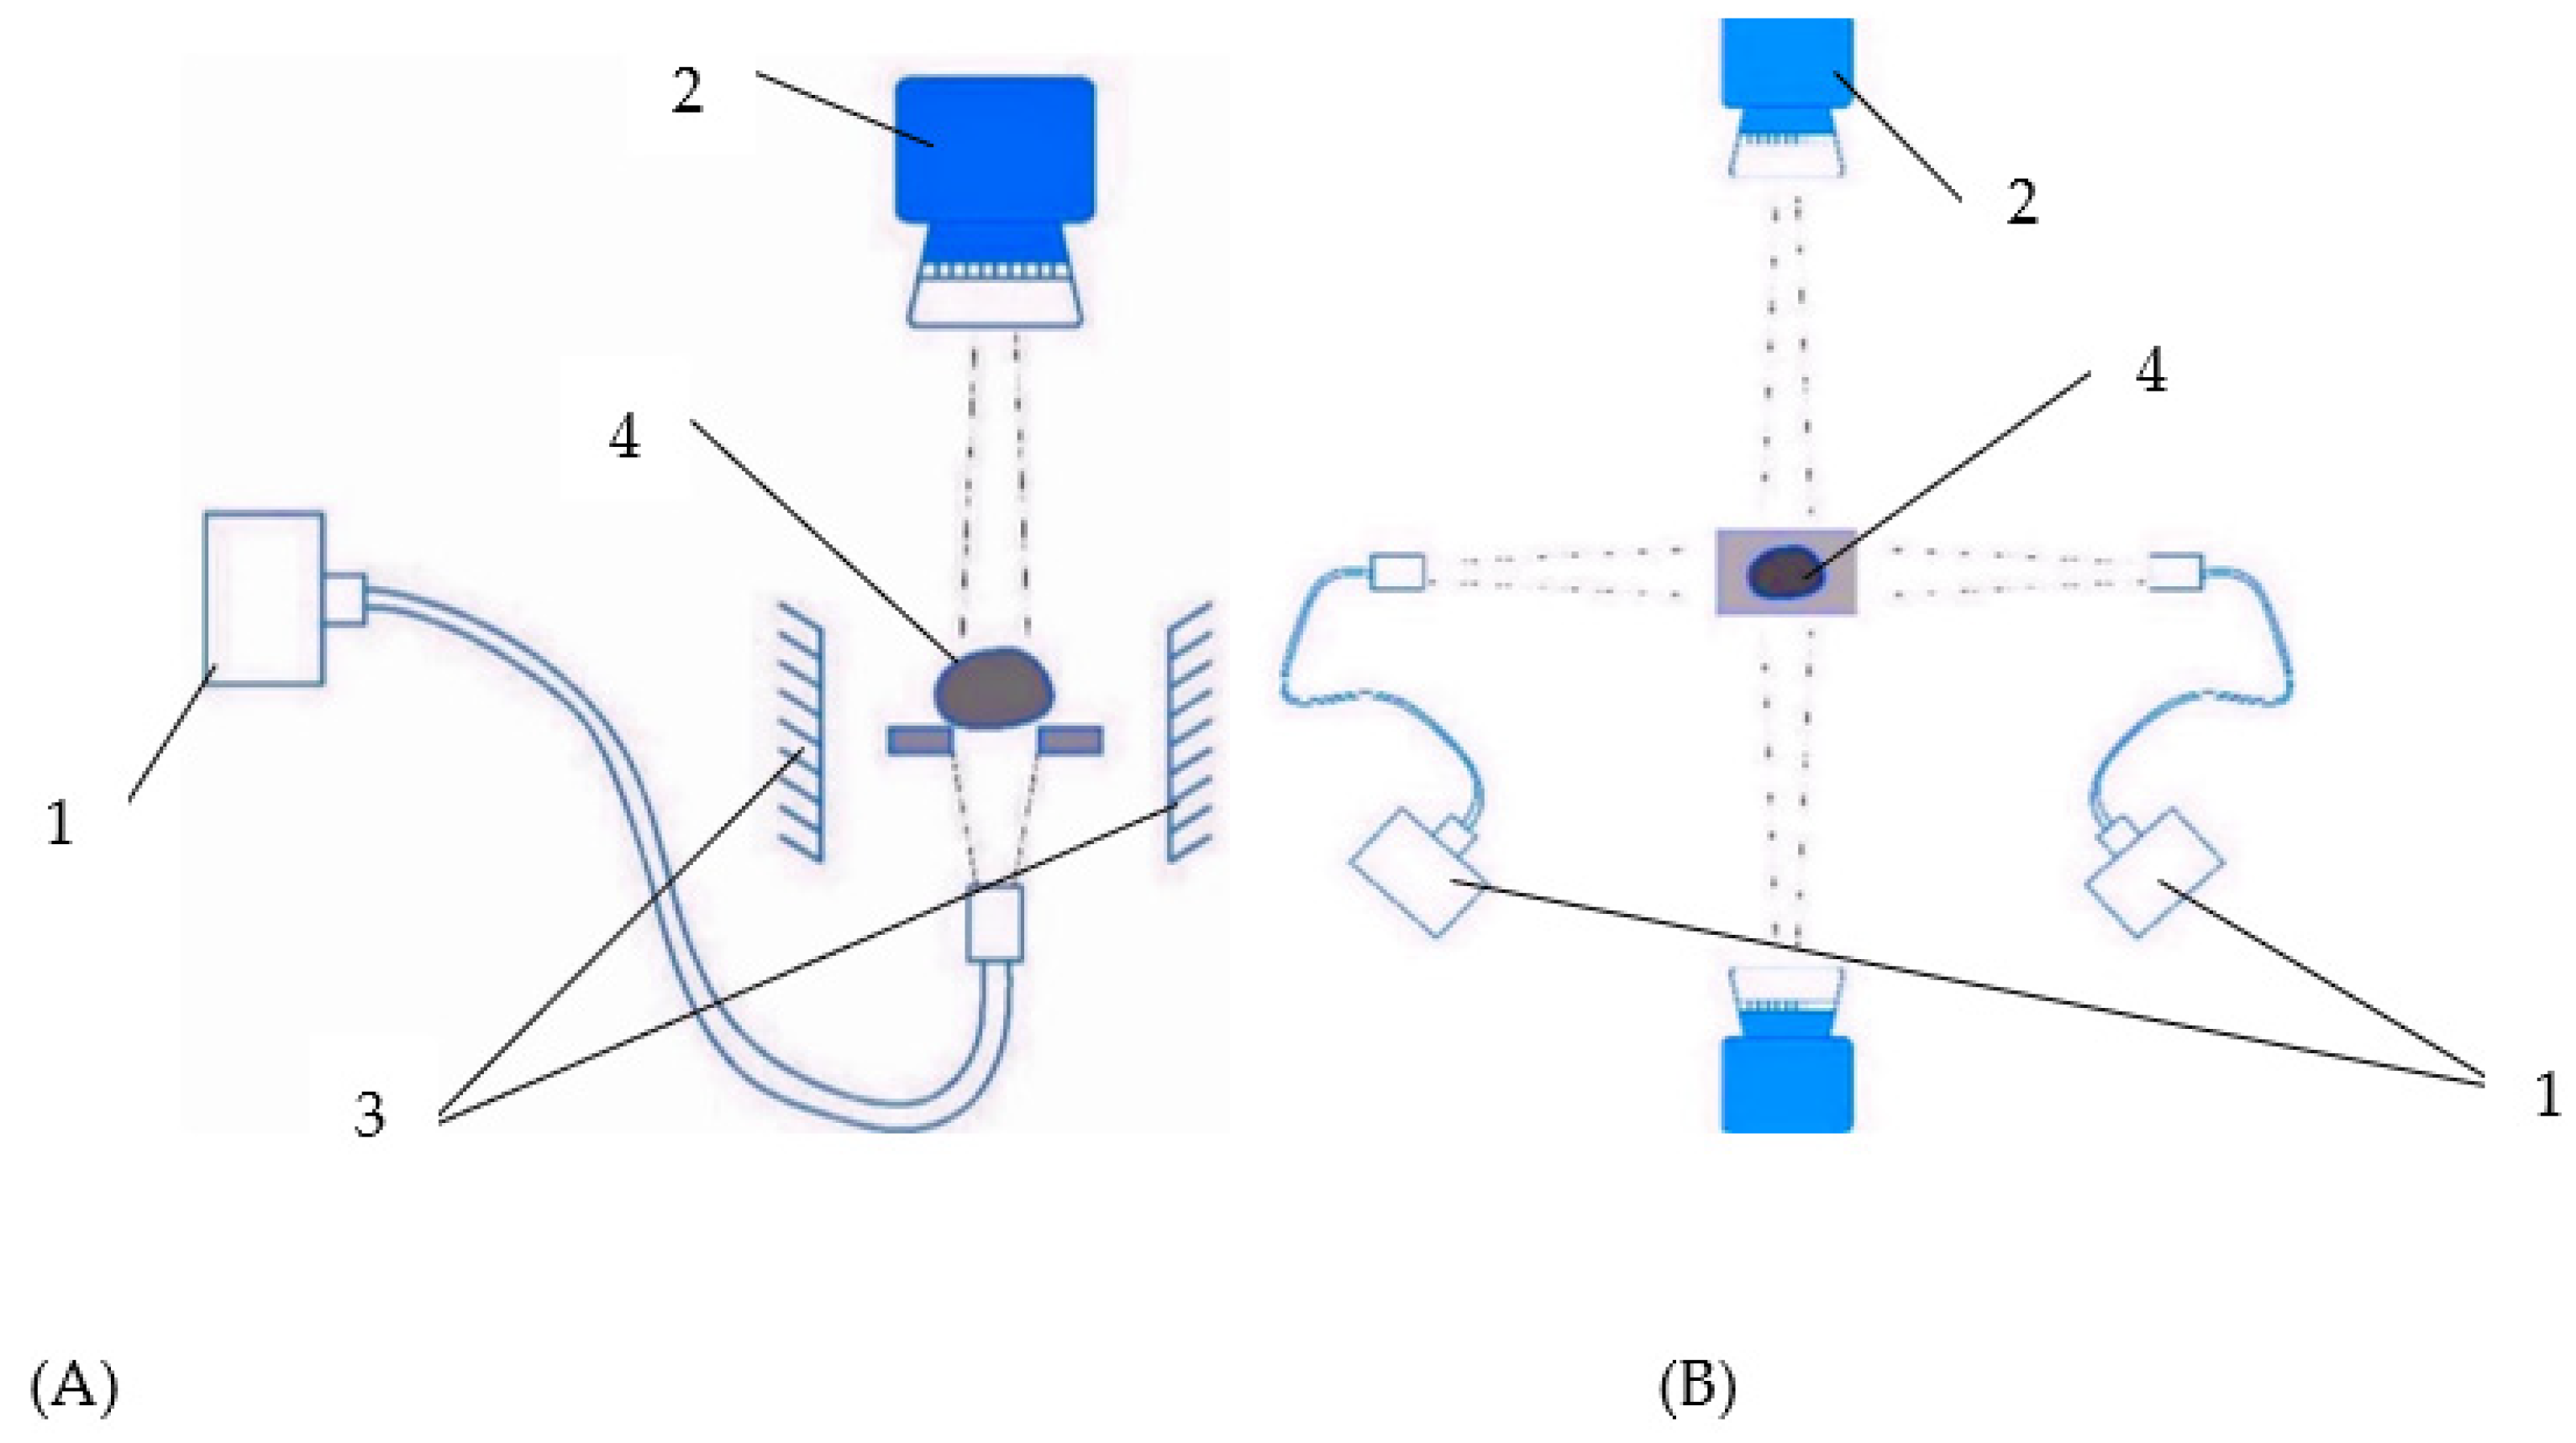
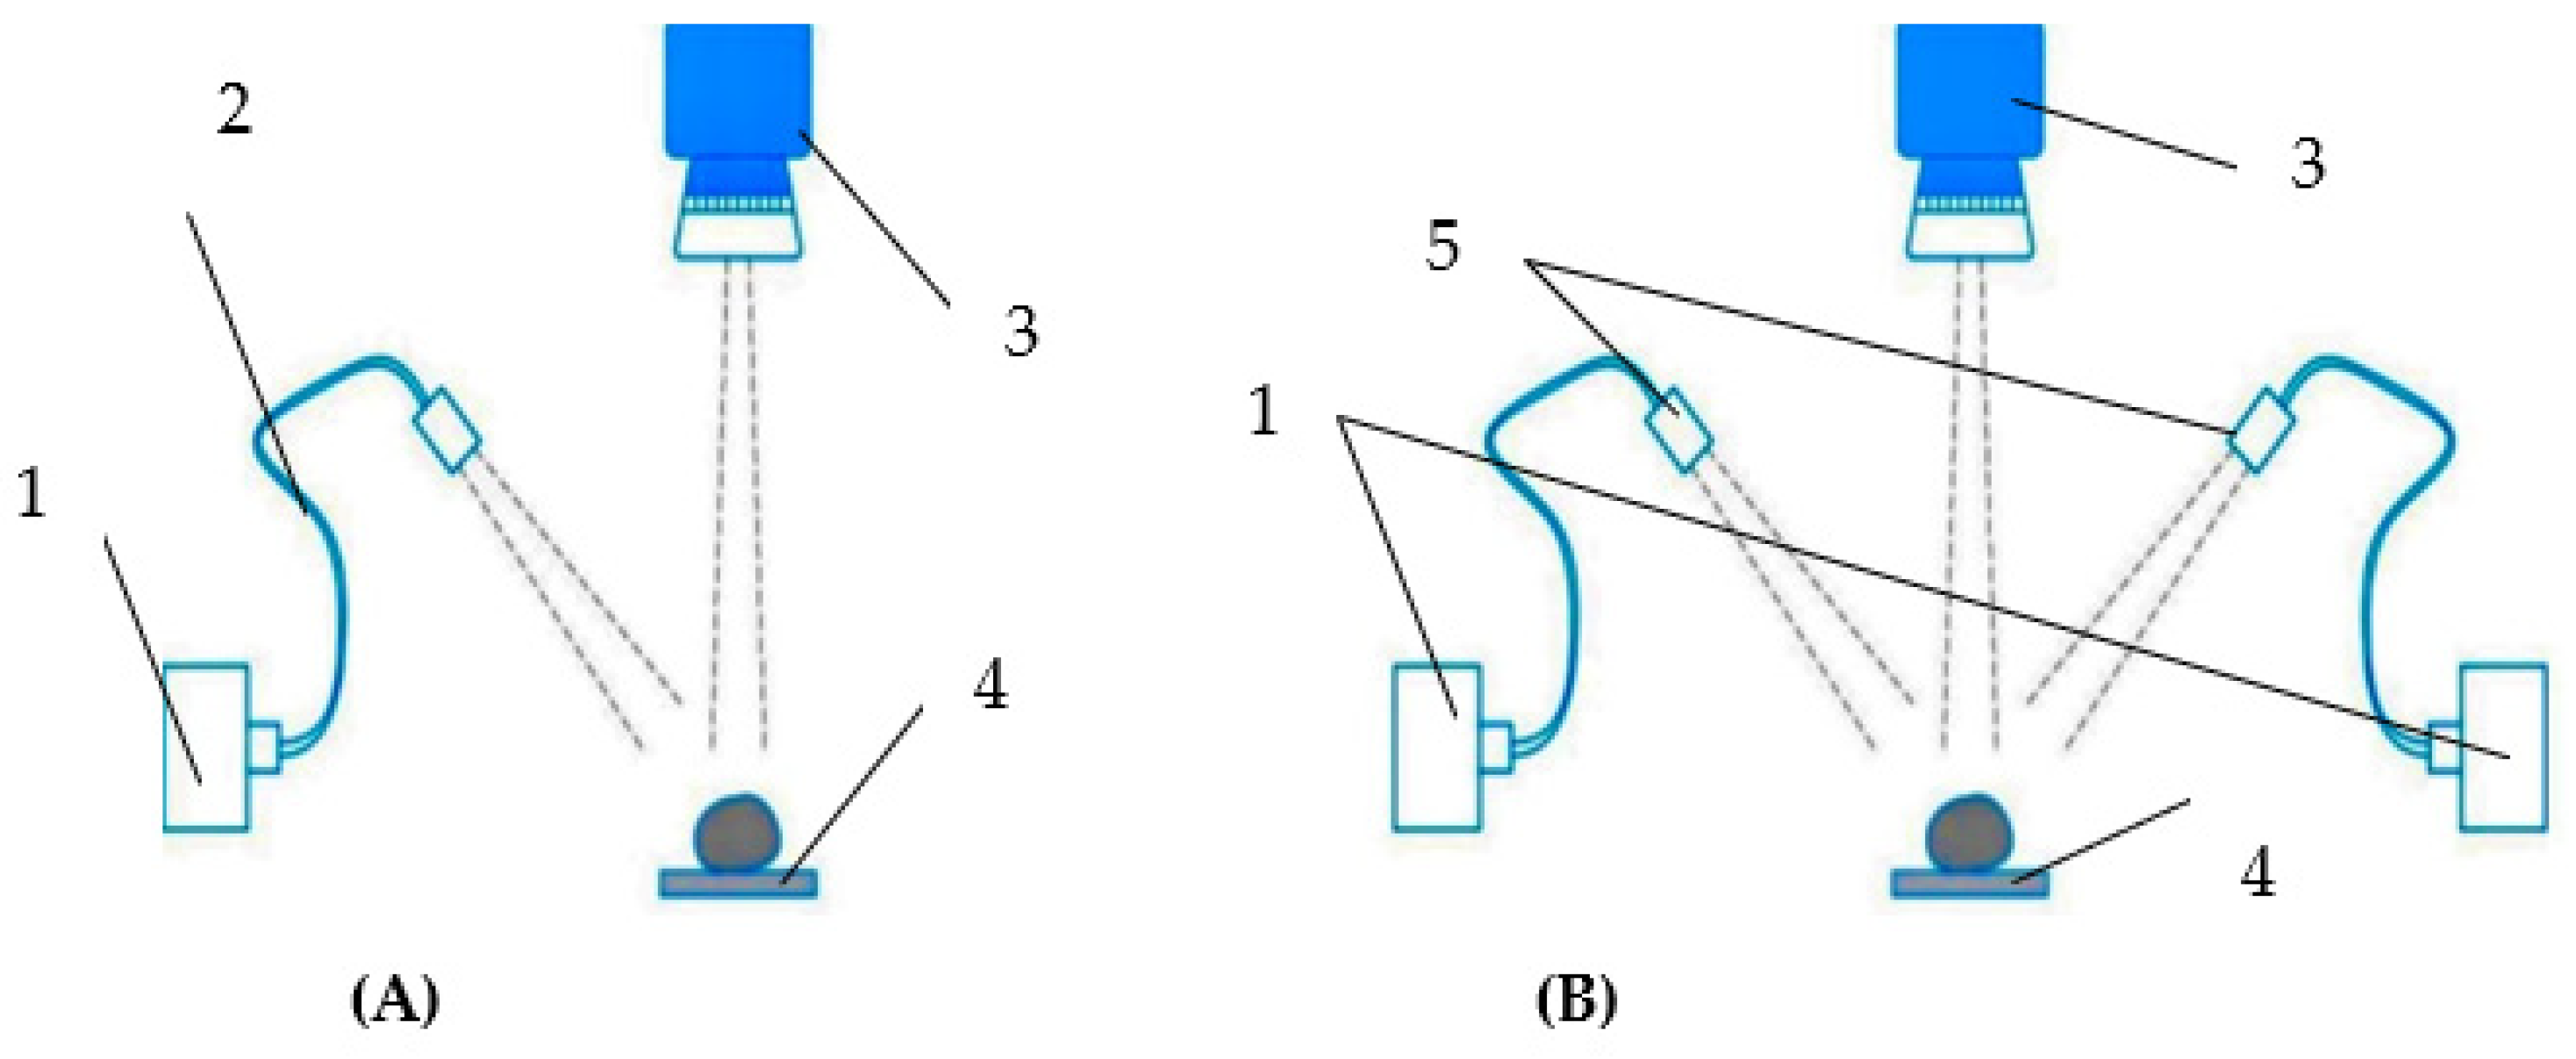
15]. The scanning of multiple objects from different angles is performed when synchronizing the work of the optical identification system, which is based on the basic hyperspectral imaging system when obtaining data on scanned biological objects in many spectral ranges in various possible versions of the system assembly:
- –
One lens using a system of mirrors to take an image from the opposite side of the location of a biological object (
Figure 4A);
- –
Two lenses located on opposite sides of the location of the biological object (
Figure 4B).
To improve the image quality both when taking a conventional image and in fluorescence spectroscopy, when implementing this technology, it is necessary to provide illumination systems for the biological object, as well as the other optical elements necessary to improve the image quality or the spectra being taken (light filters or lenses). Various types of surface illumination, including a variant with a point light source, are shown in
Figure 5A,B.
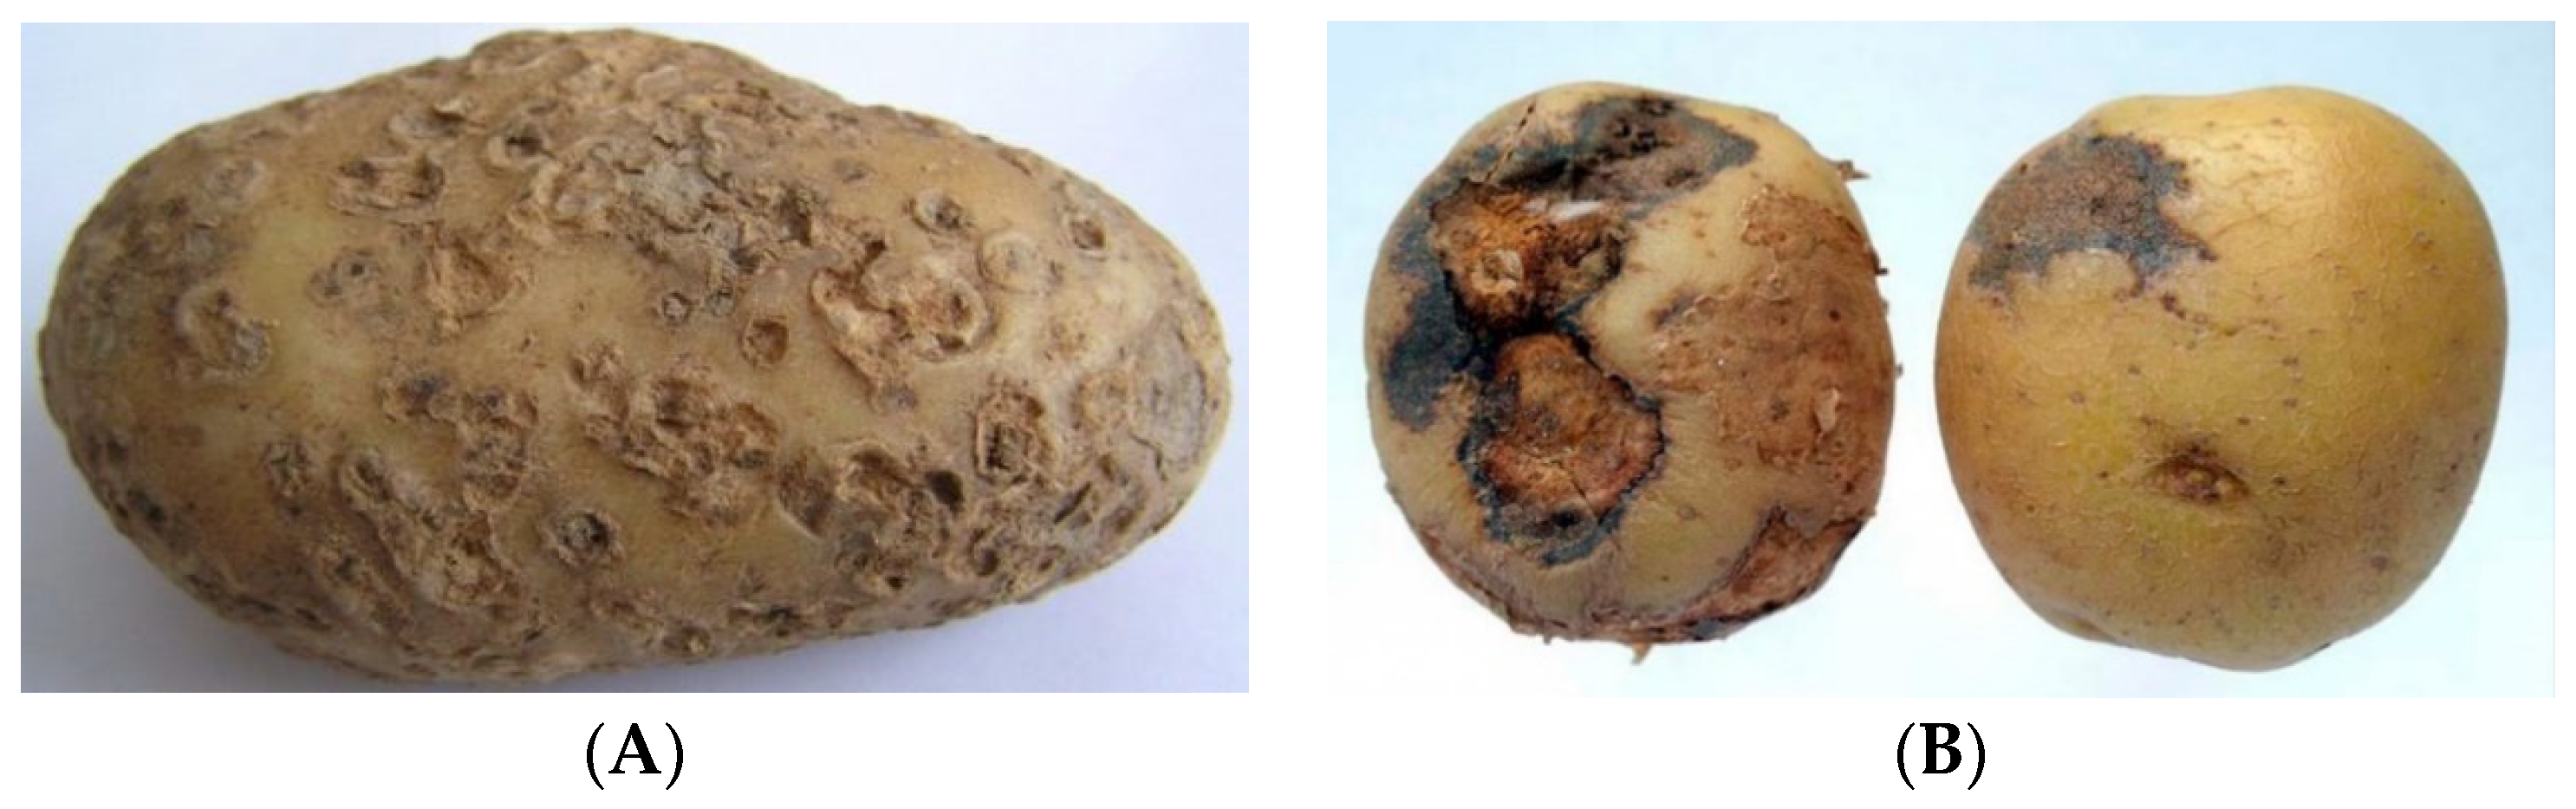
The use of this method is preferable for biological objects without pronounced symptoms of irregularity; for example, apple fruits. The use of the variant with scattered light/multiple light sources (
Figure 5B) implies the implementation of technology for scanning biological objects with pronounced features of fruit/tuber deformation. The implementation of the technology through the use of a diffused light source provides the diffuse illumination of a biological object with pronounced symptoms of rarefaction on the surface of a biological object—in this case, potato tubers, due to the presence of signs of disease on the potato peel, as well as their deformation (
Figure 6).
The computer used for calculation had the following characteristics: the amount of video memory was 8 GB; the number of CUDA cores was 1664; the amount of RAM was 12 GB; and the processor was an Intel Xeon 2.20 GHz. A library consisting of 3731 photographs of diseased potato tubers and 1520 photographs of infected potatoes of three varieties, “Nevsky”, “Red Scarlet” and “Nadezhda”, was used as a training sample.
The constructive scheme of the prototype optical system for identifying the micro- and macrodamage of plant tissues with an orienting module is shown in
Figure 7, and allows the scanning of biological objects from different angles while synchronizing the optical system with the movement of a biological object along the working surface.
To improve the image quality, both when taking a conventional image and in fluorescence spectroscopy, illumination systems for a biological object are provided, as well as the other optical elements necessary to improve the quality of an image or spectra taken (light filters, lenses, etc.), with the possibility of rotating a biological object 360 degrees around the axis as a result of the action of the rollers of the orienting module on the tuber/fruit, providing simultaneous translational and rotational movements.
The algorithm for analyzing the obtained spectral images of potato tubers and apple fruits for the recognition of objects [
6,
8], their shape, and damage to the products requires the implementation of the following stages of work:
Install the optical system relative to the working surface of the rotational motion;
Perform the installation of the focusing of the lens of the optical system relative to the roller surface by recognizing the “standard” of a biological object;
Ensure that the recognition record of the “reference” of a biological object (“white reference”) is installed in the settings of the optical system;
Perform the recognition of the “reference” of a biological object (“white reference”);
Disable the recording of the recognition of the “reference” of a biological object (“white reference”) in the settings of the optical system and close the lens with a black cover;
Set the focusing of the lens of the optical system relative to the roller surface by recognizing the “reference” of the biological object (“black reference”);
Disable the recording of the recognition of the “reference” of a biological object (“black reference”) in the settings of the optical system and close the lens with a black cover;
Remove the cover from the lens of the optical system and place the biological identification object;
Ensure the installation of “raw images” in the optical system settings, disable “black reference”;
Set up the optical system for shooting by time/number of frames;
Start the process of scanning the biological object of the optical system:
Provide power to the main software and hardware of the optical system for identifying micro- and macrodamage to plant tissues from the AC network;
Turn on the rotary motion drive of the orienting module when the circumferential speed of movement is changed by the frequency converter.
Enable the required lighting mode and time interval using a programmable microcontroller, with a point light source (
Figure 5A) and diffuse illumination (
Figure 5B).
- 12.
Start the process of identifying the diseases of apple fruits and potato plants using the “Disease Identifier” program, select files (a photographic image of the fruit) for analysis from the folder with the current date in the name using the “Open” button in the graphical interface of the software, and press the “Start” button in the graphical interface of the program;
Perform sampling of spectral data from hypercubes and placement of point areas of diagnostic interest;
Formalize the parameters for assessing the photometric quality of spectral images according to the main criteria;
Classify damaged and healthy fruits/tubers based on machine learning;
- 13.
Obtain the recognition result and a probabilistic assessment of the identified object’s compliance with the established category;
- 14.
Disconnect the power supply of the main software and hardware of the optical system for identifying micro- and macrodamage to plant tissues from the AC network.
Using fluorescence spectroscopy, the following experimental setup options are possible:
- –
Using broadband lamps (a short-pass filter is located between the source and the object (λ ≤ 400 nm, λ may vary depending on the excitation length), and a long-pass filter (λ ≥ 400 nm) is located between the fetus and the camera);
- –
Using a laser source (a mechanical shutter is needed only in the case of a permanent laser source radiation).
The preparation of equipment for the implementation of the technology includes the following requirements:
- (1)
When shooting with multispectral or hyperspectral frame cameras:
The optical axis of the camera is directed normally to the conveyor belt or coordinate table.
The distance from the front lens to the shooting objects is 0.3–0.5 m.
The illumination level is controlled by the reflection of the white body from the spectrometer kit (no illumination according to the display on the device screen).
Shooting mode—automatic, frame-by-frame, 3–5 frames/s.
- (2)
When shooting with a linear scanner:
The optical axis of the camera is directed normally to the conveyor belt or coordinate table.
The distance from the front lens to the shooting objects is 0.3–0.5 m.
The illumination level is controlled by the reflection of the white body from the spectrometer kit (no illumination by indication on the control computer screen).
Spectral resolution—4 nm/channel.
The shooting mode is continuous.
Technology implementation:
Calibration.
Selection of fruits/tubers for the calibration dataset.
To obtain calibration images, two categories of fruits are selected: healthy fruits/tubers (without visible symptoms of damage) and fruits/tubers with varying degrees of damage, which are evaluated visually.
It is important to include fruits/tubers with varying degrees of manifestation in the calibration set damage (determined by severity and surface area occupied by damaged tissues).
If the fruits/tubers of this variety have anthocyanin (red color), it is also necessary to include in the calibration set fruits and tubers colored to varying degrees, both with and without damage.
Data on an objective assessment of the degree of damage development (for example, in points) are entered into a spreadsheet. Note the maximum value acceptable for commercial fruits/tubers.
Obtaining a calibration dataset.
Hyperspectral shooting of fruits/tubers is carried out with a hyperspectral frame camera. Images of fruits/tubers can be obtained both before the removal of fruits from the tree/extraction from the soil, and after in the laboratory.
During the shooting of fruits under artificial lighting, it is necessary to adjust the exposure correctly in order to avoid “illumination” and, as a consequence, distortion of the reflection spectra.
When shooting fruits or tubers separated from a tree in a laboratory or in a fruit storage facility, it is necessary to use a light source that emits a sufficient amount of energy in the visible and near-infrared range. Standard fluorescent light sources are not suitable for this purpose due to their characteristic flickering with a frequency of 50 Hz. When working with a hyperspectral camera—a linear scanner, and not with a frame camera—it is necessary to use stands with a movable table to form images of objects.
After receiving the images, it is necessary to selectively control the reflection spectra by shape and amplitude. With significant distortions in the shape of the reflection spectra, the survey is repeated, eliminating the cause of the distortion. The most common causes of distortion are incorrect exposure settings and an unfocused hyperspectral camera lens.
Processing of the calibration dataset.
Images are segmented (marked up) manually, and individual fruits and tubers are highlighted in them, using which the values of an objective assessment of the severity of damage are compared (see point I.1.d).
The index values for the areas of interest containing fruits from the calibration set are averaged (see clause I.3.a), and the values are entered into a spreadsheet. By interpolation, the value of the mBRI index is determined, corresponding to the previously accepted maximum for commercial fruits (see clause I.1.d).
Assessment of the condition of fruits/tubers.
Hyperspectral images of onion/tubers are obtained, the assessment of the condition of which is required when performing the actions listed in paragraph I.2 above. The resulting images are marked up and processed as described in paragraph I.3 above.
Technology for obtaining hyperspectral and RGB images from different angles.
Hyperspectral images were obtained on a prototype optical system in daylight in combination with four halogen incandescent lamps equipped with diffusers to avoid glare on the surface of the object. The resulting hypercubes were processed using the original Gelion software (
https://gelion.agro.msu.ru/ accessed on 30 April 2023), as well as the original Python 2 scripts.
Specific processing steps included the elimination of background pixels (creation of a mask using the spectral criterion) and the elimination of spectra with artifacts (creation of a mask of defective pixels using the spectral criterion)—see criteria 1–5 above.
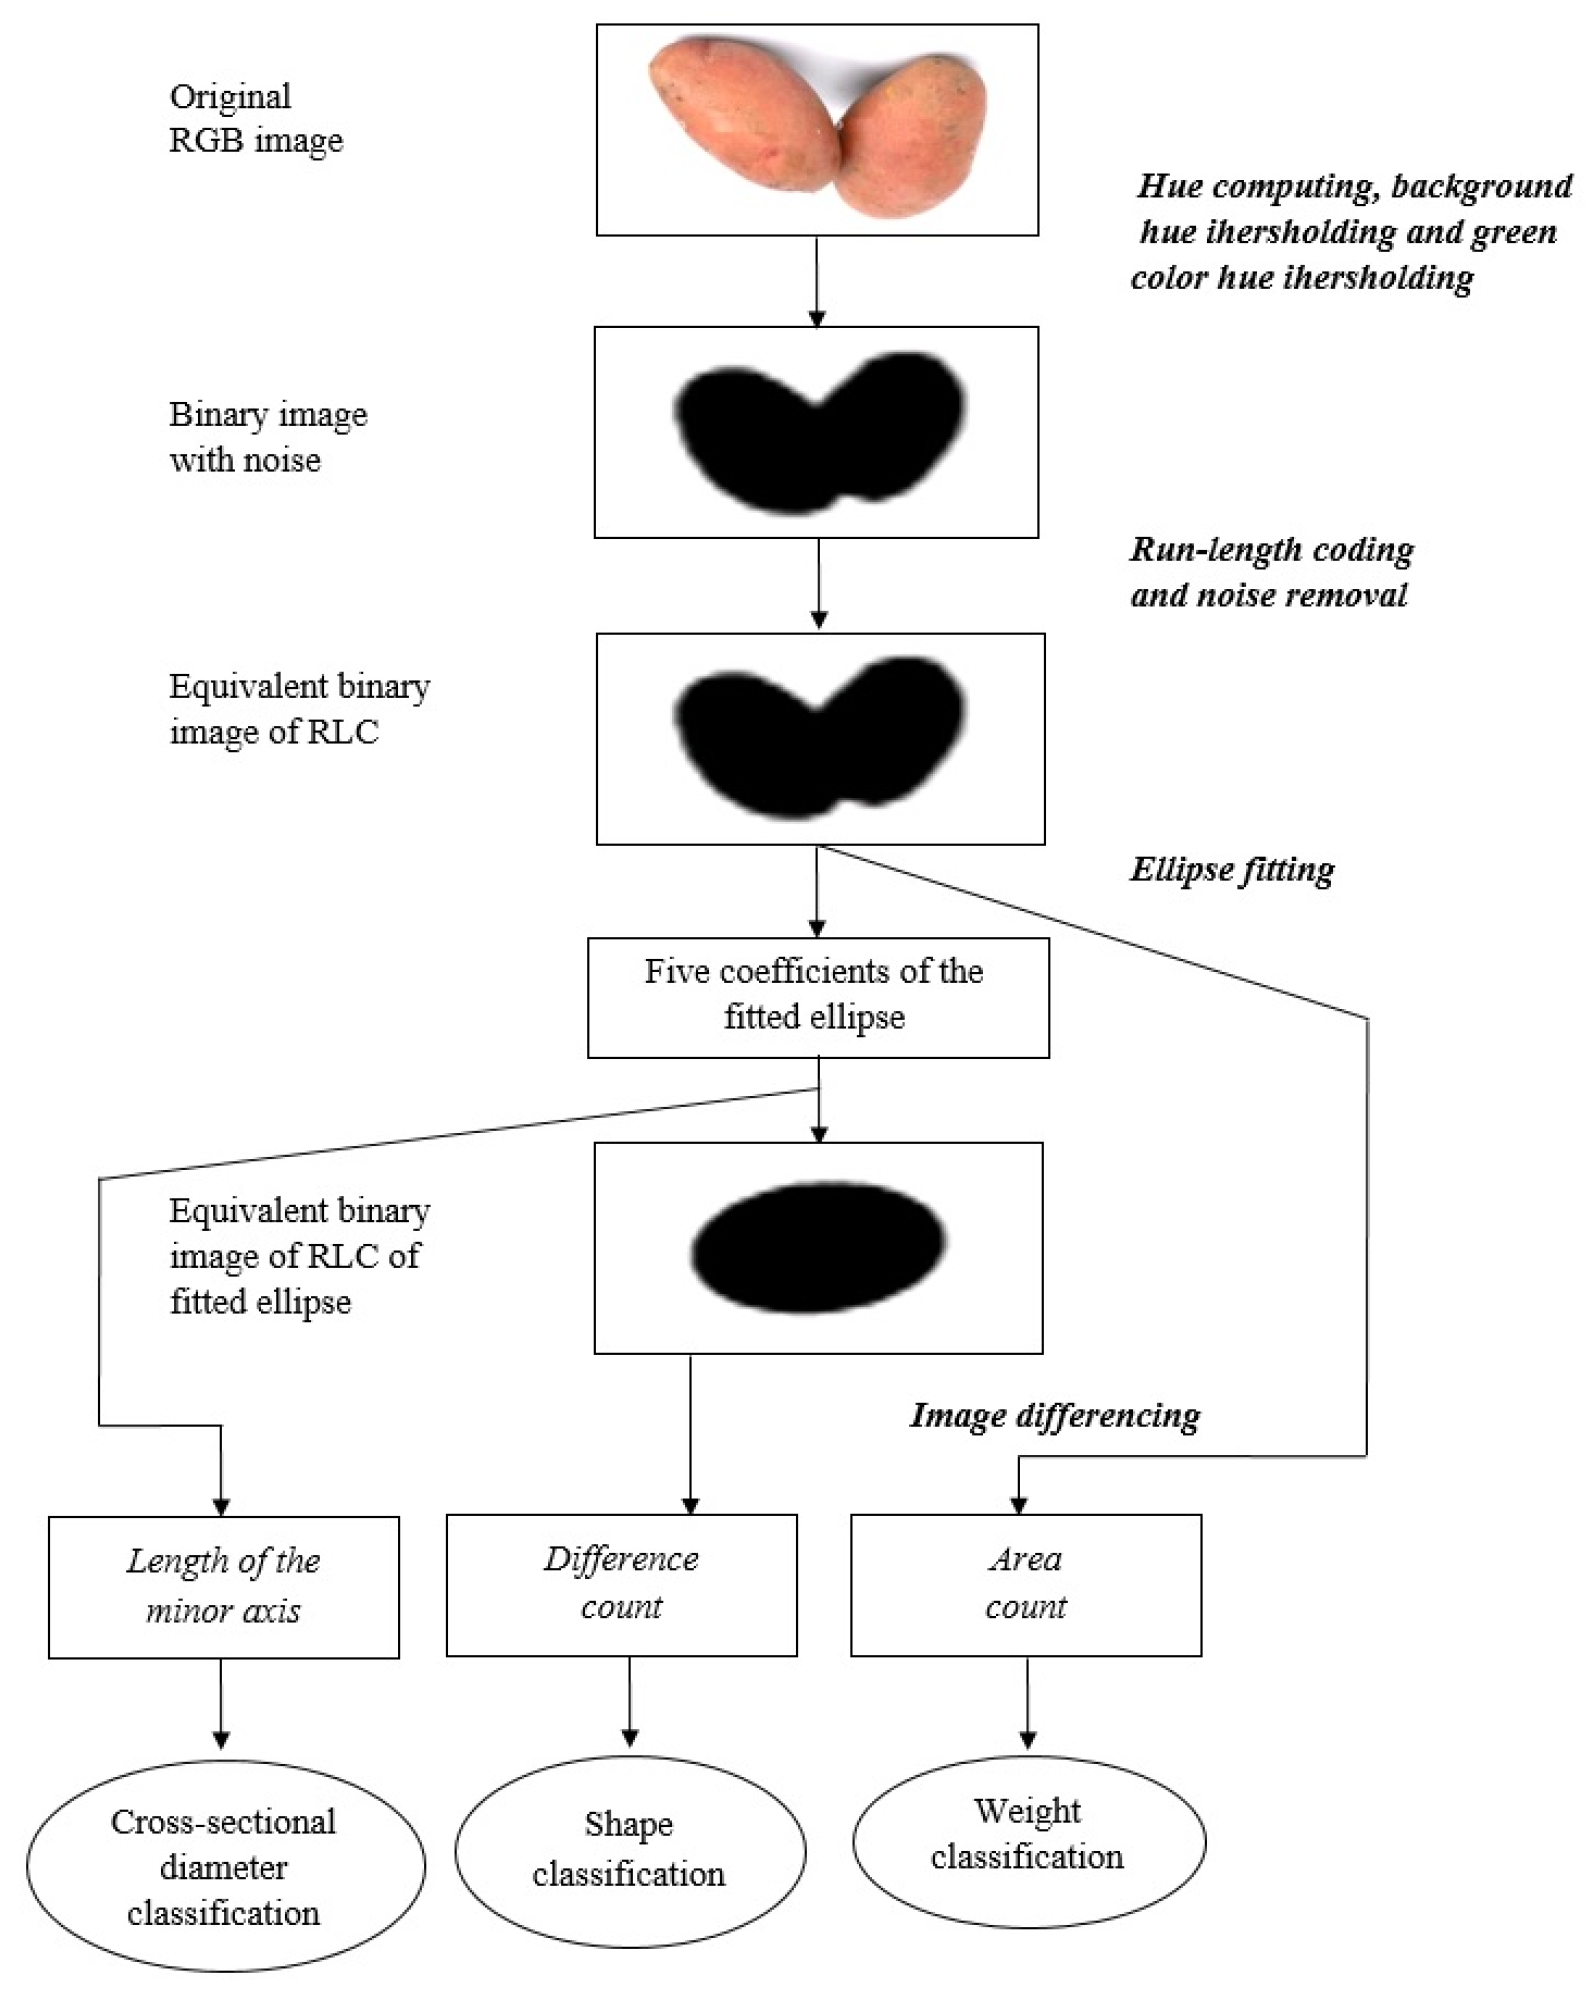
This study is aimed at creating approaches to the interpretation of these dimensional characteristics of potato tubers that are characteristic of high-quality sorting and various types of damage (
Figure 8).
3. Results and Discussion
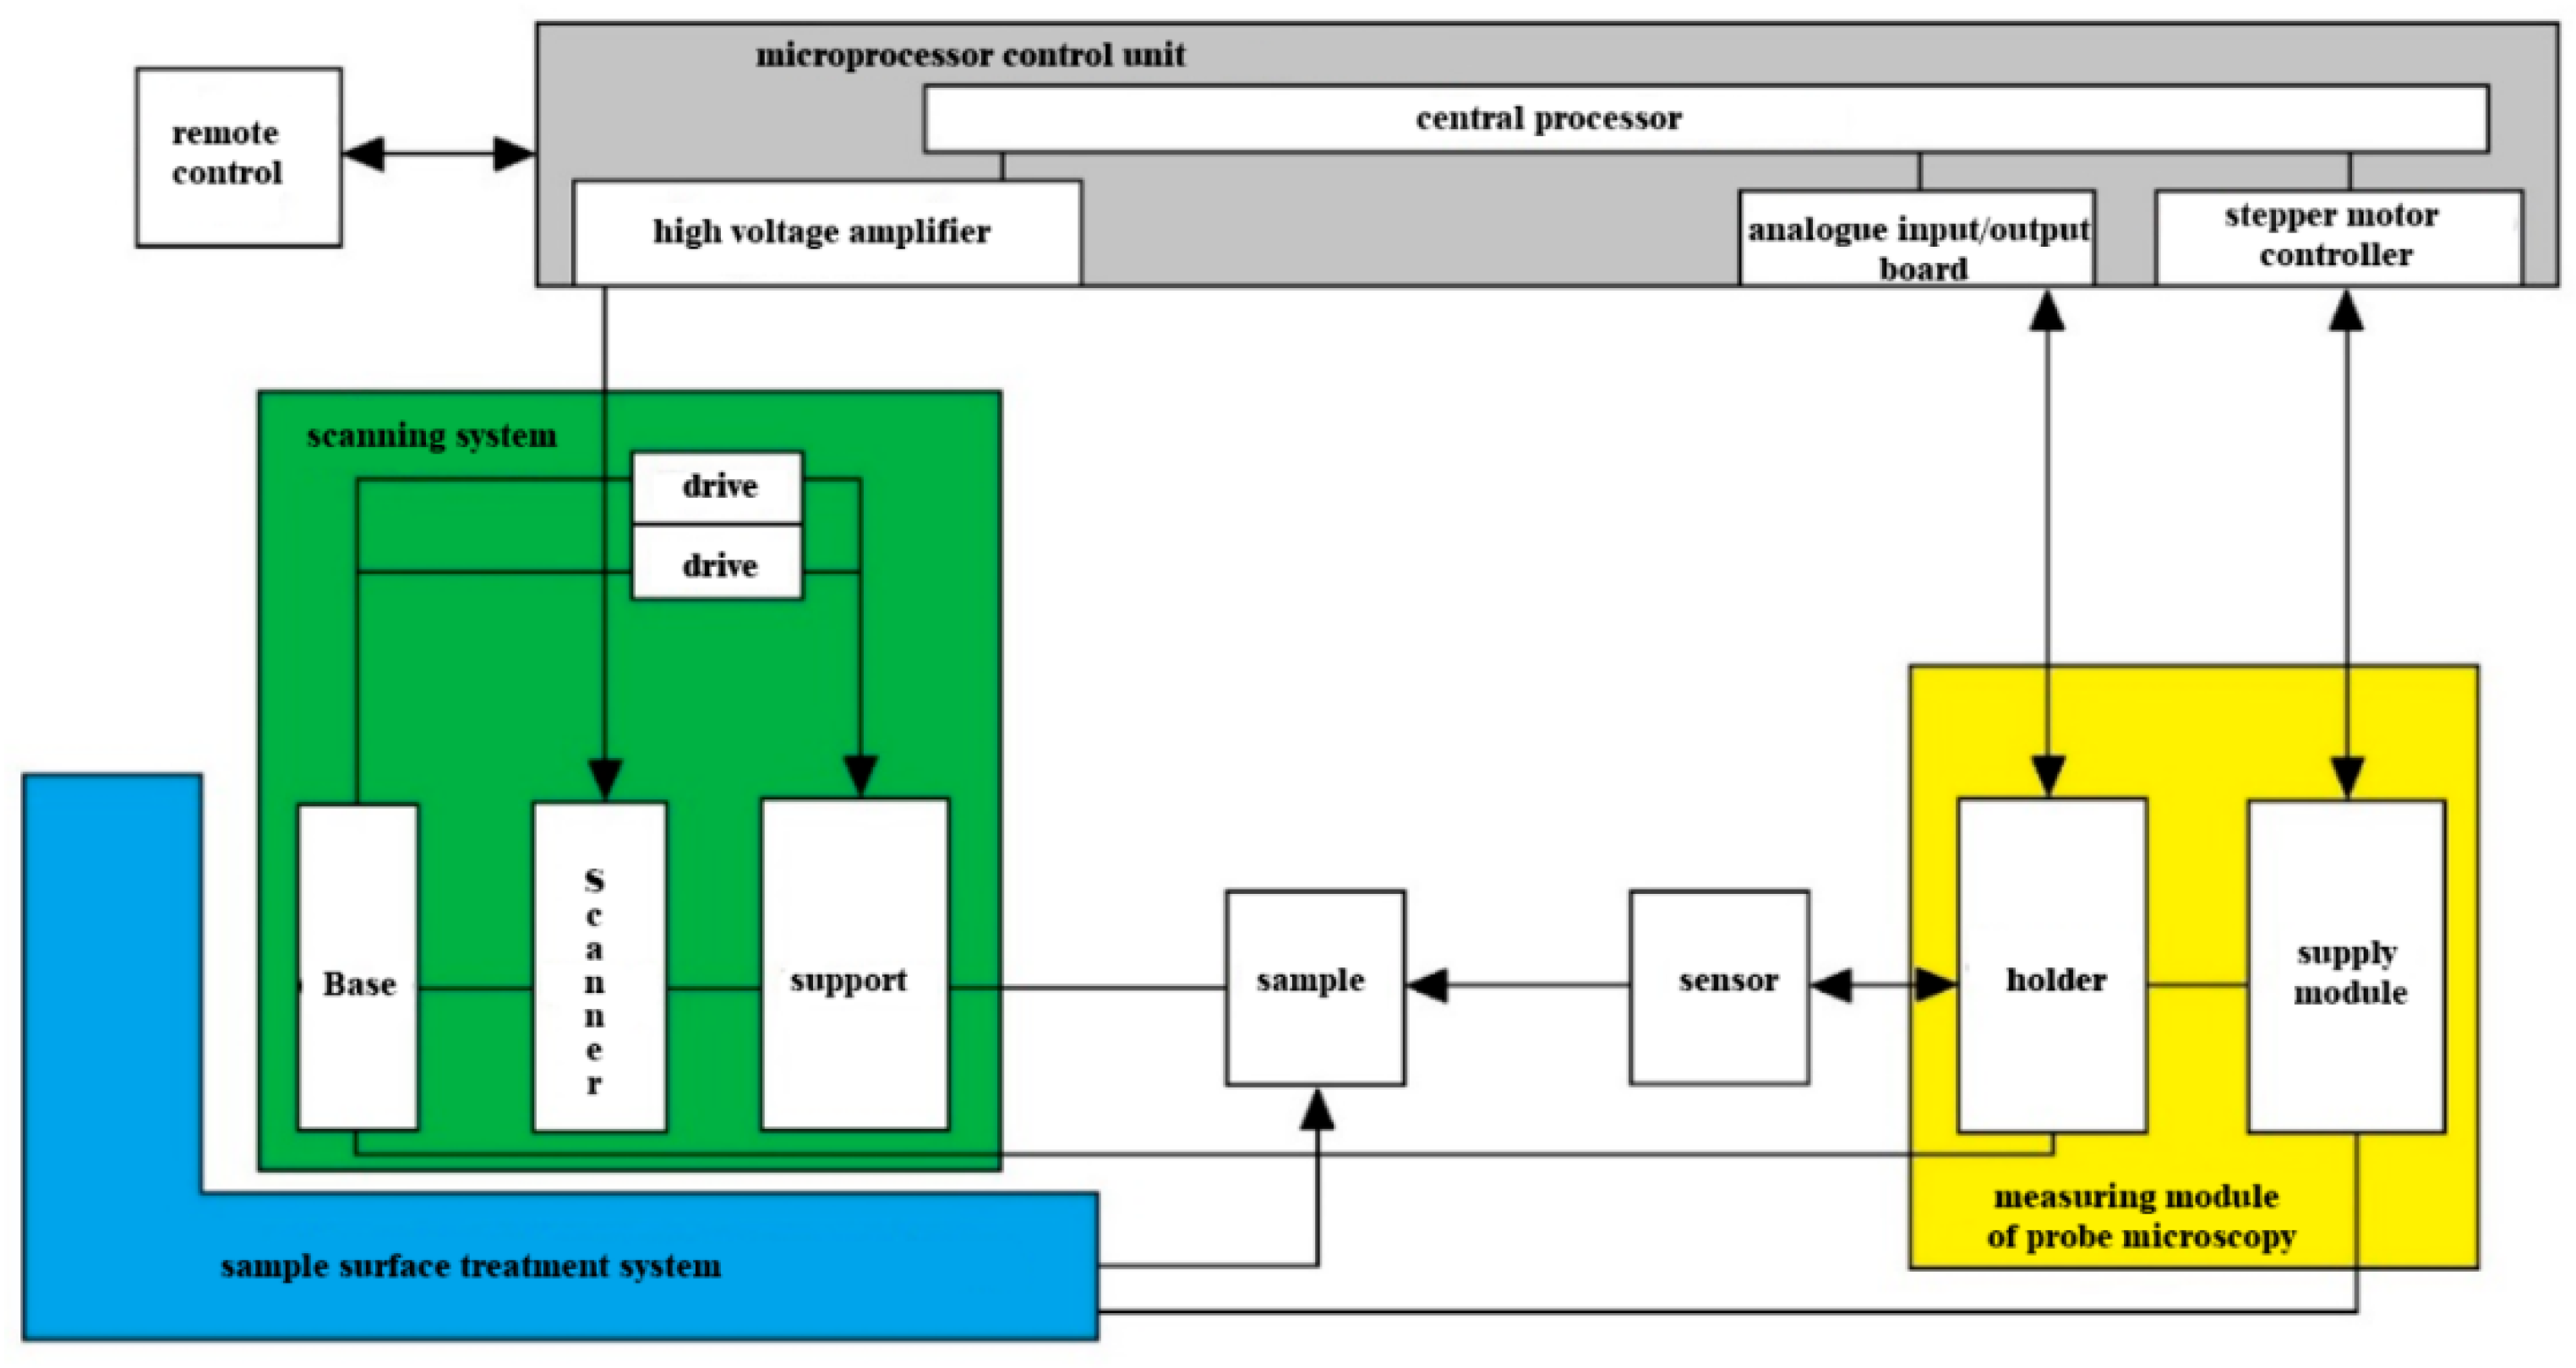
The main feature of the proposed technology is the possibility of performing a series of sequential measurements of the surface after scanning the biological object under study from different angles and restoring its three-dimensional visualization, which has the following basic characteristics: (1) the possibility of measurement by the main scanning methods (topography, phase, and amplitude contrast) of the surface of biological samples; (2) the coordinated functioning of scanning for the possibility of the three-dimensional reconstruction of the structure of samples based on sequential measurements; and (3) ensuring sufficient resolution and the scanning noise level necessary to study the ultrastructure of cellular macro- and microcarriers. This technology allows us to obtain new visualized scientific results regarding the three-dimensional organization of biological objects. In addition, it will allow us to expand existing ideas about the features of the tissues of biological objects represented by apple fruits and potato tubers. The scanning system for apples and potato tubers should consist of a measuring module and a microprocessor control unit for the coordinated execution of operations and measurements.
The microprocessor control unit must be connected via a USB 2.0 interface to the control computer (
Figure 9).
The microprocessor control unit consists of the following functional units: (1) analog I/O board; (2) synchronous detector; (3) central processor; (4) high-voltage amplifier; (5) stepper motor controller; and (6) power supply. The microprocessor control unit is designed to perform the main tasks necessary to ensure the functional execution of the scanning process of apples and potato tubers: (1) control of the scanner for scanning the sample; (2) data collection and synchronous detection from the scanning device; (3) maintaining the sample probe feedback in various modes; (4) control of the supply stepper motor; and (5) providing an interface with the control computer.
The probe holder of the measuring module should be placed on the guides of the scanning system and brought horizontally to the surface of the sample for scanning. It is necessary to use a hyperspectral detector as a scanning device, which will make it possible to exclude from the design the optical system for registering probe deviations that is typical for scanning and ensure the functioning of the scanning system [
20,
22]. The architecture of the complex and its assembly units described above makes it possible to ensure the functioning of the complex in terms of scanning biological objects from different angles according to the following basic scheme. The biological sample should be distributed on the working surface of the scanning device. Next, the scanning system is supplied, fixed in the holder to the surface of the sample.
As a result, a subset of pixels with the correctly measured spectra of a plant object (fruit) was formed from each cube, suitable for further classification and software processing, which included the following steps:
Calculation of spectral indices according to the list for the selected pixels of each hypercube. Set of indexes for calculation [
19]:
Result: index values + index images for each “derived” cube and each index.
- 2.
Analysis of the distributions of calculated indices: histogram analysis; calculation of average index values for classes with an interval of 0.5; calculation of descriptive statistics; determination of the reliability of interclass differences; and determination of threshold values (classification criteria).
- 3.
Validation of the developed criteria: formation of a sample of data for validation (30% of the total number of cubes); processing and calculation of criteria values; and reconciliation of the results of automatic classification with expert evaluation.
- 4.
Formation of the final list of criteria for the classification of fruits according to the scheme “healthy—damaged”.
The initial dataset consisted of 100 hyperspectral images of apple fruits, 60 of which were marked as healthy, and 40 as damaged. Additionally, according to synthetic RGB images, the expert marking of images into three classes was carried out: healthy tissues, damage, and background. At the same time, the total share of the damage area was 1.76%, and of whole apple tissue was 18.24%.
To train the math models, the original dataset was split in a ratio of 80:20, while maintaining the proportion of healthy and damaged fetuses in each part. A sample of 80% was used for training; accuracy assessment was carried out both for the entire set and for the remaining 20%. Spectra were randomly extracted from the test sample as follows: for each image, all spectra were divided into spectra of healthy tissues (“healthy”), damaged tissues (“damaged”), and background (“background”) using expert markup, and spectra for training were randomly extracted from the obtained arrays. Two approaches were used—class balancing (at the same time, an equal number of spectra were extracted from each class, not exceeding 1000; for healthy potato, no spectra were extracted) and the proportional construction of a training sample (at the same time, the number of spectra proportional to the occurrence of this class in this image was extracted from each class, with a sum of 3000 spectra per snapshot). These strategies are indicated on the charts as “balanced” and “proportional” [
16,
18].
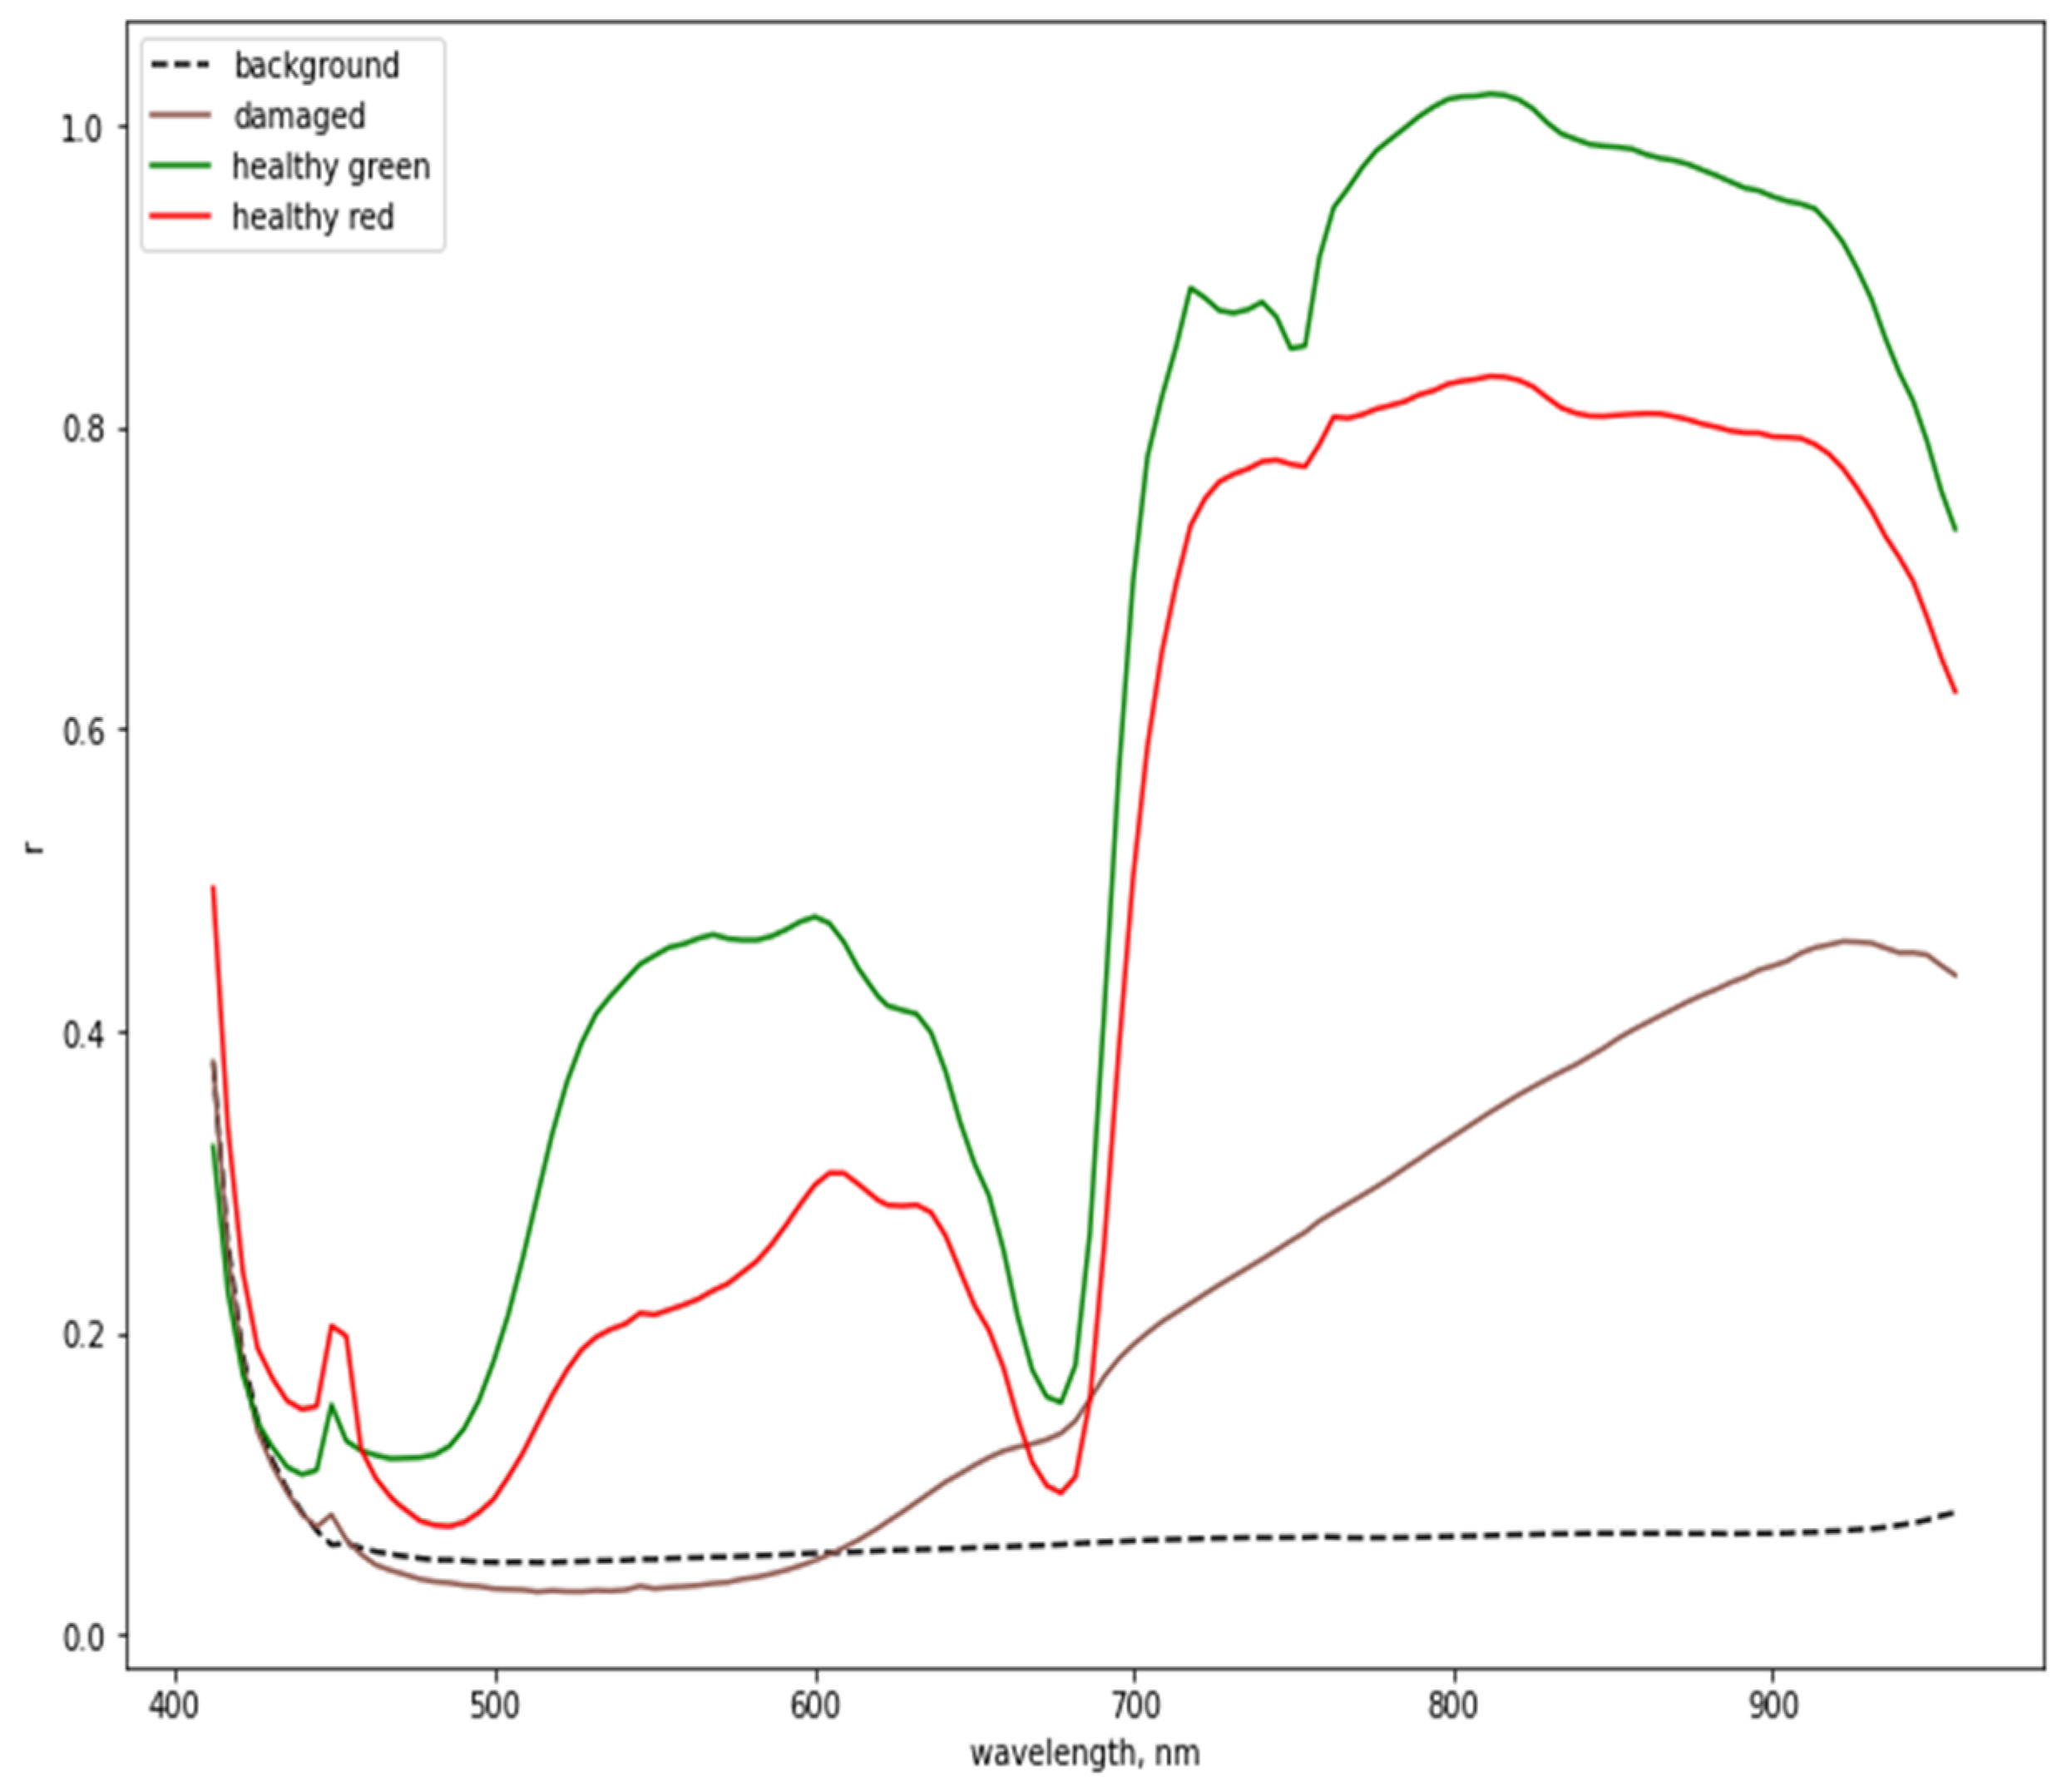
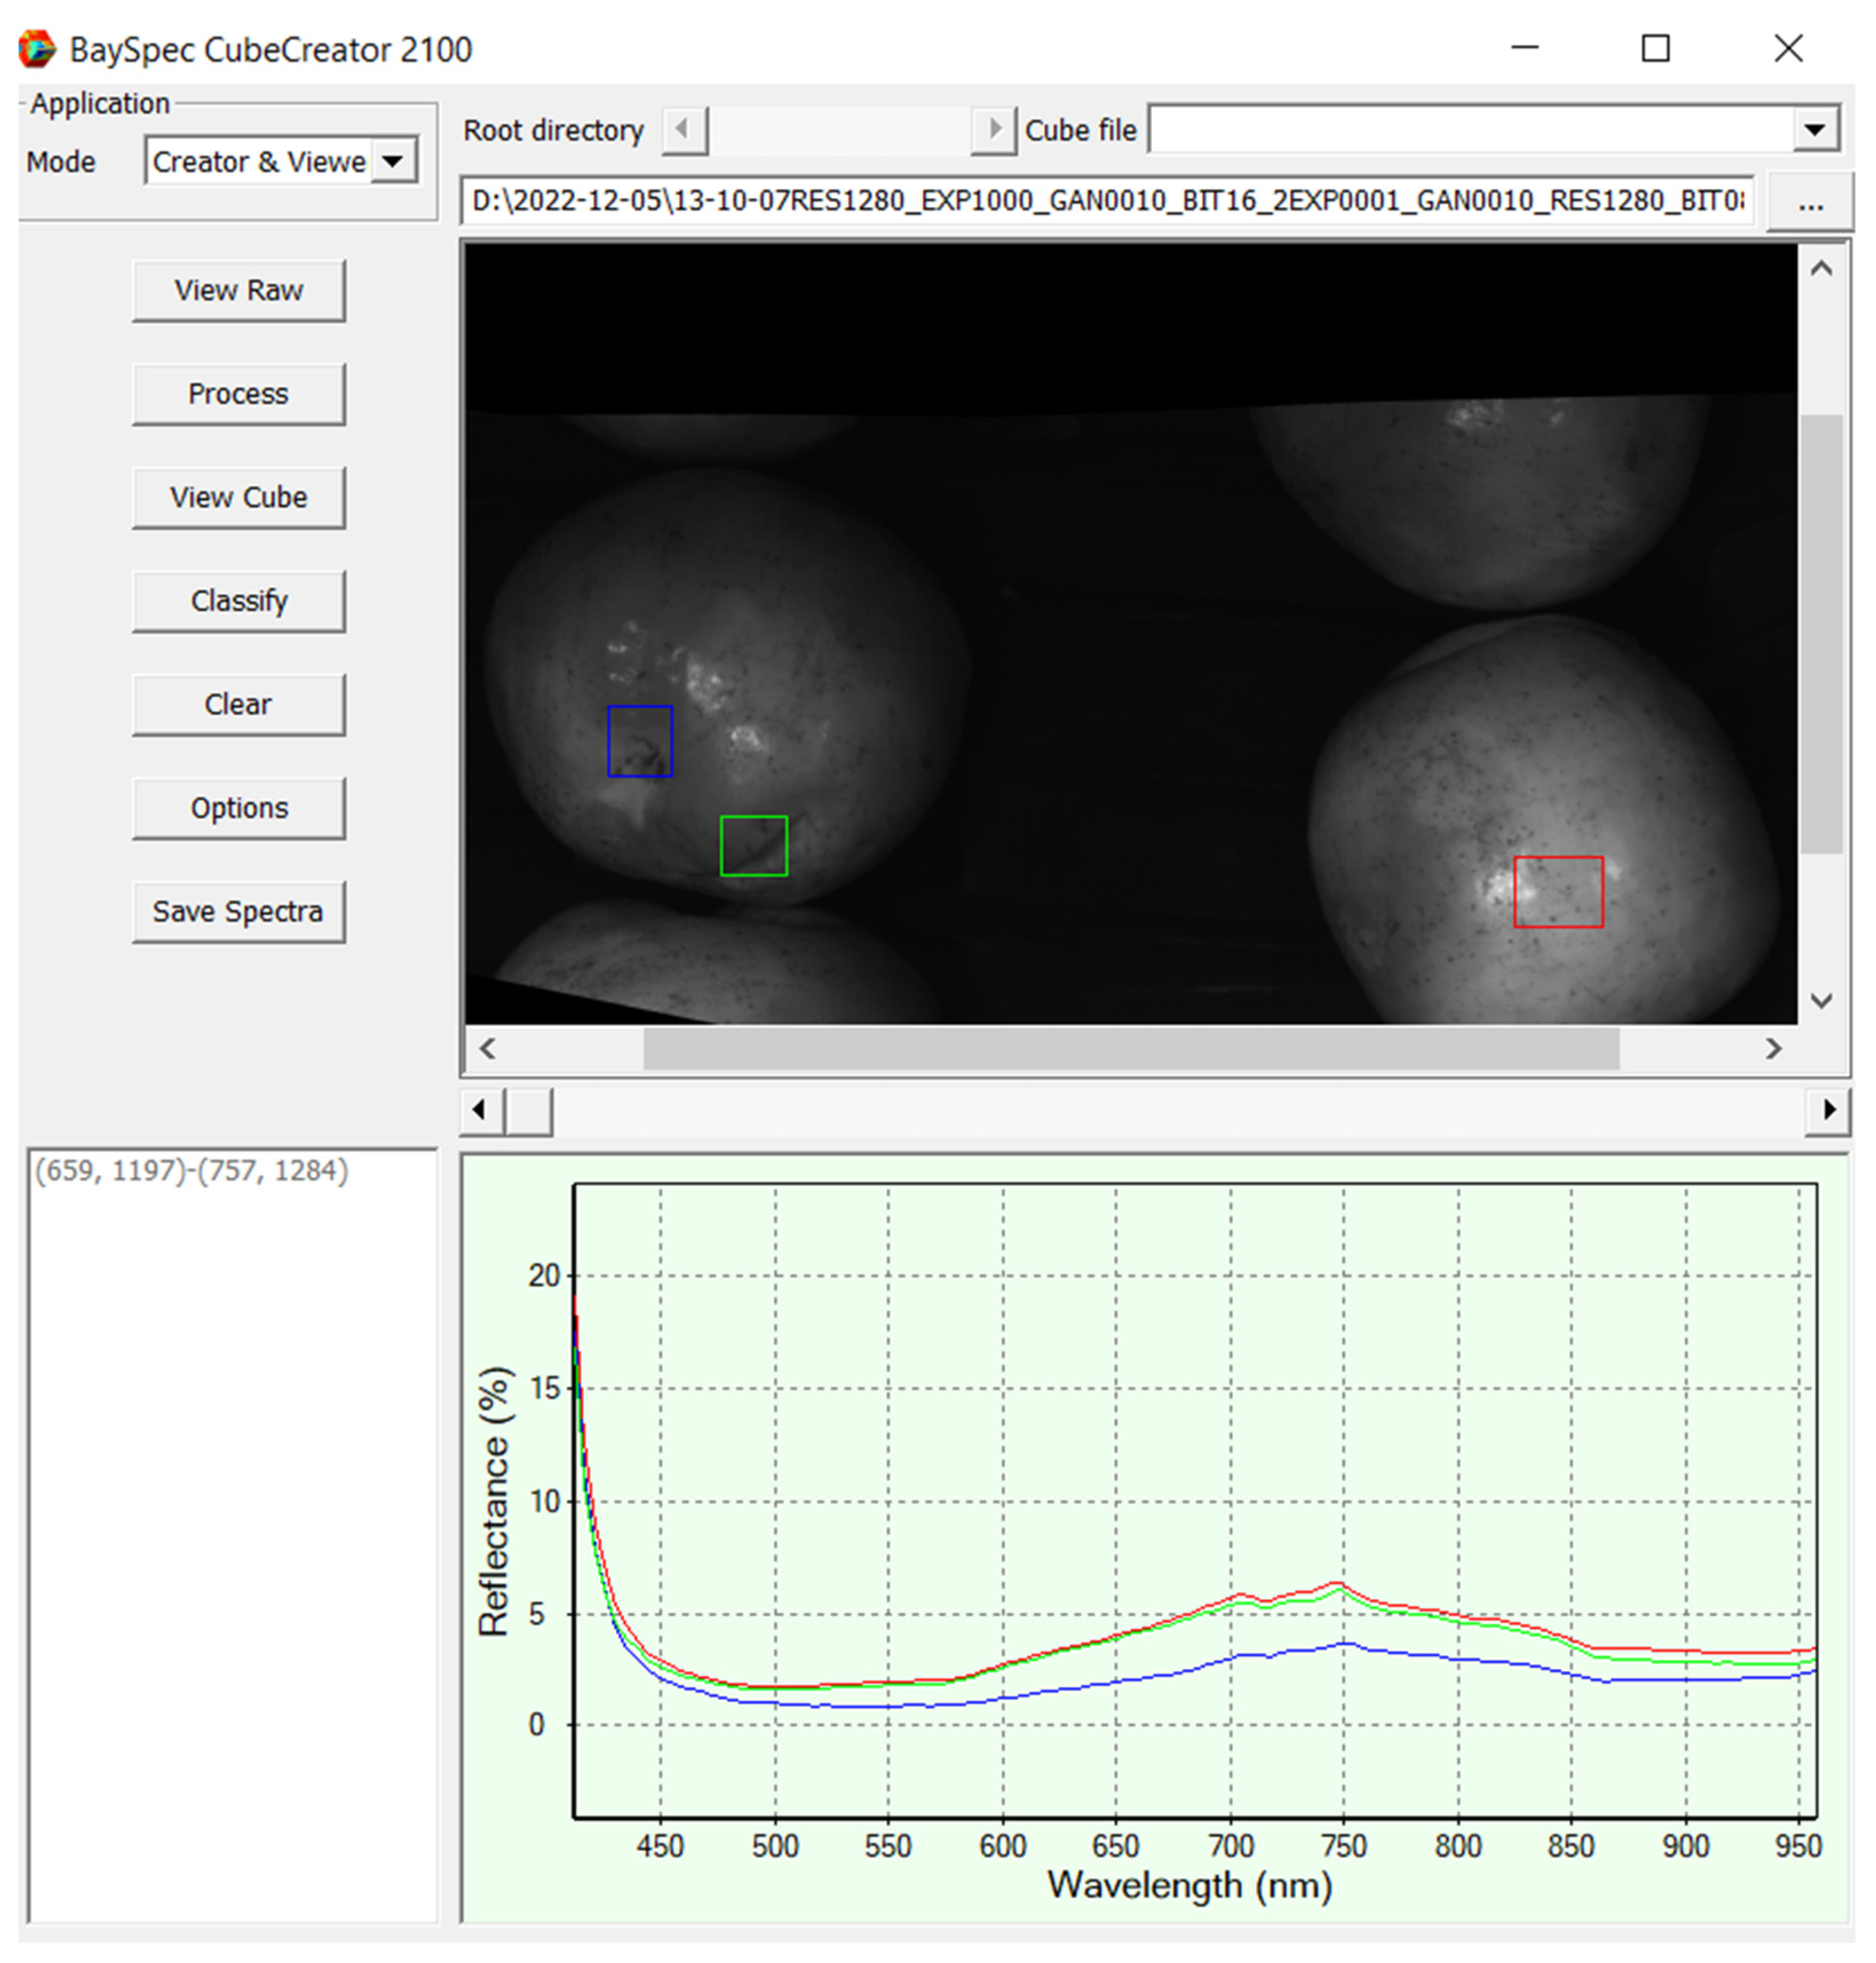
For the spectral angular classifier, the spectra manually marked up by representative image regions and shown in
Figure 10 were used (a total of four spectra—background, damage, healthy tuber No. 1, and healthy red tuber No. 2).
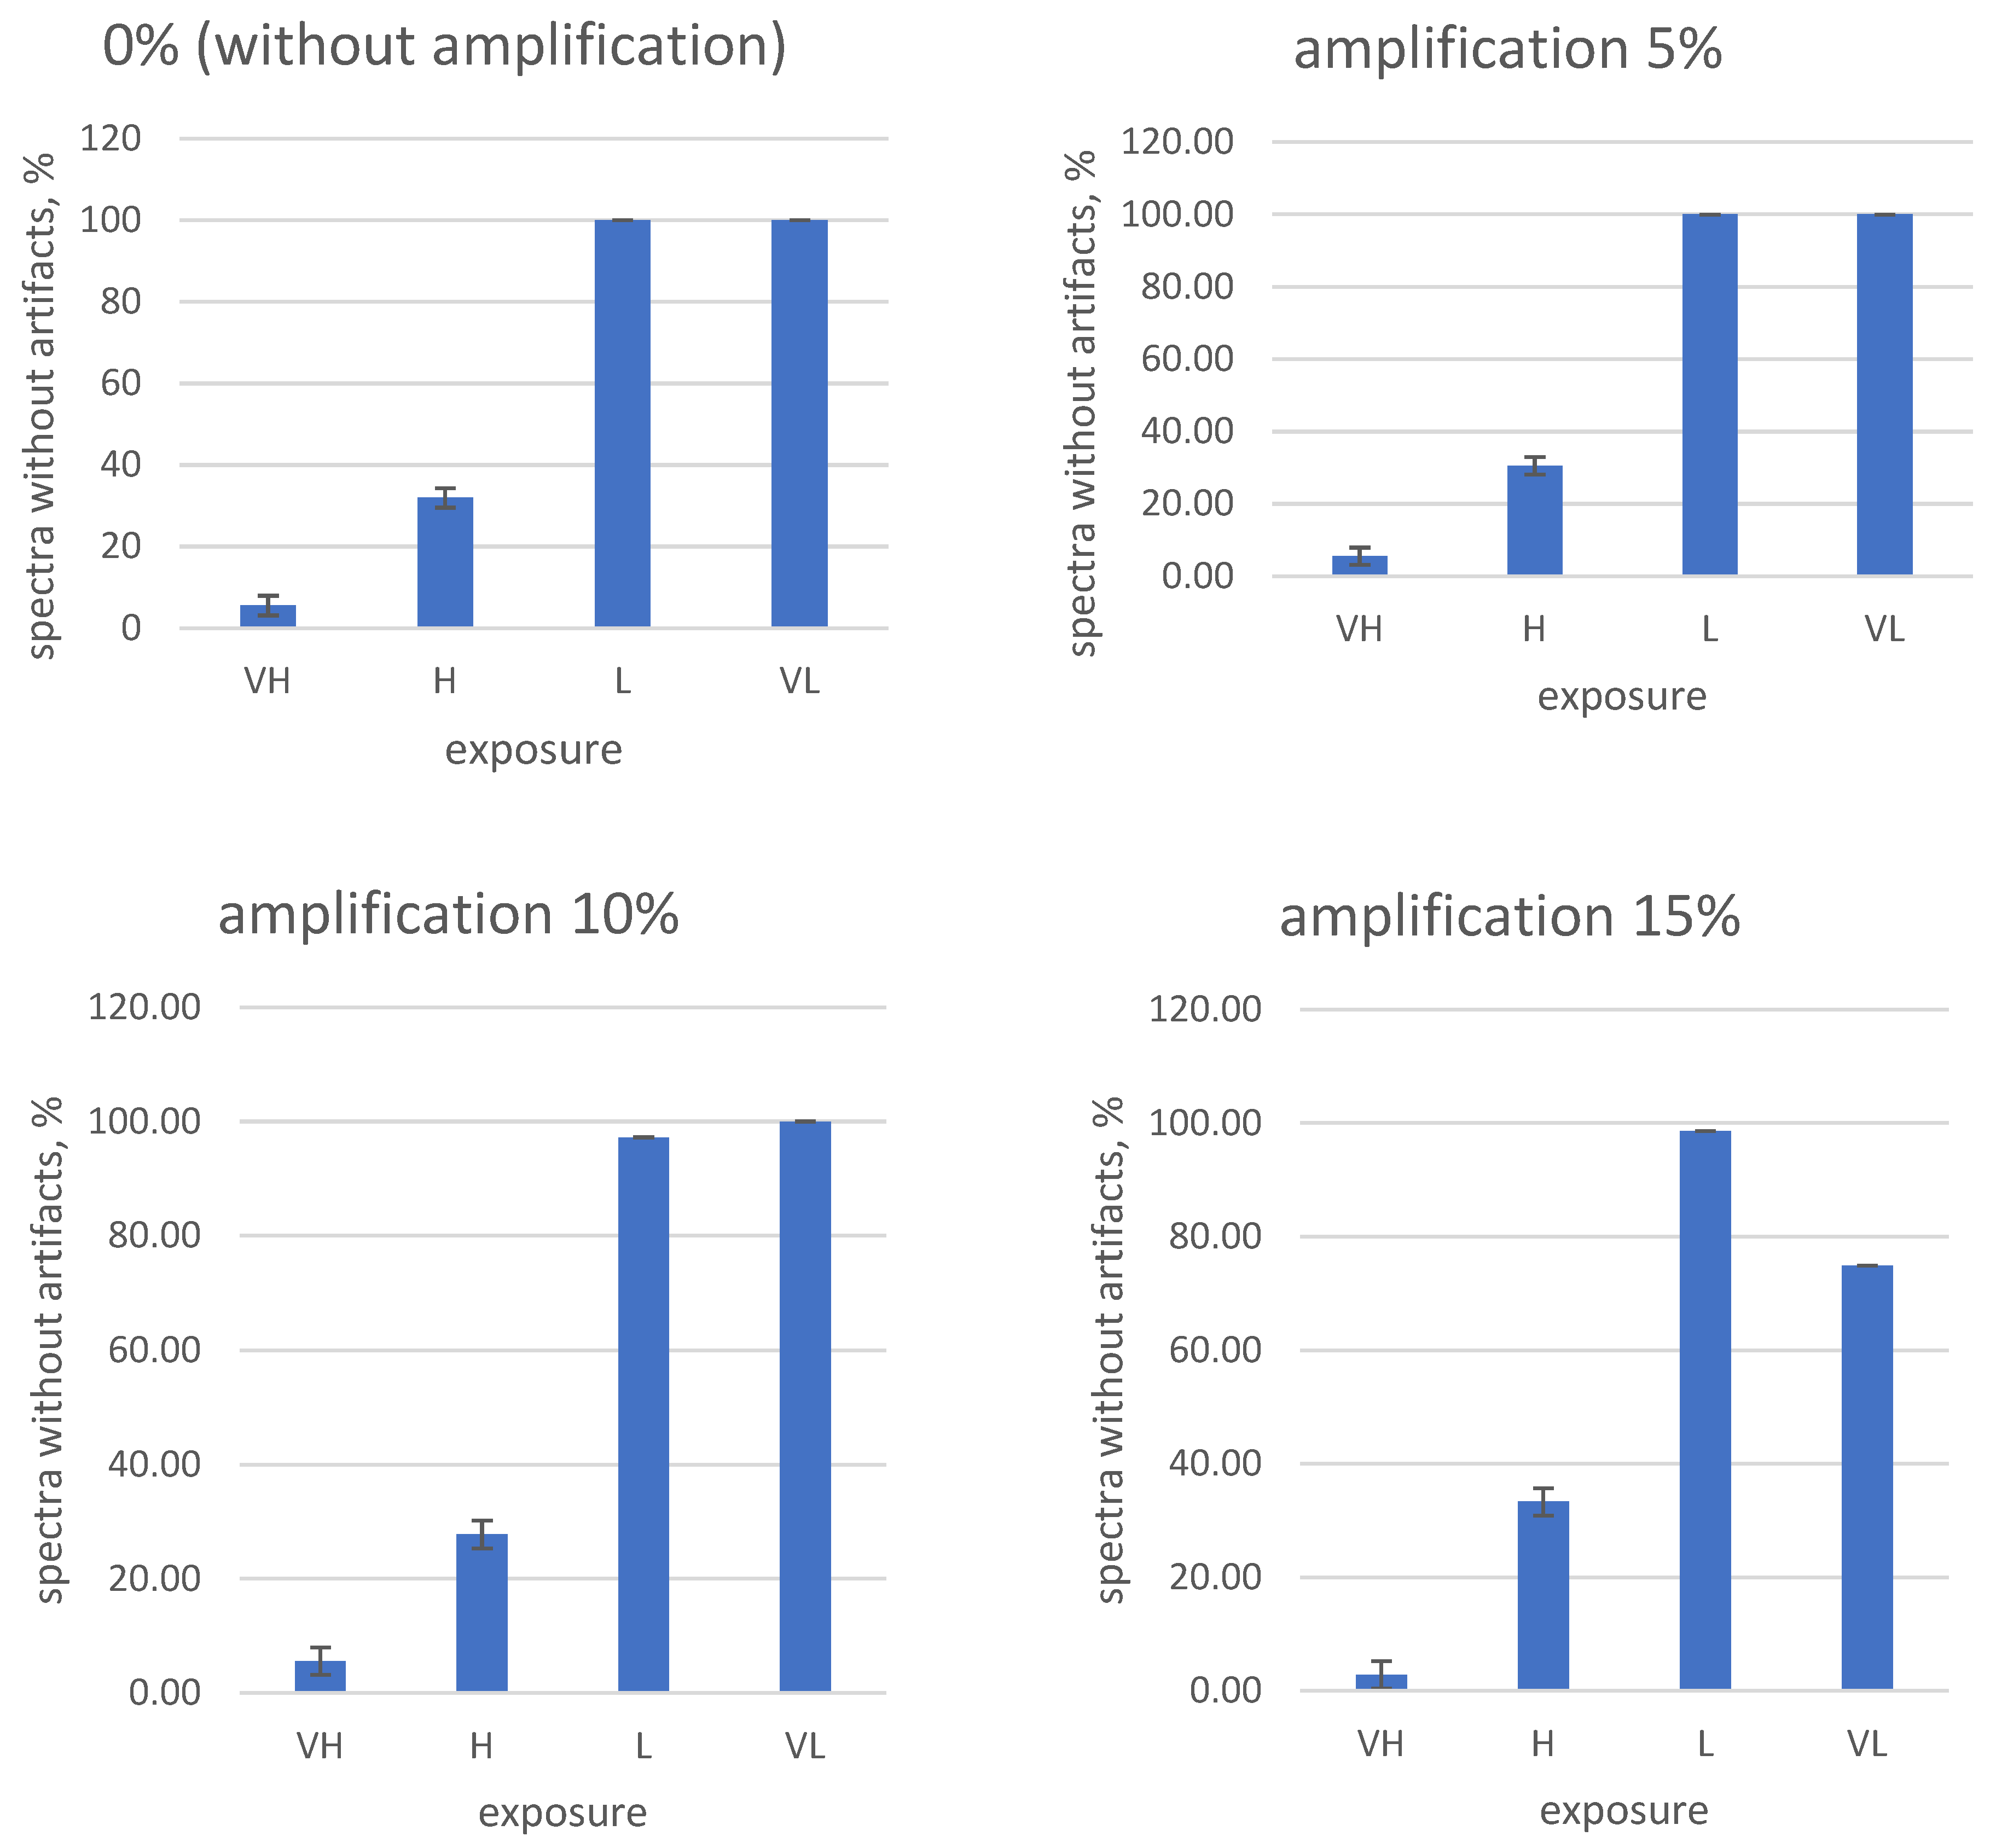
Paying attention to the frequent occurrence of artifacts when shooting hyperspectral images of fruits and tubers, the need for a systematic selection and search process for the correct shooting parameters is obvious. To solve this problem, test measurements were carried out, in which the exposure and digital amplification values are in the control software of the hyperspectral camera. A total of 16 parameter combinations (0, 5, 10, and 15% digital amplification and fixed exposures VH (very long), H (long), L (short), and VL (very short)) were studied for three fruit types (tuber No. 1 and No. 2, damaged). The results are shown in
Figure 11,
Figure 12 and
Figure 13.
From the obtained data, it is obvious that high exposure and amplification values in the settings of the hyperspectral camera lead to an increase in the frequency of artifacts in the measured spectra.
On the contrary, the complete disabling of digital amplification and exposure reduction in our experimental conditions led to the almost complete disappearance of artifacts (
Figure 11 and
Figure 12). Taking into account the obtained results, for the further shooting of fruits on the stand, the following camera settings were used: 0% amplification (digital amplification disabled) and “very short” exposure (code—VL).
As a result of the work, a reference database was formed containing hyperspectral images (hypercubes) of representative healthy and damaged fetuses, containing data on the healthy and damaged areas of the fetus. Based on these data, CIE RGB images were generated for further analysis. A total of 104 hypercubes were received, and 100 hypercubes were included in the final version of the database [
15,
20].
The results of the research made it possible to develop an optical system for identifying micro- and macrodamage in plant tissues and an algorithm for recognizing potato tubers and apple fruits in express diagnostics, as well as a program for the microcontroller of the main control panel for the process of sorting potato tubers (certificate of state registration of the computer program No. 2022610305).
To ensure the stable operation of the movement of potato tubers/onions on the working surface of sorting, it is necessary that the following condition be met:
where
represent the angular speed of rollers installed in the series, s
1.
In order to ensure the stable operation of the optical identification system with the orienting module, it is necessary that the minimum allowable kinematic mode indicator be greater than the coefficient of friction, i.e.,
where f is the coefficient of abrasion of the tuber/onion on the surface of the roller.
Minimum allowable angular speed of the roller surface:
The frequency of rotation of root crops is determined around its axis:
where t is the roller pitch, m;
is the translational speed of the tuber/fruit, m/s; and D
P is the roller diameter, m.
According to Formula (5), we obtain
The design and technological parameters of the orienting module of the optical identification system are presented in
Table 1.
To achieve the required level of linear scanning, it is necessary to determine the amount of energy passing through a certain surface area of a biological object in a certain period of time:
where J is the intensity of linear scanning, W/m, and t is the irradiation time, s.
To determine the strength of the photocurrent of linear scanning, it is necessary to determine the area of the i-th section of a biological object with a simplified characteristic for an irregularly shaped body:
where
represent the radial and diametrical dimensions of a biological object, m; k
1 is the coefficient of irregularity of the size of a biological object; k
2 is the coefficient of irregularity of the size of a biological object; and n is the number of line scanning sources, pcs.
Taking into account Equation (8), the strength of the photocurrent of linear scanning over the volume of a biological object is as follows:
To carry out the optical imaging of biological objects (apple fruits and potato tubers), it is necessary to justify the scanning device of the developed system. The justification for choosing a scanning device is determined based on the possibility of technical implementation of shooting on a prototype optical system with a choice of the focal length of the camera lens to the biological object under study:
where
is the camera size, mm; and
is the space between the biological object and the camera lens, mm.
In view of the change in the
parameter, taking into account the variation in the focal length of the lens and the eyepiece with respect to the biological object, the desired value will be written in the form
where
is the lens focal length, mm, and
is the eyepiece focal length, mm.
Taking into account Equation (11), the focal length of the camera lens with respect to the biological object under study is
Due to the fact that the identification of infected biological objects must be performed in the traffic flow with a minimum exposure time of object recognition in the range of up to 1 s, when obtaining hyperspectral images in the flow, it is necessary to justify the scanning device [
19,
21].
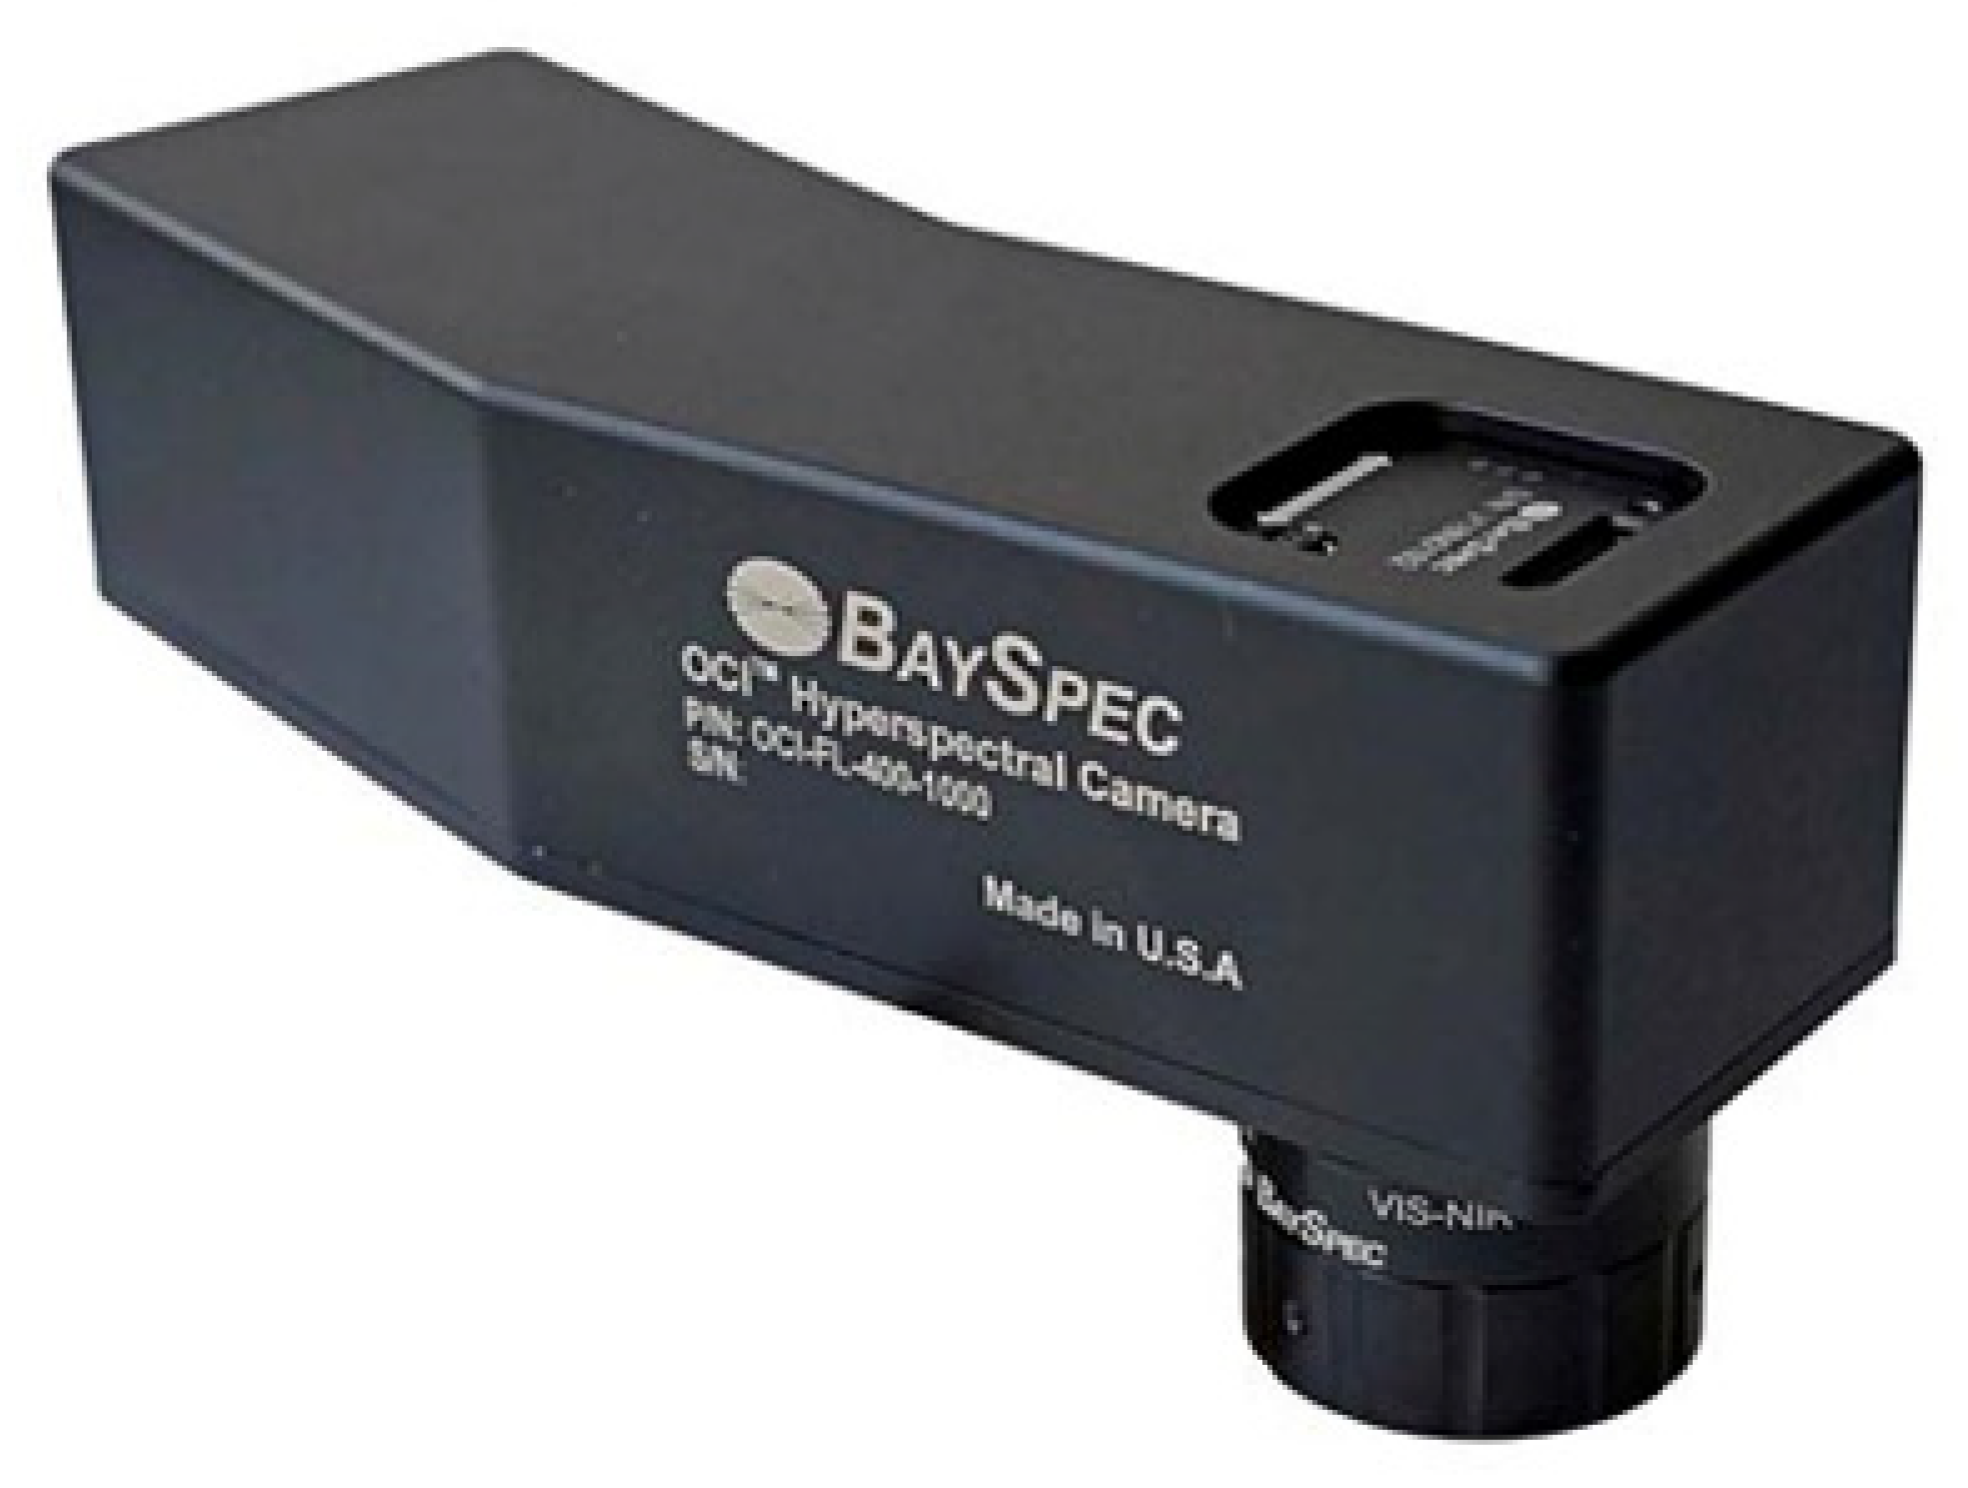
To obtain visible hyperspectral images of biological objects with continuous spectral and spatial coverage of lesions (infection and mechanical damage), the OCI-F Ultra-Compact Hyperspectral Imager was chosen, which most fully meets the requirements of the developed optical identification system device. The technical characteristics and general view of the OCI-F Ultra-Compact Hyperspectral Imager are presented in
Table 2 and
Figure 14.
The selected hyperspectral camera allows linear scanning at an arbitrary speed in accordance with the variation in the focal length of the camera lens with respect to the biological object under study when the surface area of the biological object changes according to the analytical dependence. According to Equation (12), the determination of the surface area of the biological object in a certain period of time is no more than 20–1000 μs.
To eliminate image artifacts caused by camera vibrations along the axes and achieve high spatial and spectral resolution [
11,
12], it is necessary to synchronize the hyperspectral camera with the software “SpecGrabber USB3”, “Imager CubeStitcher” and “CubeCreator” for shooting fruits and tubers. The survey of fruits and tubers was carried out using the “SpecGrabber” program (
Figure 15), in which the survey parameters were set.
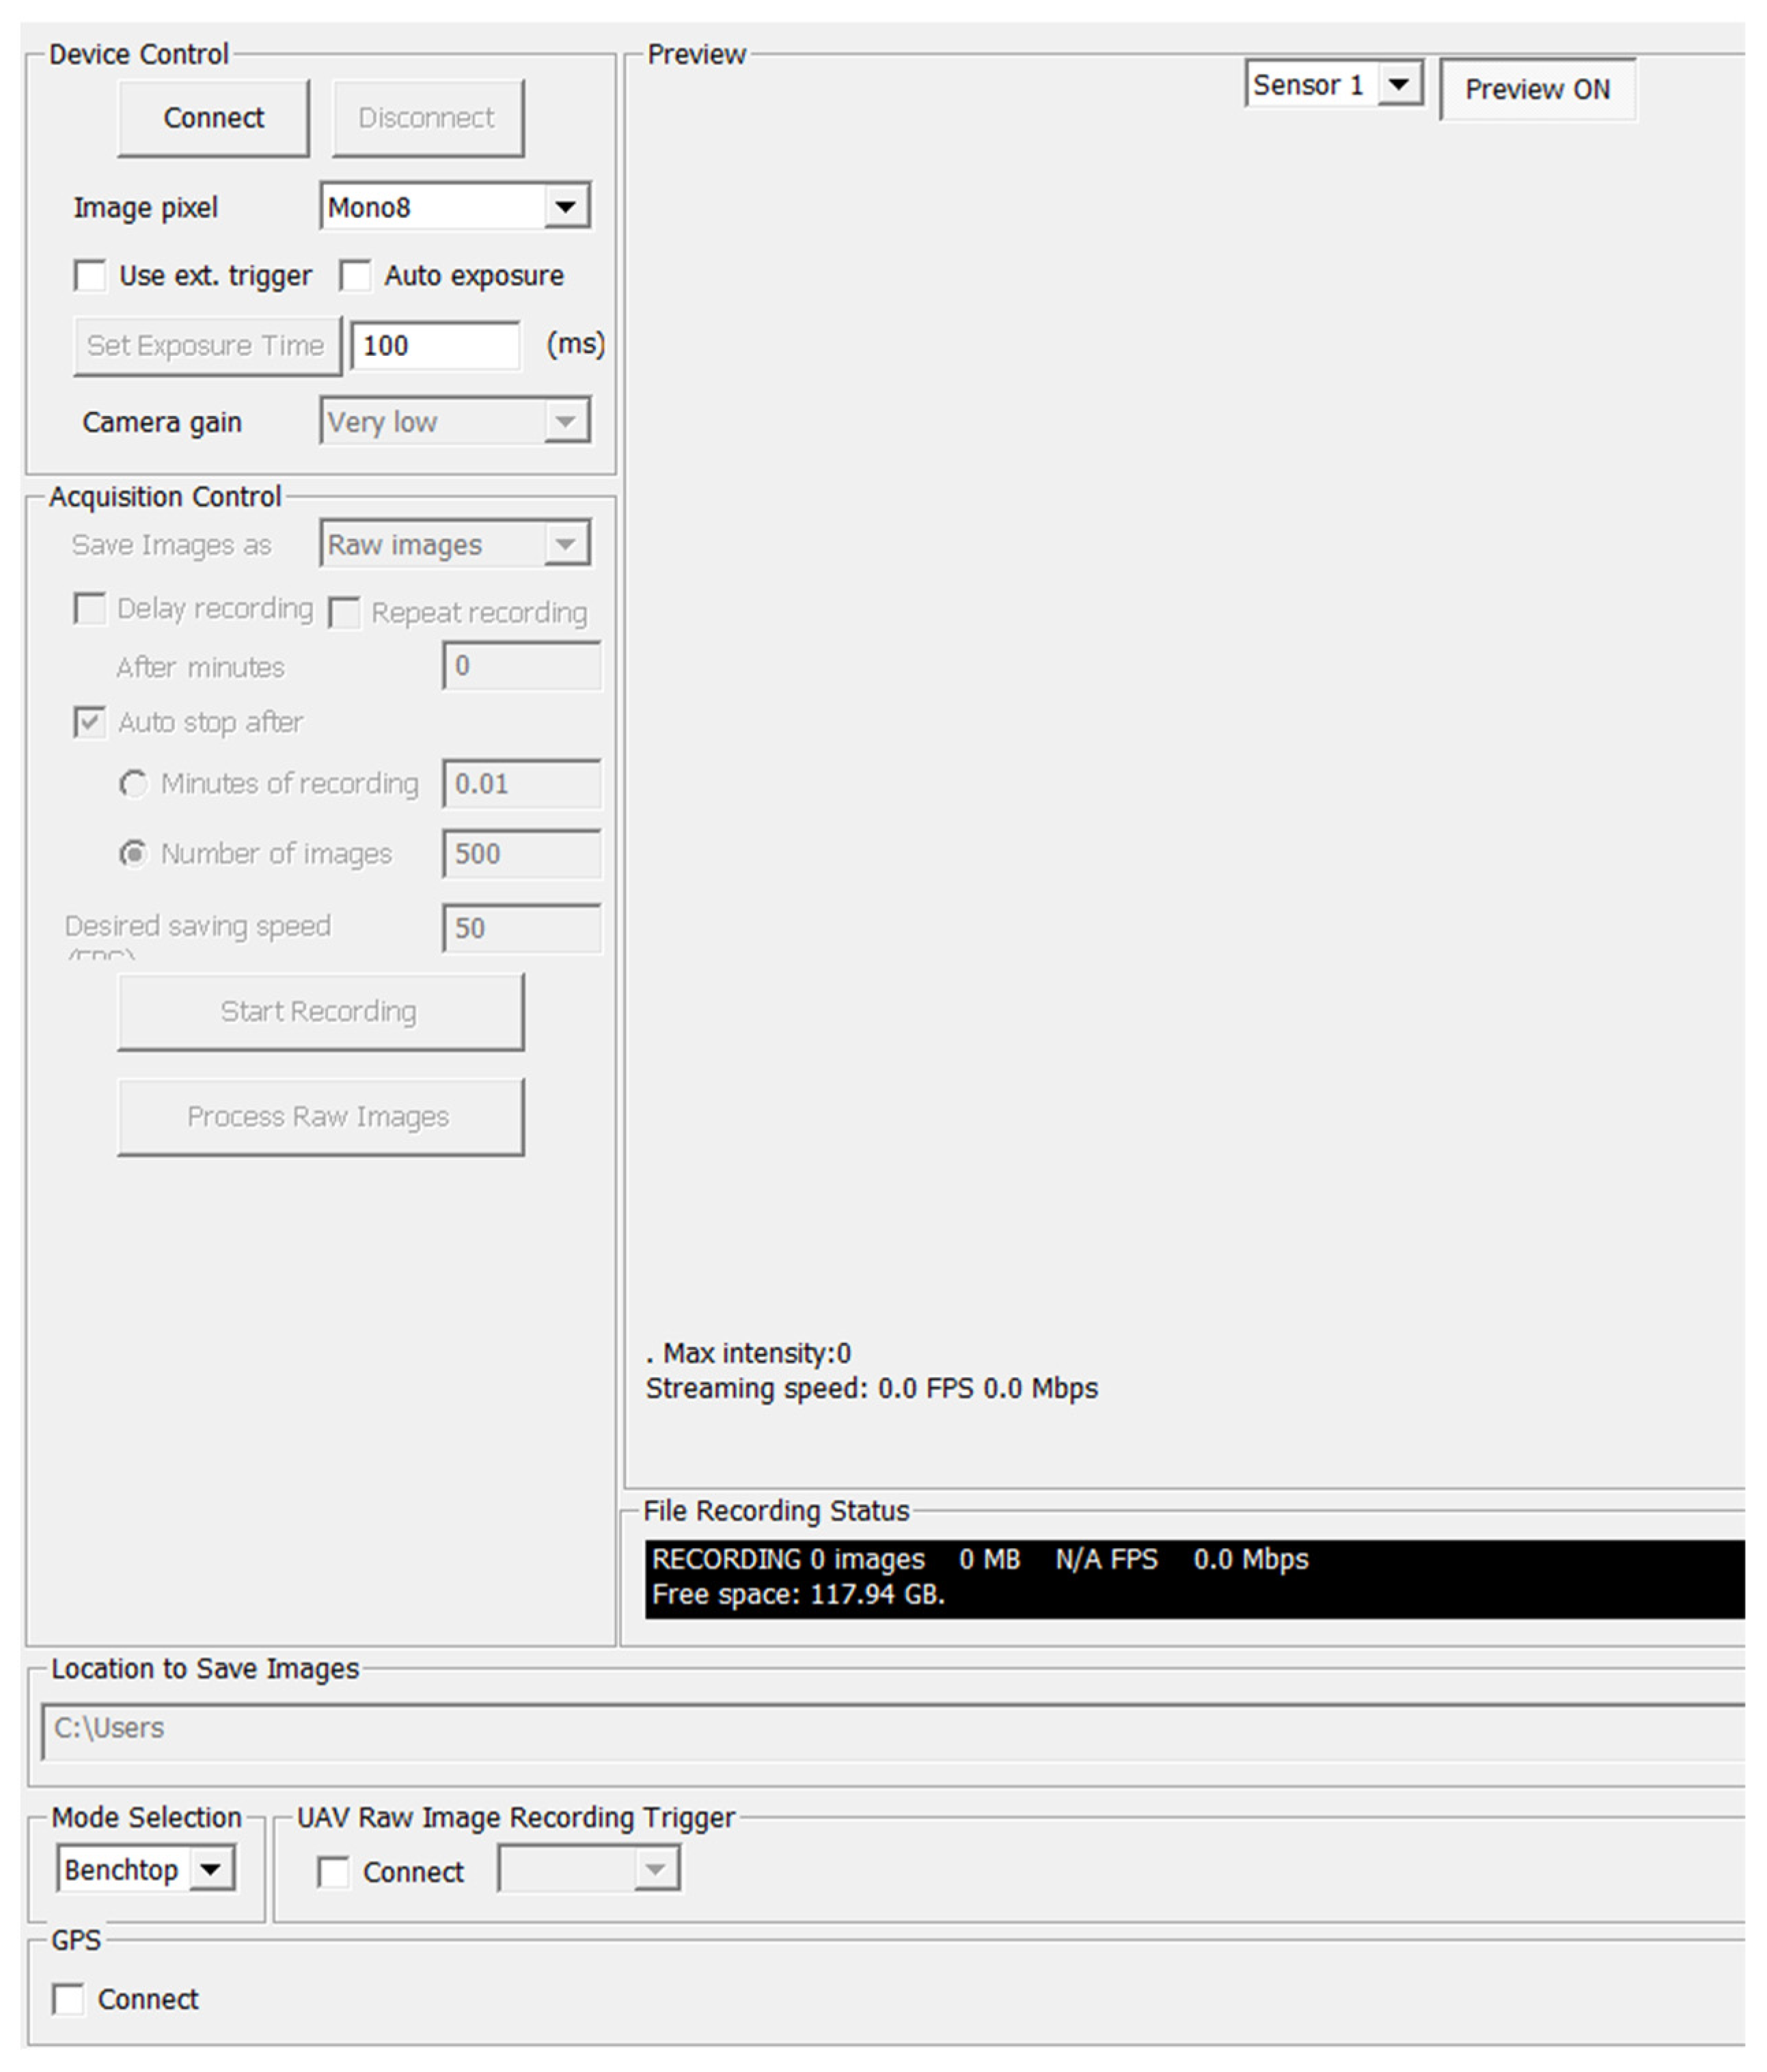
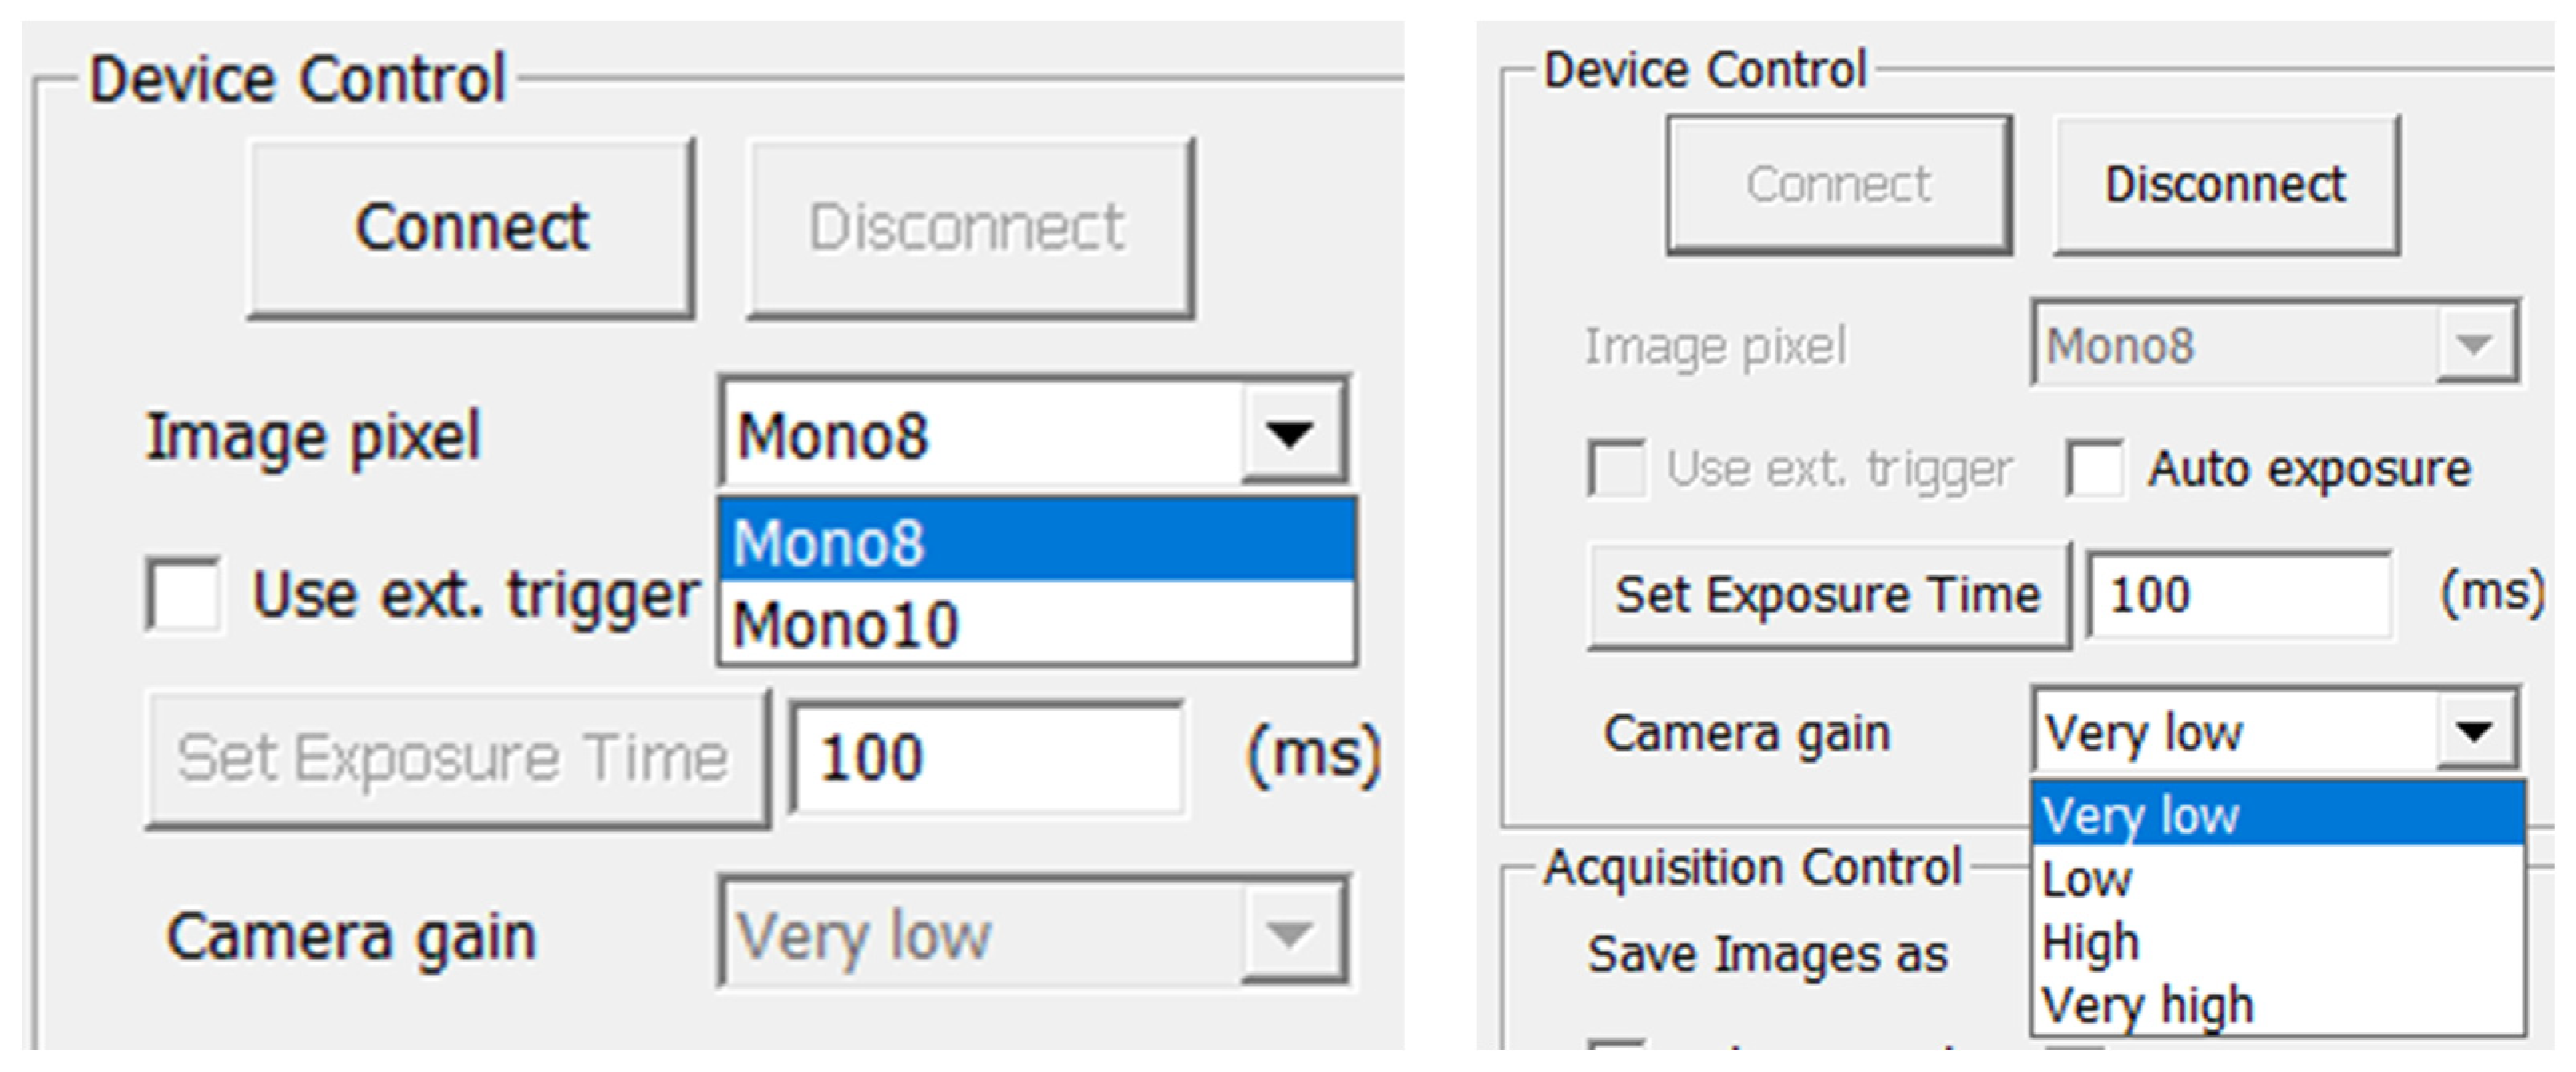
The SpecGrabber GUI consists of five panels: Device Control (
Figure 16), Acquisition Control, Preview, Status, and Location to Save Images.
The elements of the graphical user interface and their functions are described below. Before running SpecGrabber, two sensors are connected to the computer using USB 3.0 cables. After launching “SpecGrabber”, a drop-down list “Sensor 1”/”Sensor 2” (
Figure 17) appears in the upper right corner, from which the user can select a detector (sensor).
After clicking the “Connect” button, the software will check for a connected camera and start transmitting the image from the selected sensor to the “Preview” window. The “Disconnect” button stops the transmission of data from the camera. Before pressing the “Connect” button, the user can change the data format of each sensor using the Image pixel format drop-down list. Two options are available for sensor 1: “Mono 8” and “Mono 10”. When using the “Mono 8” sensor, each pixel will be stored as 8 bits (1 byte), while using the “Mono 10” sensor, each pixel occupies 16 bits (2 bytes), of which the data occupy 10 bits. Sensor 2 in this version of the camera has only one format—“Mono 8”. The camera exposure time can be changed by entering a new value in milliseconds and then clicking the Set Exposure Time button. If the “Auto exposure” checkbox is checked, pressing the “Set Exposure Time” button will allow the program to obtain and set the optimized exposure time, bringing the camera to 90% saturation intensity (about 230 for “Mono 8” and 922 for “Mono 10”) at the current amplification of the camera.
The camera amplification is controlled by the “Camera amplification” drop-down list. There are four options: “Very Low”, “Low”, “High”, and “Very high”. The function is designed to improve the image quality in low or high light conditions. When a camera is connected, the Enable preview box must be checked to display what the camera sees (the current raw frame). In the center of the panel there is a window where you can observe what is under the camera lens in real time. At the bottom are data that can change during the recording and transmission of data from the camera (with the exception of the “Resolution” resolution), which are as follows: Max intensity (Max intensity), streaming speed (streaming speed), and the number of frames per second (FPS).
The parameters set in the “Acquisition Control” window are necessary in order to control how the images are saved.
Moreover, this window is used to create predefined file systems ready for processing by the CubeCreator program and for processing hyperspectral images. In the folder specified via “Location to Save Images”, three subfolders are created for each sensor: “White reference”, “Dark background”, and “Raw images”. The “White Reference” and “Dark background” checkboxes contain an averaged reference white image and a dark image that are used to calculate the reflectivity of each hyperspectral image stored in the “Raw images” folder. The user can start recording a white or dark background by selecting “White reference” or “Dark background” in the “Save Image as” drop-down list; when selecting “Raw images”, the recording of frames of the object under study will begin (
Figure 18).
It is always necessary to record a white and dark background before shooting an object, because the software searches for white and dark standards immediately before shooting. Shooting can be carried out at a given time using the “Minutes of recording” checkbox and setting the appropriate time value. Shooting can also be carried out via the number of frames by checking the box in “Number of images”, and pre-setting the number of frames. The “Auto stop after” checkbox is required to automatically turn off the recording after using the following parameters [
20,
22].
The user can control the speed at which images are saved by setting the desired saving speed in frames per second via the values in the “Desired saving speed” (FPS) field.
For certain types of recording, you can set the recording delay and recording repetition by checking the boxes in “Delay recording” and “Repeat recording”, respectively [
11].
The Start Recording button starts the recording process according to the set parameters. When the file system is created and the raw images are recorded, when you click on the “Process Raw Images” button, the “BaySpec” “CubeCreator” program starts. The user can process/view raw images and files of hypospectral cubes using “CubeCreator”. During the experiments, 8-bit data (8 bits/channel) were used. High-spatial-resolution survey data (“ordinary RGB images”) were obtained using the Sensor 1 sensor, and hyperspectral data using the Sensor 2 sensor (
Figure 19).
The exposure time and the digital amplification factor are essential shooting parameters that greatly determine the image quality.
To calibrate a hyperspectral camera, it is necessary to consistently perform the scanning process of the 100% reflection standard—a white A4 body made of light-reflecting material (“white reference”)—and also record the values of the currents “(dark background”), as shown in
Figure 19.
Basic shooting algorithm: (1) fix the camera, adjust the focus; (2) place a white standard attached to the camera under the lens; (3) select the white reference recording in the settings; (4) after recording, remove the white reference and close the lens with a black lid; (5) select the black reference recording in the settings (“black reference”); (6) after recording, remove the cover and place the subject; (7) select “raw images” instead of “black reference”; and (8) set the camera to shoot by time or by the number of frames and start the scanning process.
The preliminary processing of raw data in order to assemble them into hypercubes must be performed in the program “BaySpec CubeCreator 2100”. BaySpec CubeCreator 2100 is a Microsoft Windows-based software for processing raw images recorded by BaySpec cameras into hyperspectral cubes. The program allows the user to display and check the white standard, dark background, and raw images. In addition, the user can use the program to view hyperspectral cubes and band images. This software is designed to work under the Windows 10 and Windows 7 operating systems and allows working in “Creator & Viewer” and “Viewer Only” modes. In the “Creator & Viewer” mode, the CubeCreator 2100 program allows the user to view recorded raw images, process raw images to create hyperspectral cube files, display spectra from cube files, and perform classification calculations based on spectrum data [
15].
Using the “Viewer Only” mode, the program will work only as a means of viewing hyperspectral cube files. All functions related to creating a hyperspectral cube file will be disabled, but all output files will be displayed and saved in 8-bit format.
The name of the file system created by BaySpec hyperspectral scanners contains information about the conditions in which the image files were located when they were recorded. All information will be used by the program later in the processing procedure. Thus, the user does not have to change the folder names. As soon as the folder selection button or the “View Raw” button is pressed on the left, the raw images saved in the file system will be displayed at the top, and the file system information will be displayed at the bottom on the right side. If there is more than one raw image in the file system, the user can use the scroll bar to display other images. Right-clicking on any raw image will bring up a pop-up menu for the user to display and check the quality of the white reference and dark background images [
21].
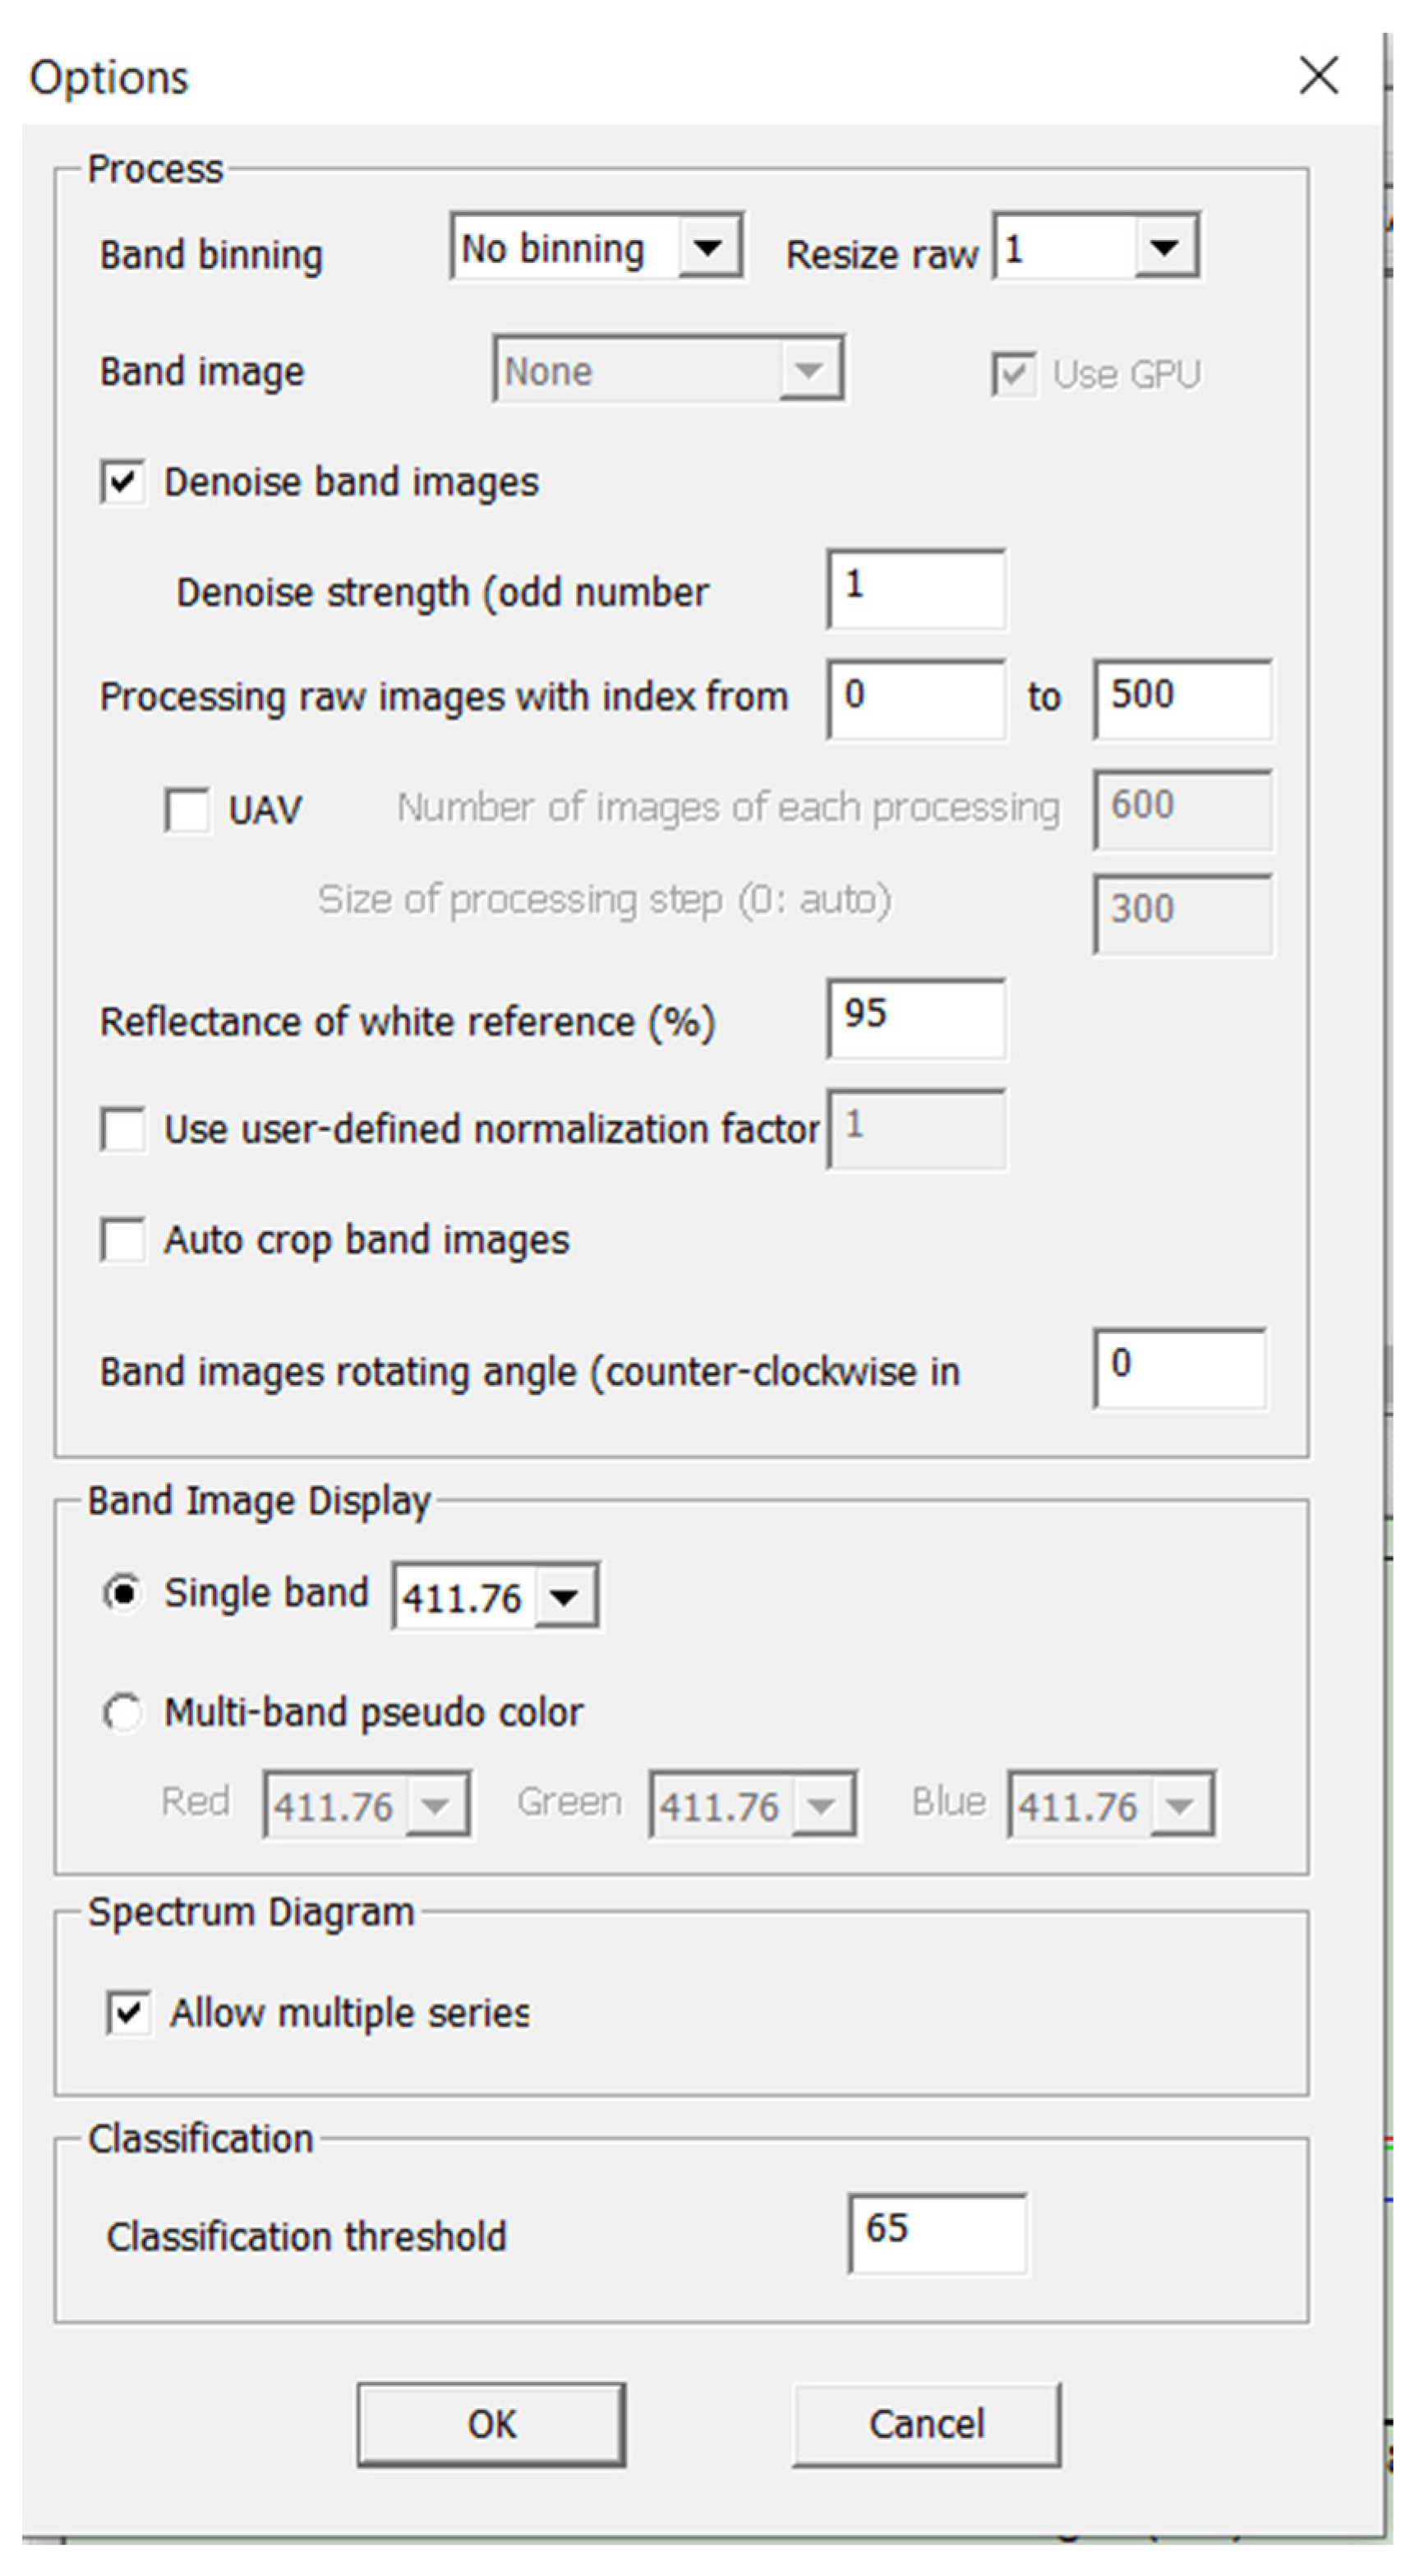
Pressing the “Process” button will start processing the raw images into a hyperspectral cube file and display the results of bandpass images in different wavelength ranges. If there are processed hyperspectral cube files, clicking on the “View Cube” button will load the first available hyperspectral file. After that, the user can click on the drop-down list on the right to download any particular hyperspectral cube file, or use the horizontal scroll bar at the top left to view all the cube files. The “Options” button in the CubeCreator program will open a separate dialog box consisting of four panels (
Figure 20).
The processing panel contains all the parameters related to the processing of raw images. The “Band binding” checkbox displays the parameters for binding adjacent ranges. To increase the processing speed and reduce the size of the cube dataset, the user can choose to bind the band from 2 to 1 or from 4 to 1 to reduce the data sample [
3,
8].
The “Resize raw” icon on the “Options” panel provides options for selecting the size of the final images of the strip. Using a smaller ratio will reduce the image processing time and reduce the size of the cube file at a lower spatial resolution. The “Band image alignment” button defines the method of alignment of the final images of the band before creating a hyperspectral cube file. There are two options: “None” and “Regular”. Pressing the “None” button means that the alignment will not be applied. The “Regular” button indicates that the usual image registration method is used.
The “Use GPU” checkbox allows CubeCreator to use the resources of the computer’s GPU to speed up image processing and ensure the better alignment of the strip images. The “Denoise band images” checkbox allows the user to decide whether the noise reduction method will be applied to the band images. If the checkbox is selected [
7,
9], the user can determine the noise level, which is defined as an odd number starting with 1. A larger value of this number creates smoother images with reduced spatial information. The “Processing raw images with index from/to” selection allows the user to select a range of raw images. If the user has recorded a large number of images, it is recommended to divide them into groups and process them separately so that several bad raw images do not affect the entire data cube.
The “UAV” checkbox allows the user to determine the number of images for each processing unit. The program will split all the selected raw images into continuous processing blocks with an overlap determined by the size of the processing step [
1,
5].
The actual overlap is the number of images for each processing block minus the size of the processing step. The “Reflectance of white regerence” button determines the value of the reflection coefficient of the reference white images stored in the “WhiteRef” catalog. Highlighting the “BaySpec” checkbox provides a small reference board of 95% white in the OCI wavelength range. The 95% white benchmark is measured against the white benchmarks tracked by NIST. The “Use user-defined normalization factor” checkbox allows the user to select whether a custom normalization factor will be used. If the user wants to increase the intensity (brightness) of the strip images, the user can check this box and set the value to greater than 1. This is intended only for viewing the range image and will not affect the actual spectrum [
5]. When processing images to obtain hyperspectral images, the recommended (standard) software settings were used.
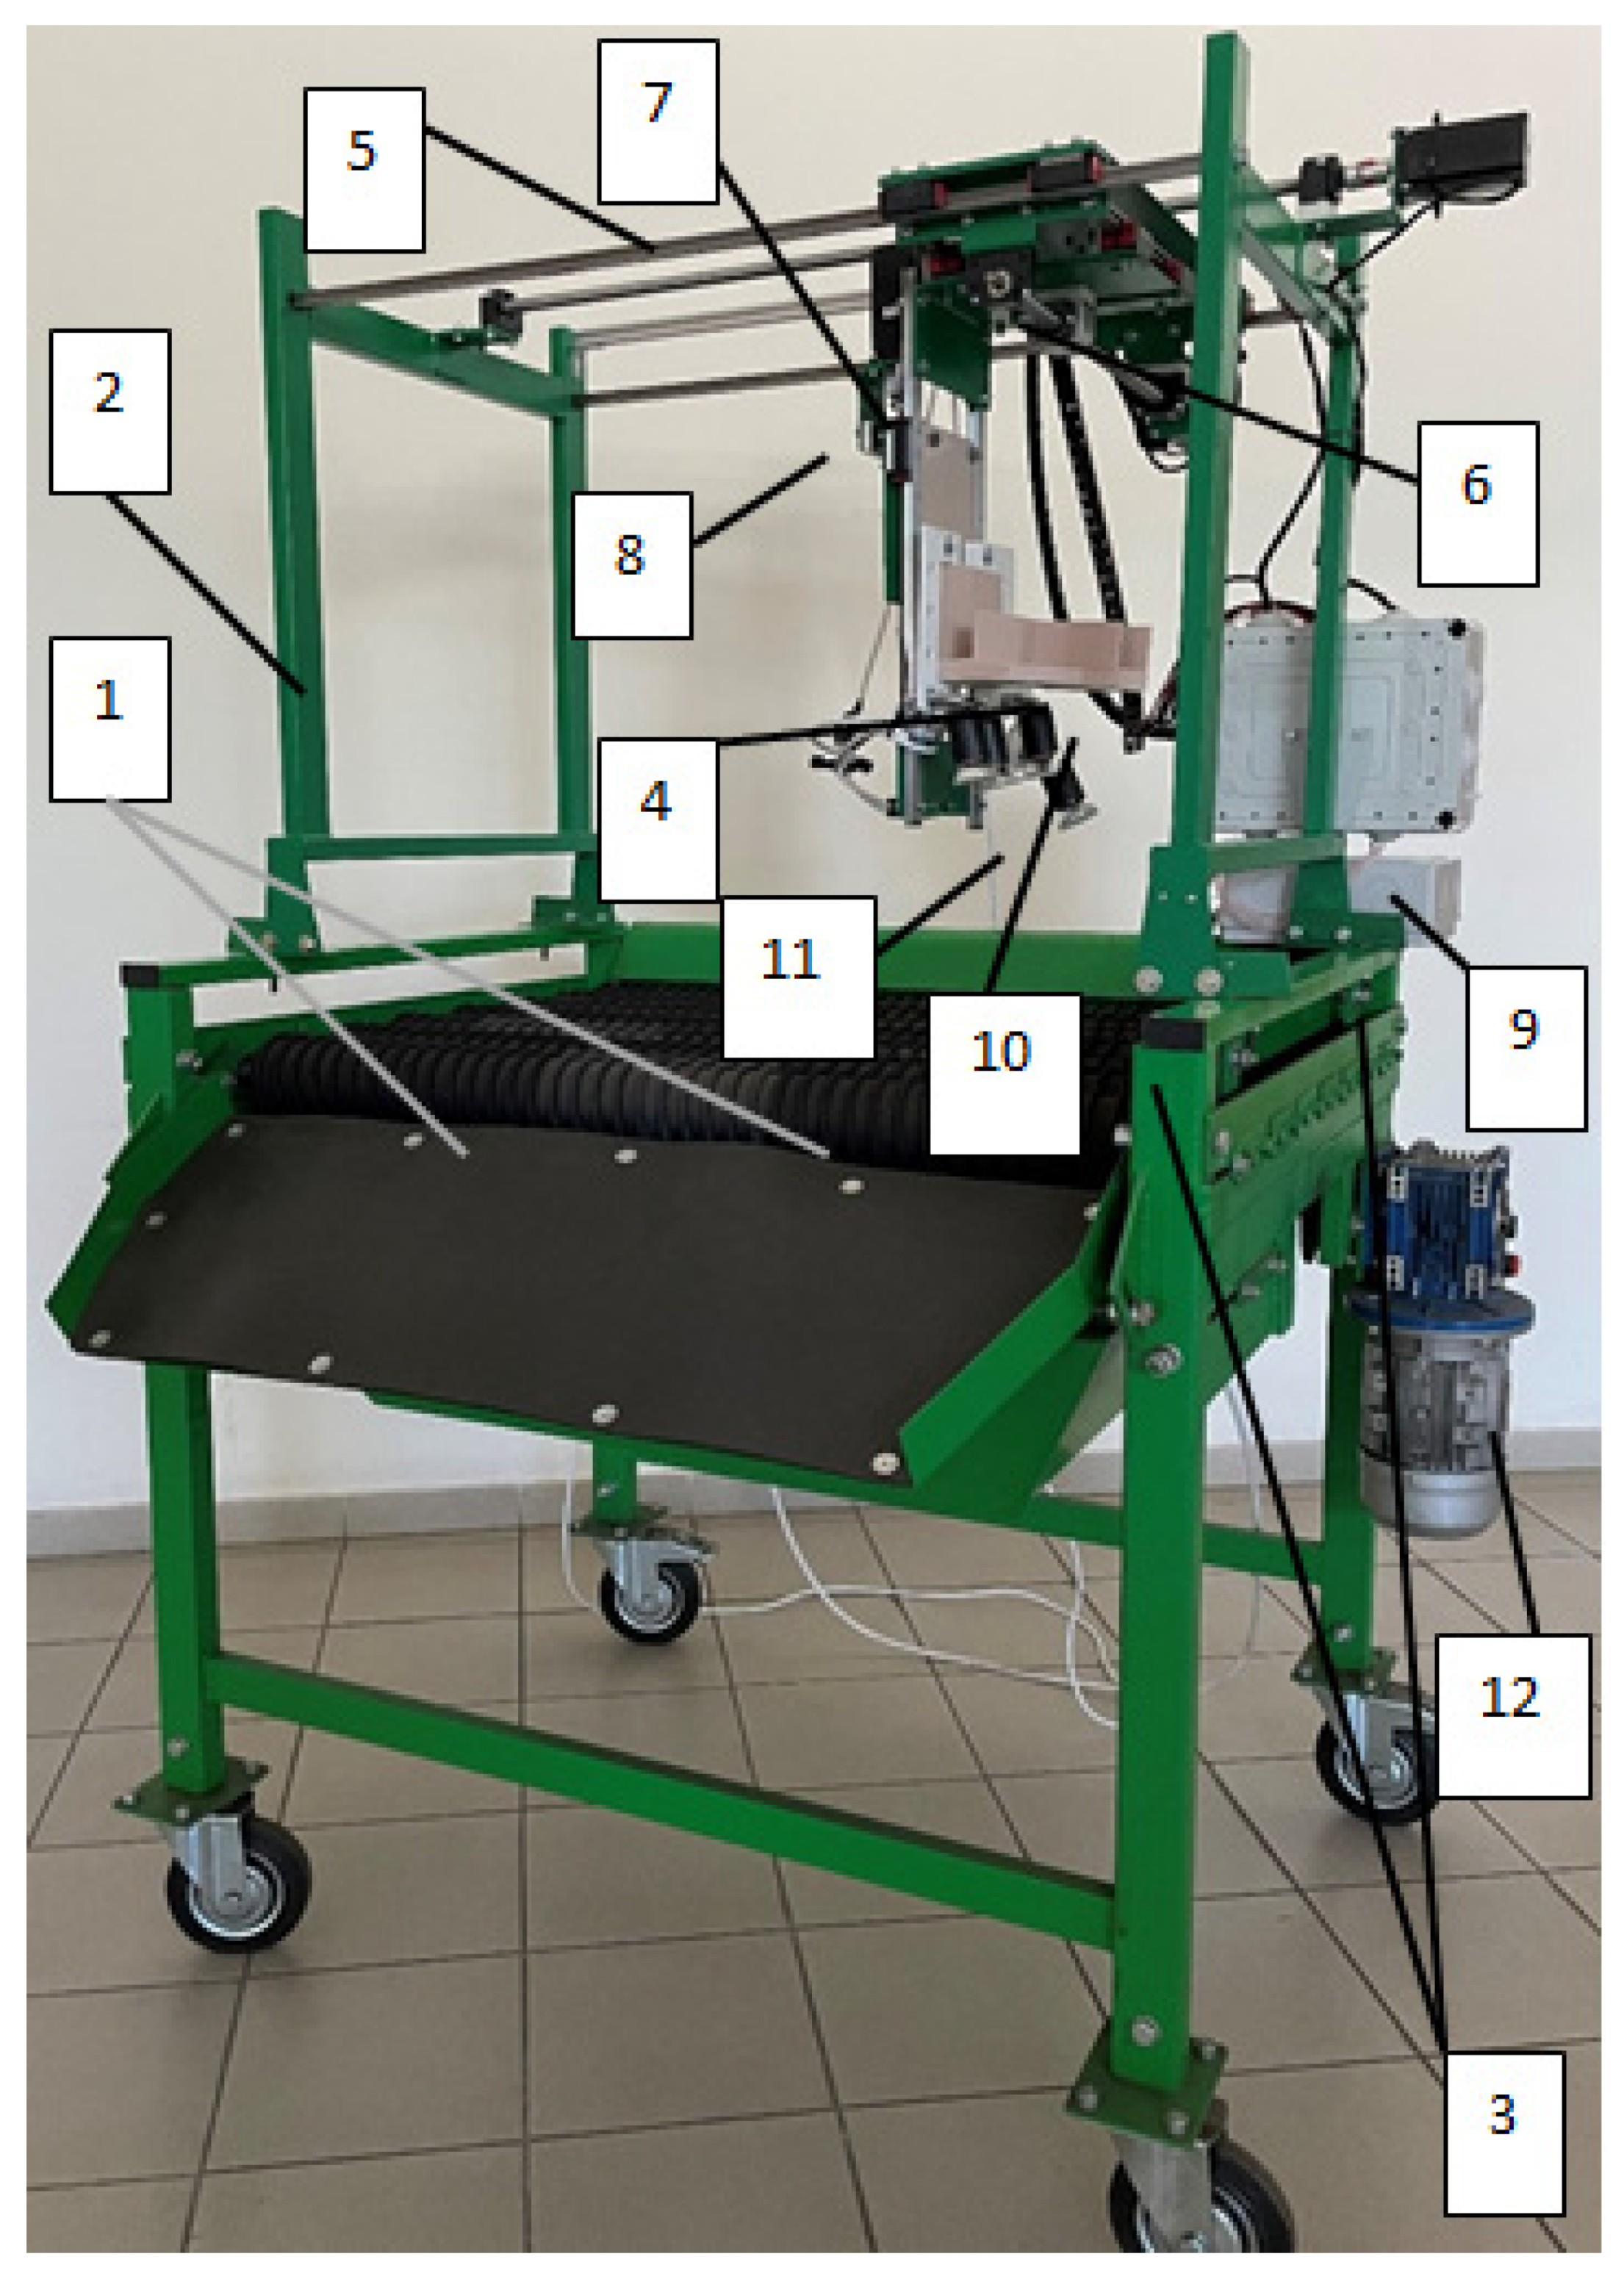
The results of the conducted research made it possible to develop a prototype of an optical system for identifying micro- and macrodamage to plant tissues with an orienting module (
Figure 21).
A prototype of an optical system for identifying micro- and macrodamage to plant tissues (
Figure 21) is represented by a working surface made in the form of rollers with winding height. Above this surface, a coordinate system for the automated positioning of a hyperspectral camera is installed on support posts by means of a bolted connection, which scans biological objects with high detail and moves in the vertical plane on rails, and in the horizontal plane by means of rack and pinion on the suspension mechanism. The drive for the automated positioning of the hyperspectral camera is carried out using stepper motors from the AC network. The main hardware and software of the optical system for the identification of micro- and macrodamage to plant tissues are powered by an alternating current network. In the sorting surface lighting system, a DNaT-400-type lamp installed above the working surface of conveyor belts is used to increase the scanning ability of commercial products. The rotational motion of the orienting module is driven by a gear motor when the circumferential speed of movement is changed by a frequency converter. Setting the lighting mode for a time interval, as well as the order of operation of the servos, is carried out using a programmable microcontroller.
Energy-saving daylight LEDs provide stroboscopic lighting, which is used for the reliable identification of color changes, and the detection of rhizoctonia, cracks, and other potato tuber defects. To sample a control array of spectral data from hypercubes in the “Gelion” program, a sect of regularly spaced point areas of interest was used (
Figure 22).
The obtained spectra were evaluated visually for the presence of artifacts due to excessive exposure, visible as rectilinear areas with zero dispersion (
Figure 23).
The prototype of the optical system for the identification of micro- and macrodamage to plant tissues was studied in the laboratory and field conditions of the FSBI FNAC VIM, the FSBI “Potato Institute named after A.G. Lorkh” (Moscow region) and the FSBI “I.V. Michurin FNAC” (Tambov region), which demonstrated the positive results of the technological process of recognizing infections with various pathogens. The novelty of this technical solution is confirmed by patents of the Russian Federation for inventions No. 2751604 and 2780053, as well as a program for the microcontroller of the main control panel for the potato tuber sorting process (certificate of state registration of the computer program No. 2022610305).
An analysis of the test results showed that the optical identification system meets the requirements in terms of the technical specifications and ensures the high-quality performance of the technological process of identifying potato tubers, as part of the post-harvest processing line, in terms of size and the presence of defects from mechanical damage, diseases, and pests. The performance of the optical identification system as part of the post-harvest processing line is 1.2 t/h. Obviously, to improve the accuracy of the recognition of defects in potato tubers, it is necessary to increase the size of the training sample by at least 2–3 times, as well as to improve the sorting processes and further stages of post-harvest processing in comparison with the LSP-4 line shown in
Figure 1.


 ,
, 


