Article

Digital Twins and Data-Driven in Plant Factory: An Online Monitoring Method for Vibration Evaluation and Transplanting Quality Analysis

1
Department of Electrical and Mechanical Engineering, College of Engineering, China Agricultural University, Beijing 100089, China
2
National Key Laboratory of Agricultural Equipment Technology, Chinese Academy of Agricultural Mechanization Sciences, Beijing 100083, China
3
College of Agricultural Equipment Engineering, Henan University of Science and Technology, Luoyang 471003, China
*
Author to whom correspondence should be addressed.
Agriculture 2023, 13(6), 1165; https://doi.org/10.3390/agriculture13061165
Submission received: 6 May 2023 / Revised: 24 May 2023 / Accepted: 29 May 2023 / Published: 30 May 2023
(This article belongs to the Section Digital Agriculture)

Abstract

:
The plant factory transplanter is a key component of the plant factory system. Its operation status directly affects the quality and survival rate of planted seedlings, which in turn affects the overall yield and economic efficiency. To monitor the operation status and transplanting quality of a transplanting machine in a timely manner, the primary task is to use a computerized and easy-to-use method to monitor the transplanting units. Inspired by the latest developments in augmented reality and robotics, a digital twin model-based and data-driven online monitoring method for plant factory transplanting equipment is proposed. First, a data-driven and virtual model approach is combined to construct a multi-domain digital twin of the transplanting equipment. Then, taking the vibration frequency domain signal above the transplanting manipulator and the image features of the transplanting seedling tray as input variables, the evaluation method and configuration method of the plant factory transplanter digital twin system are proposed. Finally, the effect of the transplanter is evaluated, and the cycle can be repeated to optimize the transplanter to achieve optimal operation parameters. The results show that the digital twin model can effectively use the sensor data to identify the mechanical vibration characteristics and avoid affecting transplanting quality due to mechanical resonance. At a transplanting rate of 3000 plants/h, the transplanting efficiency can be maintained at a high level and the vibration signal of the X, Y, and Z-axis above the transplanting manipulator is relatively calm. In this case, Combined the optimal threshold method with the traditional Wiener algorithm, the identification rate of healthy potted seedlings can reach 94.3%. Through comprehensively using the optimal threshold method and 3D block matching filtering algorithm for image threshold segmentation and denoising, the recognition rate of healthy seedlings has reached over 96.10%. In addition, the developed digital twin can predict the operational efficiency and optimal timing of the detected transplanter, even if the environmental and sensor data are not included in the training. The proposed digital twin model can be used for damage detection and operational effectiveness assessment of other plant factory equipment structures.

1. Introduction

The production of vegetables is becoming increasingly industrialized due to serious challenges related to food security, safety, sustainability, and health. Plant factories are evolving into high-tech facilities characterized by mass production and extensive applications of technologies [1,2]. Smart horticulture technologies, represented by plant factories that integrate multiple production elements and technical equipment, are changing and upgrading traditional agricultural production methods [3,4]. However, the intricate planting structure in plant factories poses a considerable challenge to the monitoring of production operations [5]. As a key piece of technical equipment in plant factories, the operational status of the plant factory transplanter (PFT) directly affects the quality and survival rate of the planted seedlings, which in turn affects the overall yield and economic efficiency [6]. A monitoring system that can be applied to the plant factory environment and display the working status of transplanters in real-time is needed to design.
There are a large number of sensors and artificial intelligence technologies used for the monitoring of transplanting equipment for agricultural production [7,8,9,10], visual localization [11,12], and fault diagnosis [13,14]. These works have greatly advanced the development of transplant equipment technology. The means of monitoring agricultural equipment have become increasingly intelligent and data-driven, including cloud computing, the Internet of Things, big data, machine learning, augmented reality, and robotics [15,16]. Smart detection technologies integrating virtual reality and physical sensing networks provide new ideas for transplant monitoring [17,18]. A powerful driver for this development is the digital twin [19,20].
A DT is a virtual representation of a physical entity created digitally. It can simulate the conduct of a bodily entity in its actual surroundings with the assistance of data and add or prolong new skills to the bodily entity by way of capacity for virtual-real interaction feedback, statistics fusion analysis, and iterative optimization of choices [21,22]. Many internationally renowned scholars and companies are exploring the use of digital twin technology in product design, manufacturing, and maintenance [23,24]. The National Aeronautics and Space Administration (NASA) has investigated a digital twin-based approach for fault monitoring and elimination in complex systems and applied it to the health management of flight systems. Using the concept of a digital twin workshop, Tao Fei et al. designed the composition and operation mechanism of DTS. Zhuang Cunbo et al. proposed the architecture and implementation path of the product digital twin [25] and pointed out that the emergence and development of digital twin technology can not only provide clear new ideas but also methods and implementation paths for realizing information-physical systems. The advantages of digital twins consist of decreasing manufacturing time and costs, hiding the complexity of integrating heterogeneous technologies, developing a safer working environment, and setting up extra environmentally sustainable operations. When applied to factory farming production, digital twin technologies can significantly increase greenhouse productivity and sustainability.
Utilizing digital twin technology in plant monitoring applications offers numerous advantages. Firstly, growers can remotely monitor and manage operations using real-time digital information rather than through direct observation and manual labor in the field. Secondly, if any anticipated issues arise, growers are alerted promptly. Thirdly, growers can simulate the impact of corrective and preventive measures on digital representation. Finally, the chosen intervention can be executed remotely by the grower, and a digital illustration can be used to confirm that the expected issue has been resolved. As a result, this intelligent management cycle will become increasingly autonomous, requiring no further manual intervention from the grower.
An on-line monitoring approach primarily based on DT fashions and information is investigated for plant transplanting gear to acquire dependable and correct monitoring. The relaxation of the paper is prepared as follows: in Section 2, the twin model, comparison technique, and configuration approach for PFT monitoring are presented; Section 3 gives the effects and dialogue of the utility of the PFT monitoring model; and Section 4 offers the conclusion.

2. Materials and Methods
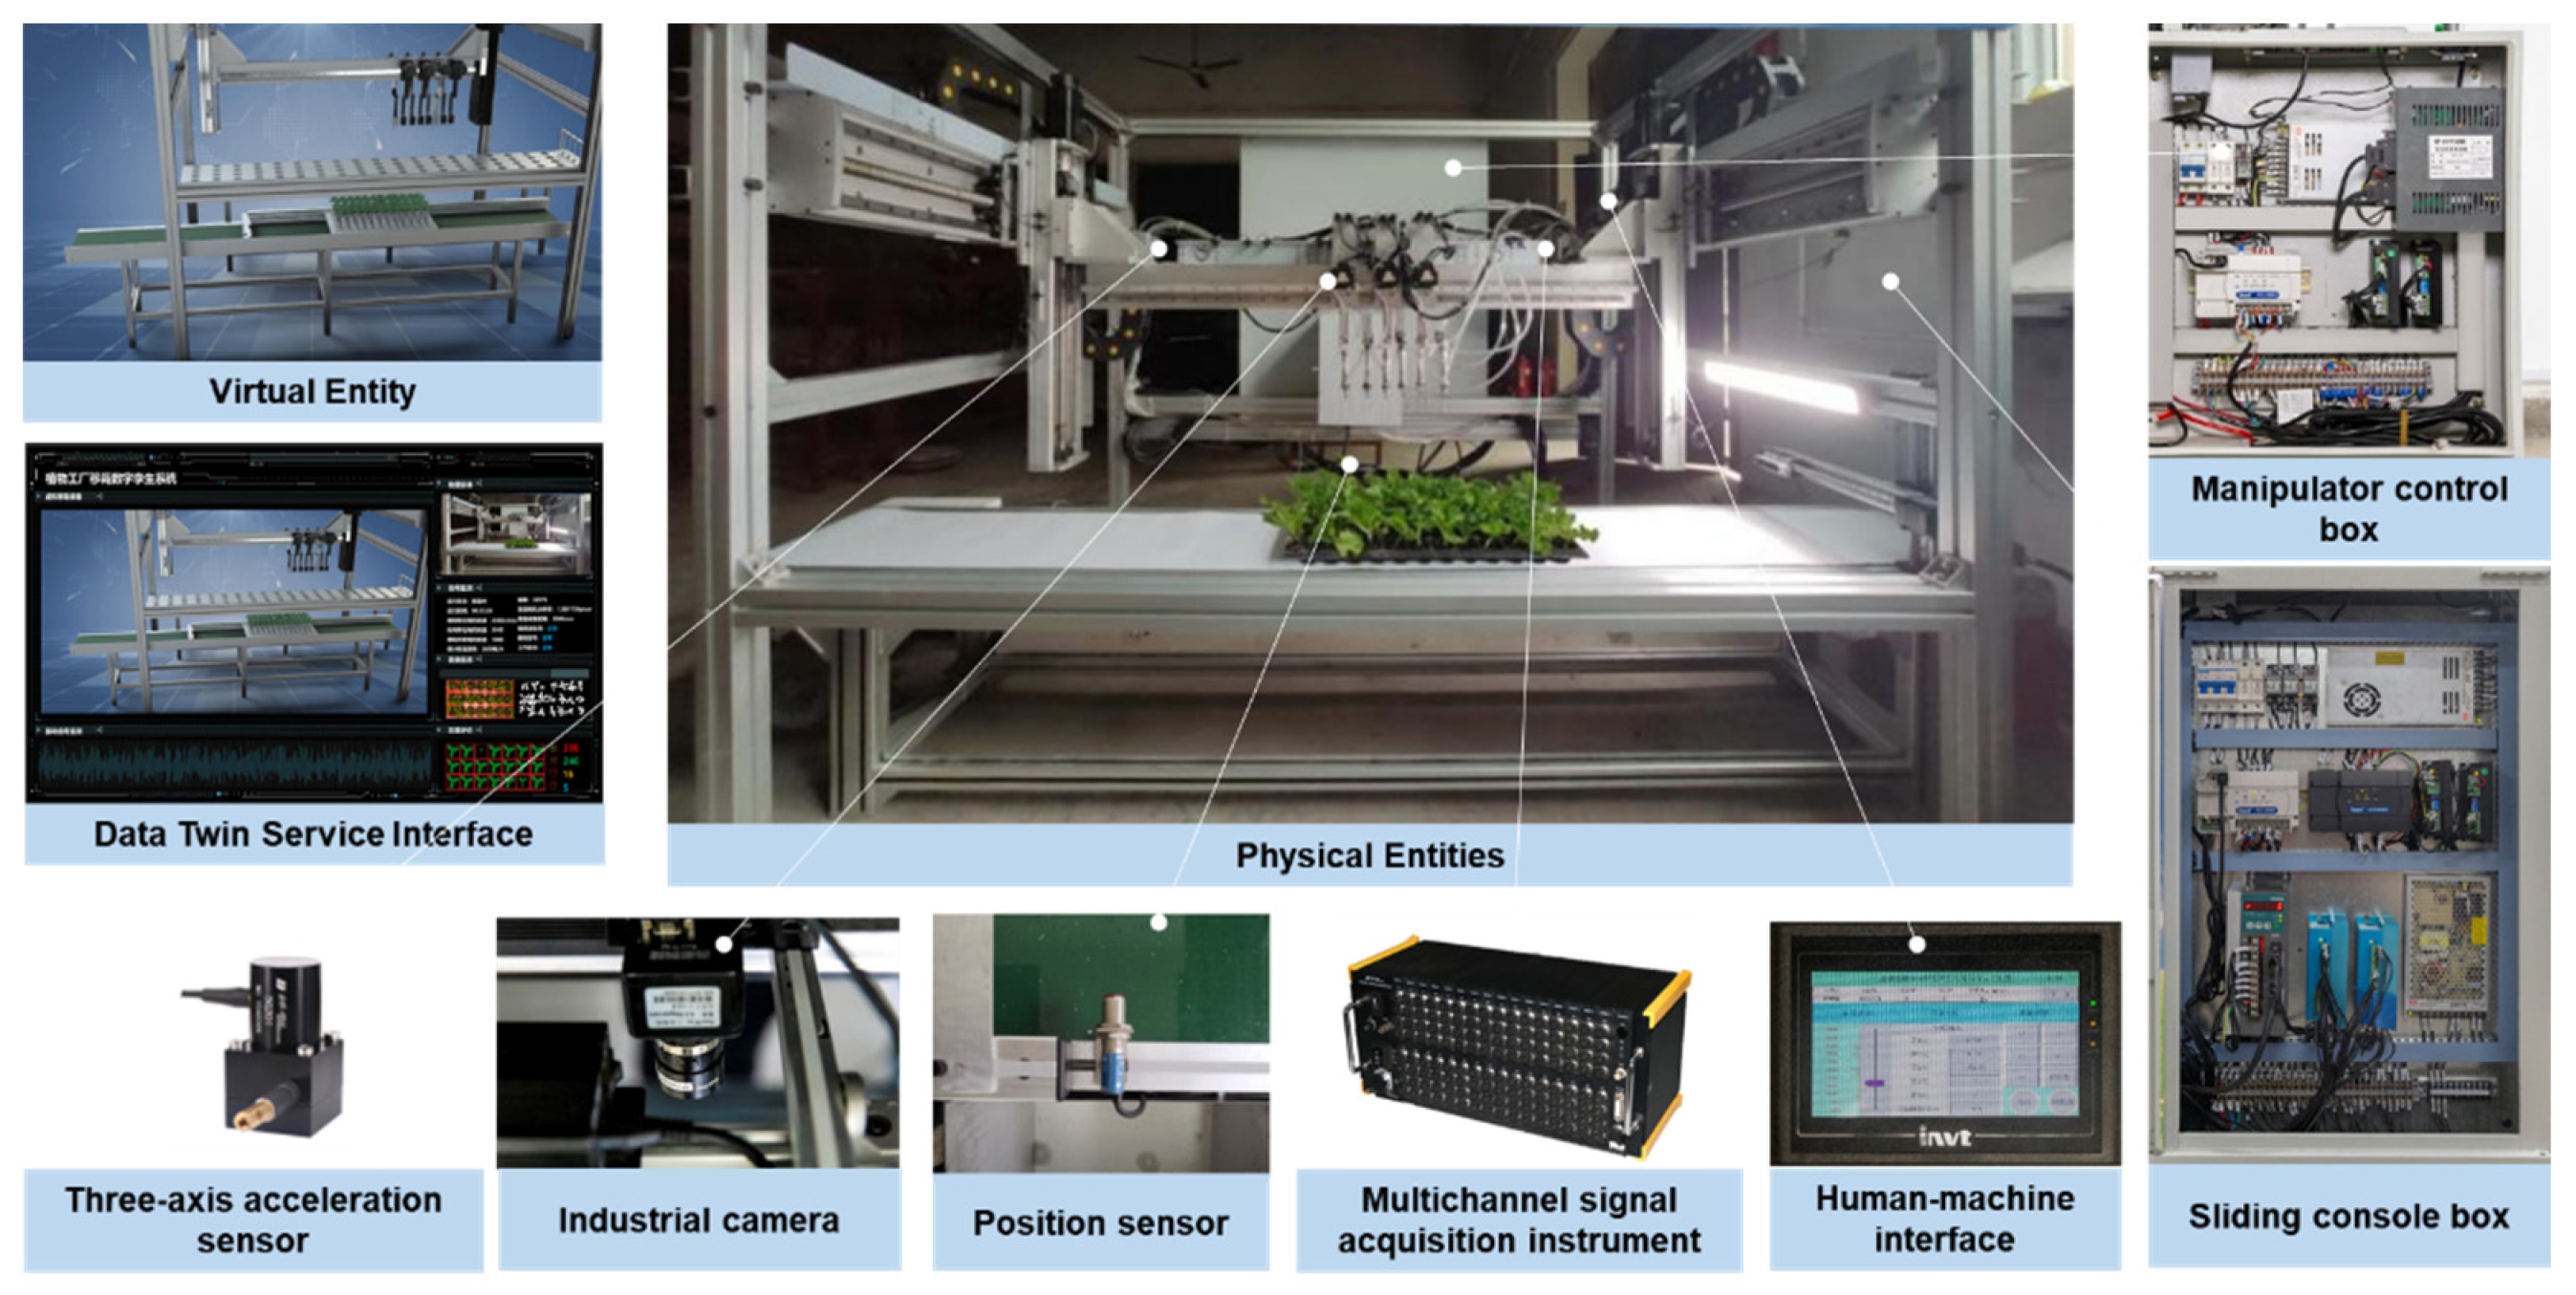
This case focuses on evaluating the vibration and effect of the transplanting manipulator, which plays an intelligent decision-making role in the regulation of the transplanting system. PFT’s transplanting robot plays a crucial role in accuracy and quality, and its condition directly affects them. The vibration of transplanting manipulators decreases dimensional accuracy but also shortens the machine’s service life due to fatigue deformation. Besides decreasing dimensional accuracy, the vibration of transplanting manipulators also shortens the machine’s service life due to fatigue deformation. To this end, a key component of transplanters, a hybrid DT-based application, is investigated for real-time monitoring and vibration evaluation of the manipulator. To evaluate the effect of transplanting, machine vision, and artificial intelligence technology are combined to discriminate and classify the video image information after real-time transplanting, aiming to provide data support for the wise decision-making of the transplanter, as shown in Figure 1.

2.1. Framework

As shown in Figure 2, the hybrid method framework is proposed. To obtain more accurate monitoring results, this framework combines data-driven and model-based approaches. Based on the material properties and operating conditions, a multidomain model of the PFT is developed. In the same way that virtual sensing allows us to calculate the internal state of systems wherever we are, multiphysics field simulations allow us to map boundary conditions to the physical PFT and calculate it wherever we want. Calculating the system state theoretically using simulated internal system values is done by converting the DT physical degradation model into a system state space model. Sensors are mounted on the PFT in a specific manner, and then data is provided to support a data-driven approach to examine the effectiveness of a plant performance evaluation.
In the data-driven approach, a number of steps need to be undertaken in order to transform historical sensory data into useful monitoring data, including data processing, feature extraction from twin data, and feature fusion from twin data. Systematic observation of PFT is conducted using the transplanting stenography monitored by the data-driven approach. Using a hybrid proximity algorithm, the system observations, the system state space model, and the simulated intra-system values are combined. Based on a priori knowledge and simulations of intra-system values, the state of the PFT is monitored. As a result, the monitored states are modified based on observations of the system.

2.2. Multi-Domain Model Implementation of Plant Factory Transplanting System

As part of a data-driven algorithmic model, the DT model represents the physical PFT numerically. When constructing a model, it is necessary to consider multiple physical fields simultaneously, such as mechanical engineering, electrical engineering, hydraulics, and thermodynamics, in order to have a comprehensive understanding of the system. Software that supports multi-domain modeling includes Unity 3D (v4.3.1), SolidWorks (2015), and 3dsMax (2017). Object models at the subsystem level, such as manipulators, cavity seedlings, and cavity seedling trays, can be built by these programs and incorporated into a multidomain system model. The implementation of the multi-domain model is shown in Figure 3.
DT is widely recognized as the most reliable and accurate method of monitoring sexual maintenance due to its high fidelity. The accuracy of DT can be improved by obtaining actual operation results (experiments). Physical PFT-based multi-domain models can also be simulated to obtain simulation results. Model parameters (e.g., material properties, operating conditions) should be the same as the actual parameters. DT consistency is then determined by comparing the experimental and simulation results in an iterative process, as shown in Figure 4. Multi-domain models are modified and simulated iteratively until the difference between simulations and experiments is small. Multi-domain models with small experimental errors can be considered high-fidelity models.
Furthermore, a real-time mapping interface should be built so the DT model can be updated. Modeling involves mapping domain knowledge and operating conditions through interfaces. An expert’s domain knowledge is mainly derived from his or her experience, mechanical manuals, sensor data, and controller parameters. Fault prognosis and monitoring of the tools will be applied on the basis of some prior expertise and experience.
The testbed design and sensor installation are shown in Figure 5. The testbed experimental platform includes the data twin service system, the sensing and signal acquisition system, and the PLC control system. The data twin service system contains a virtual entity and a data twin service interface. The sensing and signal acquisition system consists of a three-axis acceleration sensor, an industrial camera, a position sensor, a multi-channel signal collector, and a human-computer interaction interface. The PLC control system consists of a manipulator control box and a transplanting truss control box. Among them, a three-axis acceleration sensor is installed on the platform above the transplanting manipulator to continuously collect the vibration data of the platform above the manipulator. An industrial camera is mounted on the truss to take images of the entire tray of seedlings after each tray is transplanted. The position sensor is mounted on the metal profile on the side of the conveyor belt, which controls the conveyor belt stepper motor to stop when the seedling tray moves to the position to be transplanted, completing the subsequent transplanting. The main parameters of this experiment are: the working environment is 22 °C; the spindle speed is 2300 RPM (revolutions per minute); the horizontal module feed speed is 200 mm/min; the vertical module feed speed is 200 mm/min; the cavity tray conveyor is rated at 200 W; the transmission speed is 0.5 m/s; and the sampling frequency is 50 Hz.
Currently, it is impractical to construct a DT mannequin that thoroughly displays each and every element of the complete system. It is essential to purposefully construct a goal-oriented DT mannequin and simplify it. The essential goal of this study is to precisely consider the ETQ of plant transplanting. Therefore, the plant seedlings, pots, and transplanting clamping jaws have been somewhat simplified, as shown in Figure 6.
As shown in Figure 7, real-time updates of DT are necessary to maintain a true mapping with the physical model of the plant factory transplanting machine.The foundation for adjustment of the transplanting end-effector manipulator for the duration of the transplanting procedure can be divided into two types:
  • Transplanting conditions: When it comes to transplanting, there are several critical parameters that must be taken into consideration. These parameters include the spindle motor speed, the vibration signal above the transplanting manipulator, and the role signal. These parameters are controlled by the PFT controller and have a direct impact on the simulation results of the transplanting process.
  • Evaluation of the transplanting effect: The evaluation and assessment of the picture sign of the transplanting seedling tray for the duration of the transplanting process and performs a function of remarks adjustment to alter the parameters of the transplanting platform.

2.3. Data-Driven Model Implementation and Dataset Description

In the construction of a data-driven model, various sensors that monitor the conditions of PFT are used to collect big data. After collecting historical data, diagnostic and monitoring algorithms are designed and trained. As shown in Figure 8, many data processing methods are required to build the data-driven model, including noise reduction, pre-processing, feature extraction, and feature selection, which require expert domain knowledge as a foundation.
Accordingly, by setting sensors on the PFT, it is possible to detect and monitor its operating parameters, primarily the state of the PFT and the surrounding environment. From the collected data, feature recognition is performed to identify health-related features. To improve the model training speed and monitoring accuracy only features strongly related to device health are selected during the feature selection stage. In the construction stage of the algorithm model, data-driven monitoring and maintenance of PFT are achieved by constructing fault diagnosis and fault monitoring algorithms based on identified and extracted features.
Due to sensor drift caused by temperature changes, the raw data contains trend items that affect eigenvalue monitoring results. In addition, the sampled raw data are often superimposed with noisy signals, such as industrial frequency signals, periodic interference signals, and random interference signals, resulting in burrs in the signal waveform. Additionally, raw data smoothing is performed to reduce interference signals and improve vibration curve smoothness. The trend term elimination is performed by a polynomial based on the least squares method, as shown in Figure 9.
The total data set collected by the digital twin system of plant transplanting is M = M1, M2, M3, and M4, where M1, M2, M3, and M4 are the data collected under different operating conditions when the equipment is running for 20 s, 40 s, 60 s, and 80 s, respectively, as shown in Table 1. Each group contains 256 data files. To ensure synchronization between multiple sources, data from the same time period should be input into the digital twin system. The data files are intercepted within 20–80 s from the middle moment, i.e., the vibration and video signals are intercepted and uploaded as data points separately. The vibration signals are stacked as 6-channel samples, and the data dimension of the vibration signals of X, Y, and Z channels in the same time period is 128 × 2048 × 6, and 15% of the data are selected as the test set.

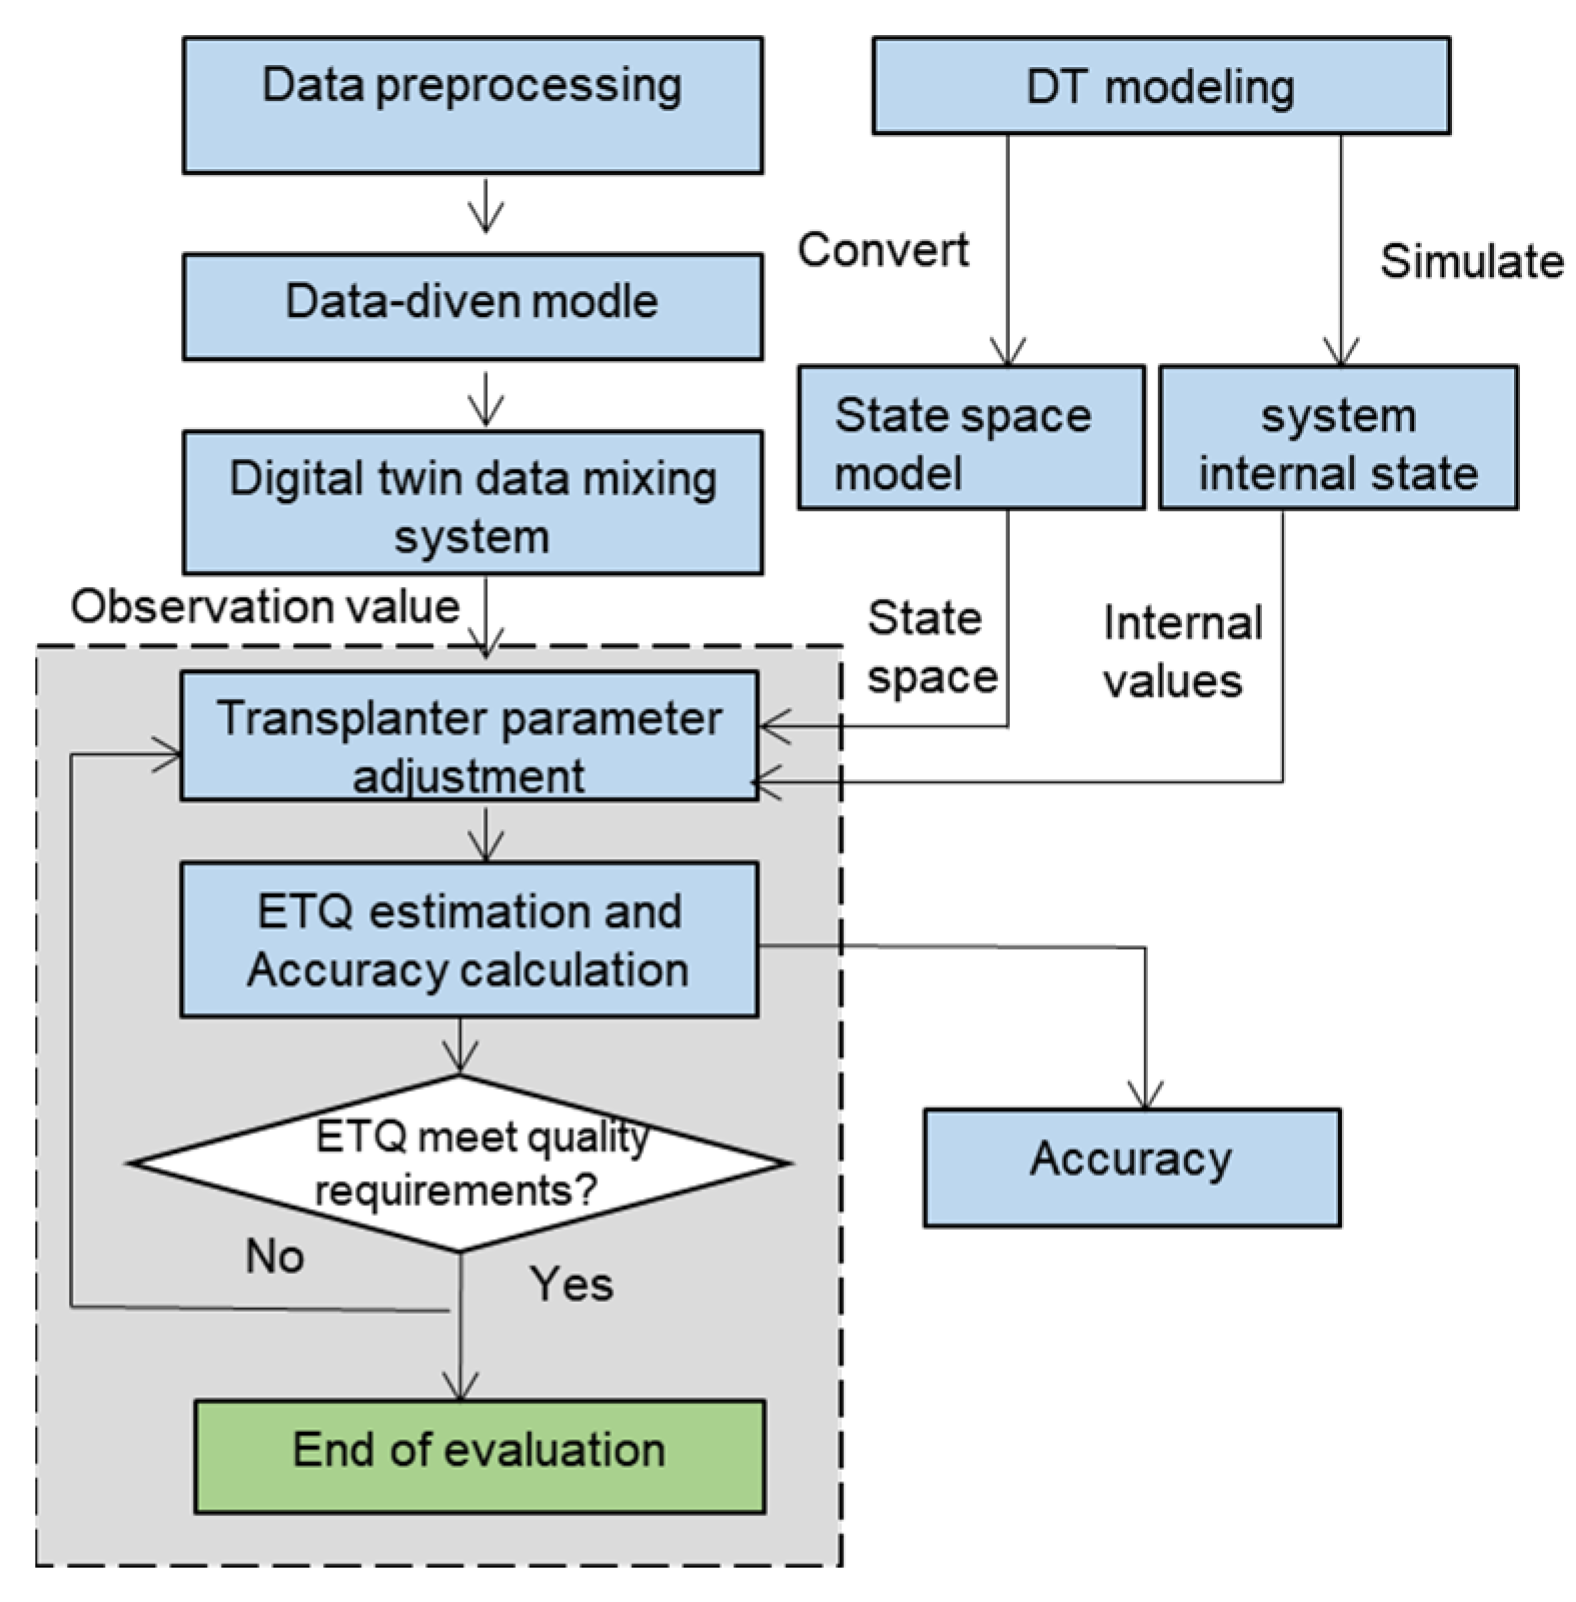
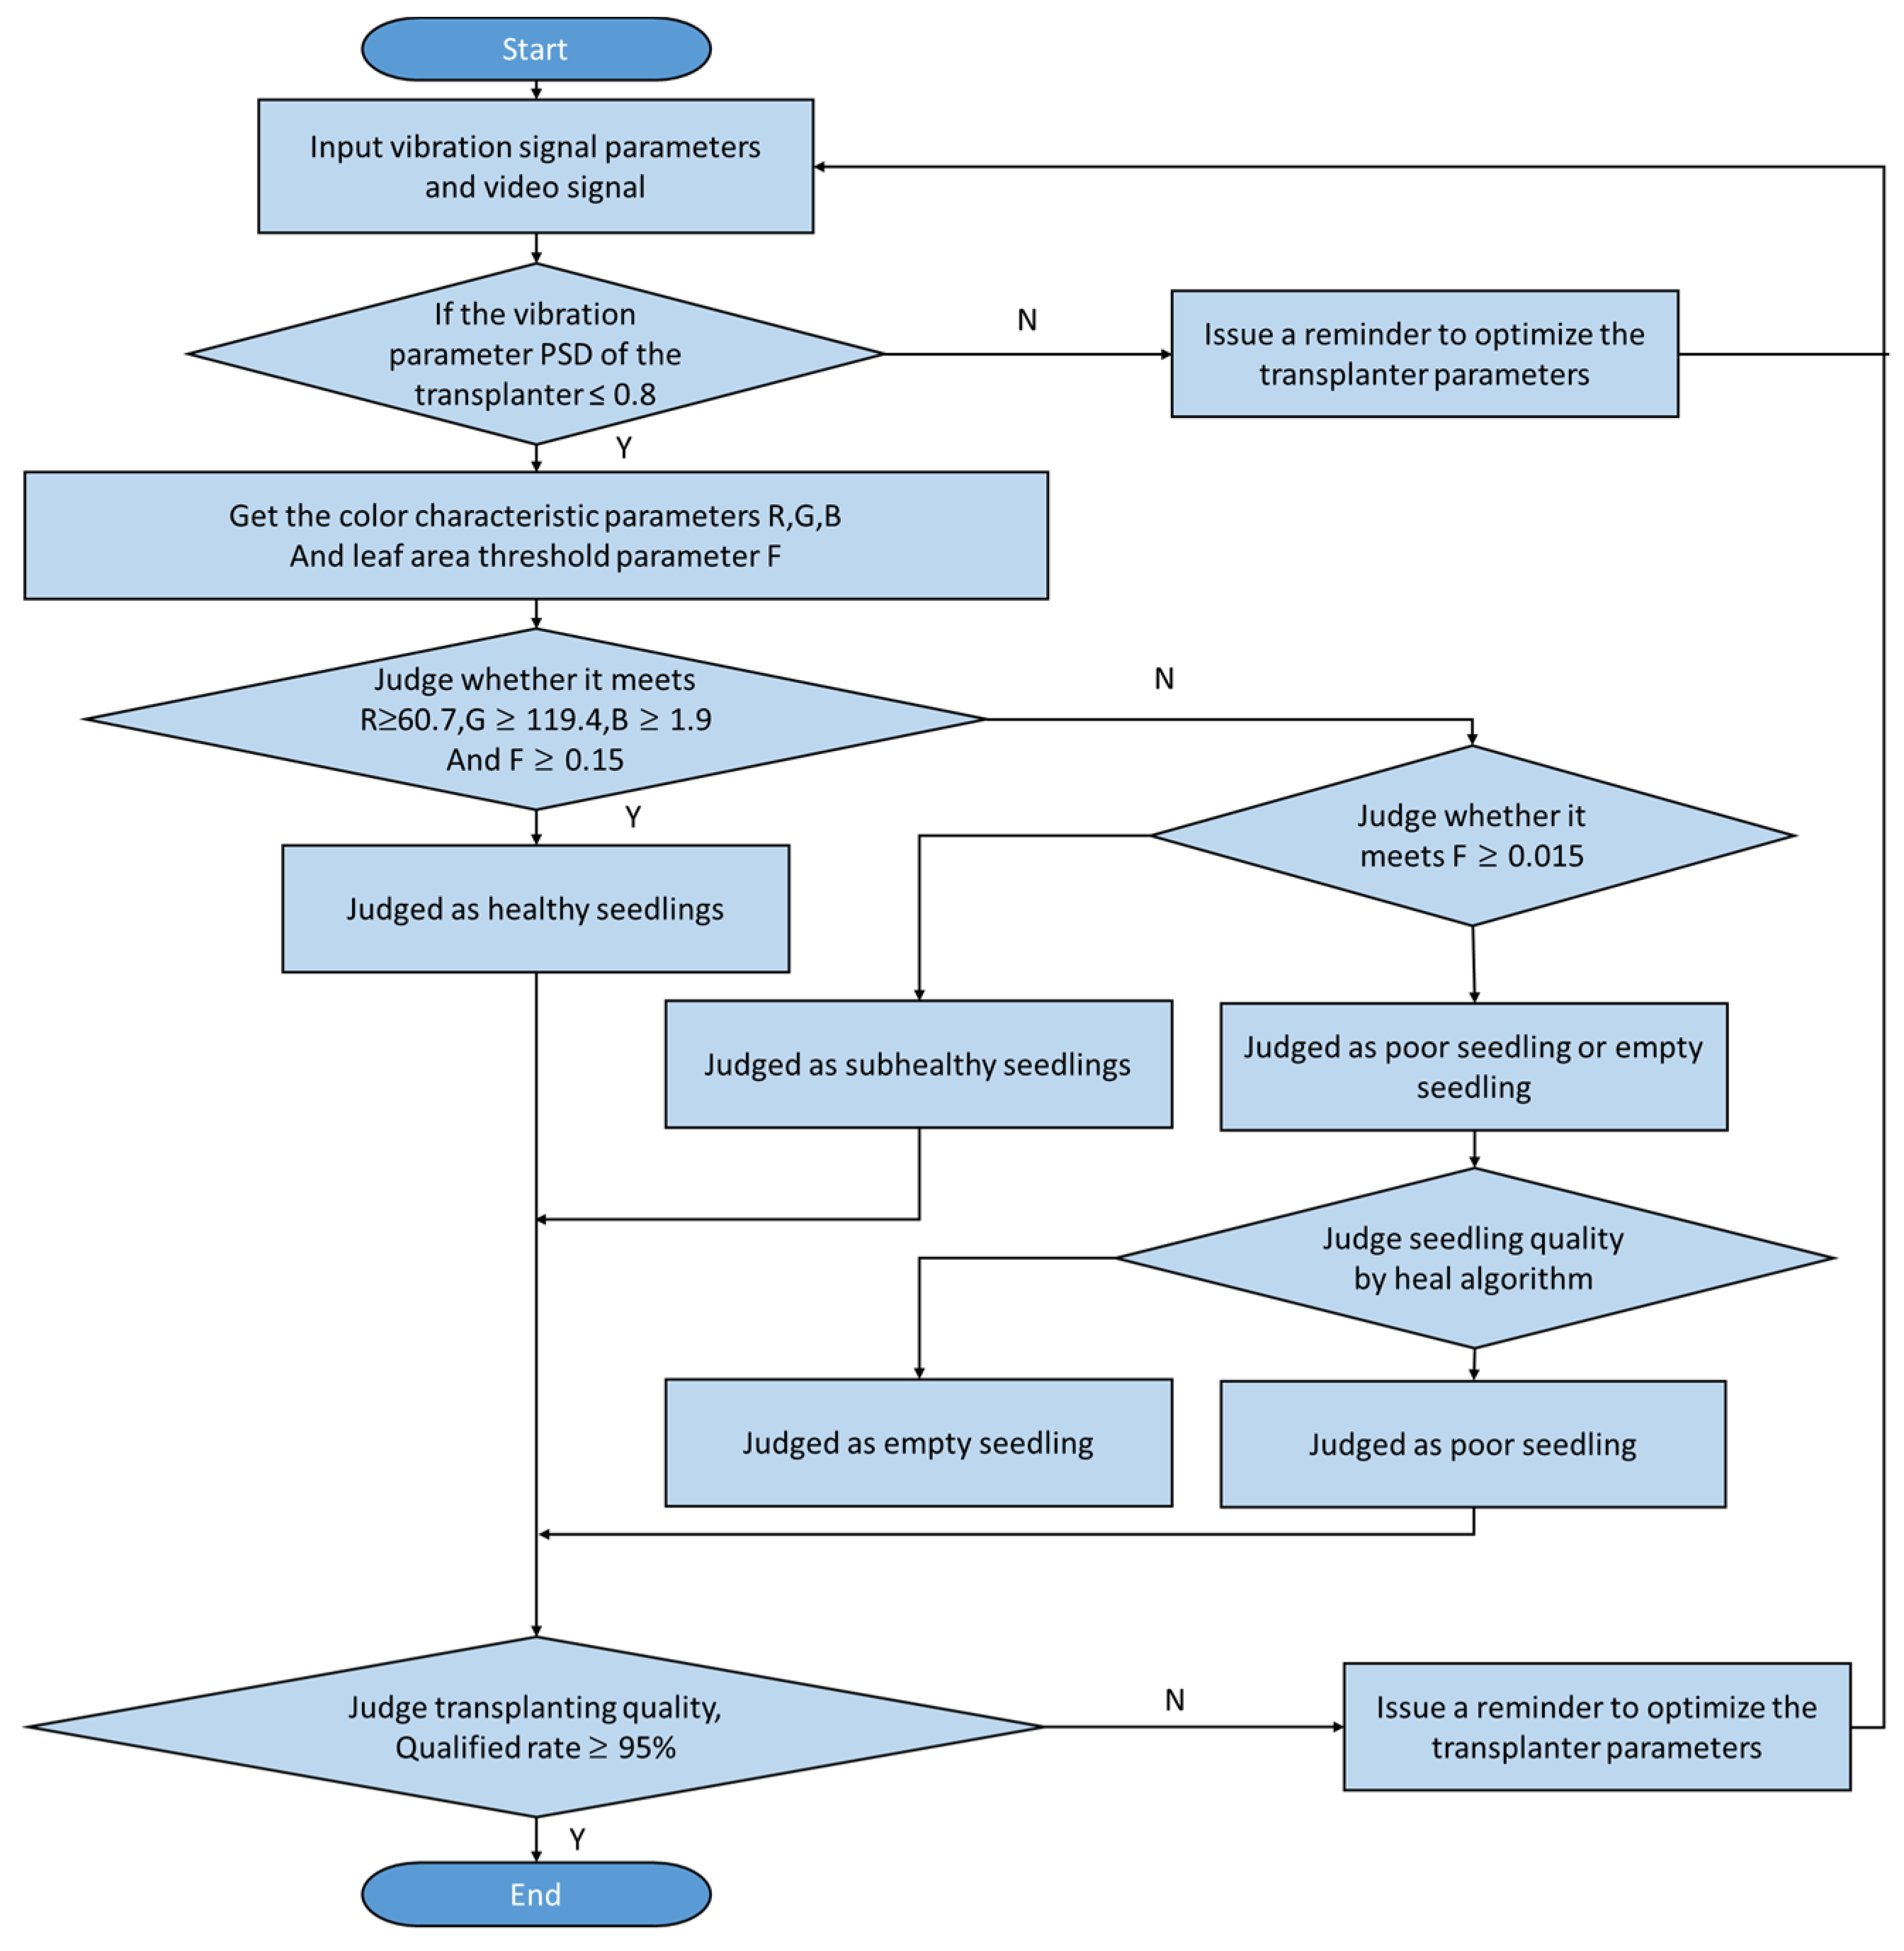
2.4. A Hybrid Evaluation Method Based on DT Model and Data-Driven Transplanting Effect

Through the hybrid approach, the evaluation of transplant quality by data-driven methods is systematically observed, and the results are corrected theoretically by empirical derivation. Figure 10 shows the steps of implementing the hybrid method based on the DT model and a data-driven approach: (1) the data-driven model is constructed and the monitoring of ETQ results is set as the observed values; (2) using a multi-physics field simulation, the DT model is converted into a state-space model for the hybrid algorithm settings; (3) a more accurate ETQ is calculated by the hybrid algorithm; (4) whether the ETQ has reached the threshold value is determined to make appropriate maintenance decisions or return to step (2) for iteration based on the judgment results.
The algorithm for intelligent recognition of healthy potted seedlings of vegetables mainly extracts and analyzes the image features of each potted seedling. A vegetable seedling’s leaf area M represents its growth conditions, so the leaf area features of vegetable seedlings are selected as one of the classification bases for the health recognition of potted seedlings. The digital image is composed of several square blocks of pixels, and the actual physical dimensions of the image pixels can be obtained by calibrating the camera size. Counting the number of pixels occupied by the mantle leaves in the image and converting the proportion can determine the actual area of the leaves. The threshold F is determined by the ratio of extracted leaf area to pore area in vegetable potted seedlings. The Heal algorithm for intelligent identification of healthy vegetable potted seedlings and rejection of inferior-quality seedlings finally detects healthy vegetable potted seedlings by comparing the threshold value F.
In fact, most of the obtained images of vegetable potting plants are disturbed by noise, and it is important to denoise the obtained images. The noise in image processing is mainly Gaussian. The three-dimensional block matching filtering (BM3D) algorithm is a denoising algorithm based on the three-dimensional transform domain, which is one of the best algorithms for processing video and image noise reduction. The algorithm is divided into two steps: First, a base valuation is obtained from the block-matching 3D matrix transformation; then the noise image is filtered by the obtained base valuation, and the overlapping blocks are revalued and weighted averaged by the aggregation method to obtain the final image.
The basic principle of block matching is to divide an image into several parts of a specific size that do not overlap. Let the displacement of each pixel in each part be the same, select a specific search area, and then delineate it. The matching criterion is formulated to search for blocks that are similar to the current block in the search area, that is, the matching block.
I represents the image containing noise; P represents any matching block that has been divided and the block size of P is set to K × K. Q represents the sliding window block during the search process. If the block size is known, its upper left pixel point represents the matching block, PI, and QI. During the block matching process, an appropriate step size h is determined first, and then the blocks are divided and searched based on the principle of a top-to-bottom, left-to-right sequential approach. The current block P is selected as the reference block, and the area with P as the center point and the diameter d as its search area,
S ( P ) = { Q I | d ( X P , X Q ) | < τ d }
where S ( P ) is set as the three-dimensional matrices aggregated from similar blocks, and τ d is the distance threshold during the search process. The distance d between the matching blocks in the search process is as follows:
d = h 1 X P X Q
where X is the matrix value of the matching block.
Finally, S ( P ) as the set of matrix blocks in the matrix is arranged in the order of d(P, Q) and a three-dimensional matrix T S ( P ) of K × K × S(P) is obtained. Then the denoising in the three-dimensional transform domain can be expressed as follows:
F ( P ) = N 3 D 1 ( γ ( N 3 D ( T S ( P ) ) ) )
where N 3 D denotes the three-dimensional you-transformation of the three-dimensional matrix T S ( P ) , and the operator is N 3 D . The equation of the function γ is as follows:
γ ( X ) = { 0 , ( | X | λ 3 D σ ) X , ( | X | > λ 3 D σ )
where, λ 3 D is the threshold parameter of hard threshold filtering, and σ is the parameter of Gaussian white noise.
The advantage of this denoising method is that it can distinguish noise from useful information in the strip image without any loss of energy. Useful information can be correctly distinguished from irrelevant information, such as noise T S ( P ) . Because most of useful image information is at the top of the energy of the 3D matrix T S ( P ) , and irrelevant information such as noise is often at the bottom of the 3D matrix. This feature allows filtering by hard thresholds in the transform domain, which effectively removes noise while retaining most of the useful image information. After filtering the noisy image, each block will have its corresponding estimate, and each pixel will have its corresponding estimate. N P denotes the non-zero values in the filtered matrix coefficients, and W P denoting the estimated values of the underlying weights of the current block is as follows:
W P b a s i c { 1 N P ( N P 1 ) 1 ( N P < 1 )
In Equation (5), the base estimate of the 3D transform domain filtering is used to calculate the final estimated weights:
W P f i n a l = | τ 3 D ( T S ( P ) ) | 2 | τ 3 D ( T S ( P ) ) | 2 + σ 2
As can be seen, the larger the estimated weights, the smaller the noise entrained. Calculate the average estimate of each overlapping block in order to obtain the final image. The health of the potted seedlings is analyzed by using the threshold F and the unit leaf area of the Heal algorithm to classify the potted seedlings into healthy, sub-healthy, poor quality, and empty holes. The red “1” represents the healthy seedlings; the green “1” represents the sub-healthy seedlings; the yellow “1” represents the poor-quality seedlings; and the blue “0” represents empty holes. The Heal algorithm calibrates the seedling tray and outputs information about the coordinates of each type of seedling in the virtual model of the digital twin, as shown in Figure 11.
A plant transplanting DT model with actual physical transplanter mapping capability was established. Through the mapping interface, working conditions such as spindle speed, ambient temperature, seedling tray position, and transplantation effect are transmitted to the DT model for the model update. The updated DT model is simulated to calculate the operating state and effect of the transplanter. The collected data, such as vibration and image information, is used to train the machine learning model and determine whether the transplanting operation continues in another way, as shown in Figure 12.

2.5. Development and Configuration of the Digital Twin Service System

Unity 3D, SolidWorks 2020, and 3 dsMax 2017 are used to develop the PFT digital twin system, as shown in Figure 13. SolidWorks 2020 is first used for the 3D modeling of the HNWC020 plant transplanting machine, and then the animation of the transplanting process is created in 3 dsMax 2017. Finally, Unity 3D is used to design the system interface and the interaction of the program. The TCP/IP communication protocol is used to transfer the data from the physical machine to the digital twin system. Every 0.2 s, a piece of data from the operation of transplanting is obtained and stored in packets, and every 5 s, a packet is sent to the twin database. The digital twin system parses one packet every 5 s. The software runs at a frequency of 30 frames/s.

3. Results and Discussions

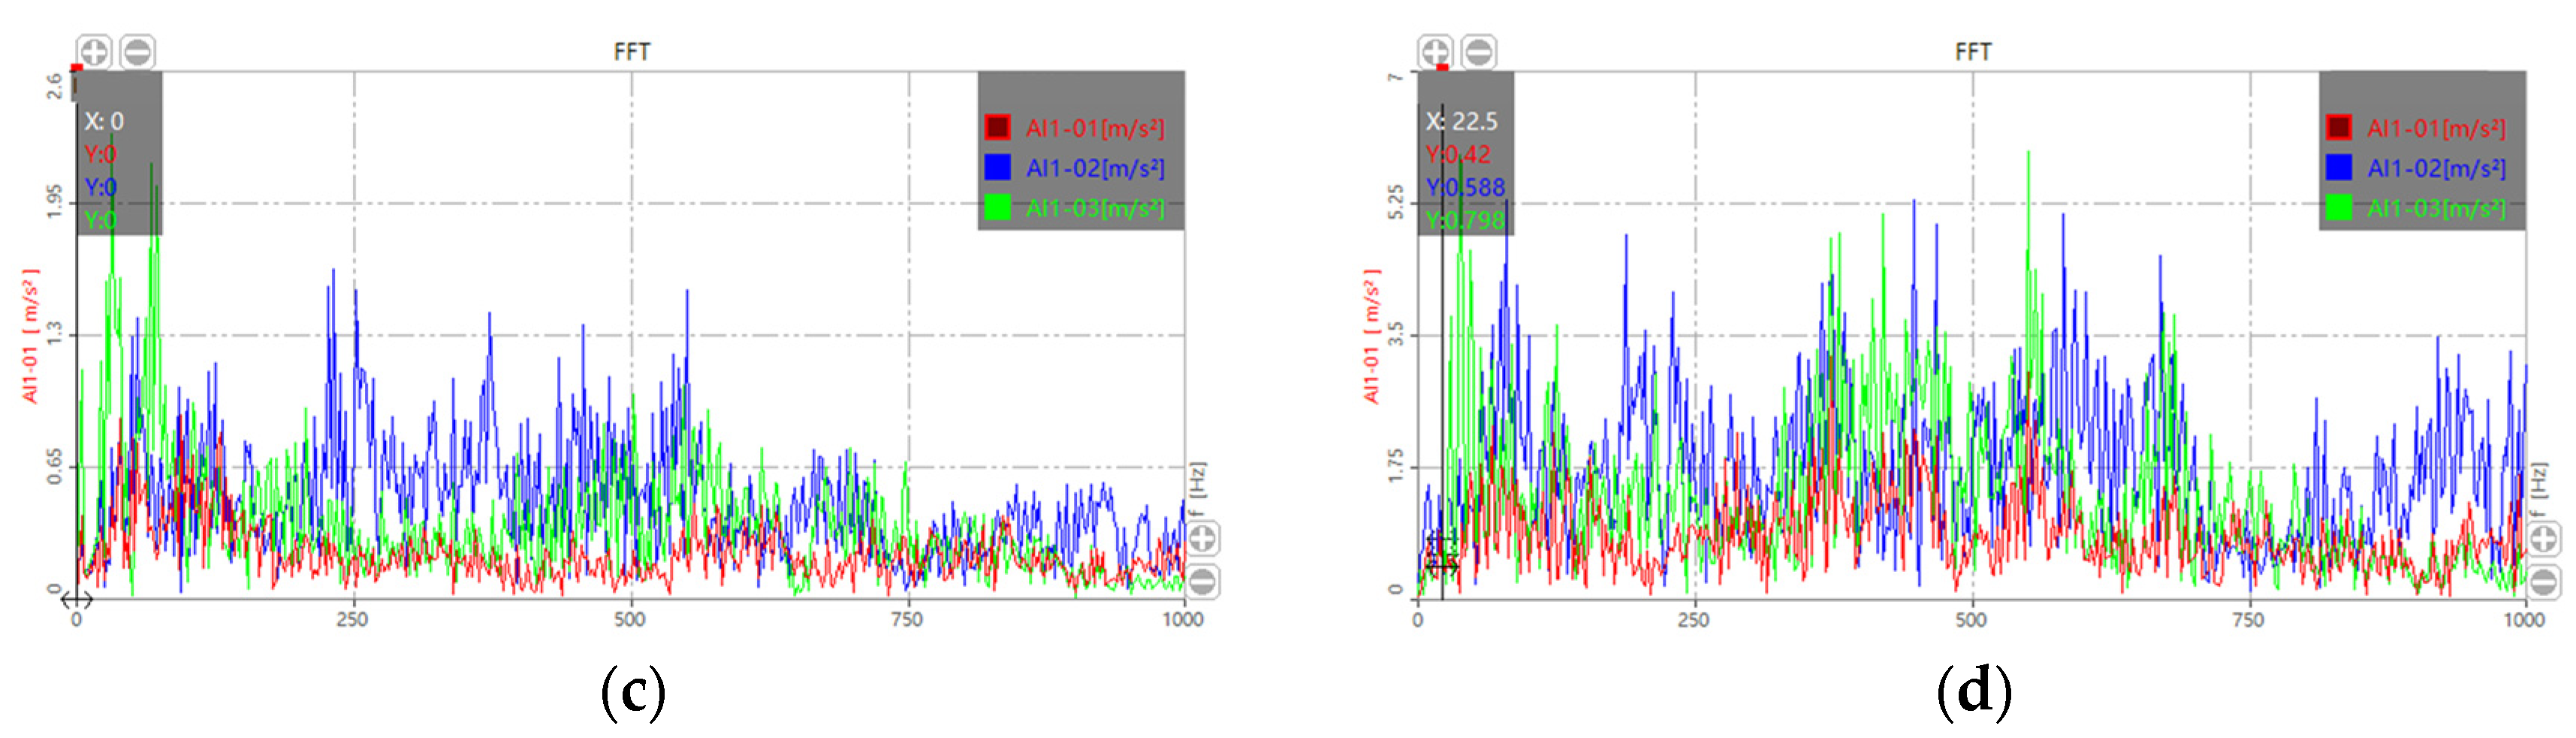
3.1. Data-Driven Comparative Analysis of Plant Factory Transplanting Equipment Working Conditions

To investigate the optimal working parameters of the plant transplanter, it is necessary to analyze the vibration characteristics under different working conditions. To study the acceleration state of the shifting manipulator of the plant transplanting equipment, three-axis acceleration sensors are placed on the beam above the transplanting manipulator. Figure 14 shows the vibration fitting cloud of the transplanter during horizontal sliding. The testing condition involves the horizontal motion of the mechanical arm of the transplanter, which moves the horizontal slider. The signal is sampled at a frequency of 2560 Hz. The root mean square (RMS) value is calculated every second. During a single cycle of transplanting, the lateral movement of the slider lasts for about 2 s.
Fast Fourier Transform (FFT) is used to extract the principal frequencies and harmonics of the signal. This feature describes the vibrational energy at a specific frequency. Three-dimensional vibrations are used to extract features. The FFT results indicate that these sensor data features have different frequencies.
Through the FFT analysis of the frequency domain, the mechanical vibration characteristics under different working conditions are visually reflected, as shown in Figure 14. As shown in Figure 14a, the vibration signal in the X, Y, and Z-axis directions does not have obvious peaks in condition 1. The vibration amplitude in each axis direction is significantly increased in condition 2. In the low frequency range within 100 Hz, the vibration is mainly in the X-axis direction, in which two wave peaks appear. This may be due to the coupling resonance between the transplanting parts of the transplanter and the original test stand during the transplanting process. As shown in Figure 14c, the vibration amplitude in the low frequency range within 100 Hz increases significantly in the X-axis direction, with a maximum value of 2.45 m/s2. The vibration amplitude in the medium frequency range of 210–580 Hz increases significantly in the Z-axis direction, with a maximum value of 1.5 m/s2. As in Figure 14d, the amplitude in the X-, Y- and Z-axis directions increases significantly in condition 4. The large amplitude in the Z-axis direction will affect the transplanting accuracy and uprightness of potted seedlings, which means that it is not suitable for transplanting in condition 4. The above analysis reflects the vibration frequency domain characteristics of the transplanting machinery under different working conditions but does not reflect the vibration energy of each time period. From the above analysis, it can be seen that under conditions 1 and 2, the vibration amplitude is small and the transplantation efficiency is low. Under condition 4, it is easy for parts to resonate, easily causing damage to the transplanting parts. At medium speed, transplanting of 3000 plants/h, the high transplanting efficiency can be maintained, and the vibration signal of the X, Y, and Z axes above the transplanting robot is relatively gentle, which is suitable for transplanting.

3.2. Comparative Analysis of Real-Time Image Processing Effects of Transplanting Potted Seedlings

To improve the final recognition accuracy of an image analysis system, it is essential to conduct a comparative analysis of potted seedling transplantation classification algorithms under optimal working conditions. This will help ensure that the image information obtained is of higher quality and more suitable for accurate recognition. As shown in Figure 15 four methods: the optimal threshold method for threshold segmentation, the traditional maximum inter-class variance method, the optimal threshold method for threshold segmentation combined with the traditional Wiener algorithm, and the optimal threshold method for threshold segmentation combined with the 3D block matching filter algorithm are selected for image information processing of potted seedlings.
To verify the rationality of the genetic algorithm-based optimal threshold method in this article, the optimal threshold method based on the genetic algorithm and the traditional maximum inter-class variance method for threshold segmentation are performed on the original images of two pepper seedlings in Figure 15a, respectively. The threshold segmentation results are shown in Figure 15b,c. It can be seen that the image obtained by the optimal threshold segmentation based on a genetic algorithm can clearly segment the leaves of pepper seedlings from the background. However, the image obtained by the traditional maximum interclass variance threshold segmentation fails to segment the leaves of pepper seedlings, and the image is blurred, not meeting the requirements. This comparison can verify the reasonableness of the optimal threshold method based on a genetic algorithm for threshold segmentation. In addition, the following comparison of image denoising algorithms is only based on Figure 15b,c and does not meet the requirements and cannot satisfy the conditions for further testing. To verify the rationality of the 3D block matching filtering algorithm selected in this paper, the two images in Figure 15b are denoised based on the 3D block matching filtering algorithm and the conventional Wiener algorithm, respectively. The denoised results of the image are shown in Figure 15d,e.
From the above figures, it can be seen that the traditional Wiener algorithm image denoising of Figure 15b,c fails to remove the noise close to the leaves and larger areas, resulting in significant overall error. In contrast, using the three-dimensional block matching filtering algorithm of Figure 15b,c for image denoising, Figure 15e, obtained by using the 3D block matching filtering algorithm for image denoising in Figure 15b,c, can almost completely remove the noise generated by the background parts, except for the leaves of pepper seedlings, and the denoising effect is good. Through comparison, the rationality of the optimal threshold method for threshold segmentation combined with the 3D block matching filtering algorithm for image denoising can be verified.

3.3. Evaluation of Transplanting Effects with Digital Twin Virtual Mapping Reproduction

As shown in Figure 16, potted seedlings processed in real-time are discriminatively classified and mapped into a virtual seedling tray grid. The final recognition maps are shown in Figure 16a,b. The optimal threshold method is used for threshold segmentation; the 3D block matching filtering algorithm and traditional Wiener algorithm are used for image denoising, respectively. The red “1” represents healthy seedlings; the green “1” represents sub-healthy seedlings; the blue “0” represents poor-quality seedlings; and the yellow number indicates the holes. The Heal algorithm calibrates the seedling tray and outputs the coordinates of each type of seedling, as shown in Figure 16.
From Figure 16a, based on the traditional Wiener algorithm, the coordinates of inferior seedlings in the seedling tray I are (3, 1), and in seedling tray II are (5, 2) (1, 3). The coordinates of sub-healthy seedlings are (1, 1), (2, 1), (7, 1), and (6, 2), and the remaining are healthy seedlings. From Figure 16b, based on the 3D block matching filtering algorithm, the coordinates of inferior seedlings in the seedling tray I are (3, 1), and the coordinates of sub-healthy seedlings are (6, 3). In seedling tray II, the coordinates of inferior seedlings are (1, 3), (5, 2), and (7, 1), and the coordinates of sub-healthy seedlings are (1, 1), (2, 1), (5, 1), (4, 2), and (6, 2), while the remaining are healthy seedlings. As shown in Figure 17, the accuracy of digital twin virtual mapping for transplanted seedlings is reflected in the recognition and analysis of more than 4000 seedling tray images. From Figure 17, it can be seen that by combining the optimal threshold method and the traditional Wiener algorithm for image threshold segmentation and denoising, the recognition rate of healthy seedlings can reach 94.3%. Through comprehensively using the optimal threshold method and 3D block matching filtering algorithm for image threshold segmentation and denoising, the recognition rate of healthy seedlings has reached over 96.10%. As such, this experiment is more suitable for using the optimal threshold method and 3D block matching filtering algorithm for image threshold segmentation and denoising, and the recognition accuracy is high.
The digital twin model-based and data-driven transplanting effect evaluation method can monitor the working status and evaluate the transplanting effect of plant transplanters online. The method can overcome the poor adaptability and difficulty of updating physical models, greatly improving the monitoring and optimization efficiency of configuration parameters. At the same time, the generated virtual entity mapping is more intuitively reflected in the control interface, which can significantly reduce the dependence of equipment operators on relevant expertise. If VR/AR technology can be combined in the future, it will bring a better planting experience, and operators may also grow vegetables like video games.

4. Conclusions

This case focuses on evaluating the vibration and transplanting effect of the transplanting manipulator, which plays an intelligent decision-making role in the regulation of the transplanting system. The transplanting robot is an important part of PFT, and its condition directly affects the accuracy and quality of plant transplanting. It is not only the vibration of the transplanting manipulator that reduces the dimensional accuracy of the planting but also the fatigue deformation of the machine, which shortens its service life. Traditionally, transplant monitoring is based on work experience and statistics, which would lead to improper or excessive maintenance. A DT-based hybrid application is studied for real-time vibration monitoring and real-time evaluation of key components of transplanters. At medium speed, transplanting of 3000 plants/h, the high transplanting efficiency can be maintained, and the vibration signal of the X, Y, and Z axes above the transplanting robot is relatively gentle, which is suitable for transplanting. In terms of transplanting effect evaluation, this study combines machine vision and artificial intelligence technology for real-time discrimination and classification of the video images after transplanting. The real-time evaluation of the transplanting effect is obtained to provide data support for the intelligent decision-making of transplanting machines. Combining the optimal threshold method with the traditional Wiener algorithm, the identification rate of healthy potted seedlings can reach 94.3%. Through comprehensively using the optimal threshold method and 3D block matching filtering algorithm for image threshold segmentation and denoising, the recognition rate of healthy seedlings has reached over 96.10%. In the future, the implementation of cloud and edge-based DT models as well as DT-based model migration learning will be further investigated.

Author Contributions

Conceptualization, K.C. and Y.Y.; methodology, K.C. and Y.Y.; software, R.L.; validation, L.Z., K.N. and X.J.; formal analysis, L.Z.; investigation, H.G.; resources, Y.Z.; data curation, S.G.; writing—original draft preparation, K.C. and B.Z.; writing—review and editing, K.C.; visualization, K.C.; supervision, R.L.; project administration, K.C.; funding acquisition, Y.Z. and B.Z. All authors have read and agreed to the published version of the manuscript.

Funding

This research was funded by the National Key Research and Development Program of China Sub-project grant number [No. 2021YFD2000705]. And The APC was funded by [No. 2021YFD2000705].

Institutional Review Board Statement

Not applicable.

Informed Consent Statement

Not applicable.

Data Availability Statement

Not applicable.

Conflicts of Interest

The authors declare no conflict of interest.

References

  1. Wang, X.; Zubko, V.; Onychko, V.; Zhao, M. Development status and trend of plant factory intelligence in China. Sci. Bulletin. Ser. F Biotechnol. 2022, 26, 65–70. [Google Scholar]
  2. Van Henten, E.J. Automation and Robotics in Greenhouses; Marcelis, L., Heuvelink, E., Eds.; Burleigh Dodds Science Publishing: Cambridge, UK, 2019; Volume 63, pp. 359–378. [Google Scholar] [CrossRef]
  3. Liu, Y.; Mousavi, S.; Pang, Z.; Ni, Z.; Karlsson, M.; Gong, S. Plant Factory: A New Playground of Industrial Communication and Computing. Sensors 2022, 22, 147. [Google Scholar] [CrossRef] [PubMed]
  4. Zhang, P.; Li, D. EPSA-YOLO-V5s: A novel method for detecting the survival rate of rapeseed in a plant factory based on multiple guarantee mechanisms. Comput. Electron. Agric. 2022, 193, 106714. [Google Scholar] [CrossRef]
  5. Sun, J.; Sun, W.; Zhang, G.; Lv, B.; Li, C. High efficient production of plant flavonoids by microbial cell factories: Challenges and opportunities. Metab. Eng. 2022, 70, 143–154. [Google Scholar] [CrossRef] [PubMed]
  6. Rahul, K.; Raheman, H.; Paradkar, V. Design and development of a 5R 2DOF parallel robot arm for handling paper pot seedlings in a vegetable transplanter. Comput. Electron. Agric. 2019, 166, 105014. [Google Scholar] [CrossRef]
  7. Jin, X.; Tang, L.; Li, R.; Zhao, B.; Ji, J.; Ma, Y. Edge recognition and reduced transplantation loss of leafy vegetable seedlings with Intel RealsSense D415 depth camera. Comput. Electron. Agric. 2022, 198, 107030. [Google Scholar] [CrossRef]
  8. Jin, X.; Yuan, Y.; Ji, J.; Zhao, K.; Li, M.; Chen, K. Design and implementation of anti-leakage planting system for transplanting machine based on fuzzy information. Comput. Electron. Agric. 2020, 169, 105204. [Google Scholar] [CrossRef]
  9. Tong, J.; Qiu, Z.; Zhou, H.; Bashir, M.K.; Yu, G.; Wu, C.; Du, X. Optimizing the path of seedling transplanting with multi-end effectors by using an improved greedy annealing algorithm. Comput. Electron. Agric. 2022, 201, 107276. [Google Scholar] [CrossRef]
  10. Yang, Q.; Ahmad, I.; Faheem, M.; Siddique, B.; Xu, H.; Addy, M. Development and assessment of belt-drive seedlings transmission device for fully-automatic vegetable transplanter. Comput. Electron. Agric. 2021, 182, 105958. [Google Scholar] [CrossRef]
  11. Fu, W.; Gao, J.; Zhao, C.; Jiang, K.; Zheng, W.; Tian, Y. Detection Method and Experimental Research of Leafy Vegetable Seedlings Transplanting Based on a Machine Vision. Agronomy 2022, 12, 2899. [Google Scholar] [CrossRef]
  12. Zhang, L.; Yang, X.; Li, T.; Gan, R.; Wang, Z.; Peng, J.; Hu, J.; Guo, J.; Zhang, Y.; Li, Q.; et al. Plant factory technology lights up urban horticulture in the post-coronavirus world. Hortic. Res. 2022, 9, uhac018. [Google Scholar] [CrossRef] [PubMed]
  13. Ji, J.T.; Chen, K.K.; Jin, X.; Pang, J.; Chen, X.; Wang, Z.Y.; Fan, J.Y. Research on the Beam Damage Diagnosis Method for a High-Speed Transplanter Based on the Strain Mode. Appl. Eng. Agric. 2021, 37, 25–32. [Google Scholar] [CrossRef]
  14. Ji, J.; Chen, K.; Jin, X.; Wang, Z.; Dai, B.; Fan, J.; Lin, X. High-efficiency modal analysis and deformation prediction of rice transplanter based on effective independent method. Comput. Electron. Agric. 2020, 168, 105126. [Google Scholar] [CrossRef]
  15. Wang, X.; Vladislav, Z.; Viktor, O.; Wu, Z.; Zhao, M. Online recognition and yield estimation of tomato in plant factory based on YOLOv3. Sci. Rep. 2022, 12, 8686. [Google Scholar] [CrossRef]
  16. Wang, X.; Wu, Z.; Jia, M.; Xu, T.; Pan, C.; Qi, X.; Zhao, M. Lightweight SM-YOLOv5 Tomato Fruit Detection Algorithm for Plant Factory. Sensors 2023, 23, 3336. [Google Scholar] [CrossRef]
  17. Ariesen-Verschuur, N.; Verdouw, C.; Tekinerdogan, B. Digital Twins in greenhouse horticulture: A review. Comput. Electron. Agric. 2022, 199, 107183. [Google Scholar] [CrossRef]
  18. Zhao, Y.; Lian, L.; Bi, C.; Xu, Z. Digital twin for rapid damage detection of a fixed net panel in the sea. Comput. Electron. Agric. 2022, 200, 107247. [Google Scholar] [CrossRef]
  19. Pylianidis, C.; Osinga, S.; Athanasiadis, I.N. Introducing digital twins to agriculture. Comput. Electron. Agric. 2021, 184, 105942. [Google Scholar] [CrossRef]
  20. Verdouw, C.; Tekinerdogan, B.; Beulens, A.; Wolfert, S. Digital twins in smart farming. Agric. Syst. 2021, 189, 103046. [Google Scholar] [CrossRef]
  21. Tao, F.; Cheng, J.; Qi, Q.; Zhang, M.; Zhang, H.; Sui, F. Digital twin-driven product design, manufacturing and service with big data. Int. J. Adv. Manuf. Technol. 2018, 94, 3563–3576. [Google Scholar] [CrossRef]
  22. Tao, F.; Zhang, M.; Cheng, J.; Qi, Q. Digital twin workshop: A new paradigm for future workshop. Comput. Integr. Manuf. Syst. 2017, 23, 1–9. [Google Scholar]
  23. Luo, W.; Hu, T.; Ye, Y.; Zhang, C.; Wei, Y. A hybrid predictive maintenance approach for CNC machine tool driven by Digital Twin. Robot. Comput.-Integr. Manuf. 2020, 65, 101974. [Google Scholar] [CrossRef]
  24. Tao, F.; Sui, F.; Liu, A.; Qi, Q.; Zhang, M.; Song, B.; Guo, Z.; Lu, S.C.Y.; Nee, A.Y.C. Digital twin-driven product design framework. Int. J. Prod. Res. 2019, 57, 3935–3953. [Google Scholar] [CrossRef]
  25. Zhuang, C.; Liu, J.; Xiong, H.; Ding, X.; Liu, S.; Weng, G. Connotation, architecture and trends of product digital twin. Comput. Integr. Manuf. Syst. 2017, 23, 753–768. [Google Scholar]
Figure 1. A digital twin and application of it to PFT.
Agriculture 13 01165 g001
Figure 2. A digital twin-based hybrid approach to monitoring and maintenance framework.
Agriculture 13 01165 g002
Figure 3. Implementation of the multi-domain model.
Agriculture 13 01165 g003
Figure 4. Methods to verify DT accuracy.
Agriculture 13 01165 g004
Figure 5. Overall design of PFT digital twin experiment platform.
Agriculture 13 01165 g005
Figure 6. Construction of the virtual entity model.
Agriculture 13 01165 g006
Figure 7. DT model update method for plant transplanting.
Agriculture 13 01165 g007
Figure 8. Construction of the data-driven model.
Agriculture 13 01165 g008
Figure 9. Elimination of trends using polynomials of different orders. (a) Raw data signal. (b) Signal after removing trend term.
Agriculture 13 01165 g009
Figure 10. DT-based and data-driven hybrid approach steps.
Agriculture 13 01165 g010
Figure 11. Virtual model mapping of the digital twin.
Agriculture 13 01165 g011
Figure 12. Hybrid evaluation method of PFT transplanting effect.
Agriculture 13 01165 g012
Figure 13. PFT Digital Twin Service System.
Agriculture 13 01165 g013
Figure 14. Signal characteristics of X, Y, Z triaxial acceleration frequency domain. (a) FFT frequency domain characteristics in condition 1. (b) FFT frequency domain characteristics in condition 2. (c) FFT frequency domain characteristics in condition 3. (d) FFT frequency domain characteristics in condition 4.
Agriculture 13 01165 g014aAgriculture 13 01165 g014b
Figure 15. Real-time image processing comparison of transplanting potted seedlings. (a) Qriginal images; (b) Optimal threshold method; (c) Maximum inter-category variance method; (d) Wiener algorithm; (e) 3DBM filtering algorithm.
Agriculture 13 01165 g015
Figure 16. Virtual mapping reproduction of digital twin seedling tray. (a) Bowl seedling classification and digital twin Mapping based on traditional Wiener Algorithm. (b) Bowl seedling classification and digital twin mapping based on 3D block matching filtering algorithm.
Agriculture 13 01165 g016
Figure 17. Accuracy of digital twin virtual mapping for transplanted seedlings.
Agriculture 13 01165 g017
Table 1. Datasets of transplanting digital twin system.
Work Condition Serial NumberWorking StatusType of DataAcquisition Frequency
1Standby
Start-up
Vibration D12560 Hz
Transverse motor power D250 Hz
Vertical motor power D350 Hz
Parallel motor power D450 Hz
2Low speed transplant
1500 plants/h
Vibration D12560 Hz
Transverse motor power D250 Hz
Vertical motor power D350 Hz
Parallel motor power D450 Hz
3Medium speed transplant
3000 plants/h
Vibration D12560 Hz
Transverse motor power D250 Hz
Vertical motor power D350 Hz
Parallel motor power D450 Hz
4High speed transplant
4500 plants/h
Vibration D12560 Hz
Transverse motor power D250 Hz
Vertical motor power D350 Hz
Parallel motor power D450 Hz
Disclaimer/Publisher’s Note: The statements, opinions and data contained in all publications are solely those of the individual author(s) and contributor(s) and not of MDPI and/or the editor(s). MDPI and/or the editor(s) disclaim responsibility for any injury to people or property resulting from any ideas, methods, instructions or products referred to in the content.

