Article

Complex Profiling of Roasted Coffee Based on Origin and Production Scale

NCDO-INOE 2000, Research Institute for Analytical Instrumentation Subsidiary, 67 Donath Street, 400293 Cluj-Napoca, Romania
*
Author to whom correspondence should be addressed.
Agriculture 2023, 13(6), 1146; https://doi.org/10.3390/agriculture13061146
Submission received: 4 April 2023 / Revised: 24 April 2023 / Accepted: 24 May 2023 / Published: 29 May 2023
(This article belongs to the Section Agricultural Product Quality and Safety)

Abstract

:
Coffee is one of the most popular beverages in the world due to its flavor, aroma, energy content, and complex nutritional profile. Many factors affect coffee’s characteristics, including its origin, storage, and roasting conditions. In this context, this study analyzes 100% Arabica medium-roasted coffee from six countries (El Salvador, Guatemala, Brazil, the Democratic Republic of the Congo, Ethiopia, and Colombia) to assess its total polyphenols, individual polyphenols, total antioxidant capacity, hydro- and liposoluble vitamins, and PAHs using analytical techniques such as high-performance liquid chromatography (HPLC), FT-NIR spectrometry, UV-VIS spectrophotometry, and photochemiluminescence. A total of 67 samples were collected from Romanian general and specialty stores. According to the study, coffee composition varies by origin, pedo-climatic characteristics, and store (general or specialty). The highest values for total polyphenols, polyphenols, and antioxidant capacity were obtained for Ethiopian coffee. The highest values of lipids and proteins were obtained in El Salvador and Guatemala, B1 and B2 in Brazil, B3 and B6 in Ethiopia, α- and β-tocopherol in Brazil, D. R. Congo, and Ethiopia. Specialty coffee had significantly higher levels than general store coffee for all investigated parameters. All coffee samples analyzed were within the maximum allowed levels for PAHs as set by regulations concerning food contaminants.

1. Introduction

Coffee is the third most consumed beverage around the world, topped only by water and tea. Although the Coffea species that produce the coffee beans are cultivated in 70 countries, coffee is consumed all around the world in many ways, both hot and cold [1]. In 2020, the EU imported 2.9 million tons of coffee, mainly from Brazil and Vietnam, accounting for about one-third of global consumption, making it the largest coffee market in the world [2,3,4]. The biggest coffee importing EU member states in 2021 were Germany, with 1.1 million tones, Italy, with 0.5 million tons, and Belgium, with 0.3 million tons [2,3]. The coffee is imported raw as green coffee and is roasted mainly in the EU countries mentioned above [2,3]. The highest per capita coffee consumption in the world is in Luxemburg, with an average of 11 kg per person per year [5]. The most imported types of coffee in 2018 were Arabica (60.5%), Brazilian Naturals (33.2%), and Colombian Milds (7.2%) [5]. Cities in Europe set the standard for coffee shops by offering customers high-end, sophisticated varieties. Consumer interest in how coffee is brewed, as well as where, how, and by whom the coffee was cultivated, has led to an increase in the market for specialty coffee. Therefore, it has become crucial for manufacturers of specialty coffee to explain the history of their product, including its origin and other environmental and social factors [5,6].
Coffee has many benefits for human health due to its complex nutritional profile and bioactive compound content [6,7,8,9]. Some of the health benefits of coffee, besides a boost in energy, include protection against type 2 diabetes, control of Parkinson’s disease symptoms, the prevention of cardiovascular diseases, the promotion of gut health, and lowered risk of cancer and depression [6,7,8,9,10,11,12,13]. The main bioactive compounds of coffee are phenolic compounds (e.g., chlorogenic acids and its derivates), diterpenes (cafestol and kahweol), methylxanthines (e.g., caffeine, theobromine, and theophylline), nicotinic acid (vitamin B3), and trigonelline [6,14]. Yamagata assessed evidence suggesting that polyphenols found in coffee have a preventive action on metabolic syndrome-associated endothelial dysfunctions, which is a risk factor for atherosclerosis-associated cardiovascular disease and type 2 diabetes. They concluded that the antioxidative effects of coffee components may be a basic feature of the prevention of metabolic syndrome [15]. Socała et al. evaluated in vitro and in vivo studies that demonstrated that coffee and its bioactive compounds exert neuroprotective effects, suggesting their preventive and/or therapeutic potential for different neurodegenerative conditions [16]. Many studies have been made on the correlation between bioactive compounds and roasting methods due to the fact that the physical, chemical, and taste properties of coffee are affected by temperature and roasting time [16,17,18,19,20,21]. A significant reduction in total chlorogenic acid content in coffee beans was observed during roasting [19,21]. A medium degree of roasting offers the optimal ratio of flavor and bioactive compound content with a minimum amount of acrylamide formation [18,19].
Roasted coffee bean characterization is a crucial element in ensuring coffee quality control and authentication. The process entails detecting and measuring various compounds present in coffee, including volatile and non-volatile compounds, sugars, acids, and phenolic compounds. The composition of roasted coffee beans is affected by multiple factors, such as the type of coffee, the conditions under which the roasting took place, and storage conditions. Since food adulteration is a current problem, many analytical techniques have been used for the development of coffee authentication and characterization methods. The most commonly used techniques are high-performance liquid chromatography (HPLC) with mass spectral (MS) detection, Fourier transform near-infrared spectroscopy (FT-NIR), and nuclear magnetic resonance (NMR) spectroscopy. Recent studies have explored the use of HPLC with in-column derivatization, non-targeted HPLC-UV fingerprinting, and multivariate classification techniques to authenticate coffee samples and detect adulteration. Other studies have employed spectroscopy-based methods, including FT-NIR and handheld near-infrared spectroscopy, to evaluate the authenticity of coffee samples. Additionally, the use of chemometric approaches in conjunction with analytical techniques has been explored to improve the accuracy and efficiency of coffee authentication methods [22,23,24,25,26,27,28,29,30,31,32].
Our study focuses on medium-roasted 100% Arabica beans grown in six different countries: El Salvador, Guatemala, Brazil, the Democratic Republic of the Congo, Ethiopia and Colombia (the most common origin for beans used in Romania). The aim of the study is to analyze roasted coffee using different analytical techniques (HPLC with fluorescence and DAD detectors, FT-NIR spectrometry, photochemiluminescence, and UV-VIS spectrophotometry) to create a complex profile and to correlate the data with the origin and the particular climate where the coffee was cultivated. The difference between specialty coffee and coffee from the general store was also studied. This complementary study is based on consumer opinion regarding the differences between these coffees when it comes to price, organoleptic properties, and energy intake. Comparing specialty and commercial coffee samples can provide valuable insights into the coffee industry and help inform decisions related to production, marketing, and research.

2. Materials and Methods

2.1. Materials

All solvents were HPLC grade from VWR (Darmstadt, Germany), with ultra-pure water obtained using the ULTRACLEAR UV UF EVOQUA Purification system (Pittsburgh, PA, USA), Florisil 200 mesh, fine powder from Supelco (Saint Louis, MO, USA), and the ACL Kit from Analitk Jena (Jena, Germany). All other standards used were from Sigma-Aldrich (Saint Louis, MO, USA).
In total, 67 medium-roasted samples of 100% Arabica coffee were collected from the Romanian market, general stores, and different specialized stores. (Table 1) Coffee from general stores was in individual 500 g packs of coffee beans and was stored in the store’s warehouse with an expiration date of 1 year from the pack date, while the specialty coffee was in individual 500 g packs of freshly roasted coffee beans and was stored in the store’s warehouse with an expiration date of 1 year from the roasting date.

2.2. Methods

2.2.1. Sample Extraction

Water extraction for total phenols and B vitamins analysis: 0.5 g of grinded sample was extracted with 1 mL of ultra-pure H2O for 20 min in an ultrasonic bath (SONOREX, Bandelin, RK 103H, Berlin, Germany) at room temperature. The samples were centrifuged (Microcentrifuge Hettich D-78532, Kirchlengern, Germany) at 11,000 rpm for 2 min and the supernatant was filtered through a 0.45 µm cellulose filter.
Methanol extraction for tocopherols analysis, polyphenols, and total antioxidant capacity: 0.5 g of grinded sample was extracted with 1 mL MeOH for 20 min in an ultrasonic bath at room temperature. The samples were centrifuged at 11,000 rpm for 2 min and the supernatant was filtered through a 0.45 µm cellulose filter.
Hexane extraction for PAH analysis: 10 g of grinded sample was extracted with 25 mL hexane for 20 min in an ultrasonic bath at room temperature. The samples were filtered through a 500 mg Florisil filter. The filtered extracts were concentrated to dryness under a light stream of nitrogen with an evaporator (RapidVap Vertex Dry Evaporator, Labconco, Kansas City, MO, USA) and brought back using 1 mL of acetonitrile.

2.2.2. Folin Ciocalteu Method for the Determination of the Total Polyphenolic Content

A method adapted from Bobková et al. was used [33]. A volume of 5 mL of distilled water, 1.5 mL of sodium carbonate solution (10%), 0.5 mL of sample, and 0.5 mL of Folin–Ciocalteu solution was pipetted into a 15 mL centrifuge tube. After the samples were kept for 45 min at room temperature in the dark, they were measured at a wavelength of 765 nm (Lambda 25, Perkin Elmer, Waltham, MA, USA). The results are expressed in gallic acid equivalents. The samples were obtained in triplicate and are expressed as mg GAE/g.

2.2.3. Total Antioxidant Capacity

After the methanol extraction, the samples were directly analyzed using the PHOTOCHEM antioxidant analyzer (Analytik Jena, Jena, Germania), and antioxidant capacity was measured using the ACL kit and is expressed in equivalent Trolox. The samples were obtained in triplicate and are expressed as mg/g Trolox equiv.

2.2.4. FT-NIR Analysis

A method adapted from Zhu et al. was used [34]. Using the Tango spectrometer from Bruker (Ettlingen, Germany), samples were measured directly without any extraction. Method parameters were as follows: measurement time, 64 s; resolution, 16 cm−1; scan type, rotating. The samples were obtained in triplicate and expressed as percentages.

2.2.5. B Vitamins Analysis

A slight variation of the method described by Grotzkyj Giorgi et al. was used for the quantification of B group vitamins in coffee [35]. A UHPLC Vanquisher H from Dionex (Thermo Fisher Scientific, Germering, Germany) with a DAD detector was used for the analysis of vitamins (Thiamine (B1), Riboflavin (B2), Nicotinamide (B3), Pyridoxine (B6), Cyanocobalamin (B12)). The mobile phase was composed of ultra-pure H2O with 1% acetic acid and MeOH in a gradient with a flow rate of 0.3 mL/min. The chromatographic column used was an Accucore aQ (100 × 2.1 mm, 2.6 μm) from Thermo Fisher, which was kept at 25 °C. The injection volume was 8 µL and the detector was set at 270 nm. B vitamin content in samples was expressed in µg/g.

2.2.6. Tocopherols Analysis

The method was an adaptation of a method developed in a previous study. A Perkin Elmer 200 Series High Performance Liquid Chromatograph (HPLC) with a fluorescence detector was used to determine tocopherols. The mobile phase consisted of ACN (50%), MeOH (45%), and H2O (5%) in isocratic mode with a flow of 0.75 mL/min. A Poroshell 120, EC-C18, 3.0 × 150 mm, 2.7 µm chromatographic column from Agilent (Santa Clara, CA, USA) was kept at 30 °C and was used for separation of the compounds. A volume of 5 µL of the sample was measured using a fluorescent detector set at 290 nm excitation and 330 nm emission. Tocopherol content in samples was expressed in µg/g.

2.2.7. PAHs Analysis

The method was an adaptation of a method developed in a previous study for different food samples. A Perkin Elmer 200 Series High Performance Liquid Chromatograph (HPLC) with an FLD detector was used. The separation of the 15 PAHs (naphthalene, acenaphtene, fluorene, phenanthrene, anthracene, fluoranthene, pyrene, benzo(a)anthracene, chrysene, benzo(b)fluoranthene, benzo(k)fluoranthene, benzo(a)pyrene, dibenzo(a,h)anthracene, benzo(g,h,i)perylene, indeno(1,2,3-cd)pyrene) was conducted on an Inertsil ODS-P 5 µm, 4.6 × 150 mm column kept at 24 °C. The injection volume was set at 50 µL. The mobile phase consisted of a gradient of water and acetonitrile and a time-programmed FLD detector was used for the detection. PAH content in samples was expressed in ng/g.

2.2.8. Polyphenols Analysis

A UHPLC Vanquisher H from Dionex (Thermo Fisher Scientific, Germering, Germany ) with a DAD detector was used for the analysis of catechin, epicatechin and resveratrol. The mobile phase was composed of ultra-pure water with 1% acetic acid and MeOH in a gradient with a flow rate of 0.3 mL/min. The chromatographic column used was an Accucore aQ (100 × 2.1 mm, 2.6 μm) from Thermo Fisher, which was kept at 25 °C. The injection volume was 1 µL and the detector was set at 260 nm for catechin and epicatechin and at 360 nm for resveratrol. Polyphenol content in samples was expressed in µg/mg.

2.2.9. Moister Content Analysis

Analysis was performed according to ISO 11294:1994 at 103 °C using a UFE 400 oven from Memmert (Büchenbach, Germany) [36]. The results were expressed in percentages.

2.2.10. Statistical Evaluation

The results were represented as the mean standard deviation, and one-way analysis of variance (ANOVA) was conducted through Minitab for Windows version 17.0 (Minitab, LLC, State College, PA, USA). Graphs and world maps were created using Minitab and Jupyter notebooks with the GeoJSON library and original map data from Natural Earth.

3. Results and Discussion

The analyzed samples were from specialty stores and were of single origin. The pedo-climatic characteristics of each country of origin are presented in Table 2 [37]. There was no significant difference between samples regarding moisture content, which varied between 1.54 and 1.86% for all samples. The results for all samples were reported for dry matter.

3.1. Total Phenols, Polyphenols, and Total Antioxidant Capacity

The average results obtained for total phenols, polyphenols, and total antioxidant capacity are presented in Table 3. From all three quantified polyphenols, catechin was the only one determined to be above the detection limit. The results are similar to those found by Ali et al. which quantified Colombian coffee at 17.74 mg GAE/g and Ethiopian coffee at 14.30 mg GAE/g [38].
There was a significant difference (p < 0.05) in total polyphenols, catechin, and total antioxidant capacity between specialty coffee and general store coffee. The average total polyphenol content for specialty coffee was 14.22 mg/g, while for the general store type, it was only 3.75 mg/g. The same significant (p < 0.05) difference can be observed for antioxidant capacity as well, with a value of 33.61 mg/g for specialty coffee and only 8.55 mg/g for general store coffee (Figure 1 and Figure 2).
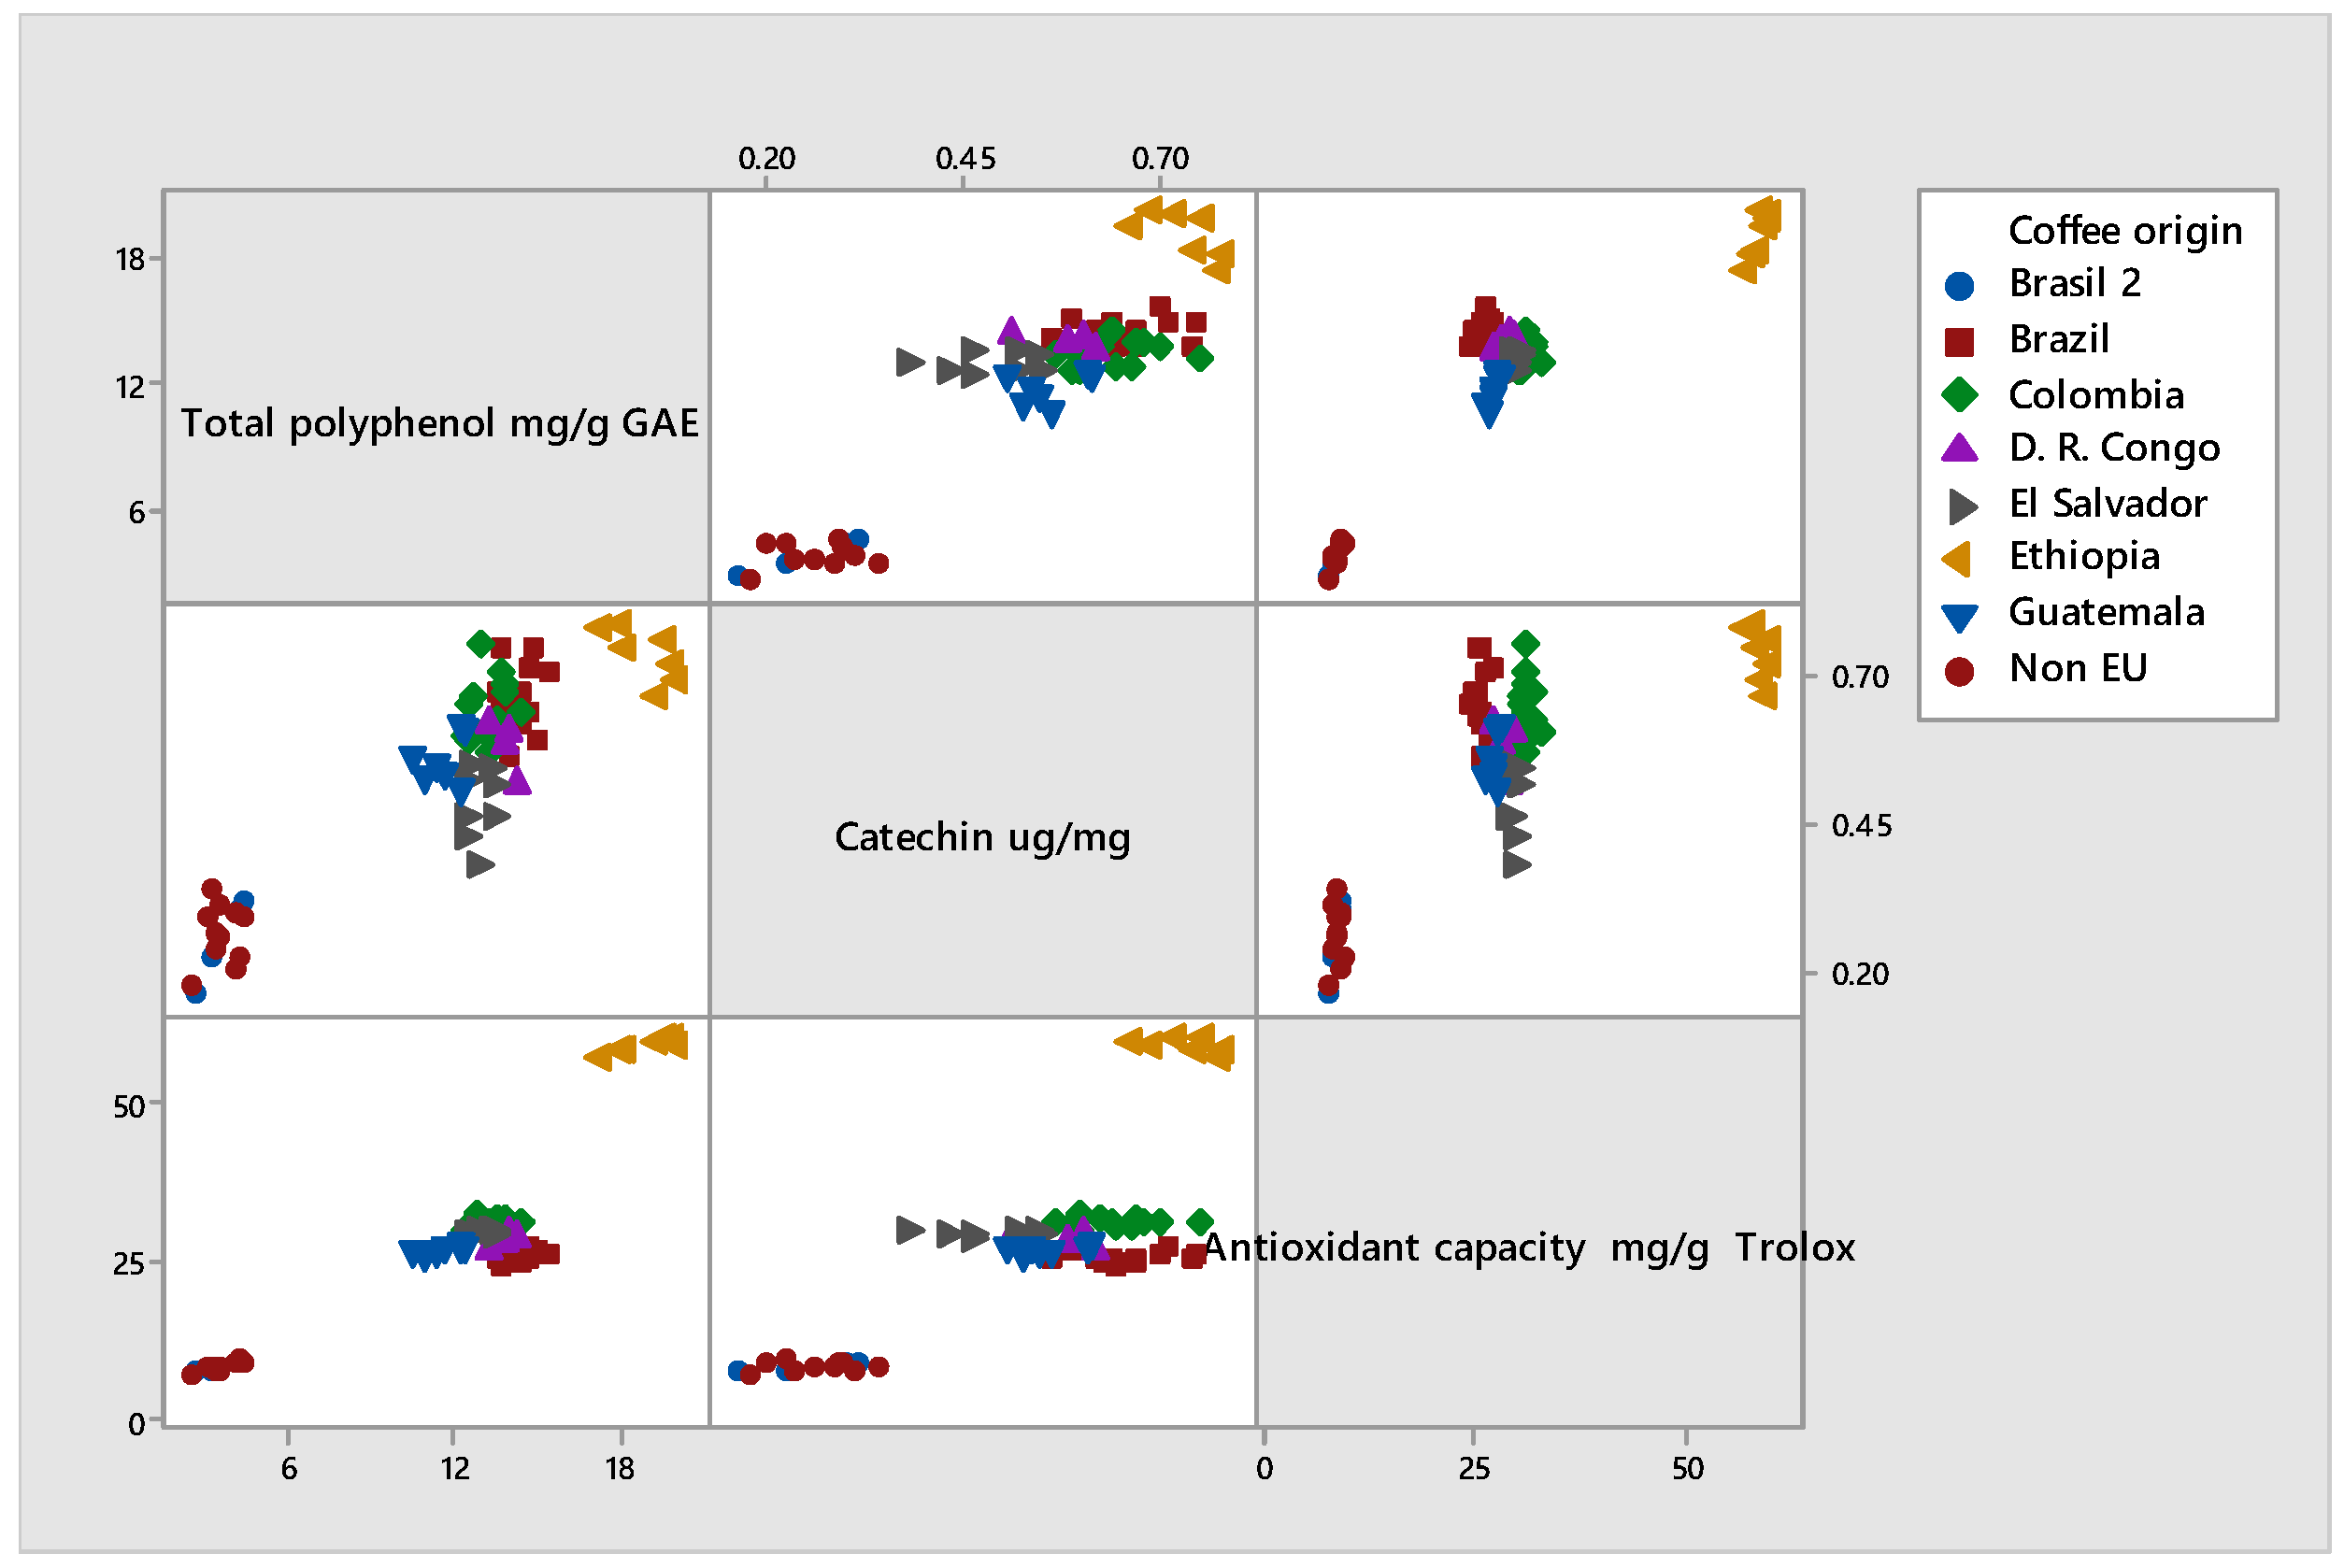
The matrix plot of catechin, total polyphenols, and antioxidant capacity reveals a positive correlation between these three variables in different coffee samples. It also shows which origin of coffee has the highest or lowest concentration. In our study, coffee of Ethiopian origin had the highest concentration, while blends of non-EU coffee had the lowest. From the matrix, it can also be observed that samples have low variance across the same origin of coffee.
The bubble plot below provides a way to explore the relationships between antioxidant capacity and mean annual precipitation (Figure 3). Ethiopia, which has a mean annual precipitation of 850 mm, has the highest antioxidant capacity. This indirect correlation cannot be observed across all the samples analyzed.
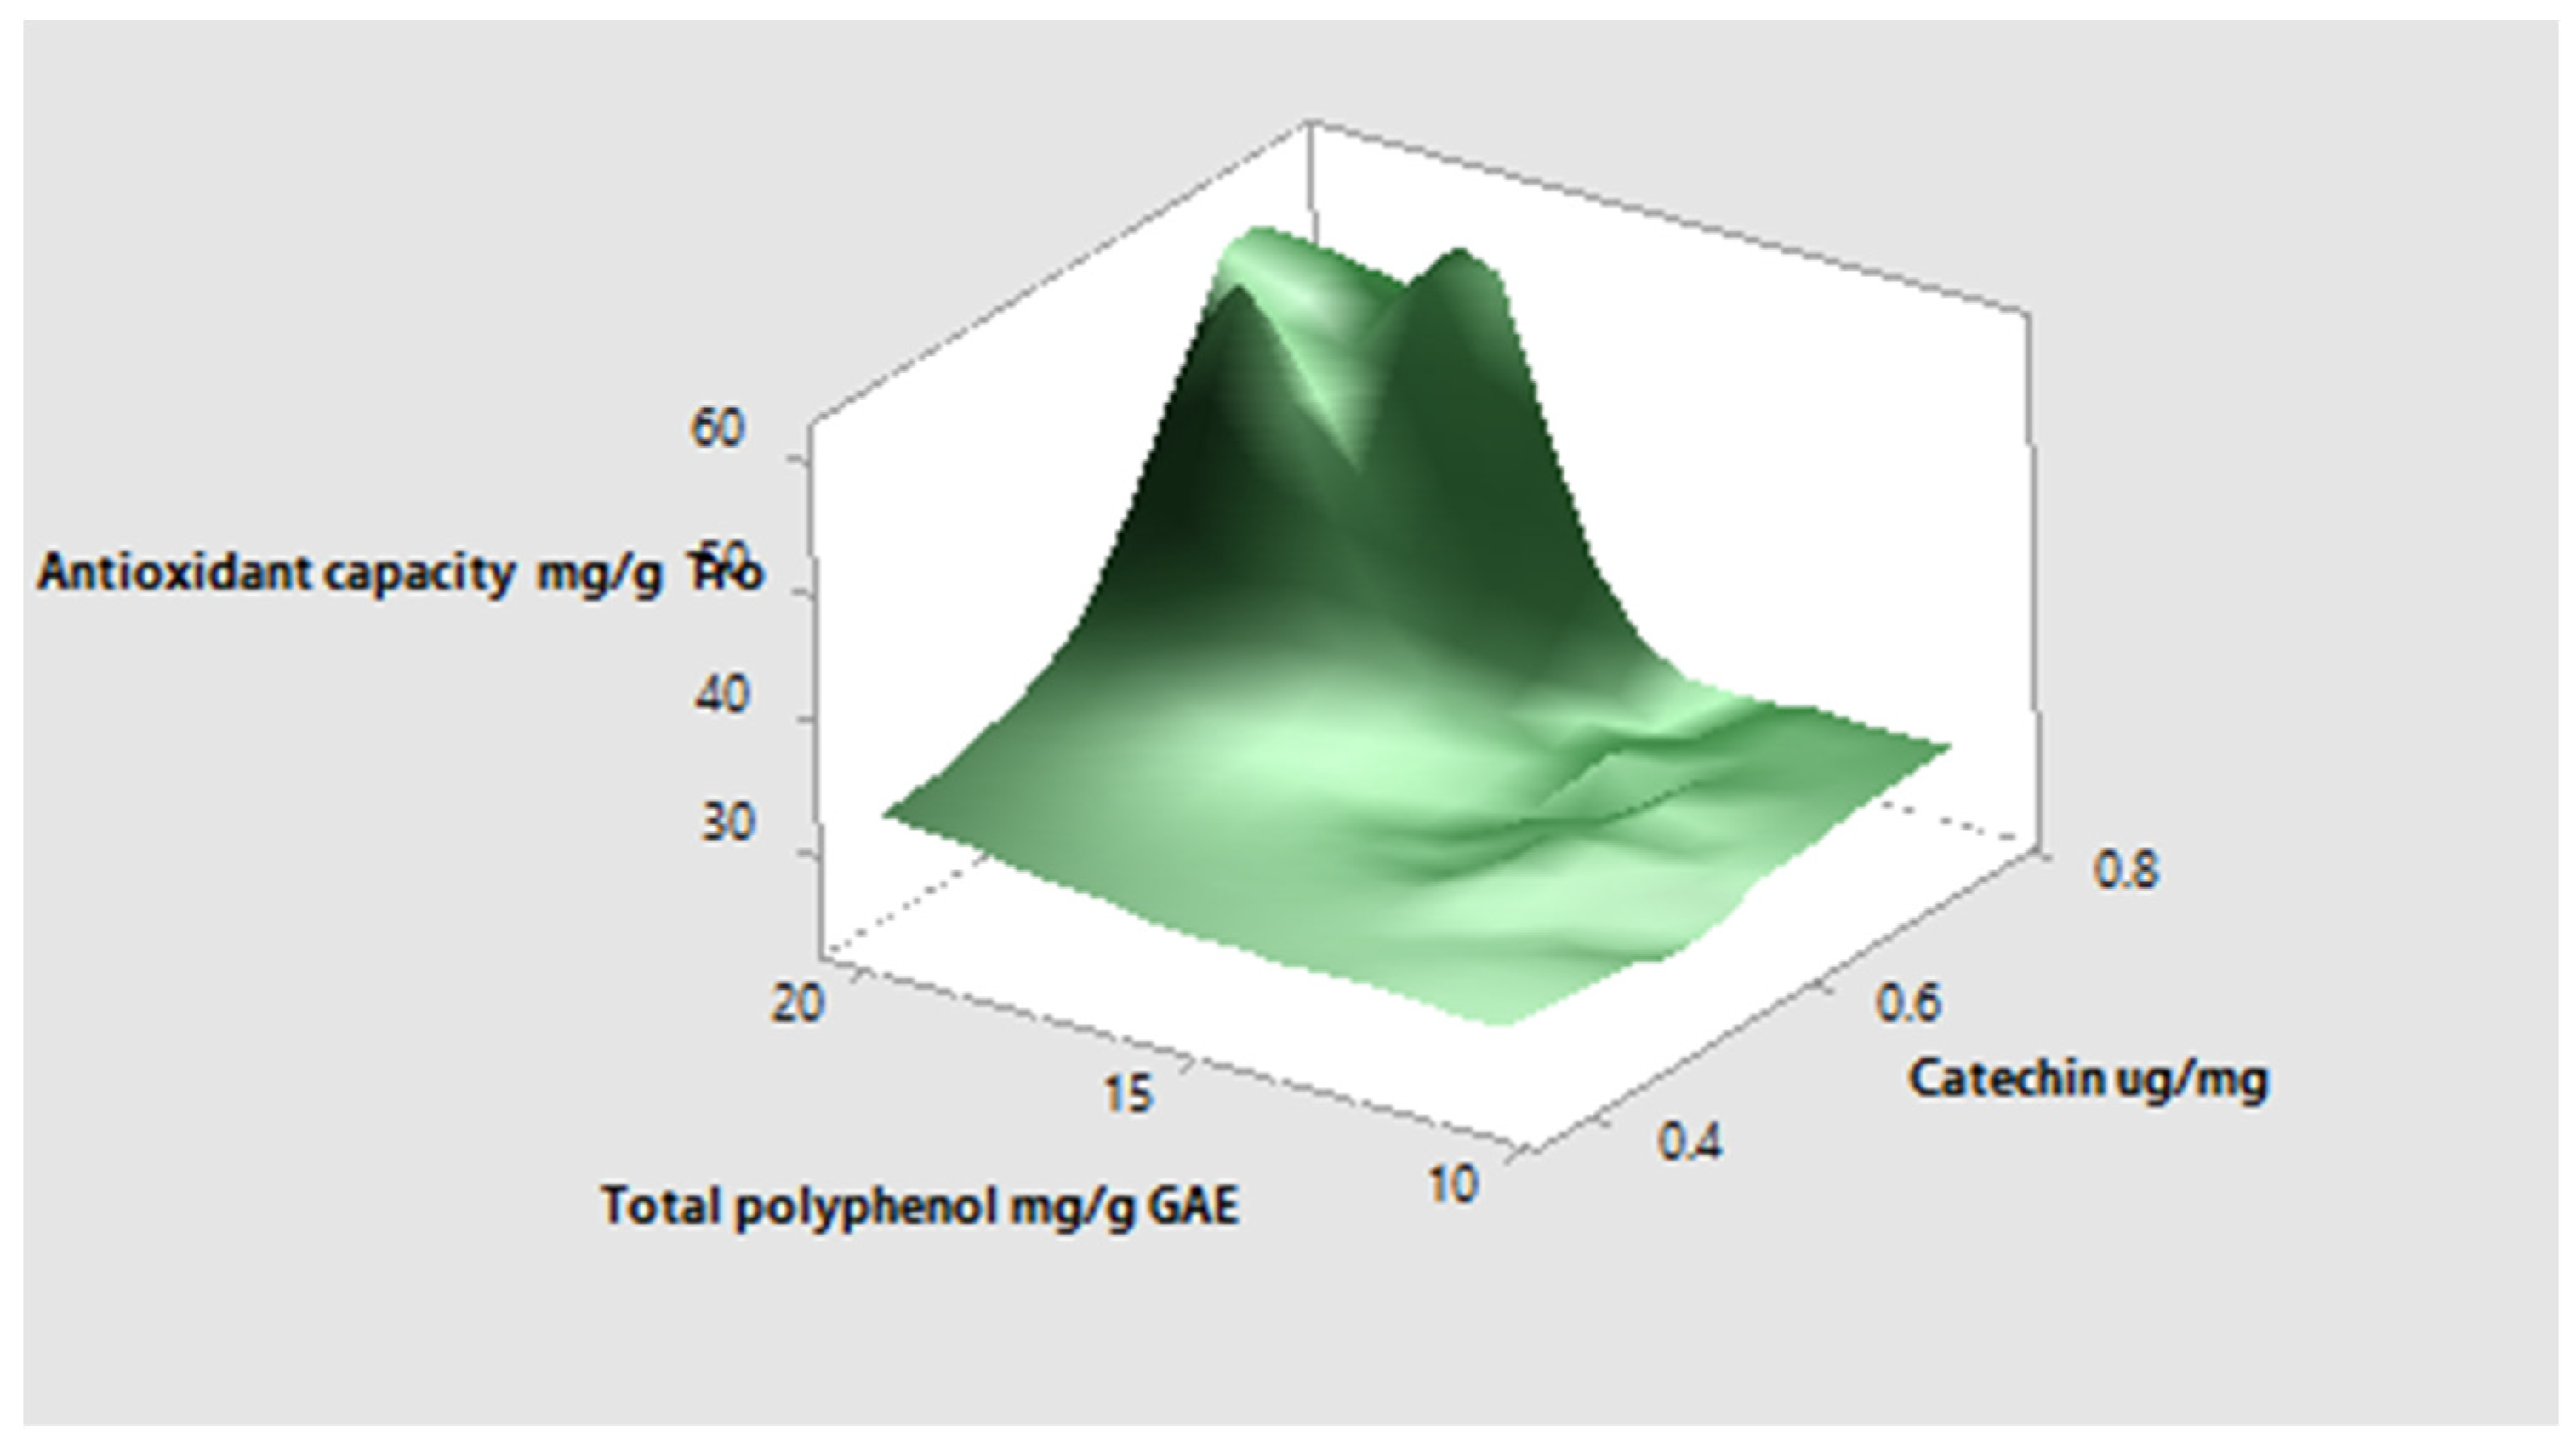
The surface plot demonstrates the positive correlation between antioxidant capacity and total polyphenols and catechin (Figure 4).
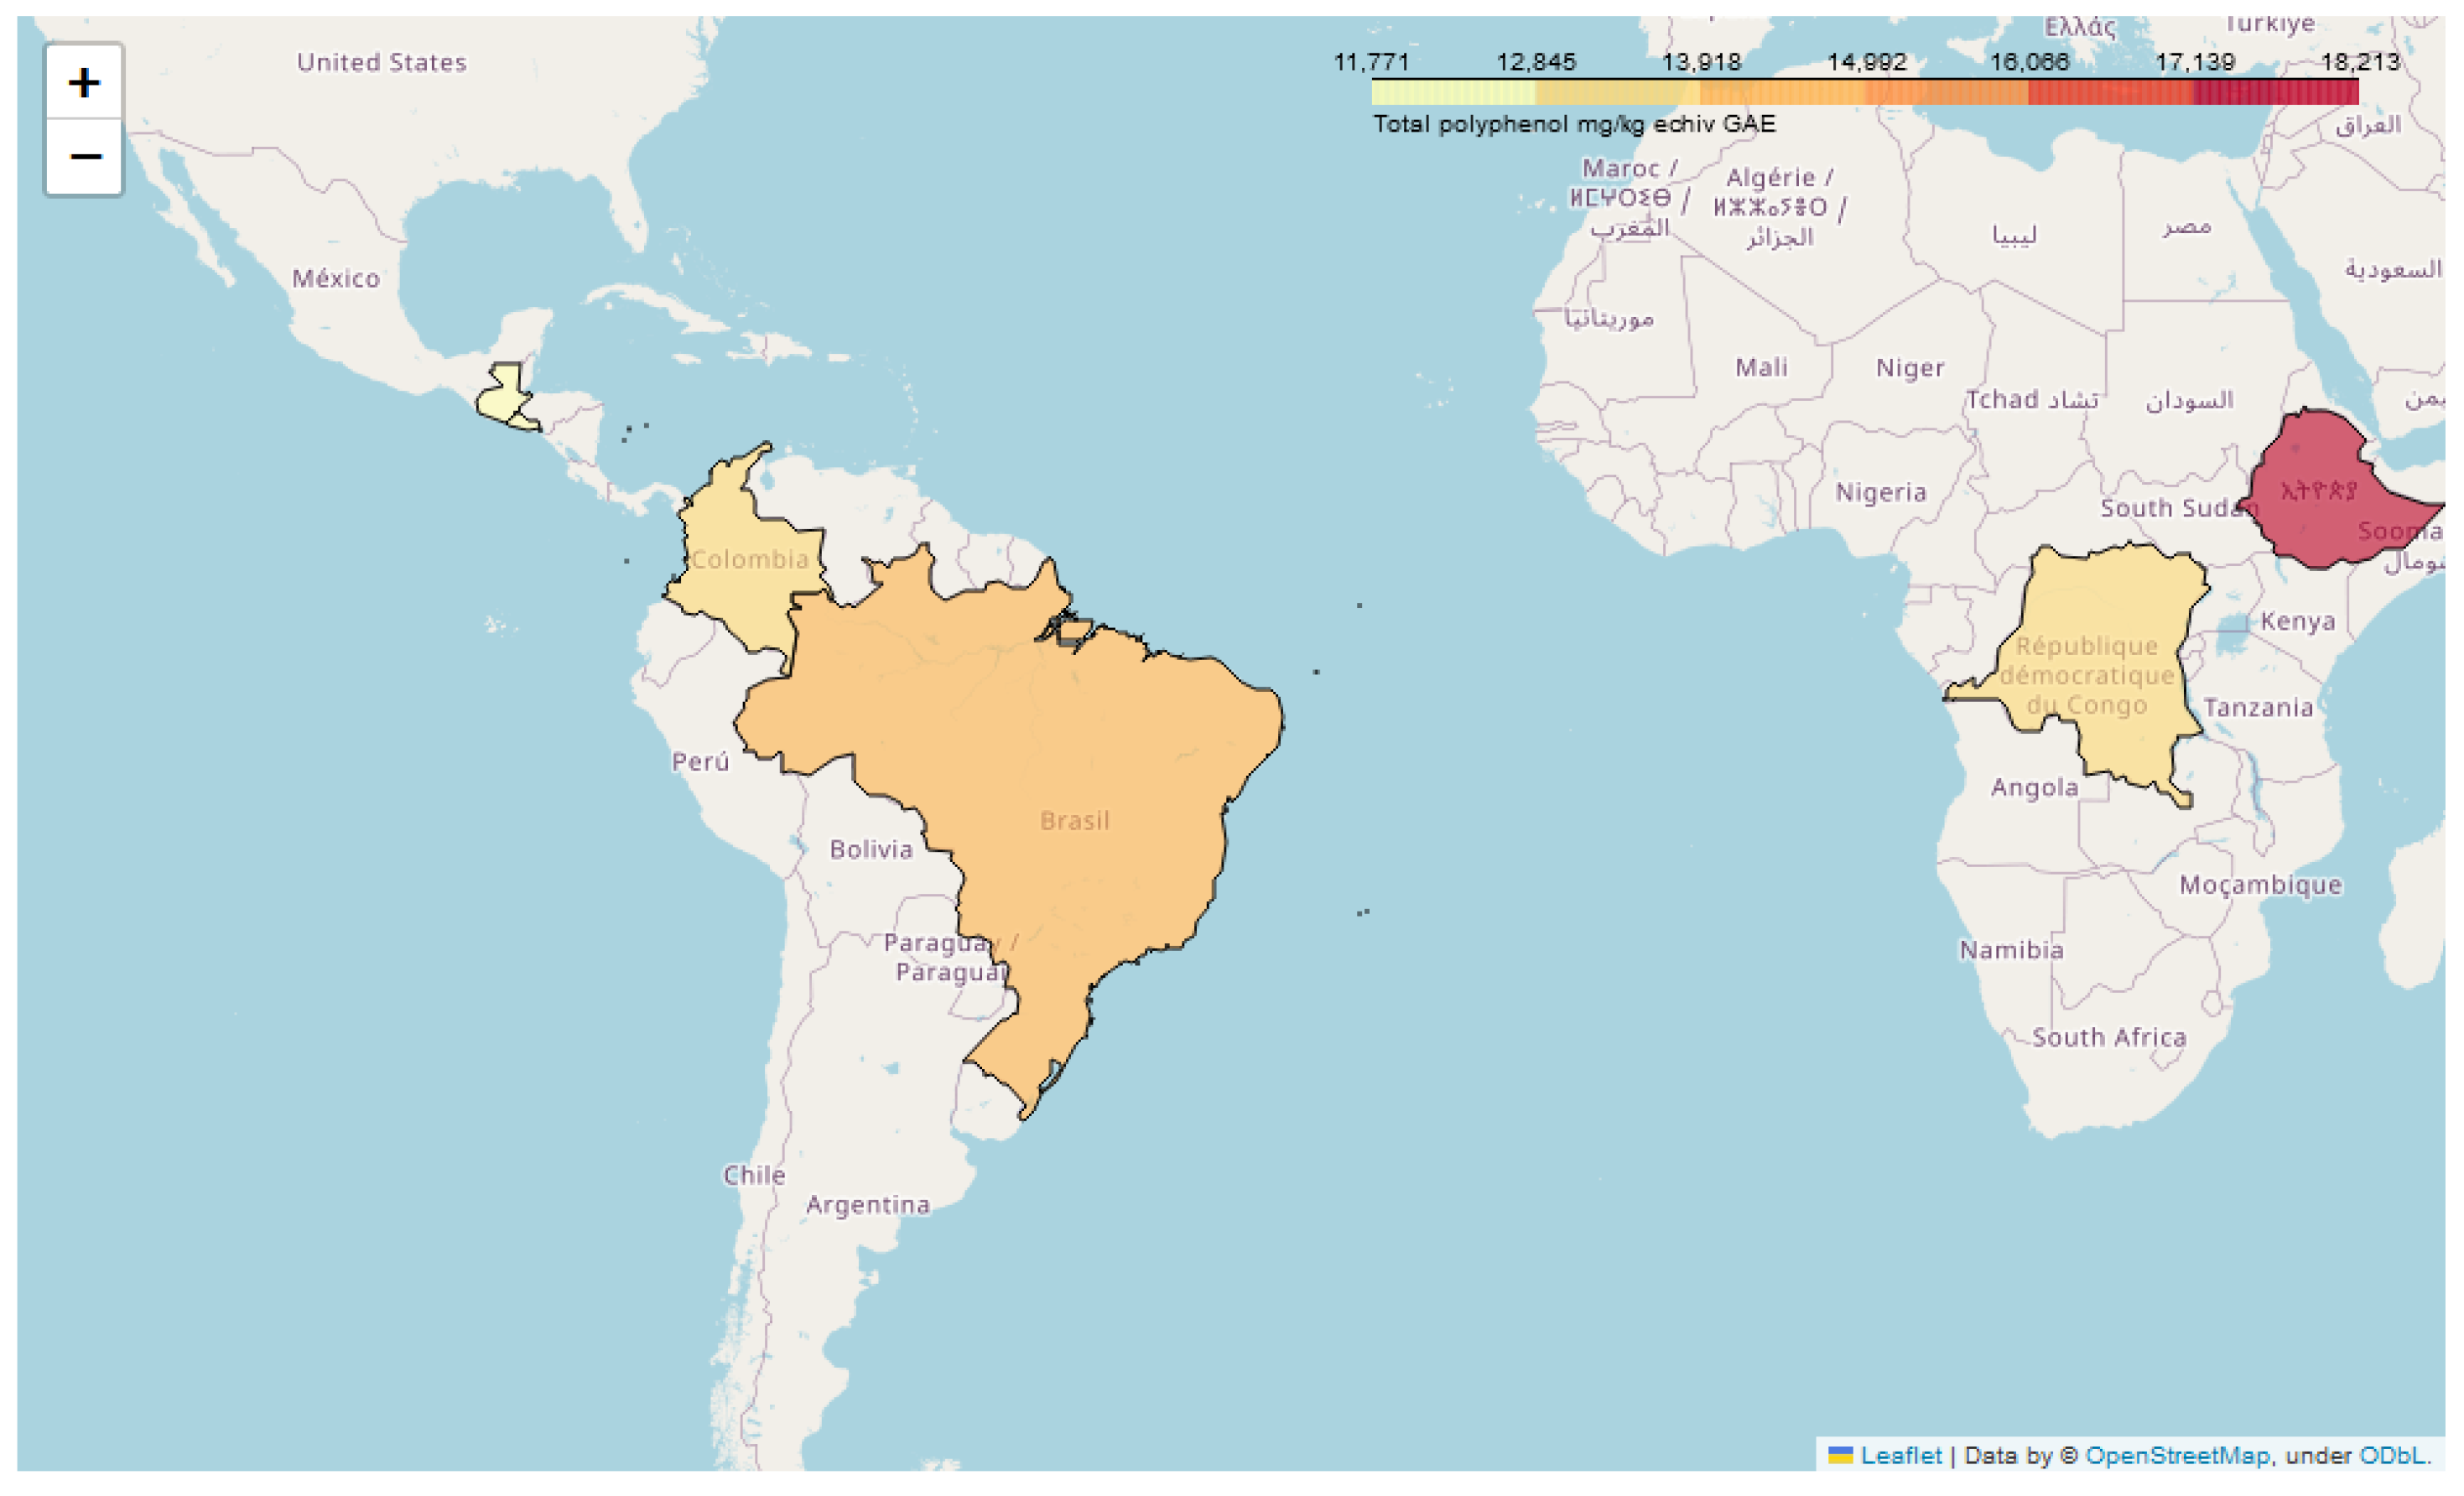
The distribution of total polyphenols for each country of origin is presented in Figure 5, which clearly indicates the high values that were obtained for Ethiopia and Brazil.

3.2. FT-NIR Analysis

Using FT-NIR spectroscopy, total lipid and total protein content were quantified (Table 4). The highest protein content was determined in Guatemalan coffee 12.8%) and the lowest was in Brazil (9.8%). Brazilian coffee had the lowest lipid content (9%), and El Salvadorian had the highest (14.6%). There was no significant difference between single-origin coffee from specialty coffee stores and coffee in general stores from Brazil. However, between coffees of other origins, there was a difference of 1–5%, representing 10–50% of the total content.
The results are similar to those found by Good Kitzberger et al., who quantified average lipids at 11.23% and proteins at 13.56% [39].

3.3. Hydro- and Liposoluble Vitamins

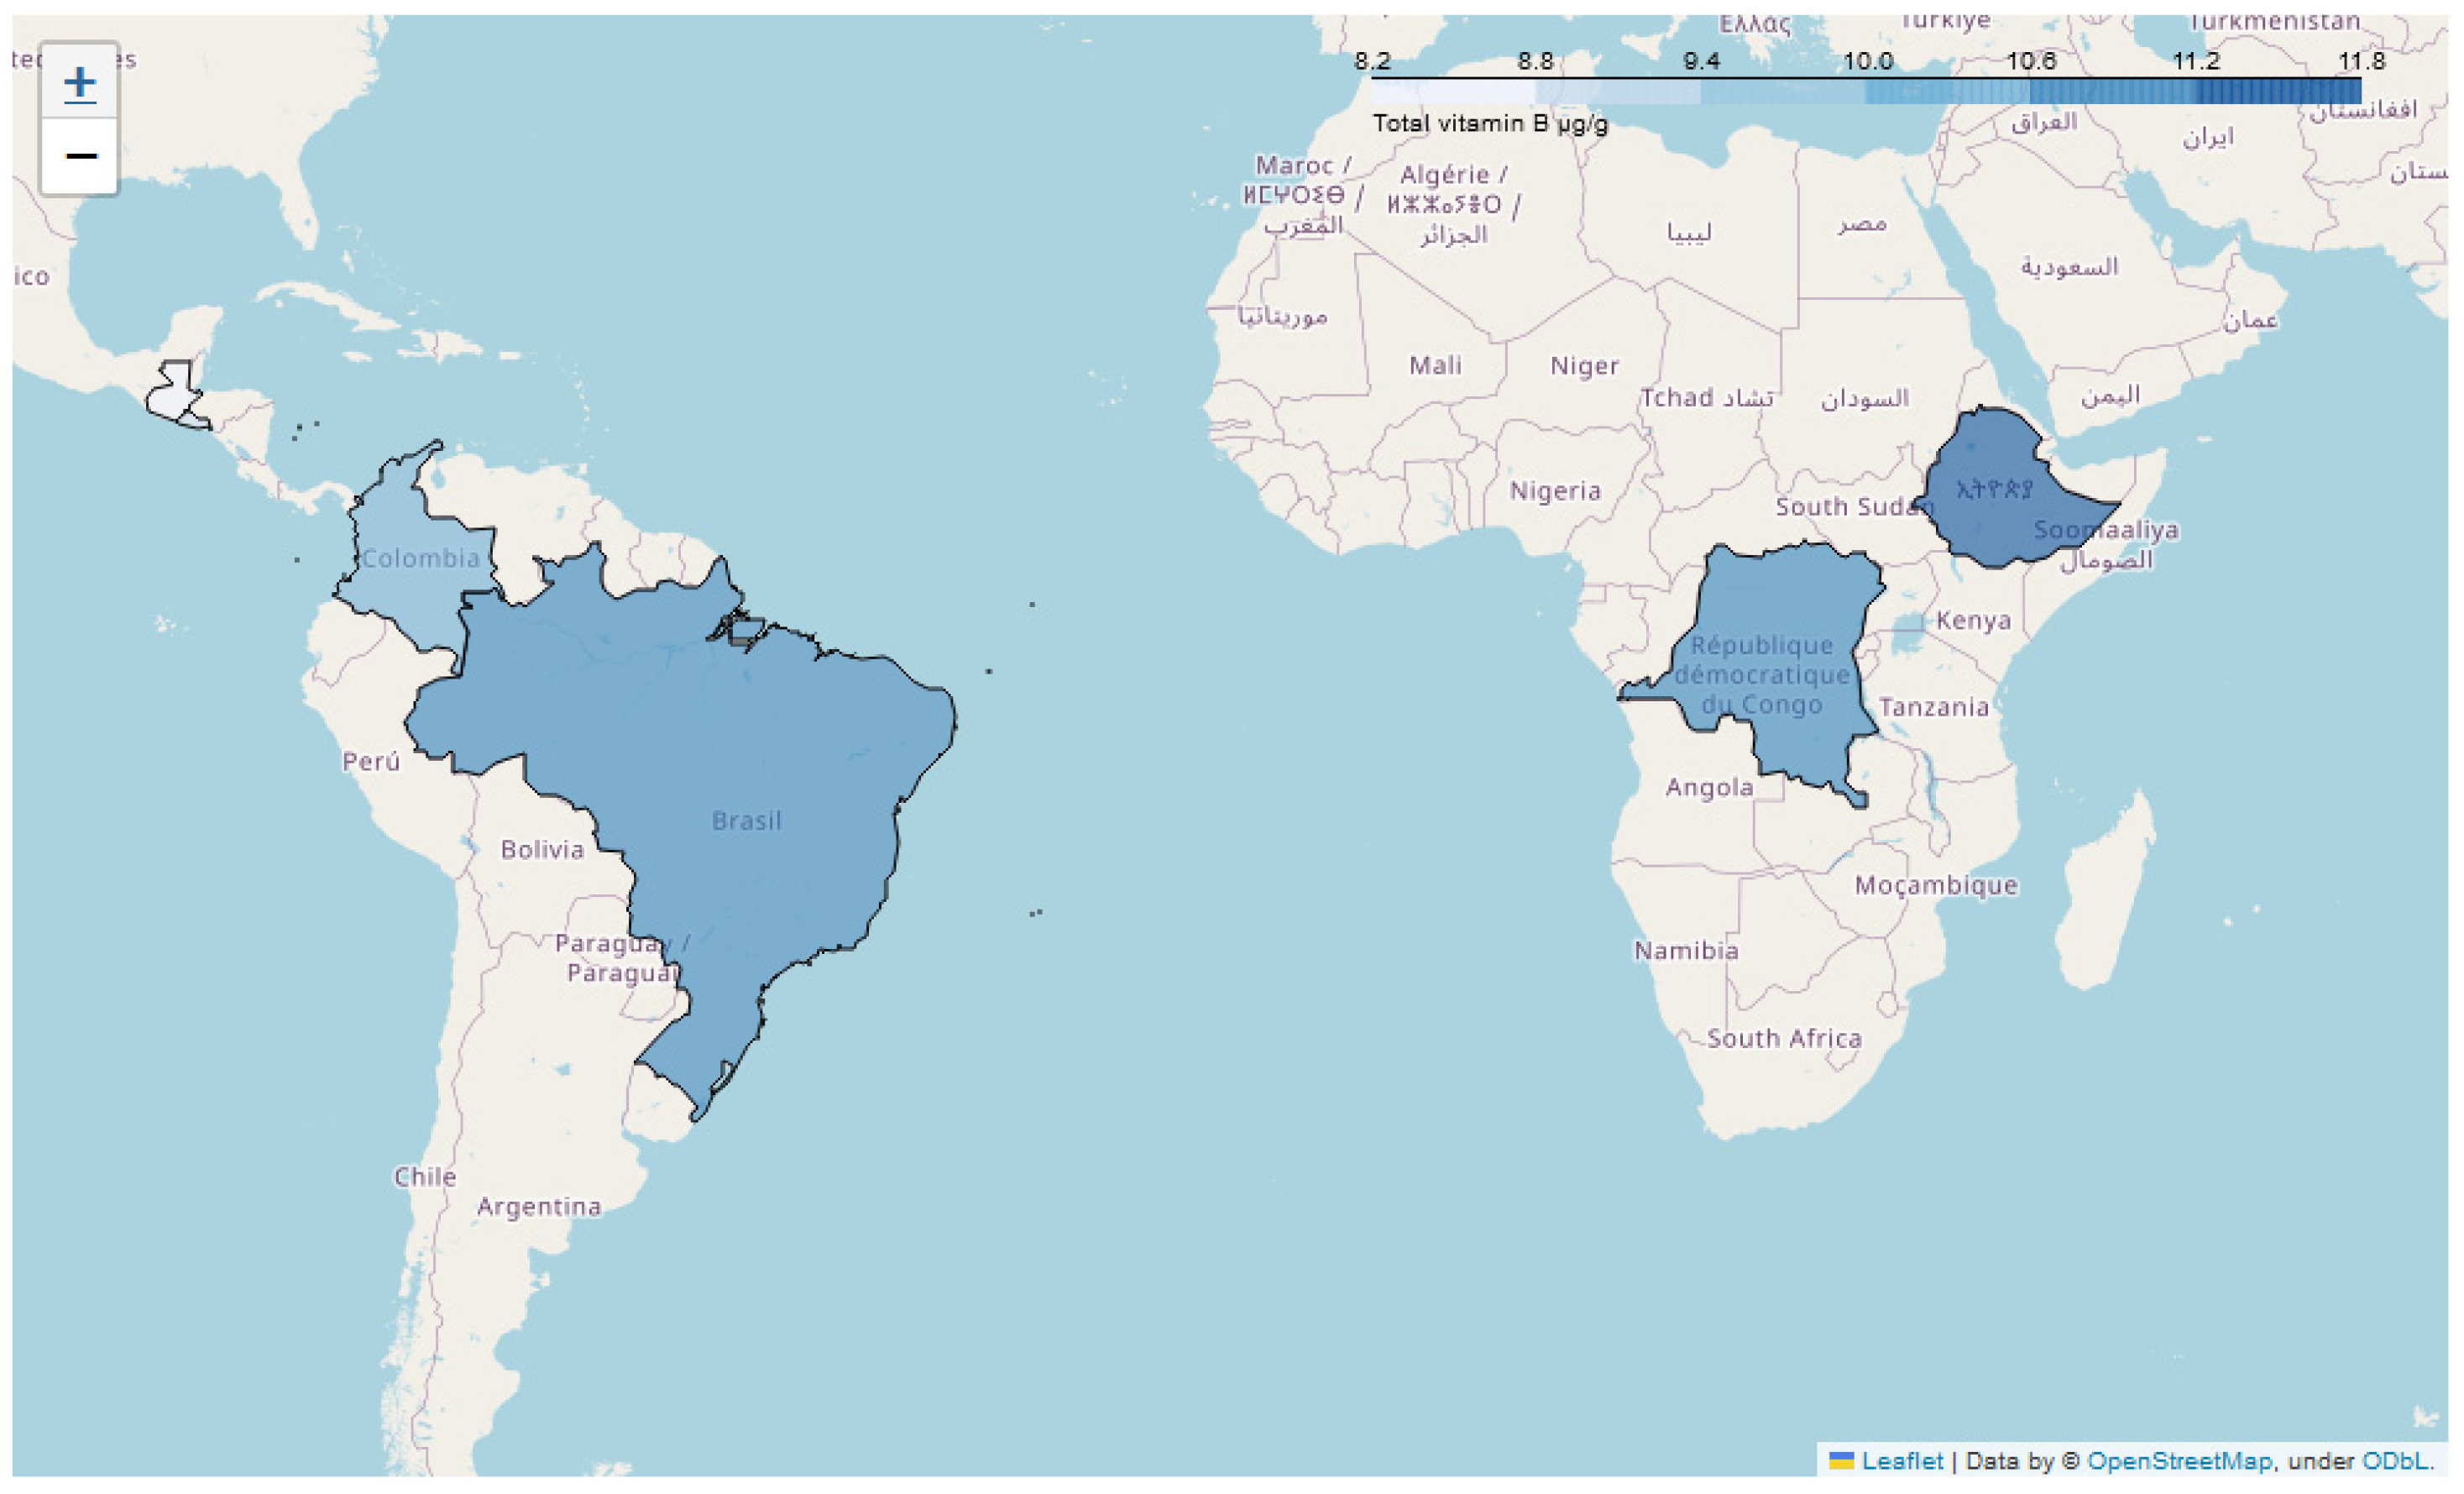
Vitamin B3, niacin, was quantified as being of the highest concentration in all samples, with an average of 9.77 µg/g. Vitamins B1 and B2 were under the detection limit for all general store coffee (Table 5). Brazilian coffee from the general store had the lowest levels of all four compounds, with B1 and B2 reported as “<LQ”, meaning they were below the limit of quantification for the method used. Non-EU origin also had relatively low levels of all four compounds compared to the other origins. In contrast, Ethiopia and Colombia had the highest levels of B3 and B6, respectively. The levels of B1 and B2 were generally low across all origins, with the highest levels found in Brazil 1. The levels of B3 and B6 are more variable across origins, with the highest levels found in Ethiopia and Colombia, respectively. The results are in the range quantified by Nzekoue et al. for vitamins B2 (0.18–0.2 mg/kg) and B3 (2.5–3.1 mg/kg) [40] (Figure 6).
Coffee samples from Brazil 1, Democratic Republic of the Congo, and Ethiopia showed the highest concentrations of α-tocopherol (47.1, 45.2, and 44.2 µg/g) and β-tocopherol (110.4, 99.1, and 98, 7 µg/g). Samples from El Salvador, Guatemala, and Colombia showed moderate concentrations of α-tocopherol (30.7, 31.2, and 32.6 µg/g, respectively) and β-tocopherol (50.8, 51.5, and 52.7 µg/g, respectively), while samples of non-EU origin and those from Brazil 2 showed the lowest concentrations of α-tocopherol (22.5 and 23.0 µg/g, respectively) and β-tocopherol (39.3 and 40.9 µg/g, respectively). For gamma-tocopherol, Brazil 1 had the highest concentration (0.114 µg/g), followed by Ethiopia and Colombia (both 0.03 µg/g). The other samples were at lower concentrations, with Brazil 2 below the limit of quantitation (LQ). For δ-tocopherol, samples from Brazil 1 had the highest concentration (1.335 μg/g), followed by Ethiopia (1.19 μg/g) and Democratic Republic of the Congo (1.154 μg/g). El Salvador, Guatemala, and Colombia had moderate concentrations (0.936, 0.853, and 0.92 µg/g, respectively), while non-EU sources and Brazil 2 had the lowest concentrations (both 0.24 µg/g).
The levels for α- and β-tocopherol are similar to the ones determined by Mansur Tavares et al., who reported α-tocopherol values between 2.8 and 4.8 mg/100 g and β-tocopherol values between 3.6 and 13.3 mg/100 g [41].

3.4. PAHs Analysis

PAHs can form in coffee during the roasting process. From the 15 PAHs analyzed, only 10 were above the detection limit. The average results obtained are presented in Table 6. All samples contained PAHs at the maximum allowed levels according to food contaminants regulation 1881/2006/EC, where the maximum levels are set at 10 µg/kg for benzo(a)pyrene and 50 μg/kg for the sum of benzo(a)pyrene, benz(a)anthracene, benzo(b)fluoranthene, and chrysene [42].
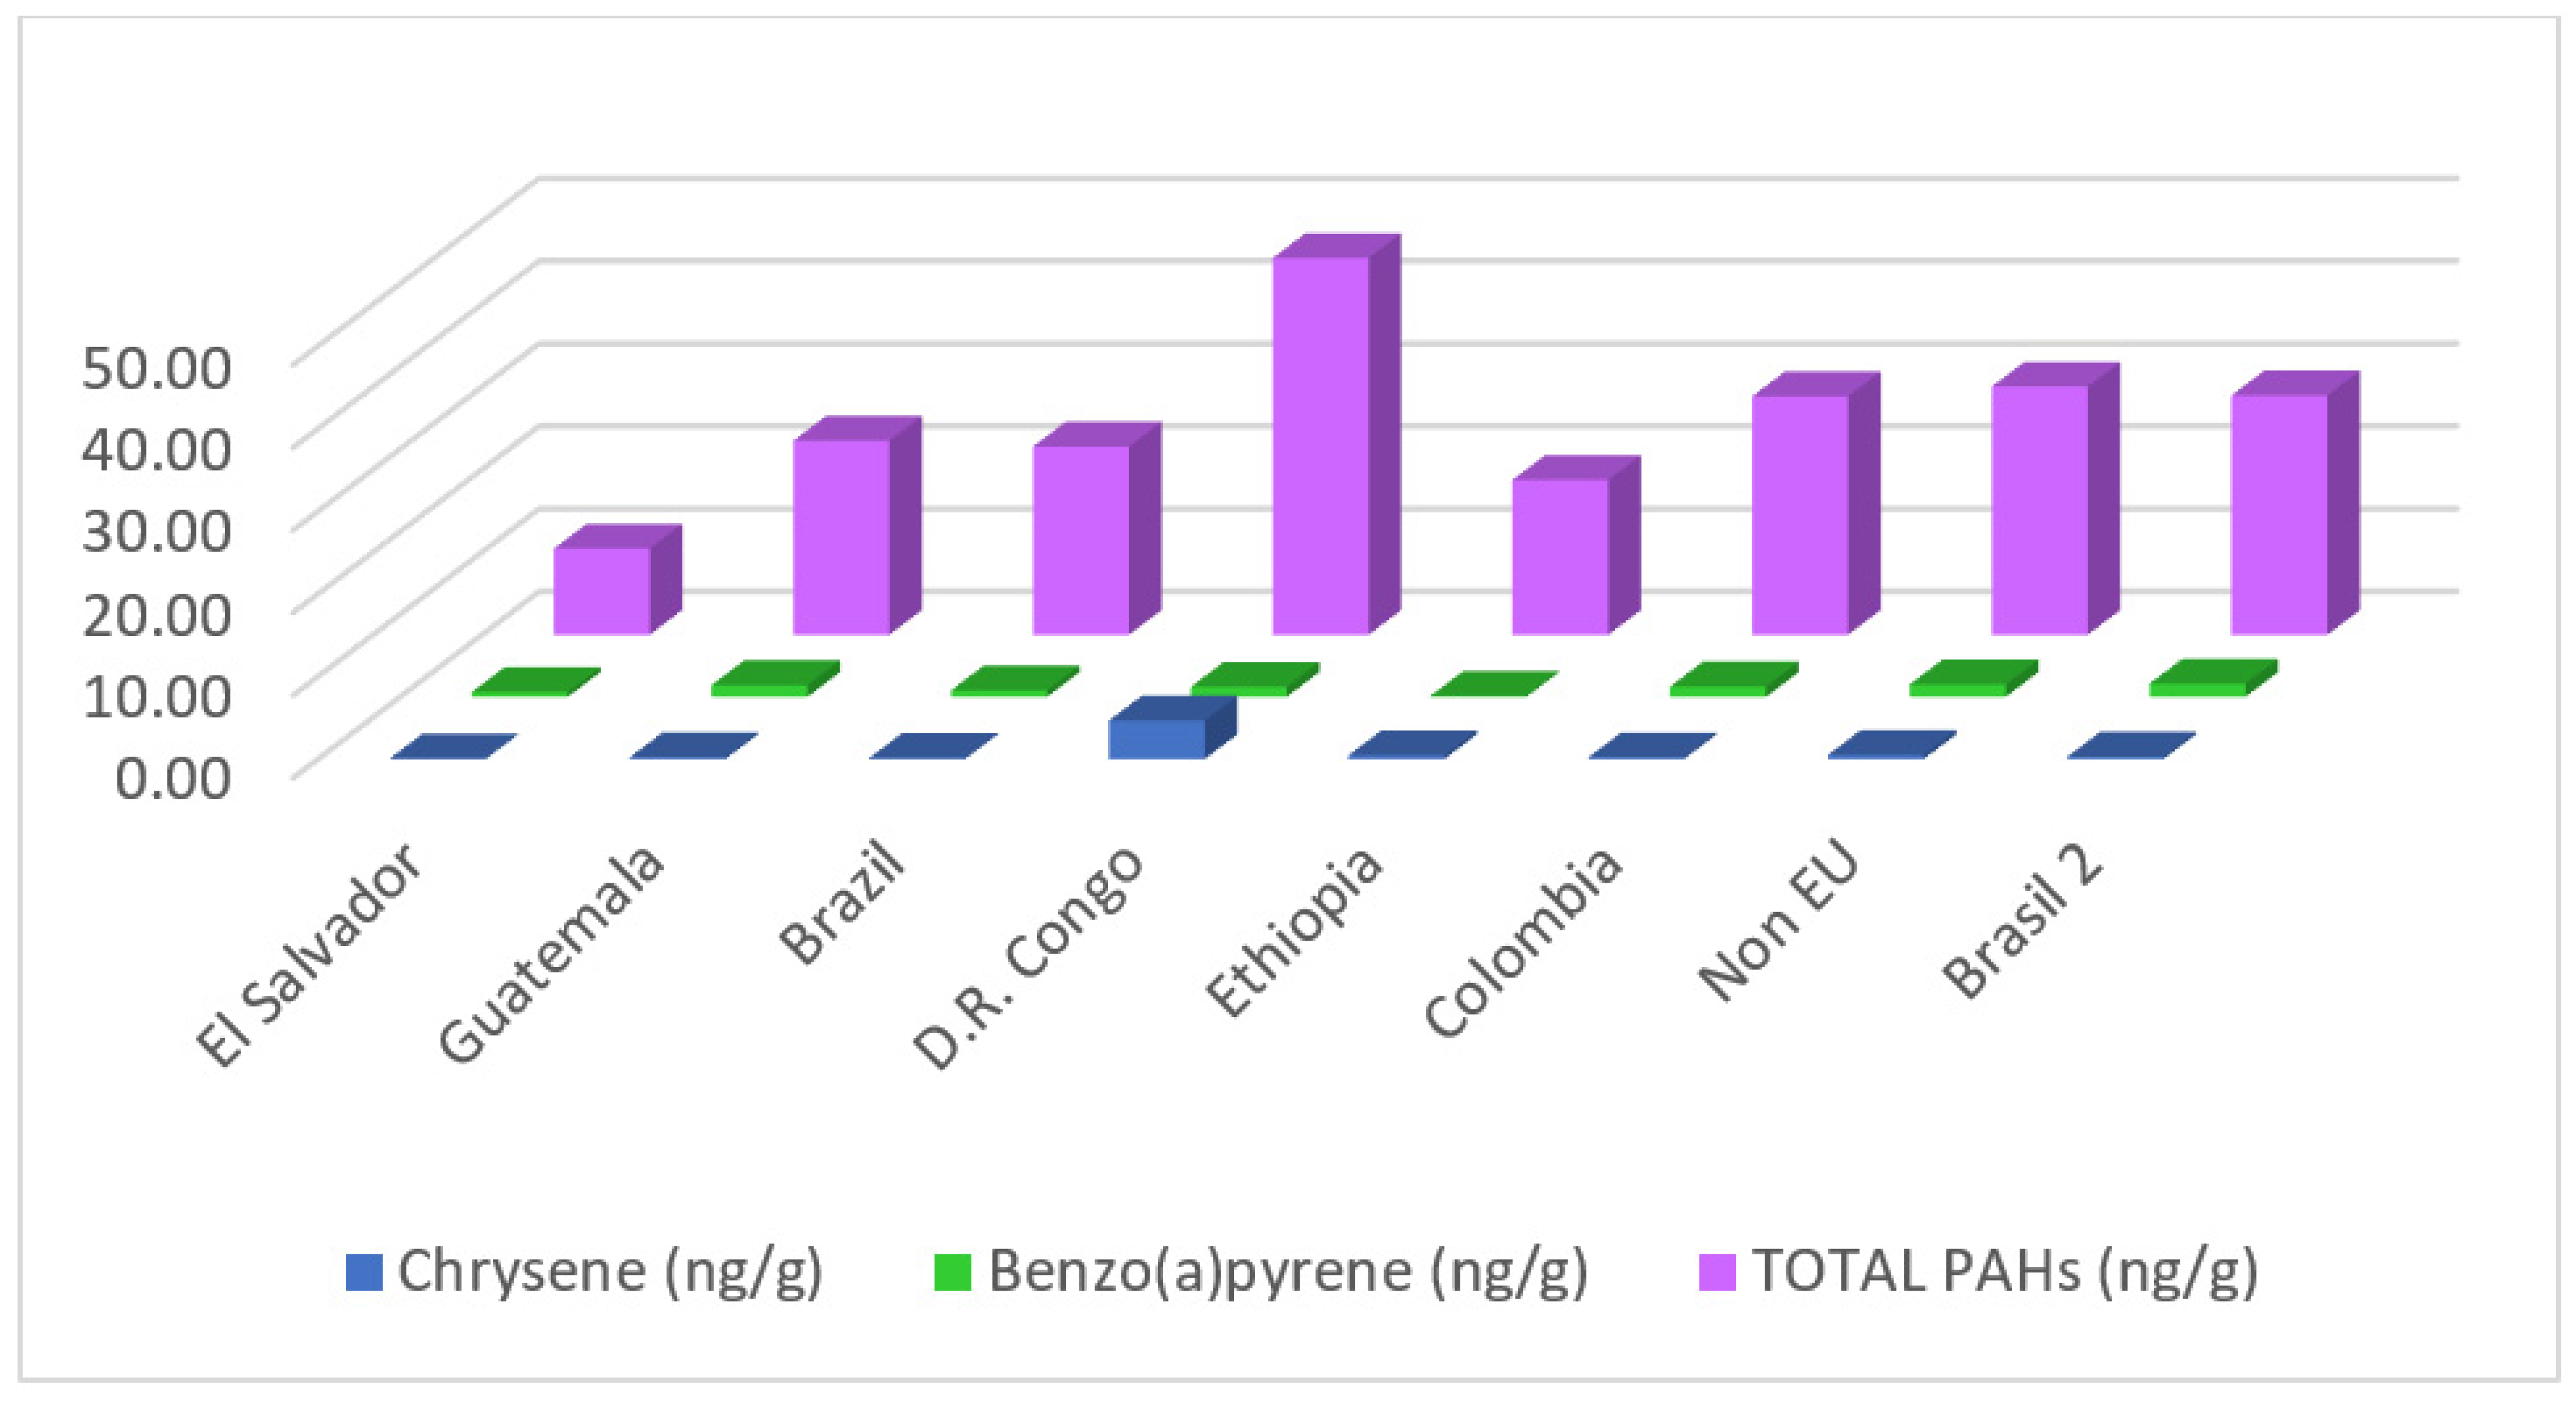
The table presents data on the content of polycyclic aromatic hydrocarbons (PAHs) in coffee samples of different origin. The PAHs were analyzed using high-performance liquid chromatography with fluorescence detection. The results show that the total PAH content in coffee samples ranged from 10.43 to 45.61 μg/kg. The samples from the Democratic Republic of the Congo showed the highest PAH levels, with an average of 45.61 μg/kg, while the samples from El Salvador had the lowest average PAH content at 10.43 μg/kg. This study provides important data on the content of PAHs in coffee samples of different origin and highlights the need for regular monitoring of coffee quality to ensure consumer safety. The results can also be used by the coffee industry to improve production practices and reduce the risk of PAH contamination in coffee products (Figure 7). The results are similar to those found by Jimenez et. al, where quantification of naphthalene concentration ranged from 0 to 561 ng g−1, acenaphthylene concentration ranged from 0 to 512 ng g−1, pyrene concentration ranged from 60 to 459 ng g−1, and chrysene concentration ranged from 56 to 371 ng g−1 [43].
The findings suggest that there are notable variations in total phenols, polyphenols, and total antioxidant capacity between specialty coffee and general store coffee. Additionally, the levels of tocopherols and vitamins B1, B2, B3, and B6 in coffee exhibit considerable diversity that can be influenced by several factors, including coffee variety, processing method, and analytical method. Furthermore, tocopherol levels were comparable to earlier research but still subject to considerable variability depending on the factors stated above. Consequently, the nutritional value and antioxidant properties of coffee may be affected by the coffee’s type and origin. Consumers interested in obtaining health advantages from coffee should consider specialty coffee, which contains more polyphenols and has greater antioxidant capacity. The effect of coffee processing and brewing procedures on the levels of bioactive compounds in coffee requires additional research.

4. Conclusions

In conclusion, this study analyzed medium-roasted 100% Arabica coffee samples from six different countries using various analytical techniques, such as HPLC, FT-NIR spectrometry, spectrophotometry, and photochemiluminescence. The aim was to provide a complex profile of the coffee and correlate the data with its origin, as well as compare specialty coffee and general store coffee. The results show significant differences (p < 0.05) between specialty coffee and general store coffee in terms of total polyphenols and total antioxidant capacity, with specialty coffee having higher levels. Furthermore, the study revealed variations in the composition of coffee from different origins, which can be attributed to their pedo-climatic characteristics. The study also demonstrated that the roasted coffee samples analyzed were within the maximum allowed levels for PAHs according to food contaminants regulation. Overall, this study provides valuable insights into the chemical composition of coffee and highlights the importance of the origin and cultivation of coffee in its quality and properties.

Author Contributions

Conceptualization, D.S. and A.B.; methodology, D.S. and A.B.; software, D.S. and A.B.; validation, D.S. and A.B.; formal analysis, A.B.; investigation, D.S.; resources, D.S. and A.B.; data curation, D.S. and A.B.; writing—original draft preparation, A.B.; writing—review and editing, D.S.; visualization, A.B.; supervision, D.S.; project administration, A.B.; funding acquisition, A.B. All authors have read and agreed to the published version of the manuscript.

Funding

This work was carried out through the Core Program within the National Research Development and Innovation Plan 2022–2027 and was carried out with the support of MCID, project no. PN 23 05 and by the Ministry of Research, Innovation, and Digitization through Program 1—Development of the national research and development system, Subprogram 1.2—Institutional performance projects that finance RDI excellence, Contract no. 18PFE/30.12.2021.

Data Availability Statement

The data presented in this study are available on request from the corresponding author. The data are not publicly available due to privacy restrictions.

Conflicts of Interest

The authors declare no conflict of interest.

References

  1. Myhrvold, N. “Coffee”. Encyclopedia Britannica, Invalid Date. Available online: https://www.britannica.com/topic/coffee (accessed on 18 February 2023).
  2. Eurostat Database DS-016894, DS-066341. Available online: https://ec.europa.eu/eurostat/data/database (accessed on 18 February 2023).
  3. Palm, V. Key Figures on the European Food Chain; Publications Office of the European Union: Luxembourg, 2021; pp. 68–71. [Google Scholar] [CrossRef]
  4. International coffee Organization, Coffee Market Report–May 2022. Available online: https://www.ico.org/documents/cy2021-22/cmr-0522-e.pdf (accessed on 10 February 2023).
  5. European Coffee Federation (ECF), European Coffee Report 2018/2019. Available online: https://www.ecf-coffee.org/wp-content/uploads/2020/09/European-Coffee-Report-2018-2019.pdf (accessed on 5 February 2023).
  6. European Market Potential for Speciality Coffee. Available online: https://www.cbi.eu/market-information/coffee/specialty-coffee/market-potential (accessed on 25 March 2023).
  7. de Melo Pereira, G.V.; de Carvalho Neto, D.P.; Júnior, A.I.M.; do Prado, F.G.; Pagnoncelli, M.G.B.; Karp, S.G.; Soccol, C.R. Chapter Three—Chemical composition and health properties of coffee and coffee by-products. In Advances in Food and Nutrition Research; Toldrá, F., Ed.; Academic Press: Cambridge, MA, USA, 2020; Volume 91, pp. 65–96. [Google Scholar] [CrossRef]
  8. Basdeki, E.D.; Argyris, A.A.; Efthymiou, O.; Athanasopoulou, E.; Sfikakis, P.P.; Protogerou, A.D.; Karatzi, K. Systematic Breakfast Consumption of Medium-Quantity and High-Quality Food Choices Is Associated with Better Vascular Health in Individuals with Cardiovascular Disease Risk Factors. Nutrients 2023, 15, 1025. [Google Scholar] [CrossRef] [PubMed]
  9. Qin, X.; Li, C.; Wei, W.; He, D.; Zhao, Y.; Cai, Q.; Zhang, N.; Chu, X.; Shi, S.; Zhang, F. Assessing the association of coffee consumption on the relationship of chronic pain with depression and anxiety. Nutr. Neurosci. 2023. [Google Scholar] [CrossRef] [PubMed]
  10. Moeenfard, M.; Alves, A. New trends in coffee diterpenes research from technological to health aspects. Int. Food Res. 2020, 134, 109207. [Google Scholar] [CrossRef] [PubMed]
  11. Voskoboinik, A.; Koh, Y.; Kistler, P.M. Cardiovascular effects of caffeinated beverages. Trends Cardiovasc. Med. 2019, 29, 345–350. [Google Scholar] [CrossRef] [PubMed]
  12. Lee, L.K.; Mhd Rodzi, N.A.R. Addressing the Neuroprotective Actions of Coffee in Parkinson’s Disease: An Emerging Nutrigenomic Analysis. Antioxidants 2022, 11, 1587. [Google Scholar] [CrossRef]
  13. Safe, S.; Kothari, J.; Hailemariam, A.; Upadhyay, S.; Davidson, L.A.; Chapkin, R.S. Health Benefits of Coffee Consumption for Cancer and Other Diseases and Mechanisms of Action. Int. J. Mol. Sci. 2023, 24, 2706. [Google Scholar] [CrossRef]
  14. Hegde, S.; Shi, D.W.; Johnson, J.C.; Geesala, R.; Zhang, K.; Lin, Y.-M.; Shi, X.-Z. Mechanistic Study of Coffee Effects on Gut Microbiota and Motility in Rats. Nutrients 2022, 14, 4877. [Google Scholar] [CrossRef]
  15. Viencz, T.; Bonfanti Acre, L.; Barros Rocha, R.; Anastácio Alves, E.; Rostand Ramalho, A.; de Toledo Benassi, M. Caffeine, trigonelline, chlorogenic acids, melanoidins, and diterpenes contents of Coffea canephora coffees produced in the Amazon. J. Food Compos. Anal. 2023, 117, 105140. [Google Scholar] [CrossRef]
  16. Yamagata, K. Do Coffee Polyphenols Have a Preventive Action on Metabolic Syndrome Associated Endothelial Dysfunctions? An Assessment of the Current Evidence. Antioxidants 2018, 7, 26. [Google Scholar] [CrossRef]
  17. Socała, K.; Szopa, A.; Serefko, A.; Poleszak, E.; Wlaź, P. Neuroprotective Effects of Coffee Bioactive Compounds: A Review. Int. J. Mol. Sci. 2021, 22, 107. [Google Scholar] [CrossRef]
  18. Maksimowski, D.; Pachura, N.; Oziembłowski, M.; Nawirska-Olszańska, A.; Szumny, A. Coffee Roasting and Extraction as a Factor in Cold Brew Coffee Quality. Appl. Sci. 2022, 12, 2582. [Google Scholar] [CrossRef]
  19. Tarigan, E.B.; Wardiana, E.; Hilmi, Y.S.; Komarudin, N.A. The changes in chemical properties of coffee during roasting: A review. IOP Conf. Ser. Earth Environ. Sci. 2022, 974, 012115. [Google Scholar] [CrossRef]
  20. Muluken, B.; Shimelis, E. Effects of coffee roasting technologies on cup quality and bioactive compounds of specialty coffee beans. Food Sci. Nutr. 2020, 8, 6120–6130. [Google Scholar]
  21. Heo, J.; Adhikari, K.; Choi, K.S.; Lee, J. Analysis of Caffeine, Chlorogenic Acid, Trigonelline, and Volatile Compounds in Cold Brew Coffee Using High-Performance Liquid Chromatography and Solid-Phase Microextraction—Gas Chromatography-Mass Spectrometry. Foods 2020, 9, 1746. [Google Scholar] [CrossRef]
  22. Fuller, M.; Rao, N.Z. The Effect of Time, Roasting Temperature, and Grind Size on Caffeine and Chlorogenic Acid Concentrations in Cold Brew Coffee. Sci. Rep. 2017, 7, 17979. [Google Scholar] [CrossRef]
  23. El-Hawary, E.A.; Zayed, A.; Laub, A.; Modolo, L.V.; Wessjohann, L.; Farag, M.A. How Does LC/MS Compare to UV in Coffee Authentication and Determination of Antioxidant Effects? Brazilian and Middle Eastern Coffee as Case Studies. Antioxidants 2022, 11, 131. [Google Scholar] [CrossRef]
  24. Manwaring, C.W.; Cravino, J.A.; Patel, M.; Stathakis, J.G.H.; Soliven, A.; Suktham, T.; Shalliker, R.A. Using HPLC with In-Column Derivatization to Authenticate Coffee Samples. Molecules 2023, 28, 1651. [Google Scholar] [CrossRef]
  25. Núñez, N.; Collado, X.; Martínez, C.; Saurina, J.; Núñez, O. Authentication of the Origin, Variety and Roasting Degree of Coffee Samples by Non-Targeted HPLC-UV Fingerprinting and Chemometrics. Application to the Detection and Quantitation of Adulterated Coffee Samples. Foods 2020, 9, 378. [Google Scholar] [CrossRef]
  26. Xie, X.; Zhang, Y.; Yue, Z.; Wang, K.; Mai, X.; Liu, Y.; Zhu, M.; Fan, H.; Zhang, W. Multi-fingerprint profiling analysis for screening and quantification of illegal adulterated antidiabetics in a functional food using HPLC coupled to diode array detection/fluorescence detection. Microchem. J. 2019, 149, 103995. [Google Scholar] [CrossRef]
  27. Klikarová, J.; Česlová, L. Targeted and Non-Targeted HPLC Analysis of Coffee-Based Products as Effective Tools for Evaluating the Coffee Authenticity. Molecules 2022, 27, 7419. [Google Scholar] [CrossRef]
  28. Belchior, V.; Botelho, B.G.; Franca, A.S. Comparison of Spectroscopy-Based Methods and Chemometrics to Confirm Classification of Specialty Coffees. Foods 2022, 11, 1655. [Google Scholar] [CrossRef] [PubMed]
  29. Rocha Baqueta, M.; Coqueiro, A.; Henrique Março, P.; Valderrama, P. Multivariate classification for the direct determination of cup profile in coffee blends via handheld near-infrared spectroscopy. Talanta 2021, 222, 121526. [Google Scholar] [CrossRef] [PubMed]
  30. Milani, M.I.; Rossini, E.L.; Catelani, T.A.; Pezza, L.; Toci, A.T.; Redigolo Pezza, H. Authentication of roasted and ground coffee samples containing multiple adulterants using NMR and a chemometric approach. Food Control. 2022, 112, 112–107104. [Google Scholar] [CrossRef]
  31. Núñez, N.; Pons, J.; Saurina, J.; Núñez, O. FIA-ESI-MS Fingerprinting Method with Chemometrics for the Characterization of Adulterated Coffee Samples. Biol. Life Sci. Forum 2021, 6, 102. [Google Scholar] [CrossRef]
  32. Núñez, N.; Saurina, J.; Núñez, O. Authenticity Assessment and Fraud Quantitation of Coffee Adulterated with Chicory, Barley, and Flours by Untargeted HPLC-UV-FLD Fingerprinting and Chemometrics. Foods 2021, 10, 840. [Google Scholar] [CrossRef]
  33. Bobková, A.; Hudáček, M.; Jakabová, S.; Belej, Ľ.; Capcarová, M.; Čurlej, J.; Bobko, M.; Árvay, J.; Jakab, I.; Čapla, J.; et al. The effect of roasting on the total polyphenols and antioxidant activity of coffee. J. Environ. Sci. Health 2020, 55, 495–500. [Google Scholar] [CrossRef]
  34. Zhu, M.; Long, Y.; Chen, Y.; Huang, Y.; Tang, L.; Gan, B.; Yu, Q.; Xie, J. Fast determination of lipid and protein content in green coffee beans from different origins using NIR spectroscopy and chemometrics. J. Food Compost. Anal. 2021, 102, 104055. [Google Scholar] [CrossRef]
  35. Grotzkyj Giorgi, M.; Howland, K.; Martin, C.; Bonner, A.B. A Novel HPLC Method for the Concurrent Analysis and Quantitation of Seven Water-Soluble Vitamins in Biological Fluids (Plasma and Urine): A Validation Study and Application. Sci. World J. 2012, 2012, 359721. [Google Scholar] [CrossRef]
  36. ISO 11294:1994; Roasted Ground Coffee—Determination of Moisture Content—Method by Determination of Loss in Mass at 103 °C (Routine Method). ISO: Geneva, Switzerland, 1994.
  37. Climate Knowled Geportal. Available online: https://climateknowledgeportal.worldbank.org/ (accessed on 2 April 2023).
  38. Ali, A.; Zahid, H.F.; Cottrell, J.J.; Dunshea, F.R. A Comparative Study for Nutritional and Phytochemical Profiling of Coffea arabica (C. arabica) from Different Origins and Their Antioxidant Potential and Molecular Docking. Molecules 2022, 27, 5126. [Google Scholar] [CrossRef]
  39. Good Kitzberger, C.S.; dos Santos Scholz, M.B.; Protasio Pereira, L.F.; Gonçalves Dias da Silva, J.B.; de Toledo Benassi, M. Profile of the diterpenes, lipid and protein content of different coffee cultivars of three consecutive harvests. Agric. Food 2016, 1, 254–264. [Google Scholar] [CrossRef]
  40. Nzekoue, F.K.; Borsetta, G.; Navarini, L.; Abouelenein, D.; Xiao, J.; Sagratini, G.; Vittori, S.; Caprioli, G.; Angeloni, S. Coffee silverskin: Characterization of B-vitamins, macronutrients, minerals and phytosterols. Food Chem. 2022, 32, 131188. [Google Scholar] [CrossRef]
  41. Mansur Tavares, K.; Ribeiro Lima, A.; Nunes, C.A.; Almeida Silva, V.; Mendes, E.; Casal, S.; Alvarenga Pereira, R.G.F. Free tocopherols as chemical markers for Arabica coffee adulteration with maize and coffee by-products. Food Control. 2016, 70, 318–324. [Google Scholar] [CrossRef]
  42. Commission Regulation (EC) No 1881/2006 of 19 December 2006 Setting Maximum Levels for Certain Contaminants in Foodstuff. Available online: https://eur-lex.europa.eu/legal-content/EN/ALL/?uri=celex%3A32006R1881 (accessed on 2 April 2023).
  43. Jimenez, A.; Adisa, A.; Woodham, C.; Saleh, M. Determination of polycyclic aromatic hydrocarbons in roasted coffee. J. Environ. Sci. Health B 2014, 49, 828–835. [Google Scholar] [CrossRef]
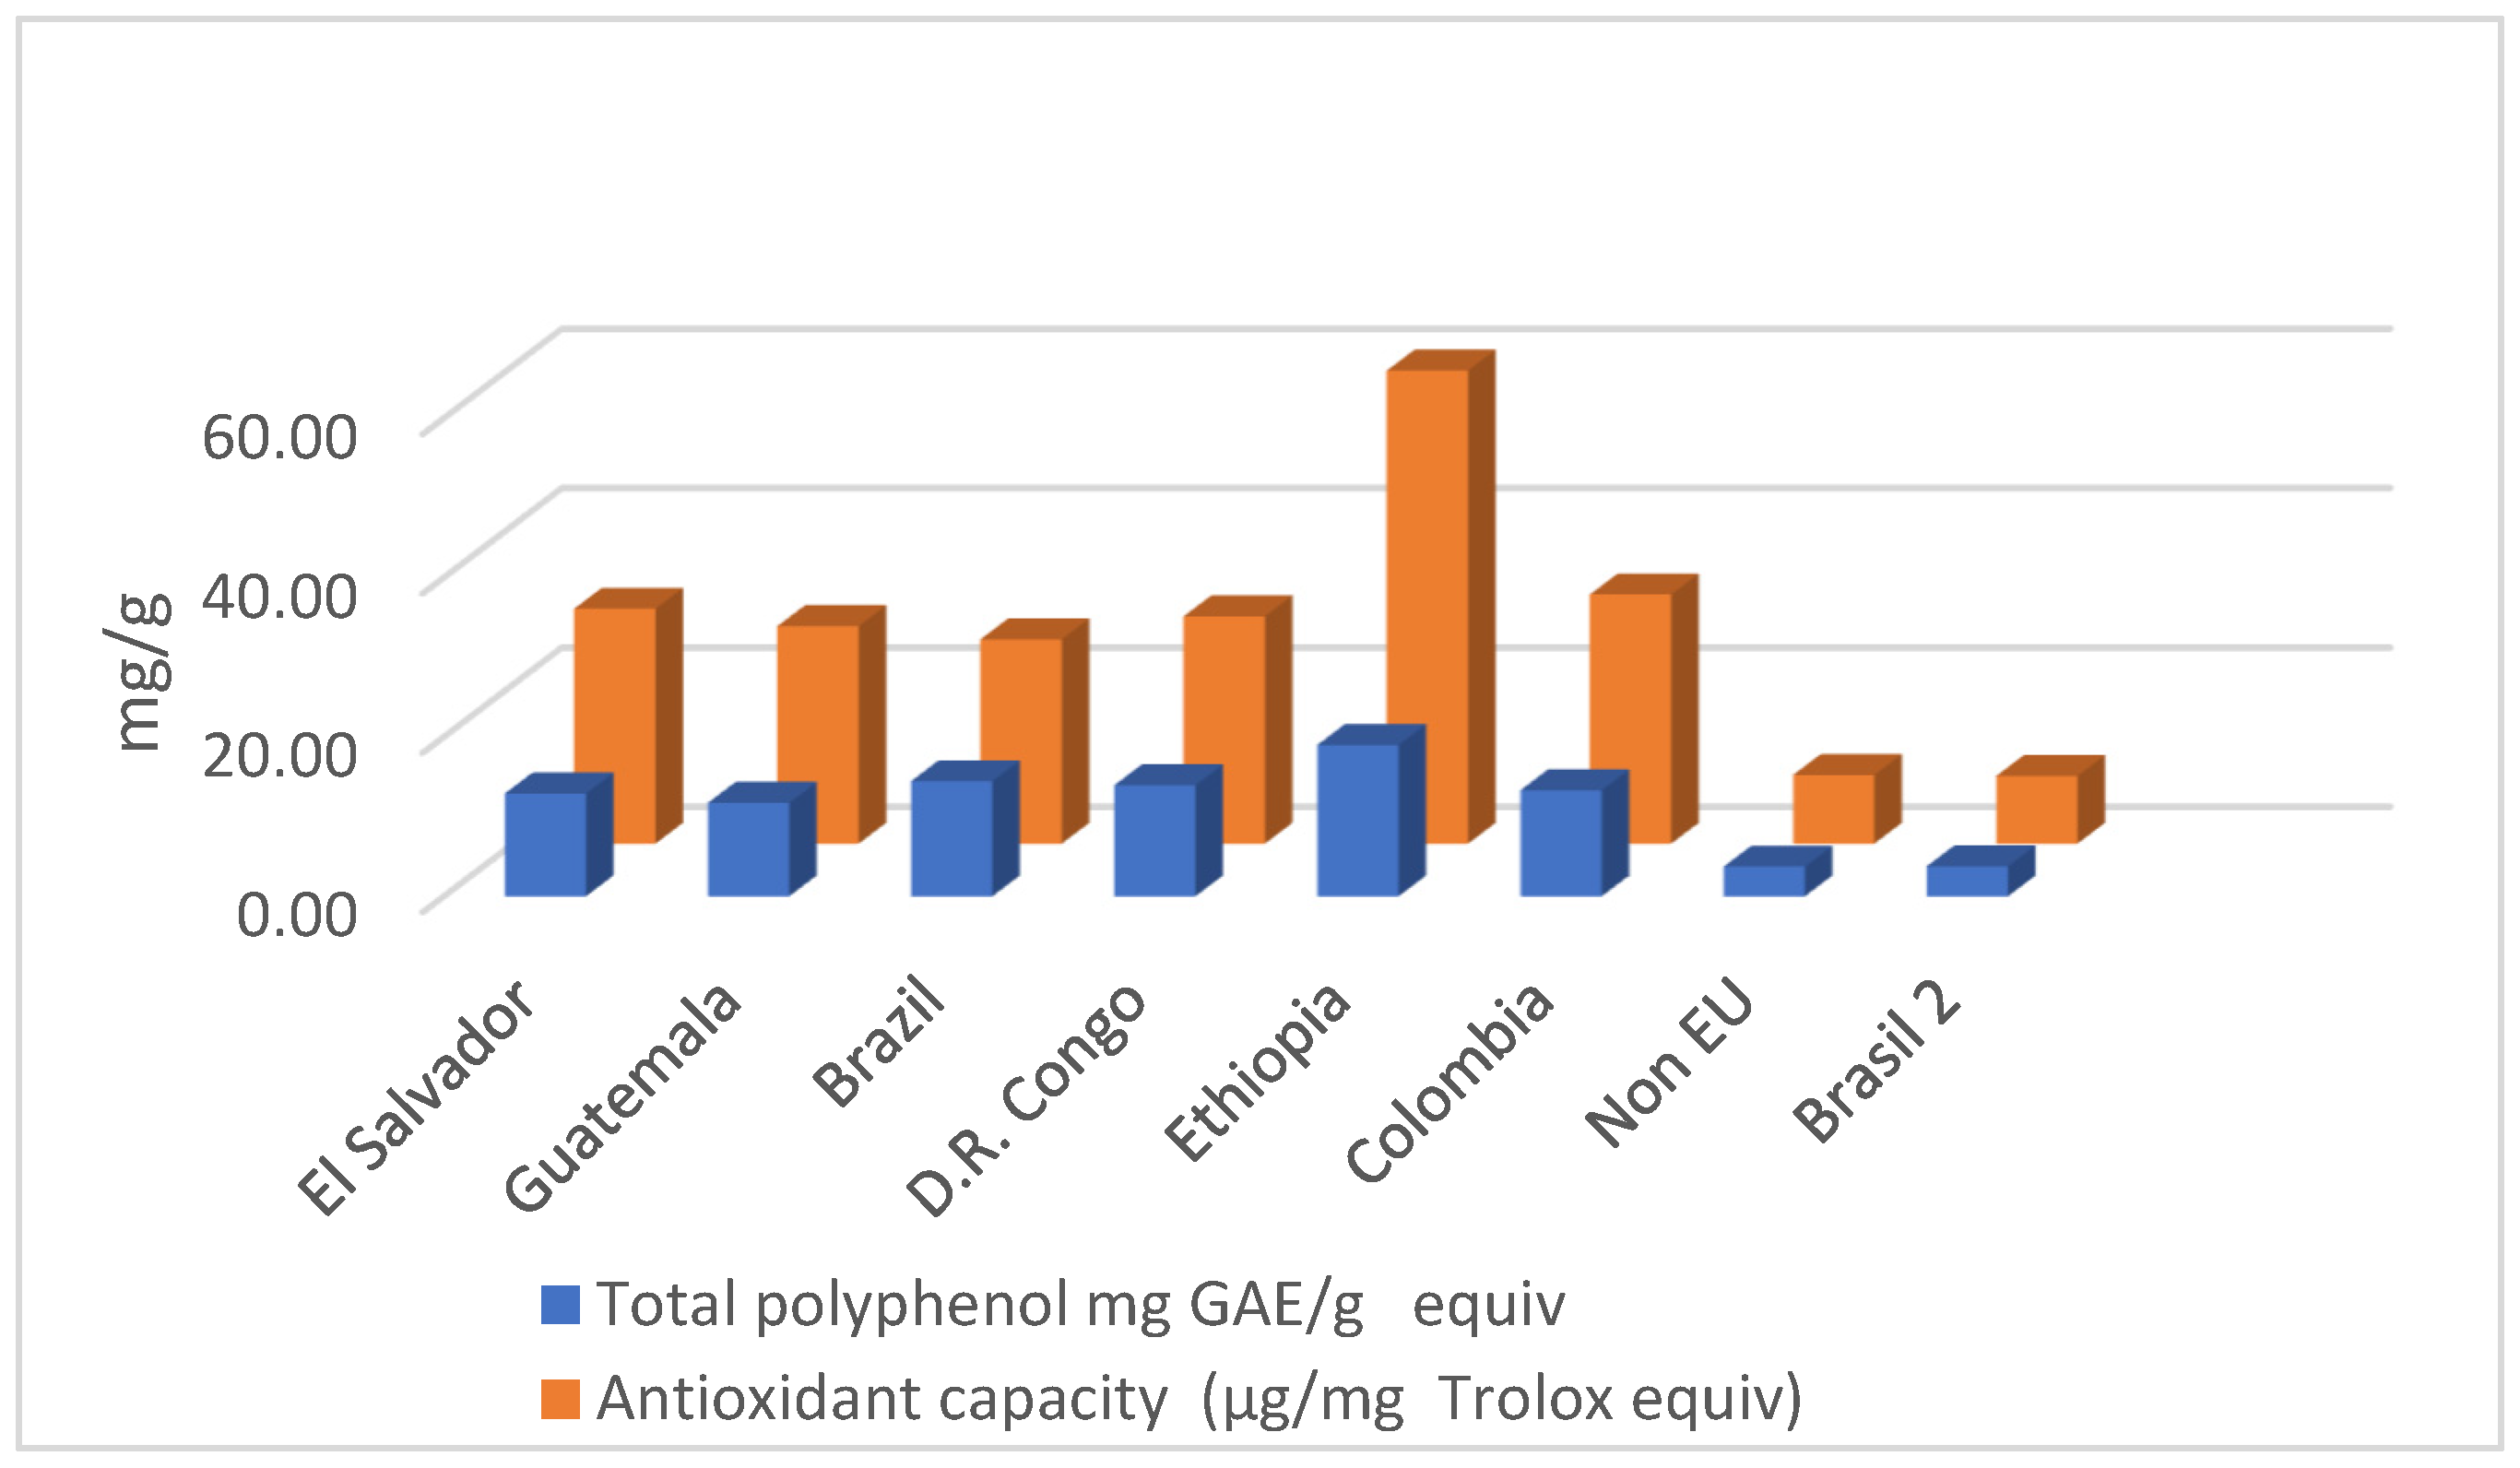
Figure 1. Average results obtained for total polyphenols, polyphenols, and total antioxidant capacity.
Agriculture 13 01146 g001
Figure 2. Matrix plot of catechin, total polyphenols, and antioxidant capacity.
Agriculture 13 01146 g002
Figure 3. Bubble plot of antioxidant capacity vs. mean annual precipitation.
Agriculture 13 01146 g003
Figure 4. Surface plot of antioxidant capacity vs. total polyphenol and catechin content.
Agriculture 13 01146 g004
Figure 5. Distribution of total polyphenols for each country of origin.
Agriculture 13 01146 g005
Figure 6. Distribution of total B vitamins for each country of origin.
Agriculture 13 01146 g006
Figure 7. Average values for chrysene, benzo(a)pyrene, and total PAHs in ng/g.
Agriculture 13 01146 g007
Table 1. General data regarding the coffee samples.
Coffee OriginNumber of SamplesPurchased From
El Salvador8Specialty coffee shops
Guatemala7Specialty coffee shops
Brazil 113Specialty coffee shops
D.R. Congo4Specialty coffee shops
Ethiopia7Specialty coffee shops
Colombia13Specialty coffee shops
Non-EU origin 11General store
Brazil 24General store
Table 2. Average pedo-climatic characteristics for each country.
Coffee OriginSoil TypeMean Annual Precipitation (mm)Mean Annual Temperature (°C)Altitude (m)
El Salvadorvolcanic 1703.5425.241200
Guatemalaclay-and-limestone2171.7423.661750
Brazilvolcanic loam1778.8725.451000
D.R. Congoclay-sandy volcanic1500.7724.351800
Ethiopiavolcanic Nitosols850.1423.371950
Colombiavolcanic2562.17251750
Table 3. Average results obtained for total polyphenols, polyphenols, and total antioxidant capacity.
Coffee OriginTotal Polyphenol
mg GAE/g
Catechin µg/mgAntioxidant Capacity mg/g Trolox Equiv.
El Salvador12.899 ±0.4720.482 ± 0.06029.493 ± 0.559
Guatemala11.731 ± 0.7370.558 ± 0.04227.304 ± 0.635
Brazil 114.447 ± 0.5750.660 ± 0.05625.652 ± 0.804
D.R. Congo13.933 ± 0.3920.580 ± 0.04828.543 ± 1.030
Ethiopia19.00 ± 1.0870.74 ± 0.04559.37 ± 1.107
Colombia13.31 ± 0.6140.64 ± 0.05331.28 ± 0.737
Non-EU origin 3.72 ± 0.5640.26 ± 0.0508.62 ± 0.596
Brazil 23.78 ± 0.8220.25 ± 0.0718.50 ± 0.824
Table 4. Average results obtained for total lipids and total protein.
Coffee OriginTotal Lipids %Total Protein %
El Salvador14.610 ± 0.30312.474 ± 0.858
Guatemala13.541 ± 0.37112.834 ± 0.970
Brazil 19.482 ± 0.7899.777 ± 0.639
D.R. Congo13.543 ± 0.56212.223 ± 0.808
Ethiopia10.39 ± 0.75411.02 ± 0.698
Colombia12.76 ± 1.11912.94 ± 1.389
Non-EU origin9.85 ± 0.8439.93 ± 0.591
Brazil 29.00 ± 0.81610.48 ± 0.248
Table 5. Average results obtained for hydro- and liposoluble vitamins.
Coffee OriginB1
µg/g
B2
µg/g
B3
µg/g
B6
µg/g
α-Tocopherol
µg/g
β-Tocopherol
µg/g
γ-Tocopherol
µg/g
δ-Tocopherol
µg/g
El Salvador0.136 ± 0.0120.116 ± 0.0388.881 ± 0.560.015 ± 0.00230.7 ± 1.350.8 ± 0.70.016 ± 0.0030.936 ± 0.206
Guatemala0.063 ± 0.0110.027 ± 0.0118.124 ± 0.310.014 ± 0.00131.2 ± 1.551.5 ± 1.10.029 ± 0.0050.853 ± 0.063
Brazil 10.339 ± 0.0480.215 ± 0.05510.311 ± 0.730.075 ± 0.0447.1 ± 2.5110.4 ± 4.80.114 ± 0.1501.335 ± 0.202
D.R. Congo0.163 ± 0.0280.158 ± 0.02210.353 ± 0.360.058 ± 0.00844.2 ± 0.799.1 ± 5.60.023 ± 0.0021.154 ± 0.083
Ethiopia0.22 ± 0.0400.07 ± 0.01311.40 ± 0.670.08 ± 0.01045.2 ± 0.498.7 ± 4.50.03 ± 0.0041.19 ± 0.179
Colombia0.25 ± 0.0300.13 ± 0.0299.58 ± 0.650.07 ± 0.00832.6 ± 0.852.7 ± 1.00.03 ± 0.0050.92 ± 0.094
Non-EU origin0.03 ± 0.0190.02 ± 0.0152.34 ± 0.560.01 ± 0.00322.5 ± 0.739.3 ± 5.00.02 ± 0.0160.24 ± 0.049
Brazil 2<LQ *<LQ2.01 ± 0.31<LQ23.0 ± 0.740.9 ± 1.6<LQ **0.24 ± 0.044
* LQ = 0.06 µg/g; ** LQ = 0.01 µg/g.
Table 6. Average results obtained for PAHs in ng/g.
Coffee OriginValueNapPhenAnthrFluorPyreneBenzo
(a)antr
ChryBenzo
(b)f
Benzo
(a)p
Dibenzo
(a,h)a
Total PAHs
El SalvadorAvg.5.211.251.110.590.870.220.080.110.590.0910.43
SD0.720.020.090.130.380.040.010.120.23n.a.3.52
GuatemalaAvg.7.1112.641.120.680.180.140.200.041.430.1223.50
SD1.661.180.100.070.100.030.020.010.24n.a.2.28
Brazil 1Avg.6.3513.840.760.560.220.150.130.070.810.0722.79
SD0.891.000.090.100.060.240.030.040.070.051.72
D.R. CongoAvg.10.3426.710.501.940.120.134.65<LQ *1.22<LQ45.61
SD1.097.570.080.360.030.048.90n.a.0.12n.a.7.72
EthiopiaAvg.8.746.680.711.750.200.040.45<LQ0.130.2418.75
SD0.621.150.080.350.040.020.10n.a.0.04n.a.0.99
ColombiaAvg.10.4710.413.531.950.950.030.200.021.260.2228.86
SD0.610.790.400.663.020.010.090.010.180.05n.a
Non-EU originAvg.12.5510.912.081.870.390.090.490.041.530.3730.04
SD1.490.880.370.530.040.030.150.020.270.082.12
Brazil 2Avg.11.7010.911.812.030.370.090.300.041.610.3328.99
SD1.750.890.460.450.050.010.220.010.060.122.63
* LQ = 0.005 ng/g.
Disclaimer/Publisher’s Note: The statements, opinions and data contained in all publications are solely those of the individual author(s) and contributor(s) and not of MDPI and/or the editor(s). MDPI and/or the editor(s) disclaim responsibility for any injury to people or property resulting from any ideas, methods, instructions or products referred to in the content.