Article

Organic Nitrogen Fertilizer Selection Influences Water Use Efficiency in Drip-Irrigated Sweet Corn †

1
Faculty of Agriculture, University Putra Malaysia, Seri Kembangan 43400, Selangor, Malaysia
2
Department of Horticulture & Landscape Architecture, Colorado State University, Fort Collins, CO 80523-1173, USA
3
Agricultural Experiment Station, Colorado State University, Fort Collins, CO 80523-3001, USA
*
Author to whom correspondence should be addressed.
This research work is a part of the Ph.D. thesis by Arina Sukor.
Agriculture 2023, 13(5), 923; https://doi.org/10.3390/agriculture13050923
Submission received: 5 April 2023 / Revised: 17 April 2023 / Accepted: 20 April 2023 / Published: 22 April 2023

Abstract

:
Organic farmers often rely on off-farm nitrogen (N) sources for mid-season N. Farmers can also produce cyano-fertilizer on-farm by growing N-fixing cyanobacteria (Anabaena spp.) in raceways and applying the cyanobacteria through irrigation systems. A two-year field study was conducted, and blood meal, feather meal, fish emulsion, and cyano-fertilizer were evaluated to determine whether the water use efficiency (WUE) of sweet corn (Zea mays) was affected by fertilizer type. Fish emulsion and cyano-fertilizer were supplied in four split applications through drip irrigation, while the blood meal and feather meal were subsurface banded pre-plant. Leaf gas exchange measurements were taken during tasseling. The amounts of phytohormone and Fe applied in organic N fertilizers were correlated with field water use efficiency (fWUE), instantaneous water use efficiency (iWUE), and leaf gas exchange components of sweet corn. A positive relationship was observed between the amount of salicylic acid (SA) applied with both iWUE (r = 0.71, p < 0.05) and fWUE (r = 0.68, p < 0.01). The amount of Fe applied was positively correlated with the leaf vapor pressure deficit (r = 0.54, p < 0.01) and transpiration rate (r = 0.53, p < 0.01). Cyano-fertilizer had the highest yield and WUE, likely due to the high amount of SA applied, although fish emulsion was comparable in year one. These relationships require further exploration to elucidate the mechanisms impacting WUE.

1. Introduction

Water use efficiency (WUE) can be measured on various scales from the leaf to the field [1]. WUE is a measurement of the carbon (C) assimilated per unit of water transpired by the plant [2]. It can be measured using either a leaf gas exchange [3] or field-scale approach [4]. Field water use efficiency (fWUE) is defined as the yield produced per unit of water used. Methods of measuring instantaneous WUE (iWUE) using the leaf gas exchange approach are derived from direct measurements of photosynthesis and transpiration [5].
Fertilizer type has the potential to influence WUE. Nitrogen (N) plays a crucial role in the crop growth and yield development of sweet corn (Zea mays), and its application affects WUE. Organic growers often use commercial, organic, animal-based fertilizers which vary in their nutrient composition and forms of available N (NH4+-N and NO3-N) and have high transportation costs to meet the N demand of crops. Organic agriculture often relies on fertilizers and soil amendments from off-farm sources to meet crop N demand [6]. Organic N fertilizers can be classified as solid (e.g., compost, blood meal, and feather meal) or liquid (e.g., fish emulsion) [7]. In organic agriculture, solid fertilizers are often incorporated into the soil before planting, while liquid fertilizers are generally applied season-long through irrigation.
Most commercially available organic fertilizers act as slow-release N sources and are often produced off-farm (such as blood meal, feather meal, and fish emulsion). However, other fertilizer options are being developed that will allow farmers to produce N fertilizer on-farm, such as the cultivation of N-fixing cyanobacteria (e.g., Anabaena spp.) for direct use as fertilizer. Cyanobacteria have unique dual properties because they can both fix N from the atmosphere and photosynthesize to produce N fertilizer without fossil fuels. When used as fertilizer, cyanobacteria (also known as cyano-fertilizer) have been shown to be effective in greenhouse studies on kale, maize, and pepper [8] and in field studies, both in drip-irrigated kale [9] and sprinkler-irrigated peach [10]. In addition, cyano-fertilizer can provide additional benefits by solubilizing organic phosphorus (P) sources [11] and improving plant tolerance to abiotic and biotic stresses [12].
Organic N fertilizers have different chemical properties that influence plant growth and development and plant–water relations due to the micronutrients and phytohormones present in these fertilizers. Micronutrients, including iron (Fe) and zinc (Zn), in organic N fertilizers can influence stomatal regulation, photosynthesis, and osmoregulation in plants [13,14]. Phytohormones in organic fertilizers can also influence plant growth and development. Phytohormones, such as abscisic acid (ABA), play a significant role in regulating plant–water relations [15,16]. Auxin in the form of indole-3-acetic acid (IAA) has been associated with the increased growth and development of photosynthetic pigments in grape and wheat [17,18]. IAA caused a wider and more circular structure of the xylem vessels in eggplant, which subsequently increased water transport [19]. In addition, cyano-fertilizer production methods can alter phytohormone concentrations, including ABA, IAA, and salicylic acid (SA) [20].
SA has been shown to increase WUE in maize and mustard [21,22,23]. The effects of the exogenous application of SA on growth, photosynthesis, stomatal regulation, and plant–water relations have been measured in maize and soybeans [24,25,26]. The WUE of broccoli plants increased following SA application due to enhanced cell division [27]. Most exogenous applications of SA to plants have been in the form of foliar application. SA may be related to the induction of the antioxidant response and to the protective role of membranes that increase the ability of plants to regulate water use [28]. Overall, the effects of SA in plants depend on its concentration and plant species [29].
Different forms of N in fertilizer can also induce various effects on plant growth and physiology. Inorganic forms of N in fertilizer have been shown to affect the WUE of French bean [30] and N assimilation in wheat [31]. Inorganic forms of N, particularly NH4+-N, decreased the WUE and net photosynthetic rate of tea plants [32], while a high NO3-N concentration in fertilizers has been shown to decrease leaf transpiration rate in maize [33]. NO3-N contributes to changes in stomatal aperture, increased dry matter accumulation and WUE in tomato compared to NH4+-N [34]. When fertilizers with high NH4+-N concentrations were used, the leaf area, fresh weight, and WUE of artichoke were lower [35] due to interferences with the photosynthetic production of ATP, the metabolism of carbohydrates, and amino acid synthesis [36]. Many WUE studies have been conducted on the effects of N fertilizer [30,32,33,37,38], but none of them have compared cyano-fertilizer with other organic fertilizers on sweet corn. There is also no literature describing how inorganic N forms and phytohormone concentrations in fertilizers affect the WUE of sweet corn. We hypothesized that (i) phytohormones in organic fertilizers (IAA and SA) will increase WUE and ear yield; (ii) an increasing amount of N applied as NH4+-N will reduce the WUE (fWUE and iWUE) and ear yield of sweet corn; (iii) an increasing amount of N applied as NO3-N will decrease the transpiration rate and increase the WUE (fWUE and iWUE); and (iv) micronutrients (Fe and Zn) in organic N fertilizers may influence gas exchange components in sweet corn. The overall aim of this study was to assess whether phytohormones, micronutrients, and forms of inorganic N in organic fertilizers affect the WUE (fWUE and iWUE) and leaf gas exchange components of drip-irrigated sweet corn under typical application methods and field conditions.

2. Materials and Methods

Field experiments were carried out on certified organic land at the Colorado State University (CSU) Horticulture Field Research Center (Fort Collins, CO, USA; 40°36′39.78′′ N, 104°59′48.25′′ W). Previously, the field area was planted with buckwheat followed by winter cover crops, rye (Secale cereal) and turnips (Brassica rapa). The experimental site is in a semi-arid zone with clay loam soils. The soil was classified as a fine, smectitic, mesic Aridic Argiustoll of the Nunn series [39].
Soil samples were collected to a depth of 30 cm from a representative area of the field (15 m × 30 m) and analyzed by the Soil, Water, and Plant Testing Laboratory at Colorado State University. Particle size distribution was determined using the hydrometer method based on Stoke’s law [40]. Chemical analyses included soil pH and electrical conductivity (EC) measured in supernatant suspension of 1:1 soil to water using a Mettler Toledo pH/EC meter (Thermo Fischer Scientific, Waltham, MA, USA). Cation exchange capacity (CEC) was determined by summation of the exchangeable bases (Ca2+, K+, Mg2+, Na+) plus hydrogen (H+) using ammonium acetate (1 N NH4C2H3O2, pH 7.0) [41]. Organic matter (OM) content was determined by the loss on ignition method [42]. Soil inorganic N (NH4+-N and NO3-N) was extracted using 2 M KCl, and the filtered extract was analyzed using an Alpkem Flow Solution IV Auto Analyzer (OI Analytical, College Station, TX, USA). Phosphorus (P) was extracted with 0.5 M sodium bicarbonate (NaHCO3) solution [43] and analyzed using a Perkin Elmer Inductively Coupled Plasma/Optical Emission Spectrometer (ICP-OES) (Perkin Elmer, Waltham, MA, USA). Major cations (K, Ca, and Mg) and micronutrients (Fe and Zn) were extracted with ammonium bicarbonate–diethylene triaminepentaacetic acid (AB-DTPA) [44] and analyzed by ICP-OES (Perkin Elmer, Waltham, MA, USA). The results of soil physical, chemical, and nutrient analyses are presented in Table 1.
Treatments consisting of four different types of N fertilizer and control (no fertilizer) were arranged in a randomized complete block design with four replications. Plots were single-row plots (76 cm × 457 cm); we do not expect fertilizer movement to neighboring plots due to a calculated wetting radius of only 7 cm around each emitter and a large (>0.50 m) dry inter-row zone. The fertilizers compared in this study were liquid fertilizers (Alaska® fish emulsion (Planet Natural, Bozeman, MO, USA) and cyano-fertilizer) and solid fertilizers (blood meal and feather meal (Down To Earth Inc., Eugene, OR, USA)). For this study, N-fixing cyanobacteria (Anabaena sp.) were cultured from local soils and inoculated into nutrient-supplemented raceways (shallow, elliptical ponds) [45,46].
Sweet corn (Zea mays var. Luscious F1 se+) seeds were purchased from Johnny’s Seeds (Johnny’s Selected Seed, Waterville, ME, USA). Seeds were hand planted at a depth of approximately 2.5 cm on 1 July 2013 and 2 July 2014, with an in-row spacing of 12 cm in rows spaced 76 cm apart.
The amount of precipitation was obtained from a nearby CoAgMet weather station (http://www.coagmet.colostate.edu/ accessed on 5 January 2015). Water was applied daily using an automated drip irrigation system. Two lines of John Deere® drip tape (Deere & Co., Moline, IL, USA) with a flow rate of 125 L hour−1 100 m−1 were stretched along each row. The drip system used for this study comprised of laterals (15 mm diameter), and emitters were 20 cm apart. Irrigation was applied for 15 min day−1 at the initial stage and was changed to 30 min day−1 after plants reached the V6 stage (Table 2).
Both the fish emulsion and cyano-fertilizer were in liquid form and were supplied in four split applications through the drip irrigation system over the growing season, while the blood meal and feather meal were in dry powdered form and incorporated into the soil prior to planting. Blood meal and feather meal were applied 6 cm from the plants and 6 cm deep through band application using a hoe. Although the fertilizers differed in application method and timing, all fertilizers were applied at 112 kg N ha−1 using common farmer practices for solid and liquid fertilizers, and no other nutrients were recommended based on soil testing.
Fertilizer samples were sent to the Soil, Water, and Plant Testing Laboratory at CSU and analyzed for N, C, P, K, Fe, Ca, Mg, and Zn (Table 3 and Table 4). Nitrogen and C were measured with a CN analyzer (TruSpec® Micro CN Analyzer, Geleen, The Netherlands). Fertilizer samples were digested with nitric acid (HNO3) and hydrogen peroxide (H2O2). Major cations (K, Ca, and Mg) and micronutrients (Fe and Zn) were analyzed using an ICP-OES (Perkin Elmer, Waltham, MA, USA). Solid fertilizers were extracted using 2 M KCl, and the filtered extracts were analyzed for NH4+-N and NO3-N. The filtered extracts of solid and liquid fertilizers were analyzed using an Alpkem Flow Solution IV Auto Analyzer (OI Analytical, College Station, TX, USA) (Table 4).
Phytohormone analyses were conducted at the Proteomics and Metabolomics Facility, CSU. Fertilizer samples were adjusted to pH 7.0 with 1 N NaOH and extracted three times with water-saturated n-butanol, followed by vacuum drying [47]. The extracts obtained were filtered through membrane filters (pore size 0.45 µm). Supernatants were harvested by centrifugation at 5000× g for 20 min at 4 °C. Supernatants were homogenized in liquid nitrogen using a cold mortar and pestle. The resulting powder was extracted using 80% methanol containing 10 mg L−1 butylated hydroxytoluene at 4 °C. Samples were methylated with diazomethane and dissolved in heptane. Gas chromatography-mass spectrometry (GC-MS) analyses were performed [48]. The concentrations and amounts of phytohormones applied over the growing season for each fertilizer treatment are presented in Table 5.
Leaf gas exchange measurements of the uppermost, fully expanded leaf from three plants in each plot were carried out during tasseling in 2014 using a portable open photosynthesis system, LI- 6400XT (LI-COR Inc., Lincoln, NE, USA). Measurements were taken between 10:00 and 15:00 under ambient CO2 (380 µL L−1); the leaf temperature inside the cuvette was set to 26 °C, and the photon flux density was 2000 µmol m−2 s−1. Relative humidity was monitored and ranged between 50 and 60% during the day. Each leaf was allowed to reach a steady state of CO2 uptake in the LI-6400XT leaf chamber before measurements were taken.
All aboveground plant parts from each treatment were hand harvested and separated into leaves, stems, and ears at 79 days after planting. The separated plant parts were dried at 70 °C for 72 h and weighed to determine the total above-ground biomass, but marketable yields were reported as fresh weights since that is how sweet corn is generally sold. Field water use efficiency (fWUE) was calculated using fresh ear yield divided by total amount of water applied over the growing season (precipitation + irrigation + fertigation). Instantaneous water use efficiency (iWUE) was only measured in 2014 and calculated as the ratio of net photosynthetic rate to transpiration rate and expressed in µmol CO2 mmol−1 H2O.
Data were analyzed using SAS version 9.3 (SAS Institute Inc., Cary, NC, USA). The Univariate and Boxplot procedures were used to evaluate the normality of data distribution. Analysis of variance (ANOVA) was performed on the data by using the GLM procedure. The Tukey’s Studentized Range (HSD) test of mean separation value was calculated from the obtained mean square errors to determine whether main effects or interactions were significant (p < 0.10). The relationships between parameters were assessed by linear correlation using the CORR procedure. PROC REG with the stepwise selection method was used to select the best combination of independent variables (gas exchange components, IAA, SA, NH4+-N, NO3-N, Fe, and Zn applied in organic N fertilizers) to predict the dependent variables (fWUE and iWUE).

3. Results

All fertilizer sources significantly increased yield as compared to the control in 2013, and fish emulsion and cyano-fertilizer treatments had significantly higher fresh yield compared to other treatments and control (p = 0.0032; Figure 1a). In 2014, only the cyano-fertilizer treatment had a higher yield compared with other treatments and control (p < 0.0001; Figure 1b). No fertilizer effect was observed in the dry weight of leaves or stems.
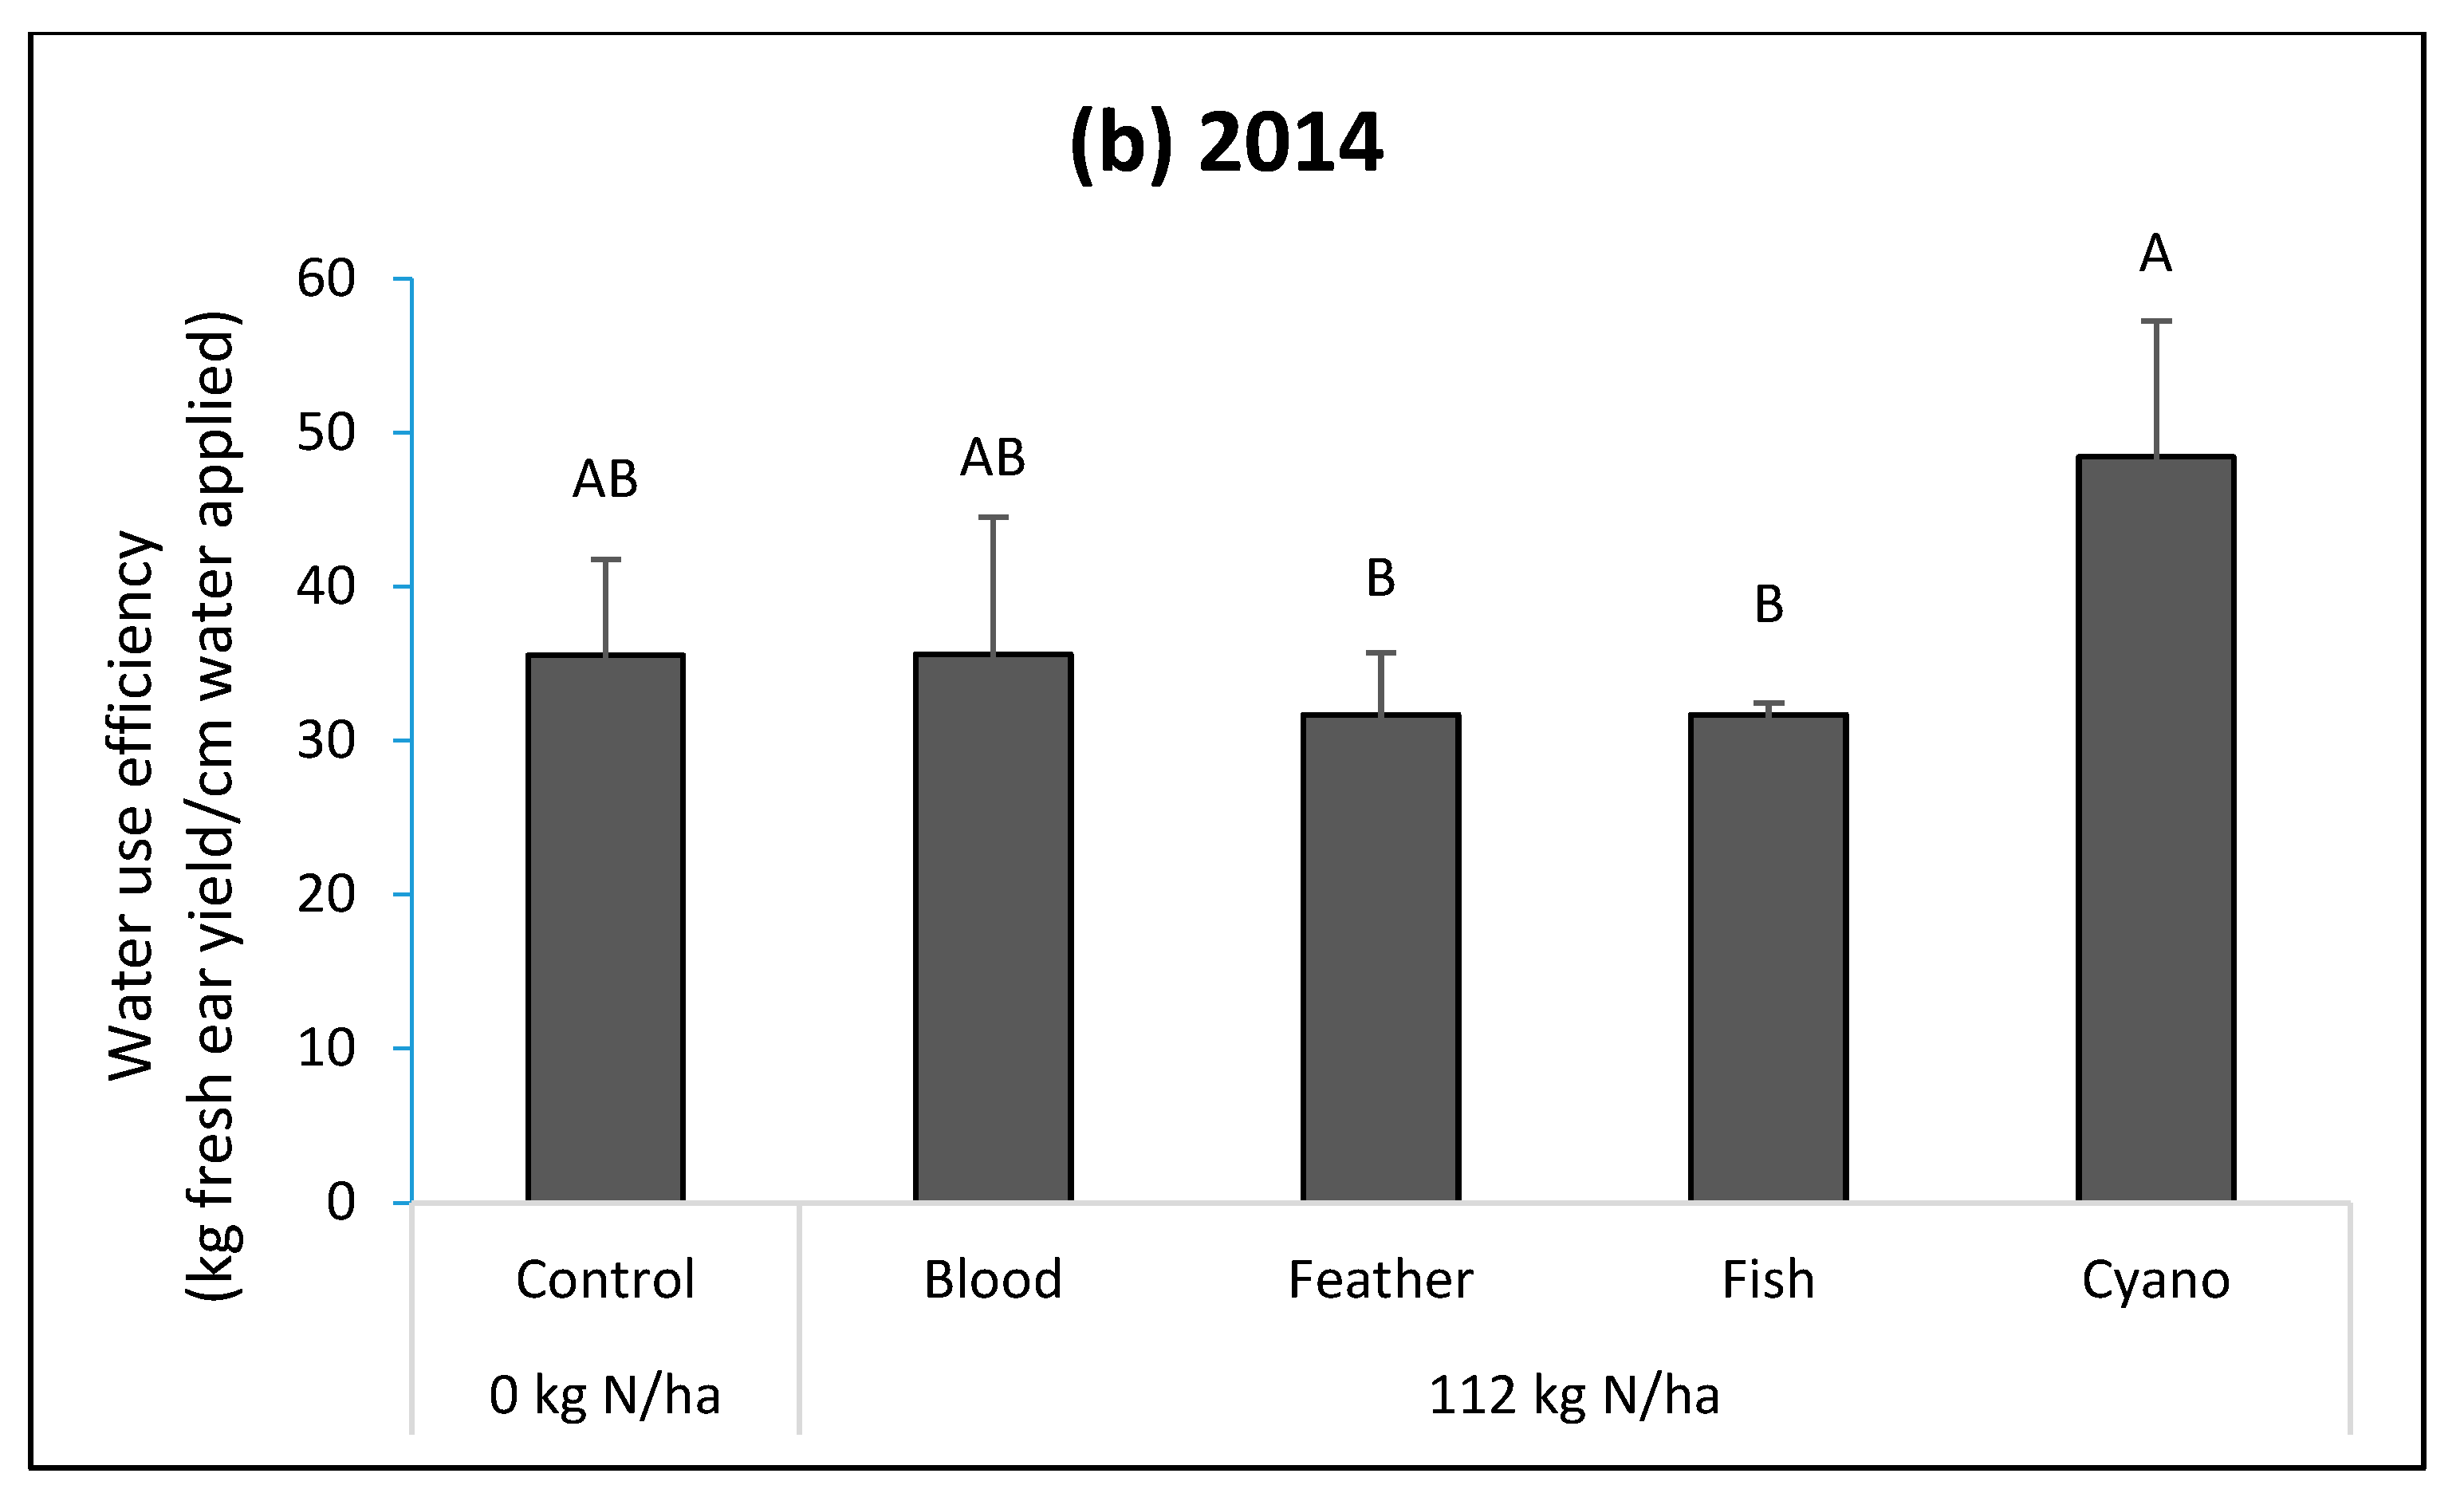
The fish emulsion, cyano-fertilizer, and blood meal treatments had higher fWUEs compared to the control in 2013 (p = 0.0002; Figure 2a). The cyano-fertilizer treatment had a higher fWUE compared to blood meal and feather meal in 2013 (Figure 2a) and higher fWUE than feather meal and fish emulsion treatments in 2014 (p < 0.0001; 
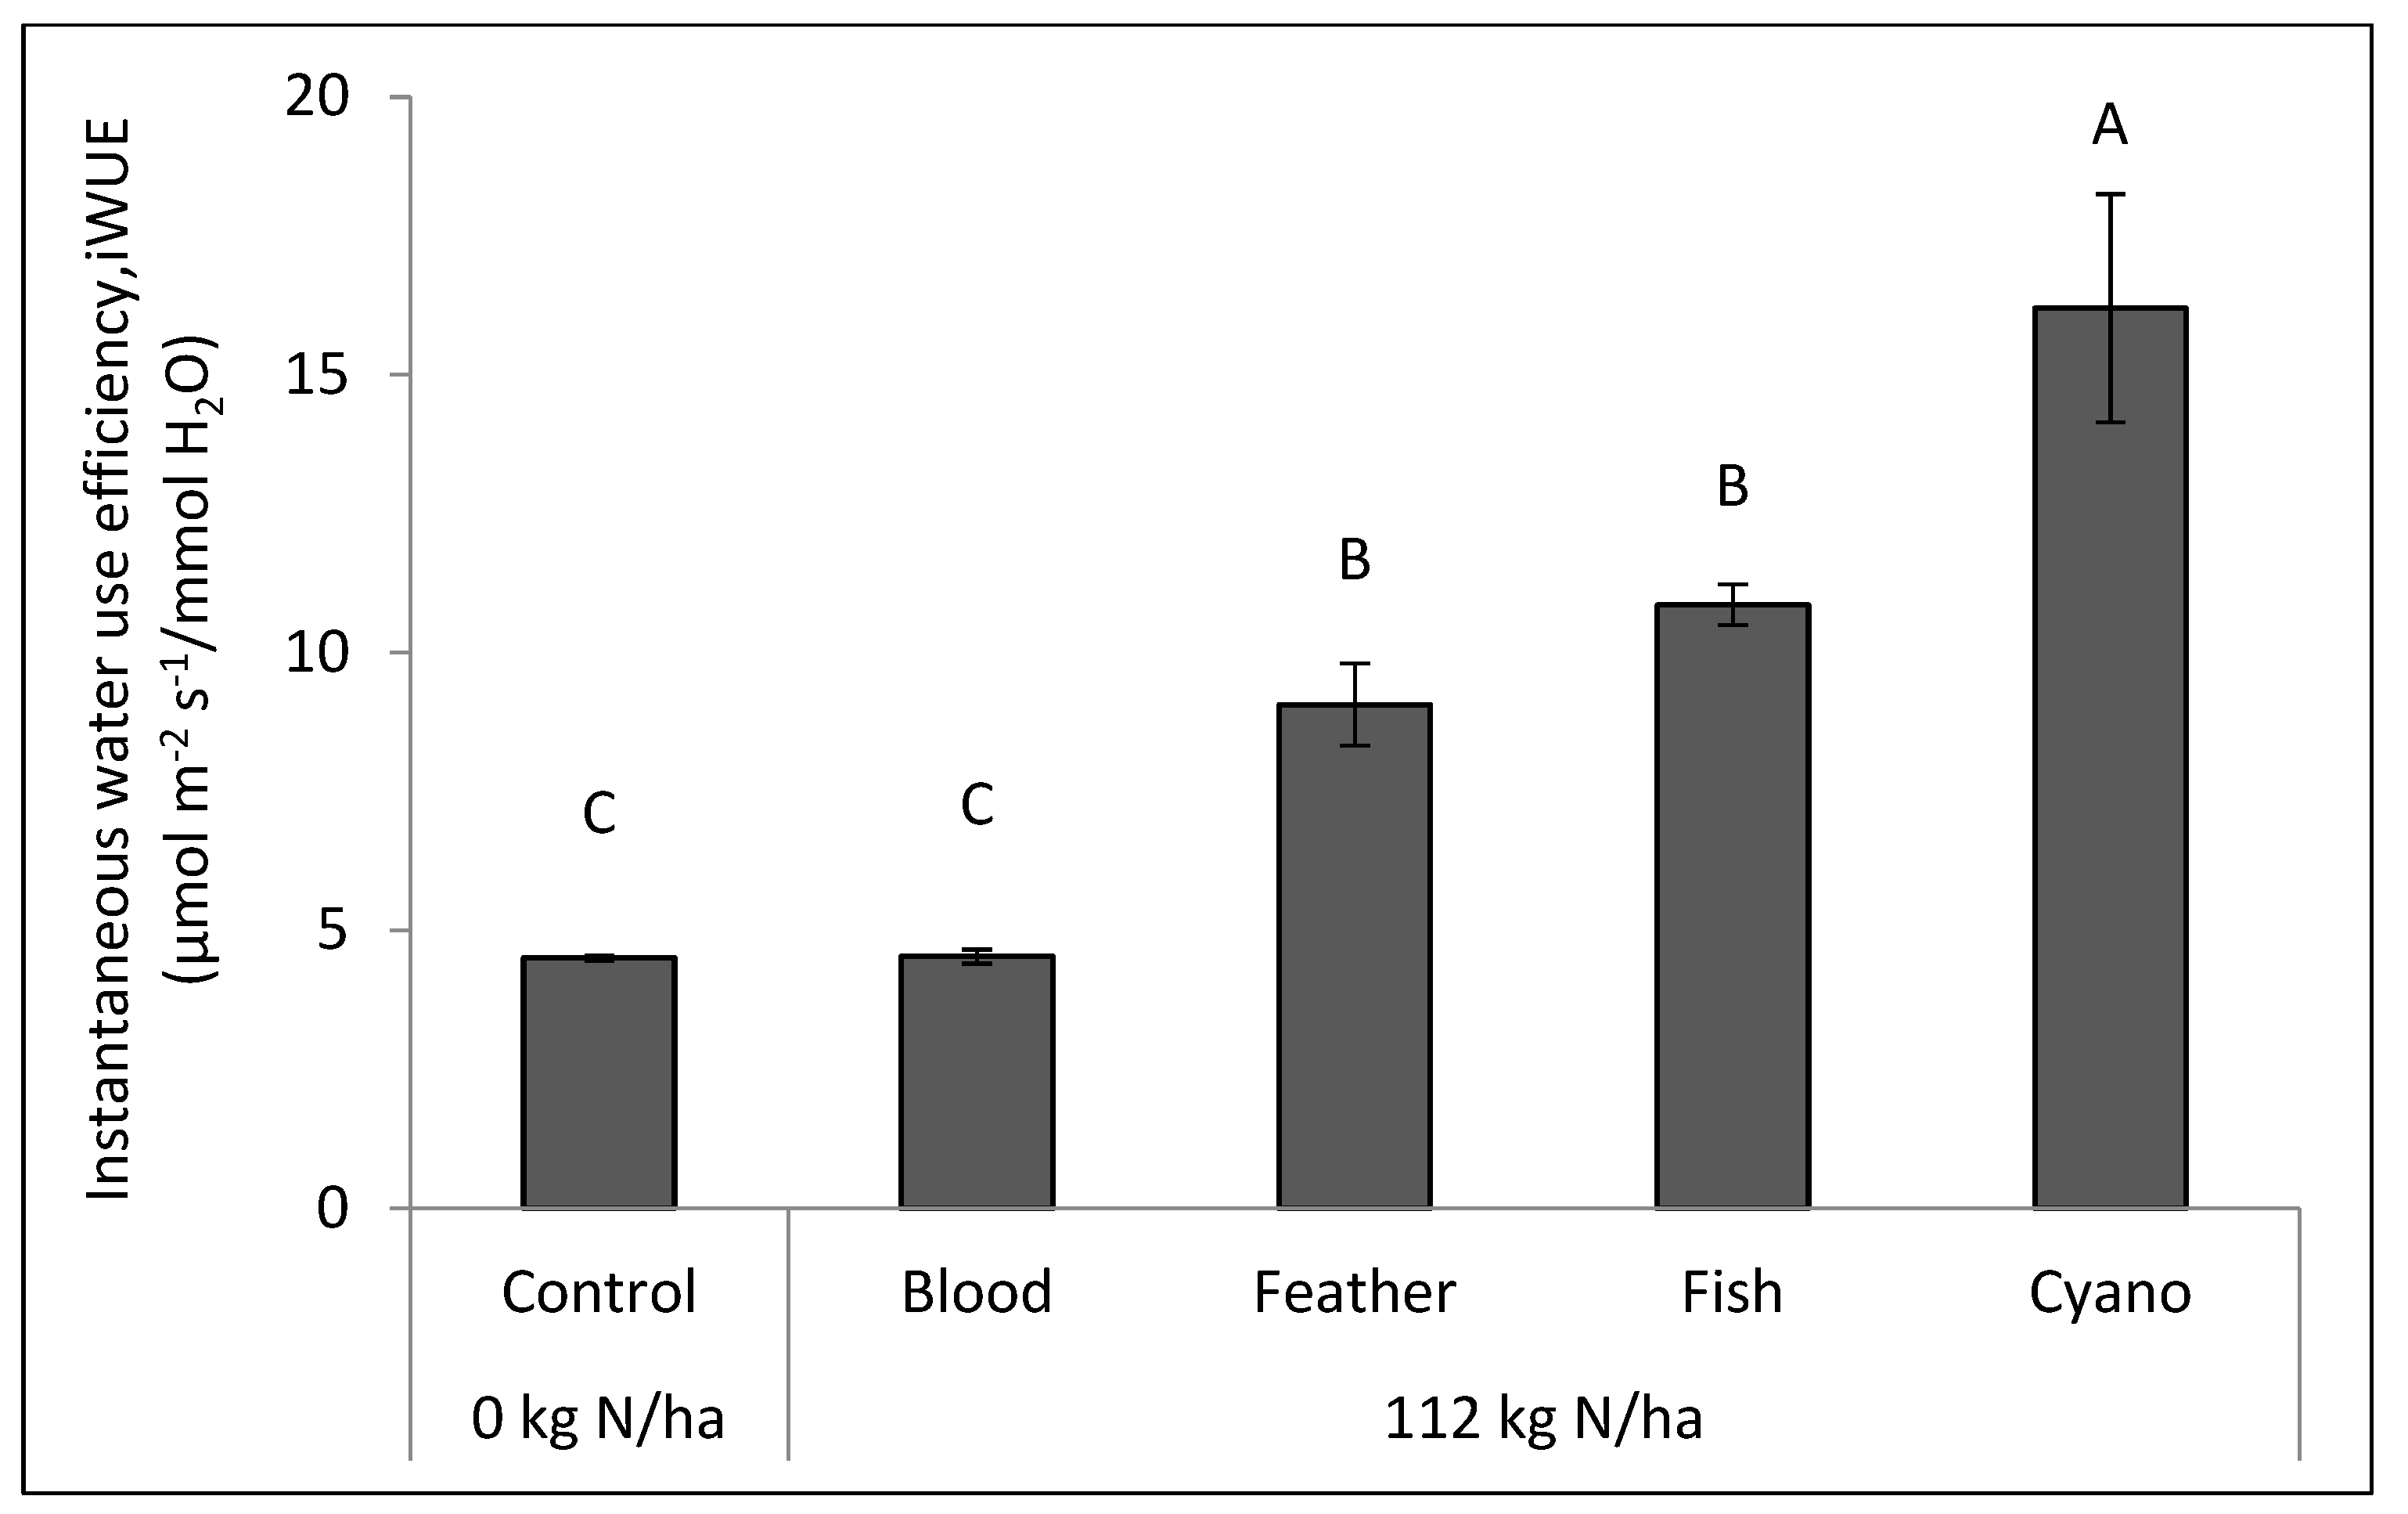
Figure 2b). The cyano-fertilizer treatment had a higher iWUE compared to other treatments, including the control, in 2014 (p < 0.0001; Figure 3).
The blood meal and control treatments had a higher leaf transpiration rate (p < 0.0001; Figure 4) and leaf VPD (p < 0.0001; 
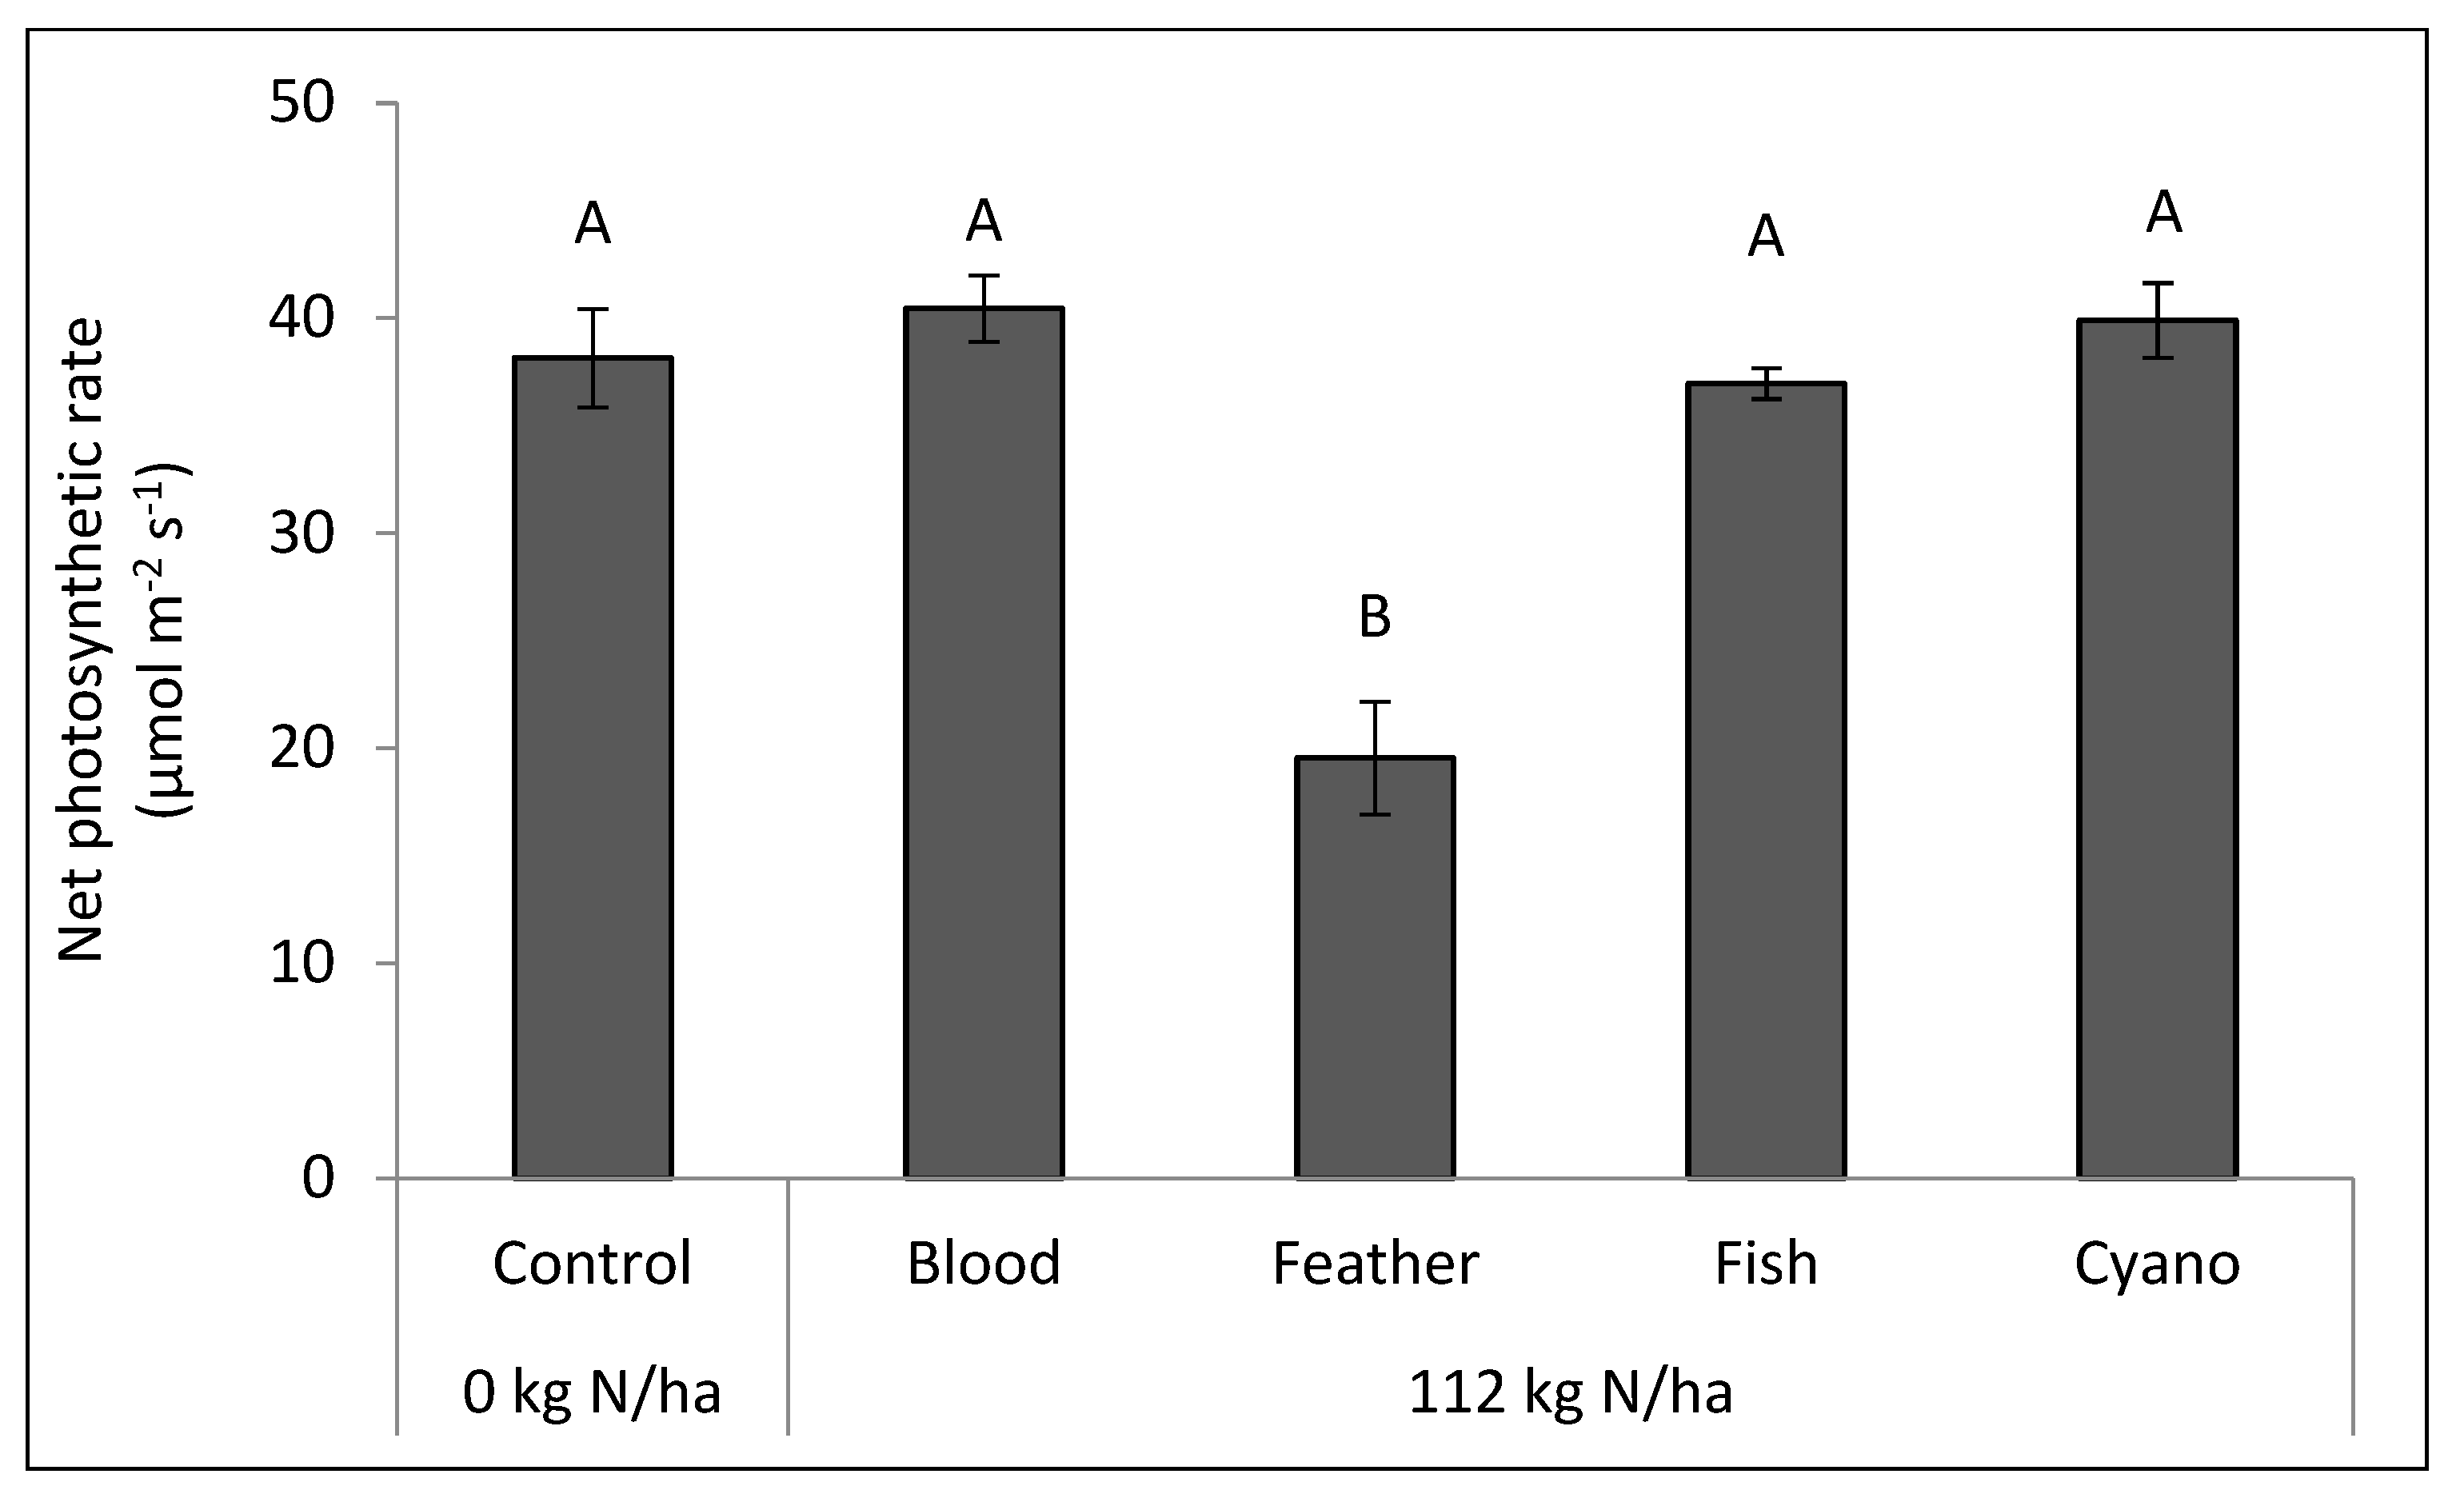
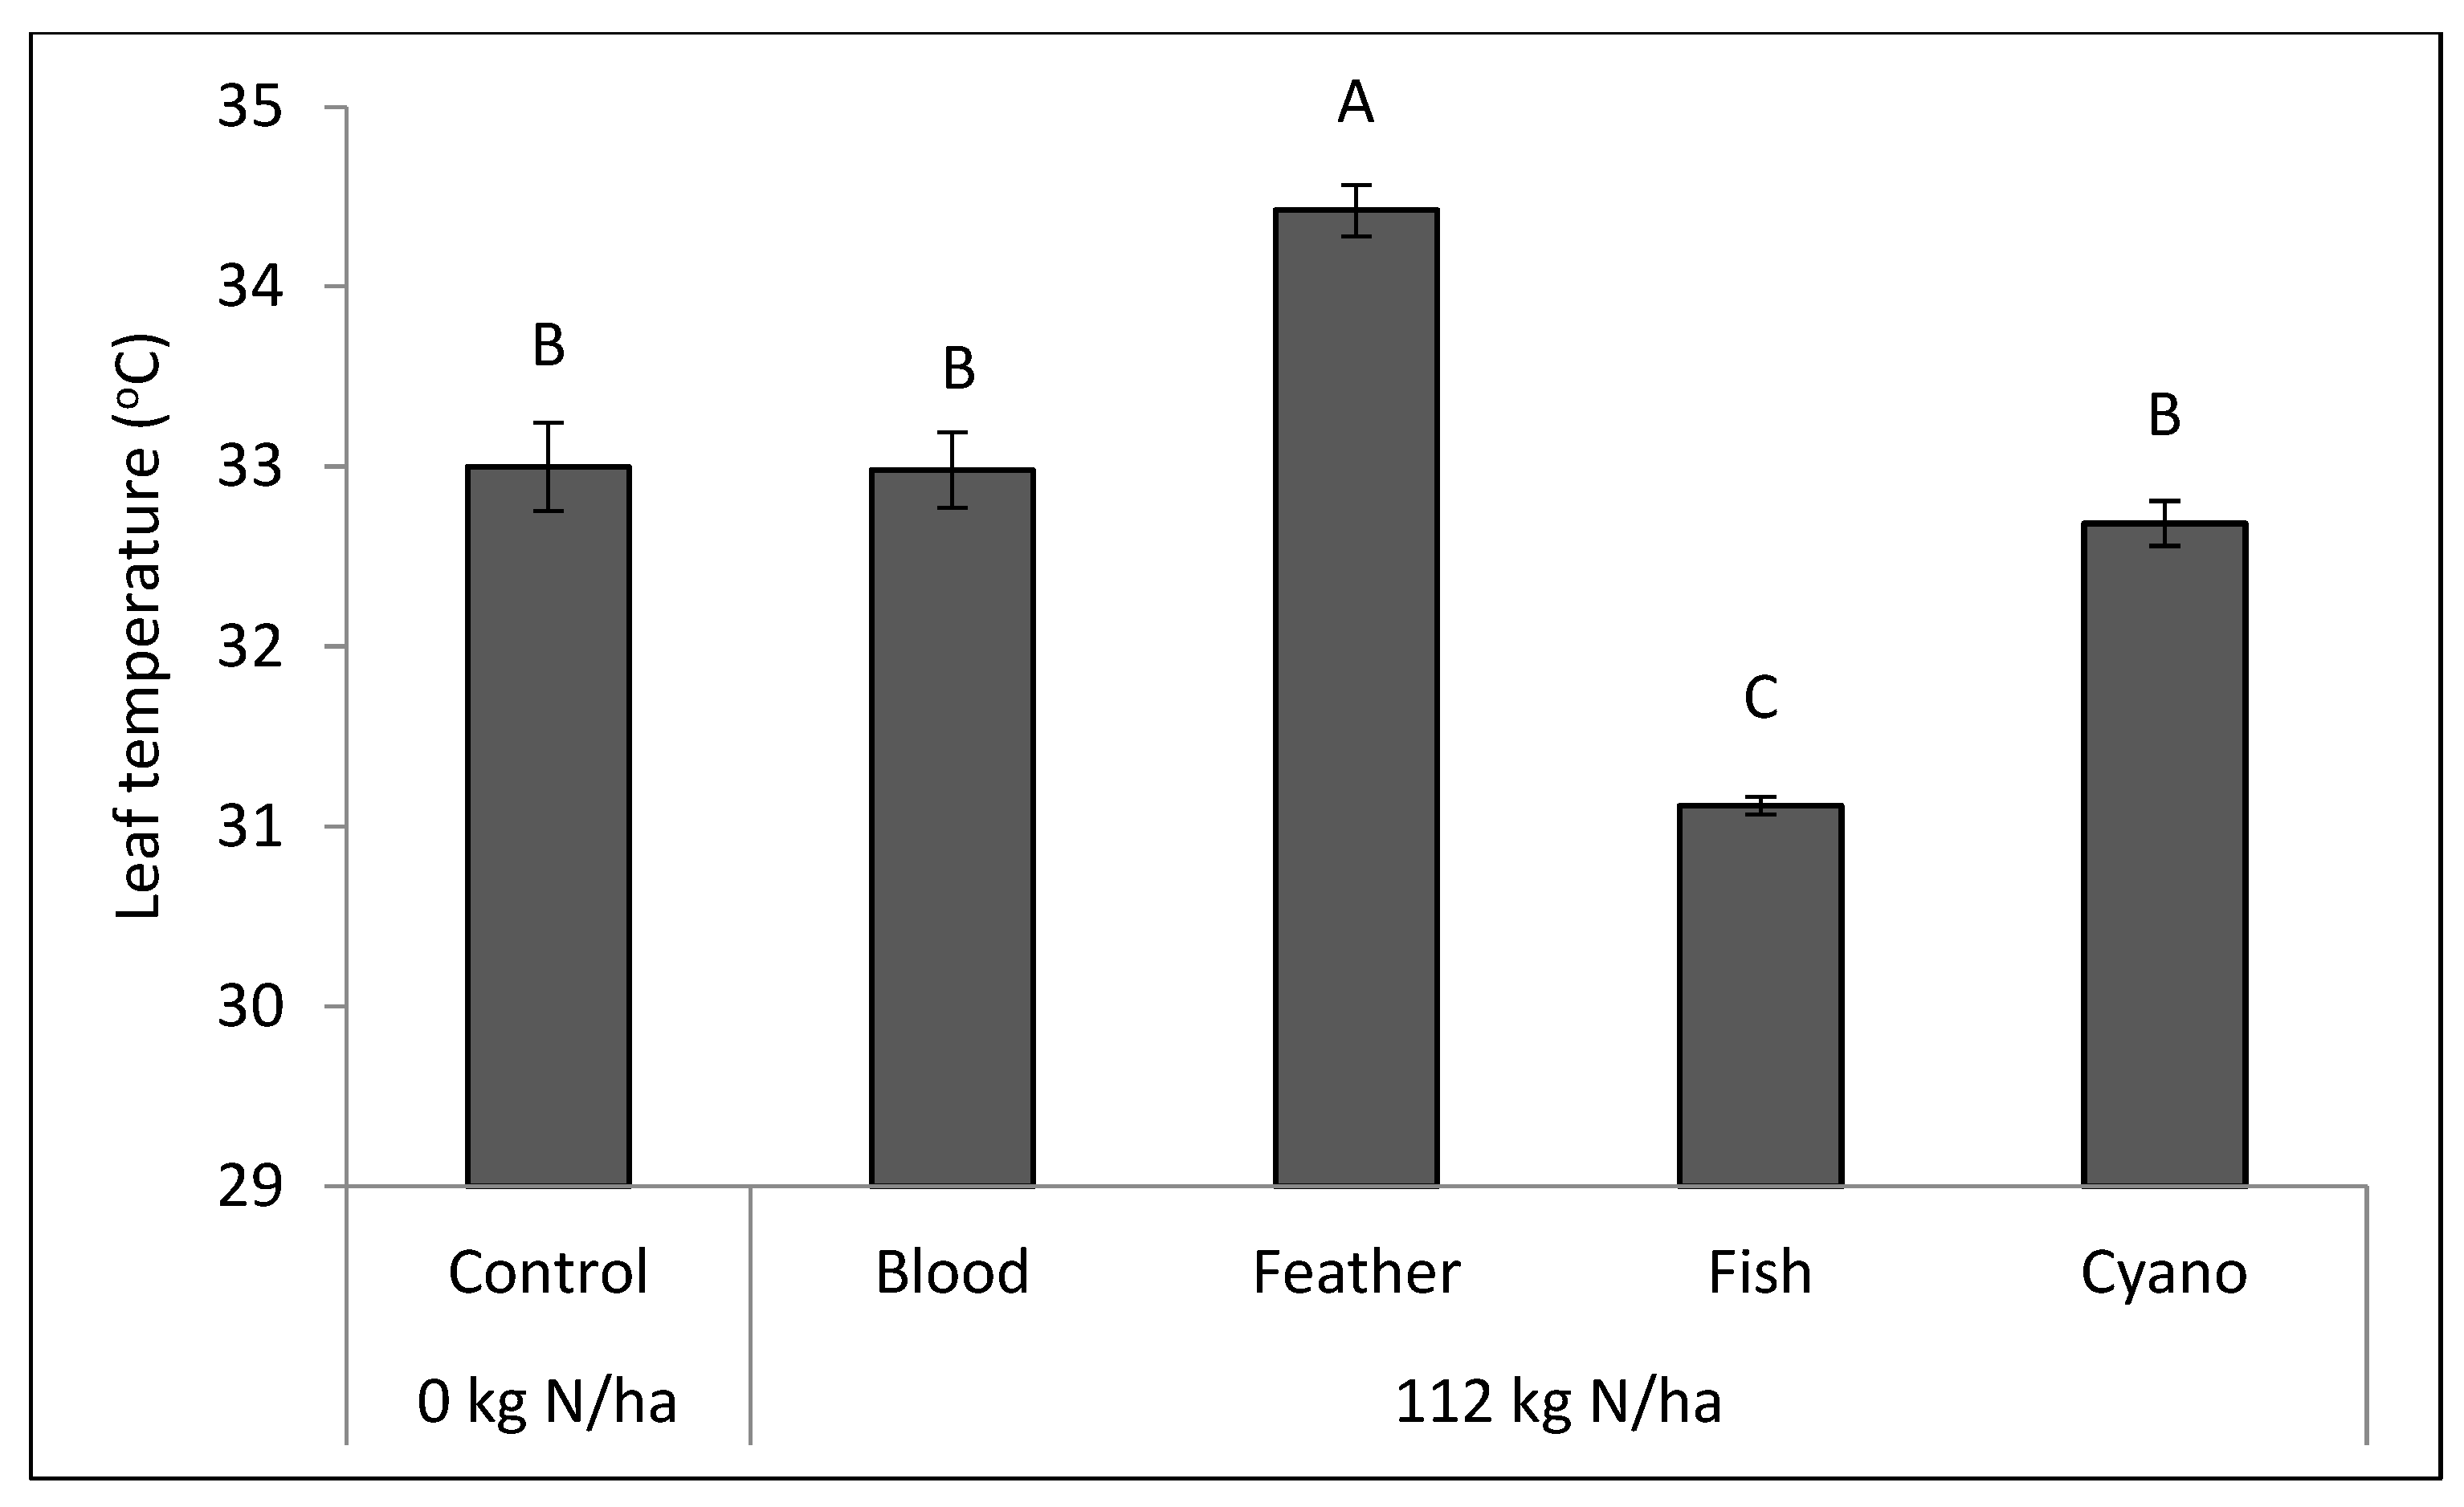
Figure 5) compared to the other treatments. The feather meal treatment had a lower net photosynthetic rate (p < 0.0001; Figure 6) and a higher leaf temperature compared to the other treatments, including the control (p = 0.003; Figure 7). A negative correlation was found between the amount of IAA applied in organic N fertilizers and leaf VPD (r = −0.49; p = 0.0163; Table 6), which may explain the low leaf temperature observed in the fish emulsion treatment (Figure 7). Leaf VPD (r = 0.54; p = 0.0071) and transpiration rate (r = 0.53; p = 0.0057) were positively correlated with the amount of Fe applied in organic N fertilizers (Table 6). The application of SA in organic N fertilizers was negatively correlated with stomatal conductance (r = −0.79; p = 0.0059).
The amounts of SA, NH4+-N, and Fe applied in organic N fertilizers were significantly correlated with both iWUE and fWUE in 2014 (Table 6). iWUE was also positively correlated with yield (r = 0.61; p = 0.0153). Among other independent variables, including the IAA, SA, NH4+-N, NO3-N, Fe, and Zn applied in organic N fertilizers, only SA was selected by stepwise regression to predict both fWUE and iWUE (Table 7).

4. Discussion

Although the IAA applied was not significantly correlated with WUE, greater amounts of SA were applied in the cyano-fertilizer treatment compared to other treatments (Table 5), ear yield was positively correlated with the application of SA in organic N fertilizers (r = 0.73; p = 0.0067), and the application of SA was positively correlated with both fWUE and iWUE (Table 6 and Table 7). SA enhances the distribution of photo assimilates and has been shown to increase iWUE in grape [17]. SA induced stomatal closure, improved membrane integrity, regulated plant water use, and increased iWUE in barley [49], maize [50,51], and wheat [14]. SA has been shown to increase wheat germination and yields [52] due to enhanced cell division and ion transport [53,54].
Among the variables analyzed (amounts of IAA, SA, NH4+-N, NO3-N, Fe, Zn applied in the fertilizers), SA application and stomatal conductance were the two independent variables significantly related to iWUE, and only SA application in organic N fertilizers predicted the fWUE of sweet corn (Table 7). The stepwise regression results indicated that SA applied in organic N fertilizers was the leading fertilizer variable resulting in the high fWUE and iWUE with the cyano-fertilizer treatment. Stomatal conductance was the leading gas exchange rate component impacting iWUE. SA has been found to induce stomatal closure and regulate plant water use [22,23,52,55,56]. Although the correlation between SA application and stomatal conductance (r = −0.79; p = 0.0059) was significant in this study (Table 6), there was no treatment effect on stomatal conductance. Most studies conducted on SA applied to plants evaluated foliar applications. In our study, fertilizers were applied to the soil through fertigation or soil application, and results were consistent with previous maize studies [21,25,50,51].
The amount of NH4+-N applied in organic N fertilizers was negatively correlated with both iWUE and fWUE (Table 6). Fertilizers with high NH4+-N concentrations decrease fWUE and have been shown to decrease the net photosynthetic rate in maize [57,58] due to interferences with the photosynthetic production of ATP [36,59]. It may be possible that a higher percentage of N applied as NH4+-N in the feather meal treatment compared to other fertilizer treatments (Table 4) decreased water transport in the xylem conduit. In addition, water flow in the xylem conduit was lower in NH4+-N (5 mM)-treated common bean due to a reduced number of functional xylem conduits [60].
Even though it has been reported that high NO3-N concentration in fertilizers decreased leaf transpiration rate in corn [33], NO3 -N applied was not significantly correlated with transpiration rate in this study (Table 6). In addition, while it had been reported that NO3-N application to tomato increased WUE [34], in this study, we found a significant positive correlation with fWUE but no correlation with iWUE.
Although Zn application was not correlated with any of the gas exchange components or WUE, the amounts of Fe applied in organic N fertilizers were negatively correlated with both iWUE and fWUE (Table 6). The amount of Fe applied in organic N fertilizers was positively correlated to leaf VPD (r = 0.54; p = 0.0071) and transpiration rate (r = 0.53; p = 0.0057; Table 6), thus contributing to reduced iWUE and fWUE. Among other fertilizer treatments, the blood meal treatment had the highest transpiration rate (Figure 4) and leaf VPD (Figure 5), similar to the control. Although the amount of Fe applied in the blood meal treatment was similar to the fish emulsion treatment (Table 4), the fish emulsion had a lower transpiration rate and leaf VPD, which may have been due to the higher amount of IAA applied in the fish emulsion treatment (Table 5), since IAA application was negatively correlated with leaf VPD (r = −0.49; p = 0.0163; Table 6). Increased Fe applied in fertilizers has been shown to increase the transpiration rate of peach leaves due to physical alterations of the stomatal opening [61]. Others have found that increased Fe application in fertilizers resulted in increased transpiration rate and Fe translocation in plants, which affected photosynthetic pigments and gas exchange rates of French bean [62].

5. Conclusions

In conclusion, we found that SA applied in organic N fertilizers was the leading fertilizer variable resulting in the consistently high fWUE and iWUE with the cyano-fertilizer treatment. We also found that the amounts of SA, NH4+-N, and Fe applied in organic N were correlated with the fWUE, iWUE, and leaf gas exchange components of sweet corn. We conclude that organic growers could increase WUE by fertigating their sweet corn with cyano-fertilizer, which had the consistently highest yield and water use efficiency of the tested fertilizers. Fish emulsion had a comparable yield and fWUE to cyano-fertilizer in 2013, but a significantly lower yield, fWUE, and iWUE in 2014. A positive relationship was observed between the amount of SA applied and both iWUE and fWUE; apparently, cyano-fertilizer may have had a higher WUE due to the high amount of SA applied as part of the cyano-fertilizer. Cyanobacteria can produce cyanotoxins, especially when they are grown in water with high N and P concentrations [63]; therefore, prior to their use, cyano-fertilizers should be tested for the presence of cyanotoxins [20]. Further research needs to be conducted to better understand the mechanisms through which phytohormones, NH4+-N, and Fe in organic N fertilizers regulate water transport and utilization in plants. In addition, the practicality and optimization of cyano-fertilizers require further assessment prior to their widespread adoption.

Author Contributions

Conceptualization, A.S. and J.G.D.; Methodology, A.S., Y.Q. and J.G.D.; Investigation, A.S.; Resources, J.G.D.; Writing—original draft, A.S.; Writing—review and editing, Y.Q. and J.G.D.; Supervision, J.G.D. All authors have read and agreed to the published version of the manuscript.

Funding

This research was funded by the USDA Western Sustainable Agriculture Research and Education Program Project # SW09-053.

Institutional Review Board Statement

Not applicable.

Informed Consent Statement

Not applicable.

Data Availability Statement

Data available on request.

Conflicts of Interest

The authors declare no conflict of interest.

References

  1. Sinclair, T.R.; Ludlow, M.M. Who taught plants thermodynamics? The unfulfilled potential of plant water potential. Aust. J. Plant Physiol. 1984, 33, 213–217. [Google Scholar] [CrossRef]
  2. Stanhill, G. Water use efficiency. Adv. Agron. 1986, 39, 53–85. [Google Scholar]
  3. Bunce, J.A. Leaf transpiration efficiency of some drought-resistant maize lines. Crop Sci. 2010, 50, 1409–1413. [Google Scholar] [CrossRef]
  4. Taylor, H.M.; Jordan, W.R.; Sinclair, T.R. Limitations to Efficient Water Use in Crop Production; ASA CSSA SSSA, Inc.: Madison, WI, USA, 1983. [Google Scholar]
  5. Ehleringer, C.S.; Cook, C.S.; Tiezen, L.L. Comparative water use and nitrogen relationships in mistletoe and its host. Oecologia 1986, 68, 279–284. [Google Scholar] [CrossRef] [PubMed]
  6. Gaskell, M.; Smith, R.; Mitchell, J.; Koike, S.T.; Fouche, C.; Hartz, T.; Horwath, W.; Jackson, L. Soil Fertility Management for Organic Crops; Publication #7249; University of California Davis: Davis, CA, USA, 2006. [Google Scholar]
  7. Toonsiri, P.; Del Grosso, S.J.; Sukor, A.; Davis, J.G. Greenhouse gas emissions from solid and liquid organic fertilizers applied to lettuce. J. Environ. Qual. 2016, 45, 1812–1821. [Google Scholar] [CrossRef]
  8. Asmamaw, M.; Wolde, G.; Yohannes, M.; Yigrem, S.; Woldemeskel, E.; Chala, A.; Davis, J.G. Comparison of cyanobacterial bio-fertilizer with urea on three crops and two soils of Ethiopia. Afr. J. Agric. Res. 2019, 14, 588–596. [Google Scholar]
  9. Yoder, N.; Davis, J.G. Organic fertilizer comparison on growth and nutrient content of three kale cultivars. HortTechnology 2020, 30, 176–184. [Google Scholar] [CrossRef]
  10. Sterle, D.G.; Stonaker, F.; Ela, S.; Davis, J.G. Cyanobacterial biofertilizer as a supplemental fertilizer for peaches: Yield, trunk growth, leaf nutrients and chlorosis. J. Am. Pomol. Soc. 2021, 75, 165–175. [Google Scholar]
  11. Afkairin, A.; Ippolito, J.A.; Stromberger, M.; Davis, J.G. Solubilization of organic phosphorus sources by cyanobacteria and a commercially available bacterial consortium. Appl. Soil Ecol. 2021, 162. [Google Scholar] [CrossRef]
  12. Poveda, J. Cyanobacteria in plant health: Biological strategy against abiotic and biotic stresses. Crop Prot. 2021, 141, 105450. [Google Scholar] [CrossRef]
  13. Welch, R.M.; Shuman, L. Micronutrient nutrition of plants. Crit. Rev. Plant Sci. 1995, 14, 49–82. [Google Scholar]
  14. O’Carrigan, A.; Babla, M.; Wang, F.; Liu, X.; Mak, M.; Thomas, R.; Bellotti, B.; Chen, Z. Analysis of gas exchange, stomatal behavior and micronutrients uncovers dynamic response and adaptation of tomato plants to monochromatic light treatments. Plant Physiol. Biochem. 2014, 82, 105–115. [Google Scholar] [CrossRef] [PubMed]
  15. Kang, G.; Li, G.; Xu, G.; Peng, X.; Han, Q.; Zhu, Y. Proteomics reveals the effects of salicylic acid on growth and tolerance to subsequent drought stress in wheat. J. Proteome Res. 2012, 11, 6066–6079. [Google Scholar]
  16. Gururani, M.A.; Mohanta, T.K.; Bae, H. Current understanding of the interplay between phytohormones and photosynthesis under environmental stress. Int. J. Mol. Sci. 2015, 16, 19055–19085. [Google Scholar]
  17. Wang, L.J.; Li, S.H. Salicylic acid-induced heat or cold tolerance in relation to Ca2+ homeostasis and antioxidant systems in young grape plants. Plant Sci. 2007, 170, 685–694. [Google Scholar]
  18. Agami, R.A.; Mohamed, G.F. Exogenous treatment with indole-3-acetic acid and salicylic acid alleviates cadmium toxicity in wheat seedlings. Ecotoxicol. Environ. Saf. 2013, 94, 164–171. [Google Scholar] [PubMed]
  19. Balraj, T.H.; Palani, S.; Arumugam, G. Influence of Gunapaselam, a liquid fermented fish waste on the growth characteristics of Solanum melongena. J. Chem. Pharm. Res. 2014, 6, 58–66. [Google Scholar]
  20. Wenz, J.; Davis, J.G.; Storteboom, H. Influence of light on endogenous phytohormone concentrations of a nitrogen-fixing Anabaena sp. cyanobacterium culture in open raceways for use as fertilizer for horticultural crops. J. Appl. Phycol. 2019, 31, 3371–3384. [Google Scholar]
  21. Moussa, H.R.; Khodary, S.E.A. Effect of salicylic acid on the growth, photosynthesis and carbohydrate metabolism in salt-stressed maize plants. Int. J. Agric. Biol. 2004, 6, 5–8. [Google Scholar]
  22. Yusuf, M.; Hassan, S.A.; Ali, B.; Hayat, S.; Fariduddin, Q.; Ahmad, A. Effect of salicylic acid on salinity-induced changes in Brassica Juncea. J. Integr. Plant Biol. 2008, 50, 1096–1102. [Google Scholar] [CrossRef]
  23. Nazar, R.; Umar, S.; Khan, N.A.; Sareer, O. Salicylic acid supplementation improves photosynthesis and growth in mustard through changes in proline accumulation and ethylene formation under drought stress. S. Afr. J. Bot. 2015, 98, 84–94. [Google Scholar]
  24. Barkosky, R.R.; Einhellig, F.A. Effects of salicylic acid on plant water relationship. J. Chem. Ecol. 1993, 19, 237–247. [Google Scholar] [PubMed]
  25. Khan, W.; Prithiviraj, B.; Smith, D.L. Photosynthetic responses of corn and soybean to foliar application of salicylates. J. Plant Physiol. 2003, 160, 485–492. [Google Scholar] [CrossRef] [PubMed]
  26. Hayat, Q.; Hayat, S.; Irfan, M.; Ahmad, A. Effect of exogenous salicylic acid under changing environment: A review. Env. Exp. Bot. 2010, 68, 14–25. [Google Scholar]
  27. Mirdad, Z.M. Effect of K+ and salicylic acid on broccoli plants grown under saline water irrigation. J. Agric. Sci. 2014, 6, 57–66. [Google Scholar]
  28. Yildrim, E.; Turan, M.; Guvenc, I. Effect of foliar salicylic acid applications on growth, chlorophyll, and mineral content of cucumber grown under salt stress. J. Plant Nutr. 2008, 31, 593–612. [Google Scholar] [CrossRef]
  29. Salehi, S.; Khajehzadeh, A.; Khorasandi, F. Growth of tomato as affected by foliar application of salicylic acid and salinity. Am. -Eurasian J. Agric. Environ. Sci. 2011, 11, 564–567. [Google Scholar]
  30. Guo, S.; Bruck, H.; Sattelmacher, B. Effects of supplied nitrogen form on growth and water uptake of French bean (Phaseolus vulgaris L.) plants. Plant Soil 2002, 239, 267–275. [Google Scholar] [CrossRef]
  31. Duan, Y.L.; Li, H.S.; Wu, S.H.; Zhang, Y.M. Effects of blue-light and calcium on the activities of glutamate synthetase and enzymes belonging to calcium signal systems in seedlings of wheat. J. Fujian Agric. For. Univ. 2003, 32, 209–212. [Google Scholar]
  32. Du, X.H.; Peng, F.R.; Jiang, J.; Tan, P.P.; Wu, Z.Z.; Liang, Y.W.; Zhong, Z.K. Inorganic nitrogen fertilizers induce changes in ammonium assimilation and gas exchange in Camellia sinensis L. Turk. J. Agric. For. 2015, 39, 28–38. [Google Scholar] [CrossRef]
  33. Wilkinson, S.; Bacon, M.A.; Davies, W.J. Nitrate signaling to stomata and growing leaves: Interactions with soil drying, ABA, and xylem sap pH in maize. J. Exp. Bot. 2007, 58, 1705–1716. [Google Scholar] [CrossRef]
  34. Claussen, W. Growth, water use efficiency, and proline content of hydroponically grown tomato plants as affected by nitrogen source and nutrient concentration. Plant Soil 2002, 247, 199–209. [Google Scholar] [CrossRef]
  35. Elia, A.; Santamaria, P.; Serio, F. Ammonium and nitrate influence on artichoke growth rate and uptake of inorganic ions. J. Plant Nutr. 1996, 19, 1029–1044. [Google Scholar] [CrossRef]
  36. Haynes, R.J.; Goh, K.M. Ammonium and nitrate nutrition of plants. Biol. Rev. 1978, 53, 465–510. [Google Scholar]
  37. Doerge, T.A.; Stroehlein, J.L.; Tucker, T.C.; Fangmeier, D.D.; Oebker, N.F.; McCreary, T.W.; Husman, S.H.; Lakatos, E.A. Nitrogen and Water Effects on the Growth, Yield, and Quality of Drip Irrigated Sweet Corn; Vegetable Report of the University of Arizona. Series P-78; University of Arizona: Tucson, AZ, USA, 1989; pp. 52–62. [Google Scholar]
  38. Agathokleous, E.; Kitao, M.; Komatsu, M.; Tamai, Y.; Harayama, H.; Koike, T. Single and combined effects of fertilization, ectomycorrhizal inoculation, and drought on container-grown Japanese larch seedlings. J. For. Res. 2022. [Google Scholar] [CrossRef]
  39. United States Dept. of Agric.—Natural Resources Conservation Service, Soil Survey of Larimer County Area, Colorado; 1980. Available online: http://soils.usda.gov/survey/online_surveys/colorado/larimer/Text-Part%201.pdf (accessed on 29 September 2012).
  40. Gee, G.W.; Bauder, J.W. Particle-size analysis by hydrometer: A simplified method for routine textural analysis and a sensitivity test of measurement parameters. Soil Sci. Soc. Am. J. 1979, 43, 1004–1007. [Google Scholar] [CrossRef]
  41. Hajek, B.F.; Adams, F.; Cope, J.T. Rapid determination of exchangeable bases, acidity and base saturation for soil characterization. Soil Sci. Soc. Am. Proc. 1972, 36, 436–438. [Google Scholar] [CrossRef]
  42. Blume, L.J.; Schumacher, B.A.; Schaffer, P.W.; Cappo, K.A.; Papp, M.L.; Remortel, R.D.; Coffey, D.S.; Johnson, M.G.; Chaloud, D.J. Handbook of Methods for Acid Deposition Studies Laboratory Analyses for Soil Chemistry; U.S. Environmental Protection Agency, Environmental Monitoring Systems Laboratory: Las Vegas, NV, USA, 1990. [Google Scholar]
  43. Olsen, S.R.; Cole, C.V.; Watanabe, F.S.; Dean, L.A. Estimation of Available Phosphorus in Soils by Extraction with Sodium Bicarbonate; USDA Circular No. 939; United States Government Printing Office: Washington, DC, USA, 1954. [Google Scholar]
  44. Jones, J.B., Jr. Laboratory Guide for Conducting Soil Tests and Plant Analysis; CRC Press LLC: Boca Raton, FL, USA, 2001. [Google Scholar]
  45. Barminski, R.; Storteboom, H.; Davis, J.G. Development and evaluation of an organically-certifiable growth medium for cyanobacteria. J. Appl. Phycol. 2016, 28, 2623–2630. [Google Scholar] [CrossRef]
  46. Wolde, G.; Asmamaw, M.; Sido, M.Y.; Yigrem, S.; Wolde-meskel, E.; Chala, A.; Storteboom, H.; Davis, J.G. Optimizing a cyanobacterial biofertilizer manufacturing system for village-level production in Ethiopia. J. Appl. Phycol. 2020, 32, 3983–3994. [Google Scholar] [CrossRef]
  47. Pan, X.; Welti, R.; Wang, X. Quantitative analysis of major plant hormones in crude plant extracts by high-performance liquid chromatography-mass spectrometry. Nat. Protoc. 2010, 5, 986–992. [Google Scholar] [CrossRef]
  48. Edlund, A.; Eklof, S.; Sundberg, B.; Moritz, T.; Sandberg, G. A microscale technique for gas chromatography-mass spectrometry measurements of pictogram amounts of indole-3 acetic acid in plant tissues. Plant Physiol. 1995, 108, 1043–1047. [Google Scholar] [CrossRef]
  49. El-Tayeb, M.A. Response of barley to the interactive effect of salinity and salicylic acid. Plant Growth Regul. 2005, 45, 215–225. [Google Scholar] [CrossRef]
  50. Rao, S.R.; Qayyum, A.; Razzaq, A.; Ahmad, M.; Mahmood, I.; Sher, A. Role of foliar application of salicylic acid and L-Tryptophan in drought tolerance of maize. J. Anim. Plant Sci. 2012, 22, 768–772. [Google Scholar]
  51. Saruhan, N.; Saglam, A.; Kadioglu, A. Salicylic acid pretreatment induces drought tolerance and delays leaf rolling by inducing antioxidant systems in maize genotypes. Acta Physiol. Plant 2012, 34, 97–106. [Google Scholar] [CrossRef]
  52. Sharafizad, M.; Naderi, A.; Siadat, S.A.; Sakinejad, T.; Lak, S. Effect of salicylic acid pretreatment on germination of wheat under drought stress. J. Agric Sci. 2012, 5, 179–200. [Google Scholar] [CrossRef]
  53. Harper, J.P.; Balke, N.E. Characterization of the inhibition of K+ absorption in oat roots by salicylic acid. J. Plant Physiol. 1981, 68, 1349–1353. [Google Scholar] [CrossRef]
  54. Argueso, C.T.; Ferreira, F.J.; Epple, P.; To, J.P.C.; Hutchison, C.E.; Schaller, G.E.; Dangl, J.L.; Kieber, J.J. Two-component elements mediate interactions between cytokinin and salicylic acid in plant immunity. PLoS Genet. 2012, 8, e1002448. [Google Scholar] [CrossRef]
  55. Larque-Saavedra, A. The antitranspirant effect of acetylsalicylic acid on Phaseolus vulgaris. Physiol. Plant. 1978, 43, 126–128. [Google Scholar] [CrossRef]
  56. Larque-Saavedra, A. Stomatal closure in response to acetalsalicylic acid treatment. Z. Pflanzenphysiol. 1979, 93, 371–375. [Google Scholar] [CrossRef]
  57. Lewis, A.M.; Leidi, E.O.; Lips, S.H. Effect of nitrogen source on growth response to salinity stress in maize and wheat. New Phytol. 1989, 111, 155–160. [Google Scholar] [CrossRef]
  58. Foyer, C.H.; Noctor, G.; Lelandais, M.; Lescure, J.C.; Valadier, M.H.; Boutin, J.P.; Horton, P. Short-term effects of nitrate, nitrite, and ammonium assimilation on photosynthesis, carbon partitioning and protein phosphorylation in maize. Planta 1994, 192, 211–220. [Google Scholar] [CrossRef]
  59. Tabatabaei, S.J.; Fatemi, L.S.; Fallahi, E. Effect of ammonium: Nitrate ratio on yield, calcium concentration, and photosynthesis rate in strawberry. J. Plant Nutr. 2006, 29, 1273–1285. [Google Scholar] [CrossRef]
  60. Schulze-Till, T.; Kaufmann, I.; Sattelmacher, B.; Jakob, P.; Hasse, A.; Guo, S.; Zimmermann, U.; Wegner, L.H. A 1H NMR study of water flow in Phaseolus vulgaris L. roots treated with nitrate or ammonium. Plant Soil 2009, 319, 307–321. [Google Scholar] [CrossRef]
  61. Eichert, T.; Peguero-Pina, J.J.; Gil-Pelegrin, E.; Heredia, A.; Fernandez, V. Effects of iron chlorosis and iron resupply on leaf xylem architecture, water relations, gas exchange and stomatal performance of field-grown peach (Prunus persica). Physiol. Plant. 2010, 138, 48–59. [Google Scholar] [CrossRef]
  62. Borowski, E.; Michalek, S. The effect of foliar fertilization of French bean with iron salts and urea on some physiological processes in plants relative to iron uptake and translocation in leaves. Acta Sci. Pol. Hort. Cult. 2011, 10, 183–193. [Google Scholar]
  63. Dolman, A.M.; Rücker, J.; Pick, F.R.; Fastner, J.; Rohrlack, T.; Mischke, U.; Wiedner, C. Cyanobacteria and cyanotoxins: The influence of nitrogen versus phosphorus. PLoS ONE 2012, 7, e38757. [Google Scholar]
Figure 1. Effects of different organic fertilizers on fresh ear yield of sweet corn at harvest in (a) 2013 and (b) 2014. Bars represent the standard error of mean. Means with the same letter are not significantly different at p < 0.05 using Tukey’s Studentized Range (HSD) test of mean separation. Blood = Blood meal; Feather = Feather meal; Fish = Fish emulsion; Cyano = Cyano-fertilizer.
Agriculture 13 00923 g001aAgriculture 13 00923 g001b
Figure 2. Effects of different organic fertilizers on field-scale water use efficiency (fWUE) at harvest in (a) 2013 and (b) 2014. Bars represent the standard error of mean. Means with the same letter are not significantly different at p < 0.05 using Tukey’s Studentized Range (HSD) test of mean separation. Blood = Blood meal; Feather = Feather meal; Fish = Fish emulsion; Cyano = Cyano-fertilizer.
Agriculture 13 00923 g002aAgriculture 13 00923 g002b
Figure 3. Effects of different organic fertilizers on instantaneous water use efficiency (iWUE) at tasseling in 2014. Bars represent the standard error of mean. Means with the same letter are not significantly different at p < 0.05 using Tukey’s Studentized Range (HSD) test of mean separation. Blood = Blood meal; Feather = Feather meal; Fish = Fish emulsion; Cyano = Cyano-fertilizer.
Agriculture 13 00923 g003
Figure 4. Effects of different organic fertilizers on leaf transpiration rate at tasseling in 2014. Bars represent the standard error of mean. Means with the same letter are not significantly different at p < 0.05 using Tukey’s Studentized Range (HSD) test of mean separation. Blood = Blood meal; Feather = Feather meal; Fish = Fish emulsion; Cyano = Cyano-fertilizer.
Agriculture 13 00923 g004
Figure 5. Effects of different organic fertilizers on leaf vapor pressure deficit (VPD) at tasseling in 2014. Bars represent the standard error of mean. Means with the same letter are not significantly different at p < 0.05 using Tukey’s Studentized Range (HSD) test of mean separation. Blood = Blood meal; Feather = Feather meal; Fish = Fish emulsion; Cyano = Cyano-fertilizer.
Agriculture 13 00923 g005
Figure 6. Effects of different organic fertilizers on net photosynthetic rate at tasseling in 2014. Bars represent the standard error of mean. Means with the same letter are not significantly different at p < 0.05 using Tukey’s Studentized Range (HSD) test of mean separation. Blood = Blood meal; Feather = Feather meal; Fish = Fish emulsion; Cyano = Cyano-fertilizer.
Agriculture 13 00923 g006
Figure 7. Effects of different organic fertilizers on sweet corn on leaf temperature at tasseling in 2014. Bars represent the standard error of mean. Means with the same letter are not significantly different at p < 0.05 using Tukey’s Studentized Range (HSD) test of mean separation. Blood = Blood meal; Feather = Feather meal; Fish = Fish emulsion; Cyano = Cyano-fertilizer.
Agriculture 13 00923 g007
Table 1. Initial soil properties (0–30 cm depth) of the sweet corn experimental site.
Soil Properties20132014
pH 7.57.7
Electrical conductivity (dS m−1)0.60.6
Cation exchange capacity, CEC ǂ (meq 100 g−1) 2930
Organic matter, OM ǂǂ (%)2.52.6
NH4+-N ǂǂǂ (ppm)2.52.7
NO3-N ǂǂǂ (ppm)1.92.1
P § (ppm)3032
K (ppm)463456
Ca (ppm)45604650
Mg (ppm)616622
Fe (ppm)67
Zn (ppm)1.41.6
pH and electrical conductivity were determined in water (1:1). ǂ CEC was determined using ammonium acetate (1 N NH4C2H3O2, pH 7.0) extraction. ǂǂ OM was determined by the loss on ignition method. ǂǂǂ Samples were extracted using 2 M KCl. § Sample was extracted with 0.5 M NaHCO3. Samples were extracted using ammonium bicarbonate diethylenetriamine pentaacetate (AB-DTPA).
Table 2. Average monthly precipitation and the amount of water applied during the 2013 and 2014 sweet corn growing seasons.
20132014
Planting1 July2 July
Harvest18 September19 September
Precipitation (mm)
July3969
August1326
September1199
Amount of water applied (mm)
Irrigation729737
Fertigation414414
Total Precipitation + Irrigation + Fertigation ǂ (mm)13141257
ǂ Total amount of water applied over the growing season is the combination of precipitation, irrigation, and fertigation. All plots received the same amount of water applied via irrigation. When liquid fertilizers were applied, the control and solid fertilizer treatments were irrigated with the same amount of water as that used to fertigate the liquid fertilizer treatments.
Table 3. Nutrient analysis of fertilizer samples.
FertilizerN ǂC ǂC/N RatioP K Fe Ca Mg Zn
%% mg kg−1
Cyano-fertilizer0.0410.0380.960.1610180.1
Fish emulsion0.0450.0661.516002051013172592118
Feather meal14.450.53.5640177662146657518
Blood meal15.551.43.33236611890428314
ǂ Samples were analyzed using CN analyzer and reported previously [7]. Samples were digested with HNO3 and H2O2 and analyzed using ICP-OES.
Table 4. Inorganic N concentration, inorganic N ratio, and percentage of N applied as inorganic-N of fertilizers and amount of Fe and Zn applied in the fertilizers at 112 kg ha−1 over the course of growing season.
NH4+-N *NO3-N *NH4+-N: NO3-NN as NH4+-NN as NO3-NFeZn
mg kg−1 %kg ha−1
Cyano-fertilizer4.70.014700.240.00056.7 × 10−41.1 × 10⁻⁵
Fish emulsion23.70.121980.050.00021.5 × 10−22.0 × 10⁻³
Feather meal12302.305360.950.0026.9 × 10−32.0 × 10⁻³
Blood meal27.78.403.30.020.0061.3 × 10−21.6 × 10⁻³
* Samples were extracted using 2 M KCl and were analyzed using an autoanalyzer [7].
Table 5. Phytohormone concentrations in the fertilizers and amount of phytohormones applied in the fertilizer over the growing season.
Indole-3-Acetic Acid (IAA) Salicylic Acid (SA) Indole-3-Acetic Acid (IAA) Salicylic Acid (SA)
ng g−1kg ha−1
Cyano-fertilizer0.0664.4 × 10−54.8 × 10⁻³
Fish emulsion1436772.4 × 10−31.2 × 10⁻⁴
Feather meal2412401.5 × 10−41.5 × 10⁻⁴
Blood meal58503.9 × 10−53.4 × 10⁻⁵
Samples were extracted in 80% methanol containing 10 mg L−1 butylated hydroxytoluene at 4 °C.
Table 6. Pearson correlation coefficients on amount of Fe, Zn, indole-3-acetic acid (IAA), and salicylic acid (SA) applied in the fertilizers (blood meal, feather meal, fish emulsion, and cyano-fertilizer) with gas exchange rate components, instantaneous water use efficiency (iWUE), and field-scale water use efficiency (fWUE) in 2014. p-values are shown in parentheses below the correlation coefficients.
Lf Temp.Lf VPDgsTrPniWUEfWUE
IAAapp−0.14−0.49−0.420.420.70−0.32−0.32
(0.7959)(0.0163 *)(0.4080)(0.4051)(0.1204)(0.5306)(0.2208)
SAapp0.0780.14−0.790.0900.0740.710.68
(0.8841)(0.7807)(0.0059 *)(0.1004)(0.8894)(0.0126 *)(0.0040 *)
NO3app−0.022−0.57−0.510.290.74−0.370.64
(0.9668)(0.2328)(0.3063)(0.5839)(0.0932)(0.4727)(0.0082 *)
NH4app0.59−0.59−0.52−0.460.41−0.49−0.65
(0.2112)(0.2166)(0.2936)(0.3602)(0.4159)(0.0212 *)(0.0066 *)
FeApp−0.420.540.430.530.12−0.64−0.69
(0.1729)(0.0071 *)(0.1569)(0.0057 *)(0.7018)(0.0238 *)(0.0122 *)
ZnApp0.040.090.190.14−0.48−0.31−0.38
(0.9012)(0.7721)(0.5329)(0.6812)(0.2134)(0.2339)(0.3002)
* p-values are significantly different at p < 0.05. Lf temp. = leaf temperature; Lf VPD = leaf vapor pressure deficit; gs = stomatal conductance; Tr = leaf transpiration rate; Pn = net photosynthetic rate; iWUE = instantaneous water use efficiency; IAAapp = Indole-3-acetic acid application; SAapp = Salicylic acid application; NO3app = NO3-N application; NH4Napp = NH4+-N application, FeApp = Iron application; and ZnApp = Zinc application.
Table 7. Stepwise regression models of field water use efficiency (fWUE) and instantaneous water use efficiency (iWUE) in 2014. Variables analyzed were gas exchange rates components, amount of indole-3-acetic acid (IAA), salicylic acid (SA), NH4+-N, NO3-N, Fe, and Zn applied in the fertilizers to predict fWUE and iWUE. All variables left in the model are significant at the 0.05 level.
Estimatep-ValueModel
Field water use efficiency (fWUE)fWUE = 32.7 + 1652SA, r2 = 0.46
Intercept32.7<0.0001
Salicylic acid application, SA16520.0040
Instantaneous water use efficiency (iWUE)iWUE = 18.4 −54gs + 642SA, r2 = 0.84
Intercept18.4<0.0001
Stomatal conductance, gs−540.0035
Salicylic acid application, SA6420.0044
Disclaimer/Publisher’s Note: The statements, opinions and data contained in all publications are solely those of the individual author(s) and contributor(s) and not of MDPI and/or the editor(s). MDPI and/or the editor(s) disclaim responsibility for any injury to people or property resulting from any ideas, methods, instructions or products referred to in the content.

